Embed Size (px)
Citation preview

Key Components of Immigration Reform
An Analysis of the Economic Effects of Creating a Pathway to Legal Status, Expanding High-Skilled
Visas, & Reforming Lesser-Skilled Visas
July 17, 2013
Prepared by
Regional Economic Models, Inc. (REMI)
Frederick R. Treyz, Ph.D. Corey Stottlemyer Rod Motamedi
This report is funded by the Ford Foundation, Unbound Philanthropy, and the Carnegie Corporation of New York. All opinions and conclusions in this report are those of the authors and do not represent
institutional views of Regional Economic Models, Inc., the Ford Foundation, Unbound Philanthropy, or the Carnegie Corporation of New York.

i
Acknowledgements The analytical and research team on the project also included Elias Scheker, Brett Albert, Jeffrey Dykes, Ahmed Mostafa, Scott Nystrom, and Ali Zaidi.

ii
Table of Contents
Acknowledgements p. i Table of Contents p. ii Executive Summary p. 1 Scope of the Analysis and Methods p. 2
Results p. 8
Conclusion p. 20
References p. 22
Appendix A: The REMI PI+ Model p. 23
Appendix B: Employment by Industry Sector p. 29
Appendix C: Pathway to Legal Status State Briefs Available on request
Appendix D: High-Skill Workforce State Briefs Available on request
Appendix E: Lesser-Skill Workforce State Briefs Available on request

iii
This page intentionally left blank.
1
Executive Summary
As the policy debate continues in
Washington, DC and throughout the nation,
this study shows the state- and national-
level economic effects of key components
of immigration policy reform. We evaluate
the economic implications of the Path to
Legal Status, high-skilled (H-1B) visa
expansion, and changes in lesser-skilled visa
programs (H-2A, H-2B, and W-1 Visas).
We use a REMI PI+ model of all 50
states and the District of Columbia to show
the macroeconomic effects of the policy
changes over the period of 2014 to 2045.
PI+ is a multiregional macroeconomic model
that has been used in thousands of national
and regional economic studies, including
studies of other elements of immigration
reforms in the United States.
We report the macroeconomic
effects of each policy on the national and
state level. Key summary macroeconomic
indicators include employment, gross
domestic (state) product, and personal
income. We also provide employment
effects by industry for the United States,
and a complete set of state-level fact sheets
which present results for each policy and all
50 states and the District of Columbia.
We estimate that the Pathway to
Legal Status policy will increase total United
States employment by 123 thousand in
2014, increasing to 594 thousand net new
U.S. jobs by 2018. Gross domestic product
is expected to increase by $10.32 billion in
2014 and $49.93 billion in 2018. (All dollar
figures presented in report are 2012 real dollars.) Employment and gross state
product increase for all states and the
District of Columbia.
As a result of the H-1B program
expansion, we estimate that employment
will increase by 227 thousand jobs in 2014,
and will continue to expand, with a net
increase of 1.3 million jobs by 2045. Gross
domestic product will increase by $22
billion in 2014 and more than $158 billion
by 2045. Employment and gross state
product is estimated to increase for all
states and in all years from 2014 to 2045 as
a result of the H-1B program expansion.
The increase in H-2A visas results in
total employment increases of almost 17
thousand jobs in 2014, 51 thousand jobs in
2017, and moderating slightly to a 39.6
thousand job increase by 2045.
Fully utilizing the H-2B visas up to the cap will increase total U.S. employment by 25 thousand in 2014, and cause employment to remain steady at about 24-25 thousand over the baseline forecast to 2045.
As a result of the W-1 Visa program,
we estimate that there will be a net
increase in U.S. jobs of more than 40
thousand in 2014, and a total gain of 365
thousand jobs by 2045. Gross domestic
product is expected to increase by $2.67
billion in 2014 and to rise by $31 billion over
the baseline by 2045.
2
The impact of these components of
immigration reform is net positive on the
state and national economies and the labor
force.
Scope of the Analysis and Methods
Immigrants comprise a significant
part of the labor force in the United States.
Although many immigrants are naturalized
U.S. citizens or permanent residents, many
others are either undocumented or eligible
to work due to various temporary visas.
Therefore, it is likely that any policy change
that affects the status of undocumented
immigrants or the number of work visas will
have important macroeconomic
implications.
This study shows the
comprehensive, state-by-state
macroeconomic effects of potential reforms
to immigration policy, including the
creation of a pathway to legal status, an
expansion of high-skilled visas, and an
expansion of lesser-skilled visas. It extends
the wide body of literature on the economic
effects of immigration literature by
estimating total macroeconomic impacts on
a state level of nationwide policy changes.
The study is also unique in its
comprehensive scope, including
employment, output and other concepts by
detailed industry sectors; in capturing
complete economic linkages, including
economic interactions between states; and
in showing the year-by-year dynamic policy
effects from 2014 to 2045.
The scope of this study is limited to
economic, not fiscal, impacts of
immigration policy changes. A number of
fiscal impact studies have been conducted
on immigration policy. Although fiscal
effects, either positive or negative, may
have economic implications, we assume
that these potential economic feedback
effects of any changes in fiscal balance are
relatively small compared to the overall
economic effect of the policy change. In
part, changes in fiscal balance and their
effect on the economy depend on further
legislative decisions on taxes and spending
that are beyond the range of this analysis.
A recent study by Douglas Holtz-Eakin,
estimating the dynamic fiscal effects of
immigration, suggests that fiscal benefits
and costs of immigration may offset each
other to a large extent. (Holtz-Eakin, 2013)
This would suggest that the economic
feedback caused by changes in the fiscal
balance, if any, would be relatively small.
We used the PI+ dynamic structural
macroeconomic model to quantify the
impacts of the identified components of
immigration reform. REMI’s models have
been used in thousands of national and
regional economic studies, including studies
of immigration reforms in the United States.
More information about the model is
available in the appendix to this report.
For the analysis, we generate a
control forecast, which is the expected
economic forecast for all 50 states and the
District of Columbia from 2014 to 2045. For
each of the components of the analysis, we
3
then estimate the direct implications of
policy changes. These changes include the
number of people affected by the policy
change and direct economic effects of the
policy, including wage and productivity
changes, increased temporary and/or
permanent migration to the United States,
and other factors. These direct effects are
then implemented in terms of policy
variable changes in the REMI PI+
macroeconomic model, such as changes in
the wage bill policy variable, employment,
and international migration. We then
generate an alternative forecast that
estimates economic activity after the policy
change has been implemented. The
difference between the alternative forecast
is the policy effect.
Pathway to Legal Status Method
The Pathway to Legal Status policy
proposal allows for the estimated 11.1
million undocumented residents in the U.S.
to receive provisional legal status. (Passel &
Cohn, 2011) This status would be granted
only under certain criteria, including paying
outstanding Federal taxes, and would be
subject to a cutoff date. Those registered
as provisional immigrants, however, would
be able to work legally in the United States.
The Pathway to Legal Status applies
to individuals who currently reside, and for
the most part already work, in the United
States. As such, it differs from immigration
policy centered on changing the number of
new immigrants, or in changing the number
of new employment-based visas. By and
large, the pathway policy changes the type
of work that can be sought and obtained by
a previously undocumented worker,
without having a significant effect on either
the overall size of the labor force or
population residing in the United States.
Many undocumented workers are
employed in the informal or underground
economy, in which economic activities are
outside of the bounds of government
regulation or taxation. Employment in this
sector tends to provide lower compensation
(wages and benefits), than in the formal
economy.
Applying for legal status is voluntary,
although increased enforcement on
employers’ hiring practices is expected. To
estimate the number of undocumented
immigrants who will enroll in the pathway,
we looked at participation rates in the
Immigration Reform and Control Act of
1986. However, estimates of the
undocumented immigrant population at the
time vary widely from 2 to 8 million. The
U.S. Department of Homeland Security
cited a report by Michael D. Hoefer
estimating the undocumented immigrant
population being between 3 and 5 million
people in 1986. (Hoefer, 1991) With
approximately 3 million people applying for
legal residency, we assumed a participation
rate of 75 percent.
Compensation is likely to increase
following the creation of a pathway to legal
status. Following the Immigration Reform

4
and Control Act of 1986, the U.S.
Department of Labor tracked 1.6 million
undocumented workers. This survey
showed a 15-percent increase in wage rates
for undocumented workers legalized under
section 245A of the Immigration and
Nationality Act during the first five years
following legalization. (Smith, 1996)
We attribute the increase in wages
following legalization to two causes, which
we categorize as compliance and
productivity. The first category,
compliance, represents an increase in
wages, without any productivity gains, that
results from employers more closely
conforming to labor legislation such as
minimum wage and overtime requirements.
The second category, labor productivity,
represents pay increases that occur in
conjunction with increases in labor
productivity.
Undocumented workers are limited
to less-productive work in marginal
positions. This is due to limited
employment opportunities, as jobs are only
available from employers operating outside
of the law. Such employers tend to have
small jobs, such as limited childcare or
housekeeping needs, or marginally
profitable operations, such as those found
in small food service and other operations.
Workers also may be restricted to positions,
such as dishwashing, that employs only part
of his or her skill set. Additionally,
undocumented workers that obtain legal
status may be more willing to invest in their
skills, such as learning the English language
and developing technical skills that will
increase their human capital and
productivity.
In general equilibrium economic
theory, firms maximize profit and in
equilibrium, the real wage is equal to the
marginal product of labor so real wage
increases imply increases in labor
productivity. For the purpose of this study,
we assume, however, that a proportion of
the real wage increases that occur when
undocumented workers enter the pathway
to legal status are in fact “deadweight”
losses to firms. That is, of the 15-percent
increase in real wages over 5 years, there is
a 12-percent increase or 2.4-percent
increase per annum in labor productivity,
and a three-percent increase or 0.6-percent
per annum increase in labor costs that are
not associated with labor productivity.
Increases in labor productivity are
associated with worker-specific effects,
such as those noted in the previous
paragraph.
We allocated the 75 percent of the
11.1 million undocumented immigrants
across the states and by industry group. (Passel & Cohn, 2011) Each of the aggregate
industries was mapped to more detailed
REMI industries using the percentage of the
aggregate sector. For example, if 0.2
percent of undocumented immigrants are
in the mining sector, then 0.2 percent are in
Oil and Gas Extraction, Mining (except oil
and gas), and Support Activities for Mining.
These percentages were then normalized to
5
equal a total distribution of 100 percent.
This distribution was further weighted to
take account of each state’s unique industry
mix.
The values from REMI’s baseline
were used as the prevailing values for
average compensation rate.
High-Skilled Workforce Method
The H-1B visa program allows
employers to hire foreign workers in
specialty occupations requiring the
application of specialized knowledge. These
can include, but are not limited to, positions
in the fields of science, engineering,
technology, and mathematics. These visas
are capped each year. Congress is
considering proposals to expand the cap on
this program.
We allocated current H-1B visas
across the states and across industries
based on information from the Department
of Labor. (OFLC, 2011) Currently, there are
65 thousand visas available. We include this
number in the baseline for the simulation.
In this scenario, the number of visas
increases by 75 thousand in 2014 and goes
up to 105 thousand by 2019. Due to labor
market competition, we assume that only
80 percent of the visas issued result in new
jobs. While the visas are intended for
positions that cannot be filled from the
current workforce, employers could be
replacing a marginally lesser-skilled worker
or workers with a highly-skilled visa
recipient. We assumed that the total
increase in migrants is 20 percent greater
than the increase in visas due to the
accompaniment of dependents.
We assumed that six years after
each year of visa issuance that 18 percent
of the immigrants would choose to not
renew their visas and leave the country.
The annual increase in visas does not
include renewals and thus represents net
new immigrants. We chose a conservative
assumption of not continuously increasing
employment while we did increase
migration. This scenario largely represents
the worse-case scenario. The change in
employment entered the model using the
variable Industry Employment. The change
in population entered the model using the
variable International Migration, All Ages,
and All Groups.
Lesser-Skilled Workforce Method
We examined three different lesser-
skilled visa programs. First, we modeled
the expansion of the current H-2A visa
program for agricultural workers. Second,
we modeled the full use of the H-2B visa
program for nonagricultural seasonal, peak
load, or intermittent workers. Finally, we
looked at the new W-1 visa program for non
seasonal workers (created by S.744).
H-2A Visas for Agricultural Workers
6
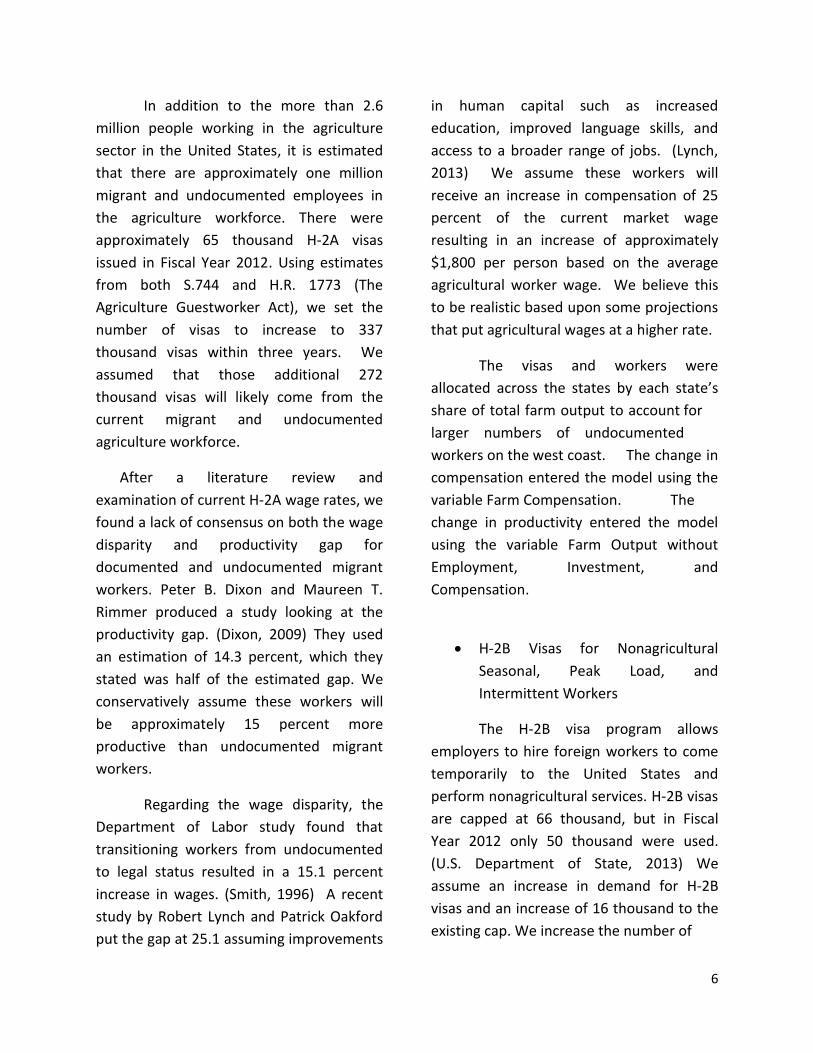
In addition to the more than 2.6
million people working in the agriculture
sector in the United States, it is estimated
that there are approximately one million
migrant and undocumented employees in
the agriculture workforce. There were
approximately 65 thousand H-2A visas
issued in Fiscal Year 2012. Using estimates
from both S.744 and H.R. 1773 (The
Agriculture Guestworker Act), we set the
number of visas to increase to 337
thousand visas within three years. We
assumed that those additional 272
thousand visas will likely come from the
current migrant and undocumented
agriculture workforce.
After a literature review and
examination of current H-2A wage rates, we
found a lack of consensus on both the wage
disparity and productivity gap for
documented and undocumented migrant
workers. Peter B. Dixon and Maureen T.
Rimmer produced a study looking at the
productivity gap. (Dixon, 2009) They used
an estimation of 14.3 percent, which they
stated was half of the estimated gap. We
conservatively assume these workers will
be approximately 15 percent more
productive than undocumented migrant
workers.
Regarding the wage disparity, the
Department of Labor study found that
transitioning workers from undocumented
to legal status resulted in a 15.1 percent
increase in wages. (Smith, 1996) A recent
study by Robert Lynch and Patrick Oakford
put the gap at 25.1 assuming improvements
in human capital such as increased
education, improved language skills, and
access to a broader range of jobs. (Lynch,
2013) We assume these workers will
receive an increase in compensation of 25
percent of the current market wage
resulting in an increase of approximately
$1,800 per person based on the average
agricultural worker wage. We believe this
to be realistic based upon some projections
that put agricultural wages at a higher rate.
The visas and workers were
allocated across the states by each state’s
share of total farm output to account for
larger numbers of undocumented
workers on the west coast. The change in
compensation entered the model using the
variable Farm Compensation. The
change in productivity entered the model
using the variable Farm Output without
Employment, Investment, and
Compensation.
H-2B Visas for Nonagricultural
Seasonal, Peak Load, and
Intermittent Workers
The H-2B visa program allows
employers to hire foreign workers to come
temporarily to the United States and
perform nonagricultural services. H-2B visas
are capped at 66 thousand, but in Fiscal
Year 2012 only 50 thousand were used. (U.S. Department of State, 2013) We
assume an increase in demand for H-2B
visas and an increase of 16 thousand to the
existing cap. We increase the number of

7
available H-2B visas by 16 thousand each year for the rest of the simulation run. We
increased international migration allocated
by state issuance for working age cohorts
16-64. We spread the employment over
sectors within the arts, entertainment, and
recreation, accommodations and food
services; and other services industries. Since
these are new people coming into the
system, there are no wage or productivity
changes.
W-1 Visas for Nonseasonal Workers
The immigration reform bill recently
passed in the Senate includes the creation
of a new W-nonimmigrant classification. A
W-1 visa holder may work in any occupation
where the typical preparation is less than a
four-year university degree. An employer
may register a position for which it cannot
find workers in the documented workforce.
Employers located in areas of the country
with high unemployment are prohibited
from using these workers unless they are
filling a position in a designated shortage
occupation.
First, we allocated the visas across
states using educational attainment by
state from the U.S. Census Bureau. These
visas target occupations in the Department
of Labor’s Job Zones 1-3, which are
essentially those jobs for which a four-year
college degree is not required. Thus we
assume that the greater the number of
people in a state with bachelors’ degrees or
higher, the greater the need would be for
outside workers in lesser-skilled
occupations.
Second, we allocated the visas
across the following industries using a
similar methodology as the H-2B visas:
administrative and support services; waste
management and remediation services;
museums, historical sites, zoos, and parks;
amusement, gambling, and recreation;
accommodation; food services and drinking
places; repair and maintenance; personal
and laundry services; membership
associations and organizations; and private
households. We assumed that the majority
of the W-1 visas would be issued in these
sectors; although this is a new program and
every sector would likely have eligible
positions.
In this case we assumed that 100
percent of the visas issued would be netnew jobs. The reason for the difference in
this simulation is that the legal
requirements that an employer must meet
to hire someone under this program are far
more stringent that previous programs. We
assumed that the total increase in migrants
is 20 percent greater than the increase in
visas due to the accompaniment of
dependents.
8
Results
After the methods were developed
and the data was secured, we ran the
simulations. The following information
provides the results from the model runs.
Pathway to Legal Status
The economic effects of the
Pathway to Legal Status policy are shown in
Table 1. As the policy does not change the
number of immigrants, but only affects the
legal status of current, undocumented
immigrants residing in the U.S., the total
number of actual people living in the U.S. isnot significantly affected by this policy.
Employment increases as a result of the
Pathway to Legal Status policy, as wage
gains and corresponding productivity
increases add to U.S. economic activity. In
2014, personal income rises by more than
$19 billion, gross domestic product (GDP)
goes up $10 billion, and employment
increases by 123 thousand.
9
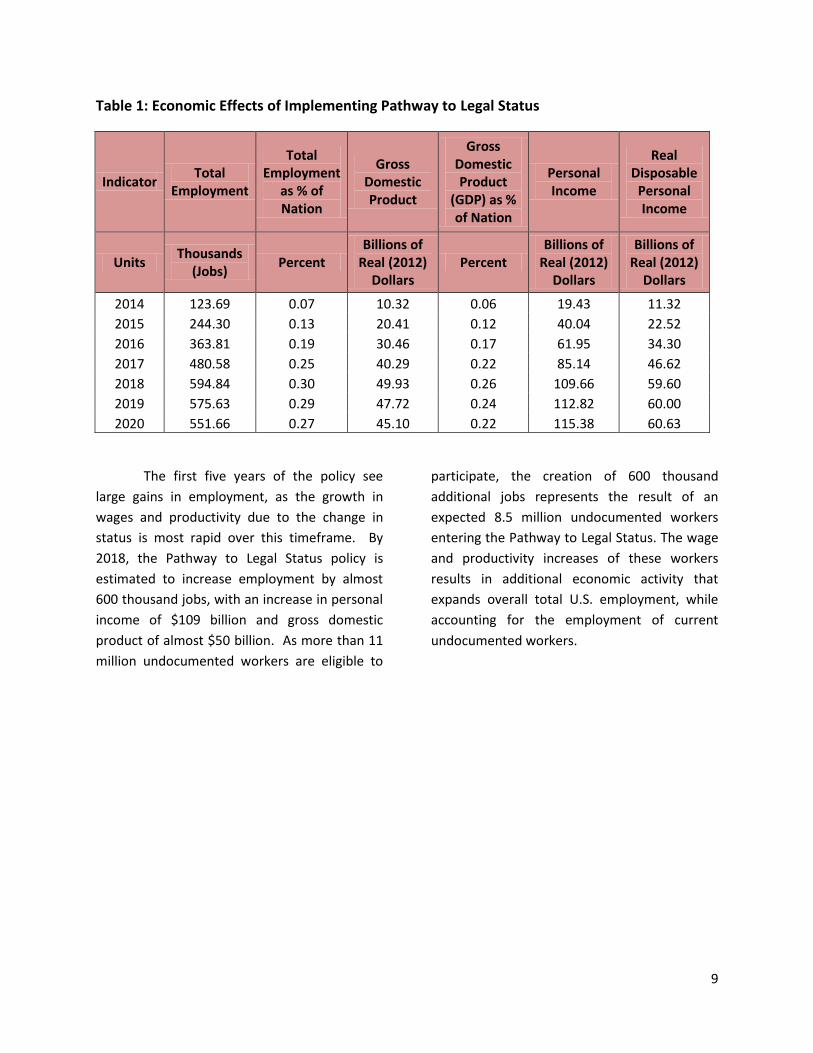
Table 1: Economic Effects of Implementing Pathway to Legal Status
Indicator Total
Employment
Total Employment
as % of Nation
Gross Domestic Product
Gross Domestic Product
(GDP) as % of Nation
Personal Income
Real Disposable
Personal Income
Units Thousands
(Jobs) Percent
Billions of Real (2012)
Dollars Percent
Billions of Real (2012)
Dollars
Billions of Real (2012)
Dollars
2014 123.69 0.07 10.32 0.06 19.43 11.32
2015 244.30 0.13 20.41 0.12 40.04 22.52
2016 363.81 0.19 30.46 0.17 61.95 34.30
2017 480.58 0.25 40.29 0.22 85.14 46.62
2018 594.84 0.30 49.93 0.26 109.66 59.60
2019 575.63 0.29 47.72 0.24 112.82 60.00
2020 551.66 0.27 45.10 0.22 115.38 60.63
The first five years of the policy see
large gains in employment, as the growth in
wages and productivity due to the change in
status is most rapid over this timeframe. By
2018, the Pathway to Legal Status policy is
estimated to increase employment by almost
600 thousand jobs, with an increase in personal
income of $109 billion and gross domestic
product of almost $50 billion. As more than 11
million undocumented workers are eligible to
participate, the creation of 600 thousand
additional jobs represents the result of an
expected 8.5 million undocumented workers
entering the Pathway to Legal Status. The wage
and productivity increases of these workers
results in additional economic activity that
expands overall total U.S. employment, while
accounting for the employment of current
undocumented workers.

10
Graph 1: Total Employment by Type for Pathway to Legal Status
Graph 1 shows the total employment changes
due to creation of a Pathway to Legal Status
program. Most of the wage and productivity
gains are assumed to occur in the first five
years, after which employment gains drop
slightly but then increase towards the end of
the time horizon. Initial wage and productivity
increases lead to a relatively rapid expansion in
investment, particularly residential investment,
as shown in Graph 2. This build-up in the
capital stock moderates after the initial wage
and productivity gains.
0
100
200
300
400
500
600
700
20
14
20
16
20
18
20
20
20
22
20
24
20
26
20
28
20
30
20
32
20
34
20
36
20
38
20
40
20
42
20
44
Job
s in
Th
ou
san
ds
Total Employment
Private Non-Farm Employment
Government Employment
11
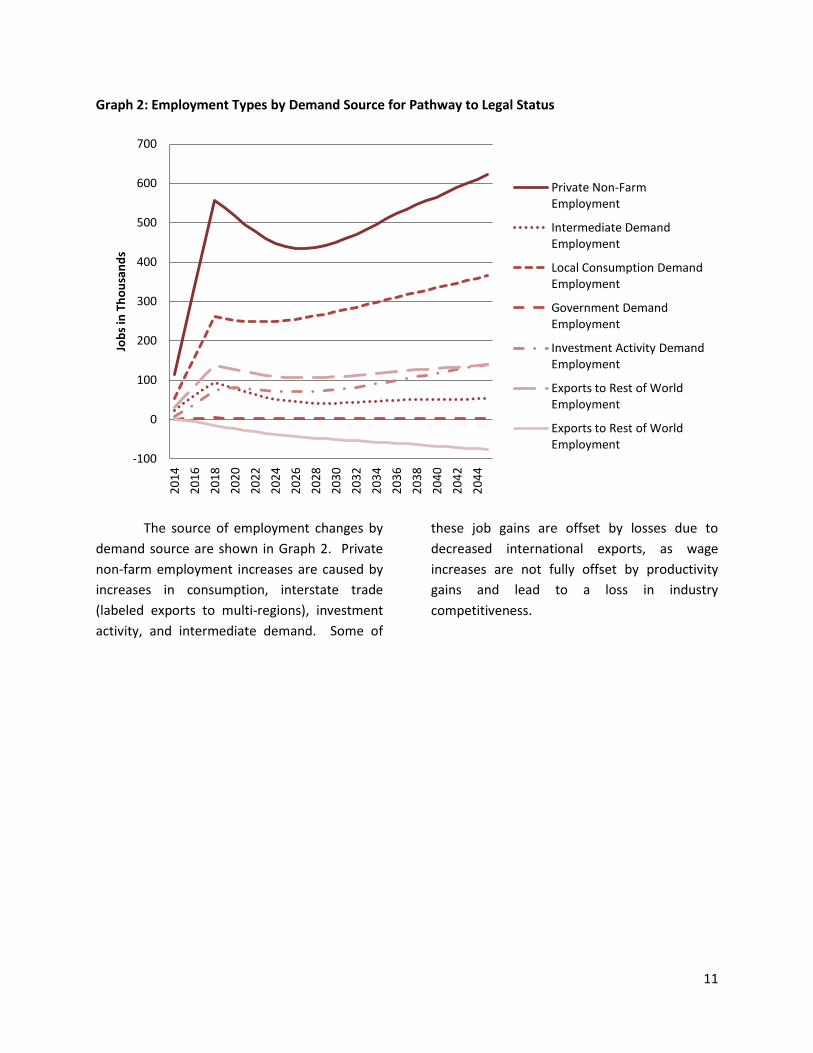
Graph 2: Employment Types by Demand Source for Pathway to Legal Status
The source of employment changes by
demand source are shown in Graph 2. Private
non-farm employment increases are caused by
increases in consumption, interstate trade
(labeled exports to multi-regions), investment
activity, and intermediate demand. Some of
these job gains are offset by losses due to
decreased international exports, as wage
increases are not fully offset by productivity
gains and lead to a loss in industry
competitiveness.
-100
0
100
200
300
400
500
600
700
20
14
20
16
20
18
20
20
20
22
20
24
20
26
20
28
20
30
20
32
20
34
20
36
20
38
20
40
20
42
20
44
Job
s in
Th
ou
san
ds
Private Non-Farm Employment
Intermediate Demand Employment
Local Consumption Demand Employment
Government Demand Employment
Investment Activity Demand Employment
Exports to Rest of World Employment
Exports to Rest of World Employment
12
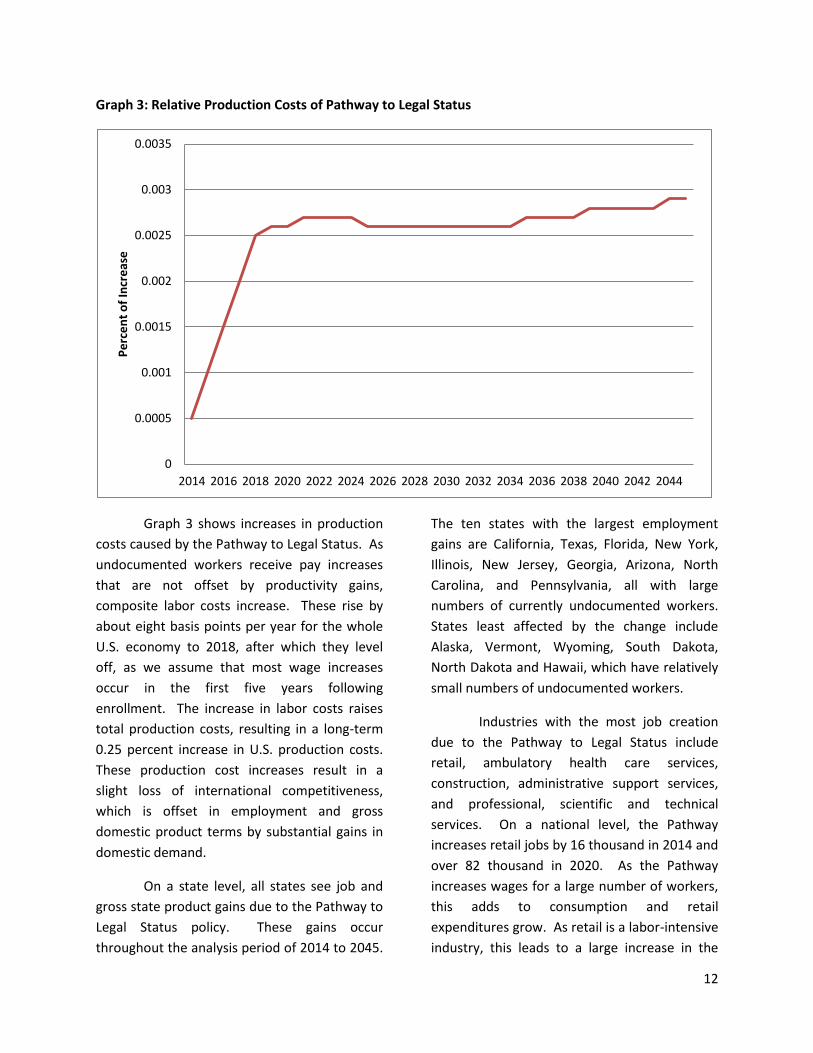
Graph 3: Relative Production Costs of Pathway to Legal Status
Graph 3 shows increases in production
costs caused by the Pathway to Legal Status. As
undocumented workers receive pay increases
that are not offset by productivity gains,
composite labor costs increase. These rise by
about eight basis points per year for the whole
U.S. economy to 2018, after which they level
off, as we assume that most wage increases
occur in the first five years following
enrollment. The increase in labor costs raises
total production costs, resulting in a long-term
0.25 percent increase in U.S. production costs.
These production cost increases result in a
slight loss of international competitiveness,
which is offset in employment and gross
domestic product terms by substantial gains in
domestic demand.
On a state level, all states see job and
gross state product gains due to the Pathway to
Legal Status policy. These gains occur
throughout the analysis period of 2014 to 2045.
The ten states with the largest employment
gains are California, Texas, Florida, New York,
Illinois, New Jersey, Georgia, Arizona, North
Carolina, and Pennsylvania, all with large
numbers of currently undocumented workers.
States least affected by the change include
Alaska, Vermont, Wyoming, South Dakota,
North Dakota and Hawaii, which have relatively
small numbers of undocumented workers.
Industries with the most job creation
due to the Pathway to Legal Status include
retail, ambulatory health care services,
construction, administrative support services,
and professional, scientific and technical
services. On a national level, the Pathway
increases retail jobs by 16 thousand in 2014 and
over 82 thousand in 2020. As the Pathway
increases wages for a large number of workers,
this adds to consumption and retail
expenditures grow. As retail is a labor-intensive
industry, this leads to a large increase in the
0
0.0005
0.001
0.0015
0.002
0.0025
0.003
0.0035
2014 2016 2018 2020 2022 2024 2026 2028 2030 2032 2034 2036 2038 2040 2042 2044
Pe
rce
nt
of
Incr
eas
e
13
number of retail employees. Construction
employment rises as housing, in particular, sees
a rapid expansion as incomes increase. Ten
thousand construction jobs are added in 2014,
and job gains of over 80 thousand are expected
in this industry by 2020.
High Skilled Labor
Table 2 shows the major economic
effects of the expansion of the high-skilled
(H-1B) visa program. Employment increases
by 227 thousand in 2014, and continues to
expand to over 1.3 million by 2045. Gross
domestic product rises by $22 billion in
2014, and also continues to grow,
increasing by $158 billion over the baseline
economic forecast by 2045. Corresponding
increases are also seen in personal income,
which increases by $13.7 billion in 2014 and
$146 billion in 2045, and real disposable
personal income, which rises to $10.48
billion in 2014 and $115 billion in 2045. The
total U.S. population increases as the visa
program expansions allow new workers to
enter the U.S., and also grows as the
workers’ dependents join and enter the U.S.
As a result of the expansion of H1-B visa
program, U.S. population increases by 91
thousand in 2014 and 4.6 million, or over
one percent of the U.S. total, by 2045.

14
Table 2: Economic Effects of Expanding the H-1B Visa Program
Indicator Total
Employment
Total Employ-ment as
% of Nation
Gross Domestic Product
Gross Domestic Product (GDP) as
% of Nation
Personal Income
Real Dispos-
able Personal Income
Population
Popu-lation
as % of Nation
Units Thousands
(Jobs) Percent
Billions of Real
(2012) Dollars
Percent
Billions of Real (2012) Dollars
Billions of Real (2012) Dollars
Thousands Percent
2014 227.91 0.12 22.00 0.13 13.74 10.48 91.41 0.03
2015 259.94 0.14 25.34 0.15 17.33 12.16 192.75 0.06
2016 291.80 0.15 28.73 0.16 20.80 14.22 304.47 0.09
2017 323.17 0.17 32.14 0.17 24.21 16.40 426.75 0.13
2018 356.25 0.18 35.75 0.19 27.71 18.78 559.88 0.17
2019 389.77 0.19 39.48 0.20 31.02 21.09 687.50 0.21
2020 408.08 0.20 41.59 0.21 33.34 22.78 817.19 0.25
2025 528.63 0.25 55.45 0.24 46.05 33.20 1492.19 0.43
2030 696.25 0.31 75.29 0.29 63.11 47.23 2216.06 0.62
2035 891.11 0.39 99.19 0.35 84.75 64.68 2976.72 0.81
2040 1099.13 0.46 126.62 0.40 111.68 86.61 3771.94 1.00
2045 1330.16 0.53 158.98 0.45 146.39 115.18 4613.38 1.19
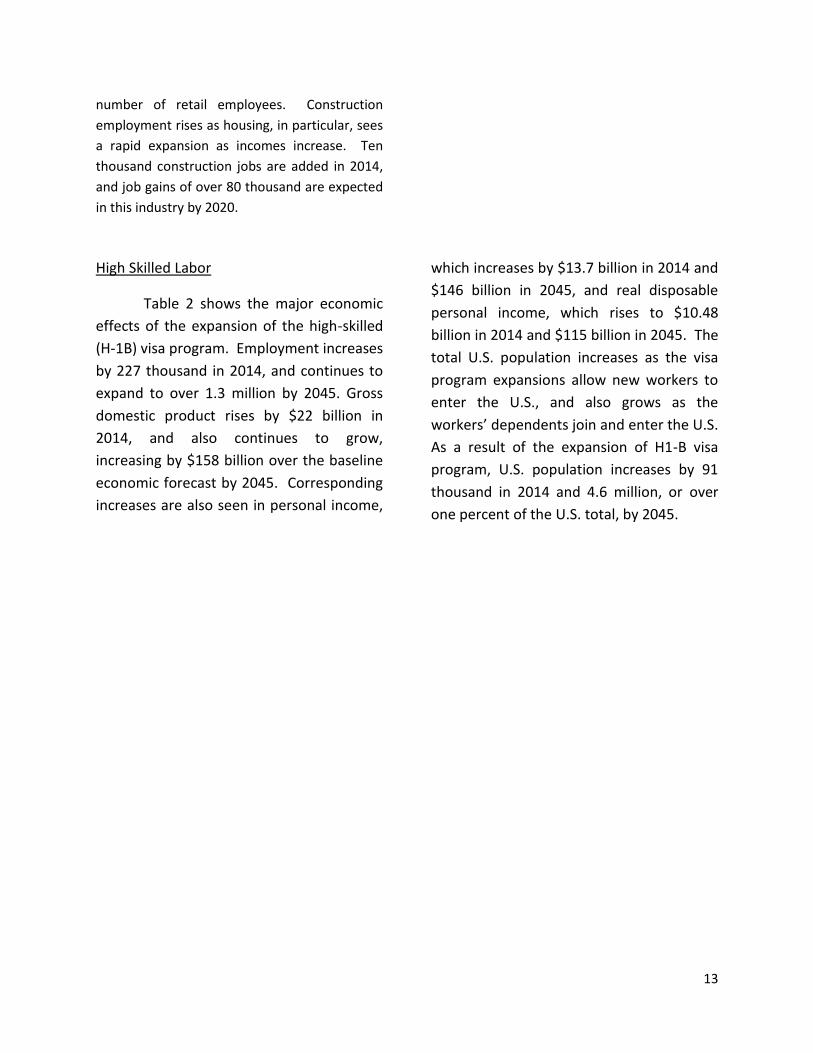
Graph 4 shows the increase in
employment for H-1B visas. Job growth is
continual throughout the 2014-2045 time
period as the visa program expansion adds
new workers every year. Most jobs are
created in private non-farm sectors while
some growth in government employment,
based on the need to provide services for a
larger population and business community,
is also predicted. Employment by source of
demand is shown in Graph 5. As
consumption represents over three-
quarters of the economy, employment
associated with increases in consumption is
the largest portion of the H-1B visa
expansion employment increase. Increased
trade, labeled exports to multi-regions and
international exports, also increase as firms
expand output due to greater high-skilled
labor availability. Employment related to
investment activity, both residential and
non-residential, also increases as the overall
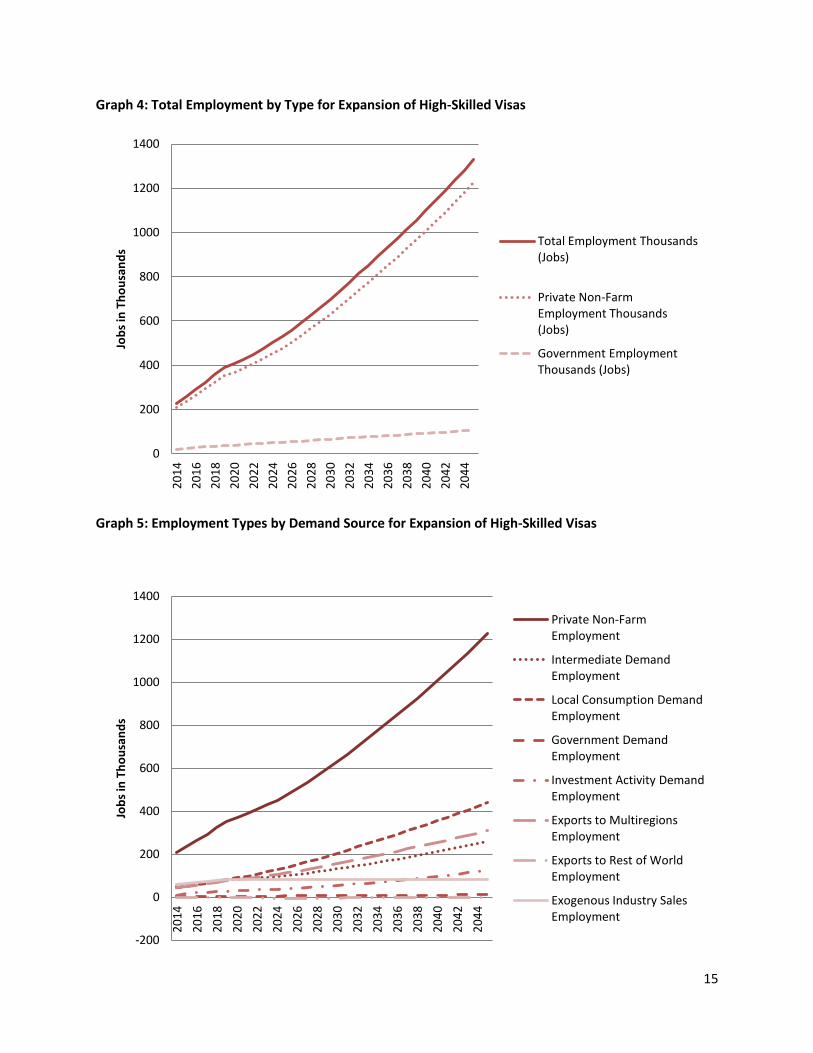
economy expands. Graph 6 details the
change in residential investment, which
shows how rising population and income
both lead to increased demand for housing.
15
Graph 4: Total Employment by Type for Expansion of High-Skilled Visas
Graph 5: Employment Types by Demand Source for Expansion of High-Skilled Visas
0
200
400
600
800
1000
1200
1400
20
14
20
16
20
18
20
20
20
22
20
24
20
26
20
28
20
30
20
32
20
34
20
36
20
38
20
40
20
42
20
44
Job
s in
Th
ou
san
ds
Total Employment Thousands (Jobs)
Private Non-Farm Employment Thousands (Jobs)
Government Employment Thousands (Jobs)
-200
0
200
400
600
800
1000
1200
1400
20
14
20
16
20
18
20
20
20
22
20
24
20
26
20
28
20
30
20
32
20
34
20
36
20
38
20
40
20
42
20
44
Job
s in
Th
ou
san
ds
Private Non-Farm Employment
Intermediate Demand Employment
Local Consumption Demand Employment
Government Demand Employment
Investment Activity Demand Employment
Exports to Multiregions Employment
Exports to Rest of World Employment
Exogenous Industry Sales Employment
16
Graph 6: Change in Residential Investment Resulting from Expansion of High-Skilled Visas
Lesser-Skilled: Agriculture Worker Visas
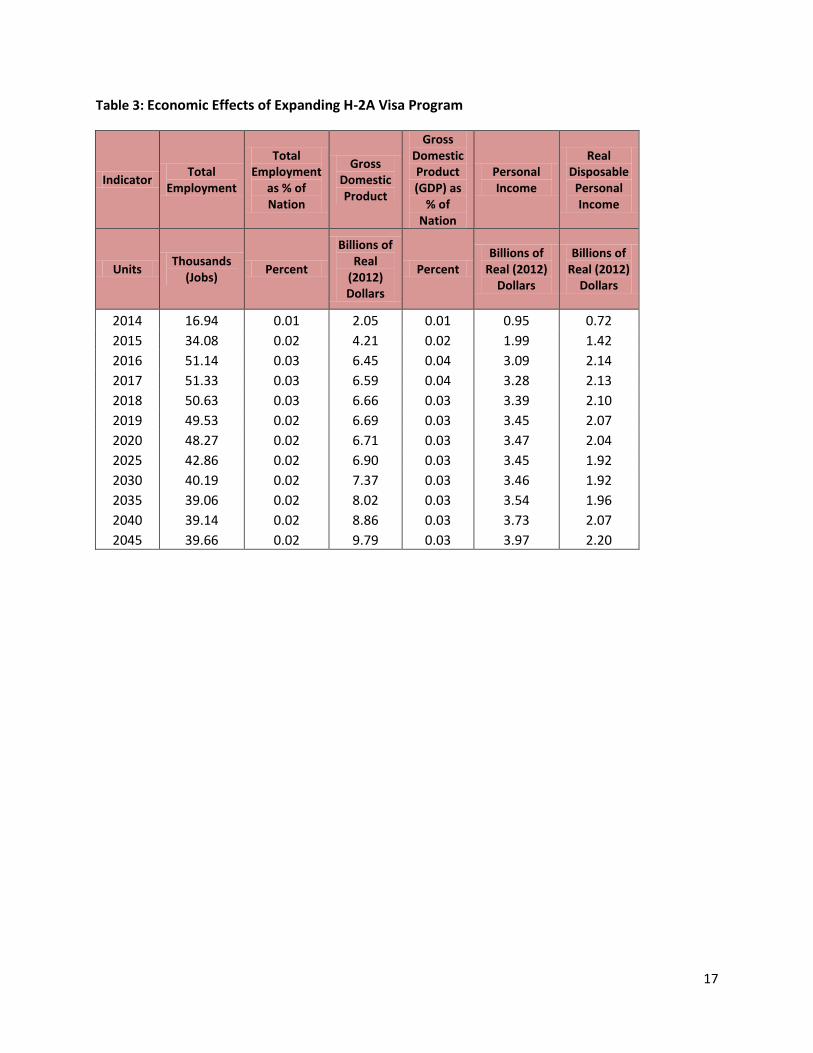
Table 3 shows the major economic effects of the expansion of the lesser-skilled agricultural worker (H-2A) visa program. The increase in visas for farm workers results in total employment increases of almost 17 thousand jobs in 2014, peaking at just over 51 thousand jobs in 2017, and declining slightly to
39.6 thousand net new jobs in 2045. Gross domestic product, personal income and real disposable personal income also increase. Increases in gross domestic product start at approximately $2 billion in 2014, increasing to $9.79 billion by 2045.
0
2
4
6
8
10
12
14
16
18
20
14
20
15
20
16
20
17
20
18
20
19
20
20
20
21
20
22
20
23
20
24
20
25
20
26
20
27
20
28
20
29
20
30
20
31
20
32
20
33
2
03
4
20
35
20
36
20
37
20
38
20
39
20
40
20
41
20
42
20
43
20
44
20
45
Bill
ion
s o
f R
eal
20
12
Do
llars
17
Table 3: Economic Effects of Expanding H-2A Visa Program
Indicator Total
Employment
Total Employment
as % of Nation
Gross Domestic Product
Gross Domestic Product (GDP) as
% of Nation
Personal Income
Real Disposable
Personal Income
Units Thousands
(Jobs) Percent
Billions of Real
(2012) Dollars
Percent Billions of
Real (2012) Dollars
Billions of Real (2012)
Dollars
2014 16.94 0.01 2.05 0.01 0.95 0.72
2015 34.08 0.02 4.21 0.02 1.99 1.42
2016 51.14 0.03 6.45 0.04 3.09 2.14
2017 51.33 0.03 6.59 0.04 3.28 2.13
2018 50.63 0.03 6.66 0.03 3.39 2.10
2019 49.53 0.02 6.69 0.03 3.45 2.07
2020 48.27 0.02 6.71 0.03 3.47 2.04
2025 42.86 0.02 6.90 0.03 3.45 1.92
2030 40.19 0.02 7.37 0.03 3.46 1.92
2035 39.06 0.02 8.02 0.03 3.54 1.96
2040 39.14 0.02 8.86 0.03 3.73 2.07
2045 39.66 0.02 9.79 0.03 3.97 2.20
18
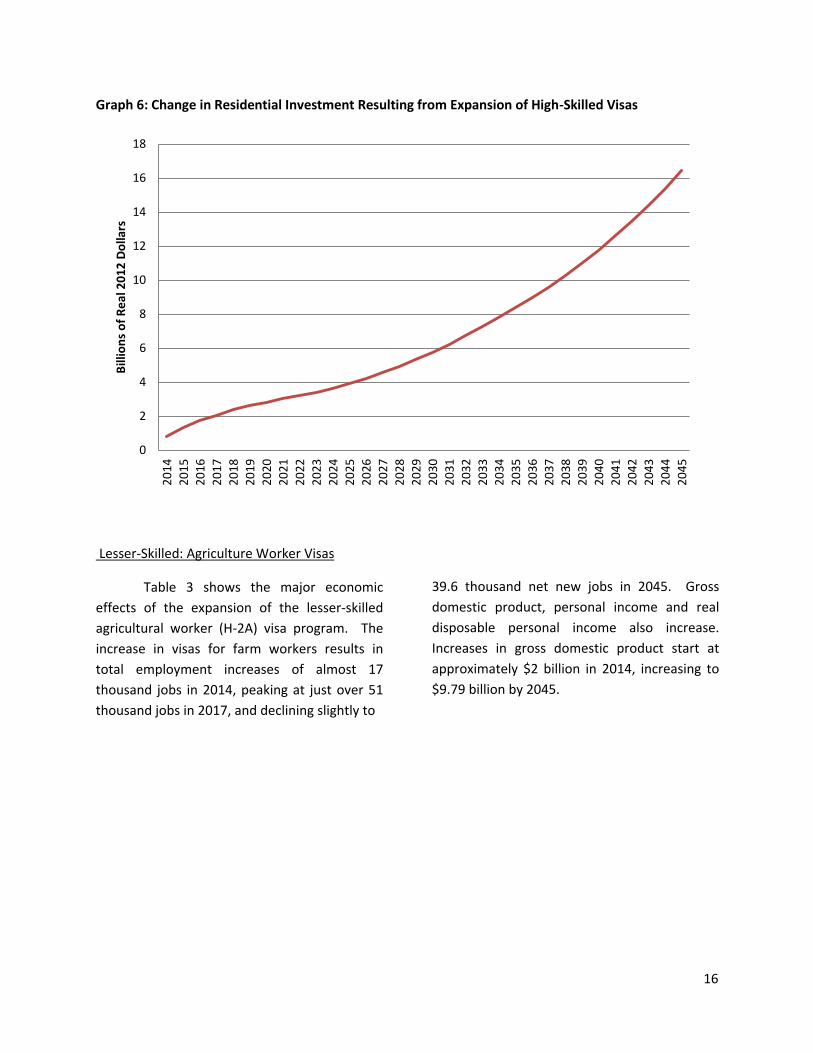
Graph 7: Employment Components by Demand Source for Expansion of Lesser-Skilled Visas for
Agricultural Workers
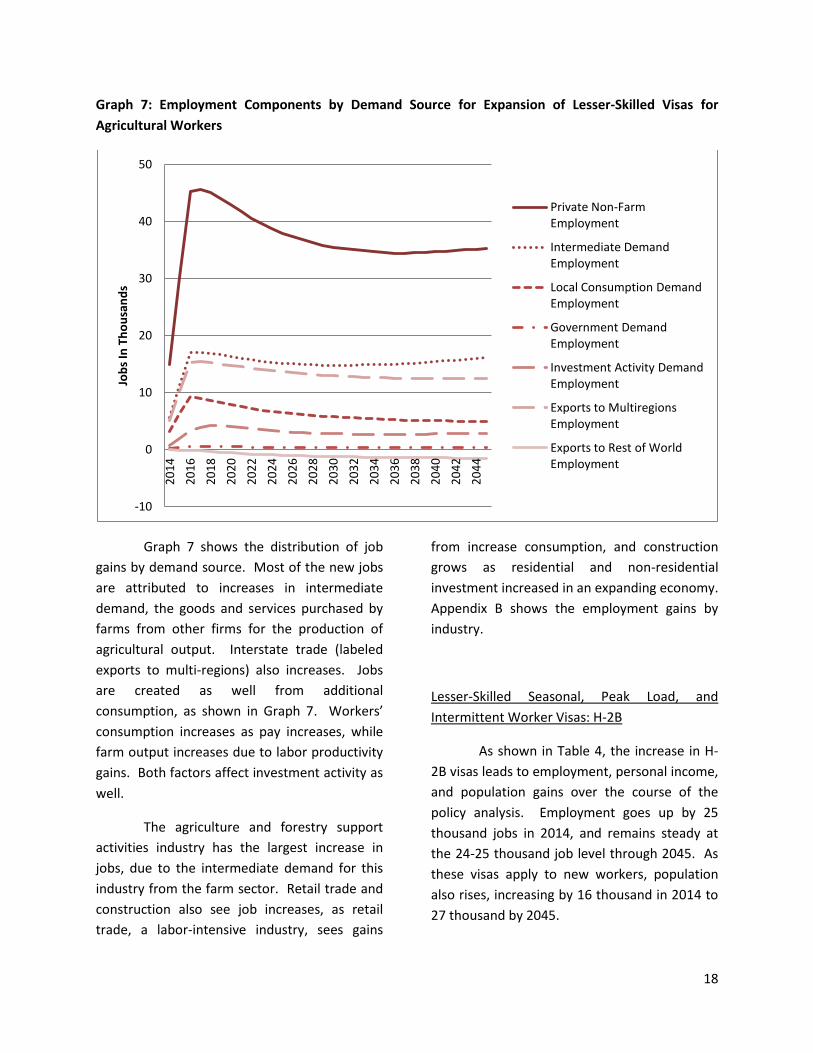
Graph 7 shows the distribution of job
gains by demand source. Most of the new jobs
are attributed to increases in intermediate
demand, the goods and services purchased by
farms from other firms for the production of
agricultural output. Interstate trade (labeled
exports to multi-regions) also increases. Jobs
are created as well from additional
consumption, as shown in Graph 7. Workers’
consumption increases as pay increases, while
farm output increases due to labor productivity
gains. Both factors affect investment activity as
well.
The agriculture and forestry support
activities industry has the largest increase in
jobs, due to the intermediate demand for this
industry from the farm sector. Retail trade and
construction also see job increases, as retail
trade, a labor-intensive industry, sees gains
from increase consumption, and construction
grows as residential and non-residential
investment increased in an expanding economy.
Appendix B shows the employment gains by
industry.
Lesser-Skilled Seasonal, Peak Load, and
Intermittent Worker Visas: H-2B
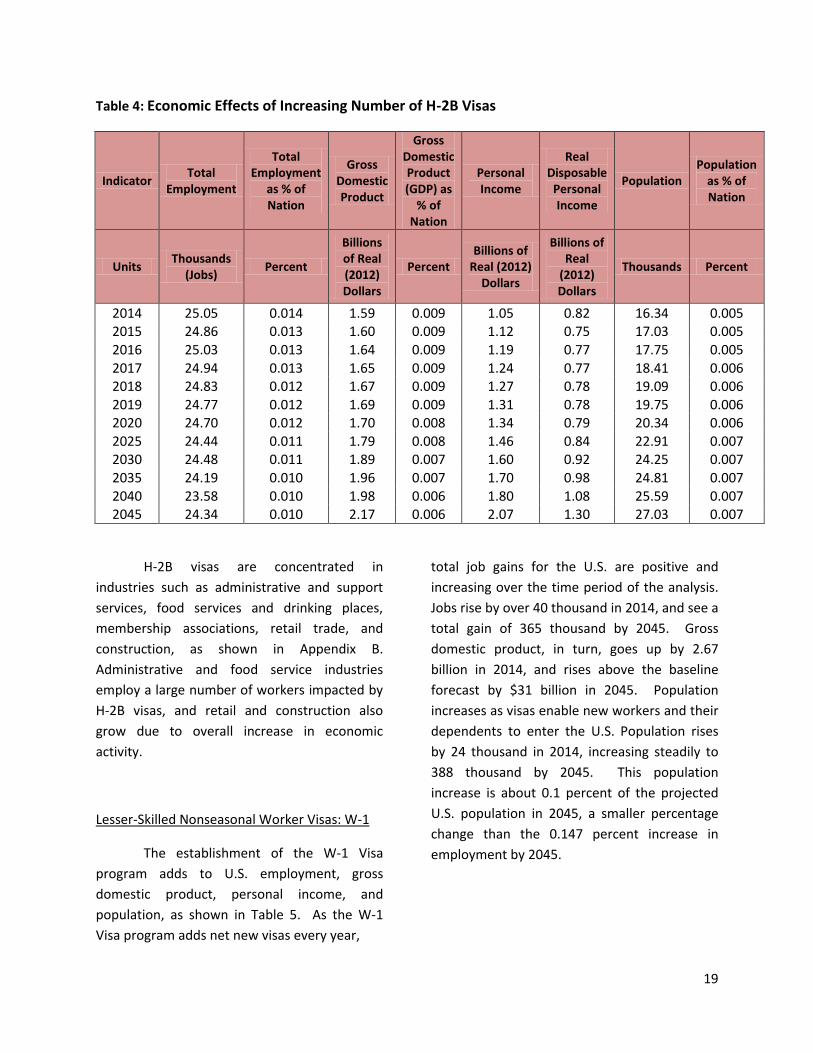
As shown in Table 4, the increase in H-
2B visas leads to employment, personal income,
and population gains over the course of the
policy analysis. Employment goes up by 25
thousand jobs in 2014, and remains steady at
the 24-25 thousand job level through 2045. As
these visas apply to new workers, population
also rises, increasing by 16 thousand in 2014 to
27 thousand by 2045.
-10
0
10
20
30
40
50 2
01
4
20
16
20
18
20
20
20
22
20
24
20
26
20
28
20
30
20
32
20
34
20
36
20
38
20
40
20
42
20
44
Job
s In
Th
ou
san
ds
Private Non-Farm Employment
Intermediate Demand Employment
Local Consumption Demand Employment
Government Demand Employment
Investment Activity Demand Employment
Exports to Multiregions Employment
Exports to Rest of World Employment
19
Table 4: Economic Effects of Increasing Number of H-2B Visas
Indicator Total
Employment
Total Employment
as % of Nation
Gross Domestic Product
Gross Domestic Product (GDP) as
% of Nation
Personal Income
Real Disposable
Personal Income
Population Population
as % of Nation
Units Thousands
(Jobs) Percent
Billions of Real (2012) Dollars
Percent Billions of
Real (2012) Dollars
Billions of Real
(2012) Dollars
Thousands Percent
2014 25.05 0.014 1.59 0.009 1.05 0.82 16.34 0.005 2015 24.86 0.013 1.60 0.009 1.12 0.75 17.03 0.005
2016 25.03 0.013 1.64 0.009 1.19 0.77 17.75 0.005 2017 24.94 0.013 1.65 0.009 1.24 0.77 18.41 0.006 2018 24.83 0.012 1.67 0.009 1.27 0.78 19.09 0.006 2019 24.77 0.012 1.69 0.009 1.31 0.78 19.75 0.006 2020 24.70 0.012 1.70 0.008 1.34 0.79 20.34 0.006
2025 24.44 0.011 1.79 0.008 1.46 0.84 22.91 0.007 2030 24.48 0.011 1.89 0.007 1.60 0.92 24.25 0.007 2035 24.19 0.010 1.96 0.007 1.70 0.98 24.81 0.007
2040 23.58 0.010 1.98 0.006 1.80 1.08 25.59 0.007 2045 24.34 0.010 2.17 0.006 2.07 1.30 27.03 0.007
H-2B visas are concentrated in
industries such as administrative and support
services, food services and drinking places,
membership associations, retail trade, and
construction, as shown in Appendix B.
Administrative and food service industries
employ a large number of workers impacted by
H-2B visas, and retail and construction also
grow due to overall increase in economic
activity.
Lesser-Skilled Nonseasonal Worker Visas: W-1
The establishment of the W-1 Visa
program adds to U.S. employment, gross
domestic product, personal income, and
population, as shown in Table 5. As the W-1
Visa program adds net new visas every year,
total job gains for the U.S. are positive and
increasing over the time period of the analysis.
Jobs rise by over 40 thousand in 2014, and see a
total gain of 365 thousand by 2045. Gross
domestic product, in turn, goes up by 2.67
billion in 2014, and rises above the baseline
forecast by $31 billion in 2045. Population
increases as visas enable new workers and their
dependents to enter the U.S. Population rises
by 24 thousand in 2014, increasing steadily to
388 thousand by 2045. This population
increase is about 0.1 percent of the projected
U.S. population in 2045, a smaller percentage
change than the 0.147 percent increase in
employment by 2045.

20
Table 5: Economic Effects of Creating the W-1 Visas
Indicator Total
Employment
Total Employment
as % of Nation
Gross Domestic Product
Gross Domestic Product (GDP) as
% of Nation
Personal Income
Real Disposable
Personal Income
Population Population
as % of Nation
Units Thousands
(Jobs) Percent
Billions of Real (2012) Dollars
Percent Billions of
Real (2012) Dollars
Billions of Real
(2012) Dollars
Thousands Percent
2014 40.91 0.022 2.67 0.02 1.81 1.38 24.41 0.008
2015 70.75 0.038 4.65 0.03 3.29 2.29 43.44 0.014
2016 110.75 0.058 7.36 0.04 5.32 3.58 69.16 0.021
2017 150.02 0.077 10.08 0.05 7.42 4.84 95.63 0.029 2018 398.72 0.200 27.18 0.14 19.40 13.53 250.91 0.077
2019 395.83 0.196 27.15 0.14 20.41 12.74 258.56 0.078 2020 395.22 0.194 27.39 0.14 21.29 12.77 266.25 0.080
2025 375.30 0.177 26.96 0.12 22.96 12.50 302.94 0.088 2030 365.73 0.165 27.44 0.11 24.15 12.99 331.66 0.093 2035 364.73 0.158 28.65 0.10 25.67 13.96 351.00 0.096
2040 361.41 0.151 29.61 0.09 27.26 15.14 367.75 0.097 2045 365.42 0.147 31.40 0.09 29.97 17.26 388.88 0.100
Industries impacted by the W-1 Visa
program are similar to those in the H-2B
program. Administrative and support services
and food services and drinking places see the
largest gain, as these are both labor-intensive
industries and employ many workers affected
by the W-1 Visa program. Construction and
retail trade also see a large number of job
increases, a combined effect of a relatively large
number of workers affected by the W-1 Visa,
and the responsiveness of these industries to
overall economic growth.
Employment gains by state are highest
in California, Texas, New York, Florida and
Illinois. These states are large employers and,
additionally, relatively many workers would
qualify under the W-1 Visa program as
employers are required to prove that existing
domestic workers are not available. In
percentage terms, New Jersey, Massachusetts,
New York, Connecticut and Maryland have the
greatest job gains from the expansion of the W-
1 Visa program. As workers are only hired in
places without current domestic workers to fill
jobs, these states will employ proportionally
more of the W-1 Visa workers.
Conclusion
At the time of writing of this report, the
United States Senate had passed animmigration reform bill that is up for review
and debate by the House of Representatives.
The economic effect of this legislation is
paramount in an economy with a national
unemployment rate of 7.6 percent and local

21
unemployment rates that are in many cases
much higher. Thus, the state-level economic
impacts of key legislative components that are
discussed in this report are important to the
legislative decision-making process.
In this study, we focus on three central
elements of immigration legislation: the
pathway to legal status, the expansion of high-
skilled (H-1B) visas, and the expansion of lesser-
skilled visas (H-2A [farm visas], H-2B [seasonal,
peak load, and intermittent worker visas] and
W-1 [lesser-skilled nonseasonal worker visas]).
In each of the three cases, we show increases in
employment and gross domestic product, on a
state-by-state level, for the analysis period of
2014-2045. These results are reported for the
United States as a whole and in summary, state-
level fact sheets for each potential policy
change.
While the Pathway to Legal Status and
expansion of visa programs most directly
benefit those who directly enroll in the Pathway
program or receive visas, current U.S. citizens
and documented immigrants also benefit from
these programs. As previously undocumented
workers enter the Pathway to Legal Status, they
are able to contribute more to the U.S.
economy. This additional economic
contribution, measured as labor productivity,
occurs as workers have more flexibility in the
labor market and choose to invest in their own
training and skills, for example by improving
their English-language skills. Workers who
enter the Pathway to Legal Status are also
expected to see wage gains, and will spend their
additional income in the economy, creating jobs
for others.
By expanding high-skilled (H-1B) visas,
businesses with labor shortages will be able to
expand their operations. The business
expansion encompasses not only the H-1B
employees, but also additional positions within
the firm that will employ the general workforce.
An expansion in lesser-skilled visas, particularly
as there are stringent new requirements to
demonstrate the unavailability of domestic
workers, will lead to increased economic
productivity and output. The expansion of
these visas will benefit not only those who
receive them, but also the workers and
consumers in the U.S. economy as a whole.

22
References
Dixon, Peter B. and Maureen T. Rimmer.
(2009). “Restriction or Legalization?
Measuring the Economic Benefits of
Immigration Reform.” Cato Institute, Center
for Trade Policy Studies.
Hoefer, Michael D. (1991). “Background of
U.S. Immigration Policy Reform.” U.S.
Immigration Policy Reform in the 190s: A
Preliminary Assessment. Edited by Francisco
L. Rivera-Batiz, Selig L. Sechzer, and Ira N.
Gang.
Holtz-Eakin, Douglas. (2013). “Immigration
Reform, Economic Growth, and the Fiscal
Challenge.” American Action Forum.
Lynch, Robert and Patrick Oakford. (2013).
“The Economic Effects of Granting Legal
Status and Citizenship to Undocumented
Immigrants.” Center for American Progress.
Office of Foreign Labor Certification (OFLC).
(2011). “Performance Data.” U.S.
Department of Labor. Employment and
Training Administration.
Passel, Jeffrey and D’Vera Cohn. (2011).
“Unauthorized Immigrant Population:
National and State Trends, 2010.” Pew
Research Center.
Peri, Giovanni. (2012). “The Effect of
Immigration on Productivity: Evidence from
U.S. States.” The Review of Economics and
Statistics, MIT Press, vol. 94(1), pages 348-
358.
Smith, Shirley, Roger Kramer and Audrey
Singer. (1996). Characteristics and Labor
Market Behavior of the Legalized
Population Five Years Following
Legalization, Immigration Policy and
Research Division, Bureau of Intl. Labor
Affairs, U.S. Dept. of Labor, Washington,
D.C.
United States Department of State. "Worldwide NIV Workload by Visa Category FY 2012", last modified February 21, 2013. http://www.travel.state.gov/pdf/FY2012NIVWorkloadbyVisaCategory.pdf.

23
Appendix A: The PI+ Model
REMI’s PI+ model is a structural
economic forecasting and policy analysis
model. It integrates input-output,
computable general equilibrium,
econometric and economic geography
methodologies. The model is dynamic, with
forecasts and simulations generated on an
annual basis and behavioral responses to
compensation, price, and other economic
factors.
The model consists of thousands of
simultaneous equations with a structure
that is relatively straightforward. The exact
number of equations used varies depending
on the extent of industry, demographic,
demand, and other detail in the specific
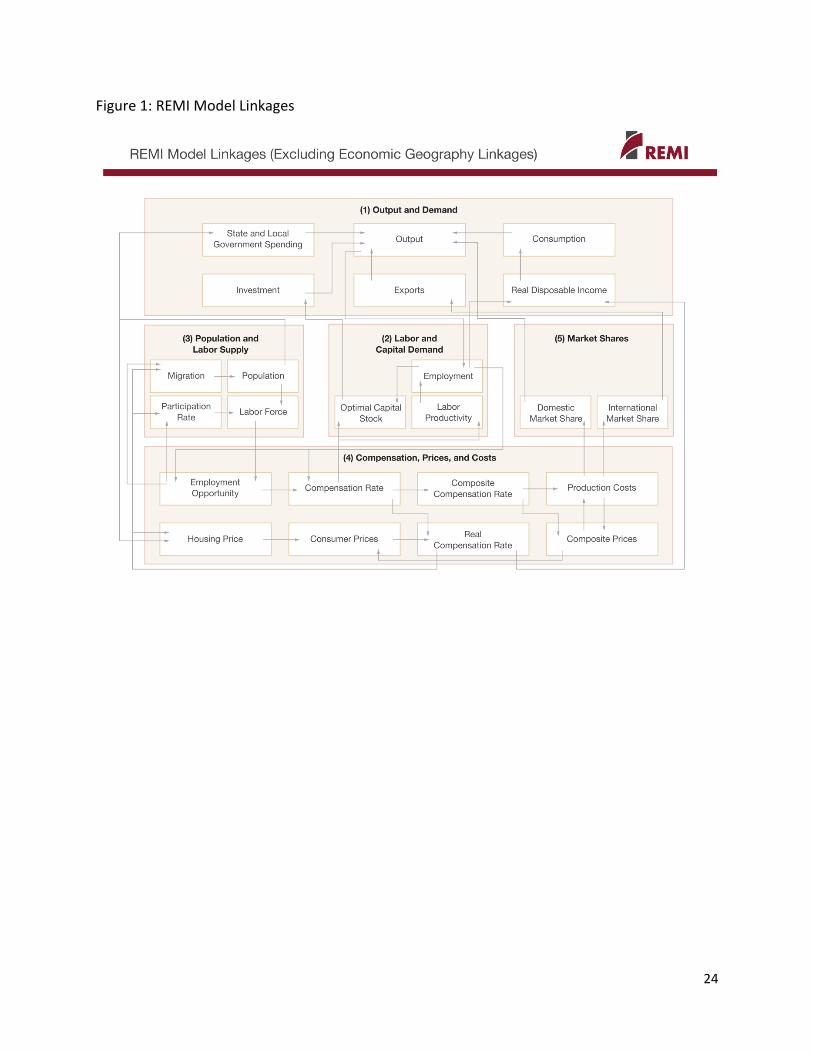
model being used. The overall structure of
the model can be summarized in five major
blocks: (1) Output and Demand, (2) Labor
and Capital Demand, (3) Population and
Labor Supply, (4) Compensation, Prices, and
Costs, and (5) Market Shares. The blocks
and their key interactions are shown in
Figures 1 and 2.
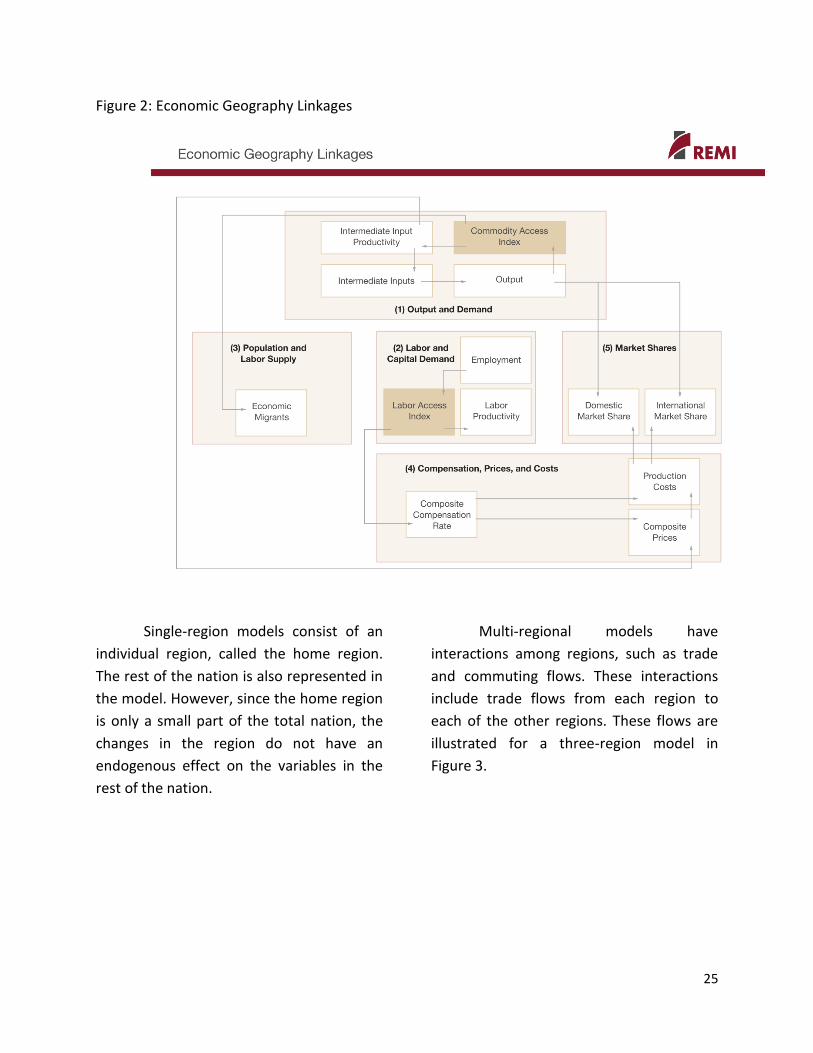
The Output and Demand block
consists of output, demand, consumption,
investment, government spending, exports,
and imports, as well as feedback from
output change due to the change in the
productivity of intermediate inputs. The
Labor and Capital Demand block includes
labor intensity and productivity as well as
demand for labor and capital. Labor force
participation rate and migration equations
are in the Population and Labor Supply
block. The Compensation, Prices, and Costs
block includes composite prices,
determinants of production costs, the
consumption price deflator, housing prices,
and the compensation equations. The
proportion of local, inter-regional, and
export markets captured by each region is
included in the Market Shares block.
Models can be built as single region,
multi-region, or multi-region national
models. A region is defined broadly as a
sub-national area, and could consist of a
state, province, county, or city, or any
combination of sub-national areas.
24
Figure 1: REMI Model Linkages
25
Figure 2: Economic Geography Linkages
Single-region models consist of an
individual region, called the home region.
The rest of the nation is also represented in
the model. However, since the home region
is only a small part of the total nation, the
changes in the region do not have an
endogenous effect on the variables in the
rest of the nation.
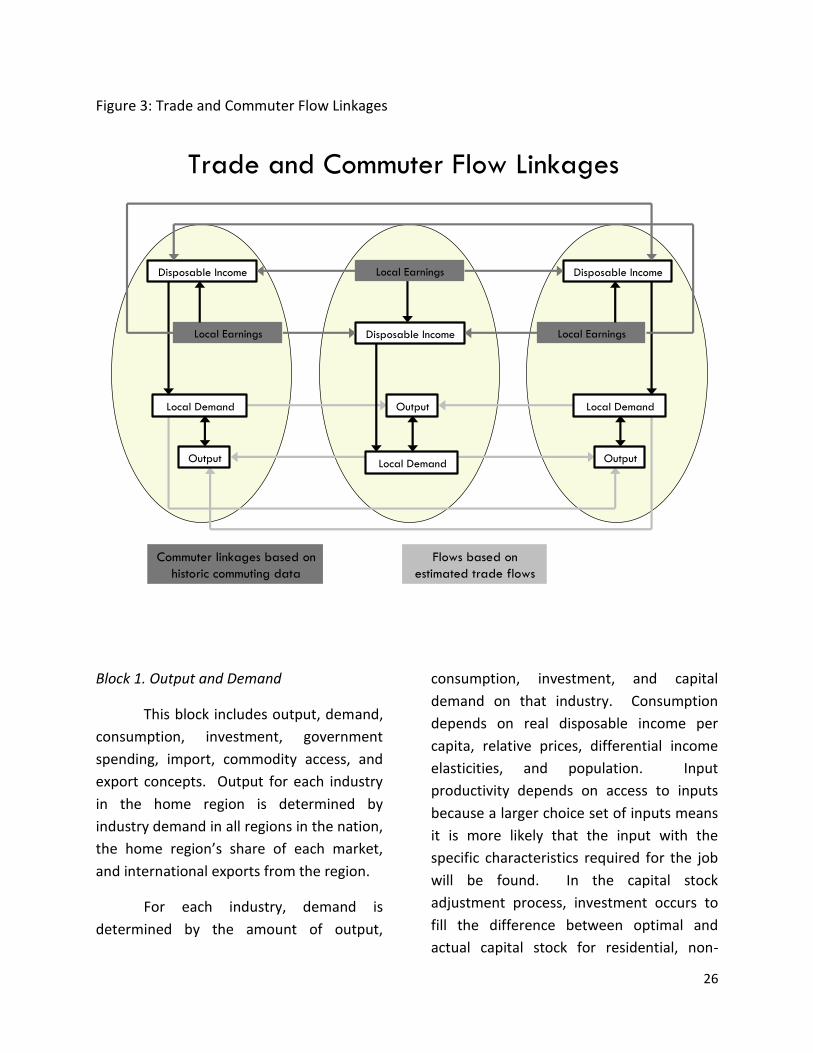
Multi-regional models have
interactions among regions, such as trade
and commuting flows. These interactions
include trade flows from each region to
each of the other regions. These flows are
illustrated for a three-region model in
Figure 3.
26
Figure 3: Trade and Commuter Flow Linkages
Trade and Commuter Flow Linkages
Flows based on
estimated trade flows
Local Demand
Output Local Demand
Output Local Demand
Output
Disposable Income
Disposable Income
Disposable Income
Local Earnings
Local Earnings
Local Earnings
Commuter linkages based on
historic commuting data
Block 1. Output and Demand
This block includes output, demand,
consumption, investment, government
spending, import, commodity access, and
export concepts. Output for each industry
in the home region is determined by
industry demand in all regions in the nation,
the home region’s share of each market,
and international exports from the region.
For each industry, demand is
determined by the amount of output,
consumption, investment, and capital
demand on that industry. Consumption
depends on real disposable income per
capita, relative prices, differential income
elasticities, and population. Input
productivity depends on access to inputs
because a larger choice set of inputs means
it is more likely that the input with the
specific characteristics required for the job
will be found. In the capital stock
adjustment process, investment occurs to
fill the difference between optimal and
actual capital stock for residential, non-

27
residential, and equipment investment.
Government spending changes are
determined by changes in the population.
Block 2. Labor and Capital Demand
The Labor and Capital Demand block
includes the determination of labor
productivity, labor intensity, and the
optimal capital stocks. Industry-specific
labor productivity depends on the
availability of workers with differentiated
skills for the occupations used in each
industry. The occupational labor supply and
commuting costs determine firms’ access to
a specialized labor force.
Labor intensity is determined by the
cost of labor relative to the other factor
inputs, capital and fuel. Demand for capital
is driven by the optimal capital stock
equation for both non-residential capital
and equipment. Optimal capital stock for
each industry depends on the relative cost
of labor and capital, and the employment
weighted by capital use for each industry.
Employment in private industries is
determined by the value added and
employment per unit of value added in
each industry.
Block 3. Population and Labor Supply
The Population and Labor Supply
block includes detailed demographic
information about the region. Population
data is given for age, gender, and race, with
birth and survival rates for each group. The
size and labor force participation rate of
each group determines the labor supply.
These participation rates respond to
changes in employment relative to the
potential labor force and to changes in the
real after-tax compensation rate. Migration
includes retirement, military, international,
and economic migration. Economic
migration is determined by the relative real
after-tax compensation rate, relative
employment opportunity, and consumer
access to variety.
Block 4. Compensation, Prices and Costs
This block includes delivered prices,
production costs, equipment cost, the
consumption deflator, consumer prices, the
price of housing, and the compensation
equation. Economic geography concepts
account for the productivity and price
effects of access to specialized labor, goods,
and services.
These prices measure the price of
the industry output, taking into account the
access to production locations. This access
is important due to the specialization of
production that takes place within each
industry, and because transportation and
transaction costs of distance are significant.
Composite prices for each industry are then
calculated based on the production costs of
supplying regions, the effective distance to
these regions, and the index of access to
the variety of outputs in the industry
28
relative to the access by other uses of the
product.
The cost of production for each
industry is determined by the cost of labor,
capital, fuel, and intermediate inputs.
Labor costs reflect a productivity
adjustment to account for access to
specialized labor, as well as underlying
compensation rates. Capital costs include
costs of non-residential structures and
equipment, while fuel costs incorporate
electricity, natural gas, and residual fuels.
The consumption deflator converts
industry prices to prices for consumption
commodities. For potential migrants, the
consumer price is additionally calculated to
include housing prices. Housing prices
change from their initial level depending on
changes in income and population density.
Compensation changes are due to
changes in labor demand and supply
conditions and changes in the national
compensation rate. Changes in
employment opportunities relative to the
labor force and occupational demand
change determine compensation rates by
industry.
Block 5. Market Shares
The market shares equations
measure the proportion of local and export
markets that are captured by each industry.
These depend on relative production costs,
the estimated price elasticity of demand,
and the effective distance between the
home region and each of the other regions.
The change in share of a specific area in any
region depends on changes in its delivered
price and the quantity it produces
compared with the same factors for
competitors in that market. The share of
local and external markets then drives the
exports from and imports to the home
economy.
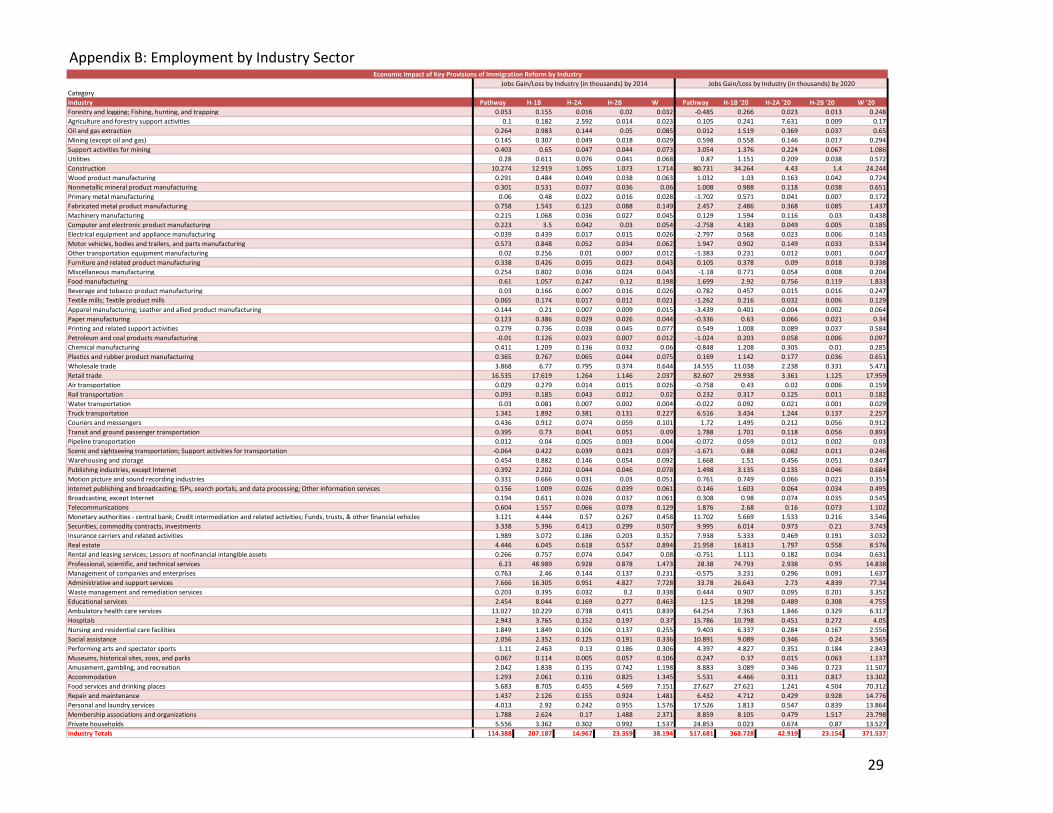
CategoryIndustry Pathway H-1B H-2A H-2B W Pathway H-1B '20 H-2A '20 H-2B '20 W '20Forestry and logging; Fishing, hunting, and trapping 0.053 0.155 0.016 0.02 0.032 -0.485 0.266 0.023 0.013 0.248Agriculture and forestry support activities 0.1 0.182 2.592 0.014 0.023 0.105 0.241 7.631 0.009 0.17Oil and gas extraction 0.264 0.983 0.144 0.05 0.085 0.012 1.519 0.369 0.037 0.65Mining (except oil and gas) 0.145 0.307 0.049 0.018 0.029 0.598 0.558 0.146 0.017 0.294Support activities for mining 0.403 0.65 0.047 0.044 0.073 3.054 1.376 0.224 0.067 1.086Utilities 0.28 0.611 0.076 0.041 0.068 0.87 1.151 0.209 0.038 0.572Construction 10.274 12.919 1.095 1.073 1.714 80.731 34.264 4.43 1.4 24.244Wood product manufacturing 0.291 0.484 0.049 0.038 0.063 1.032 1.03 0.163 0.042 0.724Nonmetallic mineral product manufacturing 0.301 0.531 0.037 0.036 0.06 1.008 0.988 0.118 0.038 0.651Primary metal manufacturing 0.06 0.48 0.022 0.016 0.028 -1.702 0.571 0.041 0.007 0.172Fabricated metal product manufacturing 0.758 1.543 0.123 0.088 0.149 2.457 2.486 0.368 0.085 1.437Machinery manufacturing 0.215 1.068 0.036 0.027 0.045 0.129 1.594 0.116 0.03 0.438Computer and electronic product manufacturing 0.223 3.5 0.042 0.03 0.054 -2.758 4.183 0.049 0.005 0.185Electrical equipment and appliance manufacturing -0.039 0.439 0.017 0.015 0.026 -2.797 0.568 0.023 0.006 0.143Motor vehicles, bodies and trailers, and parts manufacturing 0.573 0.848 0.052 0.034 0.062 1.947 0.902 0.149 0.033 0.534Other transportation equipment manufacturing 0.02 0.256 0.01 0.007 0.012 -1.383 0.231 0.012 0.001 0.047Furniture and related product manufacturing 0.338 0.426 0.035 0.023 0.043 0.105 0.378 0.09 0.018 0.338Miscellaneous manufacturing 0.254 0.802 0.036 0.024 0.043 -1.18 0.771 0.054 0.008 0.204Food manufacturing 0.61 1.057 0.247 0.12 0.198 1.699 2.92 0.756 0.119 1.833Beverage and tobacco product manufacturing 0.03 0.166 0.007 0.016 0.026 -0.782 0.457 0.015 0.016 0.247Textile mills; Textile product mills 0.065 0.174 0.017 0.012 0.021 -1.262 0.216 0.032 0.006 0.129Apparel manufacturing; Leather and allied product manufacturing -0.144 0.21 0.007 0.009 0.015 -3.439 0.401 -0.004 0.002 0.064Paper manufacturing 0.123 0.386 0.029 0.026 0.044 -0.336 0.63 0.066 0.021 0.34Printing and related support activities 0.279 0.736 0.038 0.045 0.077 0.549 1.008 0.089 0.037 0.584Petroleum and coal products manufacturing -0.01 0.126 0.023 0.007 0.012 -1.024 0.203 0.058 0.006 0.097Chemical manufacturing 0.411 1.209 0.136 0.032 0.06 -0.848 1.208 0.305 0.01 0.285Plastics and rubber product manufacturing 0.365 0.767 0.065 0.044 0.075 0.169 1.142 0.177 0.036 0.651Wholesale trade 3.868 6.77 0.795 0.374 0.644 14.555 11.038 2.238 0.331 5.471Retail trade 16.535 17.619 1.264 1.146 2.037 82.607 29.938 3.361 1.125 17.959Air transportation 0.029 0.279 0.014 0.015 0.026 -0.758 0.43 0.02 0.006 0.159Rail transportation 0.093 0.185 0.043 0.012 0.02 0.232 0.317 0.125 0.011 0.182Water transportation 0.03 0.081 0.007 0.002 0.004 -0.022 0.092 0.021 0.001 0.029Truck transportation 1.341 1.892 0.381 0.131 0.227 6.516 3.434 1.244 0.137 2.257Couriers and messengers 0.436 0.912 0.074 0.059 0.101 1.72 1.495 0.212 0.056 0.912Transit and ground passenger transportation 0.395 0.73 0.041 0.051 0.09 1.788 1.701 0.118 0.056 0.893Pipeline transportation 0.012 0.04 0.005 0.003 0.004 -0.072 0.059 0.012 0.002 0.03Scenic and sightseeing transportation; Support activities for transportation -0.064 0.422 0.039 0.023 0.037 -1.671 0.88 0.082 0.011 0.246Warehousing and storage 0.454 0.882 0.146 0.054 0.092 1.668 1.51 0.456 0.051 0.847Publishing industries, except Internet 0.392 2.202 0.044 0.046 0.078 1.498 3.135 0.135 0.046 0.684Motion picture and sound recording industries 0.331 0.666 0.031 0.03 0.051 0.761 0.749 0.066 0.021 0.355Internet publishing and broadcasting; ISPs, search portals, and data processing; Other information services 0.156 1.009 0.026 0.039 0.061 0.146 1.603 0.064 0.034 0.495Broadcasting, except Internet 0.194 0.611 0.028 0.037 0.061 0.308 0.98 0.074 0.035 0.545Telecommunications 0.604 1.557 0.066 0.078 0.129 1.876 2.68 0.16 0.073 1.102Monetary authorities - central bank; Credit intermediation and related activities; Funds, trusts, & other financial vehicles 3.121 4.444 0.57 0.267 0.458 11.702 5.669 1.533 0.216 3.546Securities, commodity contracts, investments 3.338 5.396 0.413 0.299 0.507 9.995 6.014 0.973 0.21 3.743Insurance carriers and related activities 1.989 3.072 0.186 0.203 0.352 7.938 5.333 0.469 0.191 3.032Real estate 4.446 6.045 0.618 0.537 0.894 21.958 16.813 1.797 0.558 8.576Rental and leasing services; Lessors of nonfinancial intangible assets 0.266 0.757 0.074 0.047 0.08 -0.751 1.111 0.182 0.034 0.631Professional, scientific, and technical services 6.23 48.989 0.928 0.878 1.473 28.38 74.793 2.938 0.95 14.838Management of companies and enterprises 0.763 2.46 0.144 0.137 0.231 -0.575 3.231 0.296 0.091 1.637Administrative and support services 7.666 16.305 0.951 4.827 7.728 33.78 26.643 2.73 4.839 77.34Waste management and remediation services 0.203 0.395 0.032 0.2 0.338 0.444 0.907 0.095 0.201 3.352Educational services 2.454 8.044 0.169 0.277 0.463 12.5 18.298 0.489 0.308 4.755Ambulatory health care services 13.027 10.229 0.738 0.415 0.839 64.254 7.363 1.846 0.329 6.317Hospitals 2.943 3.765 0.152 0.197 0.37 15.786 10.798 0.451 0.272 4.05Nursing and residential care facilities 1.849 1.849 0.106 0.137 0.255 9.403 6.337 0.284 0.167 2.556Social assistance 2.056 2.352 0.125 0.191 0.336 10.891 9.089 0.346 0.24 3.565Performing arts and spectator sports 1.11 2.463 0.13 0.186 0.306 4.397 4.827 0.351 0.184 2.843Museums, historical sites, zoos, and parks 0.067 0.114 0.005 0.057 0.106 0.247 0.37 0.015 0.063 1.137Amusement, gambling, and recreation 2.042 1.838 0.135 0.742 1.198 8.883 3.089 0.346 0.723 11.507Accommodation 1.293 2.061 0.116 0.825 1.345 5.531 4.466 0.311 0.817 13.302Food services and drinking places 5.683 8.705 0.455 4.569 7.151 27.627 27.621 1.241 4.504 70.312Repair and maintenance 1.437 2.126 0.155 0.924 1.481 6.432 4.712 0.429 0.928 14.776Personal and laundry services 4.013 2.92 0.242 0.955 1.576 17.526 1.813 0.547 0.839 13.864Membership associations and organizations 1.788 2.624 0.17 1.488 2.371 8.859 8.105 0.479 1.517 23.798Private households 5.556 3.362 0.302 0.992 1.537 24.853 0.023 0.674 0.87 13.527Industry Totals 114.388 207.187 14.967 23.359 38.194 517.681 368.728 42.919 23.154 371.537
Jobs Gain/Loss by Industry (in thousands) by 2014 Jobs Gain/Loss by Industry (in thousands) by 2020Economic Impact of Key Provisions of Immigration Reform by Industry
Appendix B: Employment by Industry Sector
29