Embed Size (px)
DESCRIPTION
An Examination of Offenders Released from State Prison in the First Year of Public Safety Realignment. Kevin Grassel March 20, 2014. Public Safety Realignment Act 2011. - PowerPoint PPT Presentation
Citation preview

Kevin GrasselMarch 20, 2014
AN EXAMINATION OF OFFENDERS RELEASED FROM STATE PRISON IN THE FIRST YEAR OF PUBLIC SAFETY
REALIGNMENT
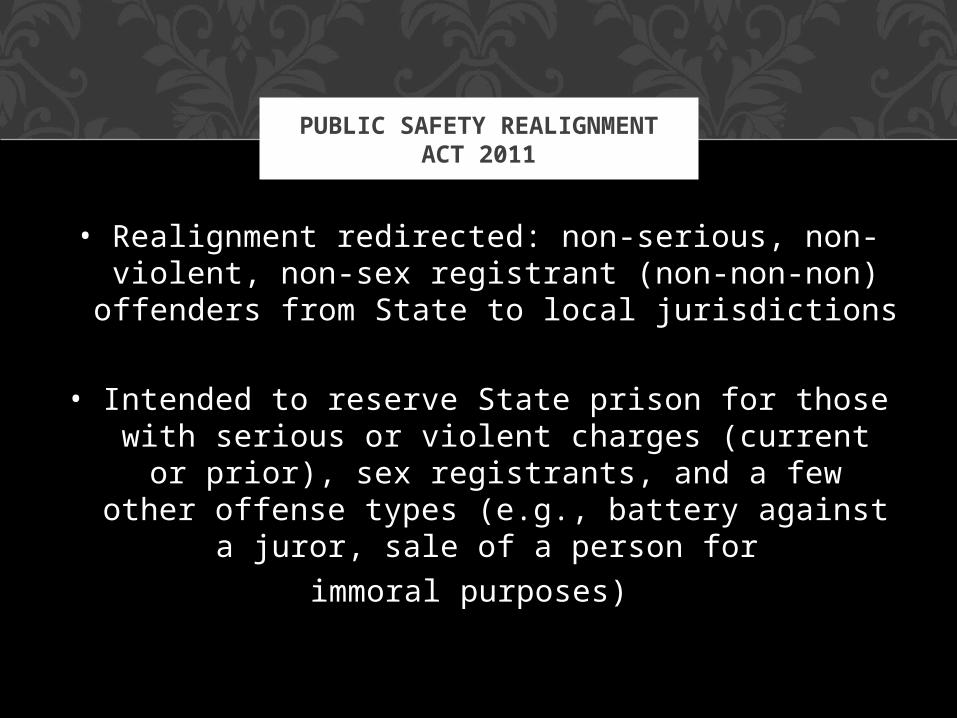
• Realignment redirected: non-serious, non-violent, non-sex registrant (non-non-non) offenders from
State to local jurisdictions
• Intended to reserve State prison for those with serious or violent charges (current or prior), sex registrants, and a few other offense types (e.g.,
battery against a juror, sale of a person for immoral purposes)
PUBLIC SAFETY REALIGNMENT ACT 2011
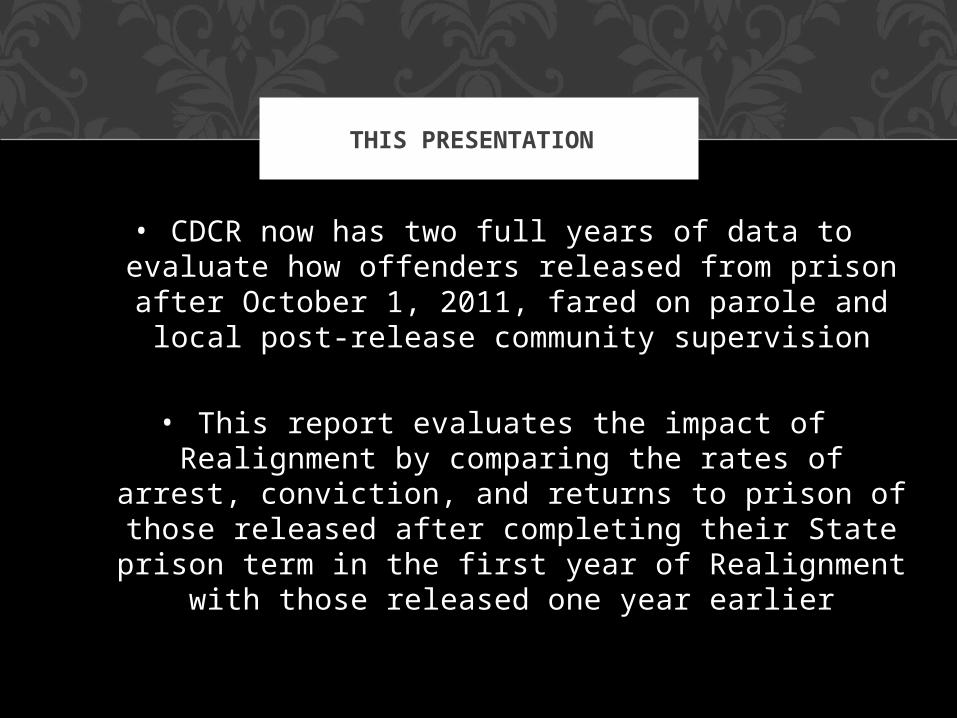
• CDCR now has two full years of data to evaluate how offenders released from prison after
October 1, 2011, fared on parole and local post-release community supervision
• This report evaluates the impact of Realignment by comparing the rates of arrest, conviction, and
returns to prison of those released after completing their State prison term in the first year of Realignment with those released one
year earlier
THIS PRESENTATION
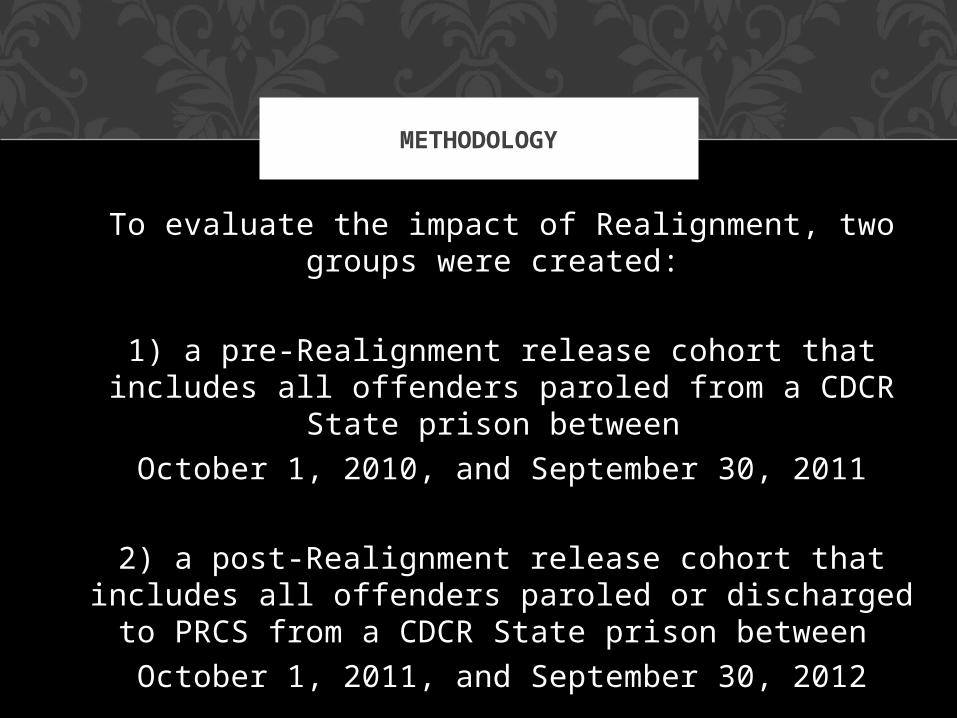
To evaluate the impact of Realignment, two groups were created:
1) a pre-Realignment release cohort that includes all offenders paroled from a CDCR State prison
between October 1, 2010, and September 30, 2011
2) a post-Realignment release cohort that includes all offenders paroled or discharged to PRCS from a
CDCR State prison between October 1, 2011, and September 30, 2012
METHODOLOGY
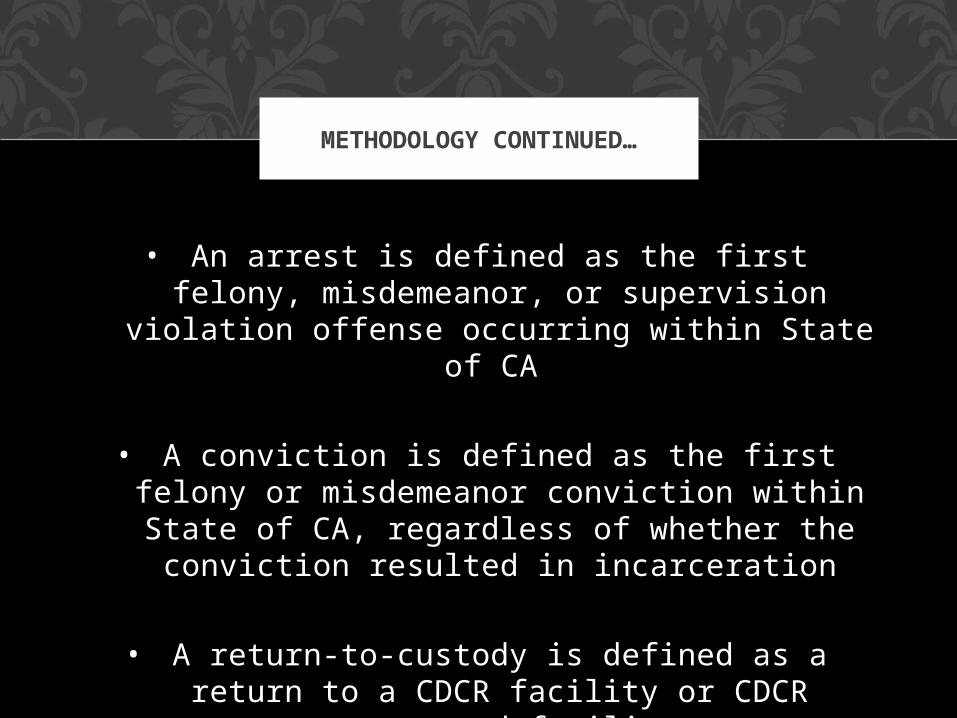
• An arrest is defined as the first felony, misdemeanor, or supervision violation offense
occurring within State of CA
• A conviction is defined as the first felony or misdemeanor conviction within State of CA,
regardless of whether the conviction resulted in incarceration
• A return-to-custody is defined as a return to a CDCR facility or CDCR contracted facility
METHODOLOGY CONTINUED…
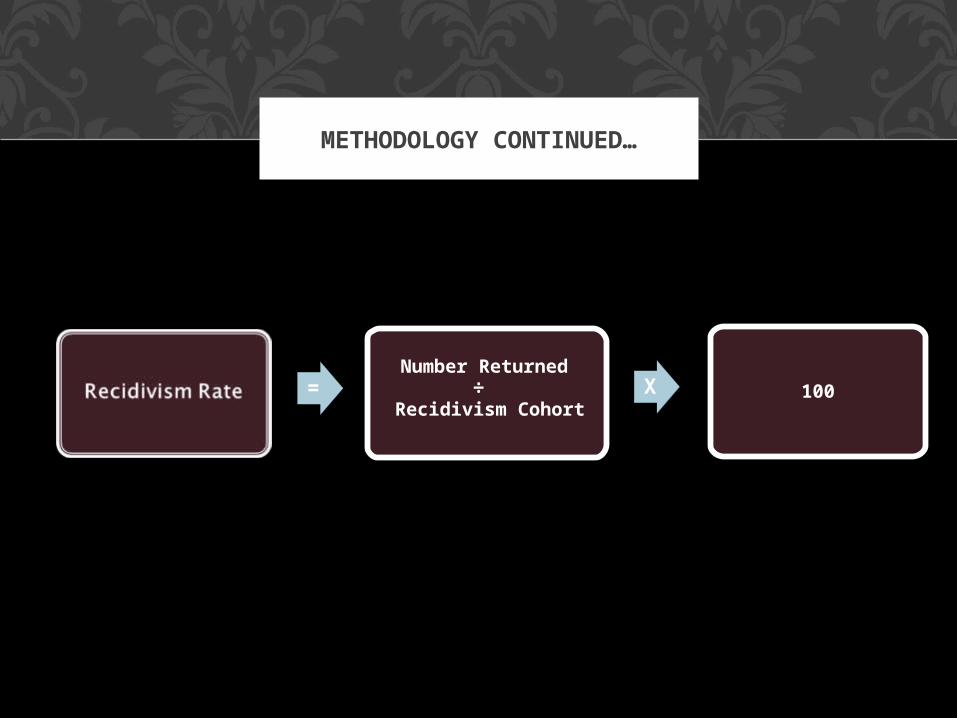
METHODOLOGY CONTINUED…
=Number Returned
÷ Recidivism Cohort
X 100
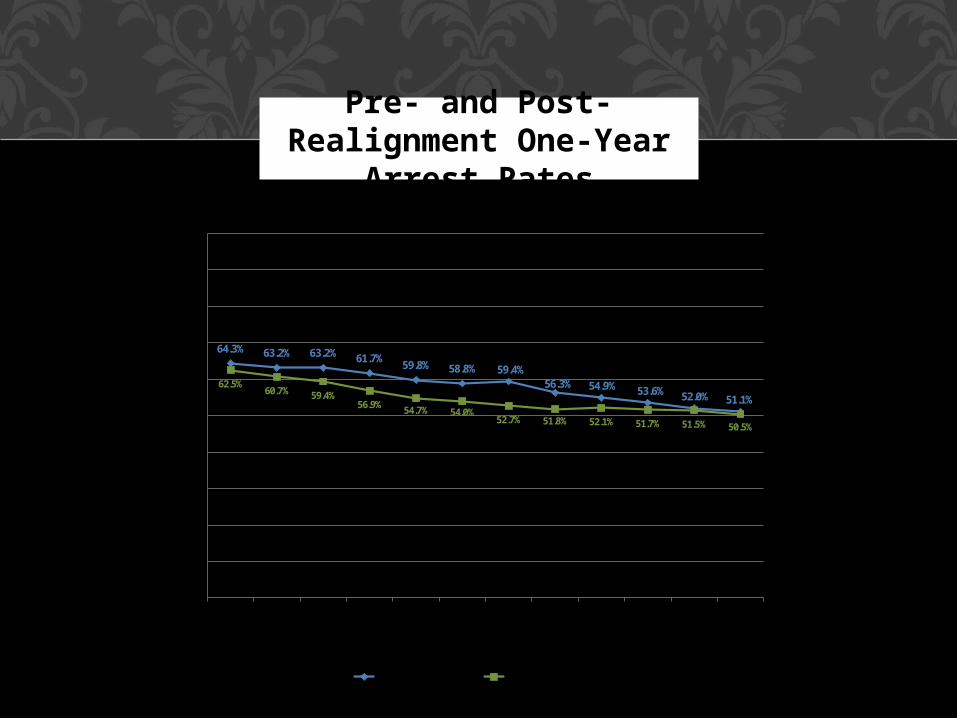
64.3% 63.2% 63.2% 61.7% 59.8% 58.8% 59.4%56.3% 54.9% 53.6% 52.0% 51.1%
62.5%60.7% 59.4%
56.9% 54.7% 54.0%52.7% 51.8% 52.1% 51.7% 51.5% 50.5%
0%
10%
20%
30%
40%
50%
60%
70%
80%
90%
100%
Pre-Realignment Post-Realignment
Pre- and Post-Realignment One-Year
Arrest Rates

36.9%42.9%
23.3%
22.2%
39.8%35.0%
0%
10%
20%
30%
40%
50%
60%
70%
80%
90%
100%
Pre-Realignment Post-Realignment
Felony Misdemeanor Supervision Violation
ARREST TYPES

1.281.25 1.25 1.23
1.17 1.16 1.14 1.10 1.12 1.131.09 1.08
1.64 1.651.61
1.401.34
1.291.24 1.22 1.21 1.21 1.18
1.21
0.00
0.20
0.40
0.60
0.80
1.00
1.20
1.40
1.60
1.80
October November December January February March April May June July August September
Pre-Realignment Post-Realignment
Number of Arrests Per Person Released
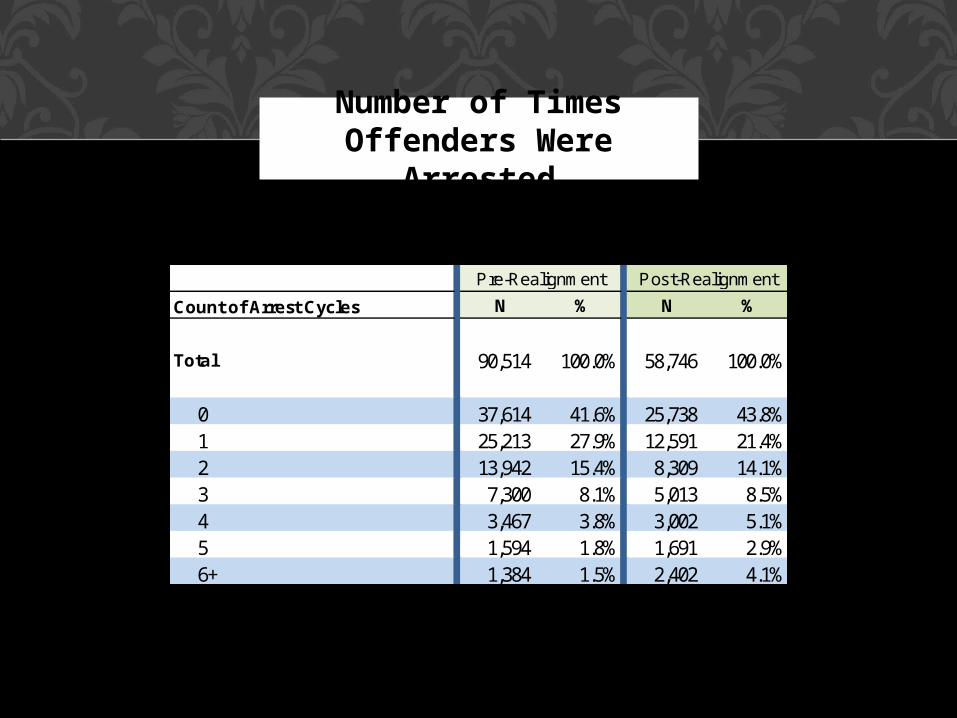
Count of Arrest Cycles N % N %
Total 90,514 100.0% 58,746 100.0%
0 37,614 41.6% 25,738 43.8%1 25,213 27.9% 12,591 21.4%2 13,942 15.4% 8,309 14.1%3 7,300 8.1% 5,013 8.5%4 3,467 3.8% 3,002 5.1%5 1,594 1.8% 1,691 2.9%6+ 1,384 1.5% 2,402 4.1%
Pre-Realignment Post-Realignment
Number of Times Offenders Were
Arrested
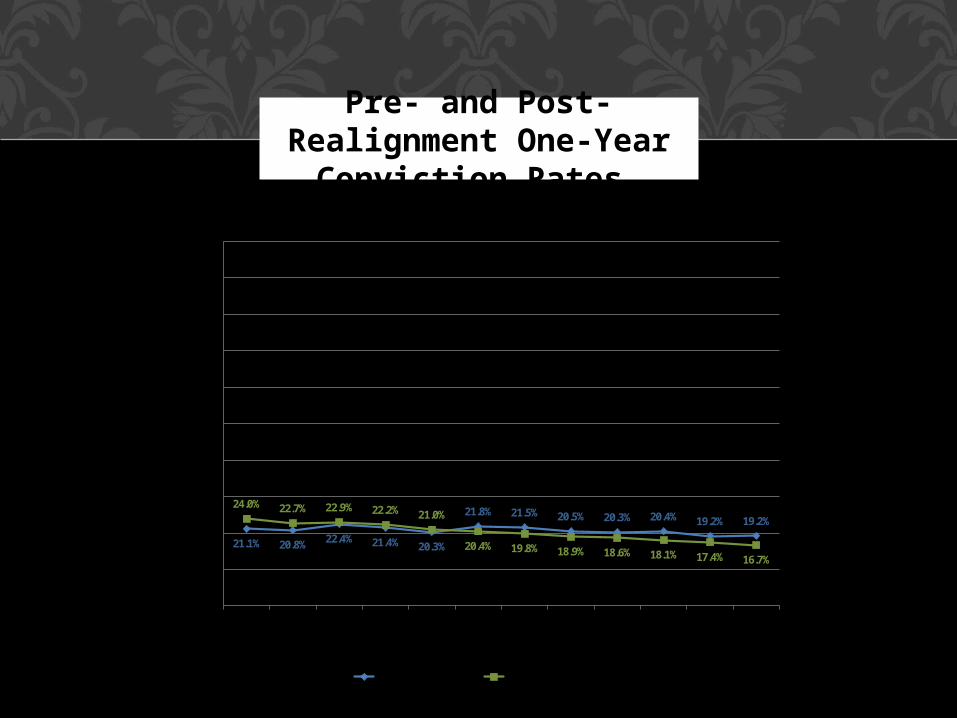
21.1% 20.8% 22.4% 21.4% 20.3%
21.8% 21.5% 20.5% 20.3% 20.4% 19.2% 19.2%24.0% 22.7% 22.9% 22.2% 21.0%
20.4% 19.8% 18.9% 18.6% 18.1% 17.4% 16.7%
0%
10%
20%
30%
40%
50%
60%
70%
80%
90%
100%
Pre-Realignment Post-Realignment
Pre- and Post-Realignment One-Year
Conviction Rates
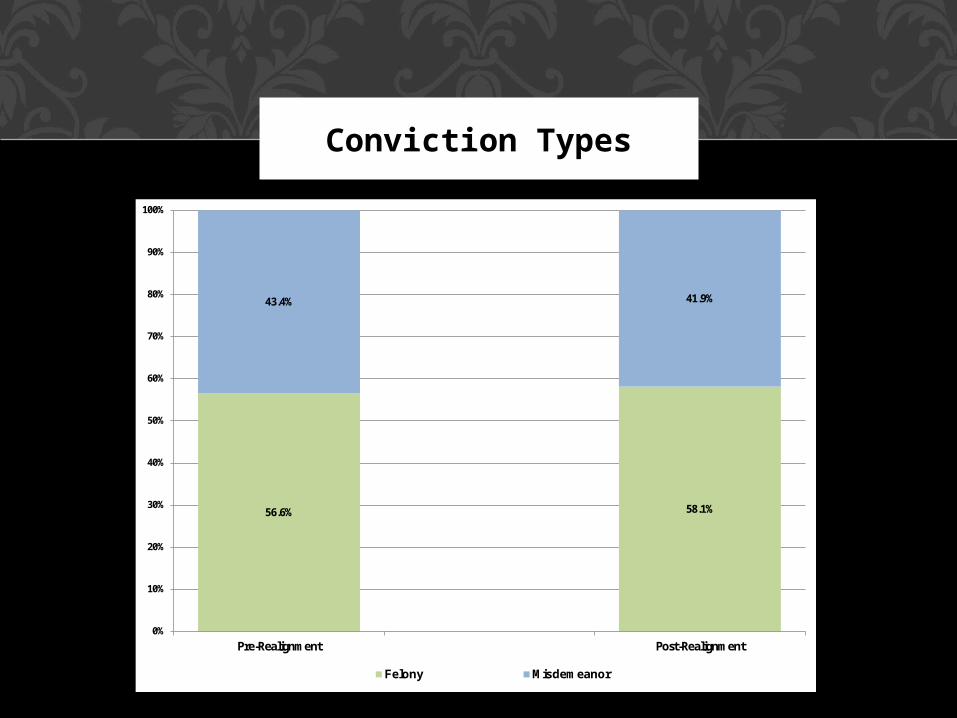
56.6% 58.1%
43.4% 41.9%
0%
10%
20%
30%
40%
50%
60%
70%
80%
90%
100%
Pre-Realignment Post-Realignment
Felony Misdemeanor
Conviction Types
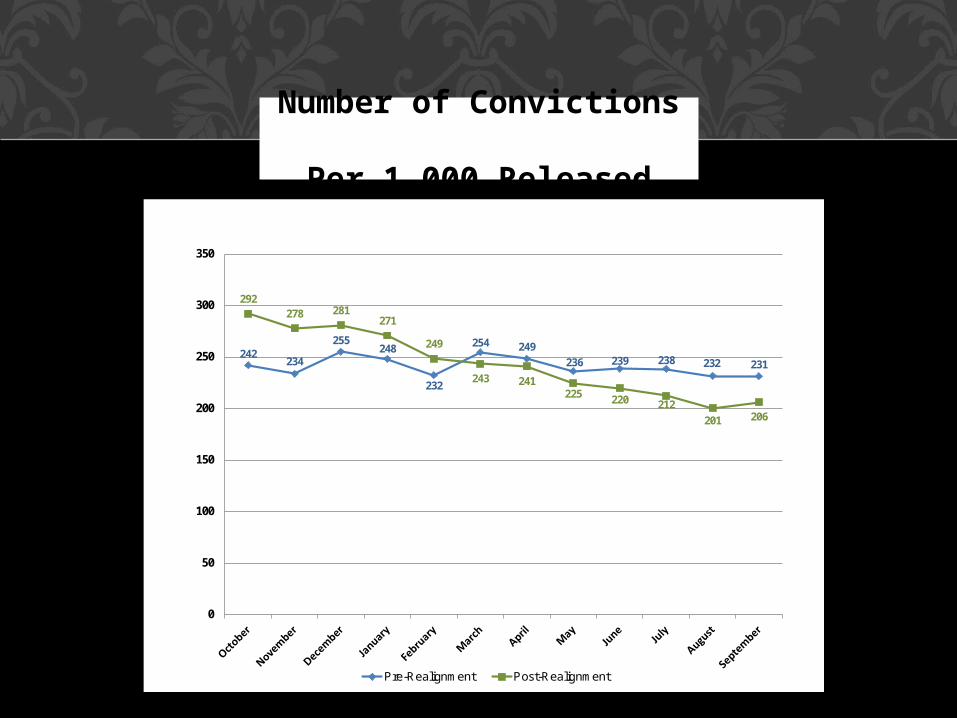
242234
255248
232
254 249236 239 238 232 231
292278 281
271
249
243 241225 220 212
201 206
0
50
100
150
200
250
300
350
Pre-Realignment Post-Realignment
Number of Convictions
Per 1,000 Released
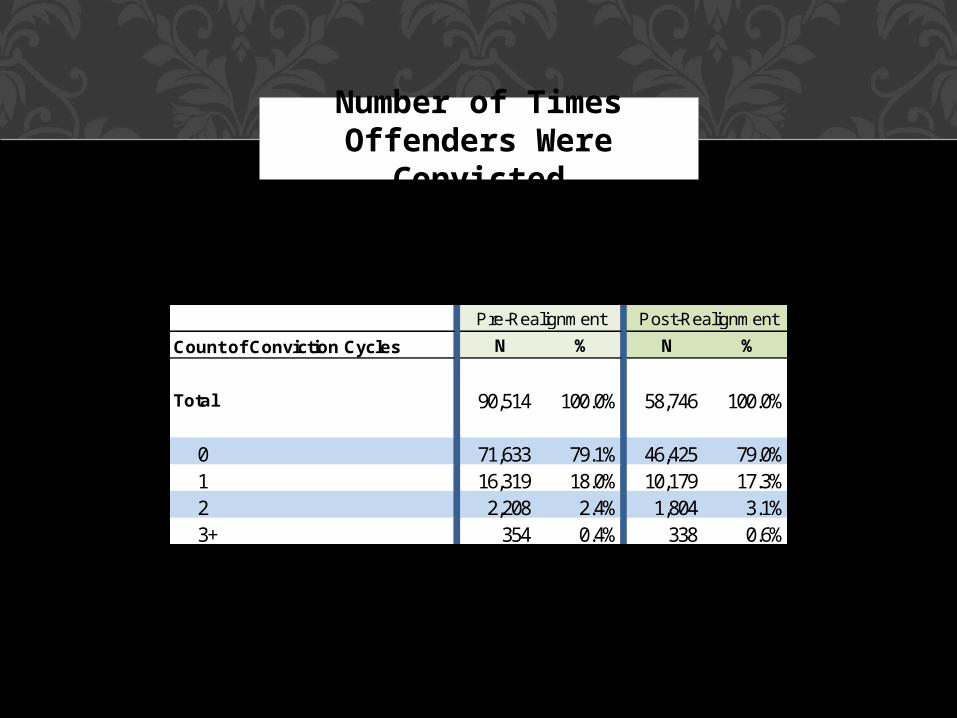
Count of Conviction Cycles N % N %
Total 90,514 100.0% 58,746 100.0%
0 71,633 79.1% 46,425 79.0%1 16,319 18.0% 10,179 17.3%2 2,208 2.4% 1,804 3.1%3+ 354 0.4% 338 0.6%
Pre-Realignment Post-Realignment
Number of Times Offenders Were
Convicted

47.0% 45.7% 44.3%41.2%
37.8%
33.8%30.3%
24.3%20.5%
16.6%12.7%
8.5%
7.1% 7.6% 7.5% 7.8% 7.3% 7.4% 8.3% 7.6% 7.7% 6.9% 7.1% 6.3%0%
10%
20%
30%
40%
50%
60%
70%
80%
90%
100%
Pre-Realignment Post-Realignment
Pre- and Post-Realignment
One-Year Return to Prison Rates
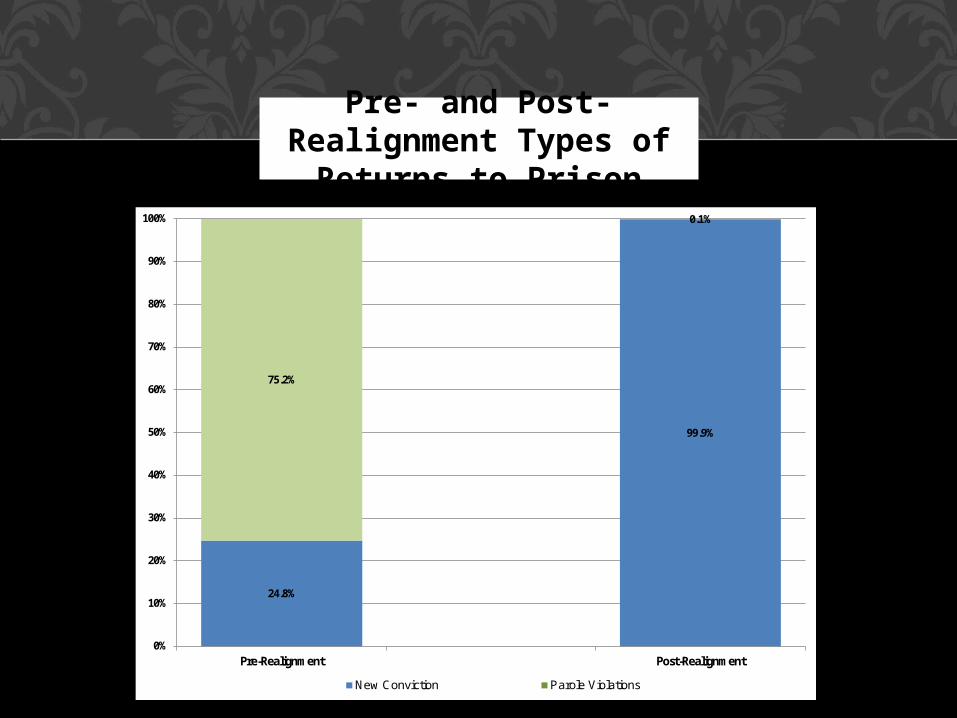
24.8%
99.9%
75.2%
0.1%
0%
10%
20%
30%
40%
50%
60%
70%
80%
90%
100%
Pre-Realignment Post-Realignment
New Conviction Parole Violations
Pre- and Post-Realignment Types of
Returns to Prison
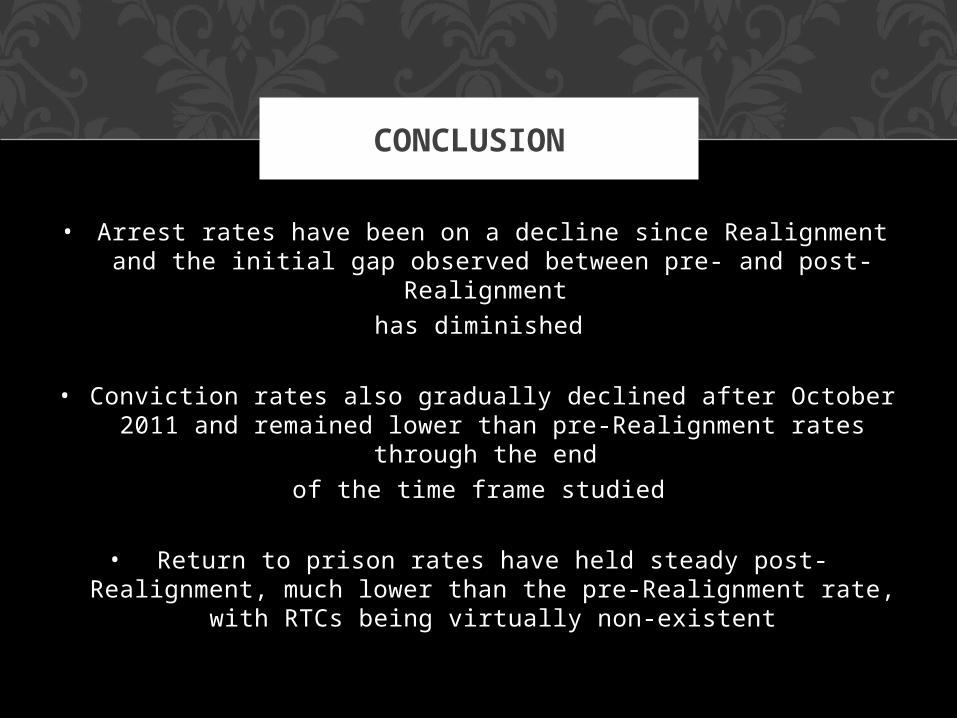
• Arrest rates have been on a decline since Realignment and the initial gap observed between pre- and post-Realignment
has diminished
• Conviction rates also gradually declined after October 2011 and remained lower than pre-Realignment rates through
the end of the time frame studied
• Return to prison rates have held steady post-Realignment, much lower than the pre-Realignment rate, with RTCs
being virtually non-existent
CONCLUSION