Embed Size (px)
Citation preview

Keperra Quarry Project Traffic Report (as submitted to Council)
For enquiries: P: 07 3907 4111 E: [email protected] W: www.transformingkeperraquarry.com.au
Transforming the Keperra Quarry.
DATE 3 May, 2016
CONTACT TOBY GILMOUR
Kepe
rra
Qua
rry
Dev
elop
men
t - S
amfo
rd R
oad,
Kep
erra
Traf
fic Im
pact
Ass
essm
ent R
epor
t
For
Bro
okfi
eld R
esid
enti
al
Pro
per
ties
C/-
RP
S
Ref: B15323TR002_revB - i - Keperra Quarry Development
Traffic Impact Assessment
TABLE OF CONTENTS
1.0 INTRODUCTION 1
2.0 CONTEXT OF DEVELOPMENT 2
2.1 BACKGROUND 2
2.2 EXISTING ROAD NETWORK 3
2.3 PUBLIC TRANSPORT FACILITIES 4
2.4 PEDESTRIAN AND BICYCLE NETWORKS 4
2.5 EXISTING DEVELOPMENT APPROVALS 4
2.6 EXISTING TRAFFIC VOLUMES 5
3.0 DETAILS OF PROPOSED DEVELOPMENT 7
3.1 PROPOSED DEVELOPMENT 7
3.2 TRAFFIC GENERATION AND DISTRIBUTION 7
3.3 FUTURE YEAR VOLUME SCENARIOS 9
4.0 SIDRA INTERSECTION ASSESSMENT 10
4.1 INTERSECTION ANALYSIS ASSUMPTIONS 10
4.2 SETTLEMENT ROAD / SAMFORD ROAD INTERSECTION 13
4.3 SAMFORD ROAD / DEVELOPMENT ACCESS INTERSECTION 16
4.4 SETTLEMENT ROAD / DEVELOPMENT ACCESS INTERSECTION 17
5.0 AIMSUN MICROSIMULATION MODELLING 18
5.1 MODELLING METHODOLOGY 18
5.2 BASE MODEL 18
5.3 FUTURE YEAR MODEL 19
5.4 RESULTS 23
6.0 SUMMARY AND CONCLUSION 26

Ref: B15323TR002_revB - ii - Keperra Quarry Development
Traffic Impact Assessment
APPENDIX A
STRUCTURE PLAN
APPENDIX B
TRAFFIC SURVEYS
APPENDIX C
CURRENT AND FUTURE YEAR VOLUMES
APPENDIX D
DETAILED SIDRA INTERSECTION SUMMARIES
Document Control Page
Rev. Date Description Author Verifier Approver Signature
A 20/10/15 Draft T Gilmour A Heritage T Gilmour
B 3/06/16 Final T Gilmour A Heritage T Gilmour
RPEQ# 12785
Ref: B15323TR002_revB - 1 - Keperra Quarry Development
Traffic Impact Assessment
1.0 INTRODUCTION
This traffic impact assessment has been prepared for RPS, on behalf of Brookfield Residential
Properties, as part of the Preliminary Approval for a Material Change of Use to provide a
residential subdivision development with some retail facilities at the existing Keperra Quarry site.
The development site is situated on land on the southern side of Samford Road in Keperra,
formally described as Lot 3 on SP202641 and Lot 1 on RP174601.
The proposed Preliminary Approval seeks to gain approval over the site for the residential and
retail uses and facilitate access onto Samford Road and Settlement Road. The proposed
structure plan is displayed in Appendix A.
As the site is seeking a Preliminary Approval this report primarily focuses of analysis of the
impact the proposed development has on Samford Road and Settlement Road. The key area of
analysis is the section of Samford Road between Settlement Road and Keperra Sanctuary and
whether the new signals, which accommodate all movement access to the site, can be
adequately coordinated with adjacent signals.
A microsimulation model of the Samford Road analysis for the Keperra Quarry development was
undertaken using the AIMSUN modelling package and Settlement Road was assessed using
Sidra Intersection.
The report has been compiled in a clear and concise manner and is set out as follows:
Section 2 discusses the existing land use and traffic arrangements surrounding the development
site.
Section 3 provides details of the proposed development and contains the calculations and
assumptions used to establish the forecast development generated traffic.
Section 4 provides a summary of the Sidra Intersection assessment.
Section 5 provides the modelling methodology used within AIMSUN 8.1, summary of the options
tested and results.
Section 6 summarises the key outcomes of the traffic investigation.
This report has been prepared on behalf of and for the exclusive use of the Client, and is subject
to and issued in connection with the provisions of the agreement between Lambert & Rehbein
and the Client. Lambert & Rehbein accepts no liability or responsibility whatsoever for or in
respect of any use of or reliance upon this report by any third party.

Ref: B15323TR002_revB - 2 - Keperra Quarry Development
Traffic Impact Assessment
2.0 CONTEXT OF DEVELOPMENT
This section of the report describes the context of the proposed development and includes a
description of the existing road network and adjacent land uses.
2.1 BACKGROUND
The development site is situated on land on the southern side of Samford Road in Keperra,
formally described as Lot 3 on SP202641 and Lot 1 on RP174601.
The site is currently a granite quarry operated by Lantrak with the adjacent lot occupied by the
Great Western Super Centre which contains a Woolworths along with other food and specialty
stores. To the South of the Great Western Super Centre and located to the west of the proposed
residential development are Lot 1 on RP86847 and Lot 2 on RP174603, where there is an
existing approval for a Bunnings. The location of the site in, context of the surrounding road
network is demonstrated below in Figure 2-1.
Figure 2-1 Development Site Location
Ref: B15323TR002_revB - 3 - Keperra Quarry Development
Traffic Impact Assessment
2.2 EXISTING ROAD NETWORK
The proposed development site is bound by Samford Road to the north and Settlement Road to
the west, with the current quarry site access provided onto Settlement Road. Details of the roads
at the site frontage is summarised below
2.2.1 SAMFORD ROAD
Samford Road fronting the subject site to the north is designated as an Arterial Road under
Brisbane City Council’s Road Hierarchy, and is under the Department of Transport and Main
Roads (TMR) jurisdiction. The road was observed to have the following characteristics at the site
frontage:
Two-way, four-lane median divided road;
Posted speed limit of 70 km/hr;
Kerb and channel on both sides of road; and
Footpath provided on the southern side only.
Samford Road provides a major east-west connection, providing connectivity between the City
and Eastern Suburbs.
2.2.2 SETTLEMENT ROAD
Settlement Road fronting the subject site to the west is designated as a Sub-Arterial Road under
Brisbane City Council’s Road Hierarchy, and is under the Brisbane City Council jurisdiction. The
road was observed to have the following characteristics at the site frontage:
Two-way, three-lane undivided road (two lanes in the southbound direction);
Posted speed limit of 60 km/hr;
No kerb and channel; and
No footpaths provided.
Settlement Road provides a north-south connection, providing connectivity between Samford
Road and Waterworks Road.
2.2.3 SAMFORD ROAD / SETTLEMENT ROAD INTERSECTION
The Samford Road / Settlement Road intersection is a 3-way signalised ‘T’ intersection with
designated right turn and left turn channelised lanes on all approaches. In addition the
intersection has a short section of three lanes in the westbound direction.
It is understood that the proposed Bunnings development on Settlement Road is conditioned to
upgrade the intersection and is discussed in further detail in Section 2.5.2.

Ref: B15323TR002_revB - 4 - Keperra Quarry Development
Traffic Impact Assessment
2.3 PUBLIC TRANSPORT FACILITIES
Existing bus services currently operate from within the Great Western Shopping Centre, adjacent
to the site, which provides connectivity between The Gap, Keperra and Brookside.
2.4 PEDESTRIAN AND BICYCLE NETWORKS
Concrete pathways are currently provided on the southern side of Samford Road fronting the
subject site. These paths extend to Gralton Street to the east and also extend to the shopping
centre frontage to the west. Signalised pedestrian crossing facilities are provided at the Samford
Road / Settlement Road intersection. No pedestrian facilities are currently provided along the
Settlement Road frontage.
There are currently no cyclist facilities along either the Samford Road or Settlement Road
frontages to the site.
2.5 EXISTING DEVELOPMENT APPROVALS
2.5.1 KEPERRA QUARRY SITE
It is understood that there is an existing approval for a residential subdivision at the Keperra
Quarry site for a total of 378 dwellings, which includes 325 detached dwelling and 53
apartments/townhouses. The existing approval also included an all movement signalised
intersection with Samford Road and an all movement unsignalised intersection with Settlement
Road.
While there is an existing approval for a signalised intersection with Samford Road, as part of the
revised preliminary approval application, it is understood TMR has raised concerns in regards
with the interaction of the signalised intersection with the Samford Road / Settlement Road
signalised intersection to the west and the Samford Road / Keperra Sanctuary signalised
intersection to the east. Therefore a microsimulation assessment has been undertaken as part of
this application to demonstrate the opportunity to coordinate the proposed signalised intersection,
providing access to the site, with adjacent signalised intersections.
2.5.2 BUNNINGS DEVELOPMENT
It is understood that there is a current approval for a Bunnings development located at 481 and
523 Settlement Road, Keperra, Queensland and is described as Lot 1 on RP86847 and Lot 2 on
RP174603. The Traffic Engineering Report, undertaken by TTM in April 2013, has been utilised to
extract the development generated traffic and assess the impacts of the proposed Bunnings
development on the surrounding road network and is further discussed in Section 3.3.
The TMR conditions (TMR13-006250) for the site have been used as the basis for future Samford
Road / Settlement Road upgrades, which proposes the following future year upgrades.
Ref: B15323TR002_revB - 5 - Keperra Quarry Development
Traffic Impact Assessment
Year of opening upgrades:
Construct additional 70m long right turn lane on Samford Road;
Reconfigure Samford Road west to accommodate additional right turn lane i.e. remove 1
westbound through lane;
Reconfigure Samford Road east to remove 1 through lane westbound; and
Reconfigure Settlement Road to include a full-length left turn lane and 60m short right
turn lane.
2024 upgrades (in addition to year of opening upgrades):
Lengthen the right turn lanes on Samford road to 190m and 95m
2.5.3 UPPER KEDRON RESIDENTIAL SUBDIVISION
As part of the Samford Road assessment, TMR requested that the Upper Kedron residential
development be considered due to the potential increase of traffic along Samford Road and
Settlement Road. The Upper Kedron development is located to the north-west of the proposed
development and a Traffic Engineering Report was undertaken by TTM in March 2015 which
considered an ultimate yield of 980 lots.
The report also considered a conservative yield of 1,200 lots, which was used as part of the
Samford Road assessment to provide a ‘worst case scenario’. Traffic volumes were extracted
from the TTM report and are further discussed in Section 3.3.
2.6 EXISTING TRAFFIC VOLUMES
To adequately assess the intersections the Samford Road assessment area and the new
settlement road intersection, a number of surveys were undertaken and are included in Appendix
B.
2.6.1 SAMFORD ROAD
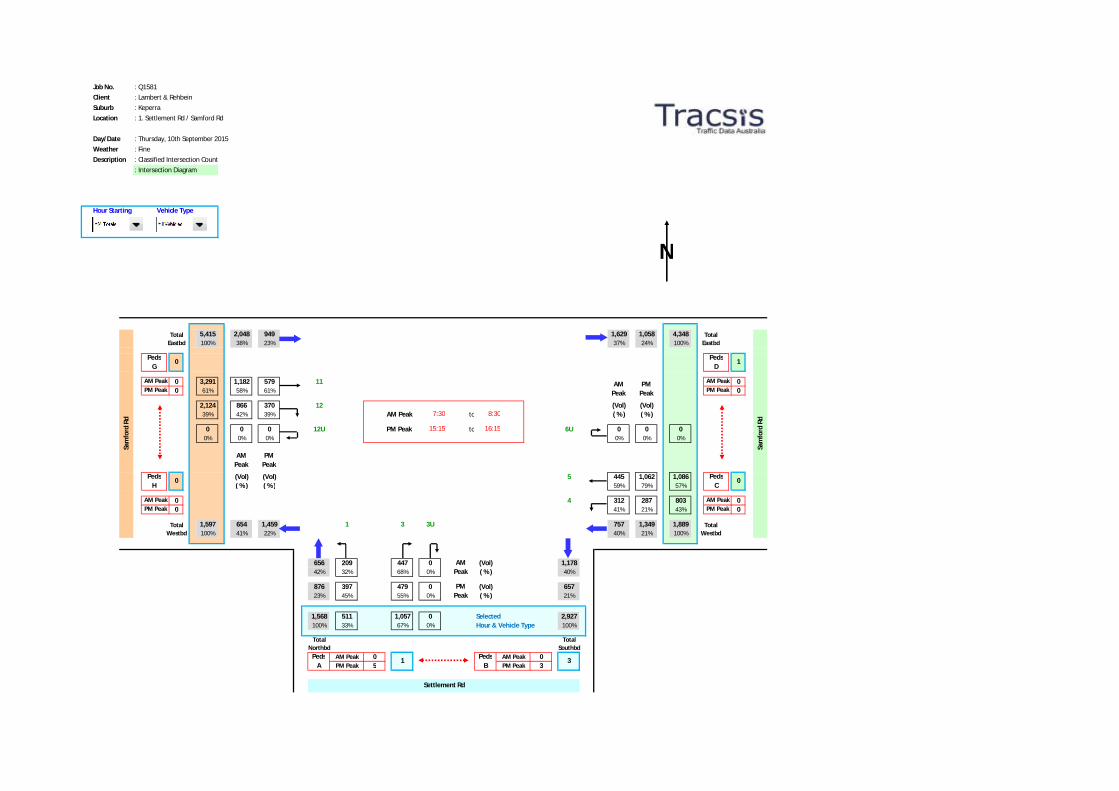
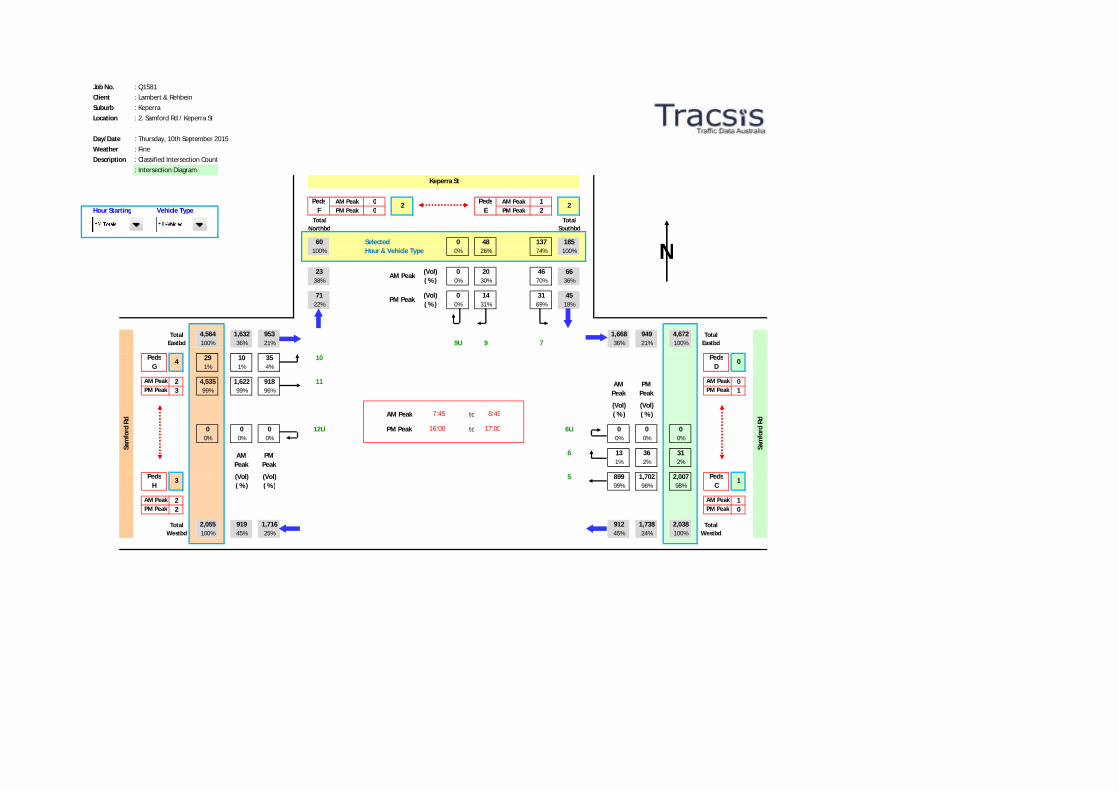
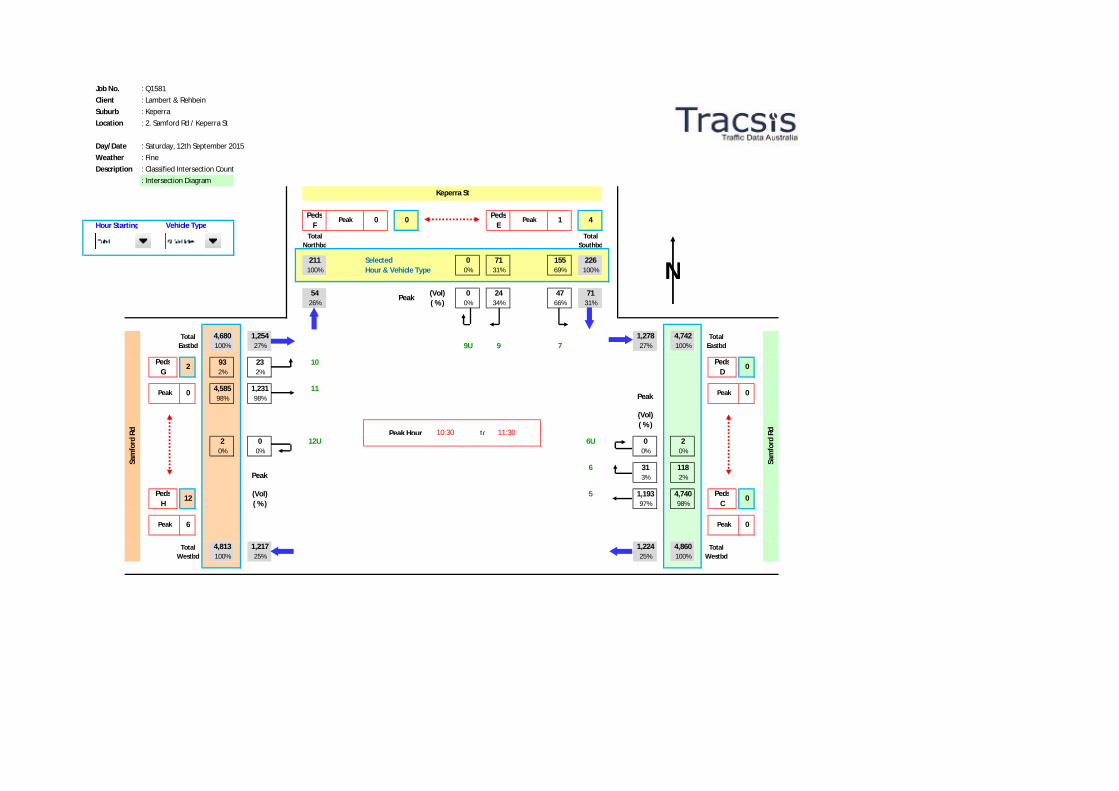
Traffic surveys were commissioned on Thursday the 10th of September and Saturday the 12th of
September at several intersections around the existing site to understand current traffic volumes
and distributions.
As demonstrated by Figure 2-2, counts were taken at the following intersections:
Intersection of Samford Road and Settlement Road;
Intersection of Samford Road and Keperra Street; and
Intersection of Samford Road and Keperra Sanctuary.

Ref: B15323TR002_revB - 6 - Keperra Quarry Development
Traffic Impact Assessment
Figure 2-2 Surveyed Samford Road Intersections
These traffic surveys determined a weekday morning peak hour of 07:30-08:30, a weekday
evening peak hour of 16:00-17:00 and a Saturday peak hour of 10:30-11:30AM.
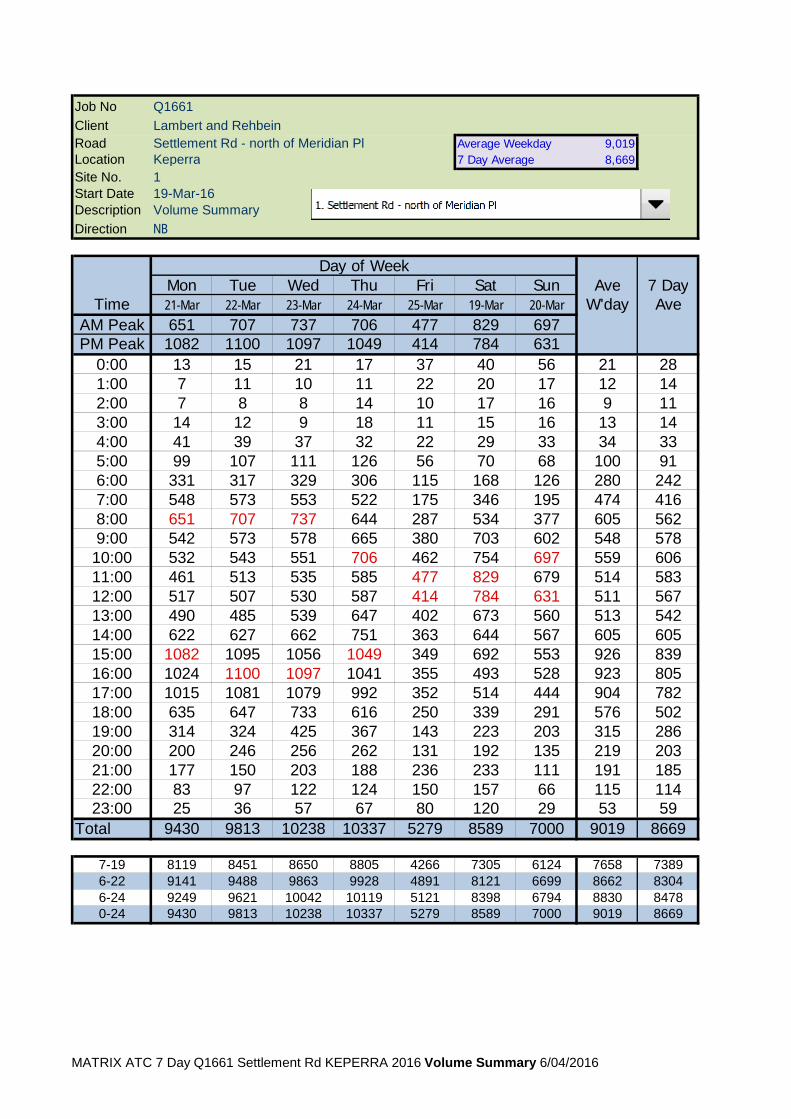
2.6.2 SETTLEMENT ROAD
Traffic surveys were commissioned from Saturday 19th to Friday 25th March 2016, acknowledging
that the Friday was a public holiday, in the form of tube counters along Settlement Road at the
proposed access location. The peak day was identified as the Tuesday with the morning peak
hour occurring at between 07:00-08:00 and evening peak hour occurring between 17:00-18:00.

Ref: B15323TR002_revB - 7 - Keperra Quarry Development
Traffic Impact Assessment
3.0 DETAILS OF PROPOSED DEVELOPMENT
This section of the report describes the nature of the proposed development.
3.1 PROPOSED DEVELOPMENT
The proposed Preliminary Approval seeks to gain approval over the site for the residential and
retail uses and facilitate access onto Samford Road and Settlement Road. The structure plan is
displayed in Appendix A and proposes to ultimately allow for the following breakdown:
300 allotments within the Low-Medium Density Residential Zone
400 multiple dwellings (units) within the Medium Density Residential Zone
3,000sqm GFA of Centre Activities within the Neighbourhood Centre Zone
Access to the development site is proposed to be generally in accordance with the existing
approval via intersections at Samford Road and Settlement Road. The Samford Road access,
situated between the existing access for the Great Western Super Centre and the Keperra
Sanctuary access, will provide an all movement signalised access to and from Samford Road.
3.2 TRAFFIC GENERATION AND DISTRIBUTION
This section provides an evaluation of the potential impact of the development generated traffic
on the external road network. The RTA Guide to Traffic Generating Developments was used to
derive the individual use requirements of each development site with generation rates being
applied as follows:
Table 3-1 Development Traffic Generation Rates
Use Generation Rate
Low-Medium Density Dwellings 0.85 trips per dwelling
Multiple Dwellings 0.65 trips per dwelling
Centre Activities 0.123 trips per 100m2 for Thursday, 0.163 trips 100m2 for
Saturday
For the Saturday peak a conservative assumption that the generation for the dwellings are
approximately 20% of the weekday peak hour generation rates. This is considered to not be a
true reflection of a Saturday peak, with the real generation rate expected to be much lower.
Ref: B15323TR002_revB - 8 - Keperra Quarry Development
Traffic Impact Assessment
Traffic entering and exiting the residential portion of the site has been assumed to be consistent
with the previous assessment, as part of the original approval for the site, which assumes as
follows:
o 36% entering/exiting via the southern access point on Settlement Road;
o 14% entering/exiting via the northern access point from the west along Samford
Road; and
o 50% entering/exiting via the northern access point from the east along Samford
Road.
The following in/out site traffic distributions were applied to the calculated two-way traffic
generations for the residential portion of the site:
o Weekday AM Peak 15% in / 85% out; and
o Weekday PM Peak 70% in / 30% out.
Traffic utilising the centre activities portion of the site has been assumed to be primarily from
Samford Road due to the close proximity to Samford Road, with a small portion accessing from
the internal residential development. The distributions are as follows:
o 62% entering/exiting via the northern access point from east along Samford
Road;
o 28% entering/exiting via the northern access point from west along Samford
Road; and
o 10% to and from the internal residential development.
Given the convenience nature of the centre activities, an in/out site traffic distributions of 50%
in/50% out has been applied to the calculated two-way traffic generations.
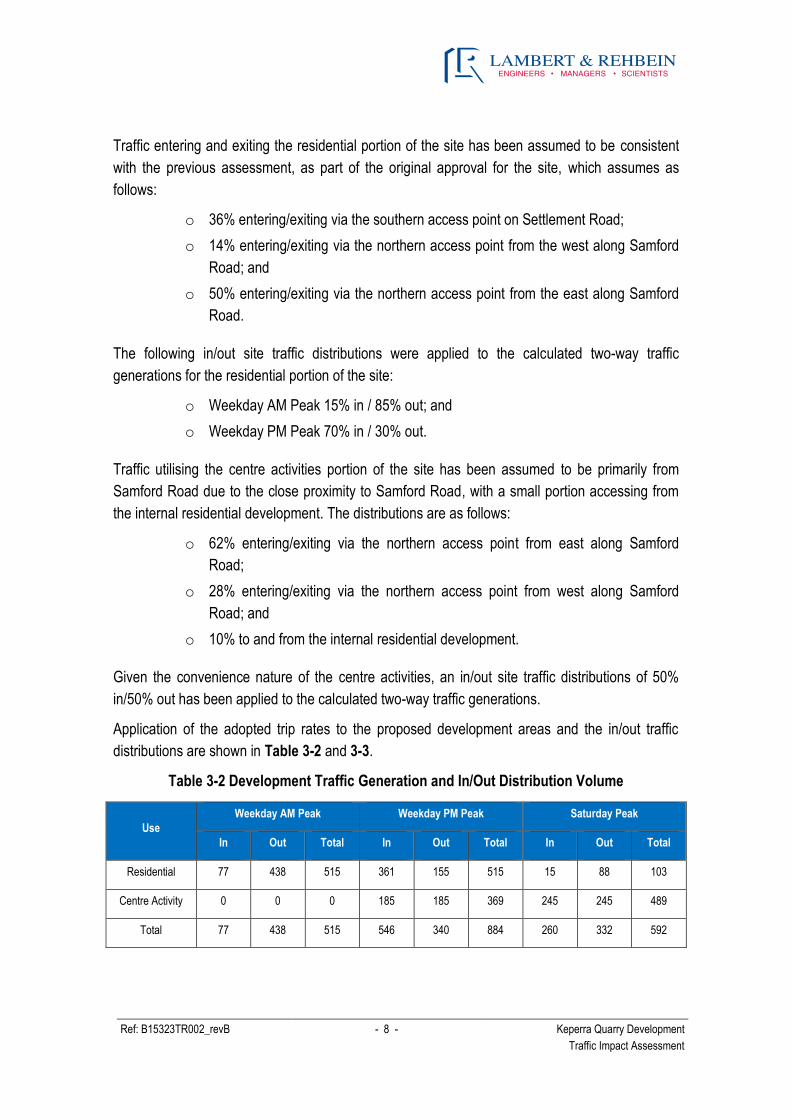
Application of the adopted trip rates to the proposed development areas and the in/out traffic
distributions are shown in Table 3-2 and 3-3.
Table 3-2 Development Traffic Generation and In/Out Distribution Volume
Use
Weekday AM Peak Weekday PM Peak Saturday Peak
In Out Total In Out Total In Out Total
Residential 77 438 515 361 155 515 15 88 103
Centre Activity 0 0 0 185 185 369 245 245 489
Total 77 438 515 546 340 884 260 332 592
Ref: B15323TR002_revB - 9 - Keperra Quarry Development
Traffic Impact Assessment
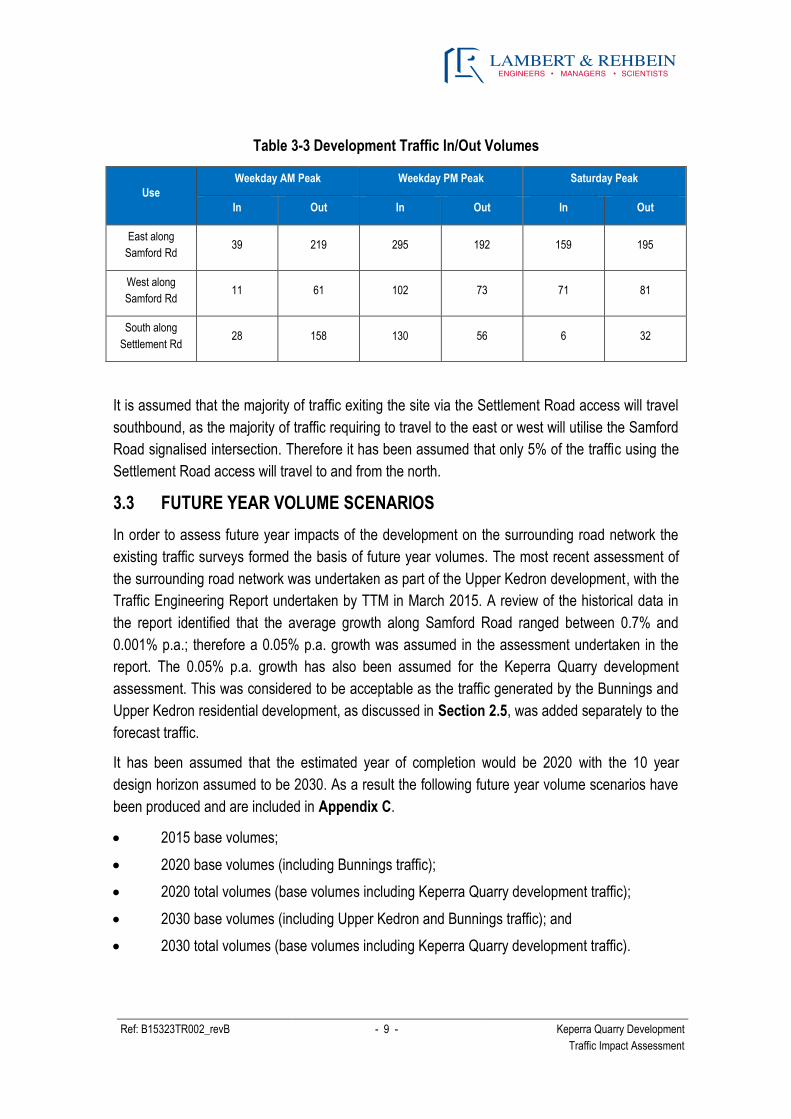
Table 3-3 Development Traffic In/Out Volumes
Use
Weekday AM Peak Weekday PM Peak Saturday Peak
In Out In Out In Out
East along
Samford Rd 39 219 295 192 159 195
West along
Samford Rd 11 61 102 73 71 81
South along
Settlement Rd 28 158 130 56 6 32
It is assumed that the majority of traffic exiting the site via the Settlement Road access will travel
southbound, as the majority of traffic requiring to travel to the east or west will utilise the Samford
Road signalised intersection. Therefore it has been assumed that only 5% of the traffic using the
Settlement Road access will travel to and from the north.
3.3 FUTURE YEAR VOLUME SCENARIOS
In order to assess future year impacts of the development on the surrounding road network the
existing traffic surveys formed the basis of future year volumes. The most recent assessment of
the surrounding road network was undertaken as part of the Upper Kedron development, with the
Traffic Engineering Report undertaken by TTM in March 2015. A review of the historical data in
the report identified that the average growth along Samford Road ranged between 0.7% and
0.001% p.a.; therefore a 0.05% p.a. growth was assumed in the assessment undertaken in the
report. The 0.05% p.a. growth has also been assumed for the Keperra Quarry development
assessment. This was considered to be acceptable as the traffic generated by the Bunnings and
Upper Kedron residential development, as discussed in Section 2.5, was added separately to the
forecast traffic.
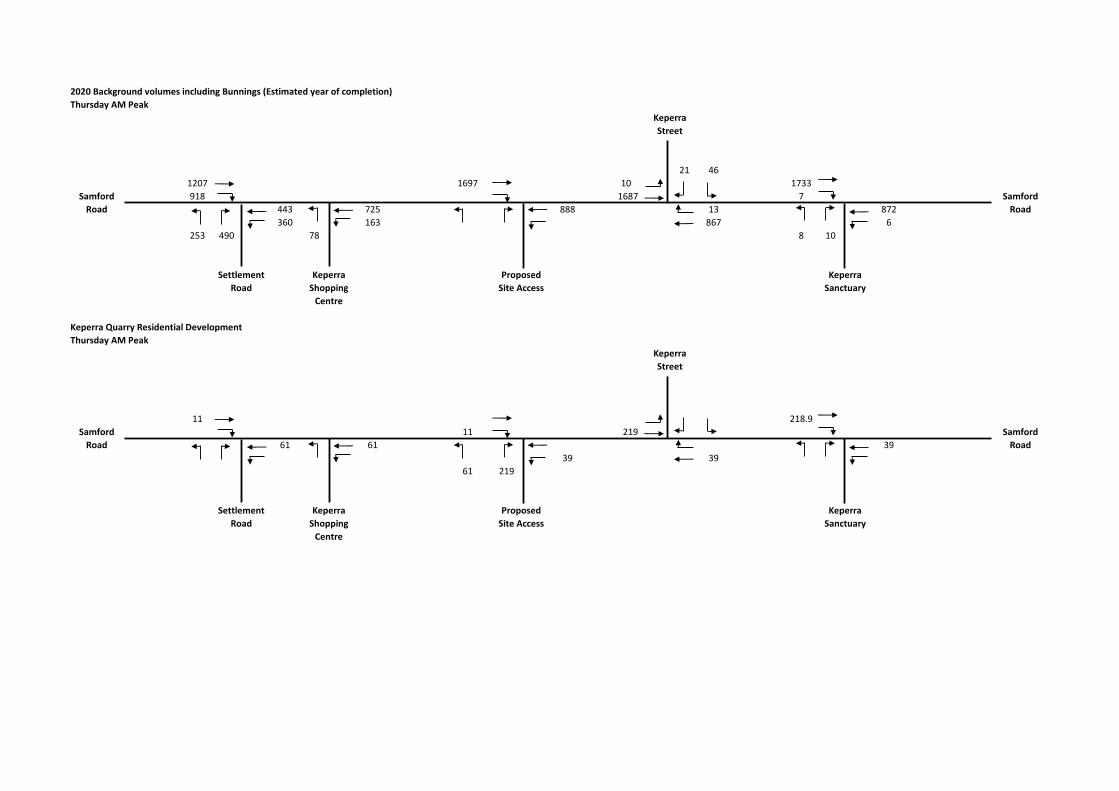
It has been assumed that the estimated year of completion would be 2020 with the 10 year
design horizon assumed to be 2030. As a result the following future year volume scenarios have
been produced and are included in Appendix C.
2015 base volumes;
2020 base volumes (including Bunnings traffic);
2020 total volumes (base volumes including Keperra Quarry development traffic);
2030 base volumes (including Upper Kedron and Bunnings traffic); and
2030 total volumes (base volumes including Keperra Quarry development traffic).
Ref: B15323TR002_revB - 10 - Keperra Quarry Development
Traffic Impact Assessment
4.0 SIDRA INTERSECTION ASSESSMENT
This section provides a Sidra Intersection assessment of the potential impact that the
development traffic could have on the operation of the surrounding road network, and assesses
the subject intersections in isolation. The Sidra Intersection assessment also provides a
comparison to the AIMSUN assessment of Samford Road which was undertaken in Section 5, to
provide a sensibility check. The intersections assessed include:
Samford Road / Settlement Road intersection;
Samford Road / proposed access intersection; and
Settlement Road / proposed access intersection;
The impact of the proposed development on the intersections has been analysed using the
intersection analysis package SIDRA INTERSECTION 6.1, and adopting the traffic generation
and distribution assumptions detailed in Section 3.3.
4.1 INTERSECTION ANALYSIS ASSUMPTIONS
The operation of the study intersections have been assessed to consider the current performance
of the intersections ‘with’ and ‘without’ the proposed development in place.
The SIDRA Intersection 6.1 model was created by adopting the following assumptions:
Existing intersection geometry, including lane lengths and widths were measured using
aerial mapping information extracted from Queensland Globe and further verified on site;
Future year Samford Road / Settlement Road intersection layouts based on Bunnings
conditions as discussed in Section 2.5.2.
A saturation flow of 1,950 through car units per hour;
Heavy vehicle percentage reflect those recorded in the 2015 survey;
Gap acceptance values are consistent with Sidra Intersection defaults;
A peak flow period of 60 minutes to reflect the observed consistent peak; and
Signal timing for the existing network was sourced from the TMR and utilised in the
assessment. Modifications to these existing signal timings were undertaken at the
Samford Road / Settlement Road intersection as future year traffic required some signal
phasing optimisation.
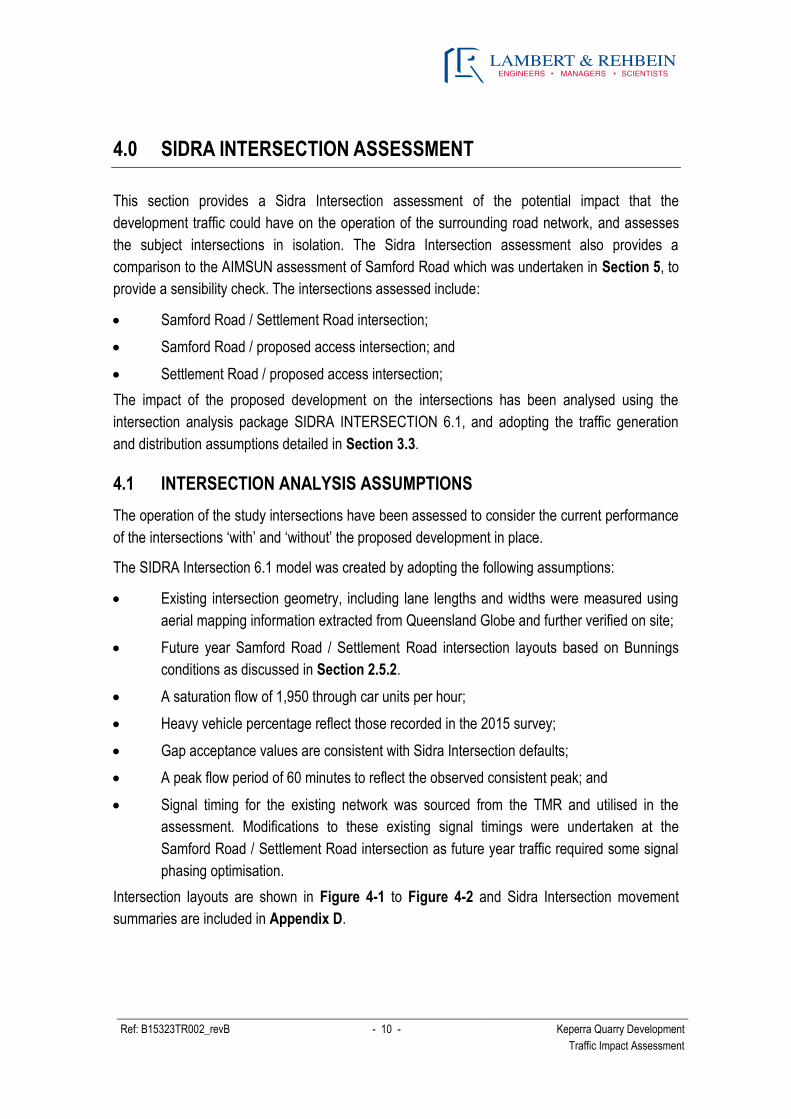
Intersection layouts are shown in Figure 4-1 to Figure 4-2 and Sidra Intersection movement
summaries are included in Appendix D.
Ref: B15323TR002_revB - 11 - Keperra Quarry Development
Traffic Impact Assessment
Figure 4-1 Samford Road / Settlement Road existing layout
Figure 4-2 Samford Road / Settlement Road interim layout
Ref: B15323TR002_revB - 12 - Keperra Quarry Development
Traffic Impact Assessment
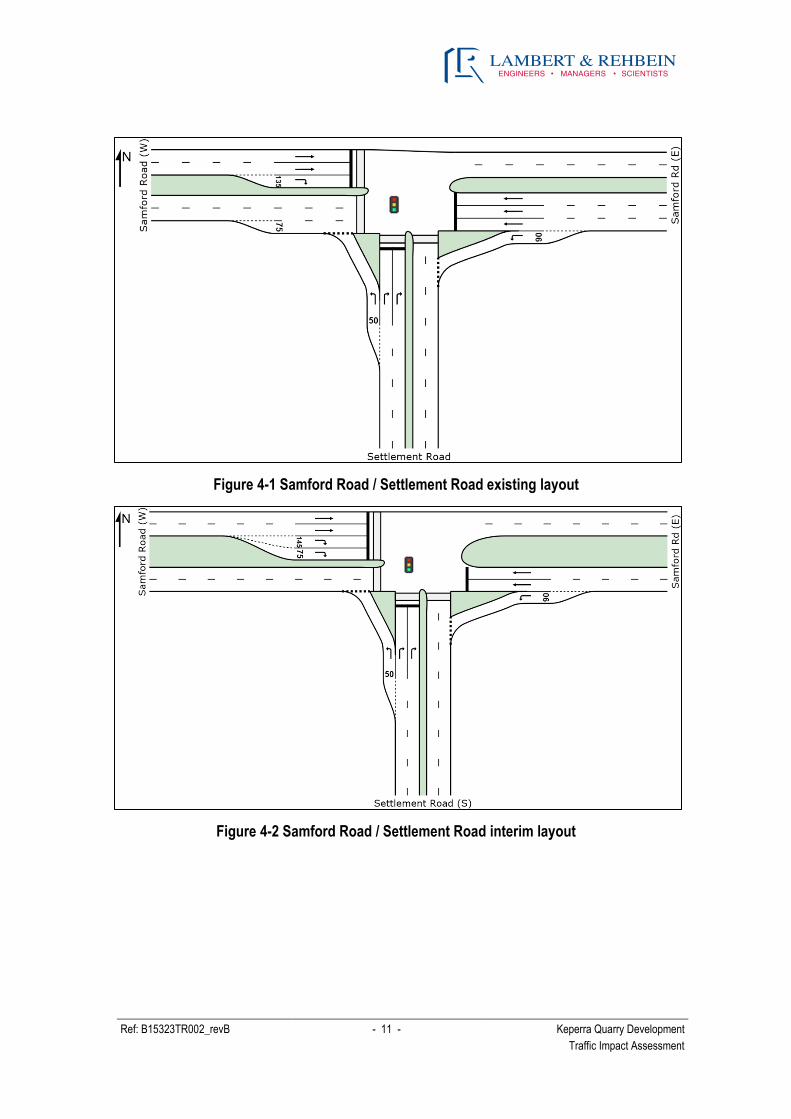
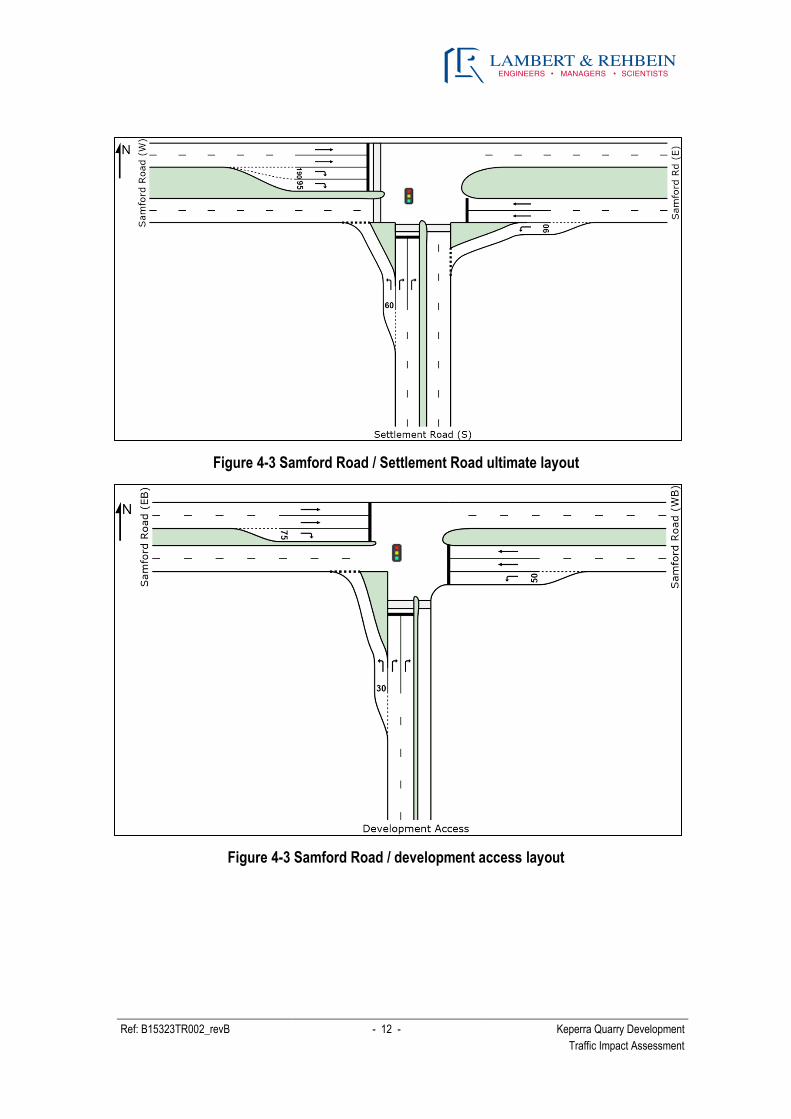
Figure 4-3 Samford Road / Settlement Road ultimate layout
Figure 4-3 Samford Road / development access layout

Ref: B15323TR002_revB - 13 - Keperra Quarry Development
Traffic Impact Assessment
Figure 4-3 Settlement Road / development access layout
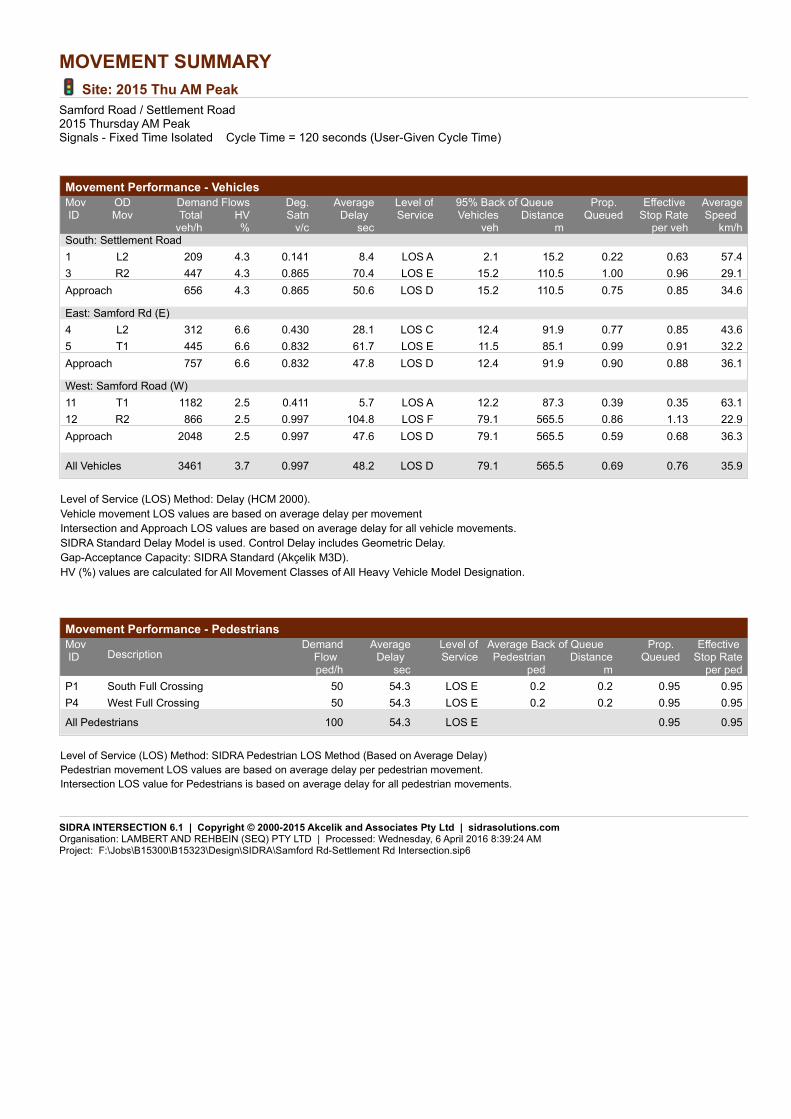
4.2 SETTLEMENT ROAD / SAMFORD ROAD INTERSECTION
The Settlement Road / Samford Road intersection was assessed in 2015 to assist with the
calibration of the AIMSUN microsimulation model, and was calibrated based on site observations
and video data provided by the survey subconsultants. Also included is the analysis for the 2020
estimated year of completion and the 10 year design horizon for the with and without
development scenarios are shown in Table 4-1 and Table 4-2, which compares the current
intersection performance as ‘background traffic’ with the development traffic, as discussed in
Section 3.3.

Ref: B15323TR002_revB - 14 - Keperra Quarry Development
Traffic Impact Assessment
Table 4-1 Settlement Road / Samford Road Thursday Intersection Results
Scenario Approach
AM Peak PM Peak
DoS Avg
Delay
(s)
LoS 95%
Back of
Queue
(m)
DoS Avg
Delay
(s)
LoS 95%
Back of
Queue
(m)
2015 Existing
Settlement Rd (S) 0.865 50.6 D 110.5 0.676 40.6 D 83.1
Samford Rd (E) 0.832 47.8 D 91.9 0.675 27.3 C 174.3
Samford Rd (W) 0.997 47.6 D 565.5 0.679 23.2 C 134.4
2020
Background
Traffic
Settlement Rd (S) 0.699 38.6 D 109.6 0.611 39.9 D 92.2
Samford Rd (E) 0.646 33.6 C 90.5 0.743 22.1 C 226.8
Samford Rd (W) 0.614 19.2 B 139.9 0.744 32.9 C 90.7
2020 With
Development
Settlement Rd (S) 0.604 37.4 D 94.5 0.636 41.5 D 93.3
Samford Rd (E) 0.674 34.3 C 102.7 0.782 22.6 C 248.7
Samford Rd (W) 0.683 20.5 C 146.6 0.744 30.2 C 90.7
2030
Background
Traffic
Settlement Rd (S) 0.778 41.3 D 111.0 0.872 53.3 D 138.2
Samford Rd (E) 0.775 39.7 D 125.7 0.870 27.6 C 347.1
Samford Rd (W) 0.785 19.4 B 189.3 0.855 33.1 C 119.3
2030 With
Development
Settlement Rd (S) 0.815 43.4 D 114.7 0.872 54.3 D 140.8
Samford Rd (E) 0.822 41.9 D 144.2 0.901 32.5 C 401.3
Samford Rd (W) 0.785 19.1 B 189.3 0.900 33.7 C 127.3
DoS = Degree of Saturation LoS = Level of Service

Ref: B15323TR002_revB - 15 - Keperra Quarry Development
Traffic Impact Assessment
Table 4-1 Settlement Road / Samford Road Saturday Intersection Results
Scenario Approach
AM Peak
DoS Avg
Delay
(s)
LoS 95%
Back of
Queue
(m)
2015 Existing
Settlement Rd (S) 0.588 32.9 C 96.6
Samford Rd (E) 0.682 35.6 D 113.7
Samford Rd (W) 0.704 21.8 C 173.1
2020
Background
Traffic
Settlement Rd (S) 0.554 28.6 C 116.9
Samford Rd (E) 0.725 31.3 C 139.0
Samford Rd (W) 0.719 32.9 C 127.6
2020 With
Development
Settlement Rd (S) 0.583 30.2 C 120.1
Samford Rd (E) 0.735 30.9 C 152.8
Samford Rd (W) 0.743 32.4 C 130.7
2030
Background
Traffic
Settlement Rd (S) 0.606 30.2 C 126.1
Samford Rd (E) 0.740 31.6 C 147.3
Samford Rd (W) 0.723 31.9 C 132.2
2030 With
Development
Settlement Rd (S) 0.622 31.3 C 127.8
Samford Rd (E) 0.824 34.4 C 187.6
Samford Rd (W) 0.747 31.8 C 135.5
DoS = Degree of Saturation LoS = Level of Service
The analysis indicates that the intersection is currently at capacity and the proposed upgrades, as
a result of the Bunnings conditions, provide sufficient capacity at the intersection to accommodate
background growth until 2030. The additional development traffic generated by the proposed site
has minimal impacts on the operation of the intersection with the highest degree of saturation of
0.9 on the Samford Road approaches during the Thursday PM peak, with 95th percentile of
queuing on the western approach reaching approximately 400m. It is noted that the queuing on
this approach is approximately 350m without the proposed development; however the
development would generate minimal traffic on this approach and the increase in queuing is due
to signal timing optimisation at the intersection.
Ref: B15323TR002_revB - 16 - Keperra Quarry Development
Traffic Impact Assessment
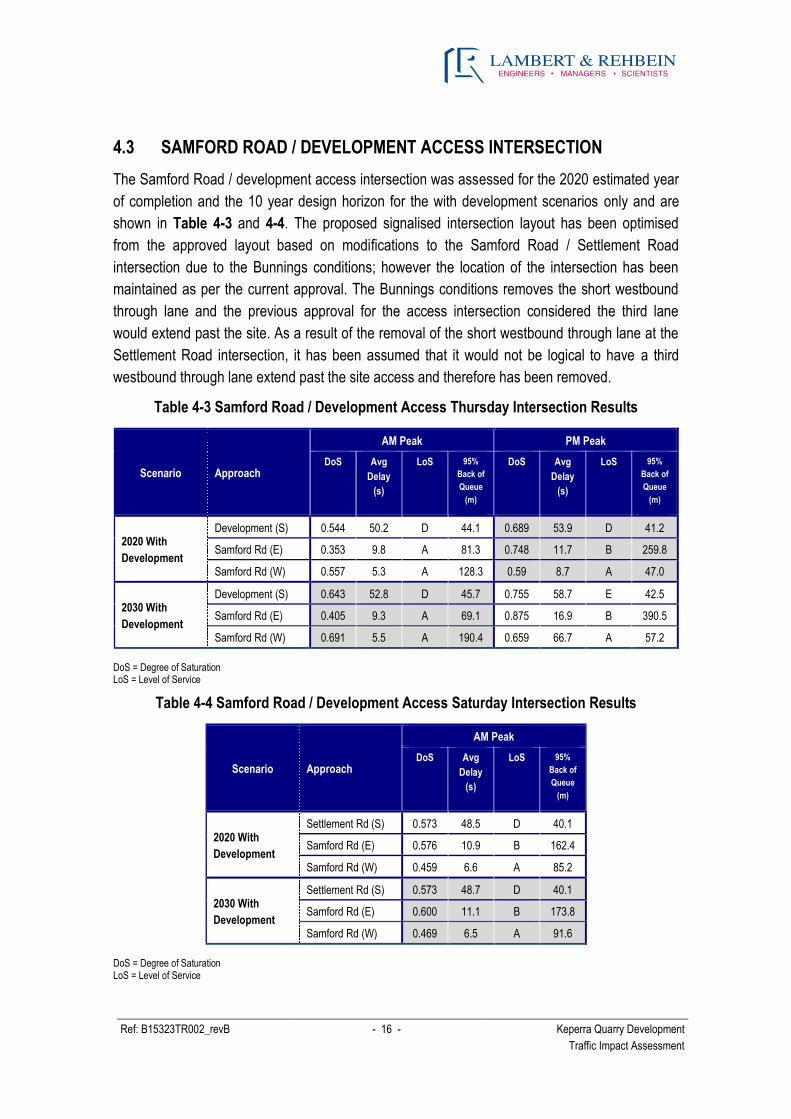
4.3 SAMFORD ROAD / DEVELOPMENT ACCESS INTERSECTION
The Samford Road / development access intersection was assessed for the 2020 estimated year
of completion and the 10 year design horizon for the with development scenarios only and are
shown in Table 4-3 and 4-4. The proposed signalised intersection layout has been optimised
from the approved layout based on modifications to the Samford Road / Settlement Road
intersection due to the Bunnings conditions; however the location of the intersection has been
maintained as per the current approval. The Bunnings conditions removes the short westbound
through lane and the previous approval for the access intersection considered the third lane
would extend past the site. As a result of the removal of the short westbound through lane at the
Settlement Road intersection, it has been assumed that it would not be logical to have a third
westbound through lane extend past the site access and therefore has been removed.
Table 4-3 Samford Road / Development Access Thursday Intersection Results
Scenario Approach
AM Peak PM Peak
DoS Avg
Delay
(s)
LoS 95%
Back of
Queue
(m)
DoS Avg
Delay
(s)
LoS 95%
Back of
Queue
(m)
2020 With
Development
Development (S) 0.544 50.2 D 44.1 0.689 53.9 D 41.2
Samford Rd (E) 0.353 9.8 A 81.3 0.748 11.7 B 259.8
Samford Rd (W) 0.557 5.3 A 128.3 0.59 8.7 A 47.0
2030 With
Development
Development (S) 0.643 52.8 D 45.7 0.755 58.7 E 42.5
Samford Rd (E) 0.405 9.3 A 69.1 0.875 16.9 B 390.5
Samford Rd (W) 0.691 5.5 A 190.4 0.659 66.7 A 57.2
DoS = Degree of Saturation LoS = Level of Service
Table 4-4 Samford Road / Development Access Saturday Intersection Results
Scenario Approach
AM Peak
DoS Avg
Delay
(s)
LoS 95%
Back of
Queue
(m)
2020 With
Development
Settlement Rd (S) 0.573 48.5 D 40.1
Samford Rd (E) 0.576 10.9 B 162.4
Samford Rd (W) 0.459 6.6 A 85.2
2030 With
Development
Settlement Rd (S) 0.573 48.7 D 40.1
Samford Rd (E) 0.600 11.1 B 173.8
Samford Rd (W) 0.469 6.5 A 91.6
DoS = Degree of Saturation LoS = Level of Service

Ref: B15323TR002_revB - 17 - Keperra Quarry Development
Traffic Impact Assessment
The analysis indicates that the proposed intersection layout provides sufficient capacity at the
intersection to accommodate background growth and development traffic until 2030. The highest
degree of saturation of 0.875 was observed on the Samford Road eastern approach during the
Thursday PM peak. It is noted that the PM peak 95th percentile of queuing on the Samford Road
eastern approach reaches approximately 390m; however the AIMSUN assessment undertaken in
Section 5 indicates this level of queuing is occurring at the Keperra Sanctuary signalised
intersection to the east, regardless of the development. The analysis undertaken by AIMSUN
allowed the proposed development signalised intersection to be coordinated with the Keperra
Sanctuary signalised intersection to allow the queuing to clear in an efficient manner.
4.4 SETTLEMENT ROAD / DEVELOPMENT ACCESS INTERSECTION
The Settlement / development access intersection was assessed for the 2020 estimated year of
completion and the 10 year design horizon for the with development scenarios only and are
shown in Table 4-5. The intersection layout and location is consistent with the previous approval
for the site and has been reassessed to confirm it can accommodate the revised level of
development and future growth. The Saturday scenario has not been assessed for this
intersection, as it is considered that relatively low volumes will be using this intersection
compared to weekday peaks.
Table 4-5 Settlement Road / Development Access Thursday Intersection Results
Scenario Approach
AM Peak PM Peak
DoS Avg
Delay
(s)
LoS 95%
Back of
Queue
(m)
DoS Avg
Delay
(s)
LoS 95%
Back of
Queue
(m)
2020 With
Development
Settlement Rd (S) 0.312 1.4 N/A 4.0 0.588 1.5 N/A 8.5
Development (E) 0.246 11.5 B 6.6 0.058 9.5 A 1.4
Settlement Rd (N) 0.347 0.1 N/A 0.0 0.192 0.0 N/A 0.0
2030 With
Development
Settlement Rd (S) 0.327 1.6 N/A 4.6 0.618 1.6 N/A 9.1
Development (E) 0.260 12.3 B 7.0 0.059 10.2 B 1.5
Settlement Rd (N) 0.365 0.1 N/A 0.0 0.202 0.0 N/A 0.0
DoS = Degree of Saturation LoS = Level of Service
The analysis indicates that the proposed intersection layout provides sufficient capacity at the
intersection to accommodate background growth and development traffic until 2030. The highest
degree of saturation of 0.618 was observed on the Settlement Road approach during the
Thursday PM peak. As previously discussed it is considered that minimal traffic will travel north
from the intersection during the peak hours due to the more convenient alternative via the
signalised intersection with Samford Road.
Ref: B15323TR002_revB - 18 - Keperra Quarry Development
Traffic Impact Assessment
5.0 AIMSUN MICROSIMULATION MODELLING
A microsimulation model of the options analysis for the Keperra Quarry development was
developed using the AIMSUN 8.1 modelling package. AIMSUN is a simulation software package
with the capability of modelling vehicle movements at micro, meso and macro simulation levels.
The microsimulation model was development to demonstrate that the new signals, which
accommodate all movement access to the site, can be adequately coordinated with adjacent
signals.
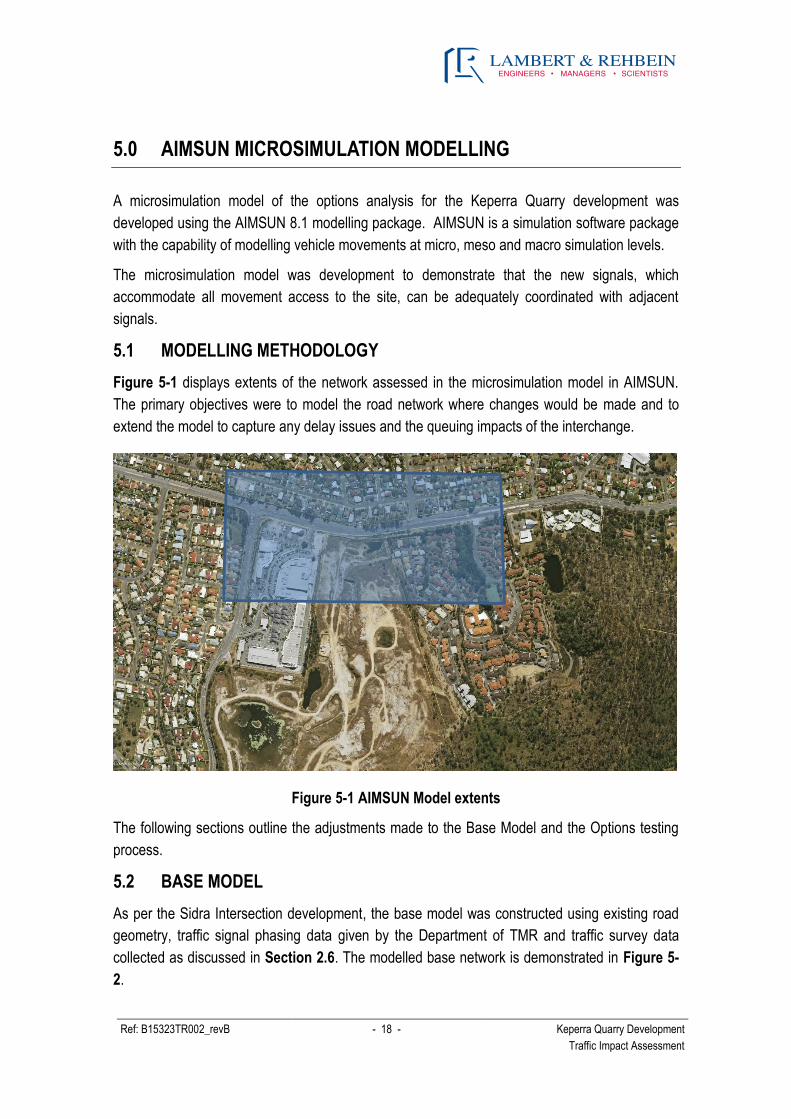
5.1 MODELLING METHODOLOGY
Figure 5-1 displays extents of the network assessed in the microsimulation model in AIMSUN.
The primary objectives were to model the road network where changes would be made and to
extend the model to capture any delay issues and the queuing impacts of the interchange.
Figure 5-1 AIMSUN Model extents
The following sections outline the adjustments made to the Base Model and the Options testing
process.
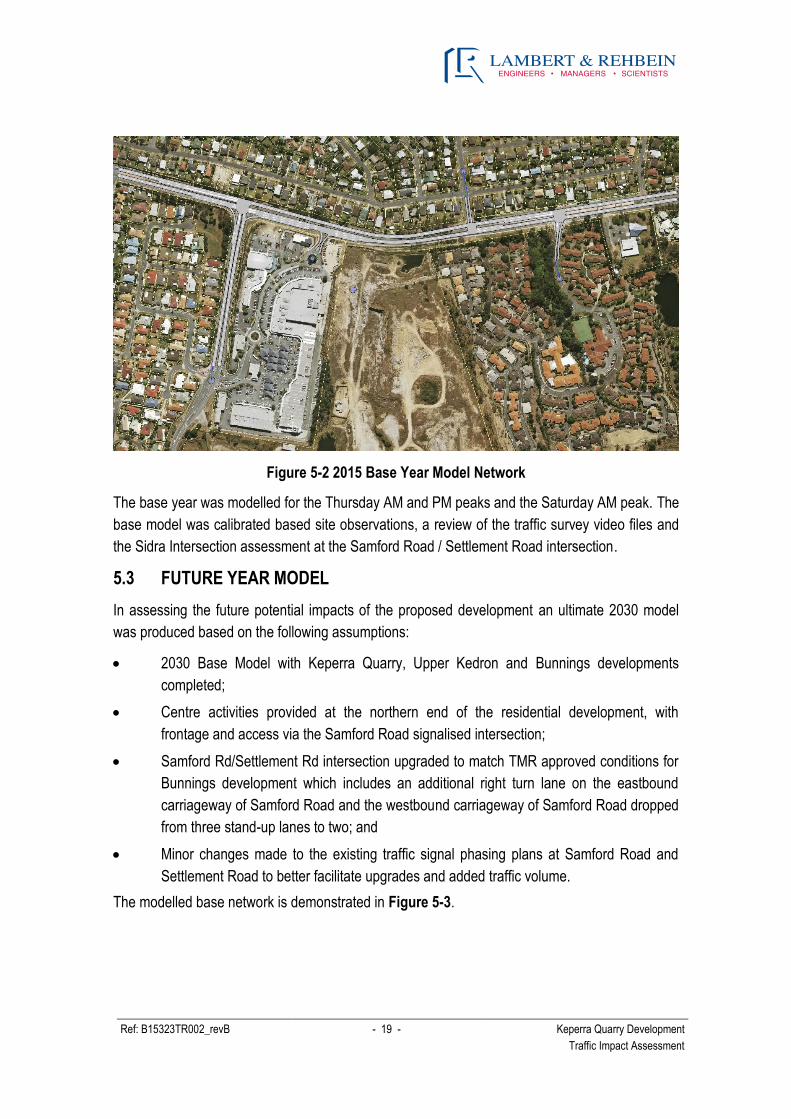
5.2 BASE MODEL
As per the Sidra Intersection development, the base model was constructed using existing road
geometry, traffic signal phasing data given by the Department of TMR and traffic survey data
collected as discussed in Section 2.6. The modelled base network is demonstrated in Figure 5-
2.
Ref: B15323TR002_revB - 19 - Keperra Quarry Development
Traffic Impact Assessment
Figure 5-2 2015 Base Year Model Network
The base year was modelled for the Thursday AM and PM peaks and the Saturday AM peak. The
base model was calibrated based site observations, a review of the traffic survey video files and
the Sidra Intersection assessment at the Samford Road / Settlement Road intersection.
5.3 FUTURE YEAR MODEL
In assessing the future potential impacts of the proposed development an ultimate 2030 model
was produced based on the following assumptions:
2030 Base Model with Keperra Quarry, Upper Kedron and Bunnings developments
completed;
Centre activities provided at the northern end of the residential development, with
frontage and access via the Samford Road signalised intersection;
Samford Rd/Settlement Rd intersection upgraded to match TMR approved conditions for
Bunnings development which includes an additional right turn lane on the eastbound
carriageway of Samford Road and the westbound carriageway of Samford Road dropped
from three stand-up lanes to two; and
Minor changes made to the existing traffic signal phasing plans at Samford Road and
Settlement Road to better facilitate upgrades and added traffic volume.
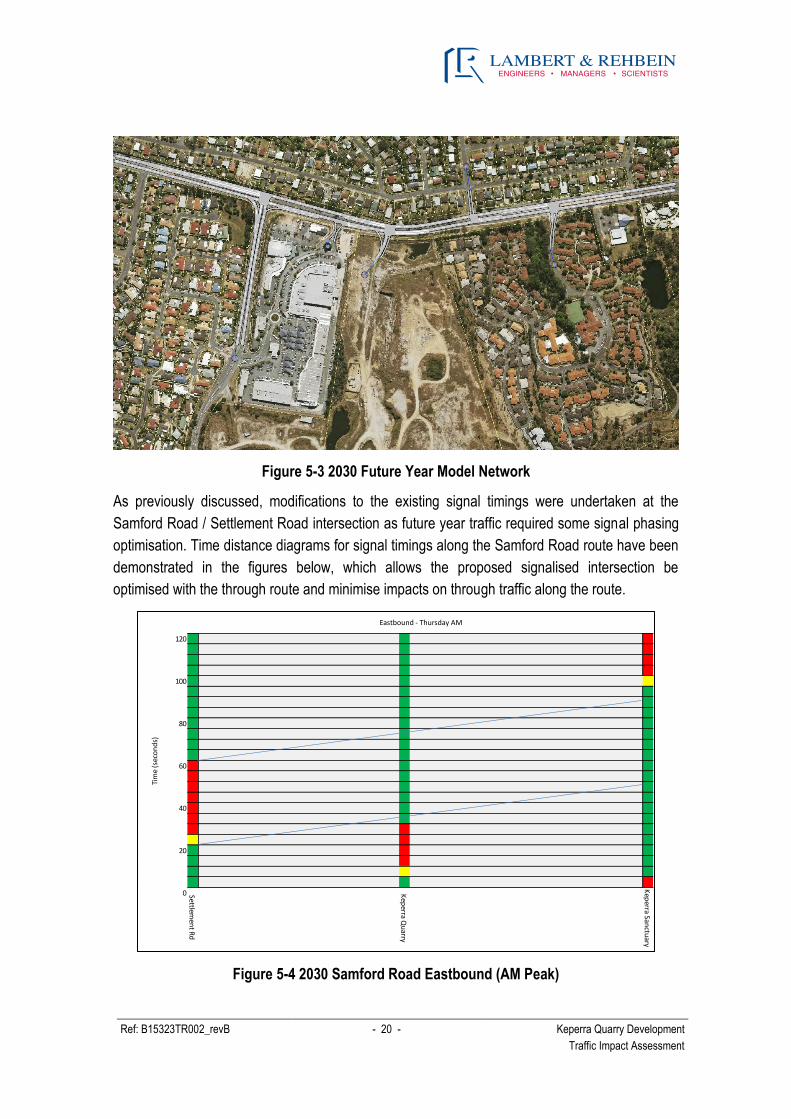
The modelled base network is demonstrated in Figure 5-3.
Ref: B15323TR002_revB - 20 - Keperra Quarry Development
Traffic Impact Assessment
Figure 5-3 2030 Future Year Model Network
As previously discussed, modifications to the existing signal timings were undertaken at the
Samford Road / Settlement Road intersection as future year traffic required some signal phasing
optimisation. Time distance diagrams for signal timings along the Samford Road route have been
demonstrated in the figures below, which allows the proposed signalised intersection be
optimised with the through route and minimise impacts on through traffic along the route.
Figure 5-4 2030 Samford Road Eastbound (AM Peak)
120
100
80
60
40
20
0 Kep
erra Qu
arry
Eastbound - Thursday AM
Tim
e (s
eco
nd
s)
Settlemen
t Rd
Kep
erra Sanctu
ary

Ref: B15323TR002_revB - 21 - Keperra Quarry Development
Traffic Impact Assessment
Figure 5-5 2030 Samford Road Westbound (AM Peak)
Figure 5-6 2030 Samford Road Eastbound (PM Peak)
120
100
80
60
40
20
0 Kep
erra Qu
arry
Tim
e (s
eco
nd
s)Westbound - Thursday AM
Settlemen
t Rd
Kep
erra Sanctu
ary
120
100
80
60
40
20
0
Eastbound - Thursday PM
Tim
e (s
eco
nd
s)
Settlemen
t Rd
Kep
erra Qu
arry
Kep
erra Sanctu
ary
Ref: B15323TR002_revB - 22 - Keperra Quarry Development
Traffic Impact Assessment
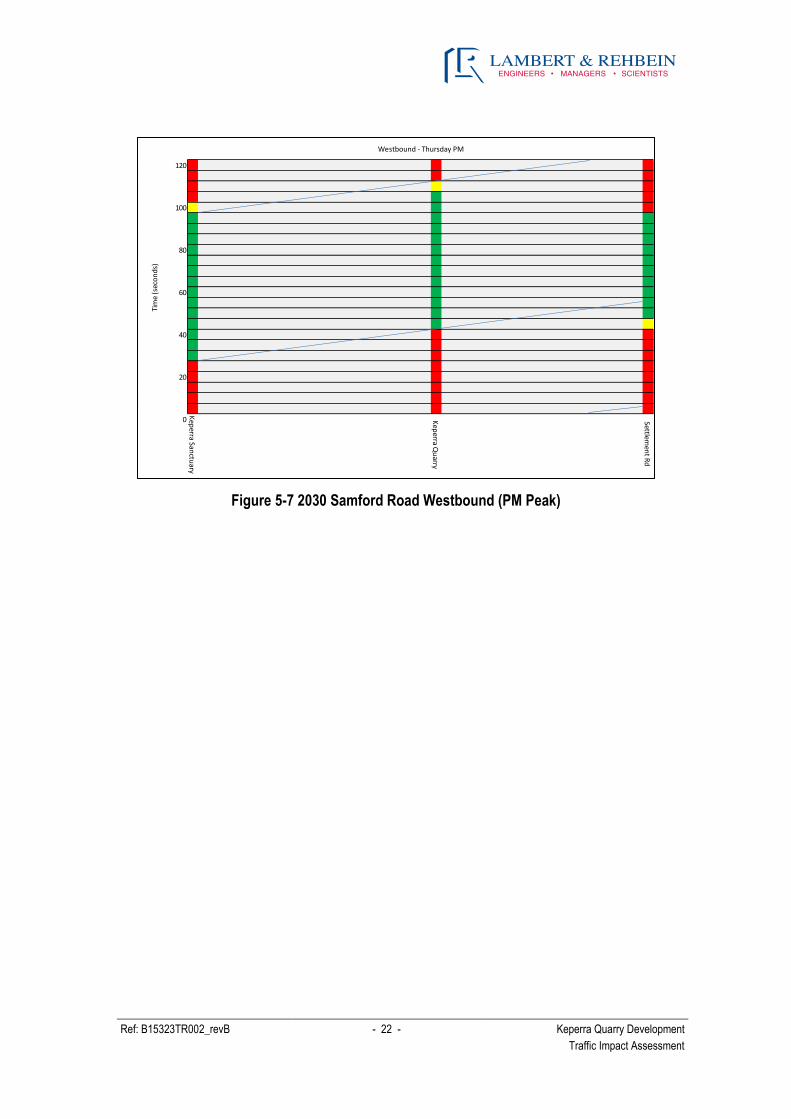
Figure 5-7 2030 Samford Road Westbound (PM Peak)
120
100
80
60
40
20
0
Westbound - Thursday PMTi
me
(sec
on
ds)
Kep
erra Sanctu
ary
Kep
erra Qu
arry
Settlemen
t Rd

Ref: B15323TR002_revB - 23 - Keperra Quarry Development
Traffic Impact Assessment
5.4 RESULTS
Each of the above scenarios were designed and modelled through AIMSUN 8.1. The results
shown below contain a summary of the observations of the overall network performance as well
as an analysis of key individual sections. The results are summarised in below.
5.4.1 SCENARIO 1 (BASE)
Existing road network modelled with traffic volumes taken directly from surveys commissioned on
Thursday the 10th of September and Saturday the 12th of September. Queuing was observed
during the AM peak for right turning traffic from Samford Road onto Settlement Road and is
consistent with current on-site observations and is demonstrated in Figure 5-8 below.
Figure 5-8 2015 AM Peak Samford Road Right Turn Queuing
5.4.2 SCENARIO 2 (2030 WITH DEVELOPMENT)
The Samford Road and Settlement Road intersection was upgraded to match TMR approved
conditions with double right turn on Samford Road to Settlement Road. Samford Road westbound
carriageway dropped to two through lanes to accommodate additional right turn lane on Samford
Road eastbound carriageway.
The network appears to operate adequately based on observations; however some queuing is
present on the network during peak hours on the Samford Road, consistent with the Sidra
Intersection assessment.

Ref: B15323TR002_revB - 24 - Keperra Quarry Development
Traffic Impact Assessment
Queuing was observed to occur during the AM peak for right turning traffic from Samford Road
onto Settlement Road and is demonstrated in Figure 5-9 below; however the development would
generate minimal traffic on this approach and the increase in queuing is due to signal timing
optimisation at the intersection.
Figure 5-9 2030 AM Peak Samford Road Right Turn Queuing
It is also observed that there is excessive queuing in the PM peak on the Samford Road due to
westbound traffic on the approach at the Keperra Sanctuary signalised intersection, as
demonstrated in Figure 5-10. The proposed development signalised intersection has been
established to be coordinated with the Keperra Sanctuary signalised intersection to allow the
queuing to clear in an efficient manner.

Ref: B15323TR002_revB - 25 - Keperra Quarry Development
Traffic Impact Assessment
Figure 5-10 2030 PM Peak Samford Road Westbound Queuing
The microsimulation model also demonstrates that the new signalised intersection is expected to
have a negligible impact to the existing Samford Road left in / left out access to the Great
Western Super Centre. Customers wishing to access the shopping centre are expected to be
familiar with the road conditions and be in the left lane prior to the new signalised intersection and
are able to exit the Samford Road without impeding through traffic due to the deceleration
provisions. The new signalised intersection is expected to provide a benefit to exiting traffic due to
the intergreen phase which will allow gaps for customer traffic to exit the shopping centre.
Ref: B15323TR002_revB - 26 - Keperra Quarry Development
Traffic Impact Assessment
6.0 SUMMARY AND CONCLUSION
This traffic impact assessment has been prepared for RPS, on behalf of Brookfield Residential
Properties, as part of the Preliminary Approval for a Material Change of Use to provide a
residential subdivision development with some retail facilities at the existing Keperra Quarry site.
The development site is situated on land on the southern side of Samford Road in Keperra,
formally described as Lot 3 on SP202641 and Lot 1 on RP174601.
The proposed Preliminary Approval seeks to gain approval over the site for the residential and
retail uses and facilitate access onto Samford Road and Settlement Road. The structure plan is
displayed in Appendix A and proposes to ultimately allow for the following breakdown:
300 allotments within the Low-Medium Density Residential Zone
400 multiple dwellings (units) within the Medium Density Residential Zone
3,000sqm GFA of Centre Activities within the Neighbourhood Centre Zone
As the site is seeking a Preliminary Approval this report primarily focussed of analysis of the
impact the proposed development has on Samford Road and Settlement Road. The key area of
analysis was the section of Samford Road between Settlement Road and Keperra Sanctuary and
whether the new signals, which accommodate all movement access to the site, can be
adequately coordinated with adjacent signals.
Analysis undertaken in Section 4 and 5, demonstrates that the fully developed Keperra Quarry
precinct can be accommodated up to 2030 by the surrounding road network; however some
queuing was observed on the network during peak hours on the Samford Road. Queuing was
observed to occur during the AM peak for right turning traffic from Samford Road onto Settlement
Road; however the development would generate minimal traffic on this approach and the
increase in queuing is due to signal timing optimisation at the intersection.
It is also observed that there is excessive queuing in the PM peak on the Samford Road due to
westbound traffic on the approach at the Keperra Sanctuary signalised intersection. The
proposed development signalised intersection has been established to be coordinated with the
Keperra Sanctuary signalised intersection to allow the queuing to clear in an efficient manner.
The proposed model also demonstrates that the new signalised intersection is expected to have a
negligible impact to the existing Samford Road left in / left out access to the Great Western Super
Centre. Customers are able to exit the Samford Road without impeding through traffic due to the
deceleration provisions and the new signalised intersection is expected to provide a benefit to
exiting traffic due to the intergreen phase which will allow gaps for customer traffic to exit the
shopping centre.
APPENDIX A
STRUCTURE PLAN

SETTLEMENT RO
AD
SAMFORD ROAD
MUNGARIE ST
KEPERRA SANCTUARY AGED CARE
EXISTING COMMERCIAL /
RETAIL USES
FUTURE BUNNINGS DEVELOPMENT SITE
DATECHKDDRWNREVPROJ_DRG NO 09.04.2016MNMN140315-0204 01 D001Keperra Quarry Master Plan10040200
SCALE 1:2000 (A1)
Keperra Quarry - Structure Plan
Neighbourhood Centre Zone
Low -Medium Density Residential Zone(up to 3 storeys zone precinct)
Medium Density Residential Zone
Sport & Recreational Zone
Conservation Zone
Open space
Bio-retention
Road
Property boundary
legend

APPENDIX B
TRAFFIC SURVEYS
Job No. : Q1581Client : Lambert & RehbeinSuburb : Keperra Location : 1. Settlement Rd / Samford Rd
Day/Date : Thursday, 10th September 2015Weather : FineDescription : Classified Intersection Count
: Intersection Diagram
Hour Starting Vehicle Type
Total 5,415 2,048 949 1,629 1,058 4,348 TotalEastbd 100% 38% 23% 37% 24% 100% Eastbd
0 3,291 1,182 579 11 00 61% 58% 61% 0
2,124 866 370 12 (Vol) (Vol)39% 42% 39% AM Peak to ( % ) ( % )
0 0 0 12U PM Peak to 6U 0 0 00% 0% 0% 0% 0% 0%
(Vol) (Vol) 5 445 1,062 1,086( % ) ( % ) 59% 79% 57%
0 4 312 287 803 00 41% 21% 43% 0
Total 1,597 654 1,459 1 3 3U 757 1,349 1,889 TotalWestbd 100% 41% 22% 40% 21% 100% Westbd
656 209 447 0 (Vol) 1,17842% 32% 68% 0% ( % ) 40%
876 397 479 0 (Vol) 65723% 45% 55% 0% ( % ) 21%
1,568 511 1,057 0 Selected 2,927100% 33% 67% 0% Hour & Vehicle Type 100%
Total TotalNorthbd Southbd
AM Peak 0 AM Peak 0PM Peak 5 PM Peak 3
AM Peak
8:30
16:15
Settlement Rd
PM Peak
PedsA
1 PedsB
3
Sam
ford
Rd
7:30
15:15
PedsG
AM PeakPM Peak
PedsH
0
AM PeakPM Peak
Sam
ford
Rd
AM Peak
PM Peak
0 1
AM Peak
PM Peak
AM PeakPM Peak
PedsD
PedsC
0
AM PeakPM Peak
N

Job No. : Q1581Client : Lambert & RehbeinSuburb : Keperra Location : 1. Settlement Rd / Samford Rd
Day/Date : Saturday, 12th September 2015Weather : FineDescription : Classified Intersection Count
: Intersection Diagram
Hour Starting Vehicle Type
Total 4,412 1,187 1,206 4,521 TotalEastbd 100% 27% 27% 100% Eastbd
2,569 688 1158% 58%
1,843 499 12 (Vol)42% 42% ( % )
Peak Hour to0 0 12U 6U 0 0
0% 0% 0% 0%
(Vol) 5 738 3,014( % ) 68% 70%
4 340 1,28632% 30%
Total 4,627 1,146 1 3 3U 1,078 4,300 TotalWestbd 100% 25% 25% 100% Westbd
926 408 518 0 (Vol) 83926% 44% 56% 0% ( % ) 27%
3,565 1,613 1,952 0 Selected 3,129100% 45% 55% 0% Hour & Vehicle Type 100%
Total TotalNorthbd Southbd
Settlement Rd
PedsA
9
Sam
ford
Rd 10:45
PedsG
Peak 2
Peak
PedsB
Peak 2 13
PedsH
Peak
Peak
Sam
ford
Rd
Peak
0 2
Peak
PedsD
Peak0 0
PedsC
2
Peak 2
3
0
11:45
N
Job No. : Q1581Client : Lambert & RehbeinSuburb : Keperra Location : 2. Samford Rd / Keperra St
Day/Date : Thursday, 10th September 2015Weather : FineDescription : Classified Intersection Count
: Intersection Diagram
AM Peak 0 AM Peak 1Hour Starting Vehicle Type PM Peak 0 PM Peak 2
Total TotalNorthbd Southbd
60 Selected 0 48 137 185100% Hour & Vehicle Type 0% 26% 74% 100%
23 (Vol) 0 20 46 6638% ( % ) 0% 30% 70% 36%
71 (Vol) 0 14 31 4522% ( % ) 0% 31% 69% 18%
Total 4,564 1,632 953 1,668 949 4,672 TotalEastbd 100% 36% 21% 9U 9 7 36% 21% 100% Eastbd
29 10 35 101% 1% 4%
2 4,535 1,622 918 11 03 99% 99% 96% 1
(Vol) (Vol)AM Peak to ( % ) ( % )
0 0 0 12U PM Peak to 6U 0 0 00% 0% 0% 0% 0% 0%
6 13 36 311% 2% 2%
(Vol) (Vol) 5 899 1,702 2,007( % ) ( % ) 99% 98% 98%
2 12 0
Total 2,055 919 1,716 912 1,738 2,038 TotalWestbd 100% 45% 25% 45% 24% 100% Westbd
Sam
ford
Rd
AM Peak
PM Peak
4 0
AM Peak
PM Peak
AM PeakPM Peak
PedsD
PedsC
1
AM PeakPM Peak
8:45
17:00
Sam
ford
Rd
7:45
16:00
PedsG
AM PeakPM Peak
PedsH
3
AM PeakPM Peak
Keperra St
AM Peak
PM Peak
PedsF
2 PedsE
2
N
Job No. : Q1581Client : Lambert & RehbeinSuburb : Keperra Location : 2. Samford Rd / Keperra St
Day/Date : Saturday, 12th September 2015Weather : FineDescription : Classified Intersection Count
: Intersection Diagram
Hour Starting Vehicle TypeTotal Total
Northbd Southbd
211 Selected 0 71 155 226100% Hour & Vehicle Type 0% 31% 69% 100%
54 (Vol) 0 24 47 7126% ( % ) 0% 34% 66% 31%
Total 4,680 1,254 1,278 4,742 TotalEastbd 100% 27% 9U 9 7 27% 100% Eastbd
93 23 102% 2%
4,585 1,231 1198% 98%
(Vol)( % )
Peak Hour to2 0 12U 6U 0 2
0% 0% 0% 0%
6 31 1183% 2%
(Vol) 5 1,193 4,740( % ) 97% 98%
Total 4,813 1,217 1,224 4,860 TotalWestbd 100% 25% 25% 100% Westbd
Keperra St
Peak
PedsF
0
11:30
Peak 0 PedsE
Peak 1 4
Sam
ford
Rd 10:30
PedsG
Peak
PedsH
Peak
Sam
ford
Rd
Peak
2 0
Peak
PedsD
Peak0 0
PedsC
0
Peak 0
12
6
N

Job No. : Q1581Client : Lambert & RehbeinSuburb : Keperra Location : 3. Samford Rd / Keperra Sanctuary
Day/Date : Thursday, 10th September 2015Weather : FineDescription : Classified Intersection Count
: Intersection Diagram
Hour Starting Vehicle Type
Total 4,686 1,676 941 1,681 941 4,694 TotalEastbd 100% 36% 20% 36% 20% 100% Eastbd
0 4,673 1,669 924 11 10 100% 100% 98% 2
13 7 16 12 (Vol) (Vol)0% 0% 2% AM Peak to ( % ) ( % )
0 0 1 12U PM Peak to 6U 0 0 00% 0% 0% 0% 0% 0%
(Vol) (Vol) 5 900 1,725 2,014( % ) ( % ) 99% 99% 99%
0 4 11 12 23 20 1% 1% 1% 0
Total 2,036 907 1,742 1 3 3U 911 1,737 2,037 TotalWestbd 100% 45% 25% 45% 24% 100% Westbd
19 7 12 0 (Vol) 1844% 37% 63% 0% ( % ) 50%
33 16 17 0 (Vol) 2823% 48% 52% 0% ( % ) 21%
43 22 21 0 Selected 36100% 51% 49% 0% Hour & Vehicle Type 100%
Total TotalNorthbd Southbd
AM Peak 3 AM Peak 1PM Peak 0 PM Peak 1
AM Peak
8:45
17:00
Keperra Sanctuary
PM Peak
PedsA
8 PedsB
3
Sam
ford
Rd
7:45
16:00
PedsG
AM PeakPM Peak
PedsH
0
AM PeakPM Peak
Sam
ford
Rd
AM Peak
PM Peak
0 4
AM Peak
PM Peak
AM PeakPM Peak
PedsD
PedsC
5
AM PeakPM Peak
N

Job No. : Q1581Client : Lambert & RehbeinSuburb : Keperra Location : 3. Samford Rd / Keperra Sanctuary
Day/Date : Saturday, 12th September 2015Weather : FineDescription : Classified Intersection Count
: Intersection Diagram
Hour Starting Vehicle Type
Total 4,744 1,252 1,244 4,745 TotalEastbd 100% 26% 26% 100% Eastbd
4,692 1,234 1199% 99%
51 18 12 (Vol)1% 1% ( % )
Peak Hour to1 0 12U 6U 0 0
0% 0% 0% 0%
(Vol) 5 1,238 4,850( % ) 99% 99%
4 18 641% 1%
Total 4,918 1,255 1 3 3U 1,256 4,914 TotalWestbd 100% 26% 26% 100% Westbd
27 17 10 0 (Vol) 3623% 63% 37% 0% ( % ) 31%
120 67 53 0 Selected 115100% 56% 44% 0% Hour & Vehicle Type 100%
Total TotalNorthbd Southbd
Keperra Sanctuary
PedsA
5
Sam
ford
Rd 10:45
PedsG
Peak 1
Peak
PedsB
Peak 1 7
PedsH
Peak
Peak
Sam
ford
Rd
Peak
0 1
Peak
PedsD
Peak0 0
PedsC
0
Peak 0
0
0
11:45
N
Job No Q1661
Client Lambert and Rehbein
Road Settlement Rd - north of Meridian Pl Average Weekday 9,019Location Keperra 7 Day Average 8,669Site No. 1
Start Date
Description Volume Summary
Direction NB
Mon Tue Wed Thu Fri Sat Sun Ave 7 Day
Time 21-Mar 22-Mar 23-Mar 24-Mar 25-Mar 19-Mar 20-Mar W'day AveAM Peak 651 707 737 706 477 829 697PM Peak 1082 1100 1097 1049 414 784 631
0:00 13 15 21 17 37 40 56 21 281:00 7 11 10 11 22 20 17 12 142:00 7 8 8 14 10 17 16 9 113:00 14 12 9 18 11 15 16 13 144:00 41 39 37 32 22 29 33 34 335:00 99 107 111 126 56 70 68 100 916:00 331 317 329 306 115 168 126 280 2427:00 548 573 553 522 175 346 195 474 4168:00 651 707 737 644 287 534 377 605 5629:00 542 573 578 665 380 703 602 548 578
10:00 532 543 551 706 462 754 697 559 60611:00 461 513 535 585 477 829 679 514 58312:00 517 507 530 587 414 784 631 511 56713:00 490 485 539 647 402 673 560 513 54214:00 622 627 662 751 363 644 567 605 60515:00 1082 1095 1056 1049 349 692 553 926 83916:00 1024 1100 1097 1041 355 493 528 923 80517:00 1015 1081 1079 992 352 514 444 904 78218:00 635 647 733 616 250 339 291 576 50219:00 314 324 425 367 143 223 203 315 28620:00 200 246 256 262 131 192 135 219 20321:00 177 150 203 188 236 233 111 191 18522:00 83 97 122 124 150 157 66 115 11423:00 25 36 57 67 80 120 29 53 59
Total 9430 9813 10238 10337 5279 8589 7000 9019 8669
7-19 8119 8451 8650 8805 4266 7305 6124 7658 7389
6-22 9141 9488 9863 9928 4891 8121 6699 8662 8304
6-24 9249 9621 10042 10119 5121 8398 6794 8830 8478
0-24 9430 9813 10238 10337 5279 8589 7000 9019 8669
Day of Week
19-Mar-16
MATRIX ATC 7 Day Q1661 Settlement Rd KEPERRA 2016 Volume Summary 6/04/2016

Job No Q1661
Client Lambert and Rehbein
Road Settlement Rd - north of Meridian Pl Average Weekday 8,950Location Keperra 7 Day Average 8,584Site No. 1
Start Date
Description Volume Summary
Direction SB
Mon Tue Wed Thu Fri Sat Sun Ave 7 Day
Time 21-Mar 22-Mar 23-Mar 24-Mar 25-Mar 19-Mar 20-Mar W'day AveAM Peak 1223 1278 1231 1102 401 729 628PM Peak 677 707 695 696 453 736 729
0:00 9 13 11 14 32 37 42 16 231:00 11 6 8 9 16 26 21 10 142:00 10 11 12 17 16 14 11 13 133:00 17 16 19 25 19 18 10 19 184:00 62 71 76 78 33 43 26 64 565:00 308 278 291 242 94 113 68 243 1996:00 826 860 840 794 159 258 146 696 5557:00 1223 1278 1231 1102 215 399 234 1010 8128:00 950 1056 1027 978 253 497 272 853 7199:00 538 545 535 614 353 591 499 517 525
10:00 488 509 544 535 399 729 564 495 53811:00 444 499 522 536 401 715 628 480 53512:00 436 495 489 574 359 736 729 471 54513:00 521 471 579 604 367 691 633 508 55214:00 677 674 685 684 403 707 590 625 63115:00 646 611 629 669 343 633 587 580 58816:00 639 662 683 672 354 677 575 602 60917:00 644 707 695 696 453 584 436 639 60218:00 423 478 529 461 254 369 257 429 39619:00 247 257 310 328 137 201 176 256 23720:00 163 164 183 243 119 160 132 174 16621:00 120 110 194 171 116 151 89 142 13622:00 44 67 85 76 105 112 42 75 7623:00 18 29 31 40 49 84 25 33 39
Total 9464 9867 10208 10162 5049 8545 6792 8950 8584
7-19 7629 7985 8148 8125 4154 7328 6004 7208 7053
6-22 8985 9376 9675 9661 4685 8098 6547 8476 8147
6-24 9047 9472 9791 9777 4839 8294 6614 8585 8262
0-24 9464 9867 10208 10162 5049 8545 6792 8950 8584
Day of Week
19-Mar-16
MATRIX ATC 7 Day Q1661 Settlement Rd KEPERRA 2016 Volume Summary 6/04/2016

APPENDIX C
CURRENT AND FUTURE YEAR VOLUMES

2015 Volumes (Base)
Thursday AM Peak
7:30-8:30
20 45
1182 1629 10 1664
Samford 866 0 1619 7
Road 445 679 842 13 827
312 163 0 822 6
209 447 78 0 0 8 10
Bunnings Volumes
Thursday AM Peak
(Source: Proposed Keperra Bunnings Development Traffic Engineering Report, April 2013)
-5 27 27
Samford 30 27
Road -13 27 27 27
40 27
39 32
Samford
Road
Samford
Settlement Keperra
Site Access Sanctuary
Road
Road Shopping
Proposed
Site Access Sanctuary
Centre
Proposed
Keperra
Street
Keperra
Keperra
Keperra
Street
Centre
Settlement Keperra
Road Shopping
2020 Background volumes including Bunnings (Estimated year of completion)
Thursday AM Peak
21 46
1207 1697 10 1733
Samford 918 1687 7
Road 443 725 888 13 872
360 163 867 6
253 490 78 8 10
Keperra Quarry Residential Development
Thursday AM Peak
11 218.9
Samford 11 219
Road 61 61 39
39 39
61 219
Samford
Road
Settlement Keperra Proposed Keperra
Centre
Road Shopping Site Access Sanctuary
Centre
Keperra
Street
Road Shopping Site Access Sanctuary
Keperra
Street
Samford
Road
Settlement Keperra Proposed Keperra

2020 Total volumes (Estimated year of completion)
Thursday AM Peak
21 46
1218 1697 10 1952
Samford 918 11 1906 7
Road 504 786 888 13 911
360 163 39 906 6
253 490 78 61 219 8 10
Upper Kedron Volumes (1200 Lot Yield)
Thursday AM Peak
(Source: Proposed Upper Kedron Residential Development Traffic Engineering Report, March 2015)
359 359 359
Samford 179 359
Road 113 113 113 113
113
57
Settlement
Road Shopping Site Access Sanctuary
Keperra Proposed Keperra
Centre
Centre
Keperra
Street
Samford
Road
Keperra
Street
Road Shopping Site Access Sanctuary
Samford
Road
Settlement Keperra Proposed Keperra
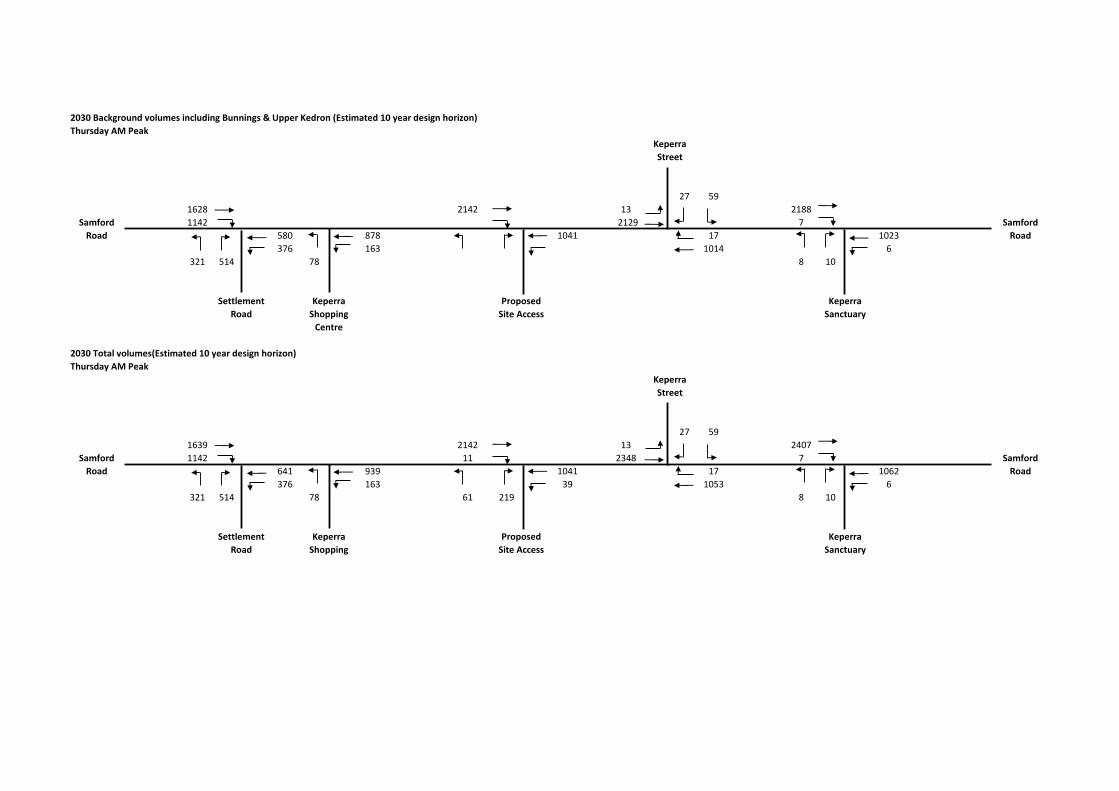
2030 Background volumes including Bunnings & Upper Kedron (Estimated 10 year design horizon)
Thursday AM Peak
27 59
1628 2142 13 2188
Samford 1142 2129 7
Road 580 878 1041 17 1023
376 163 1014 6
321 514 78 8 10
2030 Total volumes(Estimated 10 year design horizon)
Thursday AM Peak
27 59
1639 2142 13 2407
Samford 1142 11 2348 7
Road 641 939 1041 17 1062
376 163 39 1053 6
321 514 78 61 219 8 10
Road Shopping Site Access Sanctuary
Samford
Road
Settlement Keperra Proposed Keperra
Samford
Road
Keperra
Street
Road Shopping Site Access Sanctuary
Centre
Keperra
Street
Settlement Keperra Proposed Keperra

2015 Volumes (Base)
Thursday PM Peak
16:00-17:00
14 31
476 893 35 889
Samford 360 0 858 16
Road 1254 1398 1729 36 1735
311 331 0 1715 12
292 417 167 0 0 16 17
Bunnings Volumes
Thursday PM Peak
(Source: Proposed Keperra Bunnings Development Traffic Engineering Report, April 2013)
-9 53 53
Samford 59 53
Road -25 53 53 53
78 53
75 62
Road Shopping Site Access Sanctuary
Centre
Keperra
Keperra
Street
Samford
Road
Settlement Keperra Proposed Keperra
Road Shopping Site Access Sanctuary
Centre
Street
Samford
Road
Settlement Keperra Proposed Keperra

2020 Background volumes including Bunnings (Estimated year of completion)
Thursday PM Peak
14 32
479 969 36 965
Samford 428 933 16
Road 1261 1491 1822 37 1829
397 331 1808 12
374 490 167 16 17
Keperra Quarry Residential Development
Thursday PM Peak
102 191.6
Samford 102 192
Road 73 73 295
295 295
73 192
Keperra
Road Shopping Site Access Sanctuary
Centre
Keperra
Street
Samford
Road
Settlement Keperra Proposed Keperra
Road Shopping Site Access Sanctuary
Centre
Street
Samford
Road
Settlement Keperra Proposed Keperra

2020 Total volumes (Estimated year of completion)
Thursday PM Peak
14 32
581 969 36 1157
Samford 428 102 1125 16
Road 1334 1564 1822 37 2124
397 331 295 2103 12
374 490 167 73 192 16 17
Upper Kedron Volumes (1200 Lot Yield)
Thursday PM Peak
(Source: Proposed Upper Kedron Residential Development Traffic Engineering Report, March 2015)
141 141 141
Samford 71 141
Road 251 251 251 251
251
125
Keperra
Road Shopping Site Access Sanctuary
Centre
Keperra
Street
Samford
Road
Settlement Keperra Proposed Keperra
Road Shopping Site Access Sanctuary
Centre
Street
Samford
Road
Settlement Keperra Proposed Keperra

2030 Background volumes including Bunnings & Upper Kedron (Estimated 10 year design horizon)
Thursday PM Peak
18 41
645 1156 46 1151
Samford 518 1110 16
Road 1577 1823 2154 47 2167
413 331 2136 12
515 511 167 16 17
2030 Total volumes(Estimated 10 year design horizon)
Thursday PM Peak
18 41
747 1156 46 1343
Samford 518 102 1302 16
Road 1650 1896 2154 47 2462
413 331 295 2431 12
515 511 167 73 192 16 17
Keperra
Road Shopping Site Access Sanctuary
Centre
Keperra
Street
Samford
Road
Settlement Keperra Proposed Keperra
Road Shopping Site Access Sanctuary
Street
Samford
Road
Settlement Keperra Proposed Keperra

2015 Volumes (Base)
Saturday AM Peak
10:30-11:30
24 47
707 1232 23 1256
Samford 498 0 1209 13
Road 729 889 1271 31 1259
330 382 0 1247 13
398 525 170 0 0 19 8
Bunnings Volumes
Saturday AM Peak
(Source: Proposed Keperra Bunnings Development Traffic Engineering Report, April 2013)
-19 142 142
Samford 152 142
Road -21 141 141 141
162 141
154 161
Road Shopping Site Access Sanctuary
Centre
Keperra
Keperra
Street
Samford
Road
Settlement Keperra Proposed Keperra
Road Shopping Site Access Sanctuary
Centre
Street
Samford
Road
Settlement Keperra Proposed Keperra

2020 Background volumes including Bunnings (Estimated year of completion)
Saturday AM Peak
25 48
706 1405 24 1429
Samford 663 1381 13
Road 726 1056 1438 32 1426
500 382 1413 13
562 699 170 19 8
Keperra Quarry Residential Development
Saturday AM Peak
71 195.4
Samford 71 195
Road 81 81 159
159 159
81 195
Keperra
Road Shopping Site Access Sanctuary
Centre
Keperra
Street
Samford
Road
Settlement Keperra Proposed Keperra
Road Shopping Site Access Sanctuary
Centre
Street
Samford
Road
Settlement Keperra Proposed Keperra
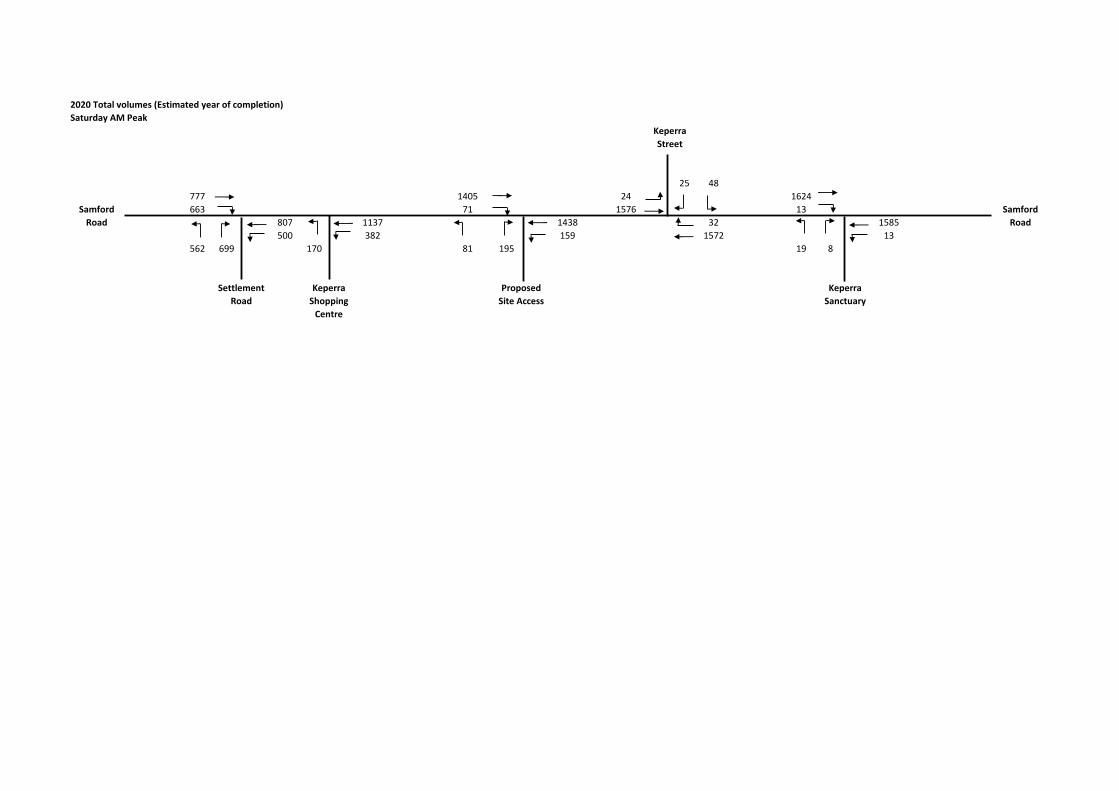
2020 Total volumes (Estimated year of completion)
Saturday AM Peak
25 48
777 1405 24 1624
Samford 663 71 1576 13
Road 807 1137 1438 32 1585
500 382 159 1572 13
562 699 170 81 195 19 8
Keperra
Road Shopping Site Access Sanctuary
Centre
Street
Samford
Road
Settlement Keperra Proposed Keperra

2030 Background volumes including Bunnings (Estimated 10 year design horizon)
Saturday AM Peak
32 61
743 1470 31 1500
Samford 689 1439 13
Road 765 1113 1495 41 1485
518 382 1463 13
583 727 170 19 8
2030 Total volumes(Estimated 10 year design horizon)
Thursday AM Peak
32 61
814 1470 31 1695
Samford 689 71 1634 13
Road 846 1194 1495 41 1644
518 382 159 1622 13
583 727 170 81 195 19 8
Keperra
Road Shopping Site Access Sanctuary
Centre
Keperra
Street
Samford
Road
Settlement Keperra Proposed Keperra
Road Shopping Site Access Sanctuary
Street
Samford
Road
Settlement Keperra Proposed Keperra
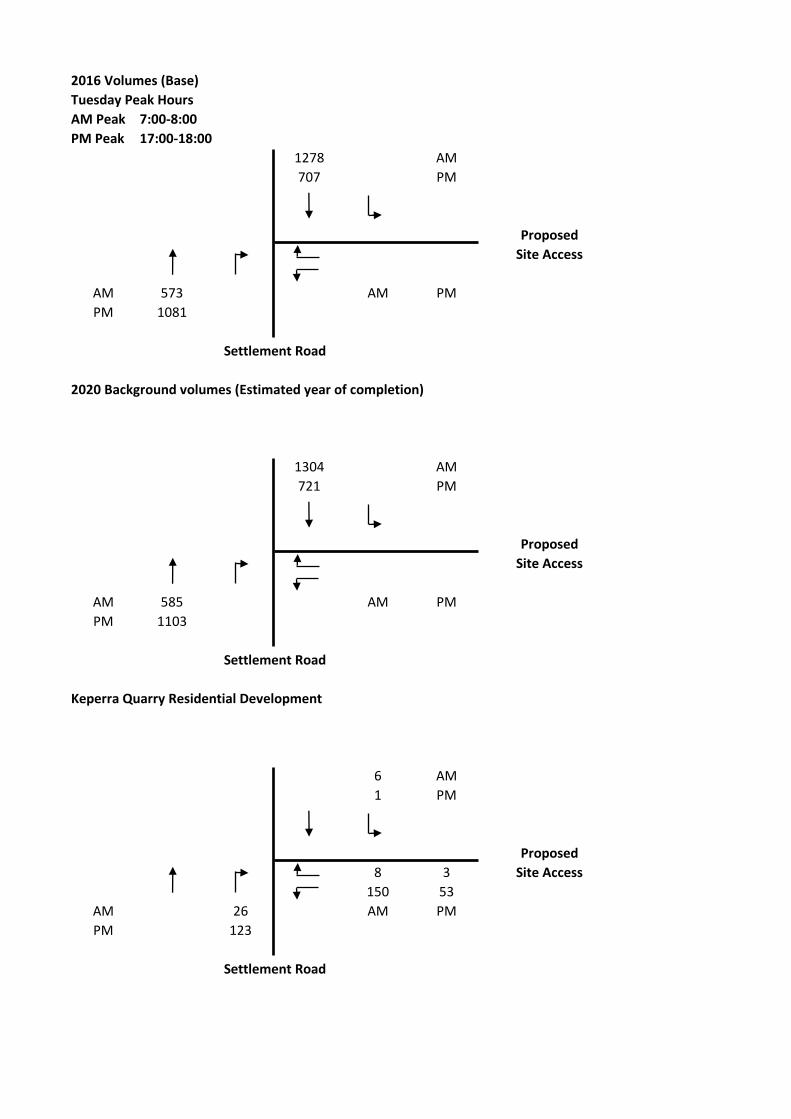
2016 Volumes (Base)
Tuesday Peak Hours
AM Peak 7:00-8:00
PM Peak 17:00-18:00
1278 AM
707 PM
AM 573 AM PM
PM 1081
2020 Background volumes (Estimated year of completion)
1304 AM
721 PM
AM 585 AM PM
PM 1103
Keperra Quarry Residential Development
6 AM
1 PM
8 3
150 53
AM 26 AM PM
PM 123
Settlement Road
Proposed
Site Access
Settlement Road
Proposed
Site Access
Settlement Road
Proposed
Site Access

2020 Total volumes (Estimated year of completion)
1304 6 AM
721 1 PM
8 3
150 53
AM 585 26 AM PM
PM 1103 123
2030 Background volumes (Estimated 10 year design horizon)
1370 AM
758 PM
AM 614 AM PM
PM 1159
2030 Total volumes (Estimated 10 year design horizon)
1370 6 AM
758 1 PM
8 3
150 53
AM 614 26 AM PM
PM 1159 123
Proposed
Site Access
Settlement Road
Settlement Road
Proposed
Site Access
Proposed
Site Access
Settlement Road

APPENDIX D
DETAILED SIDRA INTERSECTION SUMMARIES

SITE LAYOUTSite: 2015 Thu AM Peak
Samford Road / Settlement Road2015 Thursday AM PeakSignals - Fixed Time Isolated
SIDRA INTERSECTION 6.1 | Copyright © 2000-2015 Akcelik and Associates Pty Ltd | sidrasolutions.comOrganisation: LAMBERT AND REHBEIN (SEQ) PTY LTD | Created: Wednesday, 6 April 2016 8:40:07 AMProject: F:\Jobs\B15300\B15323\Design\SIDRA\Samford Rd-Settlement Rd Intersection.sip6
MOVEMENT SUMMARYSite: 2015 Thu AM Peak
Samford Road / Settlement Road2015 Thursday AM PeakSignals - Fixed Time Isolated Cycle Time = 120 seconds (User-Given Cycle Time)
Movement Performance - VehiclesDemand Flows 95% Back of QueueMov
ID ODMov
Deg.Satn
AverageDelay
Level ofService
Prop. Queued
Effective Stop Rate
AverageSpeed Total HV Vehicles Distance
veh/h % v/c sec veh m per veh km/hSouth: Settlement Road1 L2 209 4.3 0.141 8.4 LOS A 2.1 15.2 0.22 0.63 57.43 R2 447 4.3 0.865 70.4 LOS E 15.2 110.5 1.00 0.96 29.1Approach 656 4.3 0.865 50.6 LOS D 15.2 110.5 0.75 0.85 34.6
East: Samford Rd (E)4 L2 312 6.6 0.430 28.1 LOS C 12.4 91.9 0.77 0.85 43.65 T1 445 6.6 0.832 61.7 LOS E 11.5 85.1 0.99 0.91 32.2Approach 757 6.6 0.832 47.8 LOS D 12.4 91.9 0.90 0.88 36.1
West: Samford Road (W)11 T1 1182 2.5 0.411 5.7 LOS A 12.2 87.3 0.39 0.35 63.112 R2 866 2.5 0.997 104.8 LOS F 79.1 565.5 0.86 1.13 22.9Approach 2048 2.5 0.997 47.6 LOS D 79.1 565.5 0.59 0.68 36.3
All Vehicles 3461 3.7 0.997 48.2 LOS D 79.1 565.5 0.69 0.76 35.9
Level of Service (LOS) Method: Delay (HCM 2000). Vehicle movement LOS values are based on average delay per movementIntersection and Approach LOS values are based on average delay for all vehicle movements.SIDRA Standard Delay Model is used. Control Delay includes Geometric Delay.Gap-Acceptance Capacity: SIDRA Standard (Akçelik M3D).HV (%) values are calculated for All Movement Classes of All Heavy Vehicle Model Designation.
Movement Performance - PedestriansAverage Back of QueueMov
ID DescriptionDemand
Flow Average
Delay Level ofService
Prop. Queued
Effective Stop RatePedestrian Distance
ped/h sec ped m per pedP1 South Full Crossing 50 54.3 LOS E 0.2 0.2 0.95 0.95P4 West Full Crossing 50 54.3 LOS E 0.2 0.2 0.95 0.95
All Pedestrians 100 54.3 LOS E 0.95 0.95
Level of Service (LOS) Method: SIDRA Pedestrian LOS Method (Based on Average Delay)Pedestrian movement LOS values are based on average delay per pedestrian movement.Intersection LOS value for Pedestrians is based on average delay for all pedestrian movements.
SIDRA INTERSECTION 6.1 | Copyright © 2000-2015 Akcelik and Associates Pty Ltd | sidrasolutions.comOrganisation: LAMBERT AND REHBEIN (SEQ) PTY LTD | Processed: Wednesday, 6 April 2016 8:39:24 AMProject: F:\Jobs\B15300\B15323\Design\SIDRA\Samford Rd-Settlement Rd Intersection.sip6

MOVEMENT SUMMARYSite: 2015 Thu PM Peak
Samford Road / Settlement Road2015 Thursday PM PeakSignals - Fixed Time Isolated Cycle Time = 120 seconds (User-Given Cycle Time)
Movement Performance - VehiclesDemand Flows 95% Back of QueueMov
ID ODMov
Deg.Satn
AverageDelay
Level ofService
Prop. Queued
Effective Stop Rate
AverageSpeed Total HV Vehicles Distance
veh/h % v/c sec veh m per veh km/hSouth: Settlement Road (S)1 L2 292 0.6 0.271 14.7 LOS B 7.9 55.8 0.52 0.74 53.03 R2 417 0.6 0.676 58.7 LOS E 11.8 83.1 0.99 0.84 32.4Approach 709 0.6 0.676 40.6 LOS D 11.8 83.1 0.80 0.79 38.6
East: Samford Rd (E)4 L2 311 1.3 0.241 11.2 LOS B 5.5 39.0 0.37 0.68 55.75 T1 1254 1.3 0.675 31.3 LOS C 24.6 174.3 0.86 0.76 43.8Approach 1565 1.3 0.675 27.3 LOS C 24.6 174.3 0.76 0.74 45.8
West: Samford Road (W)11 T1 476 3.1 0.170 5.1 LOS A 4.1 29.7 0.33 0.28 63.812 R2 360 3.1 0.679 47.1 LOS D 18.7 134.4 0.94 0.85 35.8Approach 836 3.1 0.679 23.2 LOS C 18.7 134.4 0.59 0.52 47.7
All Vehicles 3110 1.6 0.679 29.2 LOS C 24.6 174.3 0.72 0.70 44.4
Level of Service (LOS) Method: Delay (HCM 2000). Vehicle movement LOS values are based on average delay per movementIntersection and Approach LOS values are based on average delay for all vehicle movements.SIDRA Standard Delay Model is used. Control Delay includes Geometric Delay.Gap-Acceptance Capacity: SIDRA Standard (Akçelik M3D).HV (%) values are calculated for All Movement Classes of All Heavy Vehicle Model Designation.
Movement Performance - PedestriansAverage Back of QueueMov
ID DescriptionDemand
Flow Average
Delay Level ofService
Prop. Queued
Effective Stop RatePedestrian Distance
ped/h sec ped m per pedP1 South Full Crossing 50 30.2 LOS D 0.1 0.1 0.71 0.71P4 West Full Crossing 50 54.3 LOS E 0.2 0.2 0.95 0.95
All Pedestrians 100 42.2 LOS E 0.83 0.83
Level of Service (LOS) Method: SIDRA Pedestrian LOS Method (Based on Average Delay)Pedestrian movement LOS values are based on average delay per pedestrian movement.Intersection LOS value for Pedestrians is based on average delay for all pedestrian movements.
SIDRA INTERSECTION 6.1 | Copyright © 2000-2015 Akcelik and Associates Pty Ltd | sidrasolutions.comOrganisation: LAMBERT AND REHBEIN (SEQ) PTY LTD | Processed: Wednesday, 6 April 2016 8:39:26 AMProject: F:\Jobs\B15300\B15323\Design\SIDRA\Samford Rd-Settlement Rd Intersection.sip6
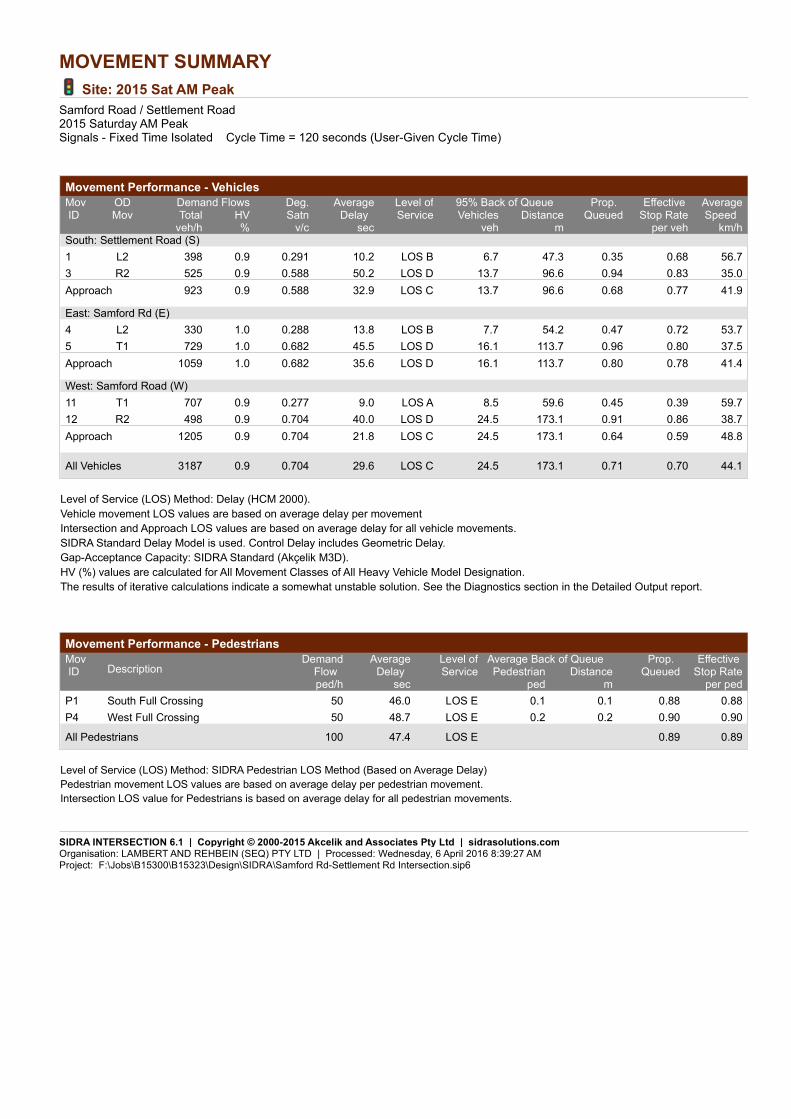
MOVEMENT SUMMARYSite: 2015 Sat AM Peak
Samford Road / Settlement Road2015 Saturday AM PeakSignals - Fixed Time Isolated Cycle Time = 120 seconds (User-Given Cycle Time)
Movement Performance - VehiclesDemand Flows 95% Back of QueueMov
ID ODMov
Deg.Satn
AverageDelay
Level ofService
Prop. Queued
Effective Stop Rate
AverageSpeed Total HV Vehicles Distance
veh/h % v/c sec veh m per veh km/hSouth: Settlement Road (S)1 L2 398 0.9 0.291 10.2 LOS B 6.7 47.3 0.35 0.68 56.73 R2 525 0.9 0.588 50.2 LOS D 13.7 96.6 0.94 0.83 35.0Approach 923 0.9 0.588 32.9 LOS C 13.7 96.6 0.68 0.77 41.9
East: Samford Rd (E)4 L2 330 1.0 0.288 13.8 LOS B 7.7 54.2 0.47 0.72 53.75 T1 729 1.0 0.682 45.5 LOS D 16.1 113.7 0.96 0.80 37.5Approach 1059 1.0 0.682 35.6 LOS D 16.1 113.7 0.80 0.78 41.4
West: Samford Road (W)11 T1 707 0.9 0.277 9.0 LOS A 8.5 59.6 0.45 0.39 59.712 R2 498 0.9 0.704 40.0 LOS D 24.5 173.1 0.91 0.86 38.7Approach 1205 0.9 0.704 21.8 LOS C 24.5 173.1 0.64 0.59 48.8
All Vehicles 3187 0.9 0.704 29.6 LOS C 24.5 173.1 0.71 0.70 44.1
Level of Service (LOS) Method: Delay (HCM 2000). Vehicle movement LOS values are based on average delay per movementIntersection and Approach LOS values are based on average delay for all vehicle movements.SIDRA Standard Delay Model is used. Control Delay includes Geometric Delay.Gap-Acceptance Capacity: SIDRA Standard (Akçelik M3D).HV (%) values are calculated for All Movement Classes of All Heavy Vehicle Model Designation.The results of iterative calculations indicate a somewhat unstable solution. See the Diagnostics section in the Detailed Output report.
Movement Performance - PedestriansAverage Back of QueueMov
ID DescriptionDemand
Flow Average
Delay Level ofService
Prop. Queued
Effective Stop RatePedestrian Distance
ped/h sec ped m per pedP1 South Full Crossing 50 46.0 LOS E 0.1 0.1 0.88 0.88P4 West Full Crossing 50 48.7 LOS E 0.2 0.2 0.90 0.90
All Pedestrians 100 47.4 LOS E 0.89 0.89
Level of Service (LOS) Method: SIDRA Pedestrian LOS Method (Based on Average Delay)Pedestrian movement LOS values are based on average delay per pedestrian movement.Intersection LOS value for Pedestrians is based on average delay for all pedestrian movements.
SIDRA INTERSECTION 6.1 | Copyright © 2000-2015 Akcelik and Associates Pty Ltd | sidrasolutions.comOrganisation: LAMBERT AND REHBEIN (SEQ) PTY LTD | Processed: Wednesday, 6 April 2016 8:39:27 AMProject: F:\Jobs\B15300\B15323\Design\SIDRA\Samford Rd-Settlement Rd Intersection.sip6

SITE LAYOUTSite: 2020 Thu AM Peak
Samford Road / Settlement Road2020 Thursday AM Peak (Without Development)Signals - Fixed Time Isolated
SIDRA INTERSECTION 6.1 | Copyright © 2000-2015 Akcelik and Associates Pty Ltd | sidrasolutions.comOrganisation: LAMBERT AND REHBEIN (SEQ) PTY LTD | Created: Wednesday, 6 April 2016 8:40:22 AMProject: F:\Jobs\B15300\B15323\Design\SIDRA\Samford Rd-Settlement Rd Intersection.sip6

MOVEMENT SUMMARYSite: 2020 Thu AM Peak
Samford Road / Settlement Road2020 Thursday AM Peak (Without Development)Signals - Fixed Time Isolated Cycle Time = 120 seconds (User-Given Cycle Time)
Movement Performance - VehiclesDemand Flows 95% Back of QueueMov
ID ODMov
Deg.Satn
AverageDelay
Level ofService
Prop. Queued
Effective Stop Rate
AverageSpeed Total HV Vehicles Distance
veh/h % v/c sec veh m per veh km/hSouth: Settlement Road (S)1 L2 253 4.3 0.179 8.9 LOS A 3.0 21.9 0.26 0.65 57.03 R2 490 4.3 0.699 53.9 LOS D 15.1 109.6 0.96 0.84 33.4Approach 743 4.3 0.699 38.6 LOS D 15.1 109.6 0.72 0.78 38.9
East: Samford Rd (E)4 L2 360 6.6 0.358 13.8 LOS B 9.7 71.9 0.53 0.75 52.55 T1 443 6.6 0.646 49.7 LOS D 12.2 90.5 0.98 0.82 35.9Approach 803 6.6 0.646 33.6 LOS C 12.2 90.5 0.78 0.78 41.9
West: Samford Road (W)11 T1 1207 2.5 0.460 9.3 LOS A 16.0 114.3 0.50 0.45 59.512 R2 918 2.5 0.614 32.4 LOS C 19.6 139.9 0.79 0.82 41.8Approach 2125 2.5 0.614 19.2 LOS B 19.6 139.9 0.62 0.61 50.3
All Vehicles 3671 3.8 0.699 26.3 LOS C 19.6 139.9 0.68 0.68 45.6
Level of Service (LOS) Method: Delay (HCM 2000). Vehicle movement LOS values are based on average delay per movementIntersection and Approach LOS values are based on average delay for all vehicle movements.SIDRA Standard Delay Model is used. Control Delay includes Geometric Delay.Gap-Acceptance Capacity: SIDRA Standard (Akçelik M3D).HV (%) values are calculated for All Movement Classes of All Heavy Vehicle Model Designation.
Movement Performance - PedestriansAverage Back of QueueMov
ID DescriptionDemand
Flow Average
Delay Level ofService
Prop. Queued
Effective Stop RatePedestrian Distance
ped/h sec ped m per pedP1 South Full Crossing 50 50.5 LOS E 0.2 0.2 0.92 0.92P4 West Full Crossing 50 51.4 LOS E 0.2 0.2 0.93 0.93
All Pedestrians 100 51.0 LOS E 0.92 0.92
Level of Service (LOS) Method: SIDRA Pedestrian LOS Method (Based on Average Delay)Pedestrian movement LOS values are based on average delay per pedestrian movement.Intersection LOS value for Pedestrians is based on average delay for all pedestrian movements.
SIDRA INTERSECTION 6.1 | Copyright © 2000-2015 Akcelik and Associates Pty Ltd | sidrasolutions.comOrganisation: LAMBERT AND REHBEIN (SEQ) PTY LTD | Processed: Wednesday, 6 April 2016 8:39:28 AMProject: F:\Jobs\B15300\B15323\Design\SIDRA\Samford Rd-Settlement Rd Intersection.sip6

MOVEMENT SUMMARYSite: 2020 Thu PM Peak
Samford Road / Settlement Road2020 Thursday PM Peak (Without Development)Signals - Fixed Time Isolated Cycle Time = 120 seconds (User-Given Cycle Time)
Movement Performance - VehiclesDemand Flows 95% Back of QueueMov
ID ODMov
Deg.Satn
AverageDelay
Level ofService
Prop. Queued
Effective Stop Rate
AverageSpeed Total HV Vehicles Distance
veh/h % v/c sec veh m per veh km/hSouth: Settlement Road (S)1 L2 374 0.6 0.407 23.2 LOS C 12.6 88.5 0.67 0.85 47.43 R2 490 0.6 0.611 52.7 LOS D 13.1 92.2 0.96 0.83 34.1Approach 864 0.6 0.611 39.9 LOS D 13.1 92.2 0.84 0.84 38.8
East: Samford Rd (E)4 L2 397 1.3 0.272 9.0 LOS A 5.1 36.3 0.28 0.66 57.65 T1 1261 1.3 0.743 26.3 LOS C 32.0 226.8 0.84 0.76 46.7Approach 1658 1.3 0.743 22.1 LOS C 32.0 226.8 0.71 0.74 48.9
West: Samford Road (W)11 T1 479 3.1 0.183 7.2 LOS A 4.9 35.6 0.39 0.33 61.512 R2 428 3.1 0.744 61.7 LOS E 12.6 90.7 1.00 0.86 31.3Approach 907 3.1 0.744 32.9 LOS C 12.6 90.7 0.68 0.58 42.2
All Vehicles 3429 1.6 0.744 29.5 LOS C 32.0 226.8 0.73 0.72 44.2
Level of Service (LOS) Method: Delay (HCM 2000). Vehicle movement LOS values are based on average delay per movementIntersection and Approach LOS values are based on average delay for all vehicle movements.SIDRA Standard Delay Model is used. Control Delay includes Geometric Delay.Gap-Acceptance Capacity: SIDRA Standard (Akçelik M3D).HV (%) values are calculated for All Movement Classes of All Heavy Vehicle Model Designation.The results of iterative calculations indicate a somewhat unstable solution. See the Diagnostics section in the Detailed Output report.
Movement Performance - PedestriansAverage Back of QueueMov
ID DescriptionDemand
Flow Average
Delay Level ofService
Prop. Queued
Effective Stop RatePedestrian Distance
ped/h sec ped m per pedP1 South Full Crossing 50 23.5 LOS C 0.1 0.1 0.63 0.63P4 West Full Crossing 50 51.4 LOS E 0.2 0.2 0.93 0.93
All Pedestrians 100 37.5 LOS D 0.78 0.78
Level of Service (LOS) Method: SIDRA Pedestrian LOS Method (Based on Average Delay)Pedestrian movement LOS values are based on average delay per pedestrian movement.Intersection LOS value for Pedestrians is based on average delay for all pedestrian movements.
SIDRA INTERSECTION 6.1 | Copyright © 2000-2015 Akcelik and Associates Pty Ltd | sidrasolutions.comOrganisation: LAMBERT AND REHBEIN (SEQ) PTY LTD | Processed: Wednesday, 6 April 2016 8:39:30 AMProject: F:\Jobs\B15300\B15323\Design\SIDRA\Samford Rd-Settlement Rd Intersection.sip6

MOVEMENT SUMMARYSite: 2020 Sat AM Peak
Samford Road / Settlement Road2020 Saturday AM Peak (Without Development)Signals - Fixed Time Isolated Cycle Time = 120 seconds (User-Given Cycle Time)
Movement Performance - VehiclesDemand Flows 95% Back of QueueMov
ID ODMov
Deg.Satn
AverageDelay
Level ofService
Prop. Queued
Effective Stop Rate
AverageSpeed Total HV Vehicles Distance
veh/h % v/c sec veh m per veh km/hSouth: Settlement Road (S)1 L2 562 0.9 0.430 13.2 LOS B 11.1 78.6 0.45 0.76 54.33 R2 699 0.9 0.554 40.9 LOS D 16.6 116.9 0.87 0.83 38.2Approach 1261 0.9 0.554 28.6 LOS C 16.6 116.9 0.68 0.80 44.0
East: Samford Rd (E)4 L2 500 1.0 0.378 12.1 LOS B 9.6 67.9 0.42 0.73 55.15 T1 726 1.0 0.725 44.5 LOS D 19.7 139.0 0.97 0.85 37.9Approach 1226 1.0 0.725 31.3 LOS C 19.7 139.0 0.75 0.80 43.4
West: Samford Road (W)11 T1 706 0.9 0.326 15.1 LOS B 11.0 77.3 0.58 0.50 54.312 R2 663 0.9 0.719 51.7 LOS D 18.1 127.6 0.97 0.86 34.4Approach 1369 0.9 0.719 32.9 LOS C 18.1 127.6 0.77 0.68 42.4
All Vehicles 3856 0.9 0.725 31.0 LOS C 19.7 139.0 0.73 0.76 43.3
Level of Service (LOS) Method: Delay (HCM 2000). Vehicle movement LOS values are based on average delay per movementIntersection and Approach LOS values are based on average delay for all vehicle movements.SIDRA Standard Delay Model is used. Control Delay includes Geometric Delay.Gap-Acceptance Capacity: SIDRA Standard (Akçelik M3D).HV (%) values are calculated for All Movement Classes of All Heavy Vehicle Model Designation.The results of iterative calculations indicate a somewhat unstable solution. See the Diagnostics section in the Detailed Output report.
Movement Performance - PedestriansAverage Back of QueueMov
ID DescriptionDemand
Flow Average
Delay Level ofService
Prop. Queued
Effective Stop RatePedestrian Distance
ped/h sec ped m per pedP1 South Full Crossing 50 42.6 LOS E 0.1 0.1 0.84 0.84P4 West Full Crossing 50 38.5 LOS D 0.1 0.1 0.80 0.80
All Pedestrians 100 40.5 LOS E 0.82 0.82
Level of Service (LOS) Method: SIDRA Pedestrian LOS Method (Based on Average Delay)Pedestrian movement LOS values are based on average delay per pedestrian movement.Intersection LOS value for Pedestrians is based on average delay for all pedestrian movements.
SIDRA INTERSECTION 6.1 | Copyright © 2000-2015 Akcelik and Associates Pty Ltd | sidrasolutions.comOrganisation: LAMBERT AND REHBEIN (SEQ) PTY LTD | Processed: Wednesday, 6 April 2016 8:39:31 AMProject: F:\Jobs\B15300\B15323\Design\SIDRA\Samford Rd-Settlement Rd Intersection.sip6

MOVEMENT SUMMARYSite: 2020 Thu AM Peak - With Dev
Samford Road / Settlement Road2020 Thursday AM Peak (With Development)Signals - Fixed Time Isolated Cycle Time = 120 seconds (User-Given Cycle Time)
Movement Performance - VehiclesDemand Flows 95% Back of QueueMov
ID ODMov
Deg.Satn
AverageDelay
Level ofService
Prop. Queued
Effective Stop Rate
AverageSpeed Total HV Vehicles Distance
veh/h % v/c sec veh m per veh km/hSouth: Settlement Road (S)1 L2 253 4.3 0.183 9.2 LOS A 3.3 23.6 0.28 0.66 56.73 R2 490 4.3 0.604 51.9 LOS D 13.0 94.5 0.95 0.83 34.0Approach 743 4.3 0.604 37.4 LOS D 13.0 94.5 0.72 0.77 39.4
East: Samford Rd (E)4 L2 360 6.6 0.349 14.1 LOS B 9.8 72.5 0.53 0.75 52.25 T1 504 6.6 0.674 48.7 LOS D 13.9 102.7 0.98 0.83 36.3Approach 864 6.6 0.674 34.3 LOS C 13.9 102.7 0.79 0.79 41.6
West: Samford Road (W)11 T1 1218 2.5 0.470 9.8 LOS A 16.6 118.9 0.51 0.47 59.012 R2 918 2.5 0.683 34.8 LOS C 20.5 146.6 0.82 0.83 40.6Approach 2136 2.5 0.683 20.5 LOS C 20.5 146.6 0.65 0.62 49.4
All Vehicles 3743 3.8 0.683 27.1 LOS C 20.5 146.6 0.70 0.69 45.2
Level of Service (LOS) Method: Delay (HCM 2000). Vehicle movement LOS values are based on average delay per movementIntersection and Approach LOS values are based on average delay for all vehicle movements.SIDRA Standard Delay Model is used. Control Delay includes Geometric Delay.Gap-Acceptance Capacity: SIDRA Standard (Akçelik M3D).HV (%) values are calculated for All Movement Classes of All Heavy Vehicle Model Designation.The results of iterative calculations indicate a somewhat unstable solution. See the Diagnostics section in the Detailed Output report.
Movement Performance - PedestriansAverage Back of QueueMov
ID DescriptionDemand
Flow Average
Delay Level ofService
Prop. Queued
Effective Stop RatePedestrian Distance
ped/h sec ped m per pedP1 South Full Crossing 50 48.7 LOS E 0.2 0.2 0.90 0.90P4 West Full Crossing 50 50.5 LOS E 0.2 0.2 0.92 0.92
All Pedestrians 100 49.6 LOS E 0.91 0.91
Level of Service (LOS) Method: SIDRA Pedestrian LOS Method (Based on Average Delay)Pedestrian movement LOS values are based on average delay per pedestrian movement.Intersection LOS value for Pedestrians is based on average delay for all pedestrian movements.
SIDRA INTERSECTION 6.1 | Copyright © 2000-2015 Akcelik and Associates Pty Ltd | sidrasolutions.comOrganisation: LAMBERT AND REHBEIN (SEQ) PTY LTD | Processed: Wednesday, 6 April 2016 8:39:32 AMProject: F:\Jobs\B15300\B15323\Design\SIDRA\Samford Rd-Settlement Rd Intersection.sip6

MOVEMENT SUMMARYSite: 2020 Thu PM Peak - With Dev
Samford Road / Settlement Road2020 Thursday PM Peak (With Development)Signals - Fixed Time Isolated Cycle Time = 120 seconds (User-Given Cycle Time)
Movement Performance - VehiclesDemand Flows 95% Back of QueueMov
ID ODMov
Deg.Satn
AverageDelay
Level ofService
Prop. Queued
Effective Stop Rate
AverageSpeed Total HV Vehicles Distance
veh/h % v/c sec veh m per veh km/hSouth: Settlement Road (S)1 L2 374 0.6 0.420 25.4 LOS C 12.9 90.6 0.70 0.87 46.03 R2 490 0.6 0.636 53.8 LOS D 13.3 93.3 0.97 0.83 33.7Approach 864 0.6 0.636 41.5 LOS D 13.3 93.3 0.85 0.85 38.2
East: Samford Rd (E)4 L2 397 1.3 0.272 9.0 LOS A 5.1 36.3 0.28 0.66 57.65 T1 1334 1.3 0.782 26.6 LOS C 35.1 248.7 0.86 0.78 46.5Approach 1731 1.3 0.782 22.6 LOS C 35.1 248.7 0.73 0.75 48.6
West: Samford Road (W)11 T1 581 3.1 0.220 7.1 LOS A 6.0 43.3 0.39 0.34 61.712 R2 428 3.1 0.744 61.7 LOS E 12.6 90.7 1.00 0.86 31.3Approach 1009 3.1 0.744 30.2 LOS C 12.6 90.7 0.65 0.56 43.7
All Vehicles 3604 1.6 0.782 29.2 LOS C 35.1 248.7 0.73 0.72 44.3
Level of Service (LOS) Method: Delay (HCM 2000). Vehicle movement LOS values are based on average delay per movementIntersection and Approach LOS values are based on average delay for all vehicle movements.SIDRA Standard Delay Model is used. Control Delay includes Geometric Delay.Gap-Acceptance Capacity: SIDRA Standard (Akçelik M3D).HV (%) values are calculated for All Movement Classes of All Heavy Vehicle Model Designation.The results of iterative calculations indicate a somewhat unstable solution. See the Diagnostics section in the Detailed Output report.
Movement Performance - PedestriansAverage Back of QueueMov
ID DescriptionDemand
Flow Average
Delay Level ofService
Prop. Queued
Effective Stop RatePedestrian Distance
ped/h sec ped m per pedP1 South Full Crossing 50 22.9 LOS C 0.1 0.1 0.62 0.62P4 West Full Crossing 50 52.4 LOS E 0.2 0.2 0.94 0.94
All Pedestrians 100 37.6 LOS D 0.78 0.78
Level of Service (LOS) Method: SIDRA Pedestrian LOS Method (Based on Average Delay)Pedestrian movement LOS values are based on average delay per pedestrian movement.Intersection LOS value for Pedestrians is based on average delay for all pedestrian movements.
SIDRA INTERSECTION 6.1 | Copyright © 2000-2015 Akcelik and Associates Pty Ltd | sidrasolutions.comOrganisation: LAMBERT AND REHBEIN (SEQ) PTY LTD | Processed: Wednesday, 6 April 2016 8:39:33 AMProject: F:\Jobs\B15300\B15323\Design\SIDRA\Samford Rd-Settlement Rd Intersection.sip6
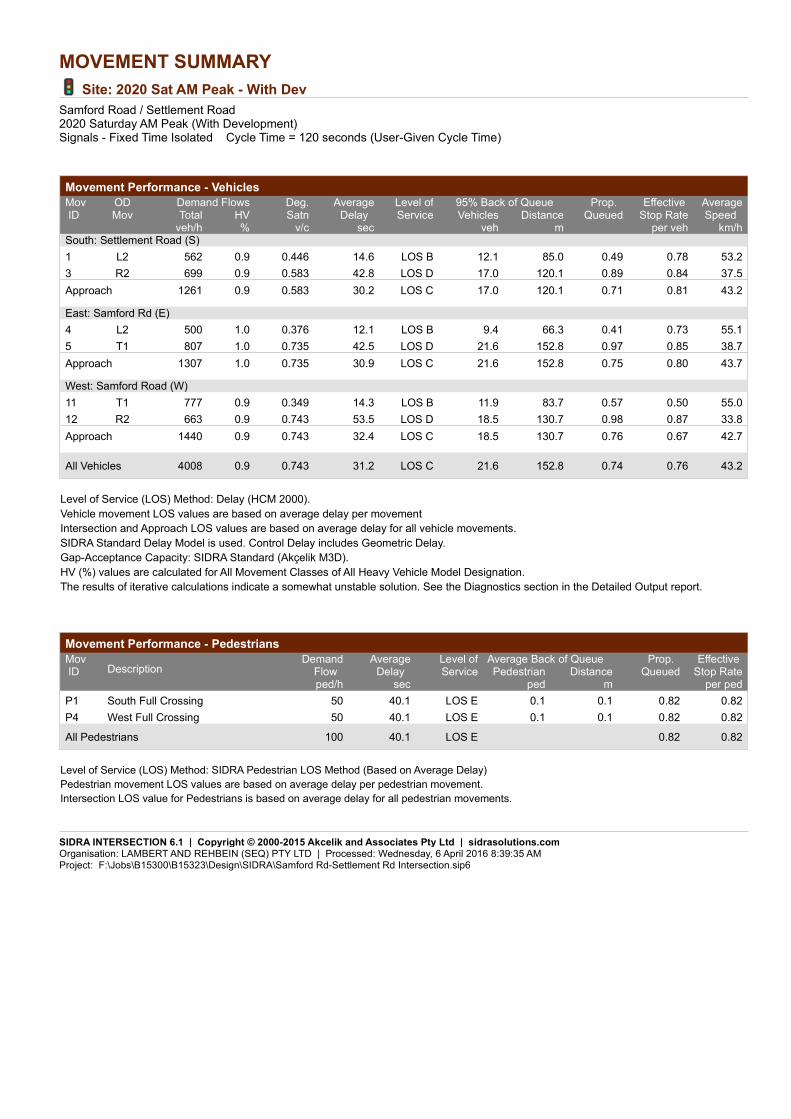
MOVEMENT SUMMARYSite: 2020 Sat AM Peak - With Dev
Samford Road / Settlement Road2020 Saturday AM Peak (With Development)Signals - Fixed Time Isolated Cycle Time = 120 seconds (User-Given Cycle Time)
Movement Performance - VehiclesDemand Flows 95% Back of QueueMov
ID ODMov
Deg.Satn
AverageDelay
Level ofService
Prop. Queued
Effective Stop Rate
AverageSpeed Total HV Vehicles Distance
veh/h % v/c sec veh m per veh km/hSouth: Settlement Road (S)1 L2 562 0.9 0.446 14.6 LOS B 12.1 85.0 0.49 0.78 53.23 R2 699 0.9 0.583 42.8 LOS D 17.0 120.1 0.89 0.84 37.5Approach 1261 0.9 0.583 30.2 LOS C 17.0 120.1 0.71 0.81 43.2
East: Samford Rd (E)4 L2 500 1.0 0.376 12.1 LOS B 9.4 66.3 0.41 0.73 55.15 T1 807 1.0 0.735 42.5 LOS D 21.6 152.8 0.97 0.85 38.7Approach 1307 1.0 0.735 30.9 LOS C 21.6 152.8 0.75 0.80 43.7
West: Samford Road (W)11 T1 777 0.9 0.349 14.3 LOS B 11.9 83.7 0.57 0.50 55.012 R2 663 0.9 0.743 53.5 LOS D 18.5 130.7 0.98 0.87 33.8Approach 1440 0.9 0.743 32.4 LOS C 18.5 130.7 0.76 0.67 42.7
All Vehicles 4008 0.9 0.743 31.2 LOS C 21.6 152.8 0.74 0.76 43.2
Level of Service (LOS) Method: Delay (HCM 2000). Vehicle movement LOS values are based on average delay per movementIntersection and Approach LOS values are based on average delay for all vehicle movements.SIDRA Standard Delay Model is used. Control Delay includes Geometric Delay.Gap-Acceptance Capacity: SIDRA Standard (Akçelik M3D).HV (%) values are calculated for All Movement Classes of All Heavy Vehicle Model Designation.The results of iterative calculations indicate a somewhat unstable solution. See the Diagnostics section in the Detailed Output report.
Movement Performance - PedestriansAverage Back of QueueMov
ID DescriptionDemand
Flow Average
Delay Level ofService
Prop. Queued
Effective Stop RatePedestrian Distance
ped/h sec ped m per pedP1 South Full Crossing 50 40.1 LOS E 0.1 0.1 0.82 0.82P4 West Full Crossing 50 40.1 LOS E 0.1 0.1 0.82 0.82
All Pedestrians 100 40.1 LOS E 0.82 0.82
Level of Service (LOS) Method: SIDRA Pedestrian LOS Method (Based on Average Delay)Pedestrian movement LOS values are based on average delay per pedestrian movement.Intersection LOS value for Pedestrians is based on average delay for all pedestrian movements.
SIDRA INTERSECTION 6.1 | Copyright © 2000-2015 Akcelik and Associates Pty Ltd | sidrasolutions.comOrganisation: LAMBERT AND REHBEIN (SEQ) PTY LTD | Processed: Wednesday, 6 April 2016 8:39:35 AMProject: F:\Jobs\B15300\B15323\Design\SIDRA\Samford Rd-Settlement Rd Intersection.sip6

SITE LAYOUTSite: 2030 Thu AM Peak
Samford Road / Settlement Road2030 Thursday AM Peak (Without Development)Signals - Fixed Time Isolated
SIDRA INTERSECTION 6.1 | Copyright © 2000-2015 Akcelik and Associates Pty Ltd | sidrasolutions.comOrganisation: LAMBERT AND REHBEIN (SEQ) PTY LTD | Created: Wednesday, 6 April 2016 8:41:20 AMProject: F:\Jobs\B15300\B15323\Design\SIDRA\Samford Rd-Settlement Rd Intersection.sip6

MOVEMENT SUMMARYSite: 2030 Thu AM Peak
Samford Road / Settlement Road2030 Thursday AM Peak (Without Development)Signals - Fixed Time Isolated Cycle Time = 120 seconds (User-Given Cycle Time)
Movement Performance - VehiclesDemand Flows 95% Back of QueueMov
ID ODMov
Deg.Satn
AverageDelay
Level ofService
Prop. Queued
Effective Stop Rate
AverageSpeed Total HV Vehicles Distance
veh/h % v/c sec veh m per veh km/hSouth: Settlement Road (S)1 L2 321 4.3 0.236 10.1 LOS B 4.9 35.7 0.32 0.67 56.03 R2 514 4.3 0.778 60.9 LOS E 15.3 111.0 1.00 0.88 31.4Approach 835 4.3 0.778 41.3 LOS D 15.3 111.0 0.74 0.80 37.8
East: Samford Rd (E)4 L2 376 6.7 0.408 20.2 LOS C 12.3 91.2 0.65 0.83 48.15 T1 580 6.5 0.775 52.4 LOS D 17.0 125.7 1.00 0.90 35.0Approach 956 6.6 0.775 39.7 LOS D 17.0 125.7 0.86 0.87 39.2
West: Samford Road (W)11 T1 1628 2.5 0.592 8.8 LOS A 23.0 164.2 0.53 0.49 59.912 R2 1142 2.5 0.785 34.4 LOS C 26.5 189.3 0.84 0.86 40.8Approach 2770 2.5 0.785 19.4 LOS B 26.5 189.3 0.66 0.64 50.2
All Vehicles 4561 3.7 0.785 27.7 LOS C 26.5 189.3 0.72 0.72 44.9
Level of Service (LOS) Method: Delay (HCM 2000). Vehicle movement LOS values are based on average delay per movementIntersection and Approach LOS values are based on average delay for all vehicle movements.SIDRA Standard Delay Model is used. Control Delay includes Geometric Delay.Gap-Acceptance Capacity: SIDRA Standard (Akçelik M3D).HV (%) values are calculated for All Movement Classes of All Heavy Vehicle Model Designation.
Movement Performance - PedestriansAverage Back of QueueMov
ID DescriptionDemand
Flow Average
Delay Level ofService
Prop. Queued
Effective Stop RatePedestrian Distance
ped/h sec ped m per pedP1 South Full Crossing 50 48.7 LOS E 0.2 0.2 0.90 0.90P4 West Full Crossing 50 54.3 LOS E 0.2 0.2 0.95 0.95
All Pedestrians 100 51.5 LOS E 0.93 0.93
Level of Service (LOS) Method: SIDRA Pedestrian LOS Method (Based on Average Delay)Pedestrian movement LOS values are based on average delay per pedestrian movement.Intersection LOS value for Pedestrians is based on average delay for all pedestrian movements.
SIDRA INTERSECTION 6.1 | Copyright © 2000-2015 Akcelik and Associates Pty Ltd | sidrasolutions.comOrganisation: LAMBERT AND REHBEIN (SEQ) PTY LTD | Processed: Wednesday, 6 April 2016 8:39:36 AMProject: F:\Jobs\B15300\B15323\Design\SIDRA\Samford Rd-Settlement Rd Intersection.sip6

MOVEMENT SUMMARYSite: 2030 Thu PM Peak
Samford Road / Settlement Road2030 Thursday PM Peak (Without Development)Signals - Fixed Time Isolated Cycle Time = 120 seconds (User-Given Cycle Time)
Movement Performance - VehiclesDemand Flows 95% Back of QueueMov
ID ODMov
Deg.Satn
AverageDelay
Level ofService
Prop. Queued
Effective Stop Rate
AverageSpeed Total HV Vehicles Distance
veh/h % v/c sec veh m per veh km/hSouth: Settlement Road (S)1 L2 515 0.7 0.654 36.5 LOS D 19.6 138.2 0.85 0.98 40.43 R2 511 0.5 0.872 70.3 LOS E 16.7 117.5 1.00 0.95 29.3Approach 1026 0.6 0.872 53.3 LOS D 19.6 138.2 0.93 0.97 34.0
East: Samford Rd (E)4 L2 413 1.3 0.289 10.0 LOS A 5.9 41.7 0.31 0.68 56.85 T1 1577 1.3 0.870 32.2 LOS C 49.0 347.1 0.88 0.88 43.4Approach 1990 1.3 0.870 27.6 LOS C 49.0 347.1 0.76 0.84 45.6
West: Samford Road (W)11 T1 645 3.2 0.228 5.1 LOS A 5.7 41.1 0.33 0.29 63.812 R2 518 3.1 0.855 67.9 LOS E 16.6 119.3 1.00 0.94 29.7Approach 1163 3.2 0.855 33.1 LOS C 16.6 119.3 0.63 0.58 42.2
All Vehicles 4179 1.6 0.872 35.4 LOS D 49.0 347.1 0.77 0.80 41.2
Level of Service (LOS) Method: Delay (HCM 2000). Vehicle movement LOS values are based on average delay per movementIntersection and Approach LOS values are based on average delay for all vehicle movements.SIDRA Standard Delay Model is used. Control Delay includes Geometric Delay.Gap-Acceptance Capacity: SIDRA Standard (Akçelik M3D).HV (%) values are calculated for All Movement Classes of All Heavy Vehicle Model Designation.
Movement Performance - PedestriansAverage Back of QueueMov
ID DescriptionDemand
Flow Average
Delay Level ofService
Prop. Queued
Effective Stop RatePedestrian Distance
ped/h sec ped m per pedP1 South Full Crossing 50 19.9 LOS B 0.1 0.1 0.58 0.58P4 West Full Crossing 50 54.3 LOS E 0.2 0.2 0.95 0.95
All Pedestrians 100 37.1 LOS D 0.76 0.76
Level of Service (LOS) Method: SIDRA Pedestrian LOS Method (Based on Average Delay)Pedestrian movement LOS values are based on average delay per pedestrian movement.Intersection LOS value for Pedestrians is based on average delay for all pedestrian movements.
SIDRA INTERSECTION 6.1 | Copyright © 2000-2015 Akcelik and Associates Pty Ltd | sidrasolutions.comOrganisation: LAMBERT AND REHBEIN (SEQ) PTY LTD | Processed: Wednesday, 6 April 2016 8:39:37 AMProject: F:\Jobs\B15300\B15323\Design\SIDRA\Samford Rd-Settlement Rd Intersection.sip6

MOVEMENT SUMMARYSite: 2030 Sat AM Peak
Samford Road / Settlement Road2030 Saturday AM Peak (Without Development)Signals - Fixed Time Isolated Cycle Time = 120 seconds (User-Given Cycle Time)
Movement Performance - VehiclesDemand Flows 95% Back of QueueMov
ID ODMov
Deg.Satn
AverageDelay
Level ofService
Prop. Queued
Effective Stop Rate
AverageSpeed Total HV Vehicles Distance
veh/h % v/c sec veh m per veh km/hSouth: Settlement Road (S)1 L2 583 0.9 0.453 14.0 LOS B 11.9 84.0 0.48 0.77 53.63 R2 727 0.9 0.606 43.1 LOS D 17.9 126.1 0.90 0.84 37.4Approach 1310 0.9 0.606 30.2 LOS C 17.9 126.1 0.71 0.81 43.2
East: Samford Rd (E)4 L2 518 1.0 0.396 12.7 LOS B 10.2 72.3 0.43 0.74 54.65 T1 765 1.0 0.740 44.3 LOS D 20.9 147.3 0.98 0.86 37.9Approach 1283 1.0 0.740 31.6 LOS C 20.9 147.3 0.76 0.81 43.3
West: Samford Road (W)11 T1 743 0.9 0.333 14.2 LOS B 11.2 79.1 0.56 0.49 55.112 R2 689 0.9 0.723 51.1 LOS D 18.7 132.2 0.97 0.86 34.6Approach 1432 0.9 0.723 31.9 LOS C 18.7 132.2 0.76 0.67 42.9
All Vehicles 4025 0.9 0.740 31.2 LOS C 20.9 147.3 0.74 0.76 43.1
Level of Service (LOS) Method: Delay (HCM 2000). Vehicle movement LOS values are based on average delay per movementIntersection and Approach LOS values are based on average delay for all vehicle movements.SIDRA Standard Delay Model is used. Control Delay includes Geometric Delay.Gap-Acceptance Capacity: SIDRA Standard (Akçelik M3D).HV (%) values are calculated for All Movement Classes of All Heavy Vehicle Model Designation.The results of iterative calculations indicate a somewhat unstable solution. See the Diagnostics section in the Detailed Output report.
Movement Performance - PedestriansAverage Back of QueueMov
ID DescriptionDemand
Flow Average
Delay Level ofService
Prop. Queued
Effective Stop RatePedestrian Distance
ped/h sec ped m per pedP1 South Full Crossing 50 41.8 LOS E 0.1 0.1 0.84 0.84P4 West Full Crossing 50 40.1 LOS E 0.1 0.1 0.82 0.82
All Pedestrians 100 40.9 LOS E 0.83 0.83
Level of Service (LOS) Method: SIDRA Pedestrian LOS Method (Based on Average Delay)Pedestrian movement LOS values are based on average delay per pedestrian movement.Intersection LOS value for Pedestrians is based on average delay for all pedestrian movements.
SIDRA INTERSECTION 6.1 | Copyright © 2000-2015 Akcelik and Associates Pty Ltd | sidrasolutions.comOrganisation: LAMBERT AND REHBEIN (SEQ) PTY LTD | Processed: Wednesday, 6 April 2016 8:39:38 AMProject: F:\Jobs\B15300\B15323\Design\SIDRA\Samford Rd-Settlement Rd Intersection.sip6

MOVEMENT SUMMARYSite: 2030 Thu AM Peak - With Dev
Samford Road / Settlement Road2030 Thursday AM Peak (With Development)Signals - Fixed Time Isolated Cycle Time = 120 seconds (User-Given Cycle Time)
Movement Performance - VehiclesDemand Flows 95% Back of QueueMov
ID ODMov
Deg.Satn
AverageDelay
Level ofService
Prop. Queued
Effective Stop Rate
AverageSpeed Total HV Vehicles Distance
veh/h % v/c sec veh m per veh km/hSouth: Settlement Road (S)1 L2 321 4.3 0.240 10.6 LOS B 5.3 38.5 0.33 0.67 55.53 R2 514 4.3 0.815 63.9 LOS E 15.8 114.7 1.00 0.91 30.6Approach 835 4.3 0.815 43.4 LOS D 15.8 114.7 0.74 0.81 37.0
East: Samford Rd (E)4 L2 376 6.7 0.408 20.2 LOS C 12.3 91.2 0.65 0.83 48.15 T1 641 6.5 0.822 54.7 LOS D 19.5 144.2 1.00 0.95 34.3Approach 1017 6.6 0.822 41.9 LOS D 19.5 144.2 0.87 0.90 38.4
West: Samford Road (W)11 T1 1639 2.5 0.589 8.3 LOS A 22.6 161.3 0.52 0.48 60.412 R2 1142 2.5 0.785 34.4 LOS C 26.5 189.3 0.84 0.86 40.8Approach 2781 2.5 0.785 19.1 LOS B 26.5 189.3 0.65 0.64 50.4
All Vehicles 4633 3.7 0.822 28.5 LOS C 26.5 189.3 0.72 0.73 44.5
Level of Service (LOS) Method: Delay (HCM 2000). Vehicle movement LOS values are based on average delay per movementIntersection and Approach LOS values are based on average delay for all vehicle movements.SIDRA Standard Delay Model is used. Control Delay includes Geometric Delay.Gap-Acceptance Capacity: SIDRA Standard (Akçelik M3D).HV (%) values are calculated for All Movement Classes of All Heavy Vehicle Model Designation.The results of iterative calculations indicate a somewhat unstable solution. See the Diagnostics section in the Detailed Output report.
Movement Performance - PedestriansAverage Back of QueueMov
ID DescriptionDemand
Flow Average
Delay Level ofService
Prop. Queued
Effective Stop RatePedestrian Distance
ped/h sec ped m per pedP1 South Full Crossing 50 47.8 LOS E 0.2 0.2 0.89 0.89P4 West Full Crossing 50 54.3 LOS E 0.2 0.2 0.95 0.95
All Pedestrians 100 51.0 LOS E 0.92 0.92
Level of Service (LOS) Method: SIDRA Pedestrian LOS Method (Based on Average Delay)Pedestrian movement LOS values are based on average delay per pedestrian movement.Intersection LOS value for Pedestrians is based on average delay for all pedestrian movements.
SIDRA INTERSECTION 6.1 | Copyright © 2000-2015 Akcelik and Associates Pty Ltd | sidrasolutions.comOrganisation: LAMBERT AND REHBEIN (SEQ) PTY LTD | Processed: Wednesday, 6 April 2016 8:39:40 AMProject: F:\Jobs\B15300\B15323\Design\SIDRA\Samford Rd-Settlement Rd Intersection.sip6

MOVEMENT SUMMARYSite: 2030 Thu PM Peak - With Dev
Samford Road / Settlement Road2030 Thursday PM Peak (With Development)Signals - Fixed Time Isolated Cycle Time = 120 seconds (User-Given Cycle Time)
Movement Performance - VehiclesDemand Flows 95% Back of QueueMov
ID ODMov
Deg.Satn
AverageDelay
Level ofService
Prop. Queued
Effective Stop Rate
AverageSpeed Total HV Vehicles Distance
veh/h % v/c sec veh m per veh km/hSouth: Settlement Road (S)1 L2 515 0.7 0.673 38.4 LOS D 20.0 140.8 0.87 0.98 39.63 R2 511 0.5 0.872 70.3 LOS E 16.7 117.5 1.00 0.95 29.3Approach 1026 0.6 0.872 54.3 LOS D 20.0 140.8 0.94 0.97 33.7
East: Samford Rd (E)4 L2 413 1.3 0.288 10.0 LOS B 5.7 40.4 0.30 0.68 56.85 T1 1650 1.3 0.901 38.2 LOS D 56.7 401.3 0.90 0.94 40.5Approach 2063 1.3 0.901 32.5 LOS C 56.7 401.3 0.78 0.89 43.0
West: Samford Road (W)11 T1 747 3.2 0.264 5.2 LOS A 6.8 49.2 0.34 0.30 63.712 R2 518 3.1 0.900 74.9 LOS E 17.7 127.3 1.00 0.99 28.1Approach 1265 3.2 0.900 33.7 LOS C 17.7 127.3 0.61 0.58 41.9
All Vehicles 4354 1.7 0.901 38.0 LOS D 56.7 401.3 0.77 0.82 40.1
Level of Service (LOS) Method: Delay (HCM 2000). Vehicle movement LOS values are based on average delay per movementIntersection and Approach LOS values are based on average delay for all vehicle movements.SIDRA Standard Delay Model is used. Control Delay includes Geometric Delay.Gap-Acceptance Capacity: SIDRA Standard (Akçelik M3D).HV (%) values are calculated for All Movement Classes of All Heavy Vehicle Model Designation.
Movement Performance - PedestriansAverage Back of QueueMov
ID DescriptionDemand
Flow Average
Delay Level ofService
Prop. Queued
Effective Stop RatePedestrian Distance
ped/h sec ped m per pedP1 South Full Crossing 50 19.3 LOS B 0.1 0.1 0.57 0.57P4 West Full Crossing 50 54.3 LOS E 0.2 0.2 0.95 0.95
All Pedestrians 100 36.8 LOS D 0.76 0.76
Level of Service (LOS) Method: SIDRA Pedestrian LOS Method (Based on Average Delay)Pedestrian movement LOS values are based on average delay per pedestrian movement.Intersection LOS value for Pedestrians is based on average delay for all pedestrian movements.
SIDRA INTERSECTION 6.1 | Copyright © 2000-2015 Akcelik and Associates Pty Ltd | sidrasolutions.comOrganisation: LAMBERT AND REHBEIN (SEQ) PTY LTD | Processed: Wednesday, 6 April 2016 8:39:41 AMProject: F:\Jobs\B15300\B15323\Design\SIDRA\Samford Rd-Settlement Rd Intersection.sip6

MOVEMENT SUMMARYSite: 2030 Sat AM Peak - With Dev
Samford Road / Settlement Road2030 Saturday AM Peak (With Development)Signals - Fixed Time Isolated Cycle Time = 120 seconds (User-Given Cycle Time)
Movement Performance - VehiclesDemand Flows 95% Back of QueueMov
ID ODMov
Deg.Satn
AverageDelay
Level ofService
Prop. Queued
Effective Stop Rate
AverageSpeed Total HV Vehicles Distance
veh/h % v/c sec veh m per veh km/hSouth: Settlement Road (S)1 L2 583 0.9 0.466 15.5 LOS B 12.6 88.7 0.51 0.79 52.53 R2 727 0.9 0.622 44.0 LOS D 18.1 127.8 0.91 0.84 37.0Approach 1310 0.9 0.622 31.3 LOS C 18.1 127.8 0.73 0.82 42.6
East: Samford Rd (E)4 L2 518 1.0 0.394 12.7 LOS B 10.0 70.7 0.43 0.74 54.75 T1 846 1.0 0.824 47.6 LOS D 26.6 187.6 0.98 0.93 36.7Approach 1364 1.0 0.824 34.4 LOS C 26.6 187.6 0.77 0.86 41.9
West: Samford Road (W)11 T1 814 0.9 0.360 13.9 LOS B 12.3 87.0 0.57 0.50 55.312 R2 689 0.9 0.747 52.9 LOS D 19.2 135.5 0.98 0.87 34.0Approach 1503 0.9 0.747 31.8 LOS C 19.2 135.5 0.76 0.67 43.0
All Vehicles 4177 0.9 0.824 32.5 LOS C 26.6 187.6 0.75 0.78 42.5
Level of Service (LOS) Method: Delay (HCM 2000). Vehicle movement LOS values are based on average delay per movementIntersection and Approach LOS values are based on average delay for all vehicle movements.SIDRA Standard Delay Model is used. Control Delay includes Geometric Delay.Gap-Acceptance Capacity: SIDRA Standard (Akçelik M3D).HV (%) values are calculated for All Movement Classes of All Heavy Vehicle Model Designation.The results of iterative calculations indicate a somewhat unstable solution. See the Diagnostics section in the Detailed Output report.
Movement Performance - PedestriansAverage Back of QueueMov
ID DescriptionDemand
Flow Average
Delay Level ofService
Prop. Queued
Effective Stop RatePedestrian Distance
ped/h sec ped m per pedP1 South Full Crossing 50 40.1 LOS E 0.1 0.1 0.82 0.82P4 West Full Crossing 50 40.9 LOS E 0.1 0.1 0.83 0.83
All Pedestrians 100 40.5 LOS E 0.82 0.82
Level of Service (LOS) Method: SIDRA Pedestrian LOS Method (Based on Average Delay)Pedestrian movement LOS values are based on average delay per pedestrian movement.Intersection LOS value for Pedestrians is based on average delay for all pedestrian movements.
SIDRA INTERSECTION 6.1 | Copyright © 2000-2015 Akcelik and Associates Pty Ltd | sidrasolutions.comOrganisation: LAMBERT AND REHBEIN (SEQ) PTY LTD | Processed: Wednesday, 6 April 2016 8:39:42 AMProject: F:\Jobs\B15300\B15323\Design\SIDRA\Samford Rd-Settlement Rd Intersection.sip6

SITE LAYOUTSite: 2020 Thu AM Peak - With Dev
Samford Road / Development Access2020 Thursday AM Peak (With Development)Signals - Fixed Time Isolated
SIDRA INTERSECTION 6.1 | Copyright © 2000-2015 Akcelik and Associates Pty Ltd | sidrasolutions.comOrganisation: LAMBERT AND REHBEIN (SEQ) PTY LTD | Created: Wednesday, 6 April 2016 8:51:16 AMProject: F:\Jobs\B15300\B15323\Design\SIDRA\Samford Rd - Development Access Intersection.sip6

MOVEMENT SUMMARYSite: 2020 Thu AM Peak - With Dev
Samford Road / Development Access2020 Thursday AM Peak (With Development)Signals - Fixed Time Isolated Cycle Time = 120 seconds (User-Given Cycle Time)
Movement Performance - VehiclesDemand Flows 95% Back of QueueMov
ID ODMov
Deg.Satn
AverageDelay
Level ofService
Prop. Queued
Effective Stop Rate
AverageSpeed Total HV Vehicles Distance
veh/h % v/c sec veh m per veh km/hSouth: Development Access1 L2 61 0.0 0.076 7.3 LOS A 0.6 4.0 0.22 0.61 52.93 R2 219 0.0 0.544 62.1 LOS E 6.3 44.1 0.99 0.79 29.3Approach 280 0.0 0.544 50.2 LOS D 6.3 44.1 0.83 0.75 32.5
East: Samford Road (WB)4 L2 39 0.0 0.032 13.0 LOS B 0.8 5.4 0.37 0.65 48.35 T1 888 3.0 0.353 9.6 LOS A 11.3 81.3 0.48 0.43 51.8Approach 927 2.9 0.353 9.8 LOS A 11.3 81.3 0.47 0.43 51.7
West: Samford Road (EB)11 T1 1697 2.0 0.557 4.9 LOS A 18.1 128.8 0.41 0.38 55.512 R2 11 0.0 0.071 61.6 LOS E 0.6 4.3 0.95 0.68 29.5Approach 1708 2.0 0.557 5.3 LOS A 18.1 128.8 0.41 0.38 55.2
All Vehicles 2915 2.1 0.557 11.0 LOS B 18.1 128.8 0.47 0.43 50.7
Level of Service (LOS) Method: Delay (HCM 2000). Vehicle movement LOS values are based on average delay per movementIntersection and Approach LOS values are based on average delay for all vehicle movements.SIDRA Standard Delay Model is used. Control Delay includes Geometric Delay.Gap-Acceptance Capacity: SIDRA Standard (Akçelik M3D).HV (%) values are calculated for All Movement Classes of All Heavy Vehicle Model Designation.
Movement Performance - PedestriansAverage Back of QueueMov
ID DescriptionDemand
Flow Average
Delay Level ofService
Prop. Queued
Effective Stop RatePedestrian Distance
ped/h sec ped m per pedP1 South Full Crossing 50 54.3 LOS E 0.2 0.2 0.95 0.95
All Pedestrians 50 54.3 LOS E 0.95 0.95
Level of Service (LOS) Method: SIDRA Pedestrian LOS Method (Based on Average Delay)Pedestrian movement LOS values are based on average delay per pedestrian movement.Intersection LOS value for Pedestrians is based on average delay for all pedestrian movements.
SIDRA INTERSECTION 6.1 | Copyright © 2000-2015 Akcelik and Associates Pty Ltd | sidrasolutions.comOrganisation: LAMBERT AND REHBEIN (SEQ) PTY LTD | Processed: Wednesday, 6 April 2016 8:51:05 AMProject: F:\Jobs\B15300\B15323\Design\SIDRA\Samford Rd - Development Access Intersection.sip6

MOVEMENT SUMMARYSite: 2020 Thu PM Peak - With Dev
Samford Road / Development Access2020 Thursday PM Peak (With Development)Signals - Fixed Time Isolated Cycle Time = 120 seconds (User-Given Cycle Time)
Movement Performance - VehiclesDemand Flows 95% Back of QueueMov
ID ODMov
Deg.Satn
AverageDelay
Level ofService
Prop. Queued
Effective Stop Rate
AverageSpeed Total HV Vehicles Distance
veh/h % v/c sec veh m per veh km/hSouth: Development Access1 L2 73 0.0 0.164 16.3 LOS B 1.9 13.0 0.50 0.69 46.83 R2 192 0.0 0.689 68.2 LOS E 5.9 41.2 1.00 0.83 28.0Approach 265 0.0 0.689 53.9 LOS D 5.9 41.2 0.86 0.79 31.5
East: Samford Road (WB)4 L2 295 0.0 0.230 12.7 LOS B 6.2 43.3 0.39 0.69 48.65 T1 1822 1.0 0.748 11.6 LOS B 36.8 259.8 0.64 0.60 50.4Approach 2117 0.9 0.748 11.7 LOS B 36.8 259.8 0.61 0.61 50.2
West: Samford Road (EB)11 T1 969 4.0 0.309 2.6 LOS A 6.5 47.0 0.25 0.23 57.612 R2 102 0.0 0.659 66.7 LOS E 6.2 43.1 1.00 0.82 28.4Approach 1071 3.6 0.659 8.7 LOS A 6.5 47.0 0.32 0.28 52.4
All Vehicles 3453 1.7 0.748 14.0 LOS B 36.8 259.8 0.54 0.52 48.6
Level of Service (LOS) Method: Delay (HCM 2000). Vehicle movement LOS values are based on average delay per movementIntersection and Approach LOS values are based on average delay for all vehicle movements.SIDRA Standard Delay Model is used. Control Delay includes Geometric Delay.Gap-Acceptance Capacity: SIDRA Standard (Akçelik M3D).HV (%) values are calculated for All Movement Classes of All Heavy Vehicle Model Designation.
Movement Performance - PedestriansAverage Back of QueueMov
ID DescriptionDemand
Flow Average
Delay Level ofService
Prop. Queued
Effective Stop RatePedestrian Distance
ped/h sec ped m per pedP1 South Full Crossing 50 54.3 LOS E 0.2 0.2 0.95 0.95
All Pedestrians 50 54.3 LOS E 0.95 0.95
Level of Service (LOS) Method: SIDRA Pedestrian LOS Method (Based on Average Delay)Pedestrian movement LOS values are based on average delay per pedestrian movement.Intersection LOS value for Pedestrians is based on average delay for all pedestrian movements.
SIDRA INTERSECTION 6.1 | Copyright © 2000-2015 Akcelik and Associates Pty Ltd | sidrasolutions.comOrganisation: LAMBERT AND REHBEIN (SEQ) PTY LTD | Processed: Wednesday, 6 April 2016 8:51:06 AMProject: F:\Jobs\B15300\B15323\Design\SIDRA\Samford Rd - Development Access Intersection.sip6

MOVEMENT SUMMARYSite: 2020 Sat AM Peak - With Dev
Samford Road / Development Access2020 Saturday AM Peak (With Development)Signals - Fixed Time Isolated Cycle Time = 120 seconds (User-Given Cycle Time)
Movement Performance - VehiclesDemand Flows 95% Back of QueueMov
ID ODMov
Deg.Satn
AverageDelay
Level ofService
Prop. Queued
Effective Stop Rate
AverageSpeed Total HV Vehicles Distance
veh/h % v/c sec veh m per veh km/hSouth: Development Access1 L2 81 0.0 0.145 10.5 LOS B 1.4 9.6 0.36 0.65 50.63 R2 195 0.0 0.573 64.4 LOS E 5.7 40.1 1.00 0.78 28.8Approach 276 0.0 0.573 48.5 LOS D 5.7 40.1 0.81 0.74 33.0
East: Samford Road (WB)4 L2 159 0.0 0.127 12.8 LOS B 3.2 22.6 0.38 0.67 48.55 T1 1438 1.0 0.576 10.7 LOS B 23.0 162.4 0.56 0.51 51.1Approach 1597 0.9 0.576 10.9 LOS B 23.0 162.4 0.54 0.53 50.8
West: Samford Road (EB)11 T1 1405 1.0 0.449 3.6 LOS A 12.1 85.2 0.33 0.30 56.612 R2 71 0.0 0.459 64.7 LOS E 4.1 29.0 0.99 0.76 28.8Approach 1476 1.0 0.459 6.6 LOS A 12.1 85.2 0.36 0.32 54.1
All Vehicles 3349 0.8 0.576 12.1 LOS B 23.0 162.4 0.48 0.46 49.9
Level of Service (LOS) Method: Delay (HCM 2000). Vehicle movement LOS values are based on average delay per movementIntersection and Approach LOS values are based on average delay for all vehicle movements.SIDRA Standard Delay Model is used. Control Delay includes Geometric Delay.Gap-Acceptance Capacity: SIDRA Standard (Akçelik M3D).HV (%) values are calculated for All Movement Classes of All Heavy Vehicle Model Designation.
Movement Performance - PedestriansAverage Back of QueueMov
ID DescriptionDemand
Flow Average
Delay Level ofService
Prop. Queued
Effective Stop RatePedestrian Distance
ped/h sec ped m per pedP1 South Full Crossing 50 54.3 LOS E 0.2 0.2 0.95 0.95
All Pedestrians 50 54.3 LOS E 0.95 0.95
Level of Service (LOS) Method: SIDRA Pedestrian LOS Method (Based on Average Delay)Pedestrian movement LOS values are based on average delay per pedestrian movement.Intersection LOS value for Pedestrians is based on average delay for all pedestrian movements.
SIDRA INTERSECTION 6.1 | Copyright © 2000-2015 Akcelik and Associates Pty Ltd | sidrasolutions.comOrganisation: LAMBERT AND REHBEIN (SEQ) PTY LTD | Processed: Wednesday, 6 April 2016 8:51:07 AMProject: F:\Jobs\B15300\B15323\Design\SIDRA\Samford Rd - Development Access Intersection.sip6

MOVEMENT SUMMARYSite: 2030 Thu AM Peak - With Dev
Samford Road / Development Access2030 Thursday AM Peak (With Development)Signals - Fixed Time Isolated Cycle Time = 120 seconds (User-Given Cycle Time)
Movement Performance - VehiclesDemand Flows 95% Back of QueueMov
ID ODMov
Deg.Satn
AverageDelay
Level ofService
Prop. Queued
Effective Stop Rate
AverageSpeed Total HV Vehicles Distance
veh/h % v/c sec veh m per veh km/hSouth: Development Access1 L2 61 0.0 0.086 7.7 LOS A 0.6 4.5 0.24 0.61 52.63 R2 219 0.0 0.643 65.4 LOS E 6.5 45.7 1.00 0.81 28.6Approach 280 0.0 0.643 52.8 LOS D 6.5 45.7 0.84 0.77 31.8
East: Samford Road (WB)4 L2 39 0.0 0.031 12.3 LOS B 0.7 5.1 0.35 0.64 48.85 T1 1041 3.0 0.405 9.2 LOS A 13.4 96.1 0.48 0.43 52.2Approach 1080 2.9 0.405 9.3 LOS A 13.4 96.1 0.48 0.44 52.0
West: Samford Road (EB)11 T1 2142 2.0 0.691 5.2 LOS A 26.7 190.4 0.47 0.44 55.312 R2 11 0.0 0.071 61.6 LOS E 0.6 4.3 0.95 0.68 29.5Approach 2153 2.0 0.691 5.5 LOS A 26.7 190.4 0.47 0.44 55.0
All Vehicles 3513 2.1 0.691 10.4 LOS B 26.7 190.4 0.50 0.47 51.1
Level of Service (LOS) Method: Delay (HCM 2000). Vehicle movement LOS values are based on average delay per movementIntersection and Approach LOS values are based on average delay for all vehicle movements.SIDRA Standard Delay Model is used. Control Delay includes Geometric Delay.Gap-Acceptance Capacity: SIDRA Standard (Akçelik M3D).HV (%) values are calculated for All Movement Classes of All Heavy Vehicle Model Designation.
Movement Performance - PedestriansAverage Back of QueueMov
ID DescriptionDemand
Flow Average
Delay Level ofService
Prop. Queued
Effective Stop RatePedestrian Distance
ped/h sec ped m per pedP1 South Full Crossing 50 54.3 LOS E 0.2 0.2 0.95 0.95
All Pedestrians 50 54.3 LOS E 0.95 0.95
Level of Service (LOS) Method: SIDRA Pedestrian LOS Method (Based on Average Delay)Pedestrian movement LOS values are based on average delay per pedestrian movement.Intersection LOS value for Pedestrians is based on average delay for all pedestrian movements.
SIDRA INTERSECTION 6.1 | Copyright © 2000-2015 Akcelik and Associates Pty Ltd | sidrasolutions.comOrganisation: LAMBERT AND REHBEIN (SEQ) PTY LTD | Processed: Wednesday, 6 April 2016 8:51:08 AMProject: F:\Jobs\B15300\B15323\Design\SIDRA\Samford Rd - Development Access Intersection.sip6
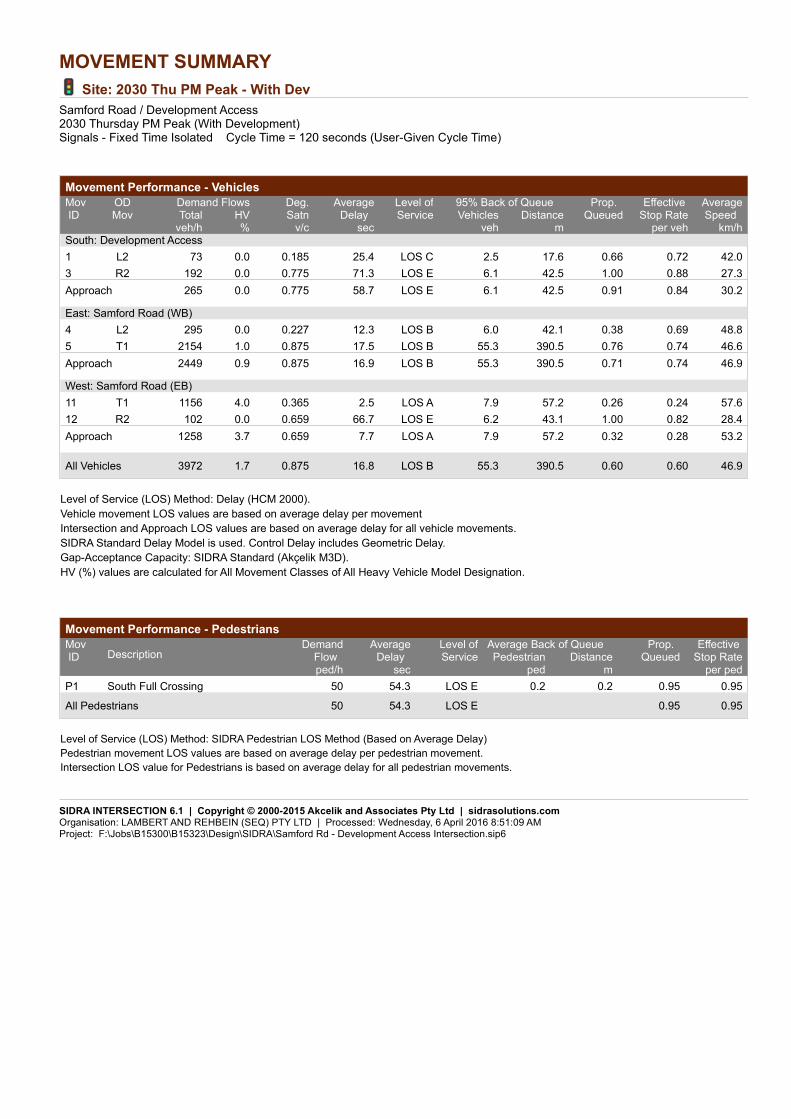
MOVEMENT SUMMARYSite: 2030 Thu PM Peak - With Dev
Samford Road / Development Access2030 Thursday PM Peak (With Development)Signals - Fixed Time Isolated Cycle Time = 120 seconds (User-Given Cycle Time)
Movement Performance - VehiclesDemand Flows 95% Back of QueueMov
ID ODMov
Deg.Satn
AverageDelay
Level ofService
Prop. Queued
Effective Stop Rate
AverageSpeed Total HV Vehicles Distance
veh/h % v/c sec veh m per veh km/hSouth: Development Access1 L2 73 0.0 0.185 25.4 LOS C 2.5 17.6 0.66 0.72 42.03 R2 192 0.0 0.775 71.3 LOS E 6.1 42.5 1.00 0.88 27.3Approach 265 0.0 0.775 58.7 LOS E 6.1 42.5 0.91 0.84 30.2
East: Samford Road (WB)4 L2 295 0.0 0.227 12.3 LOS B 6.0 42.1 0.38 0.69 48.85 T1 2154 1.0 0.875 17.5 LOS B 55.3 390.5 0.76 0.74 46.6Approach 2449 0.9 0.875 16.9 LOS B 55.3 390.5 0.71 0.74 46.9
West: Samford Road (EB)11 T1 1156 4.0 0.365 2.5 LOS A 7.9 57.2 0.26 0.24 57.612 R2 102 0.0 0.659 66.7 LOS E 6.2 43.1 1.00 0.82 28.4Approach 1258 3.7 0.659 7.7 LOS A 7.9 57.2 0.32 0.28 53.2
All Vehicles 3972 1.7 0.875 16.8 LOS B 55.3 390.5 0.60 0.60 46.9
Level of Service (LOS) Method: Delay (HCM 2000). Vehicle movement LOS values are based on average delay per movementIntersection and Approach LOS values are based on average delay for all vehicle movements.SIDRA Standard Delay Model is used. Control Delay includes Geometric Delay.Gap-Acceptance Capacity: SIDRA Standard (Akçelik M3D).HV (%) values are calculated for All Movement Classes of All Heavy Vehicle Model Designation.
Movement Performance - PedestriansAverage Back of QueueMov
ID DescriptionDemand
Flow Average
Delay Level ofService
Prop. Queued
Effective Stop RatePedestrian Distance
ped/h sec ped m per pedP1 South Full Crossing 50 54.3 LOS E 0.2 0.2 0.95 0.95
All Pedestrians 50 54.3 LOS E 0.95 0.95
Level of Service (LOS) Method: SIDRA Pedestrian LOS Method (Based on Average Delay)Pedestrian movement LOS values are based on average delay per pedestrian movement.Intersection LOS value for Pedestrians is based on average delay for all pedestrian movements.
SIDRA INTERSECTION 6.1 | Copyright © 2000-2015 Akcelik and Associates Pty Ltd | sidrasolutions.comOrganisation: LAMBERT AND REHBEIN (SEQ) PTY LTD | Processed: Wednesday, 6 April 2016 8:51:09 AMProject: F:\Jobs\B15300\B15323\Design\SIDRA\Samford Rd - Development Access Intersection.sip6
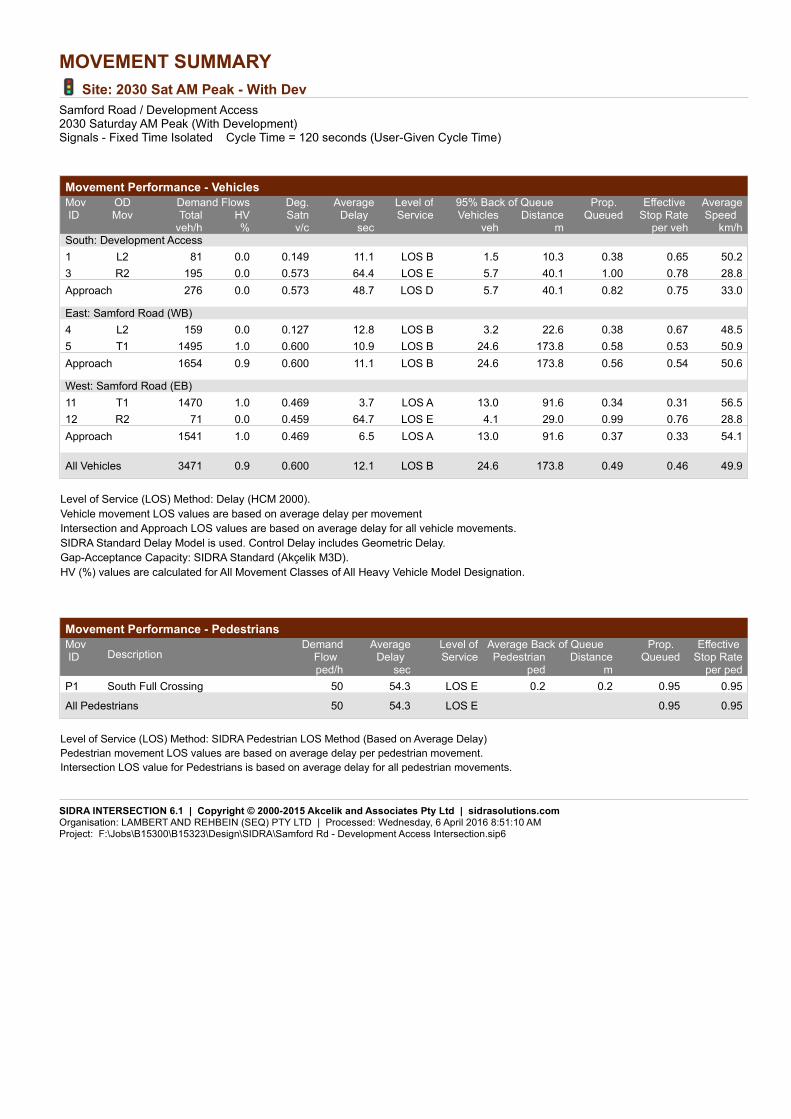
MOVEMENT SUMMARYSite: 2030 Sat AM Peak - With Dev
Samford Road / Development Access2030 Saturday AM Peak (With Development)Signals - Fixed Time Isolated Cycle Time = 120 seconds (User-Given Cycle Time)
Movement Performance - VehiclesDemand Flows 95% Back of QueueMov
ID ODMov
Deg.Satn
AverageDelay
Level ofService
Prop. Queued
Effective Stop Rate
AverageSpeed Total HV Vehicles Distance
veh/h % v/c sec veh m per veh km/hSouth: Development Access1 L2 81 0.0 0.149 11.1 LOS B 1.5 10.3 0.38 0.65 50.23 R2 195 0.0 0.573 64.4 LOS E 5.7 40.1 1.00 0.78 28.8Approach 276 0.0 0.573 48.7 LOS D 5.7 40.1 0.82 0.75 33.0
East: Samford Road (WB)4 L2 159 0.0 0.127 12.8 LOS B 3.2 22.6 0.38 0.67 48.55 T1 1495 1.0 0.600 10.9 LOS B 24.6 173.8 0.58 0.53 50.9Approach 1654 0.9 0.600 11.1 LOS B 24.6 173.8 0.56 0.54 50.6
West: Samford Road (EB)11 T1 1470 1.0 0.469 3.7 LOS A 13.0 91.6 0.34 0.31 56.512 R2 71 0.0 0.459 64.7 LOS E 4.1 29.0 0.99 0.76 28.8Approach 1541 1.0 0.469 6.5 LOS A 13.0 91.6 0.37 0.33 54.1
All Vehicles 3471 0.9 0.600 12.1 LOS B 24.6 173.8 0.49 0.46 49.9
Level of Service (LOS) Method: Delay (HCM 2000). Vehicle movement LOS values are based on average delay per movementIntersection and Approach LOS values are based on average delay for all vehicle movements.SIDRA Standard Delay Model is used. Control Delay includes Geometric Delay.Gap-Acceptance Capacity: SIDRA Standard (Akçelik M3D).HV (%) values are calculated for All Movement Classes of All Heavy Vehicle Model Designation.
Movement Performance - PedestriansAverage Back of QueueMov
ID DescriptionDemand
Flow Average
Delay Level ofService
Prop. Queued
Effective Stop RatePedestrian Distance
ped/h sec ped m per pedP1 South Full Crossing 50 54.3 LOS E 0.2 0.2 0.95 0.95
All Pedestrians 50 54.3 LOS E 0.95 0.95
Level of Service (LOS) Method: SIDRA Pedestrian LOS Method (Based on Average Delay)Pedestrian movement LOS values are based on average delay per pedestrian movement.Intersection LOS value for Pedestrians is based on average delay for all pedestrian movements.
SIDRA INTERSECTION 6.1 | Copyright © 2000-2015 Akcelik and Associates Pty Ltd | sidrasolutions.comOrganisation: LAMBERT AND REHBEIN (SEQ) PTY LTD | Processed: Wednesday, 6 April 2016 8:51:10 AMProject: F:\Jobs\B15300\B15323\Design\SIDRA\Samford Rd - Development Access Intersection.sip6

SITE LAYOUTSite: 2020 AM Peak
Settlement Road / Proposed Access2020 AM PeakGiveway / Yield (Two-Way)

SIDRA INTERSECTION 6.1 | Copyright © 2000-2015 Akcelik and Associates Pty Ltd | sidrasolutions.comOrganisation: LAMBERT AND REHBEIN (SEQ) PTY LTD | Created: Monday, 4 April 2016 1:03:31 PMProject: C:\Users\tobyg\Documents\B15323\Design\SIDRA\Settlement Road Intersection.sip6
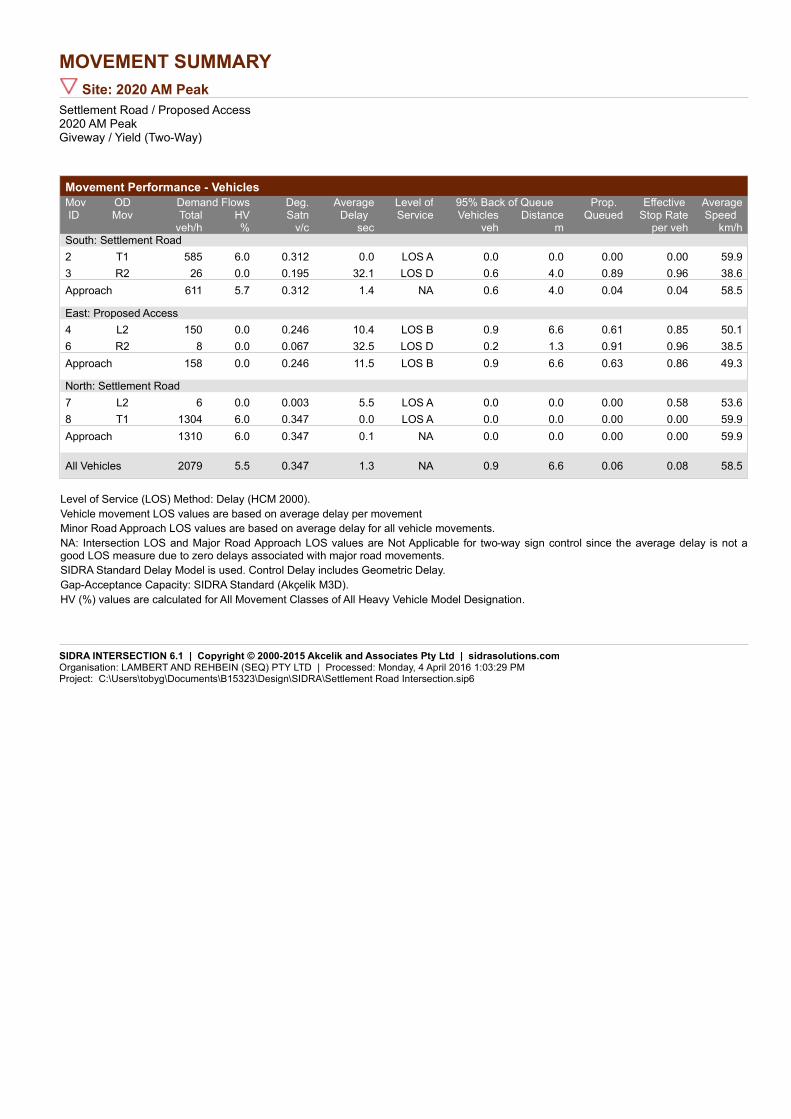
MOVEMENT SUMMARYSite: 2020 AM Peak
Settlement Road / Proposed Access2020 AM PeakGiveway / Yield (Two-Way)
Movement Performance - VehiclesDemand Flows 95% Back of QueueMov
ID ODMov
Deg.Satn
AverageDelay
Level ofService
Prop. Queued
Effective Stop Rate
AverageSpeed Total HV Vehicles Distance
veh/h % v/c sec veh m per veh km/hSouth: Settlement Road2 T1 585 6.0 0.312 0.0 LOS A 0.0 0.0 0.00 0.00 59.93 R2 26 0.0 0.195 32.1 LOS D 0.6 4.0 0.89 0.96 38.6Approach 611 5.7 0.312 1.4 NA 0.6 4.0 0.04 0.04 58.5
East: Proposed Access4 L2 150 0.0 0.246 10.4 LOS B 0.9 6.6 0.61 0.85 50.16 R2 8 0.0 0.067 32.5 LOS D 0.2 1.3 0.91 0.96 38.5Approach 158 0.0 0.246 11.5 LOS B 0.9 6.6 0.63 0.86 49.3
North: Settlement Road7 L2 6 0.0 0.003 5.5 LOS A 0.0 0.0 0.00 0.58 53.68 T1 1304 6.0 0.347 0.0 LOS A 0.0 0.0 0.00 0.00 59.9Approach 1310 6.0 0.347 0.1 NA 0.0 0.0 0.00 0.00 59.9
All Vehicles 2079 5.5 0.347 1.3 NA 0.9 6.6 0.06 0.08 58.5
Level of Service (LOS) Method: Delay (HCM 2000). Vehicle movement LOS values are based on average delay per movementMinor Road Approach LOS values are based on average delay for all vehicle movements.NA: Intersection LOS and Major Road Approach LOS values are Not Applicable for two-way sign control since the average delay is not a good LOS measure due to zero delays associated with major road movements.SIDRA Standard Delay Model is used. Control Delay includes Geometric Delay.Gap-Acceptance Capacity: SIDRA Standard (Akçelik M3D).HV (%) values are calculated for All Movement Classes of All Heavy Vehicle Model Designation.
SIDRA INTERSECTION 6.1 | Copyright © 2000-2015 Akcelik and Associates Pty Ltd | sidrasolutions.comOrganisation: LAMBERT AND REHBEIN (SEQ) PTY LTD | Processed: Monday, 4 April 2016 1:03:29 PMProject: C:\Users\tobyg\Documents\B15323\Design\SIDRA\Settlement Road Intersection.sip6

MOVEMENT SUMMARYSite: 2020 PM Peak
Settlement Road / Proposed Access2020 PM PeakGiveway / Yield (Two-Way)
Movement Performance - VehiclesDemand Flows 95% Back of QueueMov
ID ODMov
Deg.Satn
AverageDelay
Level ofService
Prop. Queued
Effective Stop Rate
AverageSpeed Total HV Vehicles Distance
veh/h % v/c sec veh m per veh km/hSouth: Settlement Road2 T1 1103 6.0 0.588 0.1 LOS A 0.0 0.0 0.00 0.00 59.83 R2 123 0.0 0.309 14.2 LOS B 1.2 8.5 0.70 0.91 47.6Approach 1226 5.4 0.588 1.5 NA 1.2 8.5 0.07 0.09 58.3
East: Proposed Access4 L2 53 0.0 0.058 7.2 LOS A 0.2 1.4 0.41 0.64 52.36 R2 3 0.0 0.042 49.4 LOS E 0.1 0.7 0.95 0.98 32.7Approach 56 0.0 0.058 9.5 LOS A 0.2 1.4 0.44 0.66 50.7
North: Settlement Road7 L2 1 0.0 0.001 5.5 LOS A 0.0 0.0 0.00 0.58 53.68 T1 721 6.0 0.192 0.0 LOS A 0.0 0.0 0.00 0.00 60.0Approach 722 6.0 0.192 0.0 NA 0.0 0.0 0.00 0.00 60.0
All Vehicles 2004 5.5 0.588 1.2 NA 1.2 8.5 0.05 0.07 58.6
Level of Service (LOS) Method: Delay (HCM 2000). Vehicle movement LOS values are based on average delay per movementMinor Road Approach LOS values are based on average delay for all vehicle movements.NA: Intersection LOS and Major Road Approach LOS values are Not Applicable for two-way sign control since the average delay is not a good LOS measure due to zero delays associated with major road movements.SIDRA Standard Delay Model is used. Control Delay includes Geometric Delay.Gap-Acceptance Capacity: SIDRA Standard (Akçelik M3D).HV (%) values are calculated for All Movement Classes of All Heavy Vehicle Model Designation.
SIDRA INTERSECTION 6.1 | Copyright © 2000-2015 Akcelik and Associates Pty Ltd | sidrasolutions.comOrganisation: LAMBERT AND REHBEIN (SEQ) PTY LTD | Processed: Monday, 4 April 2016 1:03:09 PMProject: C:\Users\tobyg\Documents\B15323\Design\SIDRA\Settlement Road Intersection.sip6

MOVEMENT SUMMARYSite: 2030 AM Peak
Settlement Road / Proposed Access2030 AM PeakGiveway / Yield (Two-Way)
Movement Performance - VehiclesDemand Flows 95% Back of QueueMov
ID ODMov
Deg.Satn
AverageDelay
Level ofService
Prop. Queued
Effective Stop Rate
AverageSpeed Total HV Vehicles Distance
veh/h % v/c sec veh m per veh km/hSouth: Settlement Road2 T1 614 6.0 0.327 0.0 LOS A 0.0 0.0 0.00 0.00 59.93 R2 26 0.0 0.225 37.3 LOS E 0.7 4.6 0.91 0.98 36.6Approach 640 5.8 0.327 1.6 NA 0.7 4.6 0.04 0.04 58.4
East: Proposed Access4 L2 150 0.0 0.260 10.9 LOS B 1.0 7.0 0.64 0.87 49.76 R2 8 0.0 0.079 37.5 LOS E 0.2 1.5 0.93 0.97 36.5Approach 158 0.0 0.260 12.3 LOS B 1.0 7.0 0.65 0.87 48.8
North: Settlement Road7 L2 6 0.0 0.003 5.5 LOS A 0.0 0.0 0.00 0.58 53.68 T1 1370 6.0 0.365 0.0 LOS A 0.0 0.0 0.00 0.00 59.9Approach 1376 6.0 0.365 0.1 NA 0.0 0.0 0.00 0.00 59.9
All Vehicles 2174 5.5 0.365 1.4 NA 1.0 7.0 0.06 0.08 58.5
Level of Service (LOS) Method: Delay (HCM 2000). Vehicle movement LOS values are based on average delay per movementMinor Road Approach LOS values are based on average delay for all vehicle movements.NA: Intersection LOS and Major Road Approach LOS values are Not Applicable for two-way sign control since the average delay is not a good LOS measure due to zero delays associated with major road movements.SIDRA Standard Delay Model is used. Control Delay includes Geometric Delay.Gap-Acceptance Capacity: SIDRA Standard (Akçelik M3D).HV (%) values are calculated for All Movement Classes of All Heavy Vehicle Model Designation.
SIDRA INTERSECTION 6.1 | Copyright © 2000-2015 Akcelik and Associates Pty Ltd | sidrasolutions.comOrganisation: LAMBERT AND REHBEIN (SEQ) PTY LTD | Processed: Monday, 4 April 2016 1:03:10 PMProject: C:\Users\tobyg\Documents\B15323\Design\SIDRA\Settlement Road Intersection.sip6

MOVEMENT SUMMARYSite: 2030 PM Peak
Settlement Road / Proposed Access2030 PM PeakGiveway / Yield (Two-Way)
Movement Performance - VehiclesDemand Flows 95% Back of QueueMov
ID ODMov
Deg.Satn
AverageDelay
Level ofService
Prop. Queued
Effective Stop Rate
AverageSpeed Total HV Vehicles Distance
veh/h % v/c sec veh m per veh km/hSouth: Settlement Road2 T1 1159 6.0 0.618 0.1 LOS A 0.0 0.0 0.00 0.00 59.73 R2 123 0.0 0.328 15.1 LOS C 1.3 9.1 0.72 0.93 47.0Approach 1282 5.4 0.618 1.6 NA 1.3 9.1 0.07 0.09 58.2
East: Proposed Access4 L2 53 0.0 0.059 7.3 LOS A 0.2 1.5 0.42 0.65 52.26 R2 3 0.0 0.053 60.9 LOS F 0.1 0.9 0.96 0.98 29.6Approach 56 0.0 0.059 10.2 LOS B 0.2 1.5 0.45 0.67 50.2
North: Settlement Road7 L2 1 0.0 0.001 5.5 LOS A 0.0 0.0 0.00 0.58 53.68 T1 758 6.0 0.202 0.0 LOS A 0.0 0.0 0.00 0.00 60.0Approach 759 6.0 0.202 0.0 NA 0.0 0.0 0.00 0.00 59.9
All Vehicles 2097 5.5 0.618 1.2 NA 1.3 9.1 0.05 0.07 58.6
Level of Service (LOS) Method: Delay (HCM 2000). Vehicle movement LOS values are based on average delay per movementMinor Road Approach LOS values are based on average delay for all vehicle movements.NA: Intersection LOS and Major Road Approach LOS values are Not Applicable for two-way sign control since the average delay is not a good LOS measure due to zero delays associated with major road movements.SIDRA Standard Delay Model is used. Control Delay includes Geometric Delay.Gap-Acceptance Capacity: SIDRA Standard (Akçelik M3D).HV (%) values are calculated for All Movement Classes of All Heavy Vehicle Model Designation.
SIDRA INTERSECTION 6.1 | Copyright © 2000-2015 Akcelik and Associates Pty Ltd | sidrasolutions.comOrganisation: LAMBERT AND REHBEIN (SEQ) PTY LTD | Processed: Monday, 4 April 2016 1:04:12 PMProject: C:\Users\tobyg\Documents\B15323\Design\SIDRA\Settlement Road Intersection.sip6

TRANSPORT, ACCESS, PARKING & SERVICING CODE Brisbane City Plan July 2014
1 Solution: Acceptable Solution
A/S Alternative Solution N/A Not applicable to this proposal
Keperra Quarry Development Current as at: July 2014 Page 1
Performance Outcomes Acceptable Outcomes SOLUTION COMMENTS
PO1
Development is designed: (a) to include a technically competent and
accurate response to the transport and traffic elements of the development;
(b) in accordance with the standards in the Transport, access, parking and servicing planning scheme policy;
(c) to ensure the efficient operation and safety of the development and its surrounds.
Note—The acceptable outcome and performance outcome can be demonstrated through a development application that:
is accompanied by sufficient information, including computer modelling input and output data, to allow the proposed development to be properly assessed against the requirements of this code and the standards and guidelines of the Transport, access, parking and servicing planning scheme policy;
is certified by a Registered Professional Engineer Queensland that all plans, documents and dimensioned drawings comply with the requirements of this code and the standards and guidelines of the Transport, access, parking and servicing planning scheme policy;
ensures that any computer modelling input and output data are accurate, reasonable and carried out in accordance with sound traffic engineering practices.
AO1
Development complies with the standards in the Transport, access, parking and servicing planning scheme policy.
Complies with Performance Outcome
Refer to Traffic Report, prepared by Lambert & Rehbein, B15323TR001.

TRANSPORT, ACCESS, PARKING & SERVICING CODE Brisbane City Plan July 2014
1 Solution: Acceptable Solution
A/S Alternative Solution N/A Not applicable to this proposal
Keperra Quarry Development Current as at: July 2014 Page 2
Performance Outcomes Acceptable Outcomes SOLUTION COMMENTS
PO2
Development of a major size incorporates on-site provision for integration with the public transport network and the management of vehicles, public transport, pedestrians and cyclists, including providing appropriate pedestrian and cyclist linkages to adjoining uses, public areas and the transport network consistent with the planning by the State Government and Council.
AO2
No acceptable outcome is prescribed.
Not applicable Will provided as part of subsequent applications
PO3
Development provides vehicle access that is located and designed so as to have no significant impact on the safety, efficiency, function, convenience of use or capacity of the road network.
AO3.1
Development provides site access that is located and designed in compliance with the standards in the Transport, access, parking and servicing planning scheme policy.
Complies with Performance Outcome
Intersection with Settlement Road is consistent with previous approval and was assessed in detail in Traffic Report, prepared by Lambert & Rehbein, B15323TR001.
AO3.2
Development provides an easement for a vehicular access benefiting all adjoining landowners and the Council if the vehicular access services more than an individual development or premises.
Not applicable Will provided as part of subsequent applications
PO4
Development provides walking and cycle routes through the site which: (a) link to the external network and pedestrian and
cyclist destinations such as schools, shopping centres, open space, public transport stations, shops and local activity centres along the safest, most direct and convenient routes;
(b) encourage walking and cycling; (c) ensure pedestrian and cyclist safety; (d) provide a direct and legible network.
Note—The Infrastructure design planning scheme policy provides additional guidance on how to comply with this performance outcome.
AO4.1
Development provides walking and cycle routes which are constructed on the carriageway or through the site to: (a) create a walking or cycle route along the full
frontage of the site; (b) connect to public transport and existing cycle and
walking routes at the frontage or boundary of the site.
Not applicable
Will provided as part of subsequent applications
AO4.2
Development provides walking and cycle routes that are constructed in compliance with the standards in the Transport, access, parking and servicing planning scheme policy and the Infrastructure design planning scheme policy.
Not applicable Will provided as part of subsequent applications
AO4.3
Development provides walking and cycle routes which
Not applicable
Will provided as part of subsequent
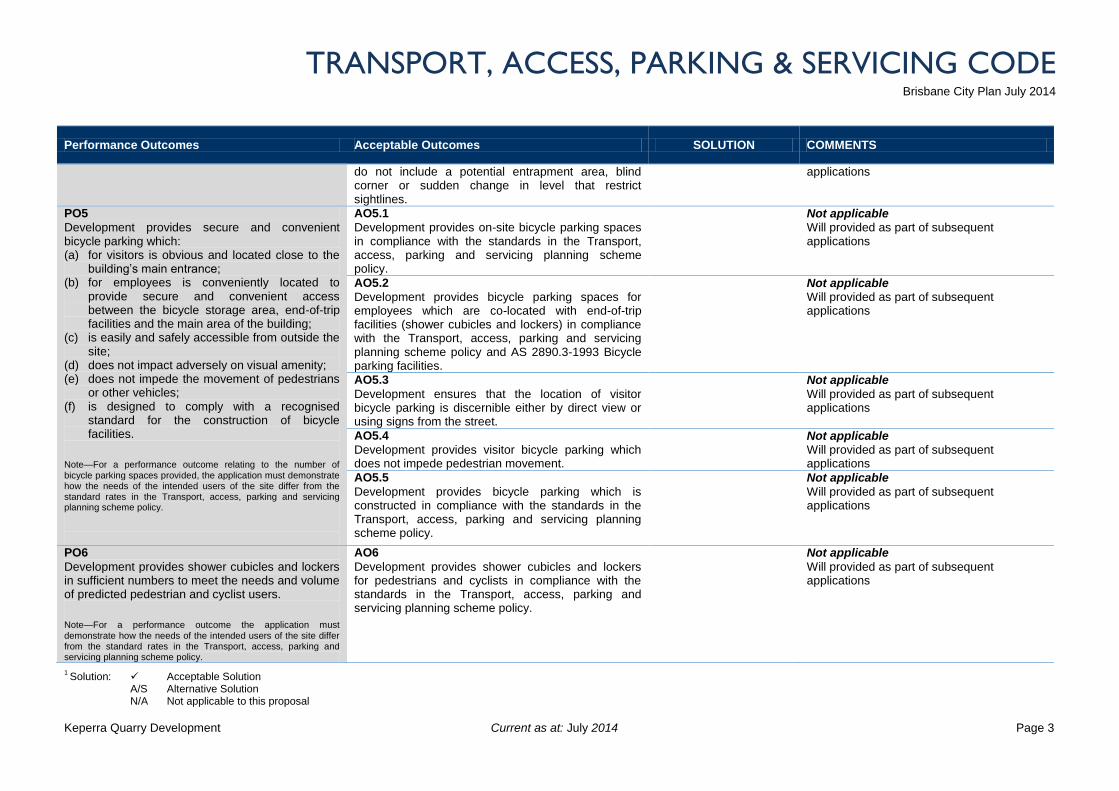
TRANSPORT, ACCESS, PARKING & SERVICING CODE Brisbane City Plan July 2014
1 Solution: Acceptable Solution
A/S Alternative Solution N/A Not applicable to this proposal
Keperra Quarry Development Current as at: July 2014 Page 3
Performance Outcomes Acceptable Outcomes SOLUTION COMMENTS
do not include a potential entrapment area, blind corner or sudden change in level that restrict sightlines.
applications
PO5
Development provides secure and convenient bicycle parking which: (a) for visitors is obvious and located close to the
building’s main entrance; (b) for employees is conveniently located to
provide secure and convenient access between the bicycle storage area, end-of-trip facilities and the main area of the building;
(c) is easily and safely accessible from outside the site;
(d) does not impact adversely on visual amenity; (e) does not impede the movement of pedestrians
or other vehicles; (f) is designed to comply with a recognised
standard for the construction of bicycle facilities.
Note—For a performance outcome relating to the number of bicycle parking spaces provided, the application must demonstrate how the needs of the intended users of the site differ from the standard rates in the Transport, access, parking and servicing planning scheme policy.
AO5.1
Development provides on-site bicycle parking spaces in compliance with the standards in the Transport, access, parking and servicing planning scheme policy.
Not applicable Will provided as part of subsequent applications
AO5.2
Development provides bicycle parking spaces for employees which are co-located with end-of-trip facilities (shower cubicles and lockers) in compliance with the Transport, access, parking and servicing planning scheme policy and AS 2890.3-1993 Bicycle parking facilities.
Not applicable Will provided as part of subsequent applications
AO5.3
Development ensures that the location of visitor bicycle parking is discernible either by direct view or using signs from the street.
Not applicable
Will provided as part of subsequent applications
AO5.4
Development provides visitor bicycle parking which does not impede pedestrian movement.
Not applicable Will provided as part of subsequent applications
AO5.5
Development provides bicycle parking which is constructed in compliance with the standards in the Transport, access, parking and servicing planning scheme policy.
Not applicable
Will provided as part of subsequent applications
PO6
Development provides shower cubicles and lockers in sufficient numbers to meet the needs and volume of predicted pedestrian and cyclist users.
Note—For a performance outcome the application must demonstrate how the needs of the intended users of the site differ from the standard rates in the Transport, access, parking and servicing planning scheme policy.
AO6
Development provides shower cubicles and lockers for pedestrians and cyclists in compliance with the standards in the Transport, access, parking and servicing planning scheme policy.
Not applicable
Will provided as part of subsequent applications
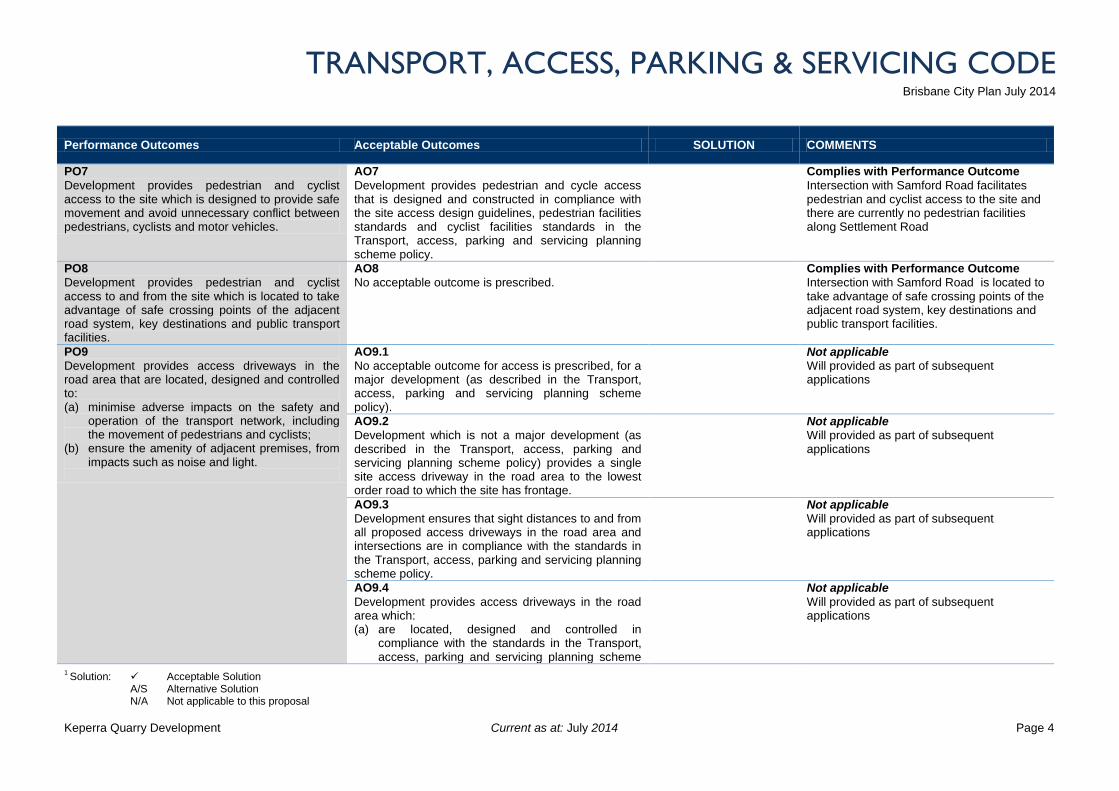
TRANSPORT, ACCESS, PARKING & SERVICING CODE Brisbane City Plan July 2014
1 Solution: Acceptable Solution
A/S Alternative Solution N/A Not applicable to this proposal
Keperra Quarry Development Current as at: July 2014 Page 4
Performance Outcomes Acceptable Outcomes SOLUTION COMMENTS
PO7
Development provides pedestrian and cyclist access to the site which is designed to provide safe movement and avoid unnecessary conflict between pedestrians, cyclists and motor vehicles.
AO7
Development provides pedestrian and cycle access that is designed and constructed in compliance with the site access design guidelines, pedestrian facilities standards and cyclist facilities standards in the Transport, access, parking and servicing planning scheme policy.
Complies with Performance Outcome
Intersection with Samford Road facilitates pedestrian and cyclist access to the site and there are currently no pedestrian facilities along Settlement Road
PO8
Development provides pedestrian and cyclist access to and from the site which is located to take advantage of safe crossing points of the adjacent road system, key destinations and public transport facilities.
AO8
No acceptable outcome is prescribed.
Complies with Performance Outcome
Intersection with Samford Road is located to take advantage of safe crossing points of the adjacent road system, key destinations and public transport facilities.
PO9
Development provides access driveways in the road area that are located, designed and controlled to: (a) minimise adverse impacts on the safety and
operation of the transport network, including the movement of pedestrians and cyclists;
(b) ensure the amenity of adjacent premises, from impacts such as noise and light.
AO9.1
No acceptable outcome for access is prescribed, for a major development (as described in the Transport, access, parking and servicing planning scheme policy).
Not applicable Will provided as part of subsequent applications
AO9.2
Development which is not a major development (as described in the Transport, access, parking and servicing planning scheme policy) provides a single site access driveway in the road area to the lowest order road to which the site has frontage.
Not applicable Will provided as part of subsequent applications
AO9.3
Development ensures that sight distances to and from all proposed access driveways in the road area and intersections are in compliance with the standards in the Transport, access, parking and servicing planning scheme policy.
Not applicable Will provided as part of subsequent applications
AO9.4
Development provides access driveways in the road area which: (a) are located, designed and controlled in
compliance with the standards in the Transport, access, parking and servicing planning scheme
Not applicable
Will provided as part of subsequent applications

TRANSPORT, ACCESS, PARKING & SERVICING CODE Brisbane City Plan July 2014
1 Solution: Acceptable Solution
A/S Alternative Solution N/A Not applicable to this proposal
Keperra Quarry Development Current as at: July 2014 Page 5
Performance Outcomes Acceptable Outcomes SOLUTION COMMENTS
policy; (b) are not provided through a bus stop, taxi rank or
pedestrian crossing or refuge.
AO9.5
Development makes provision for shared access arrangements particularly where it is necessary to limit access points to a major road.
Not applicable Will provided as part of subsequent applications
PO10
Redevelopment provides for: (a) the closure of all access driveways in the road
area that no longer comply with the standards in the Transport, access, parking and servicing planning scheme policy;
(b) the reinstatement of adjacent footpaths.
AO10
No acceptable outcome is prescribed.
Complies with Performance Outcome
The current driveway onto Settlement Road will be removed to facilitate the new priority controlled intersection.
PO11
Development provides that an internal approach to an access driveway in the road area is designed and located to provide for the safety of pedestrians and cyclists using paths adjacent to the frontage of the site, and motorists.
AO11.1
Development provides sight distances to and from all proposed access driveways in the road area and intersections which are in compliance with the standards in the Transport, access, parking and servicing planning scheme policy.
Not applicable Will provided as part of subsequent applications
AO11.2
Development ensures that convex mirrors are only used in a site: (a) as a secondary support at access driveways; (b) in addition to acceptable sight splays that comply
with the sight distances standards in the Transport, access, parking and servicing planning scheme policy.
Not applicable Will provided as part of subsequent applications
PO12
Development in the City core and City frame as identified in Figure a provides car parking spaces at rates to discourage private car use and encourage walking, cycling and the use of public transport.
AO12
Development in the City core and City frame as identified in Figure a provides maximum car-parking rates in compliance with the standards in the Transport, access, parking and servicing planning scheme policy.
Note—For self-assessable development including an existing
Not applicable Located outside of City core and City frame
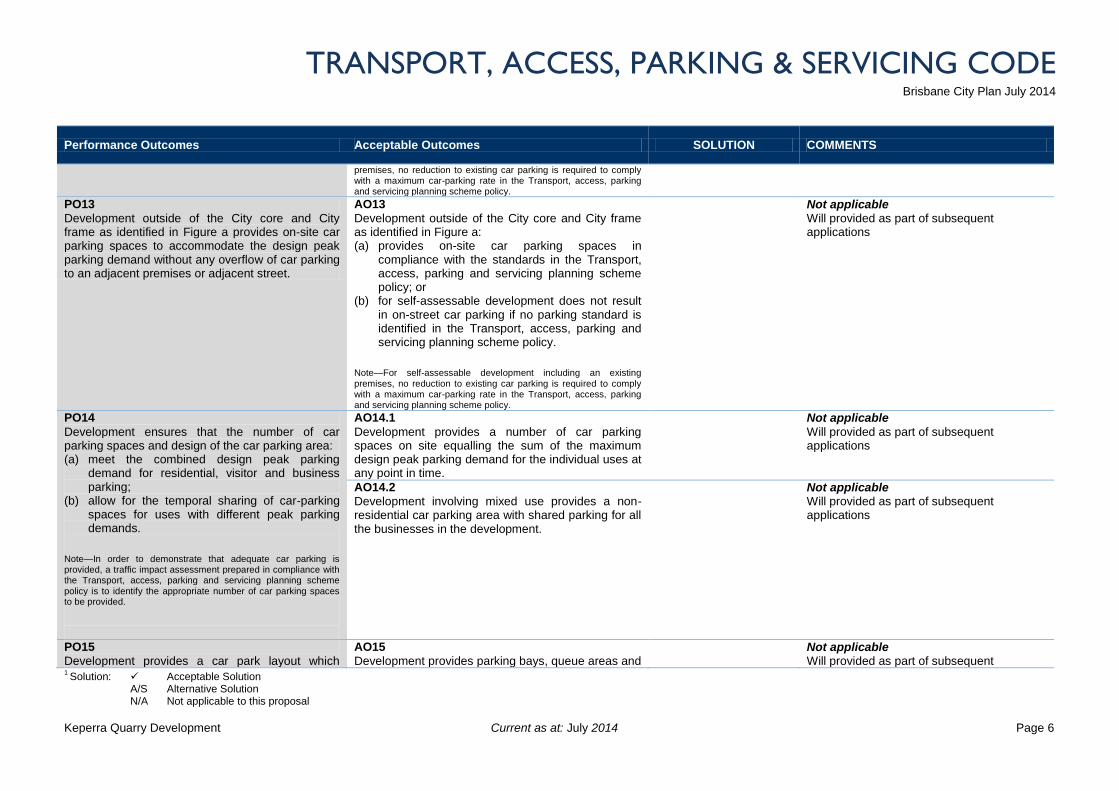
TRANSPORT, ACCESS, PARKING & SERVICING CODE Brisbane City Plan July 2014
1 Solution: Acceptable Solution
A/S Alternative Solution N/A Not applicable to this proposal
Keperra Quarry Development Current as at: July 2014 Page 6
Performance Outcomes Acceptable Outcomes SOLUTION COMMENTS
premises, no reduction to existing car parking is required to comply with a maximum car-parking rate in the Transport, access, parking and servicing planning scheme policy.
PO13
Development outside of the City core and City frame as identified in Figure a provides on-site car parking spaces to accommodate the design peak parking demand without any overflow of car parking to an adjacent premises or adjacent street.
AO13
Development outside of the City core and City frame as identified in Figure a: (a) provides on-site car parking spaces in
compliance with the standards in the Transport, access, parking and servicing planning scheme policy; or
(b) for self-assessable development does not result in on-street car parking if no parking standard is identified in the Transport, access, parking and servicing planning scheme policy.
Note—For self-assessable development including an existing premises, no reduction to existing car parking is required to comply with a maximum car-parking rate in the Transport, access, parking and servicing planning scheme policy.
Not applicable Will provided as part of subsequent applications
PO14
Development ensures that the number of car parking spaces and design of the car parking area: (a) meet the combined design peak parking
demand for residential, visitor and business parking;
(b) allow for the temporal sharing of car-parking spaces for uses with different peak parking demands.
Note—In order to demonstrate that adequate car parking is provided, a traffic impact assessment prepared in compliance with the Transport, access, parking and servicing planning scheme policy is to identify the appropriate number of car parking spaces to be provided.
AO14.1
Development provides a number of car parking spaces on site equalling the sum of the maximum design peak parking demand for the individual uses at any point in time.
Not applicable
Will provided as part of subsequent applications
AO14.2
Development involving mixed use provides a non-residential car parking area with shared parking for all the businesses in the development.
Not applicable Will provided as part of subsequent applications
PO15
Development provides a car park layout which
AO15
Development provides parking bays, queue areas and
Not applicable Will provided as part of subsequent

TRANSPORT, ACCESS, PARKING & SERVICING CODE Brisbane City Plan July 2014
1 Solution: Acceptable Solution
A/S Alternative Solution N/A Not applicable to this proposal
Keperra Quarry Development Current as at: July 2014 Page 7
Performance Outcomes Acceptable Outcomes SOLUTION COMMENTS
allows for on-site vehicle parking that: (a) is clearly defined, safe and easily accessible; (b) is designed to contain potential adverse
impacts within the site; (c) does not detract from the aesthetics or amenity
of an area; (d) discourages on-street parking if parking has an
adverse traffic management safety or amenity impact;
(e) is consistent with safe and convenient pedestrian and cyclist movement.
manoeuvring areas which are designed for the design service vehicle to the standards in the Transport, access, parking and servicing planning scheme policy.
applications
PO16
Development creates a safe environment by incorporating the key elements of crime prevention through environmental design.
AO16
Development incorporates the key elements of crime prevention through environmental design in its layout, building and structure design and landscaping by: (a) facilitating casual surveillance opportunities and
including good sightlines to publicly accessible areas such as car parks, pathways, public toilets and communal areas;
(b) defining different uses and ownerships through design and restricting access from non-residential uses into private residential dwellings;
(c) promoting safety and minimising opportunities for graffiti and vandalism through exterior building design and orientation of buildings and use of active frontages;
(d) ensuring publicly accessible areas such as car parks, pathways, public toilets and communal areas are well lit;
(e) including way-finding cues; (f) minimising predictable routes and entrapment
locations near public spaces such as car parks, public toilets, ATMs and communal areas.
Note—For guidance in achieving the key elements of crime prevention through environmental design, refer to the Crime
Not applicable Will provided as part of subsequent applications

TRANSPORT, ACCESS, PARKING & SERVICING CODE Brisbane City Plan July 2014
1 Solution: Acceptable Solution
A/S Alternative Solution N/A Not applicable to this proposal
Keperra Quarry Development Current as at: July 2014 Page 8
Performance Outcomes Acceptable Outcomes SOLUTION COMMENTS
prevention through environmental design planning scheme policy.
PO17
Development minimises the potential for graffiti and vandalism through access control, canvas reduction and easy maintenance selection.
AO17
Development incorporates graffiti and vandalism prevention techniques in its layout, building and structure design and landscaping, by: (a) denying access to potential canvas through
access control techniques; (b) reducing potential canvases through canvas
reduction techniques; (c) ensuring graffiti can be readily and quickly
removed through easy maintenance selection techniques.
Note—For guidance on graffiti and vandalism prevention techniques, refer to the Graffiti prevention planning scheme policy.
Not applicable
Will provided as part of subsequent applications
PO18
Development is serviced by an adequate number and size of service vehicles.
AO18
Development ensures that the number and size of design service vehicles selected for the site is in compliance with the standards in the Transport, access, parking and servicing planning scheme policy.
Not applicable Will provided as part of subsequent applications
PO19
Development layout provides for services which: (a) are wholly within the site; (b) are clearly defined, safe and easily accessible; (c) are designed to contain potential adverse
impacts of servicing within the site; (d) do not detract from the aesthetics or amenity of
the surrounding area.
AO19.1
Development ensures that a service bay provided on site: (a) is provided and designed to comply with the
design vehicle table and service area design standards in the Transport, access, parking and servicing planning scheme policy;
(b) is located away from street frontages and screened from adjoining premises.
Not applicable Will provided as part of subsequent applications
AO19.2
Development provides on-site servicing facilities and associated on-site vehicle manoeuvring areas which are designed in compliance with the service area design standards in the Transport, access, parking and servicing planning scheme policy.
Not applicable Will provided as part of subsequent applications

TRANSPORT, ACCESS, PARKING & SERVICING CODE Brisbane City Plan July 2014
1 Solution: Acceptable Solution
A/S Alternative Solution N/A Not applicable to this proposal
Keperra Quarry Development Current as at: July 2014 Page 9
Performance Outcomes Acceptable Outcomes SOLUTION COMMENTS
AO19.3
Development provides service areas for refuse collection in compliance with the standards in the Refuse planning scheme policy, Transport, access, parking and servicing planning scheme policy and the Infrastructure design planning scheme policy.
Not applicable Will provided as part of subsequent applications
PO20
Development provides service vehicle access routes to and from the site which minimise the impact on: (a) amenity and safety in residential areas; (b) streets not constructed to a standard that
accommodate increased heavy vehicle movements.
AO20
Development ensures that service vehicles use the shortest and most direct route to the major road network in compliance with the heavy vehicle standards in the Transport, access, parking and servicing planning scheme policy.
Not applicable Will provided as part of subsequent applications
If for development which is required to be serviced by a b-double (Austroad class 10 vehicle), multi-combination vehicle, over-dimensioned vehicle or any on vehicle identified by the Queensland Government as requiring a permit to operate on the road (freight-dependent development)
PO21
Development which is freight-dependent development ensures that the traffic generated by the development does not impact on: (a) the operation of the transport network; (b) the safety and amenity of a residential area; (c) a road not constructed to accommodate a non-
standard vehicle such as a road only constructed to accommodate a vehicle that has a legal right of access to all roads including Austroads vehicles classes 1–9.
AO21.1
Development which is freight-dependent development is located on a site which: (a) has frontage to or direct access to the freight
network in the Road hierarchy overlay via roads in a zone in the Industry zones category; or
(b) can be serviced by a route that can act as a primary freight access route and connect to an existing primary freight route without impacting on the safe operation of the road network in compliance with the heavy vehicle standards in the Transport, access, parking and servicing planning scheme policy.
Not applicable No freight proposed to the site
AO21.2
Development which is freight-dependent development provides any necessary upgrade to a road used as an access route in compliance with the Infrastructure design planning scheme policy.
Not applicable
No freight proposed to the site