Embed Size (px)
Citation preview

INTERIM REPORT
For the Financial Period Ended 30 June 2013
KENANGA BALANCED FUND

This page has been inten onally le blank.

KENANGA BALANCED FUND (KBF)Report to Unit Holders for the 6-Month Financial Period Ended 30 June 2013
Contents Page
CORPORATE DIRECTORY i
DIRECTORY OF MANAGER’S OFFICES ii
MANAGER’S REPORT 1- 8
1.0 FUND INFORMATION 1
2.0 FUND REVIEW 2
3.0 MARKET REVIEW & OUTLOOK 4
4.0 PERFORMANCE DATA 8
5.0 PORTFOLIO COMPOSITION 10
TRUSTEE’S REPORT 12
STATEMENT BY THE MANAGER 13
STATEMENT OF COMPREHENSIVE INCOME 14
STATEMENT OF FINANCIAL POSITION 15
STATEMENT OF CHANGES IN EQUITY 16
STATEMENT OF CASH FLOWS 17
NOTES TO THE FINANCIAL STATEMENTS 18 - 58
i
KENANGA BALANCED FUND (KBF)Report to Unit Holders for the 6-Month Financial Period Ended 30 June 2013
CORPORATE DIRECTORY
MANAGER: KENANGA INVESTORS BERHAD (Company No. 353563-P) REGISTERED OFFICE BUSINESS OFFICEKenanga Investors Berhad (KIB) Suite 12.02, 12th Floor, Kenanga Interna onal,8th Floor, Kenanga Interna onal, Jalan Sultan Ismail,Jalan Sultan Ismail, 50250 Kuala Lumpur, Malaysia.50250 Kuala Lumpur, Malaysia. Tel: 03-2057 3688 / 03-2713 3188Tel: 03-2162 1490 Fax: 03-2161 8807 / 03-2713 5868Fax: 03-2161 4990 E-mail: [email protected] Website: www.KenangaInvestors.com.my
BOARD OF DIRECTORSDatuk Syed Ahmad Alwee Alsree (Chairman)Syed Zafi len Syed Alwee (Independent Director)YM Raja Dato’ Seri Abdul Aziz bin Raja Salim (Independent Director)Vivek Sharma (Independent Director)Bruce Kho Yaw HuatAbdul Razak bin AhmadPeter John Rayner
COMPANY SECRETARY: Norliza Abd Samad, (MAICSA 7011089)9th Floor, Kenanga Interna onal, Jalan Sultan Ismail, 50250 Kuala Lumpur, Malaysia. TRUSTEE: HSBC (MALAYSIA) TRUSTEE BERHAD (Company No. 1281-T) REGISTERED AND BUSINESS OFFICE 13th Floor, Bangunan HSBC, South Tower, No.2, Leboh Ampang, 50100 Kuala Lumpur, Malaysia. Tel: 03-2075 7800 Fax: 03-2026 1273
AUDITOR: ERNST & YOUNG
Room 300-303, 3rd Floor, Wisma Bukit Mata Kuching, Jalan Tunku Abdul Rahman, 93100 Kuching, Sarawak, Malaysia.

ii
KENANGA BALANCED FUND (KBF)Report to Unit Holders for the 6-Month Financial Period Ended 30 June 2013
DIRECTORY OF MANAGER’S OFFICES
REGIONAL BRANCH OFFICES:
Kuala LumpurSuite 12.02, 12th FloorKenanga Interna onalJalan Sultan Ismail50250 Kuala Lumpur, MalaysiaTel: 03-2057 3688 / 03-2713 3188Fax: 03-2161 8807 / 03-2713 5868
Petaling JayaUnit B-6-2, Sunway Giza MallDataran Sunway, PJU 5/14Kota Damansara47810 Petaling JayaSelangor Darul EhsanTel: 03-6148 1871 / 03-6150 3983Fax: 03-6148 1872
KlangNo. 12 Jalan Batai Laut 3Taman Intan, 41300 KlangSelangor Darul EhsanTel:03-3341 8818 / 03-3348 7889Fax:03-3341 8816
PenangBlok A, Aras 3,Wisma PerkesoNo. 269, Jalan Burma10538 George Town, PenangTel: 04-226 4880Fax: 04-226 5120
MelakaNo. 25-1 Jalan Kota Laksamana 2/17Taman Kota Laksamana Seksyen 275200 MelakaTel: 06-281 8913 / 06-282 0518Fax: 06-281 4286
Agency Offi ceMiri (Sarawak)c/o Lot 1084, 2nd Floor,Jalan Merpa 98000 MiriSarawak, MalaysiaTel: 085-427 782
Johor BahruLot 11.03, 11th FloorMenara MSC Cyberport5 Jalan Bukit Meldrum80300 Johor Bahru, JohorTel: 07-223 7505 / 4798Fax: 07-223 4802
Kuching1st Floor, No 71, Lot 7Lot 10900, Jalan Tun Jugah93350 Kuching, SarawakTel: 082-572 228Fax: 082-572 229
Kota KinabaluA-03-11, 3rd FloorBlock A Warisan SquareJalan Tun Fuad Stephens88000 Kota Kinabalu, SabahTel: 088-447 089 / 088-448 106Fax: 088-447 039
IpohNo. 5A, Persiaran Greentown 9Greentown Business Centre30450 IpohPerak Darul RidzuanTel: 05-254 7573 / 7570Fax: 05-254 7606
SerembanSuite 08-3, Seremban City CentreJalan Pasar70000 SerembanTel: 06-761 5678Fax: 06-761 2243
1
KENANGA BALANCED FUND (KBF)Report to Unit Holders for the 6-Month Financial Period Ended 30 June 2013
MANAGER’S REPORT
Dear Unit Holders,
We are pleased to present the Manager’s interim report and the fi nancial statements of the KENANGA BALANCED FUND for the 6-month fi nancial period ended 30 June 2013.
1.0 FUND INFORMATION
1.1 Fund Name KENANGA BALANCED FUND (KBF or the Fund)
1.2 Fund Category / Type Balanced / Growth & Income
1.3 Investment Objec ve The Fund aims to provide a por olio of investments with lower risk and lower vola lity for
investors.
1.4 Investment Strategy The Fund will invest in a balanced por olio of equi es, equity-related securi es, and fi xed income
securi es.
1.5 Asset Alloca on Maximum 60% in equi es, maximum 40% in fi xed income instruments and minimum 2% in liquid
assets.
1.6 Dura on The Fund was launched on 23 May 2001 and shall exist as long as it appears to the Manager and
the Trustee that it is in the interests of the unit holders for it to con nue.
1.7 Performance Benchmark 60% FTSE-Bursa Malaysia 100 Index and 40% Maybank 12-month Fixed Deposit Rate.
1.8 Distribu on Policy The Fund aims to pay a regular distribu on annually, where possible.

2
KENANGA BALANCED FUND (KBF)Report to Unit Holders for the 6-Month Financial Period Ended 30 June 2013
2.0 FUND REVIEW
2.1 Fund performance vs benchmark performance
NAV per unit (RM)1 Fund Return3 Benchmark Return3
30/6/2013 30/6/20122 (%) (%) 0.4255 0.4284 5.77 5.63
1 Published NAV per unit based on last done price. 2 On 31 December 2012, the Manager declared gross dividend of 2.62 sen per unit. 3 Source: Lipper. Performance returns are adjusted for all distribu ons (on a reinvested basis) and unit splits. .
For the 6-months period under review to 30th June 2013, the Fund has appreciated 5.77%, out-performing the 5.63% increase in its Benchmark (60% FBM100 Index + 40% Maybank 12-month Fixed Deposit rate). The out-performance was mainly due to increased in equity alloca on and strength in stock picking strategy.
2.2 Has the Fund achieved its objec ve?
Since incep on date, the Fund has appreciated by 174.51%* in Net Asset Value terms while its benchmark rose 167.11%. In terms of risk and vola lity, as at 30 June 2013, the Fund a ained a 3-year annualised standard devia on of 7.86, classifi ed as LOW under the Lipper Fund Vola lity Classifi ca on, thus achieving the Fund’s stated objec ve of providing investments with lower risk and lower vola lity for investors.
* Source: Lipper.
2.3 Strategies & policies employed
During the period under review, the Fund invested mainly in the Malaysian equi es ranging between 50% to 58% of the Fund’s NAV. Fixed income securi es cons tuted less than 35% of the fund’s NAV mainly due to the limited size of the fund. Cash was kept between the levels of around 12% to 24% of NAV.
For equity, we engaged in gradual profi t taking and had immediately redeployed the cash into the stocks that we favoured strongly. We maintained our barbell strategy of holding a good balance of high yielding/defensive stocks and beta stocks. The former allows us to reduce the por olio vola lity during the uncertain period, whilst the la er captures extra performance when risk appe te return. We liked companies in the banking, oil and gas, consumer, and property/REITs.
For the period under review, the Fund invested primarily in a diversifi ed por olio of high grade corporate bonds and money market instruments. Given the small fund size however, it remained a challenge to fully undertake meaningful bond strategy to improve the performance of the Fund.
2.4 State of Aff airs of the Fund
There were no other signifi cant changes to the state of aff airs of the Fund and no circumstances that materially aff ect the interests of Unit Holders up to the date of this Manager’s report.
3
KENANGA BALANCED FUND (KBF)Report to Unit Holders for the 6-Month Financial Period Ended 30 June 2013
2.5 Unit Holders’ Profi le
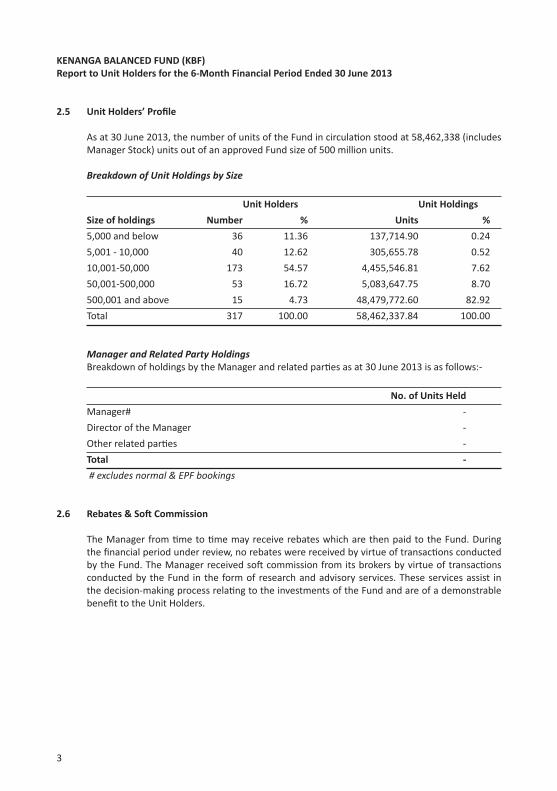
As at 30 June 2013, the number of units of the Fund in circula on stood at 58,462,338 (includes Manager Stock) units out of an approved Fund size of 500 million units.
Breakdown of Unit Holdings by Size Unit Holders Unit Holdings Size of holdings Number % Units % 5,000 and below 36 11.36 137,714.90 0.24 5,001 - 10,000 40 12.62 305,655.78 0.52 10,001-50,000 173 54.57 4,455,546.81 7.62 50,001-500,000 53 16.72 5,083,647.75 8.70 500,001 and above 15 4.73 48,479,772.60 82.92 Total 317 100.00 58,462,337.84 100.00
Manager and Related Party Holdings Breakdown of holdings by the Manager and related par es as at 30 June 2013 is as follows:- No. of Units Held Manager# - Director of the Manager - Other related par es -
Total - # excludes normal & EPF bookings
2.6 Rebates & So Commission
The Manager from me to me may receive rebates which are then paid to the Fund. During the fi nancial period under review, no rebates were received by virtue of transac ons conducted by the Fund. The Manager received so commission from its brokers by virtue of transac ons conducted by the Fund in the form of research and advisory services. These services assist in the decision-making process rela ng to the investments of the Fund and are of a demonstrable benefi t to the Unit Holders.

4
KENANGA BALANCED FUND (KBF)Report to Unit Holders for the 6-Month Financial Period Ended 30 June 2013
3.0 MARKET REVIEW & OUTLOOK
3.1 Market Review
Equity Market Review
The stock market closed the year 2012 with an all me high index point of 1,688.95 a bit higher than our best case scenario which we forecasted back in January 2012. Nevertheless the index movement was driven mainly by high dividend yield stocks throughout the year (maybe out of fear of high vola lity market due to upcoming General Elec on) whereas GDP outcome the fi rst 9 months of 2012 showed strong set of numbers. For December itself, KLCI moved up 4.85% which was marked by window dressing of the larger cap stocks. There were a bit of movement driven by mergers & acquisi on on stocks linked to Tan Sri Syed Mokhtar Al Bukhary.
During the month, crude oil and crude palm oil showed price strength where both reached USD 91.82/barrel and RM 2,320/tonne from USD 88.91 and RM2,145 from a month ago respec vely.
In January, a dark contrast to previous month, the FBM KLCI went down by 3.64% due to obvious reasons. Amongst them are seamless correc ons to last month window dressing eff orts and later on some profi t taking ac vi es coming near to Chinese New Year holidays. Topping on to that, most investors are more convinced that the Malaysian House of parliament will be dissolved in mid February to make way for the 13th General Elec on to be held in March school holidays, hence the “stay away strategy” kicked in.
Analysing the pool of stocks that dragged the index down this month, we saw much of them are largely blue chip stocks spreading across all sectors. This is a sign of systema c correc on specifi cally for Malaysia only, as the other markets in the region recorded posi ve performance. Market succumbed to correc on even when commodity markets experienced a good run up. Crude oil and crude palm oil prices con nued their strength reaching USD 97.49/barrel and RM 2,512/tonne respec vely.
The FBM KLCI was trading quite fl a sh in February as it grew by only 0.62%. Market players stayed on the sideline trying their very best to gauge on the date for the Malaysian Parliament to be dissolved; making way for the 13th General Elec on. There were two a empts to ditch the market during this month which had led the FBM KLCI touching 1613-1614 index point levels before ending the month at 1637.39 points.
There were several surprising news during February but had hardly made infl uence to market players. Malaysia’s 2012 GDP grew stronger than analysts’ expecta on at 5.6% led by investments. 4th quarter GDP came strongly at 6.4% YoY. The government of Malaysia and Singapore had jointly announced the High Speed Rail linking Singapore and Kuala Lumpur, said to be worth RM20 billion (US$6.7bn) and the Johor-Singapore Rapid transit system as well as other joint developments in Iskandar and Singapore.
Crude oil and crude palm oil prices showed weakness where it closed at USD 92.05/barrel and RM 2,375/tone.

5
KENANGA BALANCED FUND (KBF)Report to Unit Holders for the 6-Month Financial Period Ended 30 June 2013
The FBM KLCI had a good run in March, mainly playing catch-up to its outperforming regional peers. With the global equity markets con nued to rise further, foreign funds were reportedly buying into Malaysian equi es despite the looming elec on fears. MoM, the FBMKLCI index grew 2.08%, with the small-to-mid-caps being the biggest winner, evidently shown by the stronger MoM gain of 5.9% in FBM Small Cap index.
In April, the market gained another 46 points reaching the level of 1,717.65 points (its highest point). Buying was mainly focused on the index linked stocks this month as buying in small-mid cap stocks took a backseat. As expected investors focus this month was mainly about poli cs as the Prime Minister Datuk Seri Najib fi nally dissolved the parliament on the 3rd of April with elec on to be held on 5th May 2013. MoM, the FBMKLCI index grew another 2.75% with average daily value traded on Bursa was 4% higher MoM to RM1.85bn, in line with the gain in the FBM KLCI during the month.
Finally, the elec on overhang is over. Barisan Nasional won 133 out of 222 parliament seats allowing it to hold on to power for the next term. The stock market moved up strongly, indica ng posi ve con nua on of growth policy and transforma on programme, making it able to catch up with regional performance
The FBM KLCI added another 51.57 points or 3.0% reaching the level of 1,769.71 in May marking a con nua on pa ern of a bull run for 2013. The broader index, FBM100 Index moved even faster by 5.08% which are led by small to mid-sized capitaliza on stocks. The FBM Small Cap Index shot up by 24.13% this month while its YTD return is 30.41%. The market surged on the back of Barisan Nasional’s 13th general elec on (GE13) win. The margin of victory at 60% (vs 63% in 2008) of parliament seats was suffi cient to ensure a secure and stable government for the next 4-5 years.
Foreign par cipa on averaged 26.1% for May, compared to 28.1% for April. Hence much of the rally is being pushed by local investors who had been holding heavier cash posi on prior to GE13 results. On top of that, May’s 1Q13 corporate results season was encouraging in that earnings cuts were the mildest in four quarters. Earnings cut were inevitable due to lower CPO prices and weak external factors.
Fixed Income Market Review
The local bond market were generally steady during the fi rst 4 months of the fi nancial year 2013, but start to rally upon the no ce of dissolu on of the Malaysian parliament to make way for the 13th general elec on. The results that maintained Barisan Nasional to lead the Federal government provided further impetus for yields to rally further. However, this was short-lived as The Fed chairman Ben Bernanke ini ally tes fi ed to the US Congress on 22 May 2013 that the central bank will mull the scale back of QE going forward if the US economy shows signs of stable improvements, which caused the US Treasuries and global emerging bond markets succumbing to selling pressure.
Bank Negara Malaysia held three Monetary Policy Commi ee (MPC) mee ngs in January, March and in May 2013, held the Overnight Policy Rate (OPR) at 3.00% each me. At the latest MPC mee ng in May 2013, as it held the OPR as expected, Bank Negara weighed global and domes c economic condi ons. It said the current OPR of 3.00% is deemed appropriate to keep domes c demand going whilst infl a on expecta ons are modest. The MPC decisions were well within expecta ons and had muted impact to the bond market.

6
KENANGA BALANCED FUND (KBF)Report to Unit Holders for the 6-Month Financial Period Ended 30 June 2013
Despite the selling pressure, local MGS yields were s ll overall lower by 3-8bps over the 6-month period.
Corporate bond yield on the hand, were steadily declining driven mostly by local demand and the shortage of new primary bond issuance during the period under review. There was an increase in ac vity, especially during 2Q2013, of about RM 12 billion monthly. The steady volume traded was buoyed by fi rm net buying interest, as the prior rally along the MGS segment in late 2012-early 2013 drove investors into the credit segment in search for yield pickup.
Total corporate bond issuance was RM13.9 billion in 1Q2013, aided by a number of large off erings by government linked companies such as DanaInfra Nasional and Turus Pesawat. Total issuance fell to around RM11.1 billion in 2Q2013. The lower issuance total in the second quarter was partly due to inherent poli cal risks (ahead of the 13th general elec on) and as government bond yields surged in May and June 2013 which could have delayed some poten al off erings.
3.2 Market Outlook
We expect 3Q2013 to be in consolida ve mode given the prospects of the US QE being tapered off . We believe the market will experience heightened vola lity in view of poten al por olio ou lows to developed markets in view of improvement in the underlying economy which in turn fuels corporate earnings. Having said that, this may just be a temporary phase of adjustment due to the reversal of short term capital, which incidentally will coincide with the lull month of Ramadan.
The Malaysian equity market remains supported by strong fundamentals underpinned by its sustainable GDP growth of 5.1% in 2013 and 5.4% in 2014 which is driven by private consump on growth and the new investment cycle; and strong domes c liquidity. Hence we feel by end of 2H2013, market condi ons will improve further from current levels.
Fixed Income Outlook
A er May 2013, the selling pressure in the bond market intensifi ed with yields surging 15-20bps in June. While yields are now range bound at higher levels, the immediate direc on of the MGS may depend on the US Treasuries, which appeared to be torn between the percep on that the selldowns in the emerging market bonds and UST are overdone as the pace of US economic recovery does not warrant for a QE tapering yet, against the percep on that yields have more upside in the short term on the back of op mis c hint from the US central bank. We expect yields to be subjected to more vola lity in the immediate term, which may depend largely on incoming economic data.
The local sovereign bond market, similar to its emerging market regional peers, are subject to risk of por olio ou lows from MGS as foreign holdings in MGS remains high at above 42%. However, we do not expect exodus of ou low from MYR, as carry trades are s ll posi ve. Furthermore, the excess liquidity of local funds is expected to con nue suppor ng the market. The local corporate bond market may more price stability than the sovereign markets, as most investors in the asset class are long term domes c investors.
Separately, we expect Malaysia’s healthy fundamentals to remain intact. The offi cial 2013 GDP target of 5%-6% are s ll confi dently achievable, together with a target infl a on of less than 3%.

7
KENANGA BALANCED FUND (KBF)Report to Unit Holders for the 6-Month Financial Period Ended 30 June 2013
In light of this, the coming monetary policy commi ee (MPC) mee ng on 11 July is expected to maintain the overnight policy rate (OPR) at 3.00%.
3.3 Strategy
We maintain our barbell strategy of holding a good balance of high yielding/defensive stocks and beta stocks. We will con nue to deploy the excess funds on dips, as we believe market will fare be er in 2H due to improving economic condi ons.
Our stock selec on will move towards sectors that will benefi t from being the main drivers of the economy such as the oil & gas, construc on and planta on sector. This will be balanced out with having a por on of your por olio invested in high yielding stocks to ensure stability. Sectors that we favour include consumer staples, FMCG, and gloves, and selec ve technology stocks.
In light of the short term uncertain es in the sovereign bond market, we target to focus on the corporate bond. We prefer lower rated credit for yield enhancement as strength of the local credit environment remains intact. We are also targe ng to rebalance the por olio to a neutral dura on to mi gate poten al vola lity in the short term.
8
KENANGA BALANCED FUND (KBF)Report to Unit Holders for the 6-Month Financial Period Ended 30 June 2013
4.0 PERFORMANCE DATA
4.1 Performance Chart
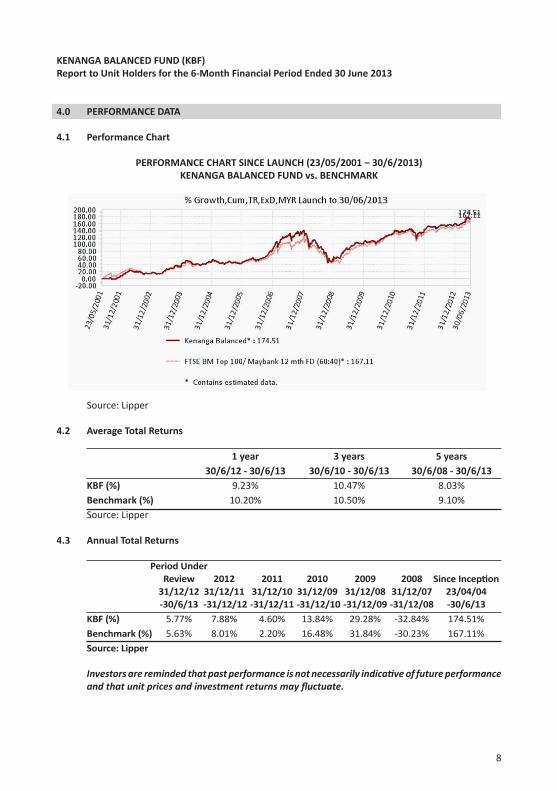
PERFORMANCE CHART SINCE LAUNCH (23/05/2001 – 30/6/2013)KENANGA BALANCED FUND vs. BENCHMARK
Source: Lipper
4.2 Average Total Returns
1 year 3 years 5 years 30/6/12 - 30/6/13 30/6/10 - 30/6/13 30/6/08 - 30/6/13 KBF (%) 9.23% 10.47% 8.03% Benchmark (%) 10.20% 10.50% 9.10% Source: Lipper
4.3 Annual Total Returns Period Under Review 2012 2011 2010 2009 2008 Since Incep on 31/12/12 31/12/11 31/12/10 31/12/09 31/12/08 31/12/07 23/04/04 -30/6/13 -31/12/12 -31/12/11 -31/12/10 -31/12/09 -31/12/08 -30/6/13 KBF (%) 5.77% 7.88% 4.60% 13.84% 29.28% -32.84% 174.51% Benchmark (%) 5.63% 8.01% 2.20% 16.48% 31.84% -30.23% 167.11% Source: Lipper
Investors are reminded that past performance is not necessarily indica ve of future performance and that unit prices and investment returns may fl uctuate.

9
KENANGA BALANCED FUND (KBF)Report to Unit Holders for the 6-Month Financial Period Ended 30 June 2013
4.4 Other Performance Data Performance details of the Fund as at 30 June 2013 and the two previous fi nancial years are as
follows: 6-months ended 12-months ended 12-months ended 12-months ended
30/6/2013 31/12/2012 31/12/2011 31/12/2010 Net Asset Value (RM’000 ) 1 24,878 24,952 23,937 26,599 0.4284 cd 0.4283 cd 0.4453 cd 0.4024 xd 0.4035 xd 0.4164 xd Units In Circula on (‘000 units) 58,462 58,240 59,318 63,883 Highest Net Asset Value Per Unit (RM) 0.4324 0.4284 0.4364 0.4500 Lowest Net Asset Value Per Unit (RM) 0.3931 0.3996 0.3827 0.3892 Total Return (%) 2 5.77 7.88 2.88 11.94 - Capital Growth (%) 2 5.77 (0.30) (3.10) 4.68 - Gross Income Distribu on (%) - 8.18 5.95 8.75 Gross Distribu on Per Unit (RM) - 0.0262 0.0321 0.0364 Net Distribu on Per Unit (RM) - 0.0261 0.0248 0.0290 Unit Split (Ra o) - - - - Management Expenses Ra o (%) 3 0.89 2.23 1.69 1.53 Por olio Turnover ( mes) 4 0.42 0.85 0.48 0.50
Source: Lipper
1 NAV computed based on last done price. 2 Source: Lipper. Total return is the annualised return of the Fund for the respec ve fi nancial
period / years computed based on the net asset value per unit and net of all fees. 3 Management Expense Ra o (MER) is computed based on the total fees and expenses incurred
by the Fund divided by the average fund size calculated on a daily basis. MER is lower against previous fi nancial years as the computa ons are for 6 months only.
4 Por olio Turnover Ra o (PTR) is computed based on the average of the total acquisi ons and total disposals of investment securi es of the Fund divided by the average fund size calculated on a daily basis. PTR is lower against previous years as the computa ons are for 6 months only.
4.5 Distribu on / Unit Split for the Period under Review
No distribu on / unit split was made during the period under review.
Investors are reminded that past performance is not necessarily indica ve of future performance and that unit prices and investment returns may fl uctuate.
Net Asset Value Per Unit (RM) 0.4255
10
KENANGA BALANCED FUND (KBF)Report to Unit Holders for the 6-Month Financial Period Ended 30 June 2013
5.0 PORTFOLIO COMPOSITION
5.1 Por olio Composi on
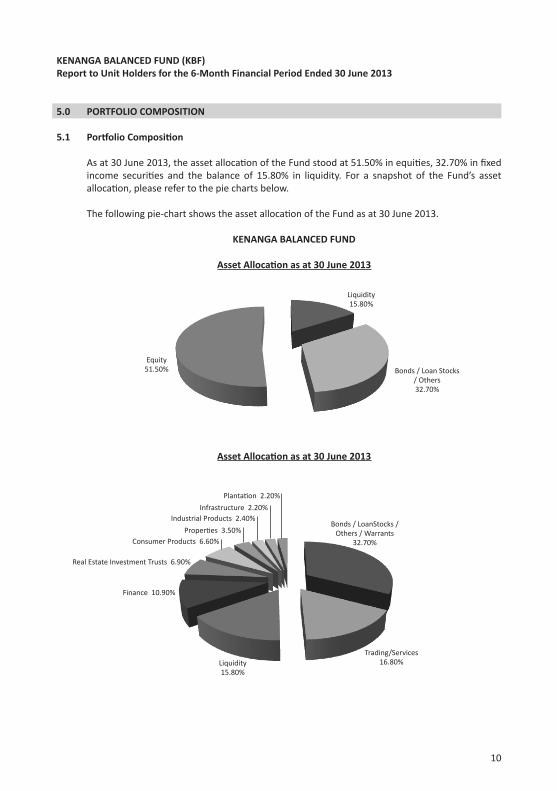
As at 30 June 2013, the asset alloca on of the Fund stood at 51.50% in equi es, 32.70% in fi xed income securi es and the balance of 15.80% in liquidity. For a snapshot of the Fund’s asset alloca on, please refer to the pie charts below.
The following pie-chart shows the asset alloca on of the Fund as at 30 June 2013. KENANGA BALANCED FUND
Asset Alloca on as at 30 June 2013
Asset Alloca on as at 30 June 2013
Infrastructure 2.20%Planta on 2.20%
Industrial Products 2.40%Proper es 3.50%
Consumer Products 6.60%
Real Estate Investment Trusts 6.90%
Finance 10.90%
Liquidity15.80%
Trading/Services16.80%
Bonds / LoanStocks / Others / Warrants
32.70%
Bonds / Loan Stocks / Others32.70%
Equity51.50%
Liquidity15.80%

11
KENANGA BALANCED FUND (KBF)Report to Unit Holders for the 6-Month Financial Period Ended 30 June 2013
5.2 Por olio Composi on – Compara ve Table Details of por olio composi on of the Fund as at 30 June 2013 and the two previous fi nancial
years are as follows:
Sectors 30/6/2013 31/12/2012 31/12/2011 31/12/2010 % of NAV % of NAV % of NAV % of NAV
Main Board Construc on - 3.76 12.69 4.33 Consumer Products 6.60 8.27 2.42 8.10 Industrial Products 2.40 1.77 3.73 1.23 Infrastructure Project Companies 2.20 4.09 - 2.74 Planta on 2.20 - 3.41 5.25 Proper es 3.50 - 2.21 2.64 Trading / Services 16.80 22.97 21.67 17.19 Finance 10.90 11.70 13.41 21.38 Technology - - - - ACE Market - - - -
Deriva ve Securi es Warrants / ICULS - 0.08 - -
Trust, REITs 6.90 5.31 - - Preference Shares - - - - Total quoted/ unquoted investment 51.50 57.95 59.54 62.86 Fixed Income Securi es 32.70 25.29 27.06 28.60 Collec ve Investment Scheme - - - - Liquidity (Cash at Banks / Receivables) 15.80 16.76 13.40 8.54 Total 100.00 100.00 100.00 100.00
12
KENANGA BALANCED FUND (KBF)Report to Unit Holders for the 6-Month Financial Period Ended 30 June 2013
TRUSTEE’S REPORT
To the Unit Holders of Kenanga Balanced Fund
We have acted as Trustee of Kenanga Balanced Fund (“the Fund”) for the fi nancial period ended 30 June 2013. To the best of our knowledge, Kenanga Investors Berhad (“the Manager”), has operated and managed the Fund in accordance with the following:
(a) limita ons imposed on the investment powers of the Manager and the Trustee under the Deed, the Securi es Commission’s Guidelines on Unit Trust Funds in Malaysia, the Capital Markets and Services Act 2007 and other applicable laws;
(b) valua on/pricing is carried out in accordance with the Deed and any regulatory requirements;
and (c) crea on and cancella on of units are carried out in accordance with the Deed and any regulatory
requirements. For HSBC (Malaysia) Trustee Berhad
Tan Bee Nie Head, Trustee Opera ons
Kuala Lumpur, Malaysia 28 August 2013
13
KENANGA BALANCED FUND (KBF)Report to Unit Holders for the 6-Month Financial Period Ended 30 June 2013
STATEMENT BY THE MANAGER
To the Unit Holders of Kenanga Balanced Fund
We, Abdul Razak Bin Ahmad and Bruce Kho Yaw Huat, being two of the directors of Kenanga Investors Berhad, the Manager, do hereby state that in the opinion of the Manager, the accompanying fi nancial statements set out on pages 14 to 58 are drawn up in accordance with Malaysian Financial Repor ng Standards, Interna onal Financial Repor ng Standards and Securi es Commission’s Guidelines on Unit Trust Funds in Malaysia so as to give a true and fair view of the fi nancial posi on of Kenanga Balanced Fund as at 30 June 2013 and of its fi nancial performance and cash fl ows for the fi nancial period then ended.
The fi nancial statements also comply with the Interna onal Financial Repor ng Standards as issued by the Interna onal Financial Repor ng Board.
For and on behalf of the Manager,Kenanga Investors Berhad
Bruce Kho Yaw Huat Abdul Razak Bin AhmadDirector Director
Kuala Lumpur, Malaysia28 August 2013
14
KENANGA BALANCED FUND (KBF)
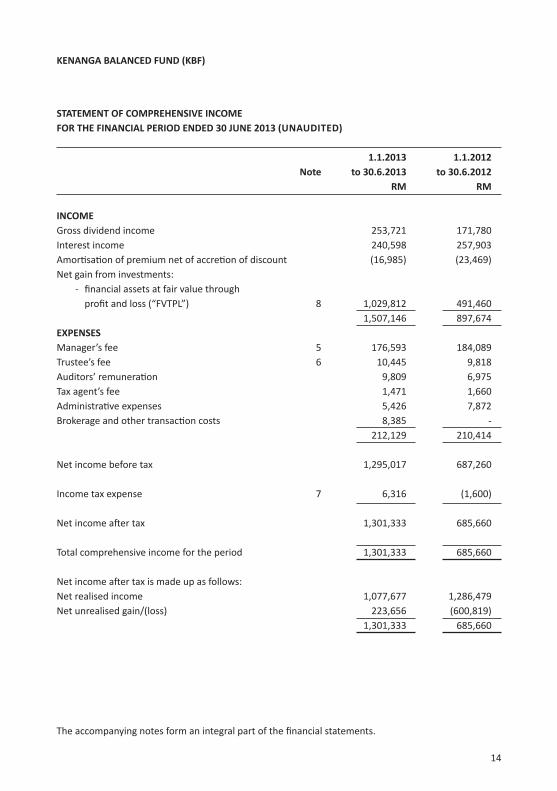
STATEMENT OF COMPREHENSIVE INCOME FOR THE FINANCIAL PERIOD ENDED 30 JUNE 2013 (UNAUDITED)
1.1.2013 1.1.2012 Note to 30.6.2013 to 30.6.2012 RM RM
INCOMEGross dividend income 253,721 171,780Interest income 240,598 257,903Amor sa on of premium net of accre on of discount (16,985) (23,469)Net gain from investments: - fi nancial assets at fair value through profi t and loss (“FVTPL”) 8 1,029,812 491,460
1,507,146 897,674EXPENSESManager’s fee 5 176,593 184,089Trustee’s fee 6 10,445 9,818Auditors’ remunera on 9,809 6,975Tax agent’s fee 1,471 1,660Administra ve expenses 5,426 7,872Brokerage and other transac on costs 8,385 - 212,129 210,414
Net income before tax 1,295,017 687,260
Income tax expense 7 6,316 (1,600)
Net income a er tax 1,301,333 685,660
Total comprehensive income for the period 1,301,333 685,660
Net income a er tax is made up as follows: Net realised income 1,077,677 1,286,479Net unrealised gain/(loss) 223,656 (600,819) 1,301,333 685,660
The accompanying notes form an integral part of the fi nancial statements.
The accompanying notes form an integral part of the fi nancial statements.
15
KENANGA BALANCED FUND (KBF)
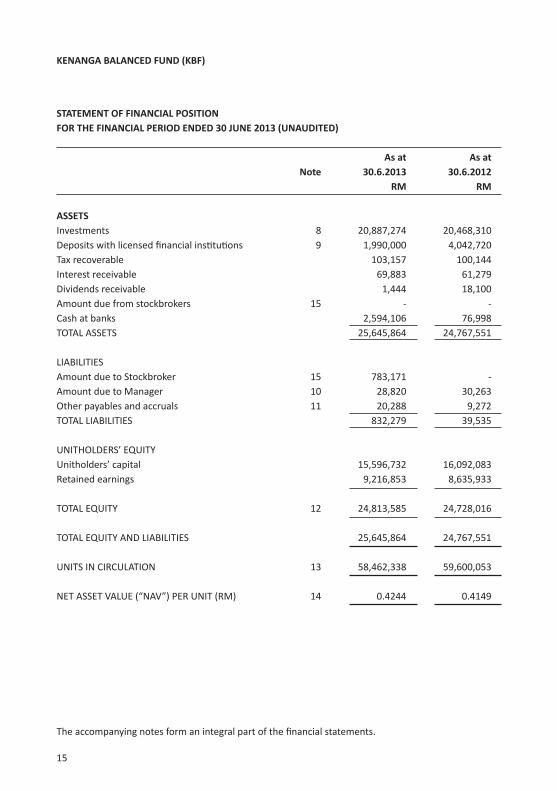
STATEMENT OF FINANCIAL POSITIONFOR THE FINANCIAL PERIOD ENDED 30 JUNE 2013 (UNAUDITED)
As at As at Note 30.6.2013 30.6.2012 RM RM
ASSETSInvestments 8 20,887,274 20,468,310Deposits with licensed fi nancial ins tu ons 9 1,990,000 4,042,720Tax recoverable 103,157 100,144Interest receivable 69,883 61,279Dividends receivable 1,444 18,100Amount due from stockbrokers 15 - -Cash at banks 2,594,106 76,998TOTAL ASSETS 25,645,864 24,767,551
LIABILITIESAmount due to Stockbroker 15 783,171 -Amount due to Manager 10 28,820 30,263Other payables and accruals 11 20,288 9,272TOTAL LIABILITIES 832,279 39,535
UNITHOLDERS’ EQUITYUnitholders’ capital 15,596,732 16,092,083 Retained earnings 9,216,853 8,635,933
TOTAL EQUITY 12 24,813,585 24,728,016
TOTAL EQUITY AND LIABILITIES 25,645,864 24,767,551
UNITS IN CIRCULATION 13 58,462,338 59,600,053
NET ASSET VALUE (“NAV”) PER UNIT (RM) 14 0.4244 0.4149
The accompanying notes form an integral part of the fi nancial statements.
16
KENANGA BALANCED FUND (KBF)
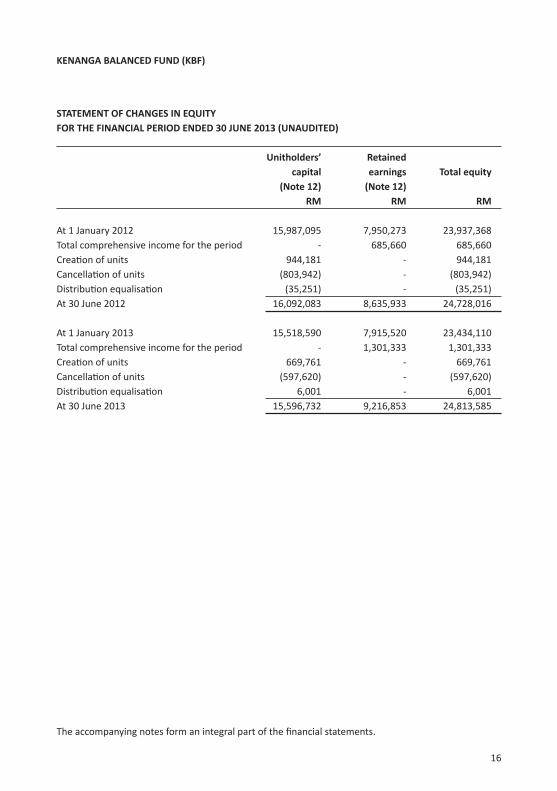
STATEMENT OF CHANGES IN EQUITYFOR THE FINANCIAL PERIOD ENDED 30 JUNE 2013 (UNAUDITED)
Unitholders’ Retained capital earnings Total equity
(Note 12) (Note 12) RM RM RM At 1 January 2012 15,987,095 7,950,273 23,937,368Total comprehensive income for the period - 685,660 685,660Crea on of units 944,181 - 944,181Cancella on of units (803,942) - (803,942)Distribu on equalisa on (35,251) - (35,251)At 30 June 2012 16,092,083 8,635,933 24,728,016
At 1 January 2013 15,518,590 7,915,520 23,434,110Total comprehensive income for the period - 1,301,333 1,301,333Crea on of units 669,761 - 669,761Cancella on of units (597,620) - (597,620)Distribu on equalisa on 6,001 - 6,001At 30 June 2013 15,596,732 9,216,853 24,813,585
17
KENANGA BALANCED FUND (KBF)
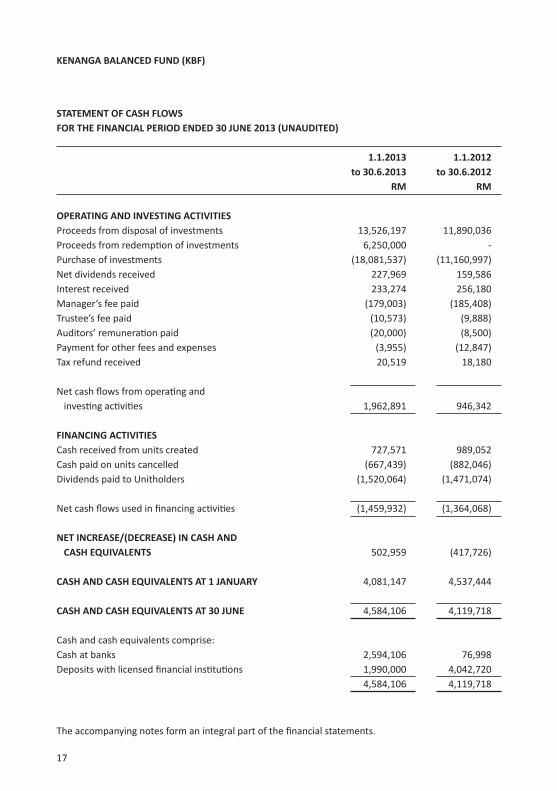
STATEMENT OF CASH FLOWS FOR THE FINANCIAL PERIOD ENDED 30 JUNE 2013 (UNAUDITED)
1.1.2013 1.1.2012 to 30.6.2013 to 30.6.2012 RM RM
OPERATING AND INVESTING ACTIVITIESProceeds from disposal of investments 13,526,197 11,890,036Proceeds from redemp on of investments 6,250,000 -Purchase of investments (18,081,537) (11,160,997)Net dividends received 227,969 159,586Interest received 233,274 256,180Manager’s fee paid (179,003) (185,408)Trustee’s fee paid (10,573) (9,888)Auditors’ remunera on paid (20,000) (8,500)Payment for other fees and expenses (3,955) (12,847)Tax refund received 20,519 18,180
Net cash fl ows from opera ng and inves ng ac vi es 1,962,891 946,342
FINANCING ACTIVITIESCash received from units created 727,571 989,052Cash paid on units cancelled (667,439) (882,046)Dividends paid to Unitholders (1,520,064) (1,471,074)
Net cash fl ows used in fi nancing ac vi es (1,459,932) (1,364,068)
NET INCREASE/(DECREASE) IN CASH AND CASH EQUIVALENTS 502,959 (417,726)
CASH AND CASH EQUIVALENTS AT 1 JANUARY 4,081,147 4,537,444
CASH AND CASH EQUIVALENTS AT 30 JUNE 4,584,106 4,119,718
Cash and cash equivalents comprise:Cash at banks 2,594,106 76,998 Deposits with licensed fi nancial ins tu ons 1,990,000 4,042,720 4,584,106 4,119,718
The accompanying notes form an integral part of the fi nancial statements.
18
NOTES TO THE FINANCIAL STATEMENTSFOR THE FINANCIAL PERIOD ENDED 30 JUNE 2013
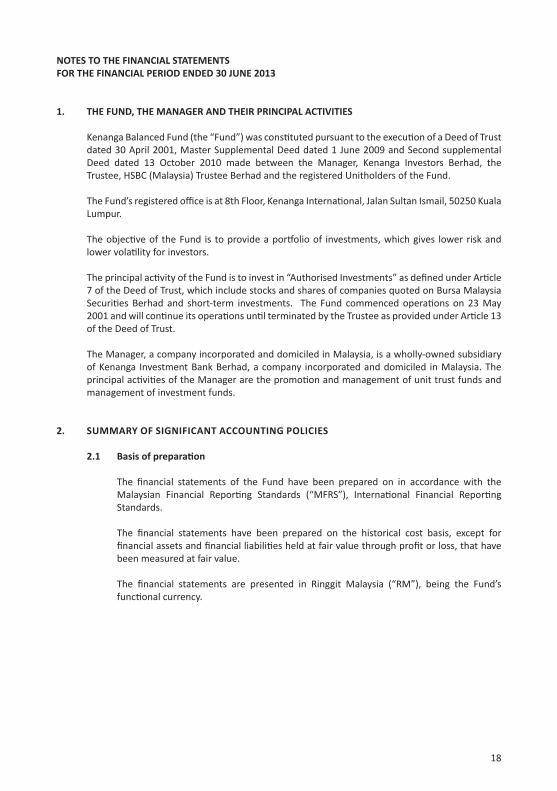
1. THE FUND, THE MANAGER AND THEIR PRINCIPAL ACTIVITIES
Kenanga Balanced Fund (the “Fund”) was cons tuted pursuant to the execu on of a Deed of Trust dated 30 April 2001, Master Supplemental Deed dated 1 June 2009 and Second supplemental Deed dated 13 October 2010 made between the Manager, Kenanga Investors Berhad, the Trustee, HSBC (Malaysia) Trustee Berhad and the registered Unitholders of the Fund.
The Fund’s registered offi ce is at 8th Floor, Kenanga Interna onal, Jalan Sultan Ismail, 50250 Kuala Lumpur.
The objec ve of the Fund is to provide a por olio of investments, which gives lower risk and lower vola lity for investors.
The principal ac vity of the Fund is to invest in “Authorised Investments” as defi ned under Ar cle
7 of the Deed of Trust, which include stocks and shares of companies quoted on Bursa Malaysia Securi es Berhad and short-term investments. The Fund commenced opera ons on 23 May 2001 and will con nue its opera ons un l terminated by the Trustee as provided under Ar cle 13 of the Deed of Trust.
The Manager, a company incorporated and domiciled in Malaysia, is a wholly-owned subsidiary of Kenanga Investment Bank Berhad, a company incorporated and domiciled in Malaysia. The principal ac vi es of the Manager are the promo on and management of unit trust funds and management of investment funds.
2. SUMMARY OF SIGNIFICANT ACCOUNTING POLICIES
2.1 Basis of prepara on
The fi nancial statements of the Fund have been prepared on in accordance with the Malaysian Financial Repor ng Standards (“MFRS”), Interna onal Financial Repor ng Standards.
The fi nancial statements have been prepared on the historical cost basis, except for fi nancial assets and fi nancial liabili es held at fair value through profi t or loss, that have been measured at fair value.
The fi nancial statements are presented in Ringgit Malaysia (“RM”), being the Fund’s func onal currency.
19
KENANGA BALANCED FUND (KBF)Report to Unit Holders for the 6-Month Financial Period Ended 30 June 2013
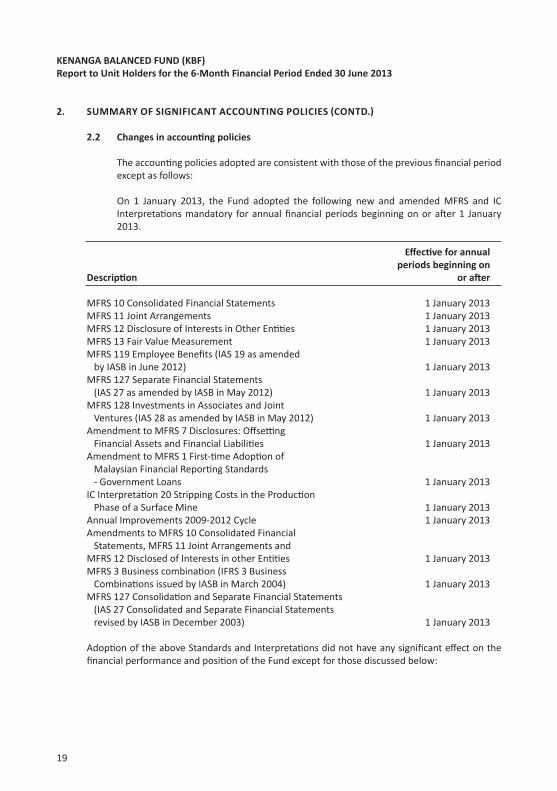
2. SUMMARY OF SIGNIFICANT ACCOUNTING POLICIES CONTD.
2.2 Changes in accoun ng policies
The accoun ng policies adopted are consistent with those of the previous fi nancial period except as follows:
On 1 January 2013, the Fund adopted the following new and amended MFRS and IC Interpreta ons mandatory for annual fi nancial periods beginning on or a er 1 January 2013.
Eff ec ve for annual periods beginning on Descrip on or a er MFRS 10 Consolidated Financial Statements 1 January 2013 MFRS 11 Joint Arrangements 1 January 2013 MFRS 12 Disclosure of Interests in Other En es 1 January 2013 MFRS 13 Fair Value Measurement 1 January 2013 MFRS 119 Employee Benefi ts (IAS 19 as amended by IASB in June 2012) 1 January 2013 MFRS 127 Separate Financial Statements (IAS 27 as amended by IASB in May 2012) 1 January 2013 MFRS 128 Investments in Associates and Joint Ventures (IAS 28 as amended by IASB in May 2012) 1 January 2013 Amendment to MFRS 7 Disclosures: Off se ng Financial Assets and Financial Liabili es 1 January 2013 Amendment to MFRS 1 First- me Adop on of Malaysian Financial Repor ng Standards - Government Loans 1 January 2013 IC Interpreta on 20 Stripping Costs in the Produc on Phase of a Surface Mine 1 January 2013 Annual Improvements 2009-2012 Cycle 1 January 2013 Amendments to MFRS 10 Consolidated Financial Statements, MFRS 11 Joint Arrangements and MFRS 12 Disclosed of Interests in other En es 1 January 2013 MFRS 3 Business combina on (IFRS 3 Business Combina ons issued by IASB in March 2004) 1 January 2013 MFRS 127 Consolida on and Separate Financial Statements (IAS 27 Consolidated and Separate Financial Statements revised by IASB in December 2003) 1 January 2013
Adop on of the above Standards and Interpreta ons did not have any signifi cant eff ect on the fi nancial performance and posi on of the Fund except for those discussed below:
20
KENANGA BALANCED FUND (KBF)Report to Unit Holders for the 6-Month Financial Period Ended 30 June 2013
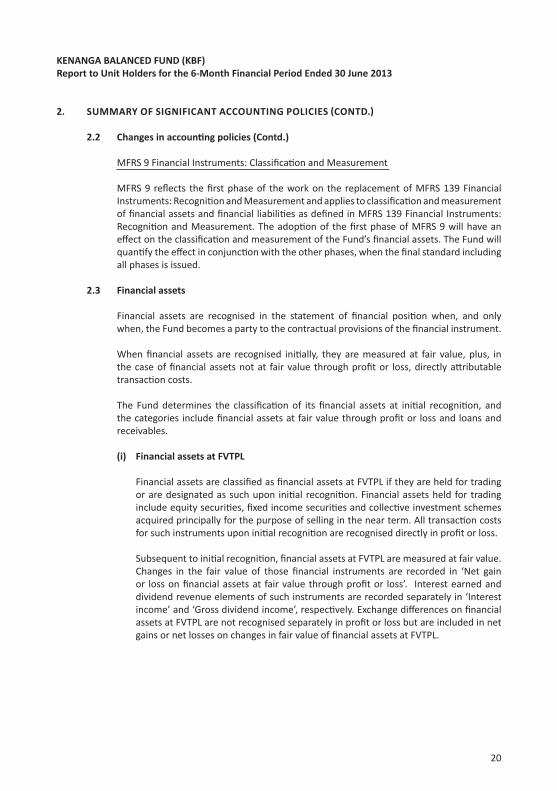
2. SUMMARY OF SIGNIFICANT ACCOUNTING POLICIES CONTD.
2.2 Changes in accoun ng policies (Contd.)
MFRS 9 Financial Instruments: Classifi ca on and Measurement
MFRS 9 refl ects the fi rst phase of the work on the replacement of MFRS 139 Financial Instruments: Recogni on and Measurement and applies to classifi ca on and measurement of fi nancial assets and fi nancial liabili es as defi ned in MFRS 139 Financial Instruments: Recogni on and Measurement. The adop on of the fi rst phase of MFRS 9 will have an eff ect on the classifi ca on and measurement of the Fund’s fi nancial assets. The Fund will quan fy the eff ect in conjunc on with the other phases, when the fi nal standard including all phases is issued.
2.3 Financial assets
Financial assets are recognised in the statement of fi nancial posi on when, and only when, the Fund becomes a party to the contractual provisions of the fi nancial instrument.
When fi nancial assets are recognised ini ally, they are measured at fair value, plus, in the case of fi nancial assets not at fair value through profi t or loss, directly a ributable transac on costs.
The Fund determines the classifi ca on of its fi nancial assets at ini al recogni on, and
the categories include fi nancial assets at fair value through profi t or loss and loans and receivables.
(i) Financial assets at FVTPL
Financial assets are classifi ed as fi nancial assets at FVTPL if they are held for trading or are designated as such upon ini al recogni on. Financial assets held for trading include equity securi es, fi xed income securi es and collec ve investment schemes acquired principally for the purpose of selling in the near term. All transac on costs for such instruments upon ini al recogni on are recognised directly in profi t or loss.
Subsequent to ini al recogni on, fi nancial assets at FVTPL are measured at fair value. Changes in the fair value of those fi nancial instruments are recorded in ‘Net gain or loss on fi nancial assets at fair value through profi t or loss’. Interest earned and dividend revenue elements of such instruments are recorded separately in ‘Interest income’ and ‘Gross dividend income’, respec vely. Exchange diff erences on fi nancial assets at FVTPL are not recognised separately in profi t or loss but are included in net gains or net losses on changes in fair value of fi nancial assets at FVTPL.

21
KENANGA BALANCED FUND (KBF)Report to Unit Holders for the 6-Month Financial Period Ended 30 June 2013
2. SUMMARY OF SIGNIFICANT ACCOUNTING POLICIES CONTD.
2.3 Financial assets (contd.)
(ii) Loans and receivables
Non-deriva ve fi nancial assets with fi xed or determinable payments that are not quoted in an ac ve market are classifi ed as loans and receivables. The Fund includes deposits with licensed fi nancial ins tu ons and short term receivables in this classifi ca on.
Subsequent to ini al recogni on, loans and receivables are measured at amor sed cost using the eff ec ve interest method less any allowance for impairment. Gains and losses are recognised in profi t or loss when the loans and receivables are derecognised or impaired, and through the amor sa on process.
The eff ec ve interest method is a method of calcula ng the amor sed cost of a fi nancial asset or a fi nancial liability and of alloca ng the interest income or interest expense over the relevant period. The eff ec ve interest rate is the rate that exactly discounts es mated future cash payments or receipts through the expected life of the fi nancial instrument or, when appropriate, a shorter period to the net carrying amount of the fi nancial asset or fi nancial liability. When calcula ng the eff ec ve interest rate, the Fund es mates cash fl ows considering all contractual terms of the fi nancial instruments, but does not consider future credit losses. The calcula on includes all fees paid or received between par es to the contract that are an integral part of the eff ec ve interest rate, transac on costs and all other premiums or discounts.
A fi nancial asset is derecognised where the asset is disposed and the contractual right to receive cash fl ows from the asset has expired. On derecogni on of a fi nancial asset in its en rety, the diff erence between the carrying amount and the sum of the considera on received and any cumula ve gain or loss that had been recognised in other comprehensive income is recognised in profi t or loss.
Regular way purchases or sales are purchases or sales of fi nancial assets that require delivery of assets within the period generally established by regula on or conven on in the marketplace concerned. All regular way purchases and sales of fi nancial assets are recognised or derecognised on the trade date i.e., the date that the Fund commits to purchase or sell the asset.

22
KENANGA BALANCED FUND (KBF)Report to Unit Holders for the 6-Month Financial Period Ended 30 June 2013
2. SUMMARY OF SIGNIFICANT ACCOUNTING POLICIES CONTD.
2.4 Financial liabili es
Financial liabili es are classifi ed according to the substance of the contractual arrangements entered into and the defi ni ons of a fi nancial liability.
Financial liabili es, within the scope of MFRS 139, are recognised in the statement of fi nancial posi on when, and only when, the Fund becomes a party to the contractual provisions of the fi nancial instrument. Financial liabili es are classifi ed as other fi nancial liabili es.
The Fund’s fi nancial liabili es are recognised ini ally at fair value plus directly a ributable transac on costs and subsequently measured at amor sed cost using the eff ec ve interest method as described in Note 2.3(ii).
A fi nancial liability is derecognised when the obliga on under the liability is discharged, cancelled or expired. Gains and losses are recognised in profi t or loss when the liabili es are derecognised, and through the amor sa on process.
2.5 Determina on of fair value The fair value for fi nancial instruments traded in ac ve markets at the repor ng date is
based on their quoted price or binding dealer price quota ons (bid price for long posi ons and ask price for short posi ons), without any deduc on for transac on costs.
Where the Fund has assets and liabili es with off se ng market risks, it uses mid-market prices as a basis for establishing fair values for the off se ng risk posi ons and applies the bid or ask price to the net open posi on as appropriate.
For all other fi nancial instruments not traded in an ac ve market, the fair value is determined by using appropriate valua on techniques. Valua on techniques include: using recent arm’s length market transac ons; reference to the current market value of another instrument that is substan ally the same; discounted cash fl ow analysis and op on pricing models making as much use of available and supportable market data as possible. An analysis of fair values of fi nancial instruments and further details as to how they are measured are provided in Note 22 (b).
23
KENANGA BALANCED FUND (KBF)Report to Unit Holders for the 6-Month Financial Period Ended 30 June 2013
2. SUMMARY OF SIGNIFICANT ACCOUNTING POLICIES CONTD.
2.6 Impairment of fi nancial assets The Fund assesses at each repor ng date whether a fi nancial asset or group of fi nancial
assets classifi ed as loans and receivables is impaired. A fi nancial asset or a group of fi nancial assets is deemed to be impaired if, and only if, there is an objec ve evidence of impairment as a result of one or more events that have occurred a er the ini al recogni on of the asset (an incurred ‘loss event’) and that loss event has an impact on the es mated future cash fl ows of the fi nancial asset or the group of fi nancial assets that can be reliably es mated. Evidence of impairment may include indica ons that the debtor, or a group of debtors, is experiencing signifi cant fi nancial diffi culty, default or delinquency in interest or principal payments, the probability that they will enter bankruptcy or other fi nancial reorganisa on and, where observable data indicate that there is a measurable decrease in the es mated future cash fl ows, such as changes in arrears or economic condi ons that correlate with defaults. If there is objec ve evidence that an impairment loss has been incurred, the amount of the loss is measured as the diff erence between the asset’s carrying amount and the present value of es mated future cash fl ows (excluding future expected credit losses that have not yet been incurred) discounted using the asset’s original eff ec ve interest rate. The carrying amount of the asset is reduced through the use of an allowance account and the amount of the loss is recognised in profi t or loss as ’Credit loss expense’.
Impaired debts, together with the associated allowance, are wri en off when there is no realis c prospect of future recovery and all collateral has been realised or has been transferred to the Fund. If, in a subsequent period, the amount of the es mated impairment loss increases or decreases because of an event occurring a er the impairment was recognised, the previously recognised impairment loss is increased or reduced by adjus ng the allowance account. If a previous write-off is later recovered, the recovery is credited to the ’Credit loss expense’.
Interest revenue on impaired fi nancial assets is recognised using the rate of interest used to discount the future cash fl ows for the purpose of measuring the impairment loss.
2.7 Net gain or loss on fi nancial assets and liabili es at FVTPL
This item includes changes in the fair value of fi nancial assets and liabili es held for trading or designated upon ini al recogni on as ‘at fair value through profi t or loss’ and excludes interest and dividend income and expenses.
Unrealised gains and losses comprise changes in the fair value of fi nancial instruments for the period and from reversal of prior period’s unrealised gains and losses for fi nancial instruments which were realised (i.e. sold, redeemed or matured) in the repor ng period.
24
KENANGA BALANCED FUND (KBF)Report to Unit Holders for the 6-Month Financial Period Ended 30 June 2013
2. SUMMARY OF SIGNIFICANT ACCOUNTING POLICIES CONTD.
2.7 Net gain or loss on fi nancial assets and liabili es at FVTPL (Contd.)
Realised gains and losses on disposals of fi nancial instruments classifi ed as part of ‘at FVTPL’ are calculated using weighted average method. They represent the diff erence between an instrument’s ini al carrying amount and disposal amount, or cash payments or receipts made of Islamic deriva ve contracts (excluding payments or receipts on collateral margin accounts for such instruments).
2.8 Off se ng fi nancial instruments
Financial assets and fi nancial liabili es are off set and the net amount reported in the statement of fi nancial posi on if, and only if, there is a currently enforceable legal right to off set the recognised amounts and there is an inten on to se le on a net basis, or to realise the asset and se le the liability simultaneously.
2.9 Func onal and presenta on currency
The Fund’s func onal currency is RM, which is the currency of the primary economic environment in which it operates. The Fund’s performance is evaluated and its liquidity is managed in RM. Therefore, the RM is considered as the currency that most faithfully represents the economic eff ects of the underlying transac ons, events and condi ons. The Fund’s presenta on currency is also the RM.
2.10 Due to and due from brokers
Amounts due to brokers are payables for securi es purchased (in a regular way transac on) that have been contracted for but not yet delivered on the repor ng date. Refer to the accoun ng policy for ‘fi nancial liabili es, other than those classifi ed as at fair value through profi t or loss’ for recogni on and measurement.
Amounts due from brokers include margin accounts and receivables for securi es sold (in a regular way transac on) that have been contracted for but not yet delivered on the repor ng date. Refer to accoun ng policy for ‘loans and receivables’ for recogni on and measurement.
Margin accounts represent cash deposits held with brokers as collateral against open futures contracts.

25
KENANGA BALANCED FUND (KBF)Report to Unit Holders for the 6-Month Financial Period Ended 30 June 2013
2. SUMMARY OF SIGNIFICANT ACCOUNTING POLICIES CONTD.
2.11 Unitholders’ capital
The Unitholders’ contribu ons to the Fund meet the defi ni on of pu able instruments classifi ed as equity instruments.
Distribu on equalisa on represents the average distributable amount included in the crea on and cancella on prices of units. This amount is either refunded to Unitholders by way of distribu on and/or adjusted accordingly when units are cancelled.
2.12 Distribu ons
Distribu ons are at the discre on of the Fund. A distribu on to the Fund’s Unitholders is accounted for as a deduc on from realised reserves except where the distribu on is sourced out of distribu on equalisa on which is accounted for as a deduc on from Unitholders’ capital. A proposed distribu on is recognised as a liability in the period in which it is approved by the Manager. No income distribu on was declared by the Fund for the fi nancial period ended 30 June 2013.
2.13 Cash and cash equivalents
Cash and cash equivalents in the statement of fi nancial posi on comprise cash at bank and deposits with licensed fi nancial ins tu ons which have an insignifi cant risk of changes in value, with original maturi es of three months or less.
Short-term investments that are not held for the purpose of mee ng short-term cash commitments and restricted margin accounts are not considered as ‘cash and cash equivalents’.
For the purpose of the statement of cash fl ows, cash and cash equivalents consist of cash and cash equivalents as defi ned above, net of outstanding bank overdra s when applicable.
2.14 Income Recogni on
Income is recognised to the extent that it is probable that the economic benefi ts will fl ow to the Fund and the income can be reliably measured. Income is measured at the fair value of considera on received or receivable.
Dividend income is recognised when the Fund’s right to receive payment is established which is presented gross of any non-recoverable income taxes, which are disclosed separately in the statement of comprehensive income.
Interest income, which includes the accre on of discount and amor sa on of premium on fi xed income securi es, is recognised using the eff ec ve interest method.
26
KENANGA BALANCED FUND (KBF)Report to Unit Holders for the 6-Month Financial Period Ended 30 June 2013
2. SUMMARY OF SIGNIFICANT ACCOUNTING POLICIES CONTD.
2.15 Fees
Manager’s fee and Trustee’s fee are recognised on an accrual basis.
2.16 Income tax
Current tax assets and liabili es are measured at the amount expected to be recovered from or paid to the tax authori es. The tax rates and tax laws used to compute the amount are those that are enacted or substan vely enacted by the repor ng date.
The Fund is exempted from income taxes, except for certain investment income that are subject to tax deducted at the source of the income. The Fund presents the income tax separately from the gross investment income in the statement of comprehensive income. For the purpose of the statement of cash fl ows, cash infl ows from investments are presented net of income taxes, when applicable.
No deferred tax is recognised as there are no material temporary diff erences.
2.17 Segment repor ng
For management purposes, the Fund is managed by two main por olios, namely (1) equity securi es and (2) debt instruments and cash instruments. Each segment engages in separate business ac vi es and the opera ng results are regularly reviewed by the Investment Manager and the Investment Commi ee. The Investment Commi ee assumes the role of chief opera ng decision maker, for performance assessment purposes and to make decisions about resources allocated to each investment segment.
3. SIGNIFICANT ACCOUNTING JUDGEMENTS, ESTIMATES AND ASSUMPTIONS
The prepara on of the Fund’s fi nancial statements requires management to make judgements, es mates and assump ons that aff ect the reported amounts recognised in the fi nancial statements and disclosure of con ngent liabili es. However, uncertainty about these assump ons and es mates could result in outcomes that could require a material adjustment to the carrying amount of the asset or liability aff ected in future periods.
27
KENANGA BALANCED FUND (KBF)Report to Unit Holders for the 6-Month Financial Period Ended 30 June 2013
3. SIGNIFICANT ACCOUNTING JUDGEMENTS, ESTIMATES AND ASSUMPTIONS CONTD.
Judgements
In the process of applying the Fund’s accoun ng policies, management has made the following judgements, which have the most signifi cant eff ect on the amounts recognised in the fi nancial statements:
Going Concern
The Fund’s management has made an assessment of the Fund’s ability to con nue as a going concern and is sa sfi ed that the Fund has the resources to con nue in business for the foreseeable future. Furthermore, management is not aware of any material uncertain es that may cast signifi cant doubt upon the Fund’s ability to con nue as a going concern. Therefore, the fi nancial statements con nue to be prepared on the going concern basis.
Es mates and assump ons
The key assump ons concerning the future and other key sources of es ma on uncertainty at the repor ng date, that have a signifi cant risk of causing a material adjustment to the carrying amounts of assets and liabili es within the next fi nancial year, are discussed below. The Fund based its assump ons and es mates on parameters available when the fi nancial statements were prepared. However, exis ng circumstances and assump ons about future developments may change due to market changes or circumstances arising beyond the control of the Fund. Such changes are refl ected in the assump ons when they occur.
Fair value of fi nancial instruments
When the fair value of fi nancial assets and fi nancial liabili es recorded in the statement of fi nancial posi on cannot be derived from ac ve markets, their fair value is determined using a variety of valua on techniques that include the use of mathema cal models. The inputs to these models are taken from observable markets where possible, but where this is not feasible, es ma on is required in establishing fair values. The es mates include considera ons of liquidity and model inputs such as credit risk (both own and counterparty’s), correla on and vola lity. Changes in assump ons about these factors could aff ect the reported fair value of fi nancial instruments in the statement of fi nancial posi on and the level where the instruments are disclosed in the fair value hierarchy. The models are calibrated regularly and tested for validity using prices from any observable current market transac ons in the same instrument (without modifi ca on or repackaging) or based on any available observable market data. MFRS 7 requires disclosures rela ng to fair value measurements using a three-level fair value hierarchy. The level within which the fair value measurement is categorised in its en rety is determined on the basis of the lowest level input that is signifi cant to the fair value measurement in its en rety. Assessing the signifi cance of a par cular input requires judgement, considering factors specifi c to the asset or liability. To assess the signifi cance of a par cular input to the en re measurement, the Fund performs sensi vity analysis or stress tes ng techniques.

28
KENANGA BALANCED FUND (KBF)Report to Unit Holders for the 6-Month Financial Period Ended 30 June 2013
4. STANDARDS ISSUED BUT NOT YET EFFECTIVE
Standards issued but not yet eff ec ve up to the date of issuance of the Fund’s fi nancial statements are listed below. The Fund intends to adopt applicable standards when they become eff ec ve:
Eff ec ve for annual periods beginning on Descrip on or a er Amendment to MFRS 132 Off se ng Financial Assets and Financial Liabili es 1 January 2014 MFRS 9 Financial instruments (IFRS 9 issued by IASB in November 2009) 1 January 2015 MFRS 9 Financial instruments (IFRS 9 issued by IASB in October 2010) 1 January 2015
5. MANAGER’S FEE
The Manager is currently charging Manager’s fee of 1.50% (30.6.2012: 1.50%) per annum of the NAV of the Fund. This is calculated on a daily basis by dividing the NAV of the Fund before deduc ng the Manager’s fee and Trustee’s fee for the par cular day by the number of days in the period and mul plying the total with the rate of the annual fee disclosed in the current prospectus of the Fund. However, under Ar cle 14.1.2 of the Deed of Trust, the Manager is en tled to a Manager’s fee not exceeding 2.00% (30.6.2012: 2.00%) per annum of the NAV of the Fund.
6. TRUSTEE’S FEE
The Trustee’s fee is computed at 0.08% (30.6.2012: 0.08%) per annum of the NAV of the Fund where there are non-foreign and foreign investments, respec vely. This is calculated on a daily basis by dividing the NAV of the Fund before deduc ng the Manager’s fee and Trustee’s fee for the par cular day by the number of days in the period and mul plying the total with the rate of the annual fee disclosed in the current prospectus of the Fund. However, under Ar cle 14.2.2 of the Deed of Trust, the Trustee is en tled to a fee not exceeding 0.50% (30.6.2012: 0.50%) of the NAV of the Fund, subject to a minimum of RM18,000 per annum.
29
KENANGA BALANCED FUND (KBF)Report to Unit Holders for the 6-Month Financial Period Ended 30 June 2013
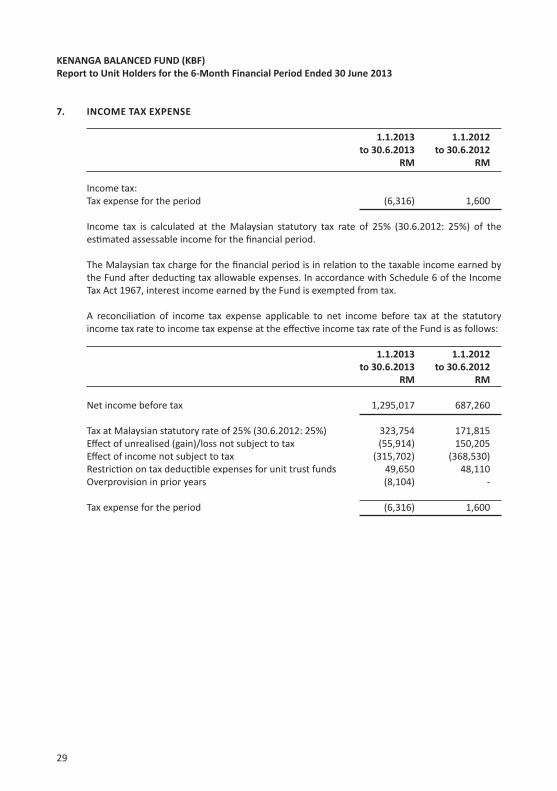
7. INCOME TAX EXPENSE
1.1.2013 1.1.2012 to 30.6.2013 to 30.6.2012 RM RM
Income tax: Tax expense for the period (6,316) 1,600
Income tax is calculated at the Malaysian statutory tax rate of 25% (30.6.2012: 25%) of the es mated assessable income for the fi nancial period.
The Malaysian tax charge for the fi nancial period is in rela on to the taxable income earned by the Fund a er deduc ng tax allowable expenses. In accordance with Schedule 6 of the Income Tax Act 1967, interest income earned by the Fund is exempted from tax.
A reconcilia on of income tax expense applicable to net income before tax at the statutory income tax rate to income tax expense at the eff ec ve income tax rate of the Fund is as follows:
1.1.2013 1.1.2012 to 30.6.2013 to 30.6.2012 RM RM
Net income before tax 1,295,017 687,260
Tax at Malaysian statutory rate of 25% (30.6.2012: 25%) 323,754 171,815 Eff ect of unrealised (gain)/loss not subject to tax (55,914) 150,205 Eff ect of income not subject to tax (315,702) (368,530) Restric on on tax deduc ble expenses for unit trust funds 49,650 48,110 Overprovision in prior years (8,104) -
Tax expense for the period (6,316) 1,600

30
KENANGA BALANCED FUND (KBF)Report to Unit Holders for the 6-Month Financial Period Ended 30 June 2013
8. INVESTMENTS
A reconcilia on of income tax expense applicable to net income before tax at the statutory income tax rate to income tax expense at the eff ec ve income tax rate of the Fund is as follows:
As at As at 30.6.2013 30.6.2012 RM RM
Financial assets at FVTPL Financial assets held for trading: Quoted equi es 12,738,147 14,066,750 Unquoted fi xed income securi es 8,149,127 6,401,560 20,887,274 20,468,310
1.1.2013 1.1.2012 to 30.6.2013 to 30.6.2012 RM RM
Net gain on fi nancial assets at FVTPL comprised: Realised gain on disposals 806,156 1,092,279 Unrealised changes in fair values 223,656 (600,819) 1,029,812 491,460
Financial assets held for trading as at 30 June 2013 are as detailed below:
Fair % of Name of counter Quan ty Cost value NAV RM RM
QUOTED EQUITIES Main Market Consumer Products Eng Kah Corpora on Berhad 129,500 309,996 401,450 1.62 Dutch Lady Milk Industries Berhad 10,000 473,615 470,200 1.89 UMW Holdings Berhad 20,000 247,263 290,400 1.17 Nestle (M) Berhad 7,000 442,047 468,300 1.89 1,472,921 1,630,350 6.57 REITS Axis Real Estate Investment Trust 90,524 284,867 330,413 1.33 Capitamalls Malaysia Trust 200,000 353,872 350,000 1.41 IGB Real Estate Investment Trust 185,800 251,558 245,256 0.99 Pavilion Real Estate Investment Trust 281,000 398,781 424,310 1.71 Sunway Real Investment Trust 250,000 365,973 385,000 1.55 1,655,051 1,734,979 6.99

31
KENANGA BALANCED FUND (KBF)Report to Unit Holders for the 6-Month Financial Period Ended 30 June 2013
8. INVESTMENTS CONTD.
Fair % of Name of counter Quan ty Cost value NAV RM RM %
QUOTED EQUITIES Finance Alliance Financial Group 30,000 131,429 156,900 0.63 CIMB Group Holdings Berhad 70,000 506,627 578,900 2.33 Hong Leong Bank Berhad 38,000 538,396 547,200 2.21 Maybank Banking Berhad 80,518 730,362 834,166 3.36 Public Bank Berhad - Foreign 34,000 429,275 577,320 2.33 2,336,089 2,694,486 10.86
Infrastructure Digi.com Berhad 113,000 497,891 532,230 2.14
Industrial Products Petronas Gas Berhad 15,000 281,997 311,700 1.26 Perisai Petronas Teknologi 180,000 179,469 280,800 1.13 461,466 592,500 2.39
Planta on Batu Kawan Berhad 14,000 258,105 261,800 1.06 United Planta on Berhad 10,000 262,176 281,000 1.13 520,281 542,800 2.19
Proper es KLCCP Property Holding Berhad 80,000 574,613 540,000 2.18 SPSETIA Berhad 100,000 340,649 335,000 1.35 915,262 875,000 3.53
32
KENANGA BALANCED FUND (KBF)Report to Unit Holders for the 6-Month Financial Period Ended 30 June 2013
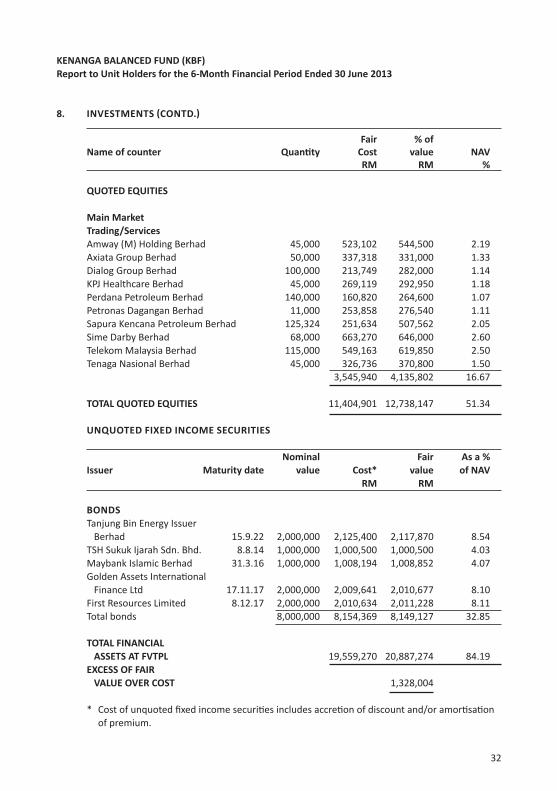
8. INVESTMENTS CONTD.
Fair % of Name of counter Quan ty Cost value NAV RM RM %
QUOTED EQUITIES
Main Market Trading/Services Amway (M) Holding Berhad 45,000 523,102 544,500 2.19 Axiata Group Berhad 50,000 337,318 331,000 1.33 Dialog Group Berhad 100,000 213,749 282,000 1.14 KPJ Healthcare Berhad 45,000 269,119 292,950 1.18 Perdana Petroleum Berhad 140,000 160,820 264,600 1.07 Petronas Dagangan Berhad 11,000 253,858 276,540 1.11 Sapura Kencana Petroleum Berhad 125,324 251,634 507,562 2.05 Sime Darby Berhad 68,000 663,270 646,000 2.60 Telekom Malaysia Berhad 115,000 549,163 619,850 2.50 Tenaga Nasional Berhad 45,000 326,736 370,800 1.50 3,545,940 4,135,802 16.67
TOTAL QUOTED EQUITIES 11,404,901 12,738,147 51.34
UNQUOTED FIXED INCOME SECURITIES
Nominal Fair As a % Issuer Maturity date value Cost* value of NAV RM RM
BONDS Tanjung Bin Energy Issuer Berhad 15.9.22 2,000,000 2,125,400 2,117,870 8.54 TSH Sukuk Ijarah Sdn. Bhd. 8.8.14 1,000,000 1,000,500 1,000,500 4.03 Maybank Islamic Berhad 31.3.16 1,000,000 1,008,194 1,008,852 4.07 Golden Assets Interna onal Finance Ltd 17.11.17 2,000,000 2,009,641 2,010,677 8.10 First Resources Limited 8.12.17 2,000,000 2,010,634 2,011,228 8.11 Total bonds 8,000,000 8,154,369 8,149,127 32.85
TOTAL FINANCIAL ASSETS AT FVTPL 19,559,270 20,887,274 84.19 EXCESS OF FAIR VALUE OVER COST 1,328,004 * Cost of unquoted fi xed income securi es includes accre on of discount and/or amor sa on of premium.
33
KENANGA BALANCED FUND (KBF)Report to Unit Holders for the 6-Month Financial Period Ended 30 June 2013
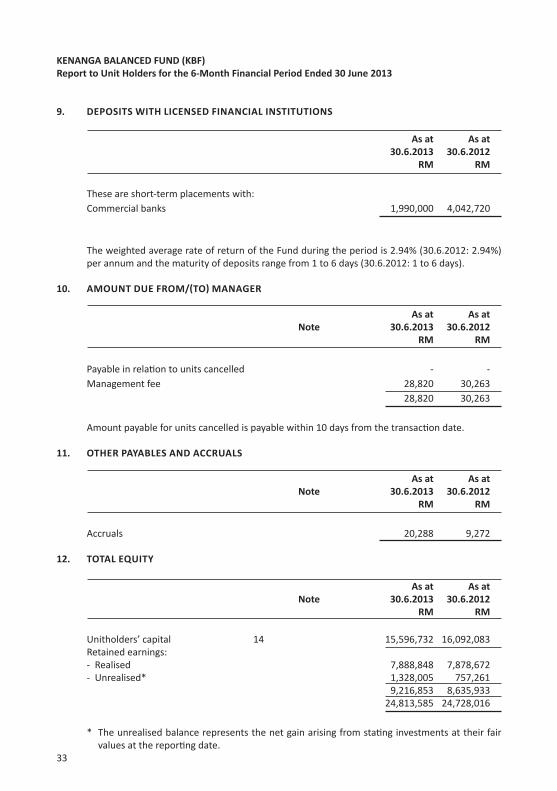
9. DEPOSITS WITH LICENSED FINANCIAL INSTITUTIONS
As at As at 30.6.2013 30.6.2012 RM RM
These are short-term placements with: Commercial banks 1,990,000 4,042,720
The weighted average rate of return of the Fund during the period is 2.94% (30.6.2012: 2.94%) per annum and the maturity of deposits range from 1 to 6 days (30.6.2012: 1 to 6 days).
10. AMOUNT DUE FROM/ TO MANAGER
As at As at Note 30.6.2013 30.6.2012 RM RM
Payable in rela on to units cancelled - - Management fee 28,820 30,263 28,820 30,263
Amount payable for units cancelled is payable within 10 days from the transac on date.
11. OTHER PAYABLES AND ACCRUALS
As at As at Note 30.6.2013 30.6.2012 RM RM
Accruals 20,288 9,272
12. TOTAL EQUITY
As at As at Note 30.6.2013 30.6.2012 RM RM
Unitholders’ capital 14 15,596,732 16,092,083 Retained earnings: - Realised 7,888,848 7,878,672 - Unrealised* 1,328,005 757,261 9,216,853 8,635,933 24,813,585 24,728,016
* The unrealised balance represents the net gain arising from sta ng investments at their fair values at the repor ng date.
34
KENANGA BALANCED FUND (KBF)Report to Unit Holders for the 6-Month Financial Period Ended 30 June 2013
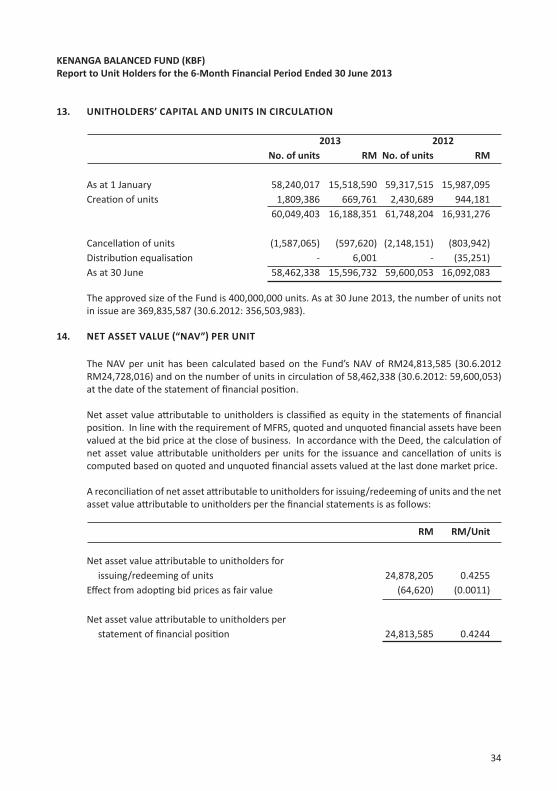
13. UNITHOLDERS’ CAPITAL AND UNITS IN CIRCULATION
2013 2012 No. of units RM No. of units RM
As at 1 January 58,240,017 15,518,590 59,317,515 15,987,095 Crea on of units 1,809,386 669,761 2,430,689 944,181 60,049,403 16,188,351 61,748,204 16,931,276 Cancella on of units (1,587,065) (597,620) (2,148,151) (803,942) Distribu on equalisa on - 6,001 - (35,251) As at 30 June 58,462,338 15,596,732 59,600,053 16,092,083
The approved size of the Fund is 400,000,000 units. As at 30 June 2013, the number of units not in issue are 369,835,587 (30.6.2012: 356,503,983).
14. NET ASSET VALUE “NAV” PER UNIT
The NAV per unit has been calculated based on the Fund’s NAV of RM24,813,585 (30.6.2012 RM24,728,016) and on the number of units in circula on of 58,462,338 (30.6.2012: 59,600,053) at the date of the statement of fi nancial posi on.
Net asset value a ributable to unitholders is classifi ed as equity in the statements of fi nancial posi on. In line with the requirement of MFRS, quoted and unquoted fi nancial assets have been valued at the bid price at the close of business. In accordance with the Deed, the calcula on of net asset value a ributable unitholders per units for the issuance and cancella on of units is computed based on quoted and unquoted fi nancial assets valued at the last done market price.
A reconcilia on of net asset a ributable to unitholders for issuing/redeeming of units and the net asset value a ributable to unitholders per the fi nancial statements is as follows:
RM RM/Unit
Net asset value a ributable to unitholders for issuing/redeeming of units 24,878,205 0.4255 Eff ect from adop ng bid prices as fair value (64,620) (0.0011)
Net asset value a ributable to unitholders per statement of fi nancial posi on 24,813,585 0.4244
35
KENANGA BALANCED FUND (KBF)Report to Unit Holders for the 6-Month Financial Period Ended 30 June 2013
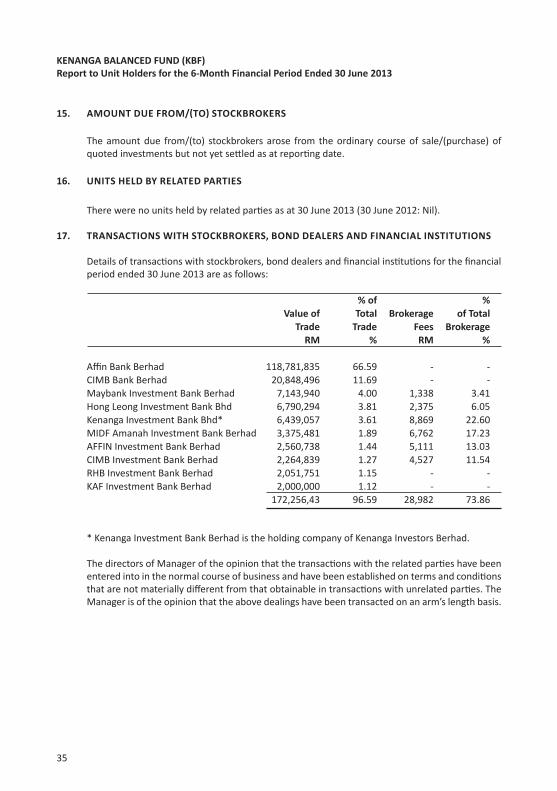
15. AMOUNT DUE FROM/ TO STOCKBROKERS
The amount due from/(to) stockbrokers arose from the ordinary course of sale/(purchase) of quoted investments but not yet se led as at repor ng date.
16. UNITS HELD BY RELATED PARTIES
There were no units held by related par es as at 30 June 2013 (30 June 2012: Nil).
17. TRANSACTIONS WITH STOCKBROKERS, BOND DEALERS AND FINANCIAL INSTITUTIONS
Details of transac ons with stockbrokers, bond dealers and fi nancial ins tu ons for the fi nancial period ended 30 June 2013 are as follows:
% of % Value of Total Brokerage of Total Trade Trade Fees Brokerage RM % RM %
Affi n Bank Berhad 118,781,835 66.59 - - CIMB Bank Berhad 20,848,496 11.69 - -
Maybank Investment Bank Berhad 7,143,940 4.00 1,338 3.41 Hong Leong Investment Bank Bhd 6,790,294 3.81 2,375 6.05 Kenanga Investment Bank Bhd* 6,439,057 3.61 8,869 22.60 MIDF Amanah Investment Bank Berhad 3,375,481 1.89 6,762 17.23 AFFIN Investment Bank Berhad 2,560,738 1.44 5,111 13.03 CIMB Investment Bank Berhad 2,264,839 1.27 4,527 11.54 RHB Investment Bank Berhad 2,051,751 1.15 - - KAF Investment Bank Berhad 2,000,000 1.12 - - 172,256,43 96.59 28,982 73.86
* Kenanga Investment Bank Berhad is the holding company of Kenanga Investors Berhad.
The directors of Manager of the opinion that the transac ons with the related par es have been entered into in the normal course of business and have been established on terms and condi ons that are not materially diff erent from that obtainable in transac ons with unrelated par es. The Manager is of the opinion that the above dealings have been transacted on an arm’s length basis.
36
KENANGA BALANCED FUND (KBF)Report to Unit Holders for the 6-Month Financial Period Ended 30 June 2013
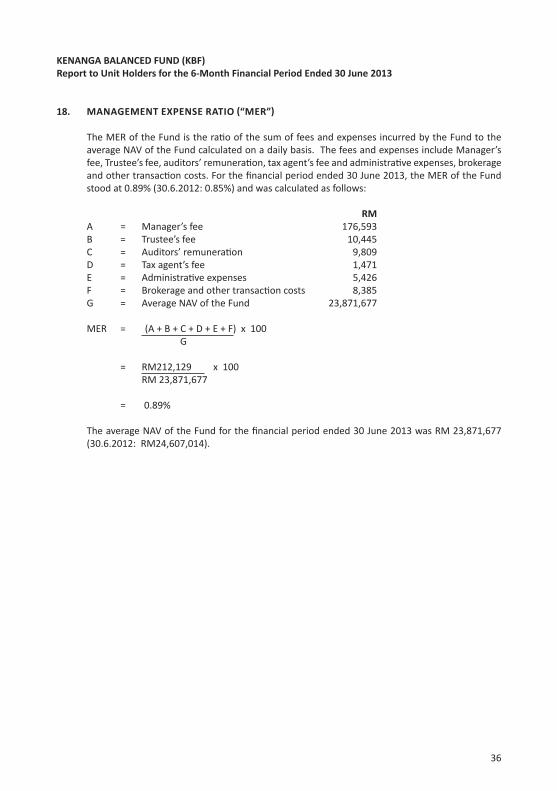
18. MANAGEMENT EXPENSE RATIO “MER”
The MER of the Fund is the ra o of the sum of fees and expenses incurred by the Fund to the average NAV of the Fund calculated on a daily basis. The fees and expenses include Manager’s fee, Trustee’s fee, auditors’ remunera on, tax agent’s fee and administra ve expenses, brokerage and other transac on costs. For the fi nancial period ended 30 June 2013, the MER of the Fund stood at 0.89% (30.6.2012: 0.85%) and was calculated as follows:
RM A = Manager’s fee 176,593 B = Trustee’s fee 10,445 C = Auditors’ remunera on 9,809 D = Tax agent’s fee 1,471 E = Administra ve expenses 5,426 F = Brokerage and other transac on costs 8,385 G = Average NAV of the Fund 23,871,677
MER = (A + B + C + D + E + F) x 100 G
= RM212,129 x 100 RM 23,871,677
= 0.89%
The average NAV of the Fund for the fi nancial period ended 30 June 2013 was RM 23,871,677 (30.6.2012: RM24,607,014).
37
KENANGA BALANCED FUND (KBF)Report to Unit Holders for the 6-Month Financial Period Ended 30 June 2013
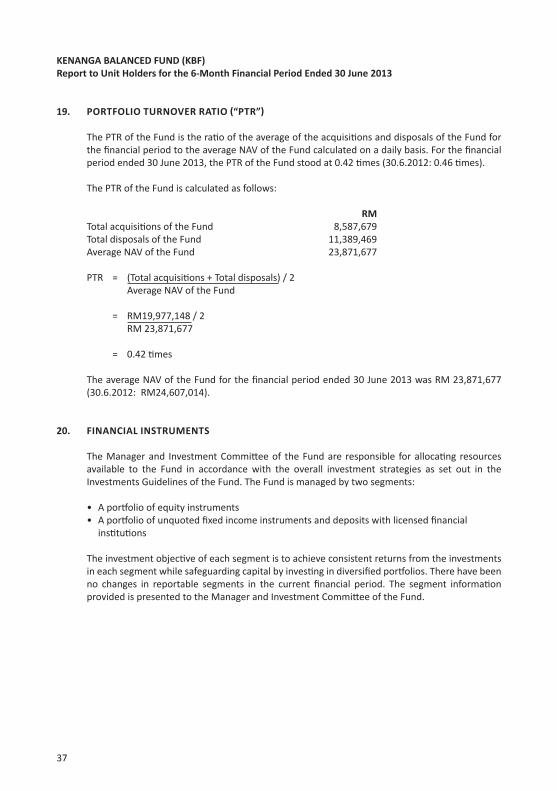
19. PORTFOLIO TURNOVER RATIO “PTR”
The PTR of the Fund is the ra o of the average of the acquisi ons and disposals of the Fund for the fi nancial period to the average NAV of the Fund calculated on a daily basis. For the fi nancial period ended 30 June 2013, the PTR of the Fund stood at 0.42 mes (30.6.2012: 0.46 mes).
The PTR of the Fund is calculated as follows:
RM Total acquisi ons of the Fund 8,587,679 Total disposals of the Fund 11,389,469 Average NAV of the Fund 23,871,677
PTR = (Total acquisi ons + Total disposals) / 2 Average NAV of the Fund
= RM19,977,148 / 2 RM 23,871,677
= 0.42 mes
The average NAV of the Fund for the fi nancial period ended 30 June 2013 was RM 23,871,677 (30.6.2012: RM24,607,014).
20. FINANCIAL INSTRUMENTS
The Manager and Investment Commi ee of the Fund are responsible for alloca ng resources available to the Fund in accordance with the overall investment strategies as set out in the Investments Guidelines of the Fund. The Fund is managed by two segments:
• A por olio of equity instruments • A por olio of unquoted fi xed income instruments and deposits with licensed fi nancial ins tu ons
The investment objec ve of each segment is to achieve consistent returns from the investments in each segment while safeguarding capital by inves ng in diversifi ed por olios. There have been no changes in reportable segments in the current fi nancial period. The segment informa on provided is presented to the Manager and Investment Commi ee of the Fund.
38
KENANGA BALANCED FUND (KBF)Report to Unit Holders for the 6-Month Financial Period Ended 30 June 2013
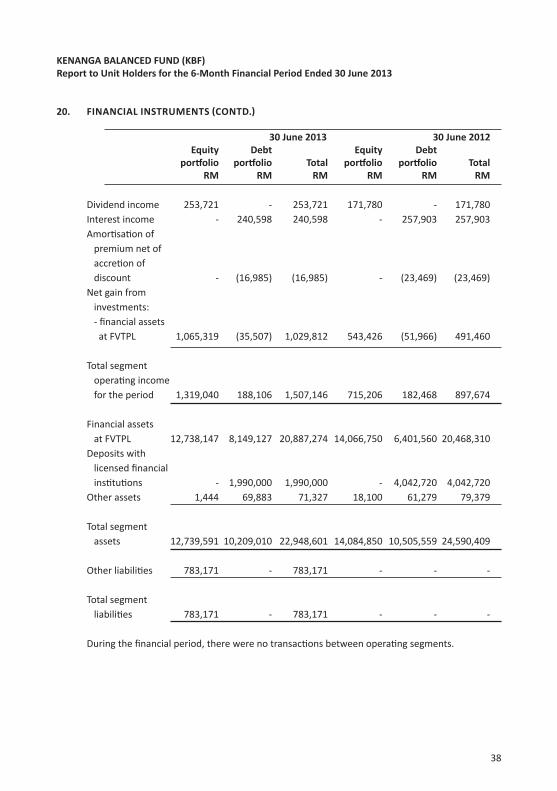
20. FINANCIAL INSTRUMENTS CONTD.
30 June 2013 30 June 2012 Equity Debt Equity Debt por olio por olio Total por olio por olio Total RM RM RM RM RM RM
Dividend income 253,721 - 253,721 171,780 - 171,780 Interest income - 240,598 240,598 - 257,903 257,903 Amor sa on of premium net of accre on of discount - (16,985) (16,985) - (23,469) (23,469) Net gain from investments: - fi nancial assets at FVTPL 1,065,319 (35,507) 1,029,812 543,426 (51,966) 491,460
Total segment opera ng income for the period 1,319,040 188,106 1,507,146 715,206 182,468 897,674
Financial assets at FVTPL 12,738,147 8,149,127 20,887,274 14,066,750 6,401,560 20,468,310 Deposits with licensed fi nancial ins tu ons - 1,990,000 1,990,000 - 4,042,720 4,042,720 Other assets 1,444 69,883 71,327 18,100 61,279 79,379
Total segment assets 12,739,591 10,209,010 22,948,601 14,084,850 10,505,559 24,590,409
Other liabili es 783,171 - 783,171 - - -
Total segment liabili es 783,171 - 783,171 - - -
During the fi nancial period, there were no transac ons between opera ng segments.
39
KENANGA BALANCED FUND (KBF)Report to Unit Holders for the 6-Month Financial Period Ended 30 June 2013
20. FINANCIAL INSTRUMENTS CONTD.
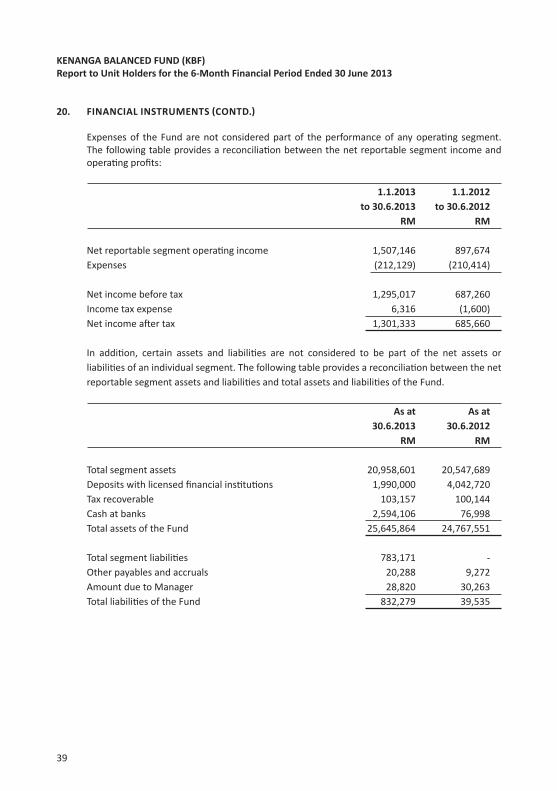
Expenses of the Fund are not considered part of the performance of any opera ng segment. The following table provides a reconcilia on between the net reportable segment income and opera ng profi ts:
1.1.2013 1.1.2012 to 30.6.2013 to 30.6.2012 RM RM Net reportable segment opera ng income 1,507,146 897,674 Expenses (212,129) (210,414)
Net income before tax 1,295,017 687,260 Income tax expense 6,316 (1,600) Net income a er tax 1,301,333 685,660
In addi on, certain assets and liabili es are not considered to be part of the net assets or liabili es of an individual segment. The following table provides a reconcilia on between the net reportable segment assets and liabili es and total assets and liabili es of the Fund.
As at As at 30.6.2013 30.6.2012 RM RM Total segment assets 20,958,601 20,547,689 Deposits with licensed fi nancial ins tu ons 1,990,000 4,042,720 Tax recoverable 103,157 100,144 Cash at banks 2,594,106 76,998 Total assets of the Fund 25,645,864 24,767,551
Total segment liabili es 783,171 - Other payables and accruals 20,288 9,272 Amount due to Manager 28,820 30,263 Total liabili es of the Fund 832,279 39,535
40
KENANGA BALANCED FUND (KBF)Report to Unit Holders for the 6-Month Financial Period Ended 30 June 2013
20. FINANCIAL INSTRUMENTS CONTD.
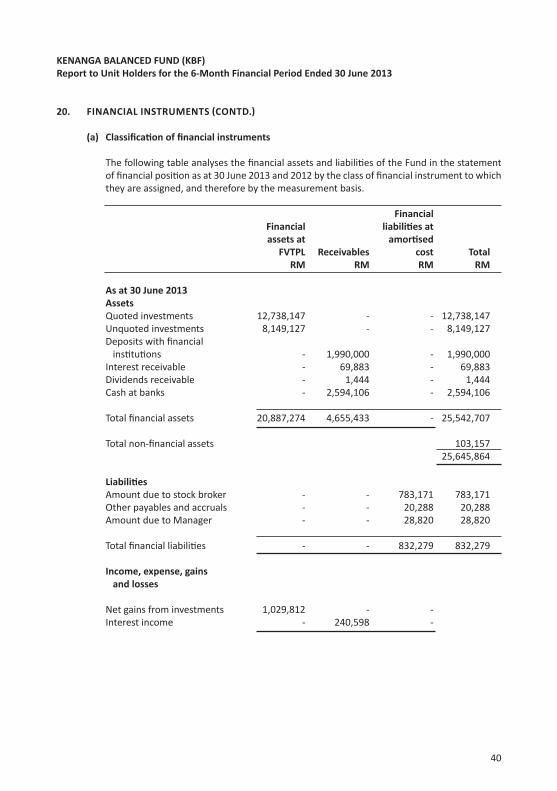
(a) Classifi ca on of fi nancial instruments
The following table analyses the fi nancial assets and liabili es of the Fund in the statement of fi nancial posi on as at 30 June 2013 and 2012 by the class of fi nancial instrument to which they are assigned, and therefore by the measurement basis.
Financial Financial liabili es at assets at amor sed FVTPL Receivables cost Total RM RM RM RM
As at 30 June 2013 Assets Quoted investments 12,738,147 - - 12,738,147 Unquoted investments 8,149,127 - - 8,149,127 Deposits with fi nancial ins tu ons - 1,990,000 - 1,990,000 Interest receivable - 69,883 - 69,883 Dividends receivable - 1,444 - 1,444 Cash at banks - 2,594,106 - 2,594,106
Total fi nancial assets 20,887,274 4,655,433 - 25,542,707 Total non-fi nancial assets 103,157 25,645,864
Liabili es Amount due to stock broker - - 783,171 783,171 Other payables and accruals - - 20,288 20,288 Amount due to Manager - - 28,820 28,820
Total fi nancial liabili es - - 832,279 832,279
Income, expense, gains and losses
Net gains from investments 1,029,812 - - Interest income - 240,598 -

41
KENANGA BALANCED FUND (KBF)Report to Unit Holders for the 6-Month Financial Period Ended 30 June 2013
20. FINANCIAL INSTRUMENTS CONTD.
(a) Classifi ca on of fi nancial instruments (Contd.)
Financial Financial liabili es at assets at amor sed FVTPL Receivables cost Total RM RM RM RM
As at 30 June 2012 Assets Quoted investments 14,066,750 - - 14,066,750 Unquoted investments 6,401,560 - - 6,401,560 Deposits with fi nancial ins tu ons - 4,042,720 - 4,042,720 Interest receivable - 61,279 - 61,279 Dividends receivable - 18,100 - 18,100 Cash at banks - 76,998 - 76,998
Total fi nancial assets 20,468,310 4,199,097 - 24,667,407 Total non-fi nancial assets 100,144 24,767,551
Liabili es Other payables and accruals - - 9,272 9,272 Amount due to Manager - - 30,263 30,263
Total fi nancial liabili es - - 39,535 39,535
Income, expense, gains and losses
Net gains from investments 491,460 - - Interest income - 257,903 -
42
KENANGA BALANCED FUND (KBF)Report to Unit Holders for the 6-Month Financial Period Ended 30 June 2013
21. FINANCIAL INSTRUMENTS CONTD.
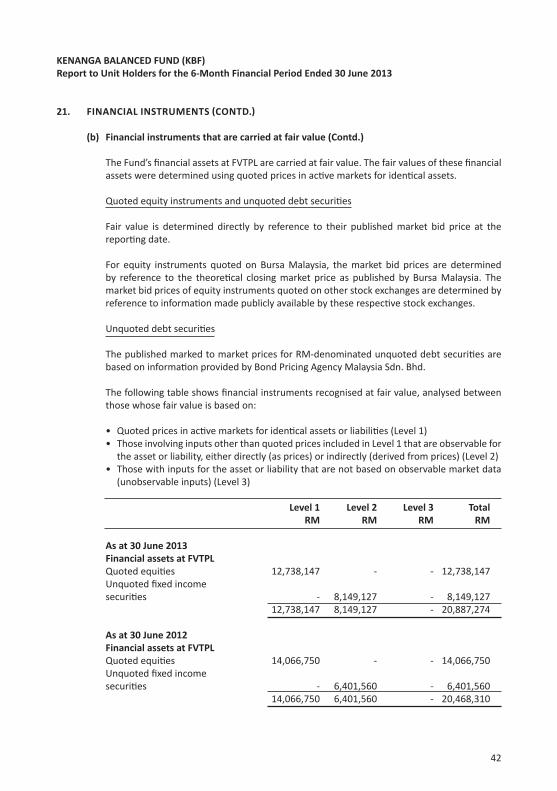
(b) Financial instruments that are carried at fair value (Contd.)
The Fund’s fi nancial assets at FVTPL are carried at fair value. The fair values of these fi nancial assets were determined using quoted prices in ac ve markets for iden cal assets.
Quoted equity instruments and unquoted debt securi es
Fair value is determined directly by reference to their published market bid price at the repor ng date.
For equity instruments quoted on Bursa Malaysia, the market bid prices are determined by reference to the theore cal closing market price as published by Bursa Malaysia. The market bid prices of equity instruments quoted on other stock exchanges are determined by reference to informa on made publicly available by these respec ve stock exchanges.
Unquoted debt securi es
The published marked to market prices for RM-denominated unquoted debt securi es are based on informa on provided by Bond Pricing Agency Malaysia Sdn. Bhd.
The following table shows fi nancial instruments recognised at fair value, analysed between those whose fair value is based on:
• Quoted prices in ac ve markets for iden cal assets or liabili es (Level 1) • Those involving inputs other than quoted prices included in Level 1 that are observable for
the asset or liability, either directly (as prices) or indirectly (derived from prices) (Level 2) • Those with inputs for the asset or liability that are not based on observable market data
(unobservable inputs) (Level 3) Level 1 Level 2 Level 3 Total RM RM RM RM
As at 30 June 2013 Financial assets at FVTPL Quoted equi es 12,738,147 - - 12,738,147 Unquoted fi xed income securi es - 8,149,127 - 8,149,127 12,738,147 8,149,127 - 20,887,274
As at 30 June 2012 Financial assets at FVTPL Quoted equi es 14,066,750 - - 14,066,750 Unquoted fi xed income securi es - 6,401,560 - 6,401,560 14,066,750 6,401,560 - 20,468,310

43
KENANGA BALANCED FUND (KBF)Report to Unit Holders for the 6-Month Financial Period Ended 30 June 2013
21. FINANCIAL INSTRUMENTS CONTD.
(b) Financial instruments that are carried at fair value (contd.)
No transfers between any levels of the fair value hierarchy took place during the current period and the compara ve period. There were also no changes in the purpose of any fi nancial asset that subsequently resulted in a diff erent classifi ca on of that asset.
The determina on of NAV based on last done prices of the fund diff ers from the determina on of NAV in accordance with the requirement of MFRSs. A common diff erence is the measurement of NAV using last done prices as opposed to the FRS measurement basis (of using bid prices of investments).
The following table shows a reconcilia on between NAV based on last prices and bid prices:
NAV Adjustment NAV calculated in arising from calculated in accordance with last-done prices accordance last done prices to bid prices with MFRS RM RM RM
Net Assets Value 24,878,205 (64,620) 24,813,585
44
KENANGA BALANCED FUND (KBF)Report to Unit Holders for the 6-Month Financial Period Ended 30 June 2013
21. FINANCIAL INSTRUMENTS CONTD.
(c) Financial instruments that are not carried at fair value and whose carrying amounts are reasonable approxima on of fair value
The following are classes of fi nancial instruments that are not carried at fair value and whose carrying amounts are reasonable approxima on of fair value:
• Deposits with licensed fi nancial ins tu ons • Short term money market instrument • Dividends receivable • Interest receivable • Other payables and accruals • Amounts due from/to Manager • Amounts due from/to Stockbrokers • Amounts due from /to Trustee • Distribu on payable
There were no fi nancial instruments which are not carried at fair values and whose carrying amounts are not reasonable approxima on of their respec ve fair values.
The methods and basis for the determina on of fair value of the Fund’s fi nancial instruments in the current fi nancial period were consistent with that of the previous fi nancial year ended 31 December 2012.
22. FINANCIAL RISK AND MANAGEMENT OBJECTIVES AND POLICIES
(a) Introduc on
The Fund maintains investment por olios in a variety of listed and unlisted fi nancial instruments as dictated by its Trust Deed and investment management strategy.
The Fund is exposed to a variety of risks including market risk (which includes interest rate risk and price risk), credit risk and liquidity risk. Whilst these are the most important types of fi nancial risks inherent in each type of fi nancial instruments, the Manager would like to highlight that this list does not purport to cons tute an exhaus ve list of all the risks inherent in an investment in the Fund.
The Fund’s objec ve in managing risk is the crea on and protec on of Unitholders’ value. Risk is inherent in the Fund’s ac vi es, but it is managed through a process of ongoing iden fi ca on, measurement and monitoring of risks. Financial risk management is also carried out through sound internal control systems and adherence to the investment restric ons as s pulated in the Trust Deed, the Securi es Commission’s Guidelines on Unit Trust Funds and the Capital Markets and Services Act, 2007.
45
KENANGA BALANCED FUND (KBF)Report to Unit Holders for the 6-Month Financial Period Ended 30 June 2013
22. FINANCIAL RISK AND MANAGEMENT OBJECTIVES AND POLICIES CONTD.
(a) Introduc on
The Fund’s Manager is responsible for iden fying and controlling risks. The Board of Directors of the Manager is ul mately responsible for the overall risk management approach within the Fund.
(c) Risk measurement and repor ng system
Monitoring and controlling risks is primarily set up to be performed based on limits established by the Manager. These limits refl ect the investment strategy and market environment of the Fund as well as the level of the risk that Fund is willing to accept. In addi on, the Fund monitors and measures the overall risk bearing capacity in rela on to the aggregate risk exposure across all risks type and ac vi es.
(d) Risk mi ga on
The Fund has investment guidelines that set out its overall business strategies, its tolerance for risk and its general risk management philosophy. The Manager also has a Compliance Department to ensure that the Fund complies with the various regula ons and guidelines as s pulated in its Trust Deed, the Securi es Commission’s Guidelines on Unit Trust Funds and the Capital Markets and Services Act, 2007.
It is, and has been throughout the current and previous fi nancial period, the Fund’s policy that no deriva ves shall be undertaken for either investment risk management purposes.
(e) Excessive risk concentra on
Concentra on indicates the rela ve sensi vity of the Fund’s performance to developments aff ec ng a par cular industry or geographical loca on. Concentra ons of risk arise when a number of fi nancial instruments or contracts are entered into with the same counterparty, or where a number of counterpar es are engaged in similar business ac vi es, or ac vi es in the same geographic region, or have similar economic features that would cause their ability to meet contractual obliga ons to be similarly aff ected by changes in economic, poli cal or other condi ons. Concentra ons of foreign exchange risk may arise if the Fund has a signifi cant net posi on in a single foreign currency, or aggregate net posi ons in several currencies that tend to move together.

46
KENANGA BALANCED FUND (KBF)Report to Unit Holders for the 6-Month Financial Period Ended 30 June 2013
22. FINANCIAL RISK AND MANAGEMENT OBJECTIVES AND POLICIES CONTD.
(e) Excessive risk concentra on (Contd.)
In order to avoid excessive concentra on of risk, the Fund’s policies and procedures include specifi c guidelines to focus on maintaining a diversifi ed por olio in accordance with the Fund’s Trust Deed, Investment Manager’s guidelines and the Securi es Commission’s Guidelines on Unit Trust Funds. Por olio diversifi ca on across a number of sectors and industries minimises the risk not only of any single company’s securi es becoming worthless but also of all holdings suff ering uniformly adverse business condi ons. Specifi cally, the Fund’s Trust Deed and Securi es Commission’s Guidelines on Unit Trust Funds limits the Fund’s exposure to a single en ty/industry sector to a certain percentage of its NAV.
(f) Market risk
Market risk is the risk that the fair value or future cash fl ows of fi nancial instruments will fl uctuate due to changes in market variables such as interest rates, foreign exchange rates and equity prices. The maximum risk resul ng from fi nancial instruments equals their fair value.
(i) Interest rate risk
Cash is par cularly sensi ve to movements in interest rates. When interest rates rise, the return on cash will rise while the value of fi xed income securi es or bond will fall and vice versa, thus aff ec ng the NAV of the Fund. When the interest rate trend is an cipated to rise, the exposure to bond will be reduced to an acceptable level.
The Fund’s investments in debt securi es carry fi xed interest rates and mature within ten years while deposits with licensed fi nancial ins tu ons are usually rolled-over on a daily/month basis.
Interest rate risk sensi vity
The following table demonstrates the sensi vity of the Fund’s profi t/(loss) for the period and other comprehensive income to a reasonably possible change in interest rates, with all other variables held constant.
The sensi vity is the eff ect of the assumed changes in interest rates on:
• the net interest income for one period, based on the fl oa ng rate fi nancial assets held at the end of the repor ng period; and
• changes in fair value of investments for the period, based on revaluing fi xed rate fi nancial assets at the end of the repor ng period.

47
KENANGA BALANCED FUND (KBF)Report to Unit Holders for the 6-Month Financial Period Ended 30 June 2013
22. FINANCIAL RISK AND MANAGEMENT OBJECTIVES AND POLICIES CONTD.
(f) Market risk (Contd.)
(i) Interest rate risk (Contd.)
Sensi vity of changes Sensi vity in fair value Sensi vity of of other Shariah- profi t income comprehensive compliant Changes in and profi t income investments basis (decrease)/ (decrease)/ (decrease)/ points* increase increase increase RM RM RM As at 30 June 2013 +25/-25 (4,975)/4,975 - (4,975)/4,975
As at 30 June 2012 +25/-25 (2,712)/3,307 - (2,712)/3,307
* The assumed movement in basis points for interest rate sensi vity analysis is based on the currently observable market environment.
In prac ce, the actual trading results may diff er from the sensi vity analysis below and the diff erence could be material.

48
KENANGA BALANCED FUND (KBF)Report to Unit Holders for the 6-Month Financial Period Ended 30 June 2013
21. FINANCIAL RISK AND MANAGEMENT OBJECTIVES AND POLICIES CONTD.
(e) Market risk (Contd.)
(i) Interest rate risk (Contd.)
Interest rate risk exposure (Contd.)
Non- exposure to Eff ec ve 0-3 3 months 5-10 interest rate rate months -5 years years movement Total of return* RM RM RM RM RM %
As at 30 June 2013
Assets Financial assets held at FVTPL - 8,149,127 - 12,738,147 20,887,274 Deposits with fi nancial ins tu ons 1,990,000 - - - 1,990,000 Other assets - - - 2,768,590 2,768,590
Total assets 1,990,000 8,149,127 - 15,506,737 25,645,864
Liabili es Other liabili es - - - 832,279 832,279
Total liabili es - - - 832,279 832,279
Total interest sensi vity gap 1,990,000 8,149,127 - 14,674,458 24,813,585
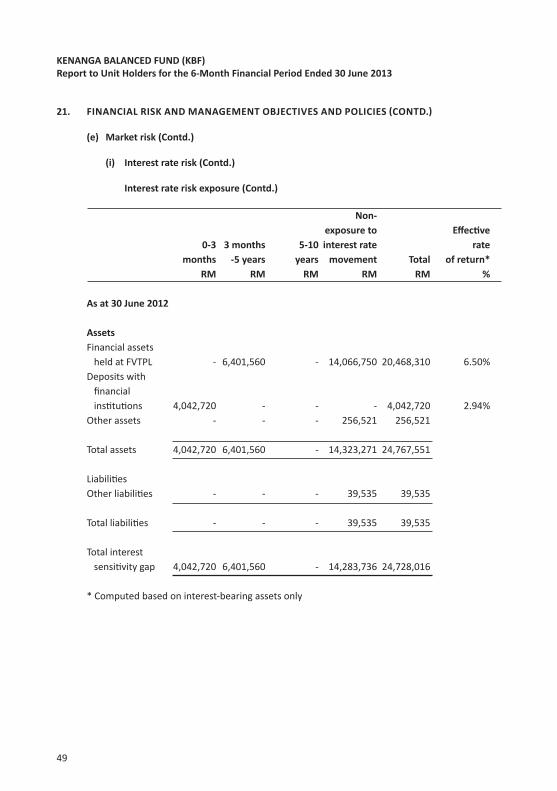
49
KENANGA BALANCED FUND (KBF)Report to Unit Holders for the 6-Month Financial Period Ended 30 June 2013
21. FINANCIAL RISK AND MANAGEMENT OBJECTIVES AND POLICIES CONTD.
(e) Market risk (Contd.)
(i) Interest rate risk (Contd.)
Interest rate risk exposure (Contd.)
Non- exposure to Eff ec ve 0-3 3 months 5-10 interest rate rate months -5 years years movement Total of return* RM RM RM RM RM %
As at 30 June 2012
Assets Financial assets held at FVTPL - 6,401,560 - 14,066,750 20,468,310 6.50% Deposits with fi nancial ins tu ons 4,042,720 - - - 4,042,720 2.94% Other assets - - - 256,521 256,521
Total assets 4,042,720 6,401,560 - 14,323,271 24,767,551
Liabili es Other liabili es - - - 39,535 39,535
Total liabili es - - - 39,535 39,535
Total interest sensi vity gap 4,042,720 6,401,560 - 14,283,736 24,728,016
* Computed based on interest-bearing assets only
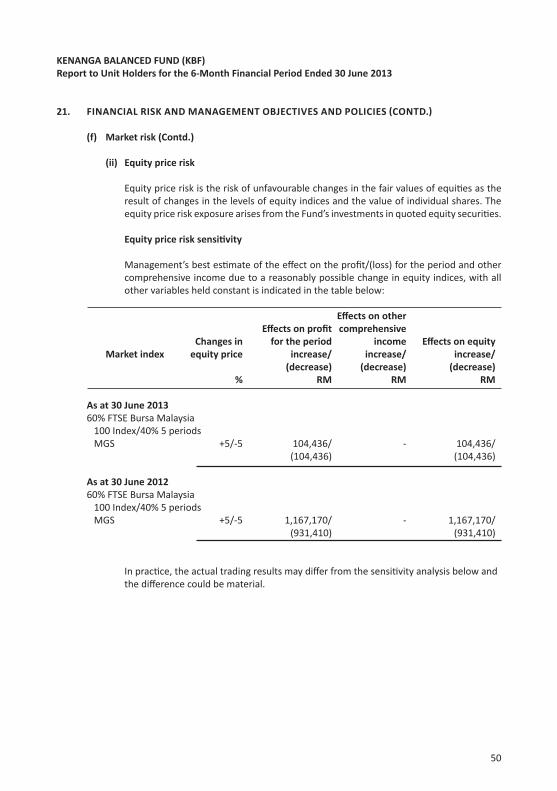
50
KENANGA BALANCED FUND (KBF)Report to Unit Holders for the 6-Month Financial Period Ended 30 June 2013
21. FINANCIAL RISK AND MANAGEMENT OBJECTIVES AND POLICIES CONTD.
(f) Market risk (Contd.)
(ii) Equity price risk
Equity price risk is the risk of unfavourable changes in the fair values of equi es as the result of changes in the levels of equity indices and the value of individual shares. The equity price risk exposure arises from the Fund’s investments in quoted equity securi es.
Equity price risk sensi vity
Management’s best es mate of the eff ect on the profi t/(loss) for the period and other comprehensive income due to a reasonably possible change in equity indices, with all other variables held constant is indicated in the table below:
Eff ects on other Eff ects on profi t comprehensive Changes in for the period income Eff ects on equity Market index equity price increase/ increase/ increase/ (decrease) (decrease) (decrease) % RM RM RM
As at 30 June 2013 60% FTSE Bursa Malaysia 100 Index/40% 5 periods MGS +5/-5 104,436/ - 104,436/ (104,436) (104,436)
As at 30 June 2012 60% FTSE Bursa Malaysia 100 Index/40% 5 periods MGS +5/-5 1,167,170/ - 1,167,170/ (931,410) (931,410)
In prac ce, the actual trading results may diff er from the sensi vity analysis below and the diff erence could be material.
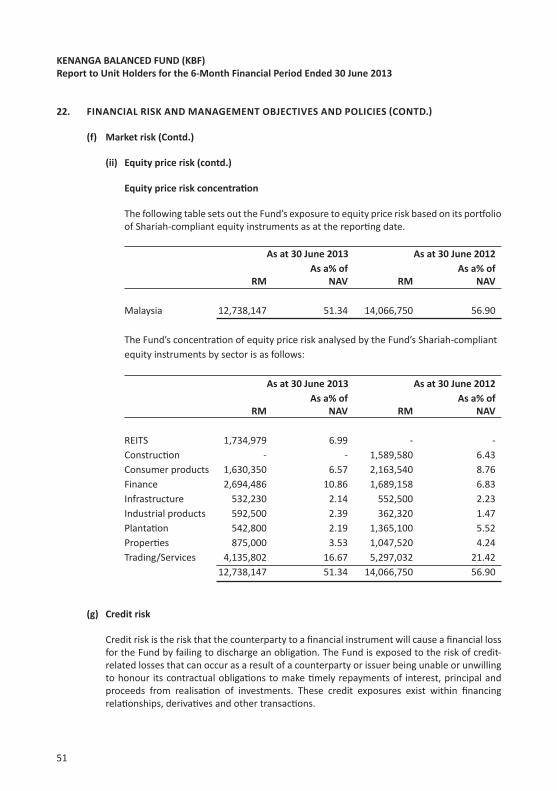
51
KENANGA BALANCED FUND (KBF)Report to Unit Holders for the 6-Month Financial Period Ended 30 June 2013
22. FINANCIAL RISK AND MANAGEMENT OBJECTIVES AND POLICIES CONTD.
(f) Market risk (Contd.)
(ii) Equity price risk (contd.)
Equity price risk concentra on
The following table sets out the Fund’s exposure to equity price risk based on its por olio of Shariah-compliant equity instruments as at the repor ng date.
As at 30 June 2013 As at 30 June 2012 As a% of As a% of RM NAV RM NAV
Malaysia 12,738,147 51.34 14,066,750 56.90
The Fund’s concentra on of equity price risk analysed by the Fund’s Shariah-compliant equity instruments by sector is as follows:
As at 30 June 2013 As at 30 June 2012 As a% of As a% of RM NAV RM NAV
REITS 1,734,979 6.99 - - Construc on - - 1,589,580 6.43 Consumer products 1,630,350 6.57 2,163,540 8.76 Finance 2,694,486 10.86 1,689,158 6.83 Infrastructure 532,230 2.14 552,500 2.23 Industrial products 592,500 2.39 362,320 1.47 Planta on 542,800 2.19 1,365,100 5.52 Proper es 875,000 3.53 1,047,520 4.24 Trading/Services 4,135,802 16.67 5,297,032 21.42 12,738,147 51.34 14,066,750 56.90
(g) Credit risk
Credit risk is the risk that the counterparty to a fi nancial instrument will cause a fi nancial loss for the Fund by failing to discharge an obliga on. The Fund is exposed to the risk of credit-related losses that can occur as a result of a counterparty or issuer being unable or unwilling to honour its contractual obliga ons to make mely repayments of interest, principal and proceeds from realisa on of investments. These credit exposures exist within fi nancing rela onships, deriva ves and other transac ons.

52
KENANGA BALANCED FUND (KBF)Report to Unit Holders for the 6-Month Financial Period Ended 30 June 2013
22. FINANCIAL RISK AND MANAGEMENT OBJECTIVES AND POLICIES CONTD.
(g) Credit risk (Contd.)
The Manager manages the Fund’s credit risk by undertaking credit evalua on and close monitoring of any changes to the issuer/counterparty’s credit profi le to minimise such risk. It is the Fund’s policy to enter into fi nancial instruments with reputable counterpar es. The Manager also closely monitors the creditworthiness of the Fund’s counterpar es (e.g., brokers, custodian, banks, etc.) by reviewing their credit ra ngs and credit profi le on a regular basis.
Credit risk exposure
At the repor ng date, the Fund’s maximum exposure to credit risk is represented by the carrying amount of each class of fi nancial assets recognised in the statement of fi nancial posi on.
None of the Fund’s fi nancial assets were past due nor impaired as at 30 June 2013 and 30 June 2012.
Credit quality of fi nancial assets
The Fund invests only in debt securi es with at least investment grade credit ra ng by a credit ra ng agency. The following table analyses the Fund’s por olio of debt securi es by ra ng category:
As at 30 June 2013 As at 30 June 2012 As a% of As a% of As a% of As a% of Debt securi es NAV Debt securi es NAV
Credit ra ng AA 100 32.85 100 25.95

53
KENANGA BALANCED FUND (KBF)Report to Unit Holders for the 6-Month Financial Period Ended 30 June 2013
22. FINANCIAL RISK AND MANAGEMENT OBJECTIVES AND POLICIES CONTD.
(g) Credit risk (Contd.)
Credit risk concentra on
Concentra on of risk is monitored and managed based on sectorial distribu on.
The table below analyses the Fund’s por olio of sukuk analysed by sectorial distribu on:
As at 30 June 2013 As at 30 June 2012 As a% of As a% of As a% of As a% of Debt securi es NAV Debt securi es NAV
Sector Finance 12 4.07 - - Infrastructure and u li es 26 8.54 100 25.95 Planta on 62 20.24 - -
100 32.85 100 25.95
The table below analyses the Fund’s por olio of sukuk analysed by sectorial distribu on:
As at 30 June 2013 As at 30 June 2012 As a% of As a% of As a% of As a% of Debt securi es NAV Debt securi es NAV
Geographical region Malaysia 100 32.85 100 25.95

54
KENANGA BALANCED FUND (KBF)Report to Unit Holders for the 6-Month Financial Period Ended 30 June 2013
22. FINANCIAL RISK AND MANAGEMENT OBJECTIVES AND POLICIES CONTD.
(h) Liquidity risk
Liquidity risk is defi ned as the risk that the Fund will encounter diffi culty in mee ng obliga ons associated with fi nancial liabili es that are se led by delivering cash or another fi nancial asset. Exposure to liquidity risk arises because of the possibility that the Fund could be required to pay its liabili es or redeem its units earlier than expected. The Fund is exposed to cash redemp ons of its units on a regular basis. Units sold to unitholders by the Manager are redeemable at the unitholder’s op on based on the Fund’s net asset value per unit at the me of redemp on calculated in accordance with the Fund’s Trust Deed.
The Manager’s policy is to always maintain a prudent and suffi cient level of liquid assets so as to meet normal opera ng requirements and expected redemp on requests by unitholders. Liquid assets comprise cash, deposits with fi nancial ins tu ons and other instruments which are capable of being converted into cash within 7 days.
The following table summarises the maturity profi le of the Fund’s units in issue (classifi ed as equity instruments) and fi nancial liabili es. Balances due within six months equal their carrying amounts, as the impact of discoun ng is insignifi cant. The table also analyses the maturity profi le of the Fund’s fi nancial assets (undiscounted where appropriate) and equity in order to provide a complete view of the Fund’s contractual commitments and liquidity.
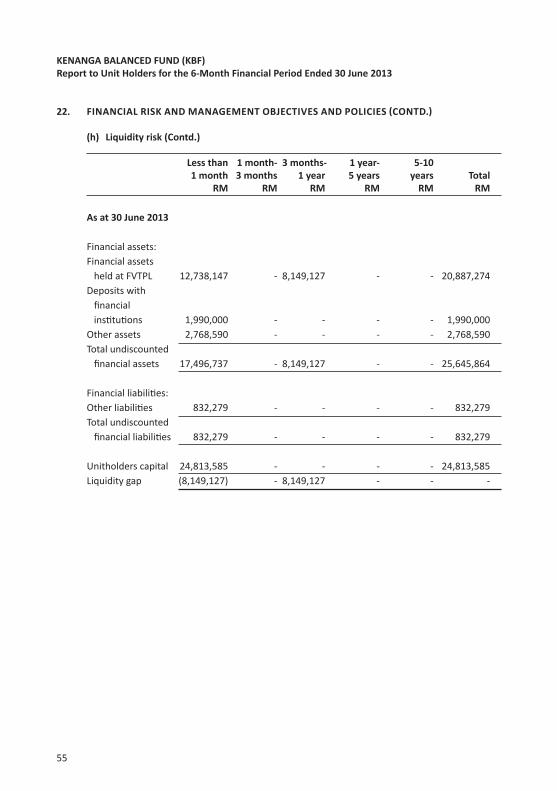
55
KENANGA BALANCED FUND (KBF)Report to Unit Holders for the 6-Month Financial Period Ended 30 June 2013
22. FINANCIAL RISK AND MANAGEMENT OBJECTIVES AND POLICIES CONTD.
(h) Liquidity risk (Contd.)
Less than 1 month- 3 months- 1 year- 5-10 1 month 3 months 1 year 5 years years Total RM RM RM RM RM RM
As at 30 June 2013
Financial assets: Financial assets held at FVTPL 12,738,147 - 8,149,127 - - 20,887,274 Deposits with fi nancial ins tu ons 1,990,000 - - - - 1,990,000 Other assets 2,768,590 - - - - 2,768,590 Total undiscounted fi nancial assets 17,496,737 - 8,149,127 - - 25,645,864
Financial liabili es: Other liabili es 832,279 - - - - 832,279 Total undiscounted fi nancial liabili es 832,279 - - - - 832,279
Unitholders capital 24,813,585 - - - - 24,813,585 Liquidity gap (8,149,127) - 8,149,127 - - -

56
KENANGA BALANCED FUND (KBF)Report to Unit Holders for the 6-Month Financial Period Ended 30 June 2013
22. FINANCIAL RISK AND MANAGEMENT OBJECTIVES AND POLICIES CONTD.
(h) Liquidity risk (Contd.)
Less than 1 month- 3 months- 1 year- 5-10 1 month 3 months 1 year 5 years years Total RM RM RM RM RM RM
As at 30 June 2012
Financial assets: Financial assets held at FVTPL 14,066,750 - 6,401,560 - - 20,468,310 Deposits with fi nancial ins tu ons 4,042,720 - - - - 4,042,720 Other assets 256,521 - - - - 256,521 Total undiscounted fi nancial assets 18,365,991 - 6,401,560 - - 24,767,551
Financial liabili es: Other liabili es 39,535 - - - - 39,535 Total undiscounted fi nancial liabili es 39,535 - - - - 39,535
Unitholders capital 24,728,016 - - - - 24,728,016 Liquidity gap (6,401,560) - 6,401,560 - - -
57
KENANGA BALANCED FUND (KBF)Report to Unit Holders for the 6-Month Financial Period Ended 30 June 2013
22. FINANCIAL RISK AND MANAGEMENT OBJECTIVES AND POLICIES CONTD.
(h) Liquidity risk
Notes:
(i) Financial assets Analysis of fi nancial assets at fair value through profi t or loss into maturity groupings
is based on the expected date on which these assets will be realised. Quoted equity instruments have been included in the “Less than 1 month category” on the assump on that these are highly liquid investments which can be realised should all of the Fund’s unitholders’ capital are required to be redeemed. For other assets, the analysis into maturity groupings is based on the remaining period from the end of the repor ng period to the contractual maturity date or if earlier, the expected date on which the assets will be realised/maturity dates of debt securi es.
(ii) Financial liabili es The maturity grouping is based on the remaining period from the end of the repor ng
period to the contractual maturity date. When counterparty has a choice of when the amount is paid, the liability is allocated to the earliest period in which the Fund can be required to pay.
(iii) Equity As unitholders can request for redemp on on their units without giving the Manager
any no ce period and the redemp ons are repayable within 10 days, they have been categorised as having a maturity of “Less than 1 month”.
(i) Specifi c risk
The Fund is exposed to the individual risk of the respec ve companies issuing equity securi es and bond which includes changes to the business performance of the company, consumer tastes and demand, lawsuits and management prac ces. This risk is minimised through the well diversifi ed nature of the Fund.
(j) Infl a on risk
The Fund is subject to the risk of Unitholders’ investment not growing propor onately to the infl a on rate thereby decreasing the Unitholders’ purchasing power even though the investment in monetary terms may have increased.
(k) Compliance risk
Non-compliance of regula ons imposed by the Securi es Commission Act 1993 and the Securi es Commission’s Guidelines on Unit Trust Funds may aff ect the Unitholders’ investment.
58
KENANGA BALANCED FUND (KBF)Report to Unit Holders for the 6-Month Financial Period Ended 30 June 2013
22. FINANCIAL RISK AND MANAGEMENT OBJECTIVES AND POLICIES CONTD.
(l) Single issuer risk
Internal policy restricts the Fund from inves ng in securi es issued by any issuer of not more than a certain percentage of its net assets value. Under such restric on, the risk exposure to the securi es of any issuer is managed based on internal/external ra ngs.
(m) Regulatory risk
Any changes in na onal policies and regula ons may have an eff ect on the capital market.
(n) Management risk
Poor management of a fund may cause considerable losses to the Fund that in turn will aff ect the capital invested by Unitholders.
23. CAPITAL MANAGEMENT
The capital of the Fund can vary depending on the demand for redemp ons and subscrip ons to the Fund. The Fund’s approved fund size and units in issue at the end of the fi nancial period is disclosed in Note 13.
The Funds’ objec ves for managing capital are:
(a) To invest in investments mee ng the descrip on, risk exposure and expected return indicated in its prospectus;
(b) To achieve consistent returns while safeguarding capital by using various investment strategies;
(c) To maintain suffi cient liquidity to meet the expenses of the Fund, and to meet redemp on
requests as they arise; and
(d) To maintain suffi cient fund size to make the opera on of the Fund cost-effi cient.
No changes were made to the capital management objec ves, policies or processes during the current fi nancial period.
24. EVENTS AFTER THE REPORTING PERIOD
There were no events occurring since the last repor ng date and before the comple on of these fi nancial statements

59
This page has been inten onally le blank.

60
This page has been inten onally le blank.

61
This page has been inten onally le blank.