Embed Size (px)
Citation preview
KECUK SUHARIYANTO, M. SAIRI, AND WYNANDIN IMAWAN
Towards SEEA Experimental Ecosystem Accounting in Indonesia:
BPS-Statistics Indonesia
44th Session of the United Nations Statistical CommissionFebruary 25th 2013
Current Works, Main Challenges, and National Plans
1. INTRODUCTION
The Indonesian government has been implementing sustainable development principles of the green economy stated as Pro-Growth, Pro-Job, Pro-Poor, and Pro-Environment.
Pro-Environment: Indonesia has been part of REDD (Reducing Emission from Deforestation and Forest Degradation).
REDD is a scheme which allows developed countries to give compensation for forest sequestration of the developing countries.
Indonesia has a commitment to reduce carbon dioxide emission, which cause climate changes, to 26 % in 2020, and 41 percent with international assistance.
25 FEB 2013 2
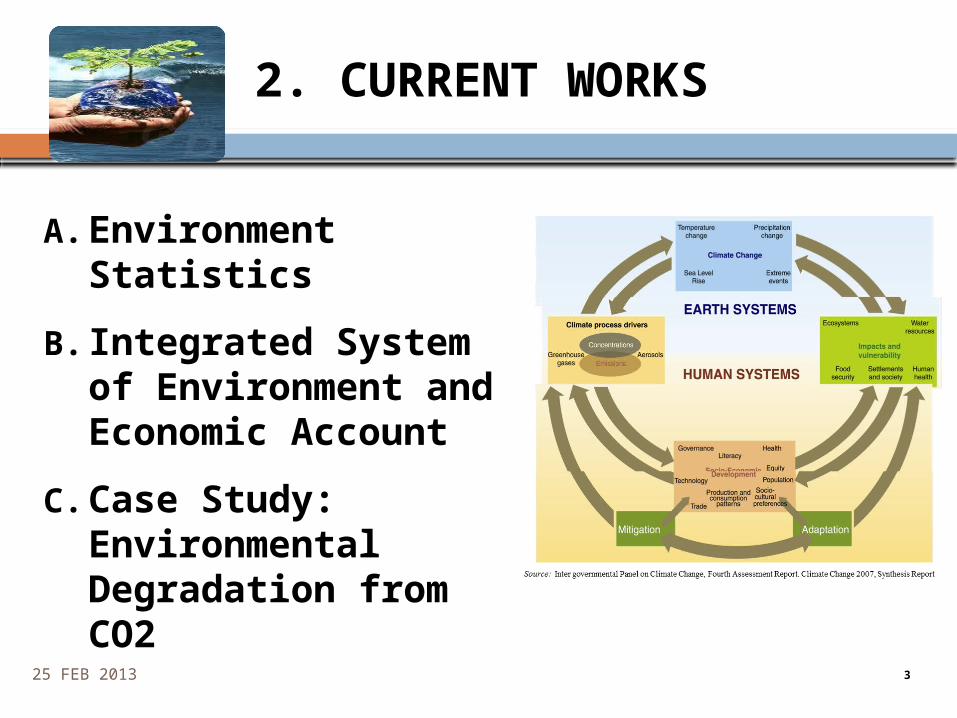
2. CURRENT WORKS
A.Environment Statistics
B. Integrated System of Environment and Economic Account
C. Case Study: Environmental Degradation from CO2
25 FEB 2013 3
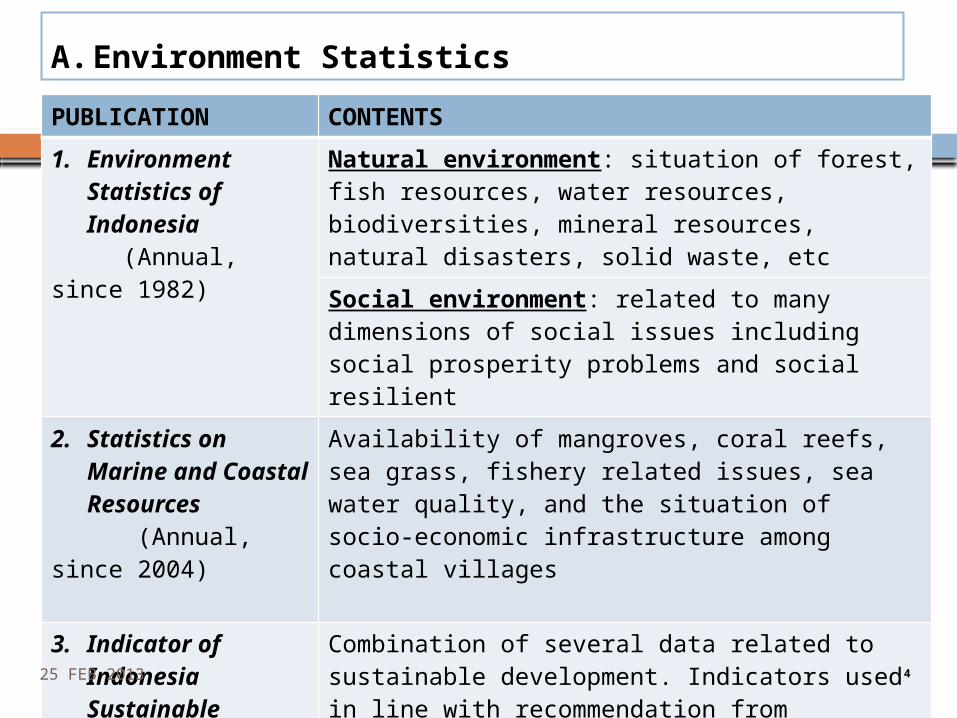
A. Environment Statistics
PUBLICATION CONTENTS
1. Environment Statistics of Indonesia
(Annual, since 1982)
Natural environment: situation of forest, fish resources, water resources, biodiversities, mineral resources, natural disasters, solid waste, etc
Social environment: related to many dimensions of social issues including social prosperity problems and social resilient
2. Statistics on Marine and Coastal Resources
(Annual, since 2004)
Availability of mangroves, coral reefs, sea grass, fishery related issues, sea water quality, and the situation of socio-economic infrastructure among coastal villages
3. Indicator of Indonesia Sustainable Development
Combination of several data related to sustainable development. Indicators used in line with recommendation from Commission on Sustainable Development within the Framework of Driving Force-State-Response (DSR). Data including: poverty, governance, health related issues, education, demography, atmosphere, land used, freshwater, biodiversity, global economic partnership, consumption pattern, etc.
25 FEB 2013 4
PUBLICATION CONTENTS
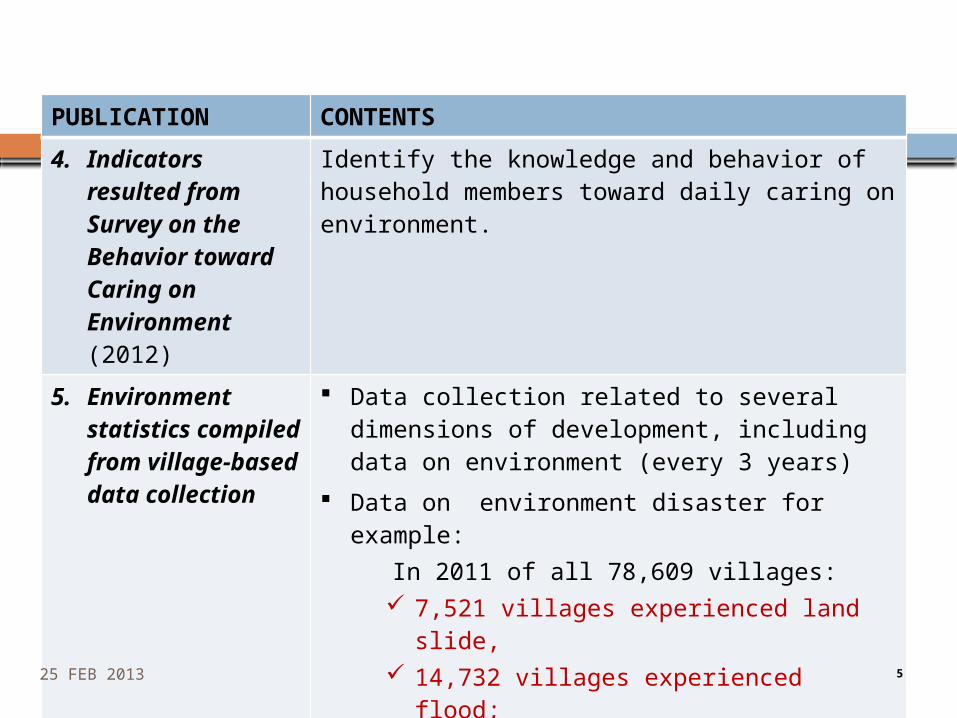
4. Indicators resulted from Survey on the Behavior toward Caring on Environment (2012)
Identify the knowledge and behavior of household members toward daily caring on environment.
5. Environment statistics compiled from village-based data collection
Data collection related to several dimensions of development, including data on environment (every 3 years)
Data on environment disaster for example: In 2011 of all 78,609 villages:
7,521 villages experienced land slide, 14,732 villages experienced flood; 1,609 village with tide; 554 villages experienced forest-fire; 2,105 villages with dryness.
25 FEB 2013 5
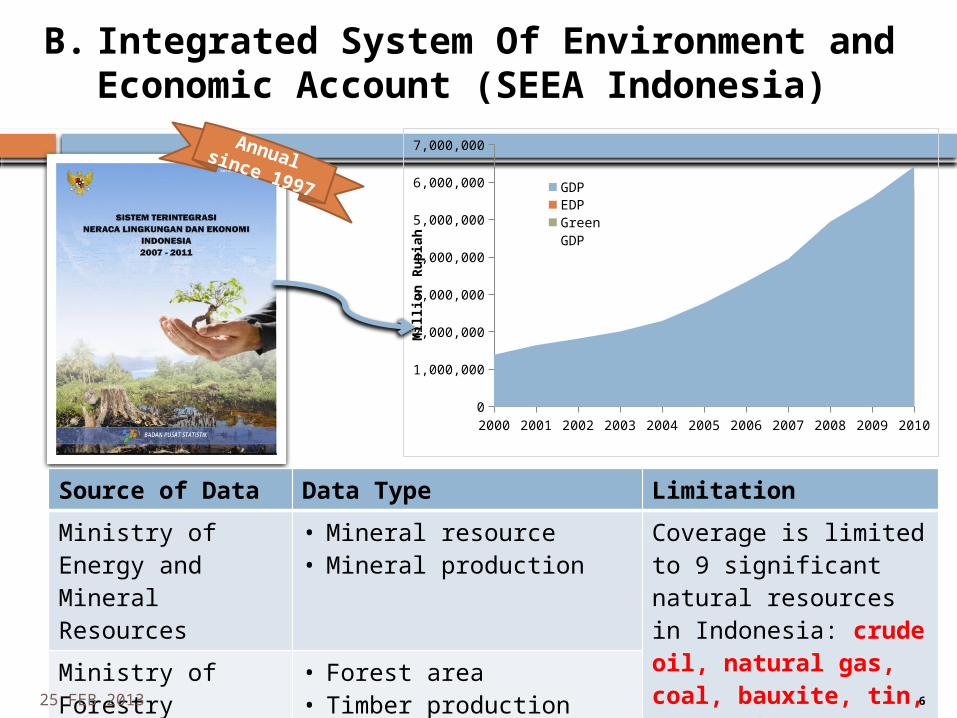
B. Integrated System Of Environment and Economic Account (SEEA Indonesia)
Source of Data Data Type Limitation
Ministry of Energy and Mineral Resources
• Mineral resource• Mineral production
Coverage is limited to 9 significant natural resources in Indonesia: crude oil, natural gas, coal, bauxite, tin, gold, silver, nickel ore, and timber wood
Ministry of Forestry
• Forest area• Timber production
Statistics Indonesia
• National account aggregates
2000 2001 2002 2003 2004 2005 2006 2007 2008 2009 20100
1,000,000
2,000,000
3,000,000
4,000,000
5,000,000
6,000,000
7,000,000
GDPEDPGreen GDP
Million R
upia
h
Annual since 1997
25 FEB 2013 6
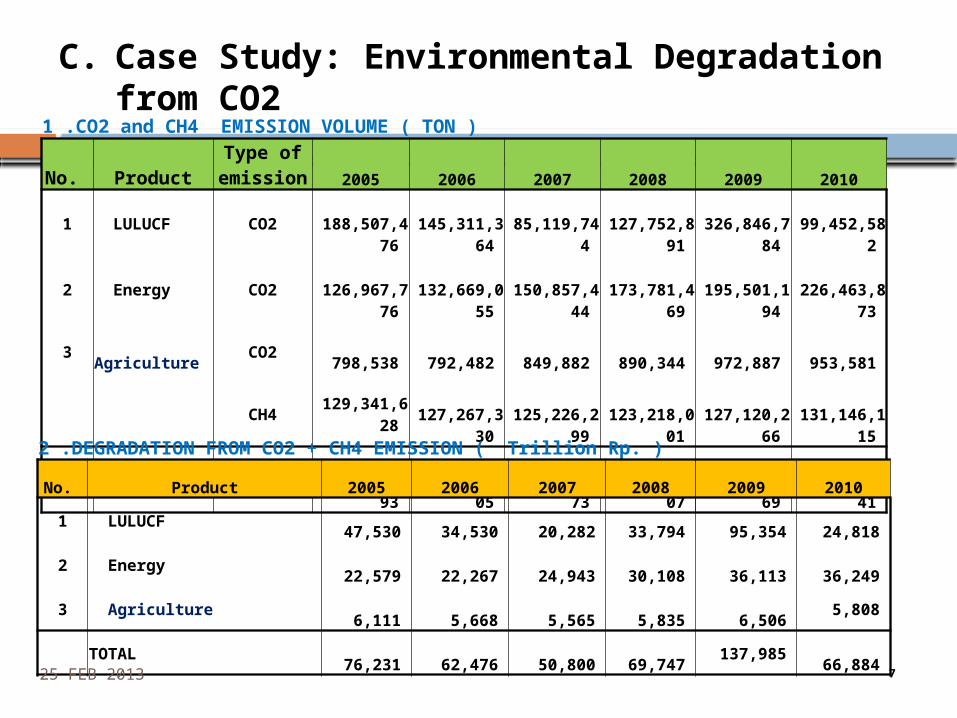
C. Case Study: Environmental Degradation from CO2
1 .CO2 and CH4 EMISSION VOLUME ( TON )
No. ProductType of
emission 2005 2006 2007 2008 2009 2010
1 LULUCF CO2
188,507,476
145,311,3
64
85,119,74
4
127,752,8
91
326,846,7
84
99,452,58
2
2 Energy CO2
126,967,776
132,669,0
55
150,857,4
44
173,781,4
69
195,501,1
94
226,463,8
73
3 Agriculture CO2
798,538
792,482
849,882
890,344
972,887
953,581
CH4129,341,6
28
127,267,3
30
125,226,2
99
123,218,0
01
127,120,2
66
131,146,1
15
TOTAL CO2
316,273,793
278,772,9
05
236,827,0
73
302,424,7
07
523,320,8
69
326,870,0
41 2 .DEGRADATION FROM CO2 + CH4 EMISSION ( Trillion Rp. )
No. Product 2005 2006 2007 2008 2009 2010
1 LULUCF
47,530
34,530
20,282
33,794
95,354
24,818
2 Energy
22,579
22,267
24,943
30,108
36,113
36,249
3 Agriculture 6,111
5,668
5,565
5,835
6,506
5,808
TOTAL
76,231
62,476
50,800
69,747 137,985
66,884
25 FEB 2013 7
Summary of Findings Government must be aware about the increase of forest
conversion and depletion, and also the decrease of additional growth of forest outside of Java.
Over exploitation of timber wood especially outside of Java is reflected in the decrease of end of year inventory of timber wood.
Rate of depletion for some of mineral resources is exceeding the rate of deposit discovery, so the end of year deposit resources is significantly diminished (such as crude oil, natural gas, gold, and nickel ore).
Warning about over exploitation of crude oil, bauxite and tin because the ratio of end of year deposit resource to production is pretty low.
Net Domestic Product and net accumulated capital become different from the conventional National Account aggregates due to the decrease of produced assets and also the decrease of non-produced (environmental) assets.25 FEB 2013 8
Data availabilityUnstandarized of measurement and conceptData scatters in various institutions Coordination needs to be enhanced
Insufficient knowledgeKnowledge gap among staffNeed technical assistance in improving existing environmental account & toward the development of ecosystem account
Institutional ChallengesNeed to strengthen capability of statistical institutionNeed to create more awareness among stakeholders on the important of facts-based decision making pertaining to environment related issues and its impactsNeed statistical advocacy to recognize the importance of doing data analysis and researches on ecosystem accounting
3. MAIN CHALLENGES
25 FEB 2013 9
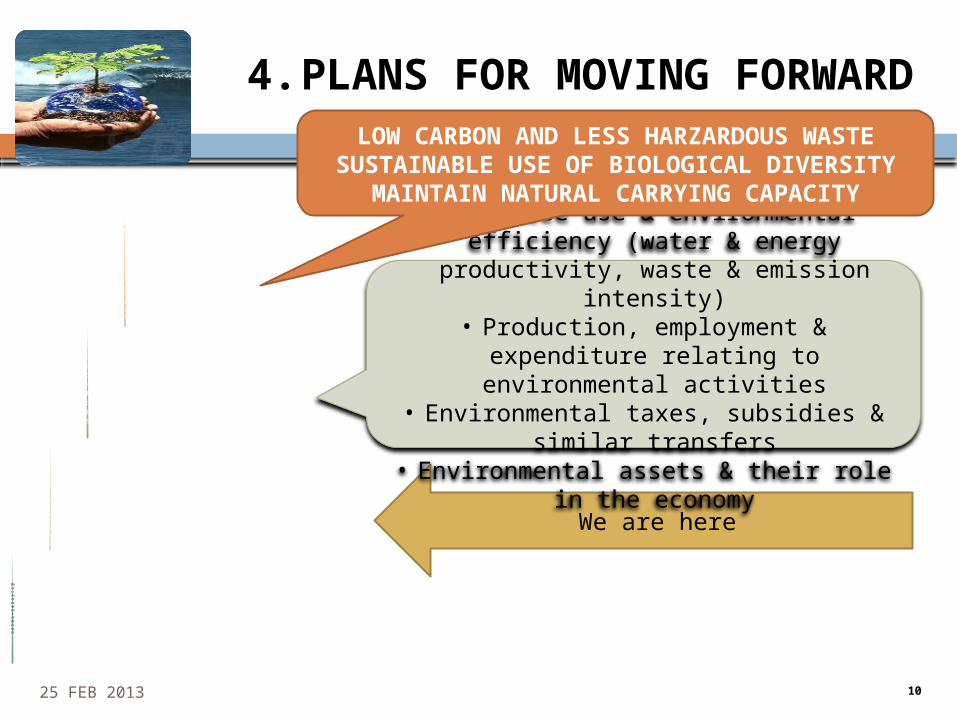
Key indicators
Indicators
Accounts (SEEA)
Basic/environment statistics
We are here
• Resource use & environmental efficiency (water & energy productivity, waste &
emission intensity)• Production, employment & expenditure
relating to environmental activities• Environmental taxes, subsidies & similar
transfers• Environmental assets & their role in the
economy
LOW CARBON AND LESS HARZARDOUS WASTE
SUSTAINABLE USE OF BIOLOGICAL DIVERSITY
MAINTAIN NATURAL CARRYING CAPACITY
4. PLANS FOR MOVING FORWARD
25 FEB 2013 10
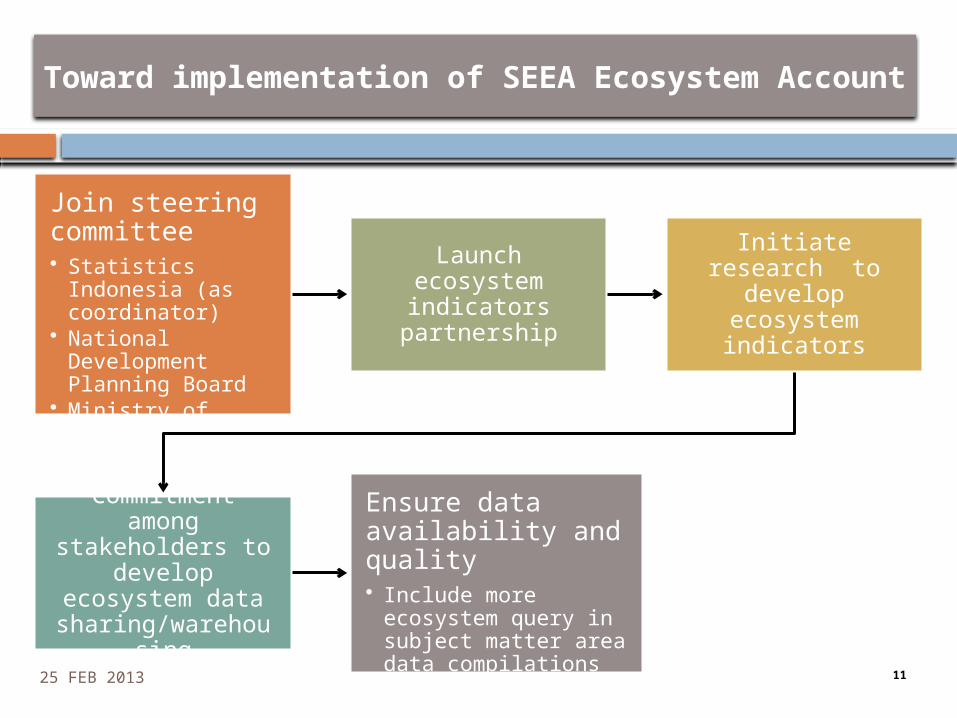
Toward implementation of SEEA Ecosystem Account
Join steering committee• Statistics Indonesia
(as coordinator)• National
Development Planning Board
• Ministry of Environment
Launch ecosystem indicators
partnership
Initiate research to develop ecosystem indicators
Commitment among
stakeholders to develop
ecosystem data sharing/warehousi
ng
Ensure data availability and quality• Include more
ecosystem query in subject matter area data compilations
• Improving data gathering and reporting
25 FEB 2013 11
THANK YOU –TERIMA KASIH
25 FEB 2013 12
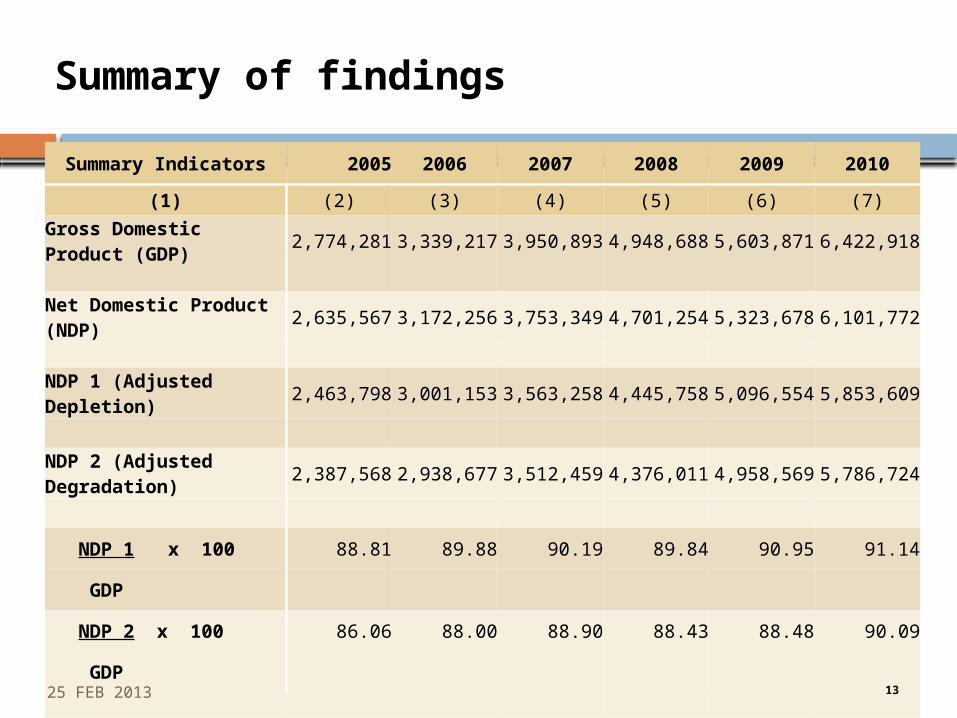
Summary of findings
Summary Indicators 2005 2006 2007 2008 2009 2010
(1) (2) (3) (4) (5) (6) (7)Gross Domestic Product (GDP)
2,774,281 3,339,217 3,950,893 4,948,688 5,603,871 6,422,918
Net Domestic Product (NDP)
2,635,567 3,172,256 3,753,349 4,701,254 5,323,678 6,101,772
NDP 1 (Adjusted Depletion)
2,463,798 3,001,153 3,563,258 4,445,758 5,096,554 5,853,609
NDP 2 (Adjusted Degradation)
2,387,568 2,938,677 3,512,459 4,376,011 4,958,569 5,786,724
NDP 1 x 100 88.81 89.88 90.19 89.84 90.95 91.14
GDP
NDP 2 x 100 86.06 88.00 88.90 88.43 88.48 90.09
GDP
25 FEB 2013 13