Embed Size (px)
Citation preview
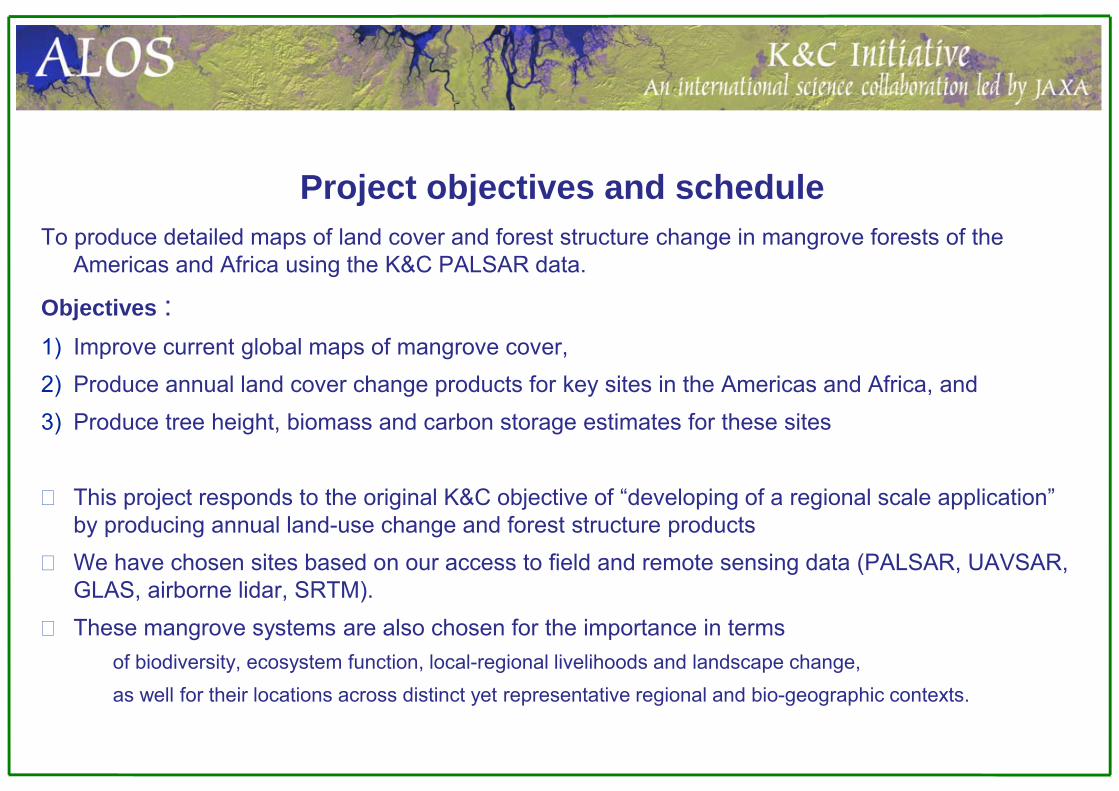
K&C Phase 3 – Brief project essentials
Mangrove extent, change and structure in Africa and the Americas
Lola FatoyinboNASA Goddard Space Flight Center
Marc SimardCaltech Jet Propulsion Laboratory
Naiara Pinto Caltech Jet Propulsion Laboratory
Science Team meeting #19JAXA TKSC/RESTEC HQ, Tsukuba/Tokyo, April 2013
To produce detailed maps of land cover and forest structure change in mangrove forests of the Americas and Africa using the K&C PALSAR data.
Objectives : 1) Improve current global maps of mangrove cover,2) Produce annual land cover change products for key sites in the Americas and Africa, and 3) Produce tree height, biomass and carbon storage estimates for these sites
This project responds to the original K&C objective of “developing of a regional scale application”by producing annual land-use change and forest structure products We have chosen sites based on our access to field and remote sensing data (PALSAR, UAVSAR, GLAS, airborne lidar, SRTM). These mangrove systems are also chosen for the importance in terms
� of biodiversity, ecosystem function, local-regional livelihoods and landscape change, � as well for their locations across distinct yet representative regional and bio-geographic contexts.
Project objectives and schedule
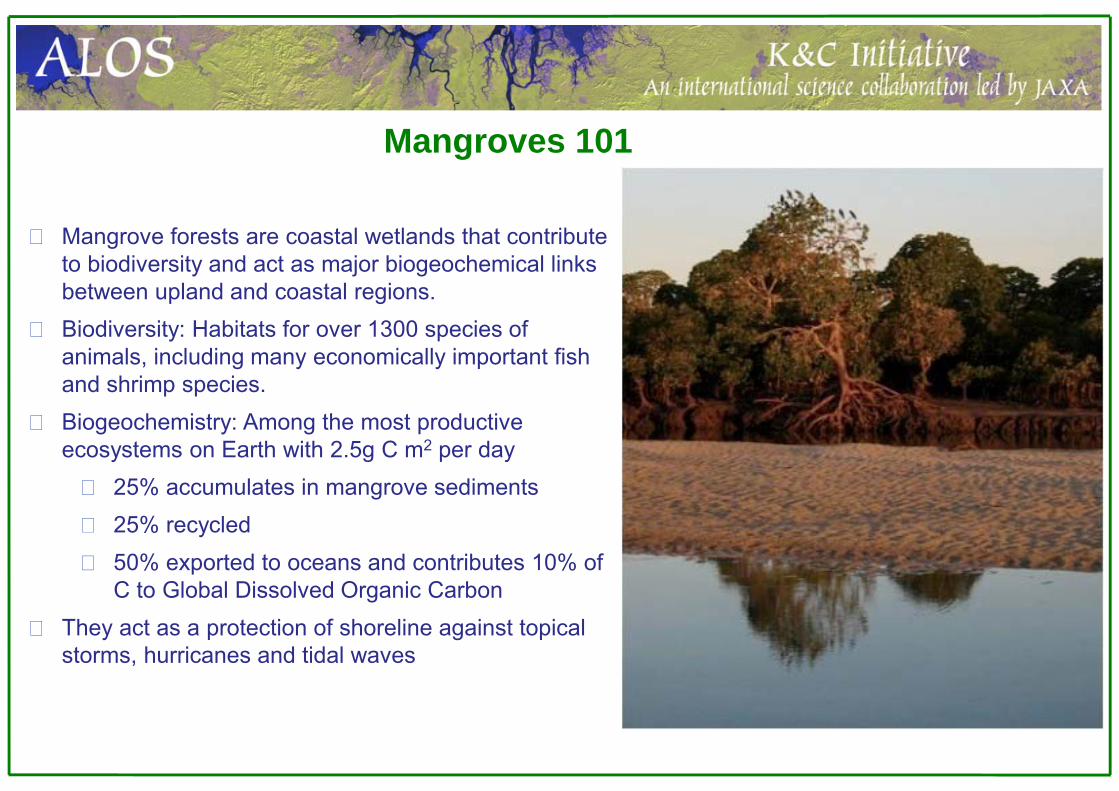
Mangroves 101
Mangrove forests are coastal wetlands that contribute to biodiversity and act as major biogeochemical links between upland and coastal regions.Biodiversity: Habitats for over 1300 species of animals, including many economically important fish and shrimp species.Biogeochemistry: Among the most productive ecosystems on Earth with 2.5g C m2 per day
25% accumulates in mangrove sediments25% recycled50% exported to oceans and contributes 10% of C to Global Dissolved Organic Carbon
They act as a protection of shoreline against topical storms, hurricanes and tidal waves
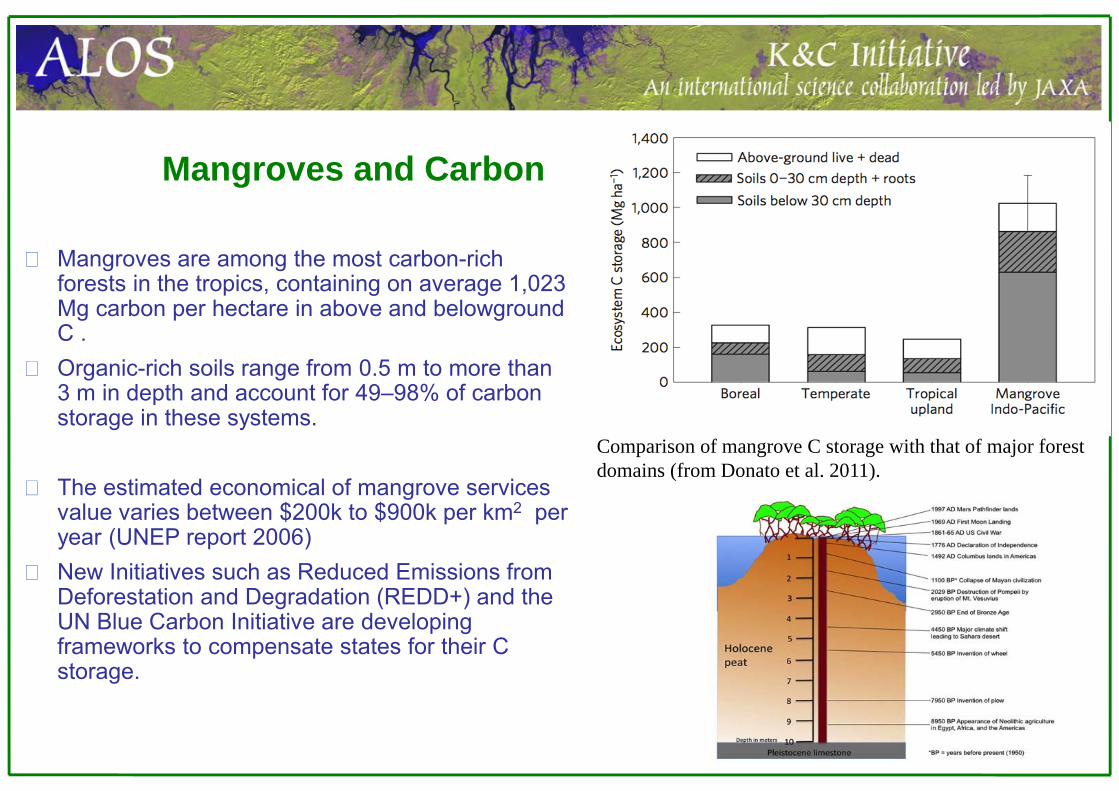
Mangroves and Carbon
Mangroves are among the most carbon-rich forests in the tropics, containing on average 1,023 Mg carbon per hectare in above and belowground C . Organic-rich soils range from 0.5 m to more than 3 m in depth and account for 49–98% of carbon storage in these systems.
The estimated economical of mangrove services value varies between $200k to $900k per km2 per year (UNEP report 2006)New Initiatives such as Reduced Emissions from Deforestation and Degradation (REDD+) and the UN Blue Carbon Initiative are developing frameworks to compensate states for their C storage.
Comparison of mangrove C storage with that of major forest domains (from Donato et al. 2011).
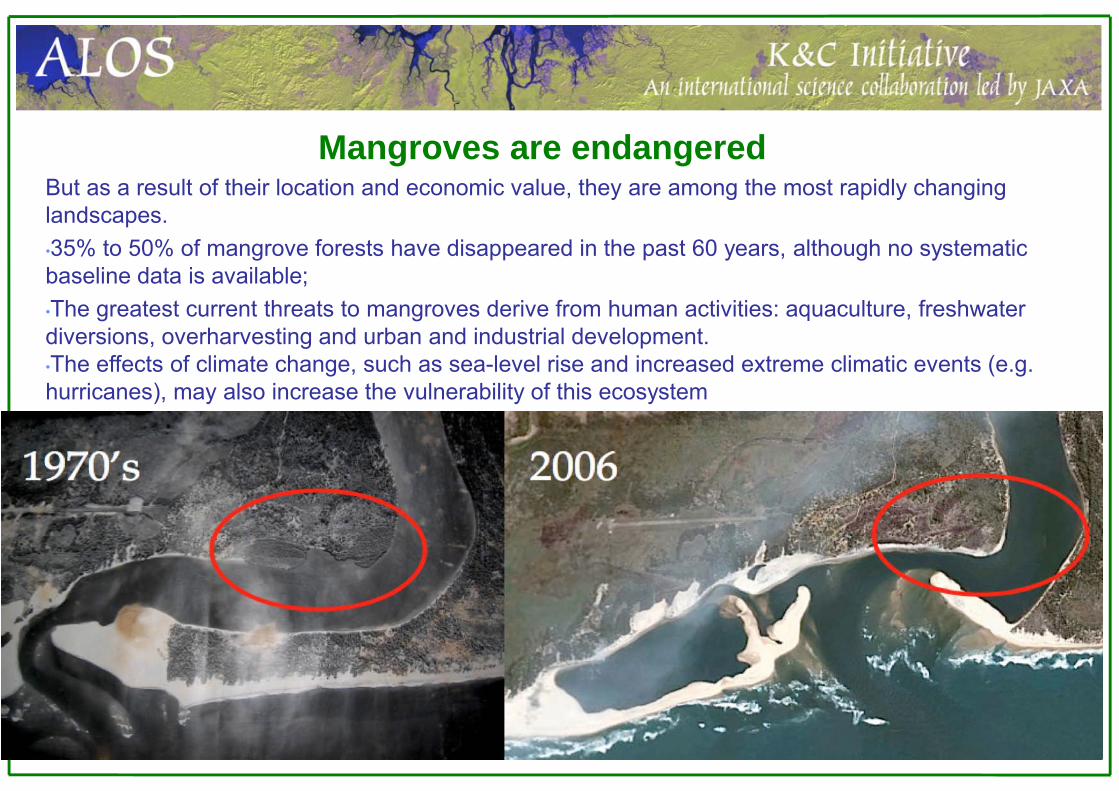
Mangroves are endangeredBut as a result of their location and economic value, they are among the most rapidly changing landscapes.•35% to 50% of mangrove forests have disappeared in the past 60 years, although no systematic baseline data is available;•The greatest current threats to mangroves derive from human activities: aquaculture, freshwater diversions, overharvesting and urban and industrial development.•The effects of climate change, such as sea-level rise and increased extreme climatic events (e.g. hurricanes), may also increase the vulnerability of this ecosystem
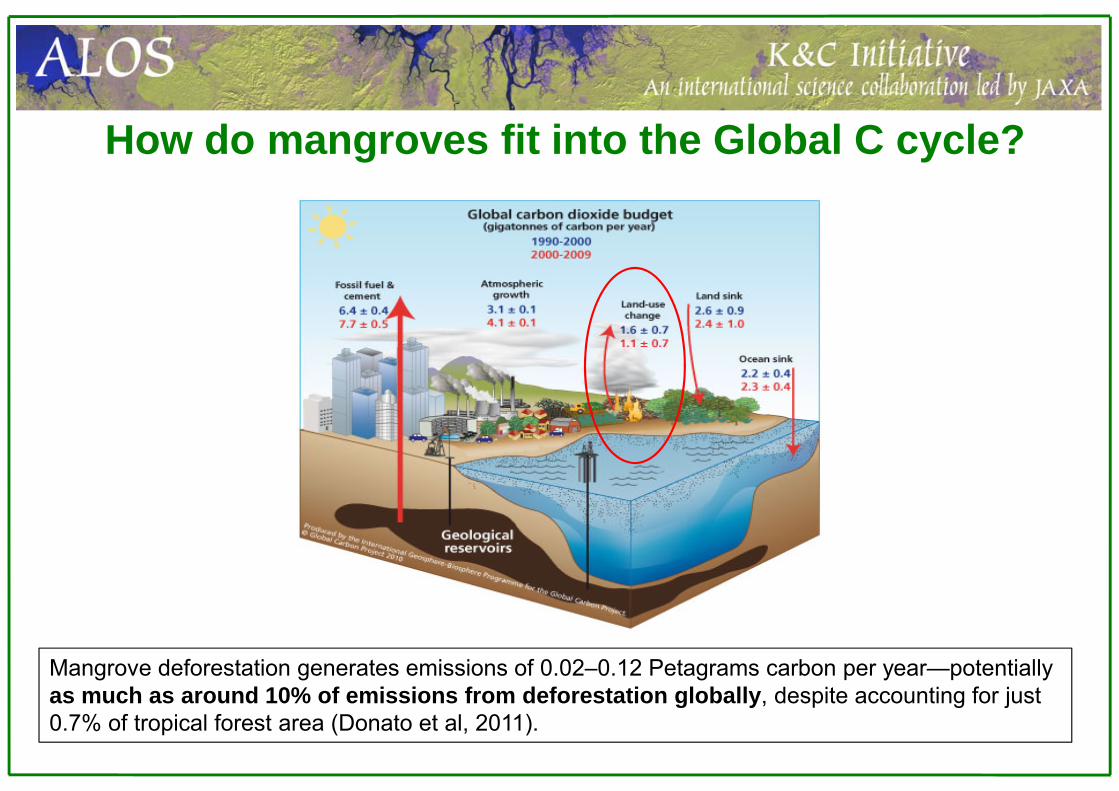
Mangrove deforestation generates emissions of 0.02–0.12 Petagrams carbon per year—potentially as much as around 10% of emissions from deforestation globally, despite accounting for just 0.7% of tropical forest area (Donato et al, 2011).
How do mangroves fit into the Global C cycle?
Land Use Change
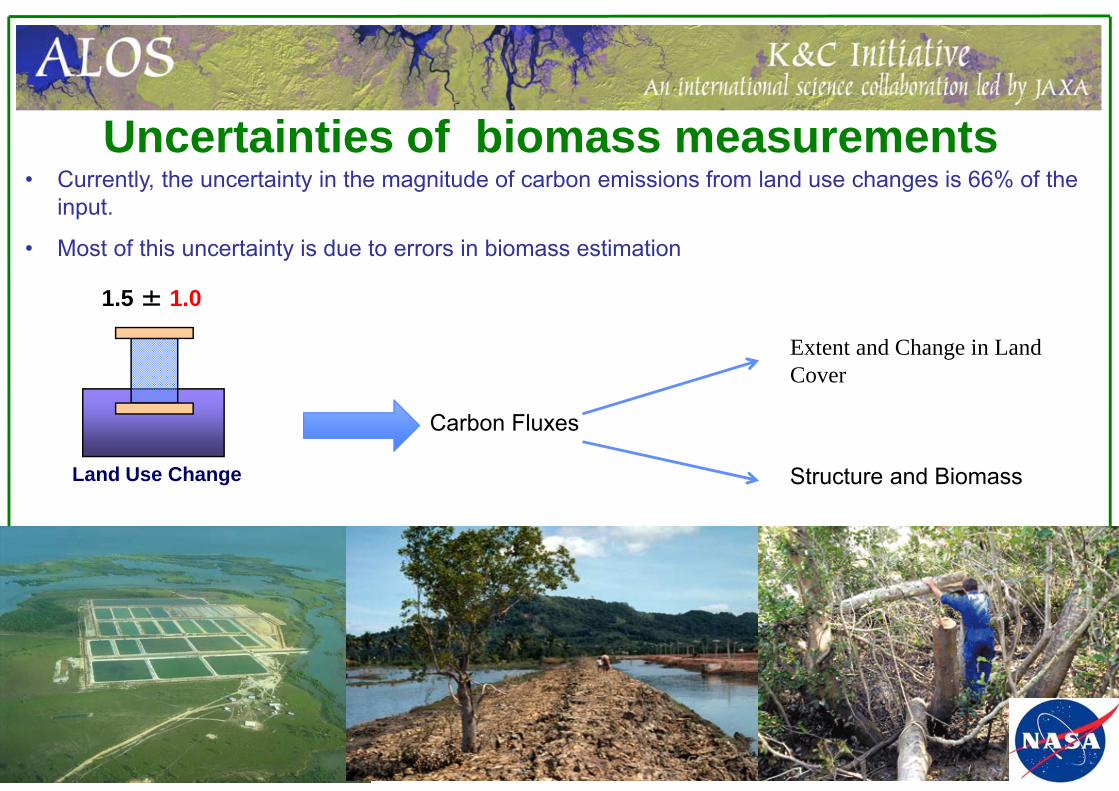
1.5 ± 1.0
Extent and Change in Land Cover
Structure and Biomass
Carbon Fluxes
• Currently, the uncertainty in the magnitude of carbon emissions from land use changes is 66% of the input.
• Most of this uncertainty is due to errors in biomass estimation
Uncertainties of biomass measurements
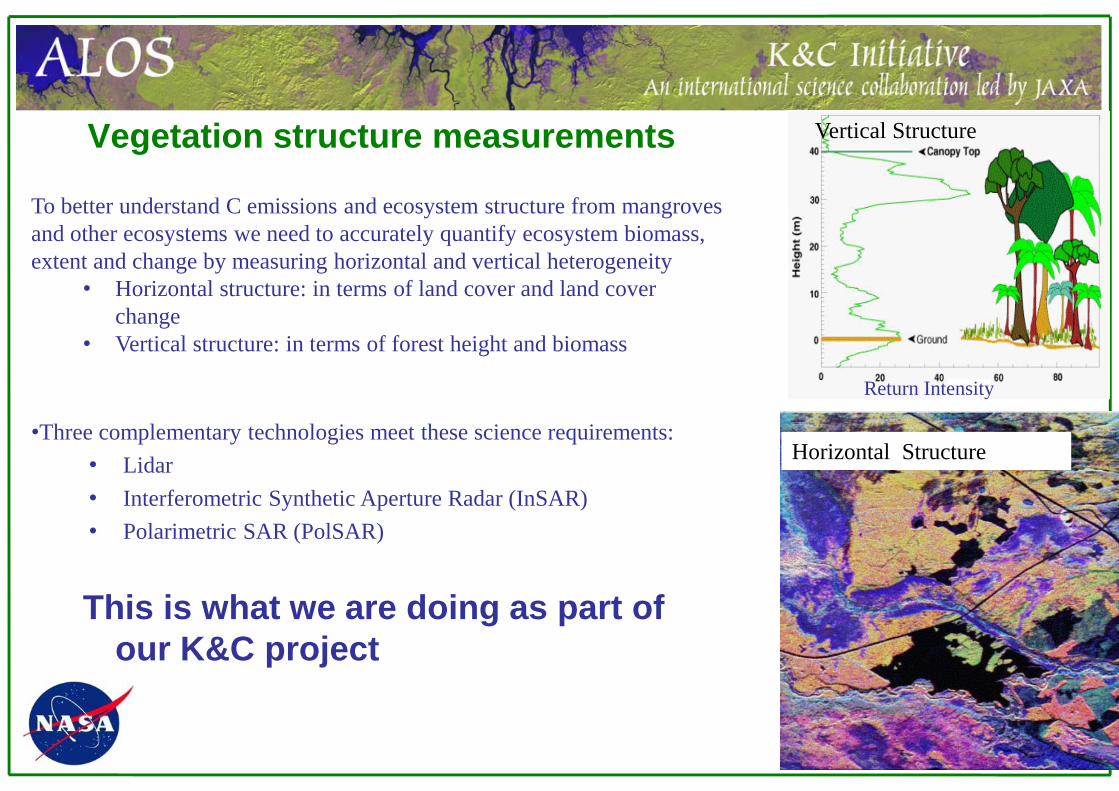
Return Intensity
Horizontal Structure
Vertical Structure
To better understand C emissions and ecosystem structure from mangroves and other ecosystems we need to accurately quantify ecosystem biomass, extent and change by measuring horizontal and vertical heterogeneity
• Horizontal structure: in terms of land cover and land cover change
• Vertical structure: in terms of forest height and biomass
•Three complementary technologies meet these science requirements: • Lidar• Interferometric Synthetic Aperture Radar (InSAR)• Polarimetric SAR (PolSAR)
This is what we are doing as part of our K&C project
Vegetation structure measurements
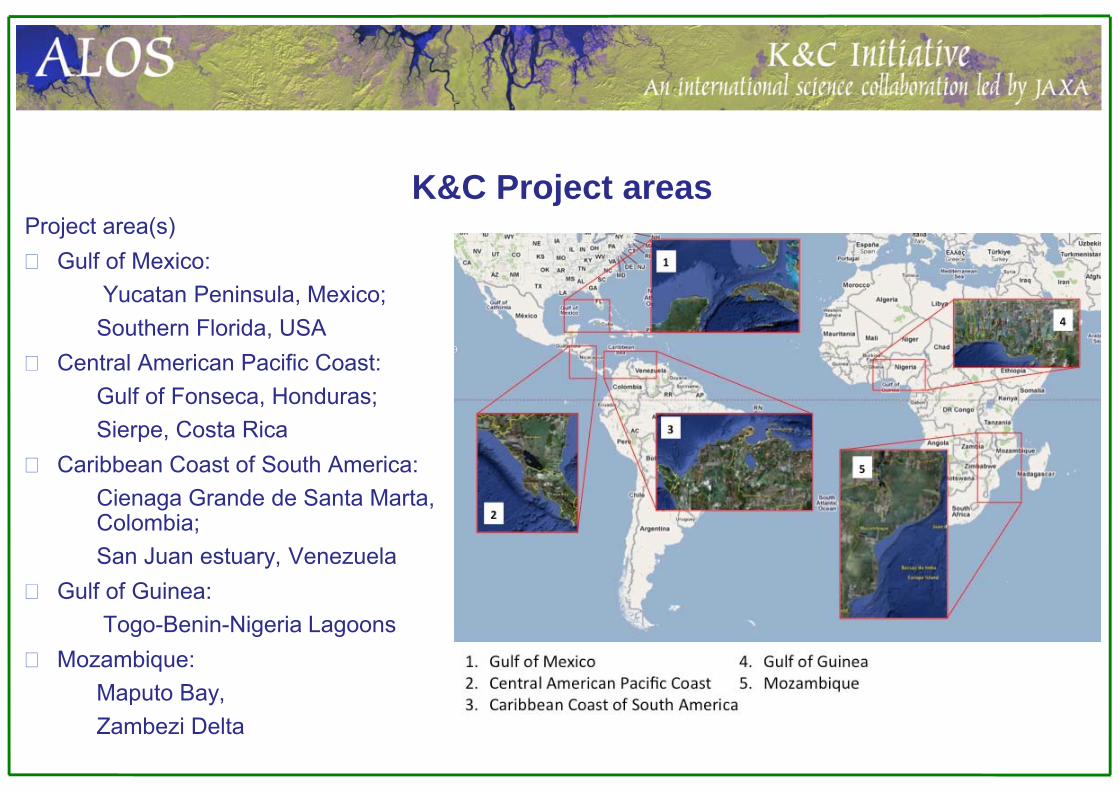
Project area(s) Gulf of Mexico:
� Yucatan Peninsula, Mexico; � Southern Florida, USA
Central American Pacific Coast:� Gulf of Fonseca, Honduras; � Sierpe, Costa Rica
Caribbean Coast of South America:� Cienaga Grande de Santa Marta,
Colombia; � San Juan estuary, Venezuela
Gulf of Guinea:� Togo-Benin-Nigeria Lagoons
Mozambique: � Maputo Bay, � Zambezi Delta
K&C Project areas
This project responds to all three of the K&C “3C” thematic drivers:International Conventions:
o the data products of land cover and change, forest height and biomass are crucial for the UN Reduced Emissions from Deforestation and Degradation (REDD) initiative, the UN Blue Carbon Initiative and the Ramsar Convention as they provide background and repeat data needed for the MRV (measuring, reporting and verification) process.
Carbon cycle science:o The proposed data products will improve current estimates of carbon storage in forest and
coastal ecosystems. Environmental Conservation:
o the proposed products will also help in determining high conservation priority areas based on threats to and the health of the forest.
Project objectives and schedule
Foreseen deliverables/products:Annual mangrove cover and change maps for regional sites in the Americas and
Africa for 2007 through 2010.Mangrove Tree height maps from K&C mosaics and ancillary field and GLAS data for
the regional sites using a decision tree approach.Mangrove Biomass maps and changes from K&C mosaics and ancillary field and
GLAS data for regional sites using a decision tree approach.
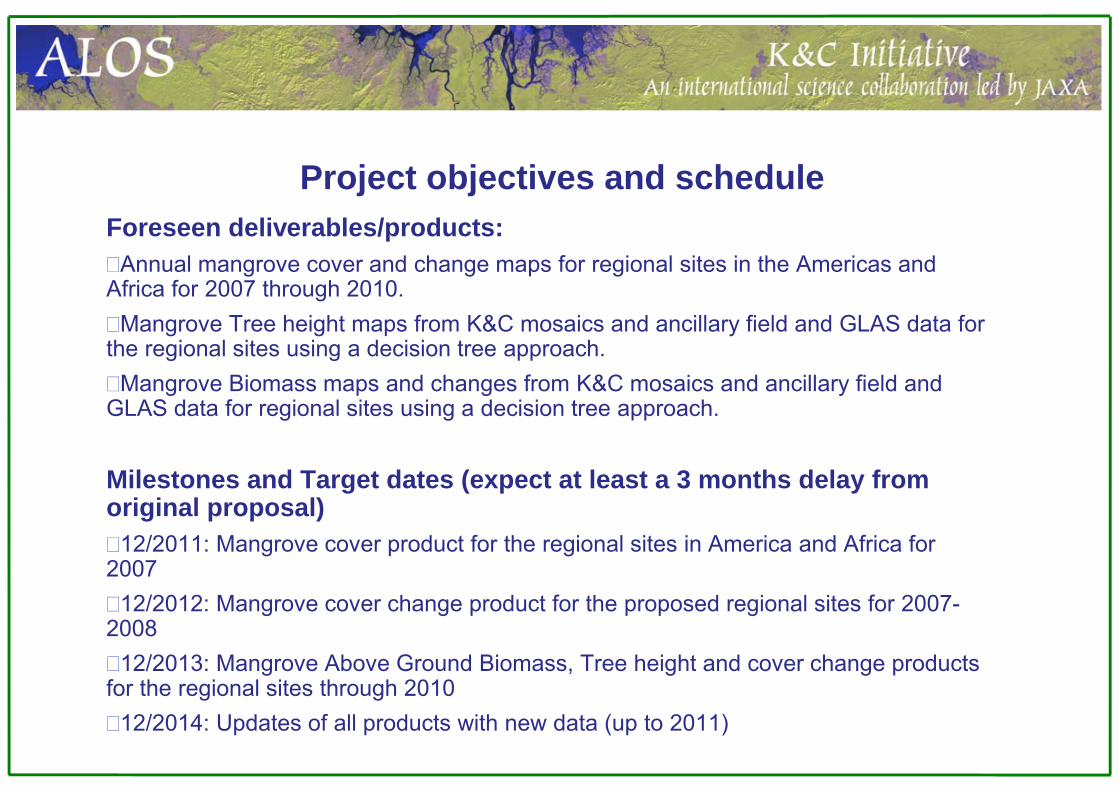
Milestones and Target dates (expect at least a 3 months delay from original proposal)
12/2011: Mangrove cover product for the regional sites in America and Africa for 2007
12/2012: Mangrove cover change product for the proposed regional sites for 2007-2008
12/2013: Mangrove Above Ground Biomass, Tree height and cover change products for the regional sites through 2010
12/2014: Updates of all products with new data (up to 2011)
Project objectives and schedule
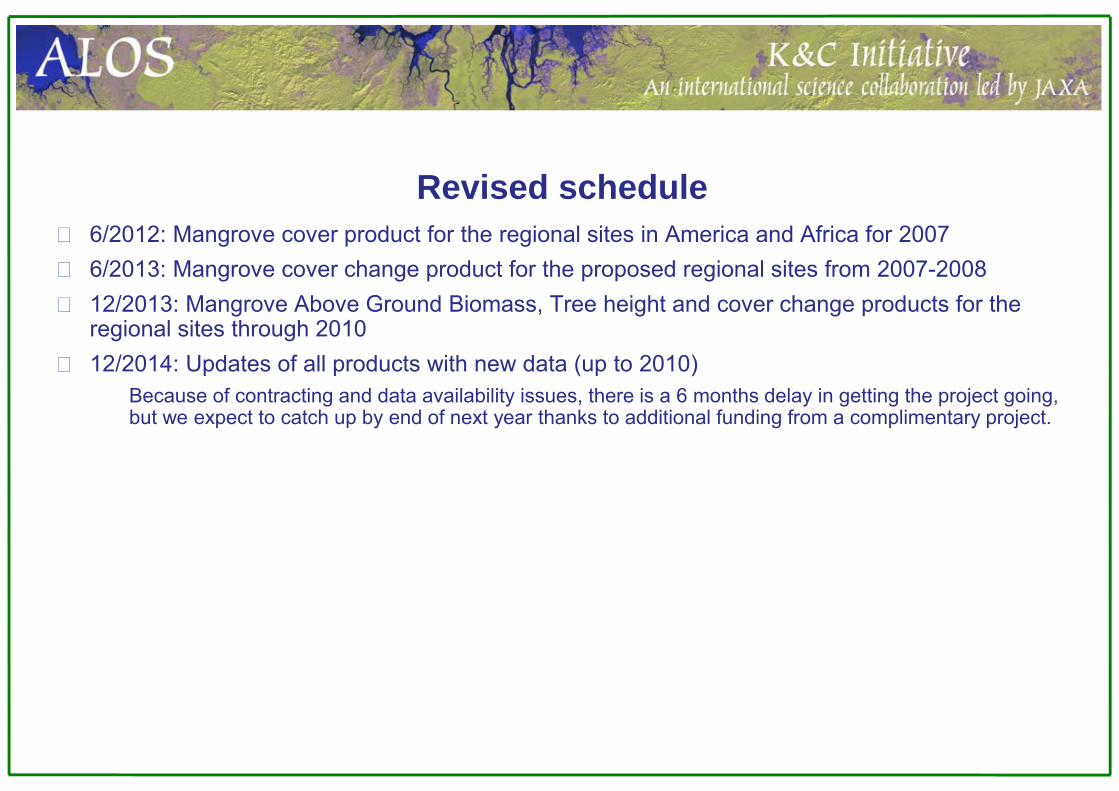
6/2012: Mangrove cover product for the regional sites in America and Africa for 20076/2013: Mangrove cover change product for the proposed regional sites from 2007-2008 12/2013: Mangrove Above Ground Biomass, Tree height and cover change products for the regional sites through 201012/2014: Updates of all products with new data (up to 2010)
� Because of contracting and data availability issues, there is a 6 months delay in getting the project going, but we expect to catch up by end of next year thanks to additional funding from a complimentary project.
Revised schedule
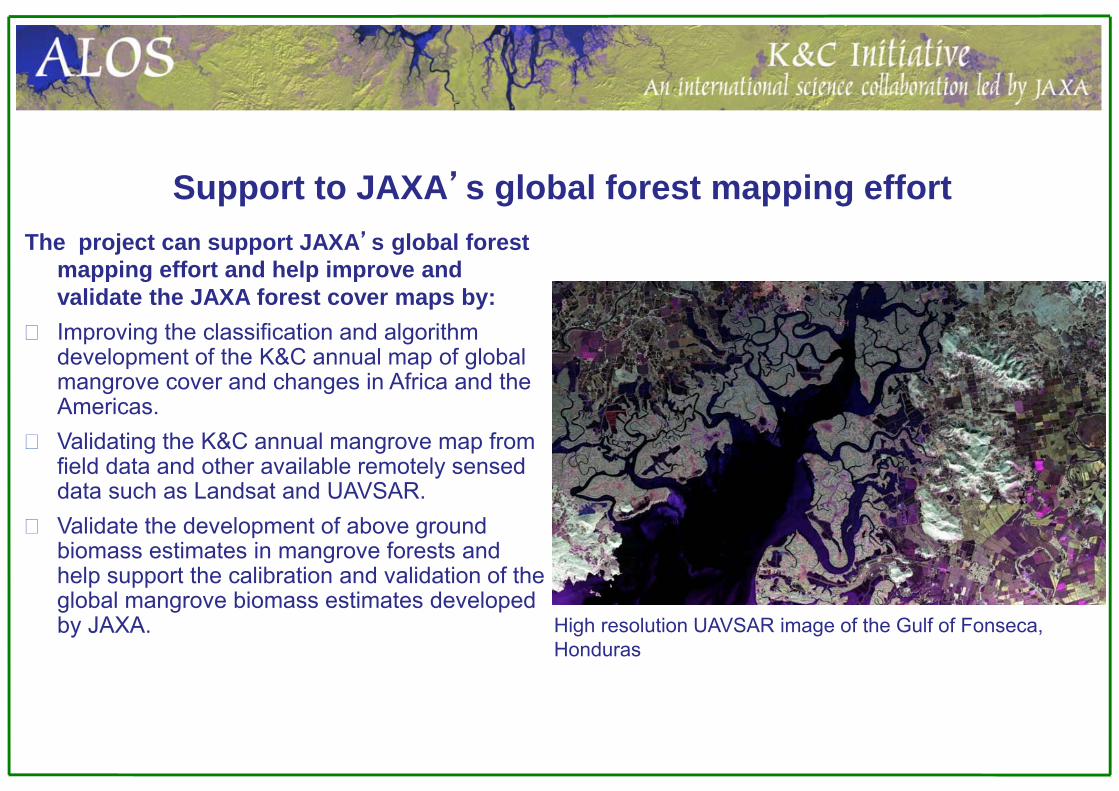
Support to JAXA’s global forest mapping effortThe project can support JAXA’s global forest
mapping effort and help improve and validate the JAXA forest cover maps by:Improving the classification and algorithm development of the K&C annual map of global mangrove cover and changes in Africa and the Americas. Validating the K&C annual mangrove map from field data and other available remotely sensed data such as Landsat and UAVSAR. Validate the development of above ground biomass estimates in mangrove forests and help support the calibration and validation of the global mangrove biomass estimates developed by JAXA. High resolution UAVSAR image of the Gulf of Fonseca,
Honduras
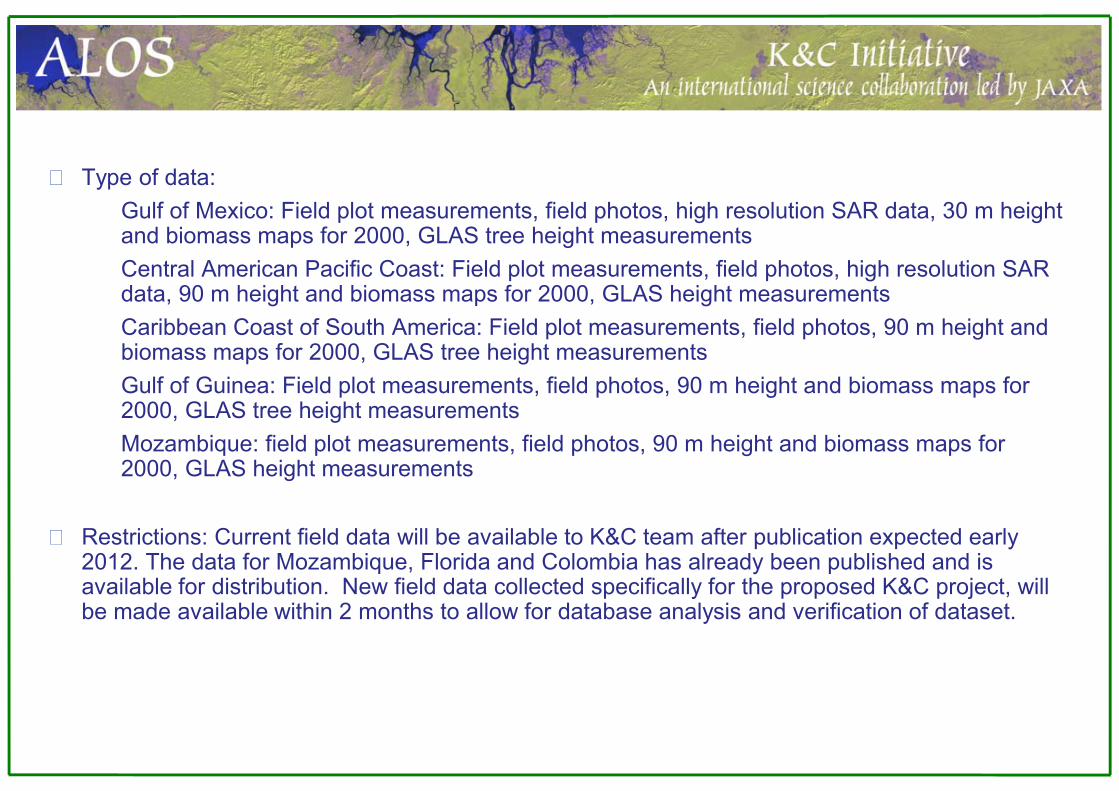
Type of data:� Gulf of Mexico: Field plot measurements, field photos, high resolution SAR data, 30 m height
and biomass maps for 2000, GLAS tree height measurements � Central American Pacific Coast: Field plot measurements, field photos, high resolution SAR
data, 90 m height and biomass maps for 2000, GLAS height measurements � Caribbean Coast of South America: Field plot measurements, field photos, 90 m height and
biomass maps for 2000, GLAS tree height measurements � Gulf of Guinea: Field plot measurements, field photos, 90 m height and biomass maps for
2000, GLAS tree height measurements � Mozambique: field plot measurements, field photos, 90 m height and biomass maps for
2000, GLAS height measurements
Restrictions: Current field data will be available to K&C team after publication expected early 2012. The data for Mozambique, Florida and Colombia has already been published and is available for distribution. New field data collected specifically for the proposed K&C project, will be made available within 2 months to allow for database analysis and verification of dataset.
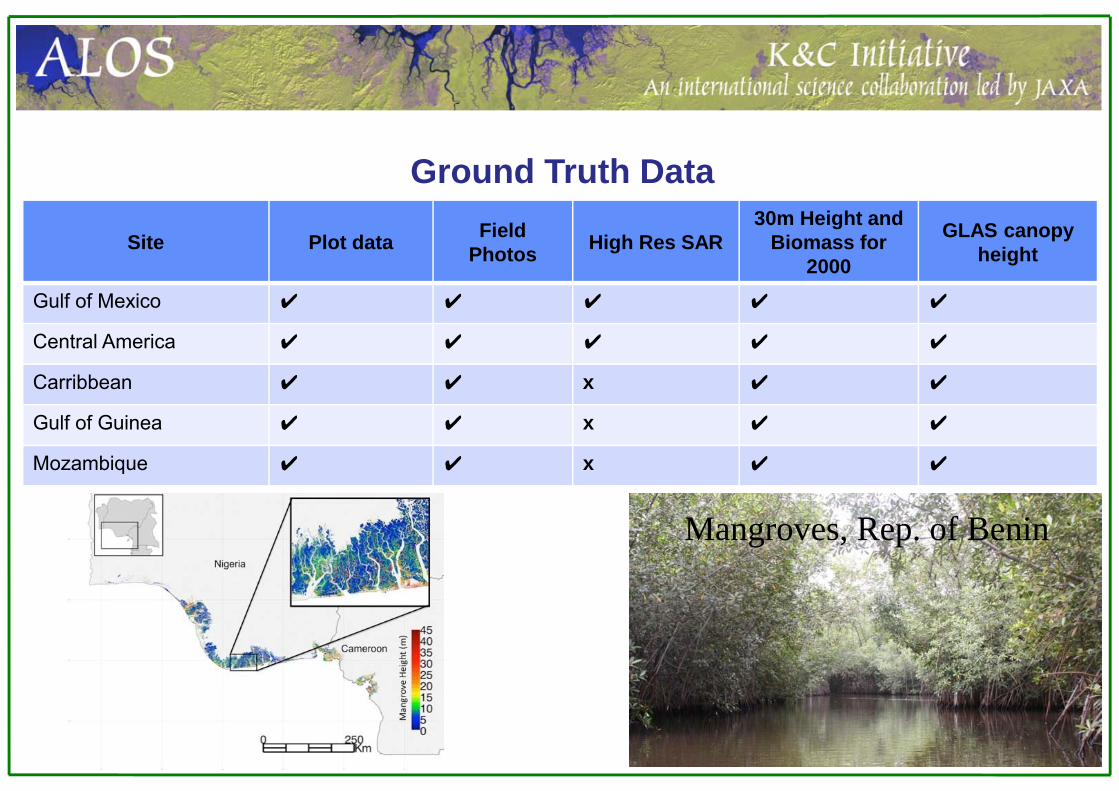
Ground Truth Data
Site Plot data Field Photos High Res SAR
30m Height and Biomass for
2000
GLAS canopy height
Gulf of Mexico ✔ ✔ ✔ ✔ ✔
Central America ✔ ✔ ✔ ✔ ✔
Carribbean ✔ ✔ x ✔ ✔
Gulf of Guinea ✔ ✔ x ✔ ✔
Mozambique ✔ ✔ x ✔ ✔
Mangroves, Rep. of Benin
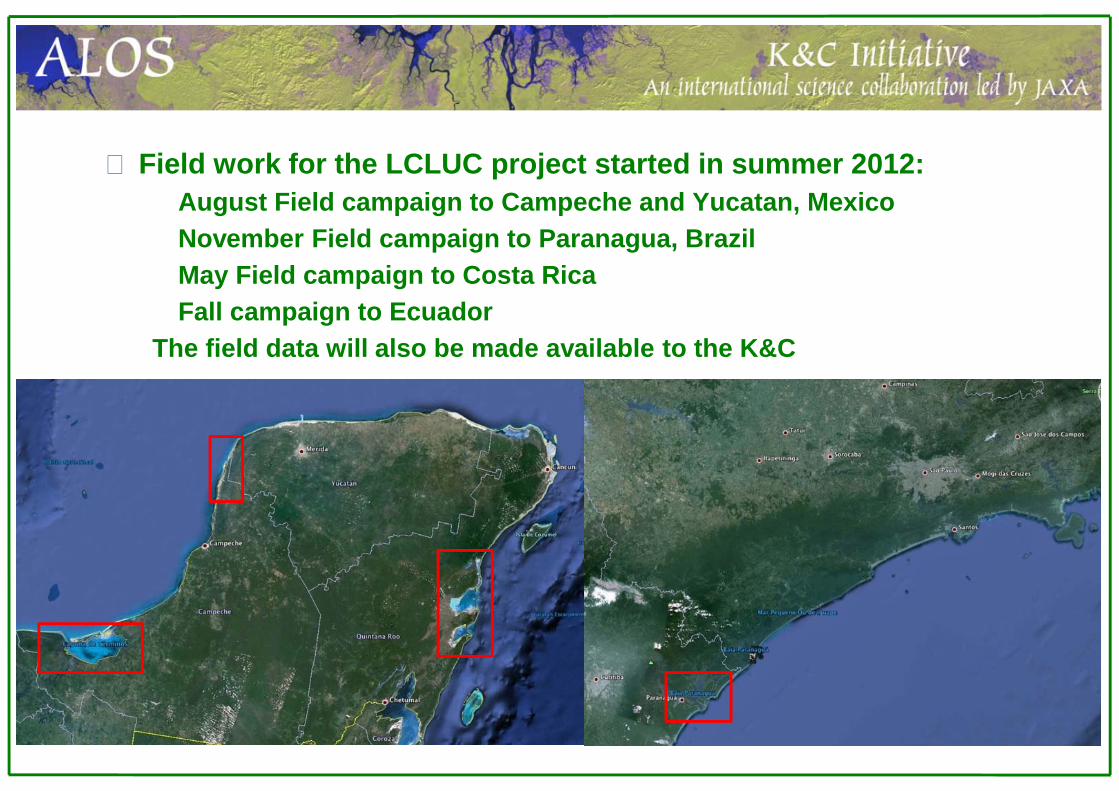
Field work for the LCLUC project started in summer 2012:� August Field campaign to Campeche and Yucatan, Mexico � November Field campaign to Paranagua, Brazil � May Field campaign to Costa Rica� Fall campaign to EcuadorThe field data will also be made available to the K&C
Planned output of the project: Annual mangrove cover and change maps for regional sites in the Americas and Africa for 2007 through 2011.Mangrove Tree height maps from K&C mosaics and ancillary field and GLAS data for the regional sites using a decision tree approach.Mangrove Biomass maps and changes from K&C mosaics and ancillary field and GLAS data for regional sites using a decision tree approach.
Deliverables
Results so farK&C data for our field sites has been downloadedProduced Mosaics covering different years and/or polarization � to look at changes over time � to produce forest/non forest maps� Extracted mangrove areas for biomass estimates
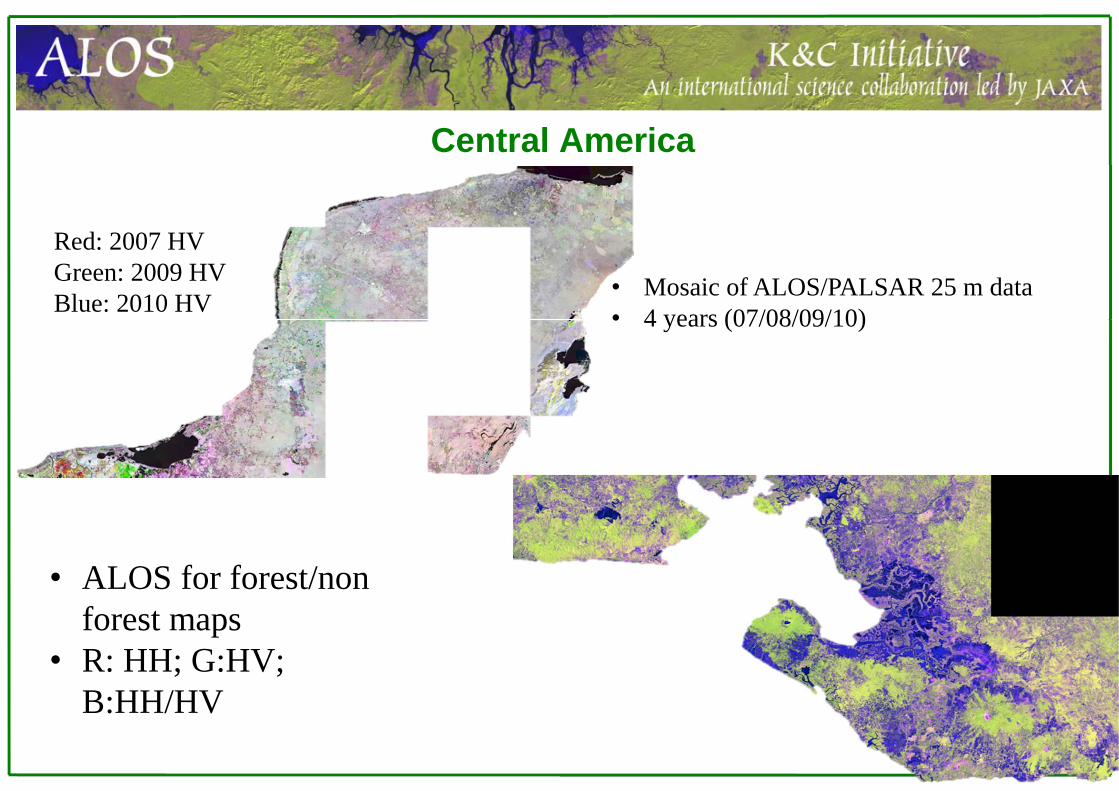
Central America
• Mosaic of ALOS/PALSAR 25 m data• 4 years (07/08/09/10)
Red: 2007 HVGreen: 2009 HVBlue: 2010 HV
• ALOS for forest/non forest maps
• R: HH; G:HV; B:HH/HV
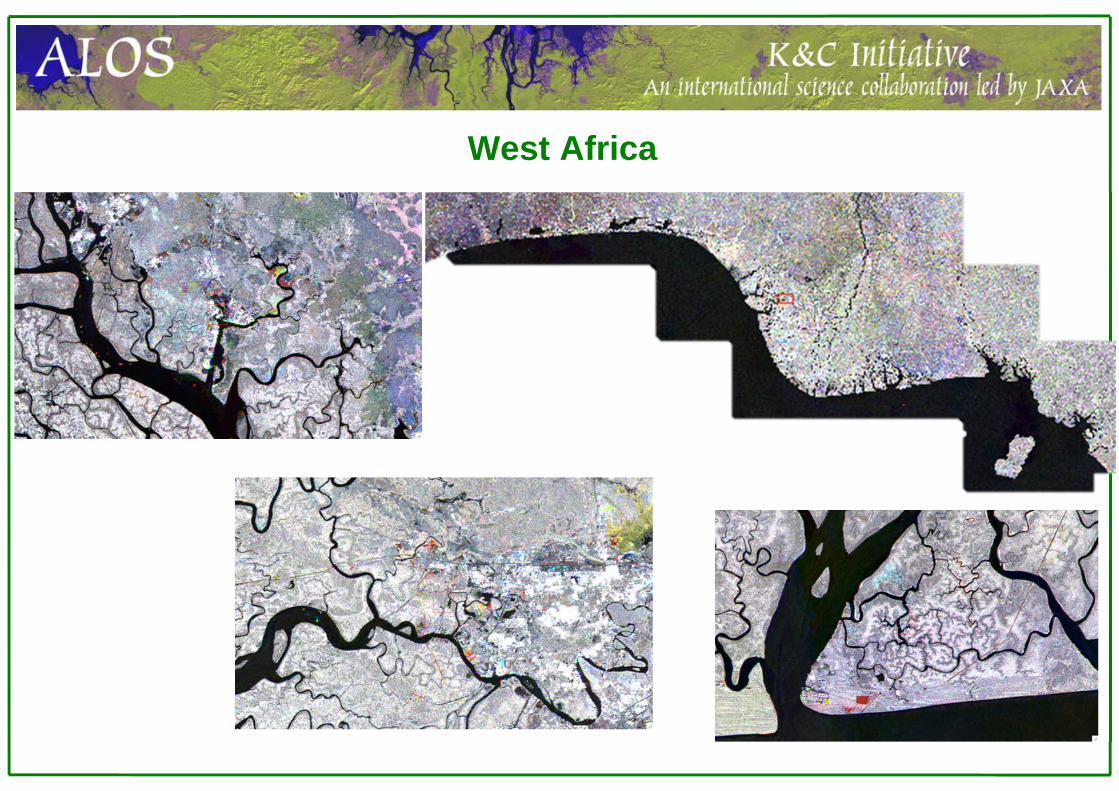
West Africa
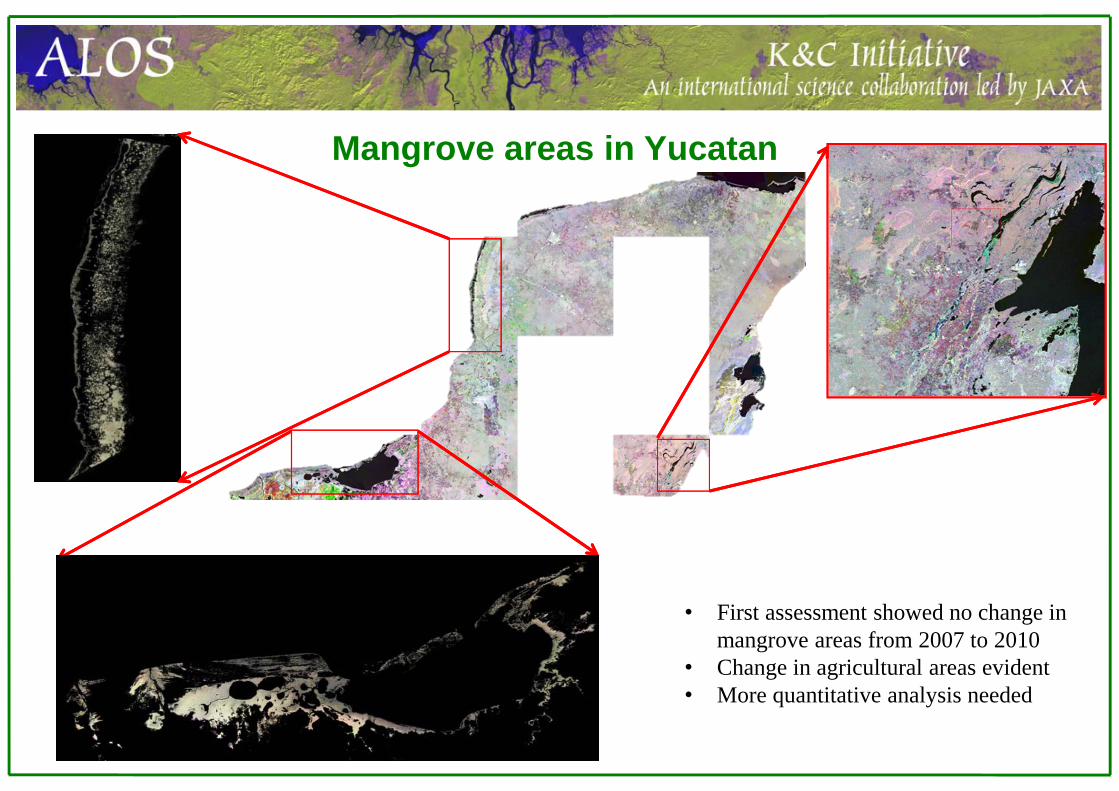
Mangrove areas in Yucatan
• First assessment showed no change in mangrove areas from 2007 to 2010
• Change in agricultural areas evident • More quantitative analysis needed
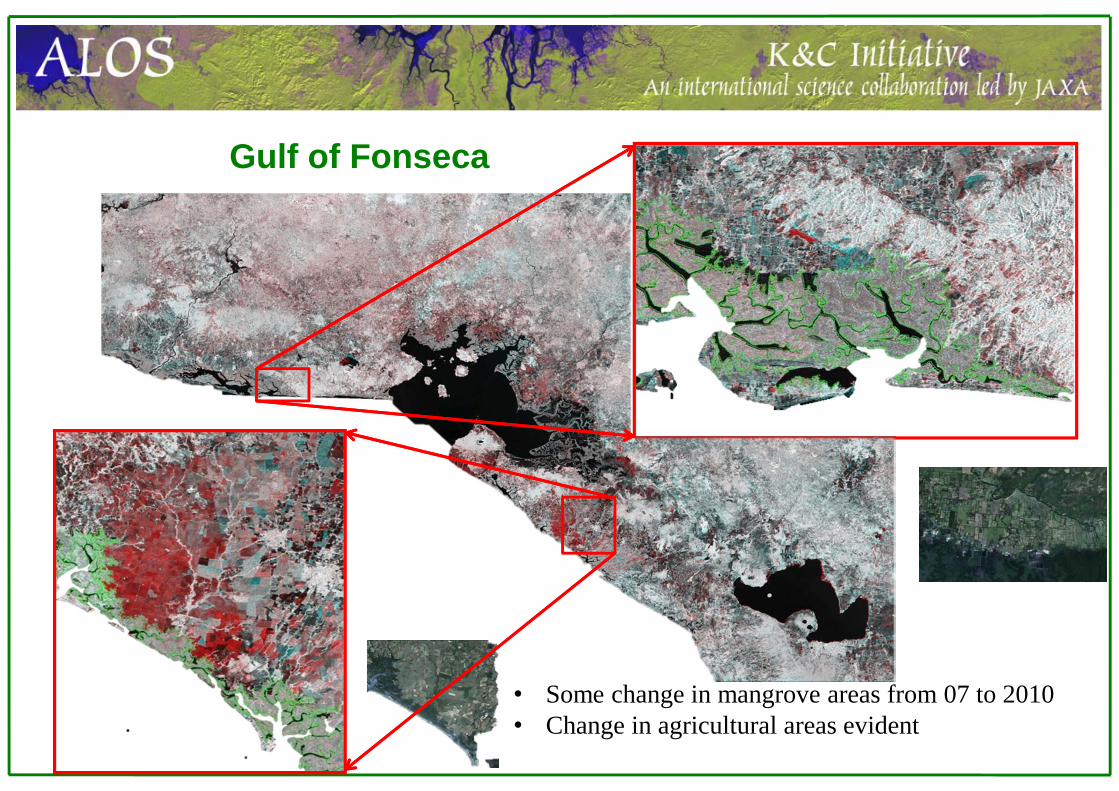
Gulf of Fonseca
• Some change in mangrove areas from 07 to 2010• Change in agricultural areas evident
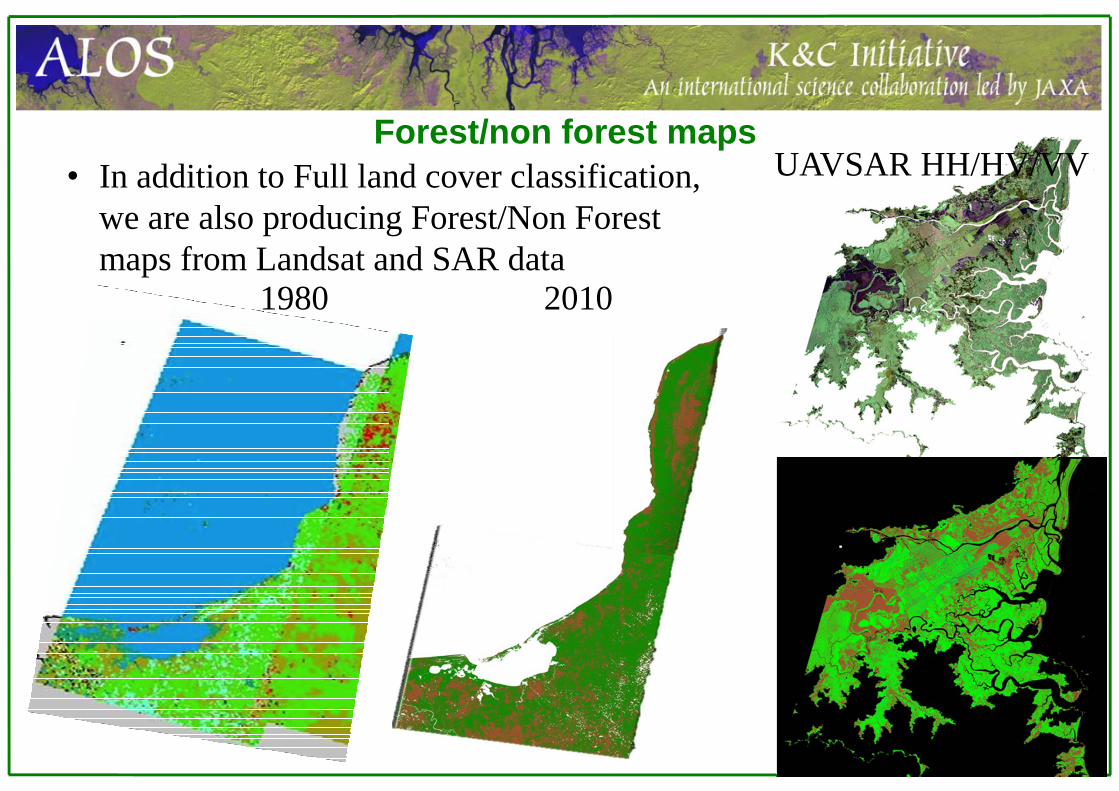
Forest/non forest maps
1980 2010
• In addition to Full land cover classification, we are also producing Forest/Non Forest maps from Landsat and SAR data
UAVSAR HH/HV/VV
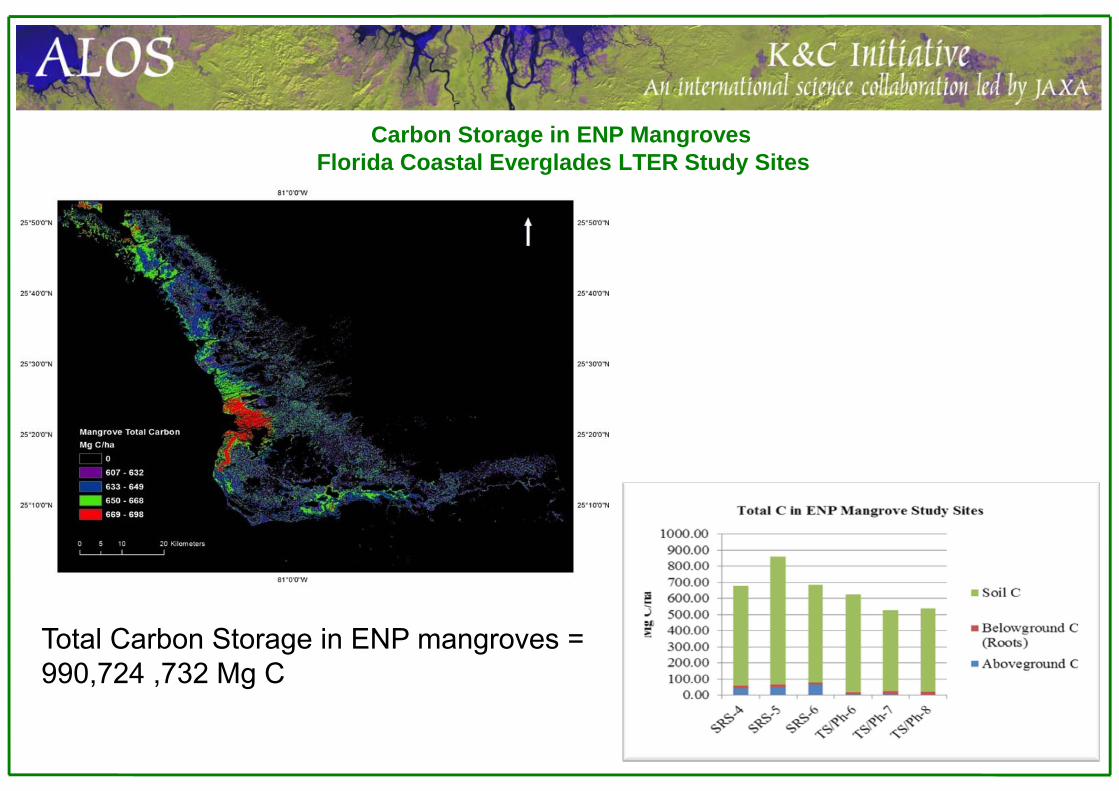
Carbon Storage in ENP MangrovesFlorida Coastal Everglades LTER Study Sites
Total Carbon Storage in ENP mangroves = 990,724 ,732 Mg C
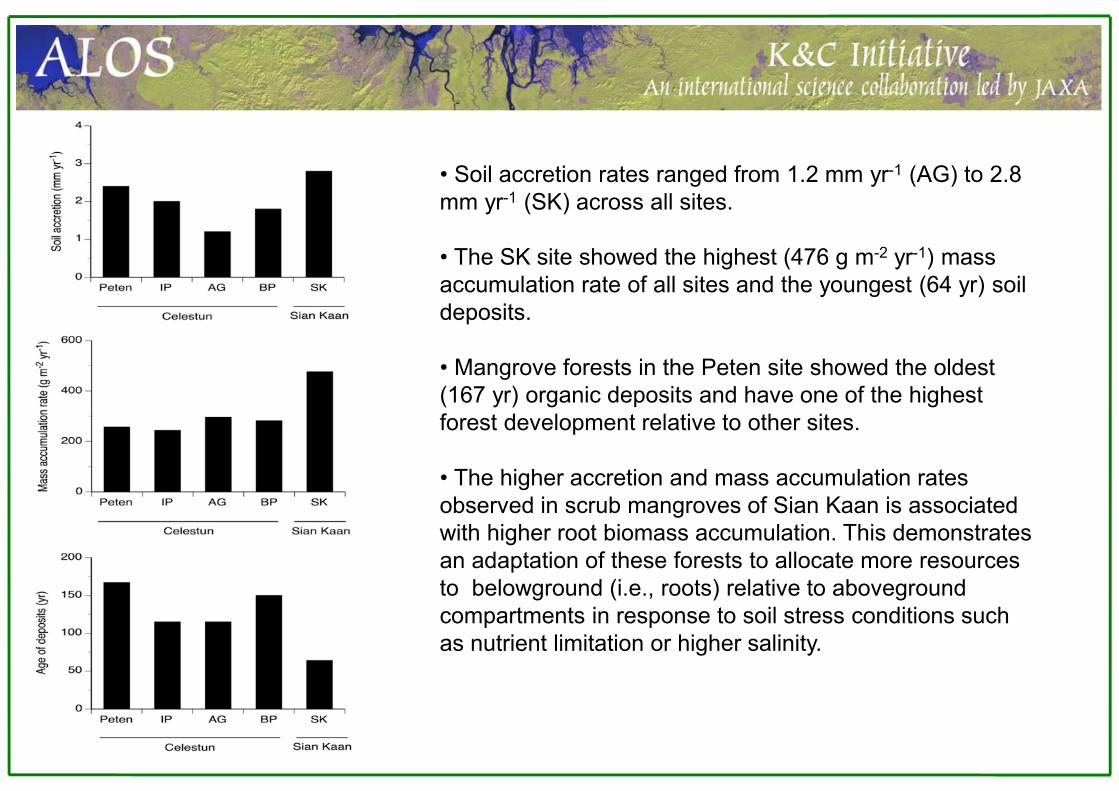
Soil Accretion, Mass Accumulation, and Age of Deposits
• Soil accretion rates ranged from 1.2 mm yr-1 (AG) to 2.8 mm yr-1 (SK) across all sites.
• The SK site showed the highest (476 g m-2 yr-1) mass accumulation rate of all sites and the youngest (64 yr) soil deposits.
• Mangrove forests in the Peten site showed the oldest (167 yr) organic deposits and have one of the highest forest development relative to other sites.
• The higher accretion and mass accumulation rates observed in scrub mangroves of Sian Kaan is associated with higher root biomass accumulation. This demonstrates an adaptation of these forests to allocate more resources to belowground (i.e., roots) relative to aboveground compartments in response to soil stress conditions such as nutrient limitation or higher salinity.
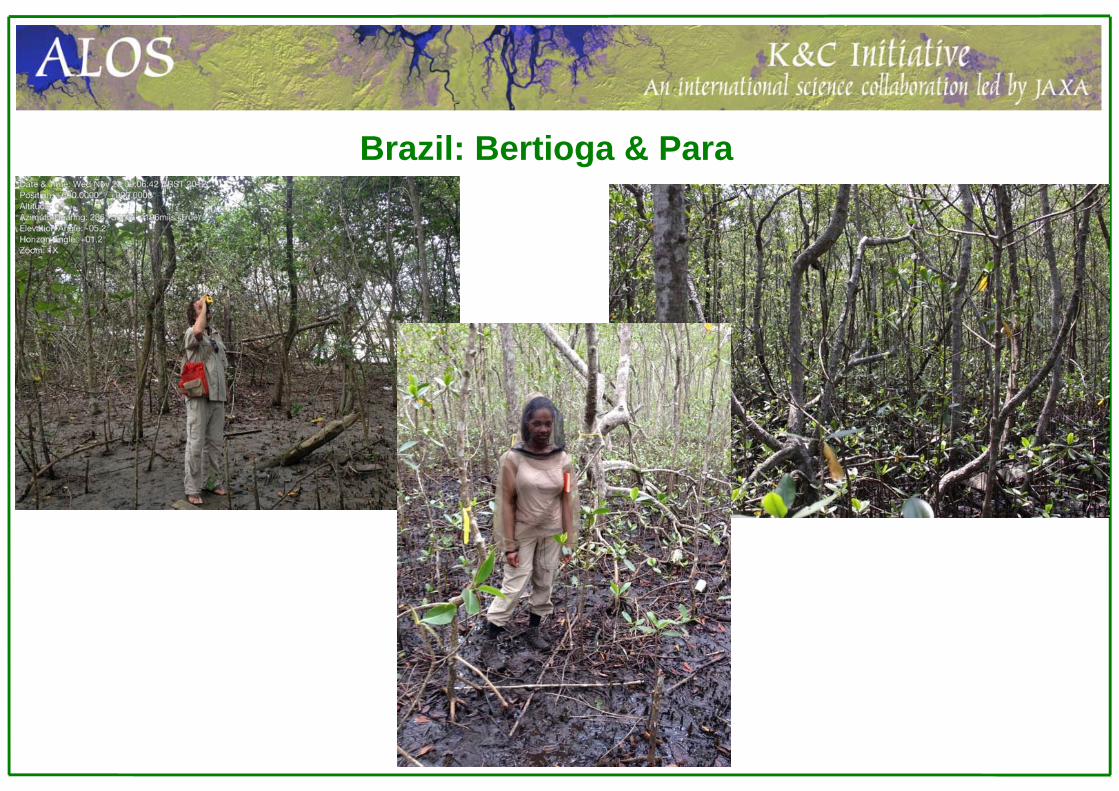
Brazil: Bertioga & Para
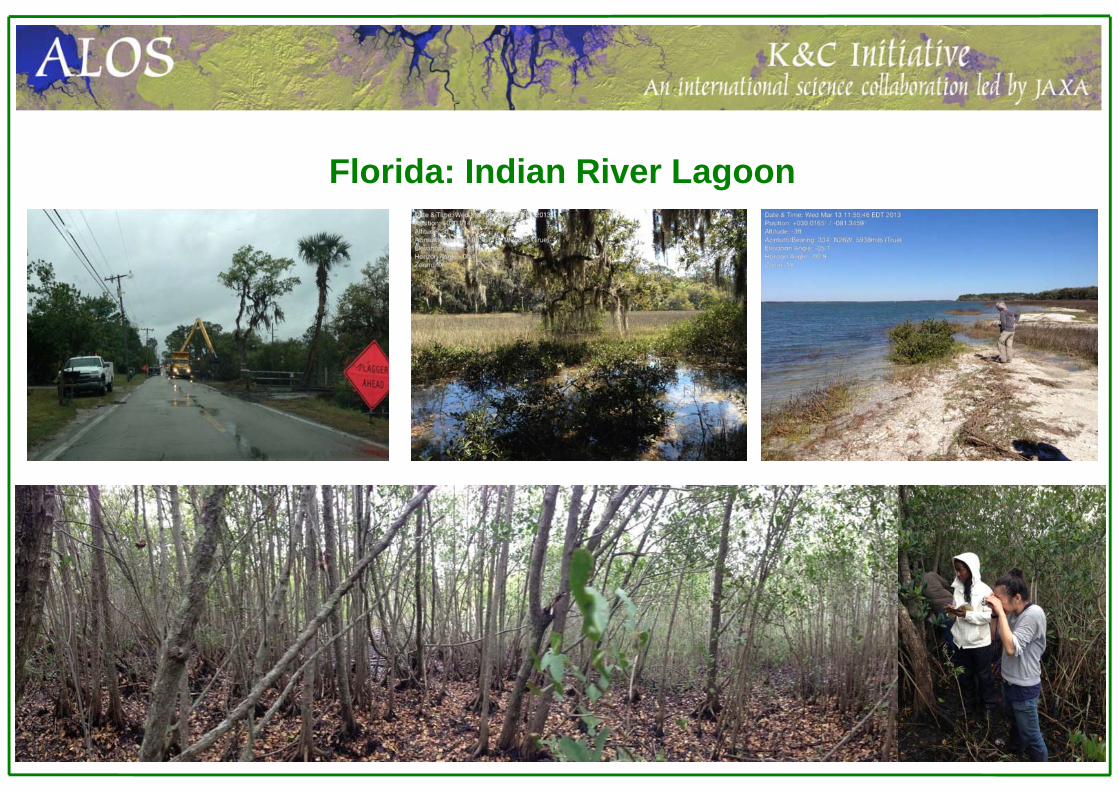
Florida: Indian River Lagoon
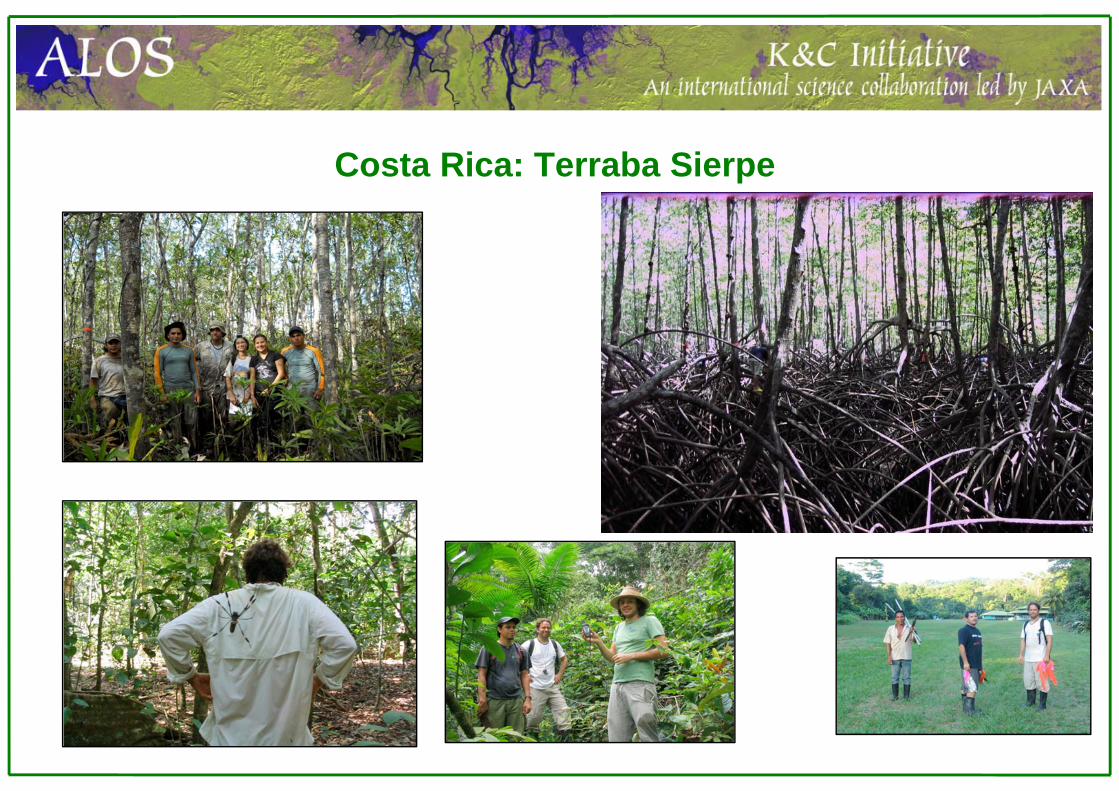
Costa Rica: Terraba Sierpe
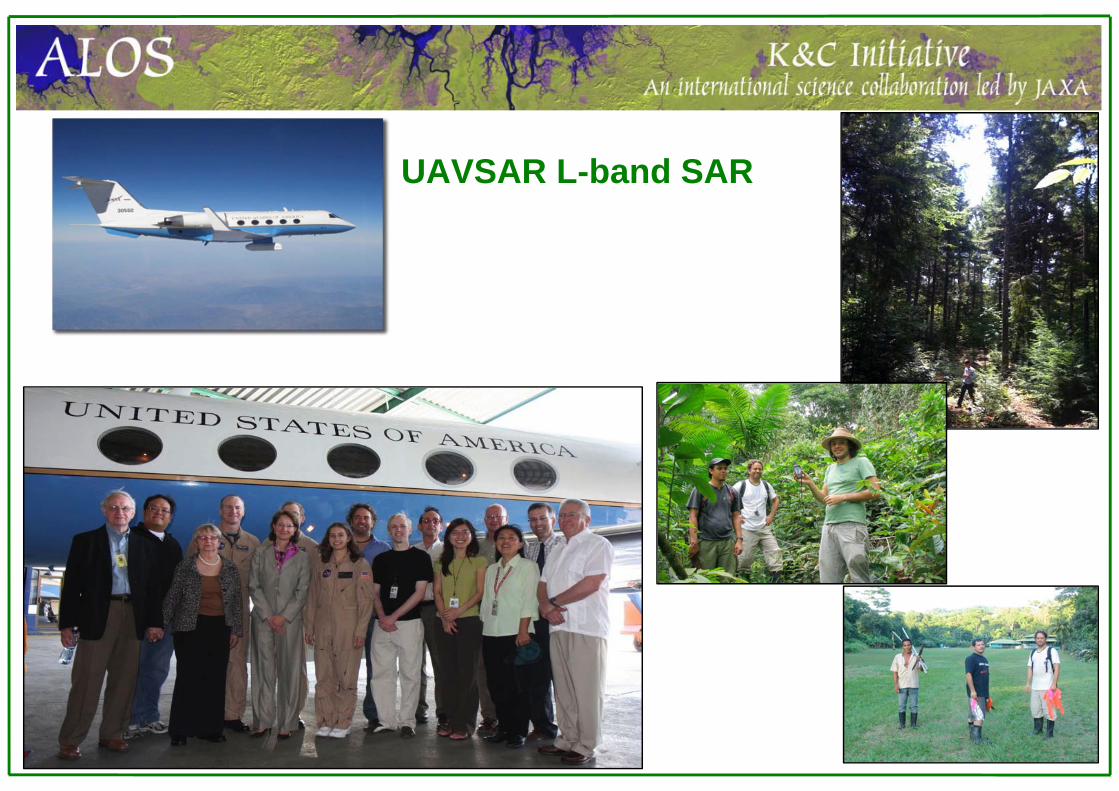
UAVSAR L-band SAR

UAVSAR mangrove monitoring campaign in Central and South America
Térraba-Sierpe, Costa Rica
Gulf of Fonseca, Honduras
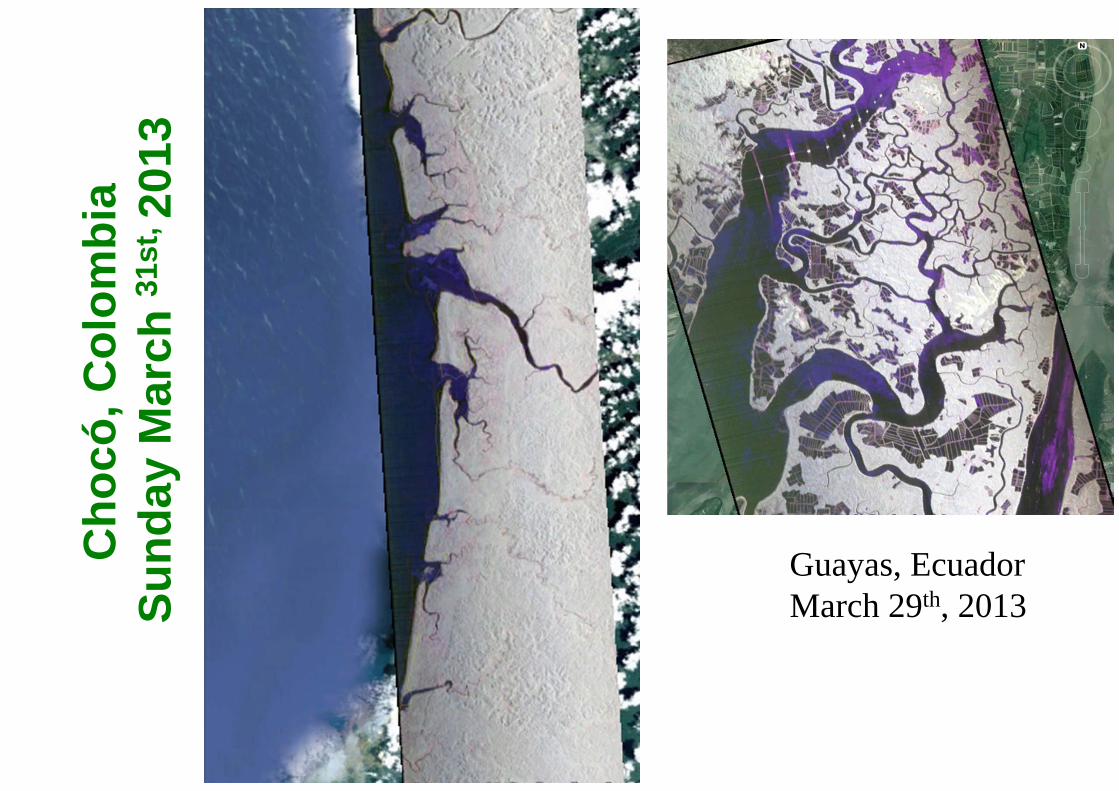
Chocó, Colombia
Guayas, Ecuador
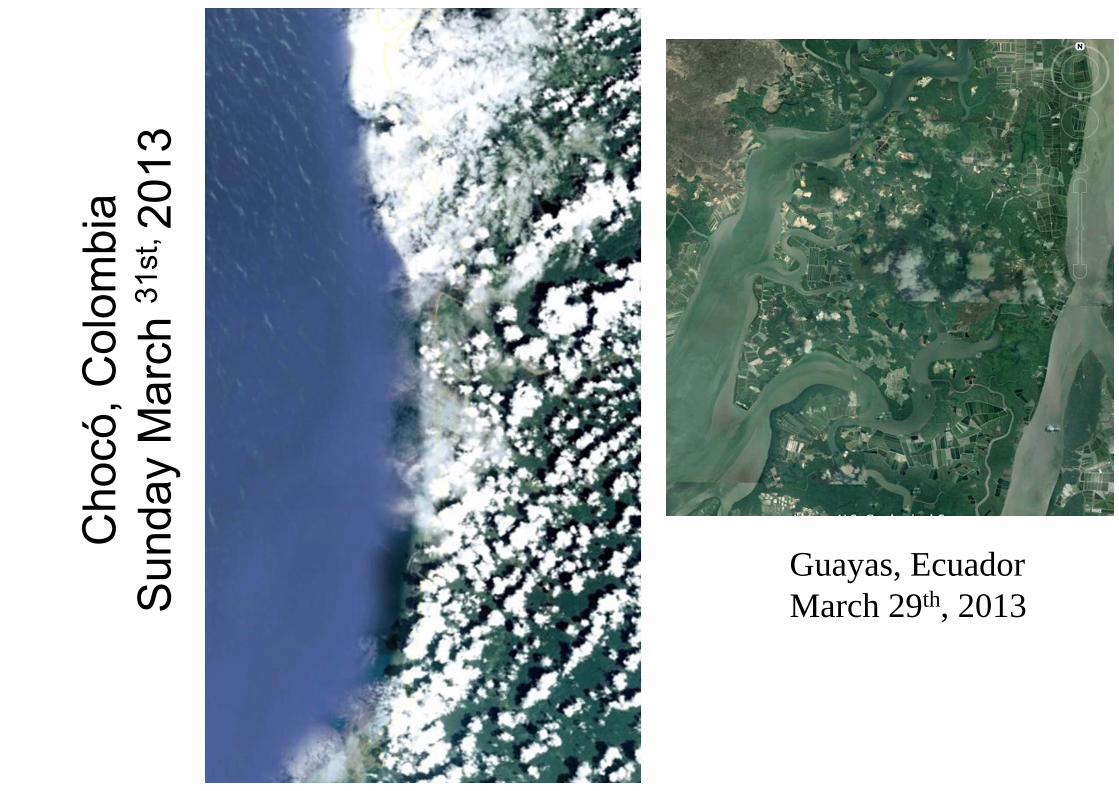
Cho
có, C
olom
bia
Sun
day
Mar
ch 31
st, 2
013
Guayas, EcuadorMarch 29th, 2013
Cho
có, C
olom
bia
Sund
ay M
arch
31st
, 201
3
Guayas, EcuadorMarch 29th, 2013
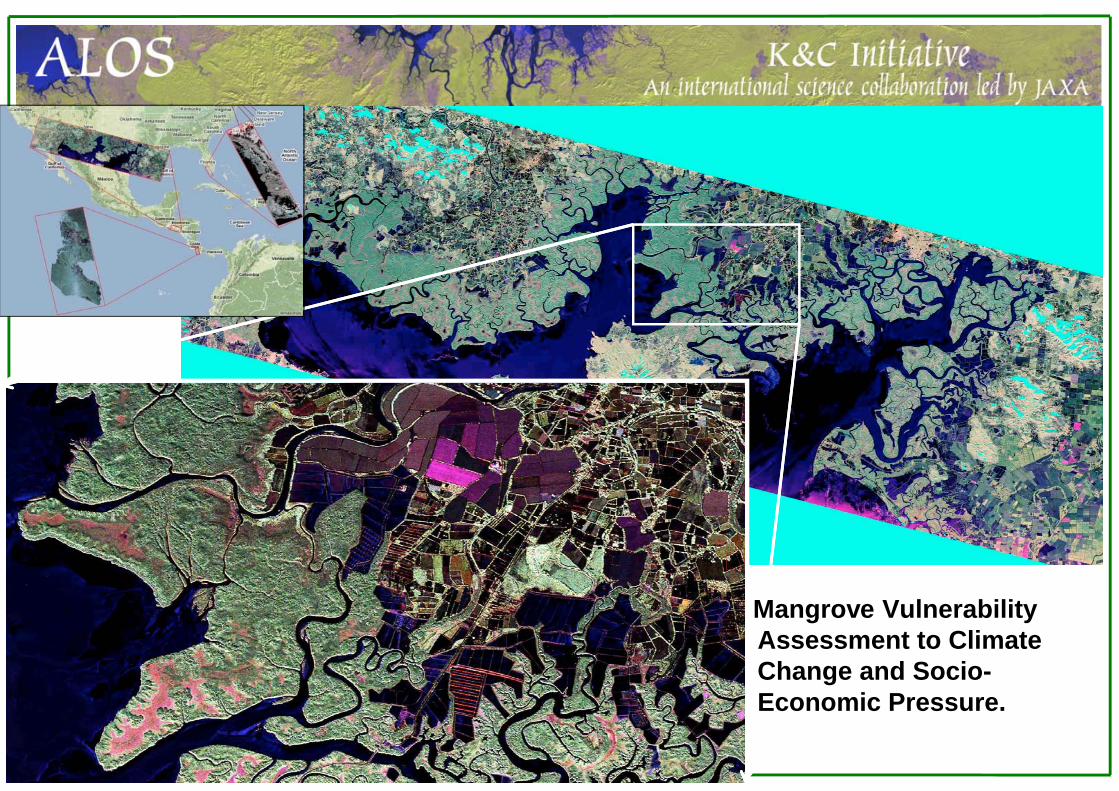
Mangrove Vulnerability Assessment to Climate Change and Socio-Economic Pressure.
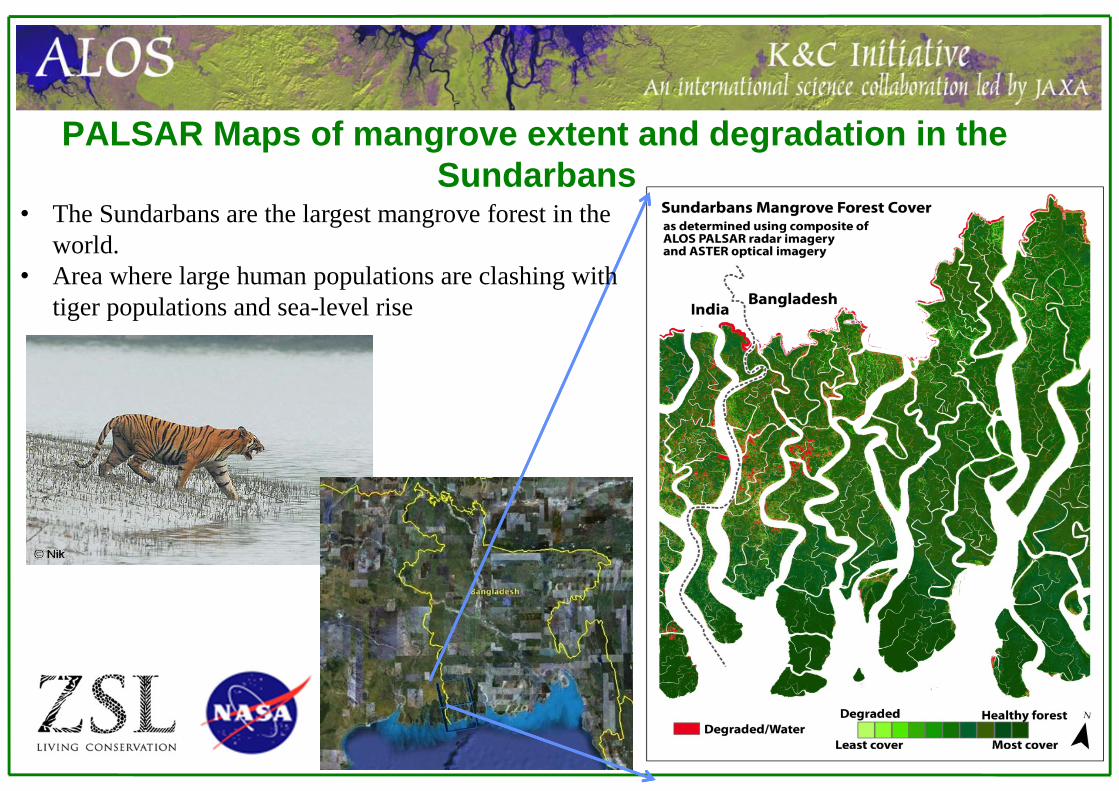
PALSAR Maps of mangrove extent and degradation in the Sundarbans
• The Sundarbans are the largest mangrove forest in the world.
• Area where large human populations are clashing with tiger populations and sea-level rise