Embed Size (px)
Citation preview
Katana Capital LimitedNOVEMBER 2014
AGM PRESENTATION
For
per
sona
l use
onl
y
Disclaimer
The information contained in this presentation is provided to each recipient on the following basis:
a. this presentation has been produced by Katana Asset Management (KAM)
b. this presentation does not purport to contain all the information that the recipient may require to evaluate Katana Capital’s (KAT) performance over the reporting period
c. KAM is the holder of Australian Financial Services License No: 288412
d. none of KAM, Katana Capital Ltd, their respective directors, officers, employees advisers or representatives (collectively, the Beneficiaries) make any representation or warranty, express or implied, as to the accuracy, reliability or completeness of the information contained in this presentation and nothing contained in this presentation is, or shall be relied upon as a promise of representation, whether as to the past or the future.
e. except insofar as liability under any law cannot be excluded, the Beneficiaries shall have no liability arising in respect of the information contained in or not contained in this presentation.
f. Past performance is no t necessarily indicative of future performance.
g. All investment returns throughout this presentation are pre-tax and pre-fees.
h. statements in this presentation are made as of the date of this presentation unless otherwise stated.
i. this is general advice only and it is not a recommendation as we have not considered the personal circumstances of any person.
j. The proposed placement is for wholesale and/or sophisticated investors only; not to be distributed to retail investors/clients.
For
per
sona
l use
onl
y
Index
PersonnelInvestment PhilosophyPortfolio Construction
Performance HistoryDividend YieldNet Asset Backing
Summary
Thankyou & Additional Information
For
per
sona
l use
onl
y
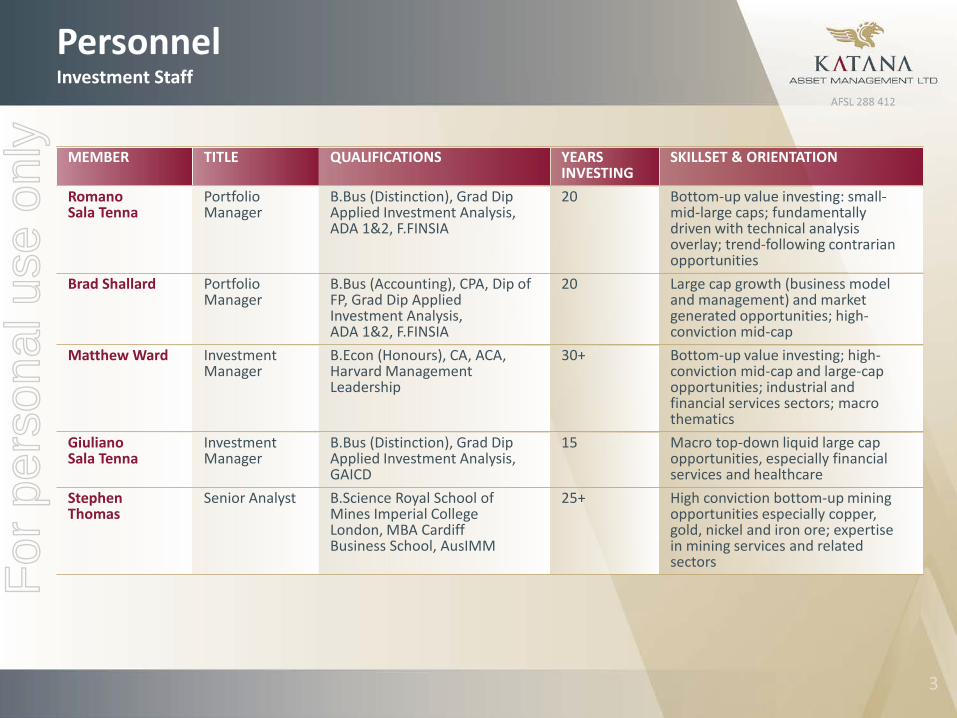
PersonnelInvestment Staff
MEMBER TITLE QUALIFICATIONS YEARS INVESTING
SKILLSET & ORIENTATION
Romano Sala Tenna
Portfolio Manager
B.Bus (Distinction), Grad Dip Applied Investment Analysis, ADA 1&2, F.FINSIA
20 Bottom-up value investing: small-mid-large caps; fundamentally driven with technical analysis overlay; trend-following contrarian opportunities
Brad Shallard Portfolio Manager
B.Bus (Accounting), CPA, Dip of FP, Grad Dip Applied Investment Analysis, ADA 1&2, F.FINSIA
20 Large cap growth (business model and management) and market generated opportunities; high-conviction mid-cap
Matthew Ward Investment Manager
B.Econ (Honours), CA, ACA, Harvard Management Leadership
30+ Bottom-up value investing; high-conviction mid-cap and large-cap opportunities; industrial and financial services sectors; macro thematics
GiulianoSala Tenna
Investment Manager
B.Bus (Distinction), Grad Dip Applied Investment Analysis, GAICD
15 Macro top-down liquid large cap opportunities, especially financial services and healthcare
Stephen Thomas
Senior Analyst B.Science Royal School of Mines Imperial College London, MBA CardiffBusiness School, AusIMM
25+ High conviction bottom-up mining opportunities especially copper, gold, nickel and iron ore; expertise in mining services and related sectors
For
per
sona
l use
onl
y
PersonnelInvestment Staff
Combined ExperienceThe 5 Portfolio Managers have a combined direct investment experience in excess of 100 years.
4 of the Portfolio Managers have invested through at least 3 boom-bust cycles. 2 of the Managers have invested through 4+ stock market cycles. In the world of professional investing, there can be no substitute for experience. And in terms of experience, the very best type is attained during times of crises.
During the 2008-2010 GFC, the Katana team fine tuned its philosophy, processes and culture. Many managers chose to close their funds during this period and re-open with a new track record post the GFC. Others were forced to close or were gated (ie closed to redemptions). The Katana team has emerged with a strong track record and confirmation that their robust processes and conservative approach are able to survive the most trying of market gyrations.
Particular ExpertiseEach of the Managers has specific post-graduate training in investment theory and analysis.
In addition the team has specific undergraduate or post-graduate training in economics, business, accounting, mining and geology.
The Portfolio Managers hail from diverse backgrounds in terms of geography, training and profession. Each of the Managers thinks quite differently. Combining this diversity has lead to a stronger and more rigorous decision-making process.
Aligned InterestsAs at June 2014, the Managers own approximately 20% of the funds under management.F
or p
erso
nal u
se o
nly
Investment PhilosophyOverview
Think independently but act in unison with the market, by combining the best precepts of the 5 key investment disciplines:1. Value Investing
2. Fundamental Analysis
3. Growth Investing
4. Technical Analysis
5. Market Experience and Observation
Overriding pre-occupation with capital preservation
Comfortable to remain weighted in cash for extended periods
Emphasis on flexibility within a strong overlying framework of accountability & risk management
Companies are imperfect; our lot is to choose the ‘less imperfect’ by clearly prioritising ourinvestment criteria
What we avoidBy definition, as a buyer of a company, we are backing that we are ‘better guided’ than the seller.We hence look for companies inside our ‘circle of competence’ and ‘network of newsflow’.
Additionally, we generally avoid companies that lack cashflow; in particular:
• Technology / start-up
• Biotech, esp. pre-product release
• Greenfields exploration and except in exceptional circumstances brownfields/pre-production
www.katanaasset.com
For
per
sona
l use
onl
y
Investment PhilosophyKey criteria
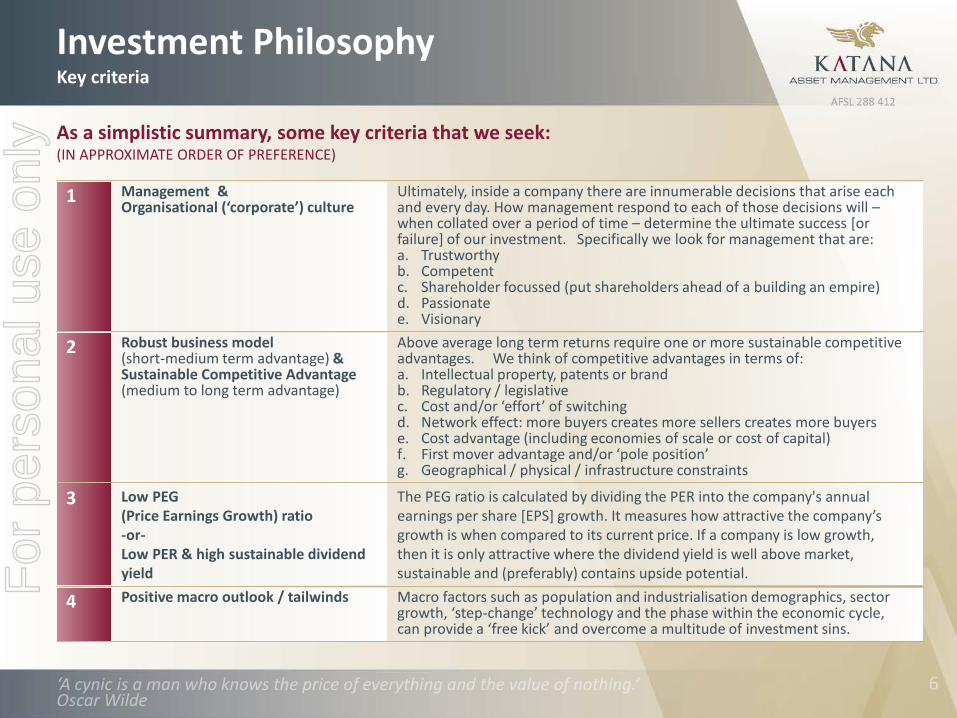
As a simplistic summary, some key criteria that we seek:(IN APPROXIMATE ORDER OF PREFERENCE)
1 Management & Organisational (‘corporate’) culture
Ultimately, inside a company there are innumerable decisions that arise each and every day. How management respond to each of those decisions will –when collated over a period of time – determine the ultimate success [or failure] of our investment. Specifically we look for management that are:a. Trustworthyb. Competentc. Shareholder focussed (put shareholders ahead of a building an empire)d. Passionatee. Visionary
2 Robust business model (short-medium term advantage) &Sustainable Competitive Advantage (medium to long term advantage)
Above average long term returns require one or more sustainable competitive advantages. We think of competitive advantages in terms of: a. Intellectual property, patents or brandb. Regulatory / legislative c. Cost and/or ‘effort’ of switchingd. Network effect: more buyers creates more sellers creates more buyerse. Cost advantage (including economies of scale or cost of capital)f. First mover advantage and/or ‘pole position’g. Geographical / physical / infrastructure constraints
3 Low PEG (Price Earnings Growth) ratio -or-Low PER & high sustainable dividend yield
The PEG ratio is calculated by dividing the PER into the company's annual earnings per share [EPS] growth. It measures how attractive the company’s growth is when compared to its current price. If a company is low growth, then it is only attractive where the dividend yield is well above market, sustainable and (preferably) contains upside potential.
4 Positive macro outlook / tailwinds Macro factors such as population and industrialisation demographics, sector growth, ‘step-change’ technology and the phase within the economic cycle, can provide a ‘free kick’ and overcome a multitude of investment sins.
For
per
sona
l use
onl
y
Investment PhilosophyKey criteria (continued)
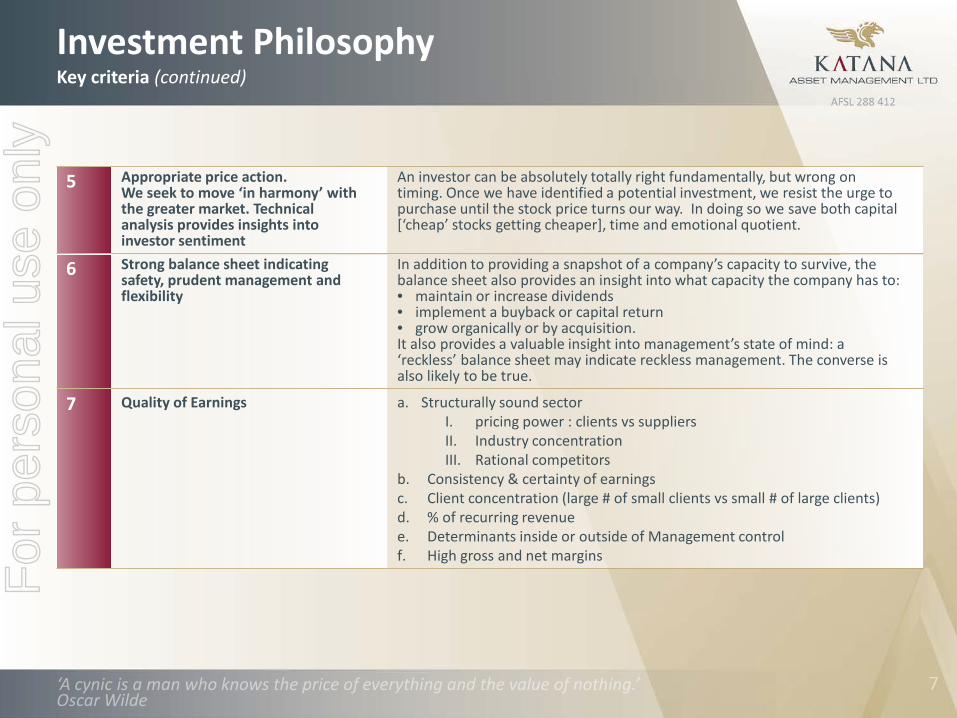
5 Appropriate price action.We seek to move ‘in harmony’ with the greater market. Technical analysis provides insights into investor sentiment
An investor can be absolutely totally right fundamentally, but wrong on timing. Once we have identified a potential investment, we resist the urge to purchase until the stock price turns our way. In doing so we save both capital [‘cheap’ stocks getting cheaper], time and emotional quotient.
6 Strong balance sheet indicating safety, prudent management and flexibility
In addition to providing a snapshot of a company’s capacity to survive, the balance sheet also provides an insight into what capacity the company has to:• maintain or increase dividends• implement a buyback or capital return • grow organically or by acquisition. It also provides a valuable insight into management’s state of mind: a ‘reckless’ balance sheet may indicate reckless management. The converse is also likely to be true.
7 Quality of Earnings a. Structurally sound sector I. pricing power : clients vs suppliersII. Industry concentrationIII. Rational competitors
b. Consistency & certainty of earningsc. Client concentration (large # of small clients vs small # of large clients)d. % of recurring revenuee. Determinants inside or outside of Management controlf. High gross and net margins
For
per
sona
l use
onl
y
Investment PhilosophyKey criteria (continued)
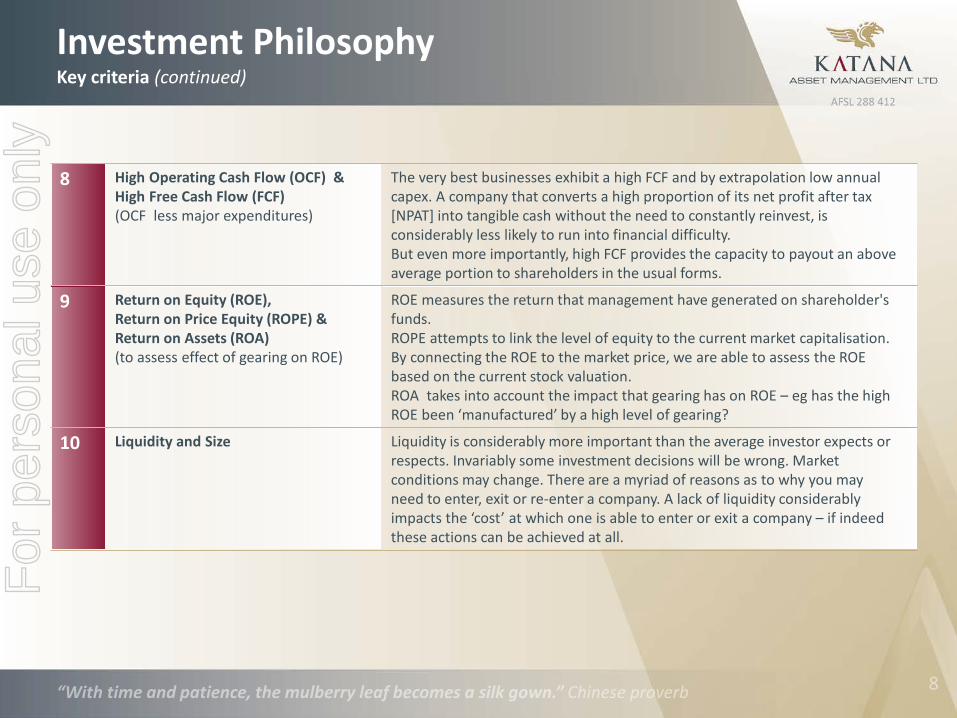
8 High Operating Cash Flow (OCF) &High Free Cash Flow (FCF)(OCF less major expenditures)
The very best businesses exhibit a high FCF and by extrapolation low annual capex. A company that converts a high proportion of its net profit after tax [NPAT] into tangible cash without the need to constantly reinvest, is considerably less likely to run into financial difficulty. But even more importantly, high FCF provides the capacity to payout an above average portion to shareholders in the usual forms.
9 Return on Equity (ROE),Return on Price Equity (ROPE) &Return on Assets (ROA) (to assess effect of gearing on ROE)
ROE measures the return that management have generated on shareholder's funds. ROPE attempts to link the level of equity to the current market capitalisation. By connecting the ROE to the market price, we are able to assess the ROE based on the current stock valuation.ROA takes into account the impact that gearing has on ROE – eg has the high ROE been ‘manufactured’ by a high level of gearing?
10 Liquidity and Size Liquidity is considerably more important than the average investor expects or respects. Invariably some investment decisions will be wrong. Market conditions may change. There are a myriad of reasons as to why you may need to enter, exit or re-enter a company. A lack of liquidity considerably impacts the ‘cost’ at which one is able to enter or exit a company – if indeed these actions can be achieved at all.
For
per
sona
l use
onl
y
Portfolio ConstructionOverview and Parameters
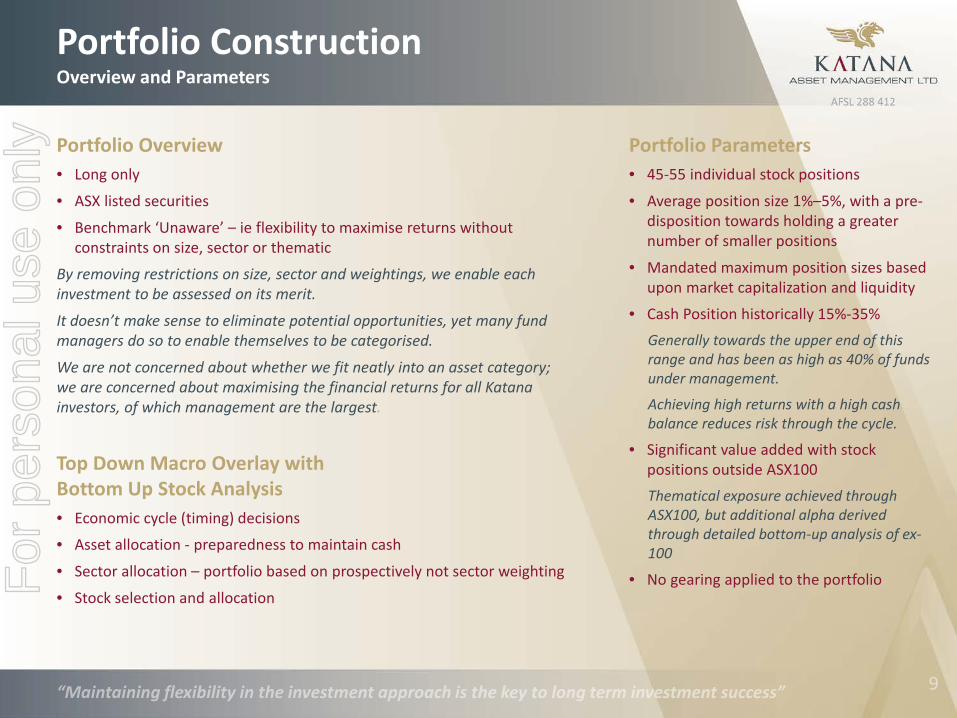
Portfolio Overview• Long only
• ASX listed securities
• Benchmark ‘Unaware’ – ie flexibility to maximise returns without constraints on size, sector or thematic
By removing restrictions on size, sector and weightings, we enable each investment to be assessed on its merit.
It doesn’t make sense to eliminate potential opportunities, yet many fund managers do so to enable themselves to be categorised.
We are not concerned about whether we fit neatly into an asset category; we are concerned about maximising the financial returns for all Katana investors, of which management are the largest.
Top Down Macro Overlay withBottom Up Stock Analysis• Economic cycle (timing) decisions
• Asset allocation - preparedness to maintain cash
• Sector allocation – portfolio based on prospectively not sector weighting
• Stock selection and allocation
Portfolio Parameters • 45-55 individual stock positions
• Average position size 1%–5%, with a pre-disposition towards holding a greater number of smaller positions
• Mandated maximum position sizes based upon market capitalization and liquidity
• Cash Position historically 15%-35% Generally towards the upper end of this range and has been as high as 40% of funds under management.
Achieving high returns with a high cash balance reduces risk through the cycle.
• Significant value added with stock positions outside ASX100Thematical exposure achieved through ASX100, but additional alpha derived through detailed bottom-up analysis of ex-100
• No gearing applied to the portfolioFor
per
sona
l use
onl
y
Portfolio ConstructionProcesses
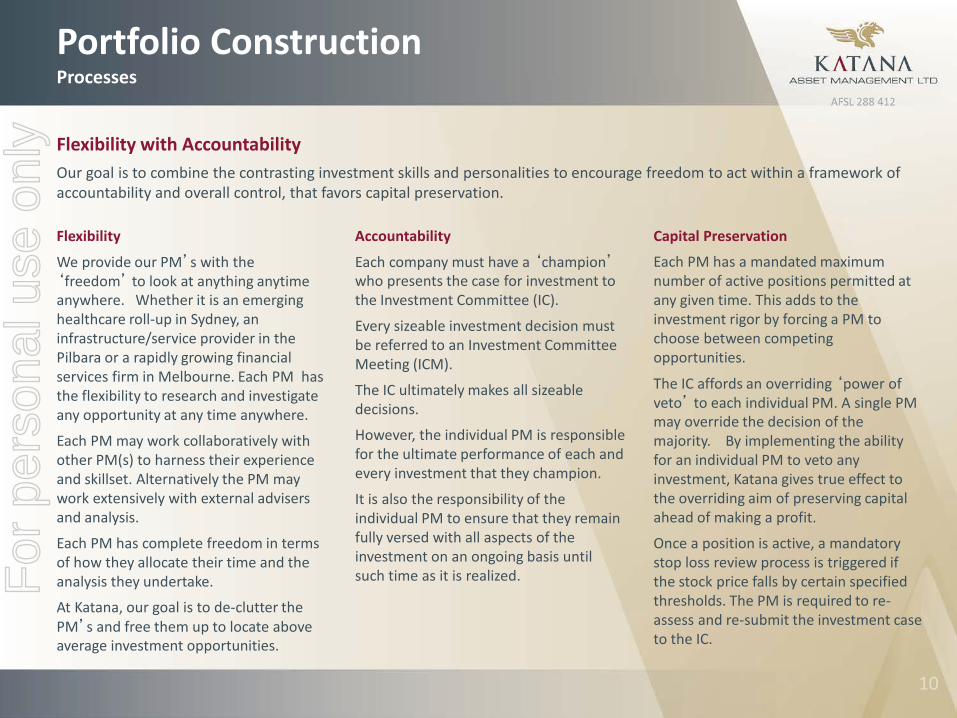
Flexibility with AccountabilityOur goal is to combine the contrasting investment skills and personalities to encourage freedom to act within a framework of accountability and overall control, that favors capital preservation.
Flexibility
We provide our PM’s with the ‘freedom’ to look at anything anytime anywhere. Whether it is an emerging healthcare roll-up in Sydney, an infrastructure/service provider in the Pilbara or a rapidly growing financial services firm in Melbourne. Each PM has the flexibility to research and investigate any opportunity at any time anywhere.
Each PM may work collaboratively with other PM(s) to harness their experience and skillset. Alternatively the PM may work extensively with external advisers and analysis.
Each PM has complete freedom in terms of how they allocate their time and the analysis they undertake.
At Katana, our goal is to de-clutter the PM’s and free them up to locate above average investment opportunities.
Accountability
Each company must have a ‘champion’who presents the case for investment to the Investment Committee (IC).
Every sizeable investment decision must be referred to an Investment Committee Meeting (ICM).
The IC ultimately makes all sizeable decisions.
However, the individual PM is responsible for the ultimate performance of each and every investment that they champion.
It is also the responsibility of the individual PM to ensure that they remain fully versed with all aspects of the investment on an ongoing basis until such time as it is realized.
Capital Preservation
Each PM has a mandated maximum number of active positions permitted at any given time. This adds to the investment rigor by forcing a PM to choose between competing opportunities.
The IC affords an overriding ‘power of veto’ to each individual PM. A single PM may override the decision of the majority. By implementing the ability for an individual PM to veto any investment, Katana gives true effect to the overriding aim of preserving capital ahead of making a profit.
Once a position is active, a mandatory stop loss review process is triggered if the stock price falls by certain specified thresholds. The PM is required to re-assess and re-submit the investment case to the IC.
For
per
sona
l use
onl
y
Portfolio ConstructionTypical portfolio
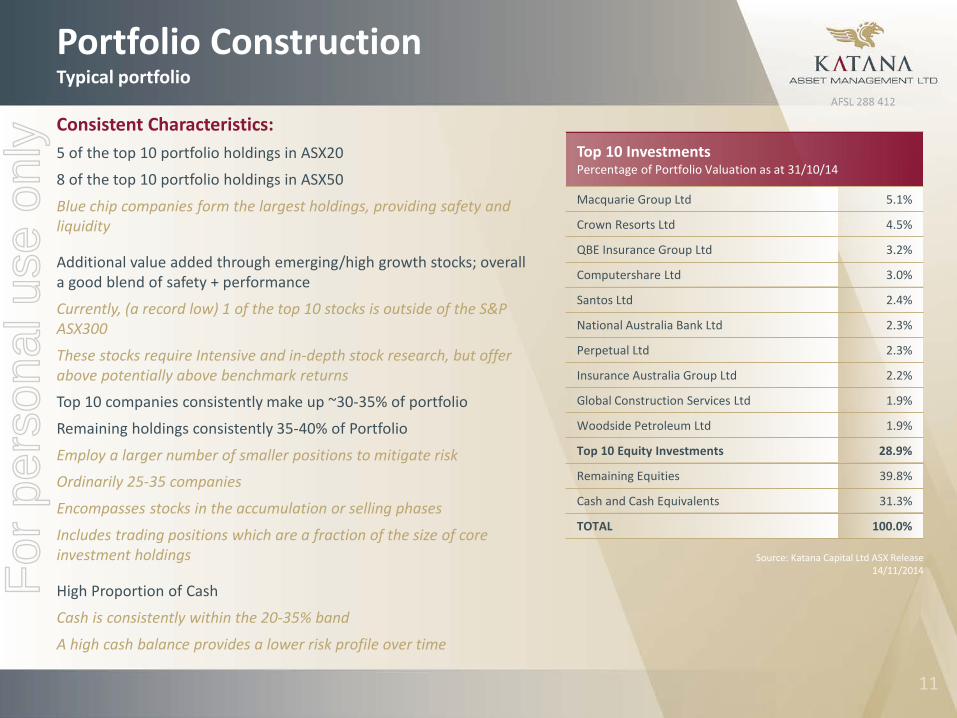
Consistent Characteristics:5 of the top 10 portfolio holdings in ASX20
8 of the top 10 portfolio holdings in ASX50
Blue chip companies form the largest holdings, providing safety and liquidity
Additional value added through emerging/high growth stocks; overall a good blend of safety + performance
Currently, (a record low) 1 of the top 10 stocks is outside of the S&P ASX300
These stocks require Intensive and in-depth stock research, but offer above potentially above benchmark returns
Top 10 companies consistently make up ~30-35% of portfolio
Remaining holdings consistently 35-40% of Portfolio
Employ a larger number of smaller positions to mitigate risk
Ordinarily 25-35 companies
Encompasses stocks in the accumulation or selling phases
Includes trading positions which are a fraction of the size of core investment holdings
High Proportion of Cash
Cash is consistently within the 20-35% band
A high cash balance provides a lower risk profile over time
Source: Katana Capital Ltd ASX Release 14/11/2014
Top 10 InvestmentsPercentage of Portfolio Valuation as at 31/10/14
Macquarie Group Ltd 5.1%
Crown Resorts Ltd 4.5%
QBE Insurance Group Ltd 3.2%
Computershare Ltd 3.0%
Santos Ltd 2.4%
National Australia Bank Ltd 2.3%
Perpetual Ltd 2.3%
Insurance Australia Group Ltd 2.2%
Global Construction Services Ltd 1.9%
Woodside Petroleum Ltd 1.9%
Top 10 Equity Investments 28.9%
Remaining Equities 39.8%
Cash and Cash Equivalents 31.3%
TOTAL 100.0%
For
per
sona
l use
onl
y

Portfolio ConstructionTypical portfolio
Active ‘Weightings’ Away from Index BenchmarksComfortable to be substantially overweight high conviction sectorsCurrently Financial Services
Comfortable to substantially underweight sectorsFor example, in May KAM sold all hldings in RIO, BHP, FMG etc and as at 31st October essentially retained a Nil weighting.Combined these 3 stocks equate to ~8% of the index.This represents a substantial deviation from the index; something other funds may be hesitant or unable to do.
Source: Katana Asset Management
Energy7.01%
Consumer Discretionary
15.70%
Industrials8.46%Consumer
Staples0.79%
Materials8.32%
Health Care1.50%
Financials53.70%
Information Technology
4.51%
Property Trusts0.00%
Telecom Services
0.00% Utilities0.00%
Portfolio Holdings By GICS 31 October 2014
For
per
sona
l use
onl
y
Performance Historyvs Benchmark
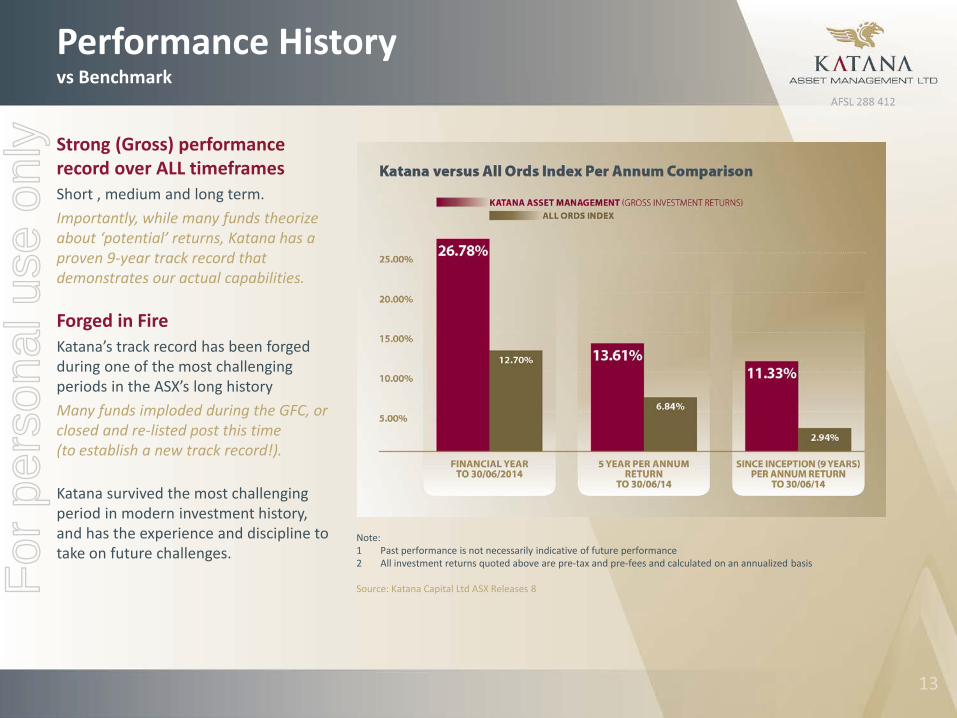
Strong (Gross) performance record over ALL timeframes Short , medium and long term.Importantly, while many funds theorize about ‘potential’ returns, Katana has a proven 9-year track record that demonstrates our actual capabilities.
Forged in FireKatana’s track record has been forged during one of the most challenging periods in the ASX’s long historyMany funds imploded during the GFC, or closed and re-listed post this time (to establish a new track record!).
Katana survived the most challenging period in modern investment history, and has the experience and discipline to take on future challenges.
Note:1 Past performance is not necessarily indicative of future performance2 All investment returns quoted above are pre-tax and pre-fees and calculated on an annualized basis
Source: Katana Capital Ltd ASX Releases 8For
per
sona
l use
onl
y
Performance HistorySignificant Out-Performance
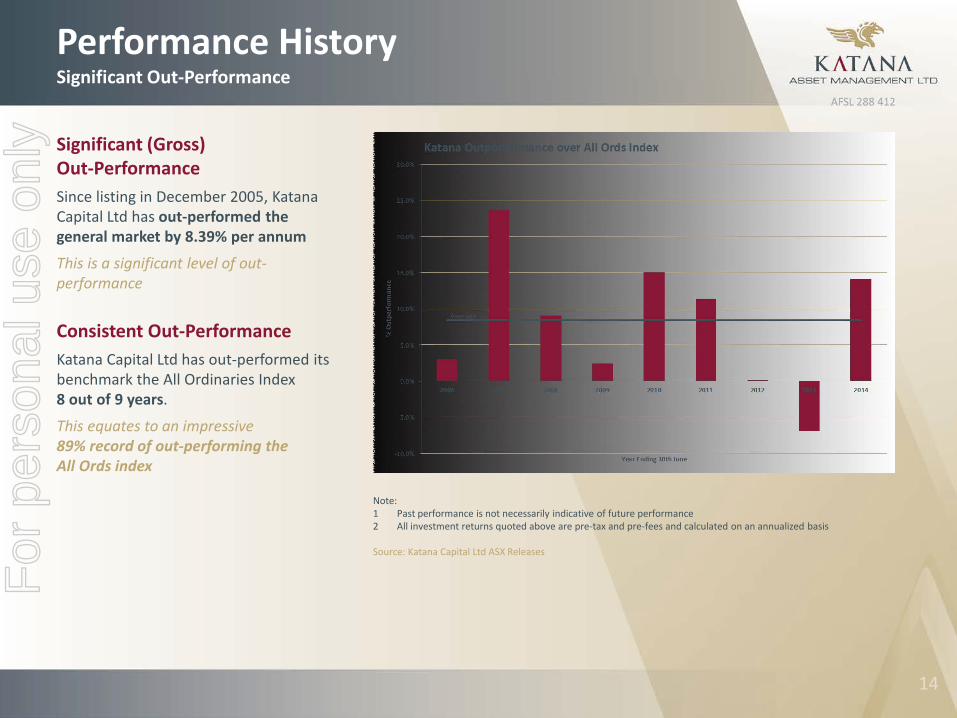
Significant (Gross) Out-PerformanceSince listing in December 2005, Katana Capital Ltd has out-performed the general market by 8.39% per annum
This is a significant level of out-performance
Consistent Out-PerformanceKatana Capital Ltd has out-performed its benchmark the All Ordinaries Index 8 out of 9 years.
This equates to an impressive 89% record of out-performing the All Ords index
Note:1 Past performance is not necessarily indicative of future performance2 All investment returns quoted above are pre-tax and pre-fees and calculated on an annualized basis
Source: Katana Capital Ltd ASX Releases
For
per
sona
l use
onl
y
DividendsHistorical & Current
Dividend HistoryKatana Capital Ltd has paid dividends every year since listing
Currently paying quarterly dividends This provides added convenience and cash flow for yield conscious investors
‘Smart’ Dividend Reinvestment Plan (DPR) in placeUnder the DRP, the company steps into the market and purchases shares each quarter to satisfy demand under the DRP.
The shares are issued to shareholders free of brokerage at the average purchase price.
In addition to providing the opportunity to add to long term holdings without incurring brokerage, this DRP has 3 advantages:
1. Shareholders receive the shares generally at a cheaper price than if the company issued them at NTA
2. Non-dilutive: no new shares are issued: existing shares are purchased on-market and distributed
3. Adds liquidity to the market for shareholders looking to exit
Future DividendsKatana has committed to paying a MINIMUM of 1.5c for each quarter during the 2015FY.
On a share price of 93c, this equates to 6.45% plus franking credits (where available)
For
per
sona
l use
onl
y
DividendsComparative Yields
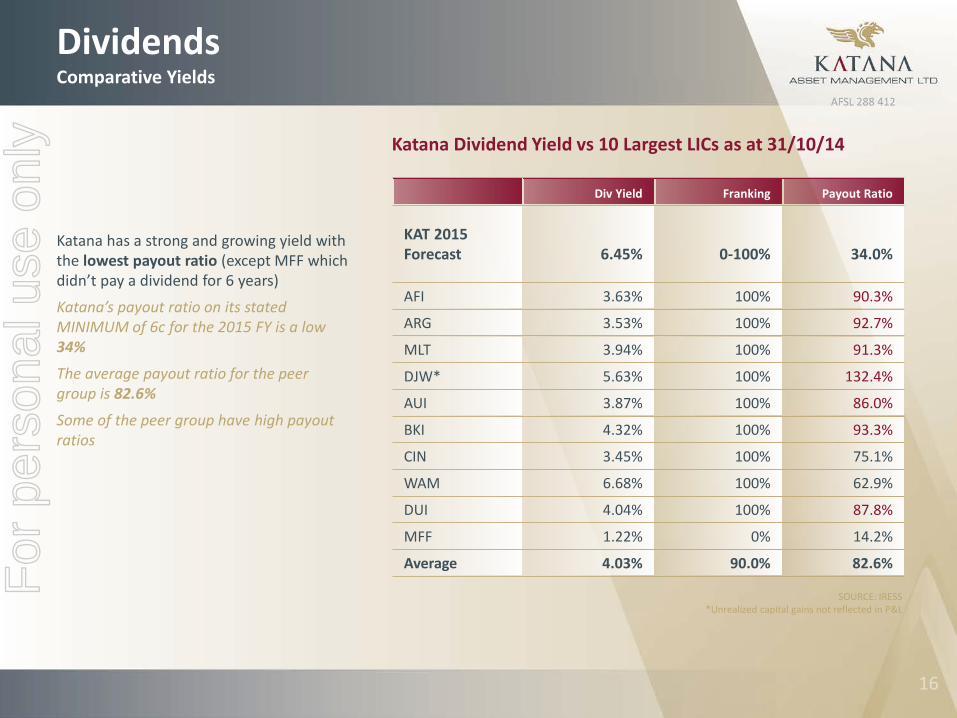
Katana has a strong and growing yield with the lowest payout ratio (except MFF which didn’t pay a dividend for 6 years)
Katana’s payout ratio on its stated MINIMUM of 6c for the 2015 FY is a low 34%
The average payout ratio for the peer group is 82.6%
Some of the peer group have high payout ratios
Katana Dividend Yield vs 10 Largest LICs as at 31/10/14
Div Yield Franking Payout Ratio
KAT 2015 Forecast 6.45% 0-100% 34.0%
AFI 3.63% 100% 90.3%
ARG 3.53% 100% 92.7%
MLT 3.94% 100% 91.3%
DJW* 5.63% 100% 132.4%
AUI 3.87% 100% 86.0%
BKI 4.32% 100% 93.3%
CIN 3.45% 100% 75.1%
WAM 6.68% 100% 62.9%
DUI 4.04% 100% 87.8%
MFF 1.22% 0% 14.2%
Average 4.03% 90.0% 82.6%
SOURCE: IRESS*Unrealized capital gains not reflected in P&L
For
per
sona
l use
onl
y
Net Asset BackingComparative Discounts / Premiums
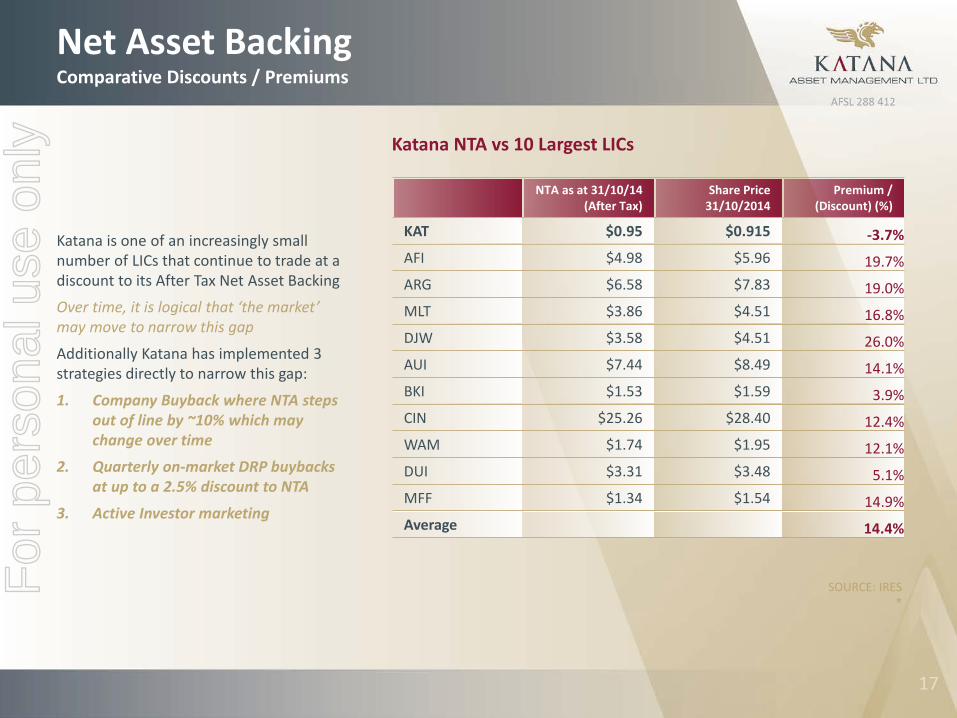
Katana is one of an increasingly small number of LICs that continue to trade at a discount to its After Tax Net Asset Backing
Over time, it is logical that ‘the market’ may move to narrow this gap
Additionally Katana has implemented 3 strategies directly to narrow this gap:
1. Company Buyback where NTA steps out of line by ~10% which may change over time
2. Quarterly on-market DRP buybacks at up to a 2.5% discount to NTA
3. Active Investor marketing
Katana NTA vs 10 Largest LICs
NTA as at 31/10/14 (After Tax)
Share Price 31/10/2014
Premium / (Discount) (%)
KAT $0.95 $0.915 -3.7%AFI $4.98 $5.96 19.7% ARG $6.58 $7.83 19.0%MLT $3.86 $4.51 16.8%DJW $3.58 $4.51 26.0%AUI $7.44 $8.49 14.1%BKI $1.53 $1.59 3.9%CIN $25.26 $28.40 12.4%WAM $1.74 $1.95 12.1%DUI $3.31 $3.48 5.1%MFF $1.34 $1.54 14.9%Average 14.4%
SOURCE: IRES*
For
per
sona
l use
onl
y
Summary1. Company
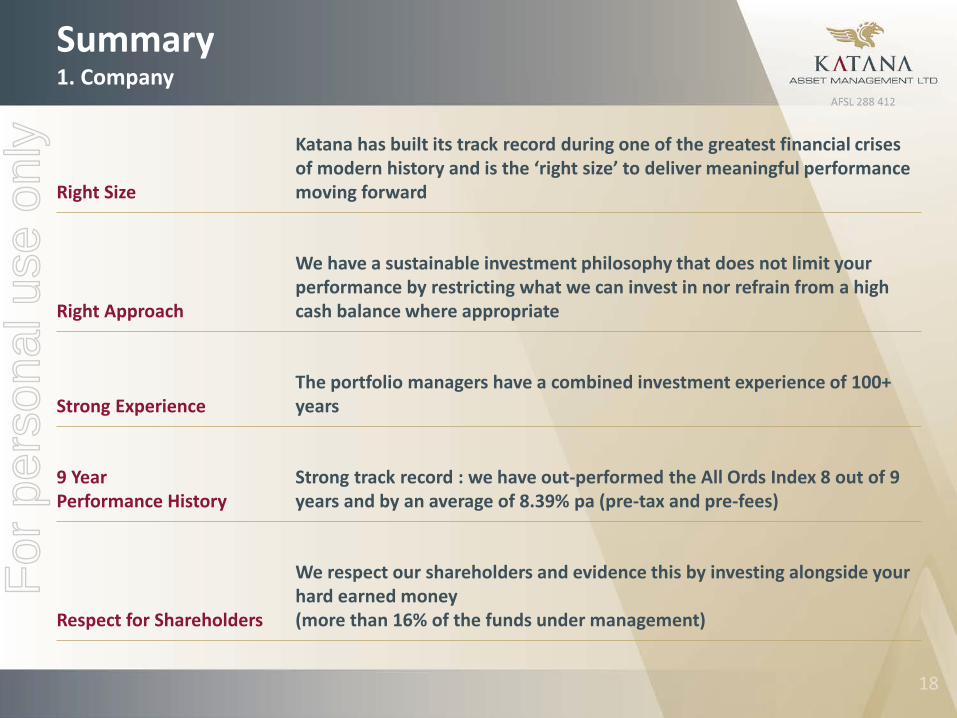
Right Size
Katana has built its track record during one of the greatest financial crises of modern history and is the ‘right size’ to deliver meaningful performance moving forward
Right Approach
We have a sustainable investment philosophy that does not limit your performance by restricting what we can invest in nor refrain from a high cash balance where appropriate
Strong ExperienceThe portfolio managers have a combined investment experience of 100+ years
9 YearPerformance History
Strong track record : we have out-performed the All Ords Index 8 out of 9 years and by an average of 8.39% pa (pre-tax and pre-fees)
Respect for Shareholders
We respect our shareholders and evidence this by investing alongside your hard earned money (more than 16% of the funds under management)
For
per
sona
l use
onl
y
Summary2. Pricing
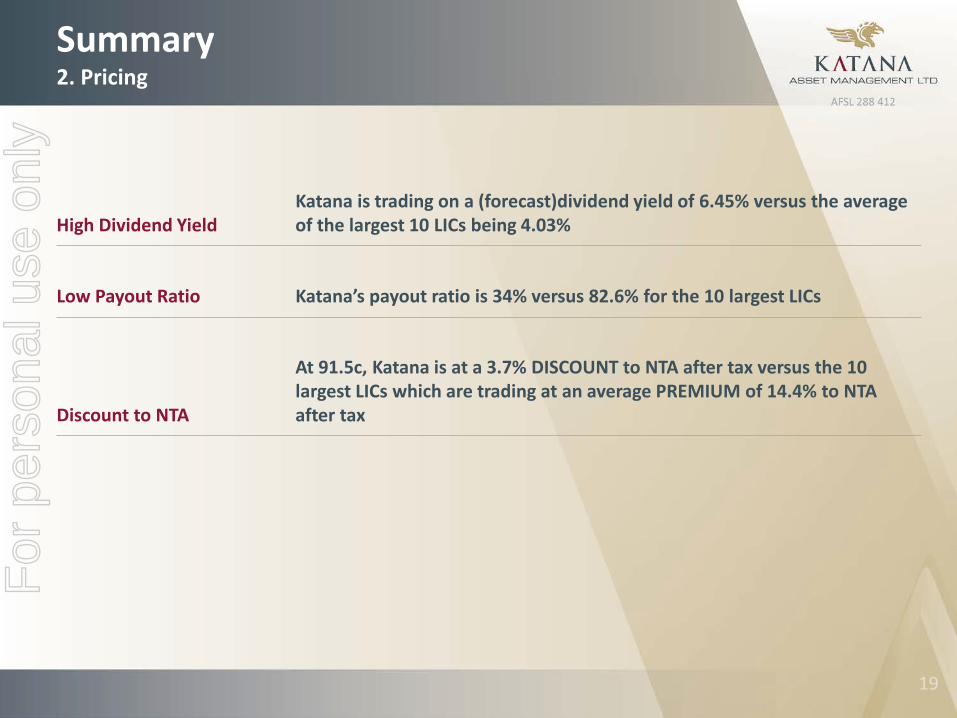
High Dividend YieldKatana is trading on a (forecast)dividend yield of 6.45% versus the average of the largest 10 LICs being 4.03%
Low Payout Ratio Katana’s payout ratio is 34% versus 82.6% for the 10 largest LICs
Discount to NTA
At 91.5c, Katana is at a 3.7% DISCOUNT to NTA after tax versus the 10 largest LICs which are trading at an average PREMIUM of 14.4% to NTA after tax
For
per
sona
l use
onl
y
Thank you
&
Additional Information (Following)
For
per
sona
l use
onl
y
Long Term Equity ReturnsSuperior Asset Class
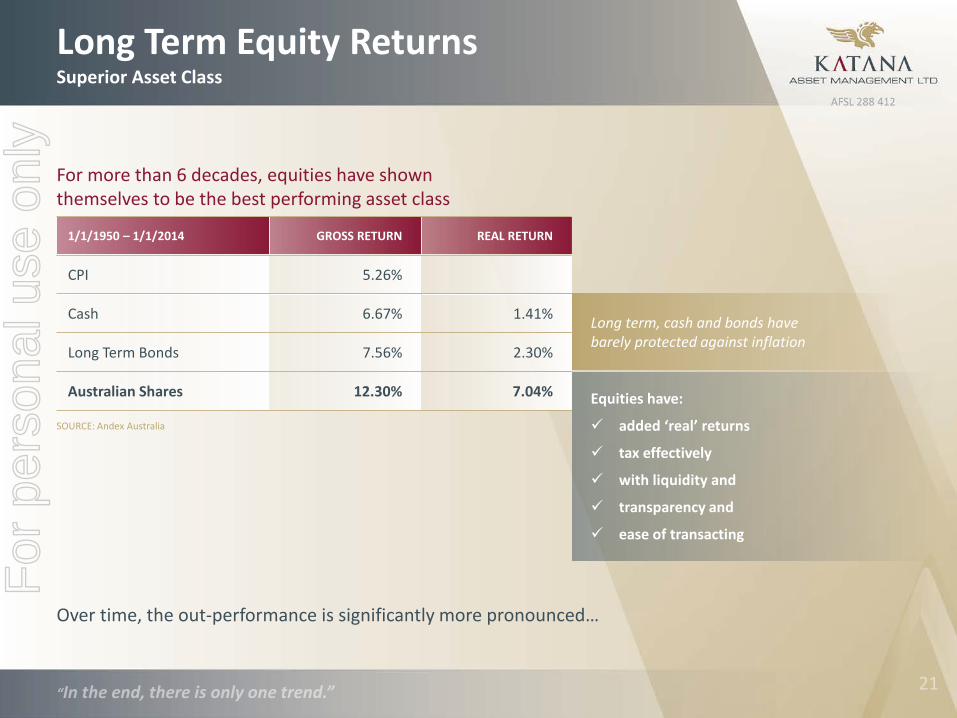
For more than 6 decades, equities have shownthemselves to be the best performing asset class
Over time, the out-performance is significantly more pronounced…
1/1/1950 – 1/1/2014 GROSS RETURN REAL RETURN
CPI 5.26%
Cash 6.67% 1.41%
Long Term Bonds 7.56% 2.30%
Australian Shares 12.30% 7.04% Equities have:
added ‘real’ returns
tax effectively
with liquidity and
transparency and
ease of transacting
Long term, cash and bonds havebarely protected against inflation
SOURCE: Andex Australia
For
per
sona
l use
onl
y
Long Term Equity ReturnsImpact of Compounding
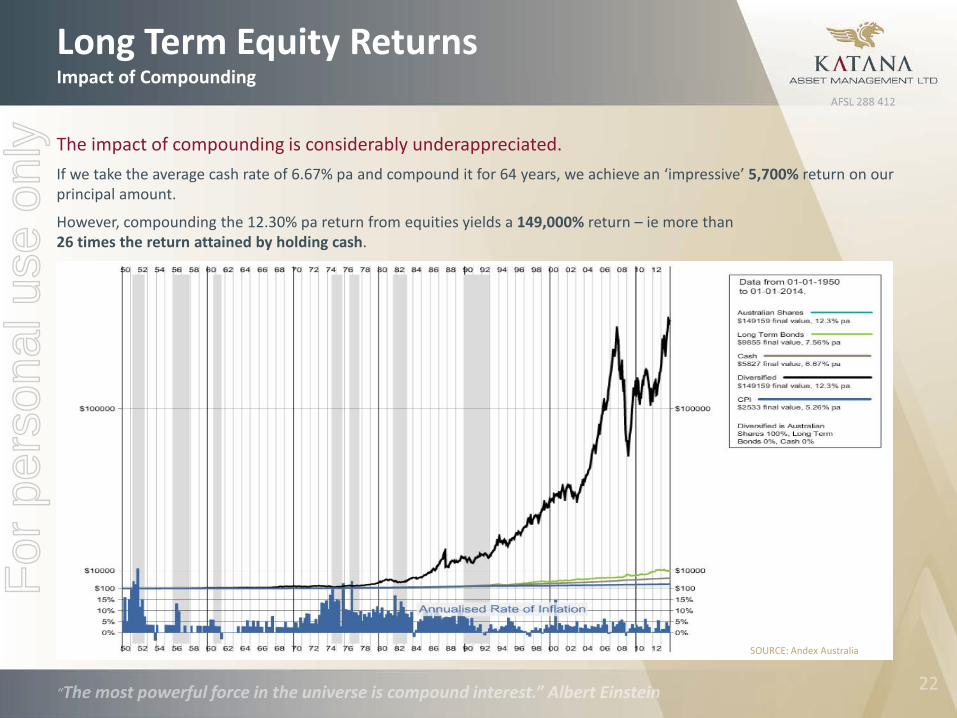
The impact of compounding is considerably underappreciated. If we take the average cash rate of 6.67% pa and compound it for 64 years, we achieve an ‘impressive’ 5,700% return on our principal amount.
However, compounding the 12.30% pa return from equities yields a 149,000% return – ie more than26 times the return attained by holding cash.
SOURCE: Andex Australia
For
per
sona
l use
onl
y
Long Term Equity ReturnsThe last decade in perspective
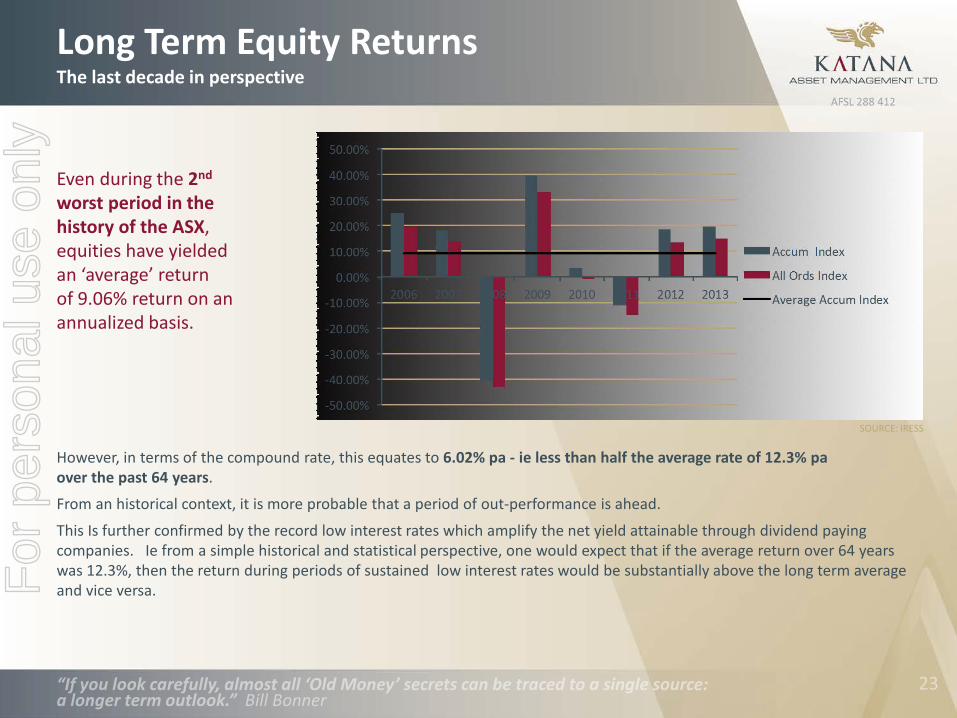
Even during the 2nd
worst period in thehistory of the ASX,equities have yieldedan ‘average’ returnof 9.06% return on anannualized basis.
However, in terms of the compound rate, this equates to 6.02% pa - ie less than half the average rate of 12.3% pa over the past 64 years.
From an historical context, it is more probable that a period of out-performance is ahead.
This Is further confirmed by the record low interest rates which amplify the net yield attainable through dividend paying companies. Ie from a simple historical and statistical perspective, one would expect that if the average return over 64 years was 12.3%, then the return during periods of sustained low interest rates would be substantially above the long term averageand vice versa.
SOURCE: IRESS
For
per
sona
l use
onl
y
PersonnelSupport Staff & Service Providers
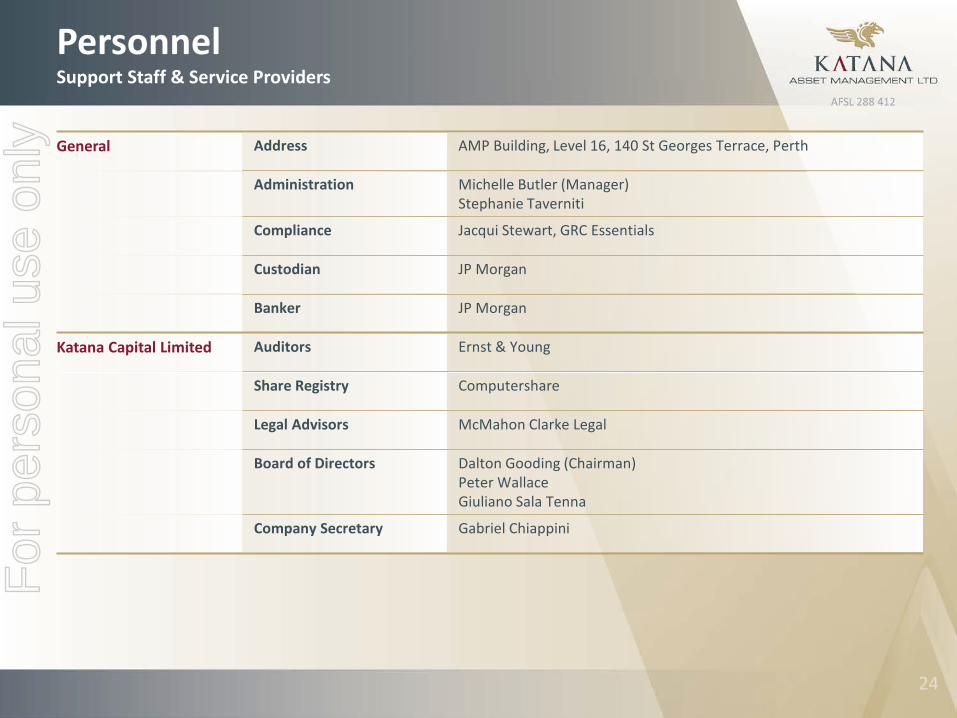
General Address AMP Building, Level 16, 140 St Georges Terrace, Perth
Administration Michelle Butler (Manager)Stephanie Taverniti
Compliance Jacqui Stewart, GRC Essentials
Custodian JP Morgan
Banker JP Morgan
Katana Capital Limited Auditors Ernst & Young
Share Registry Computershare
Legal Advisors McMahon Clarke Legal
Board of Directors Dalton Gooding (Chairman)Peter WallaceGiuliano Sala Tenna
Company Secretary Gabriel Chiappini
For
per
sona
l use
onl
y
Portfolio ConstructionProcesses
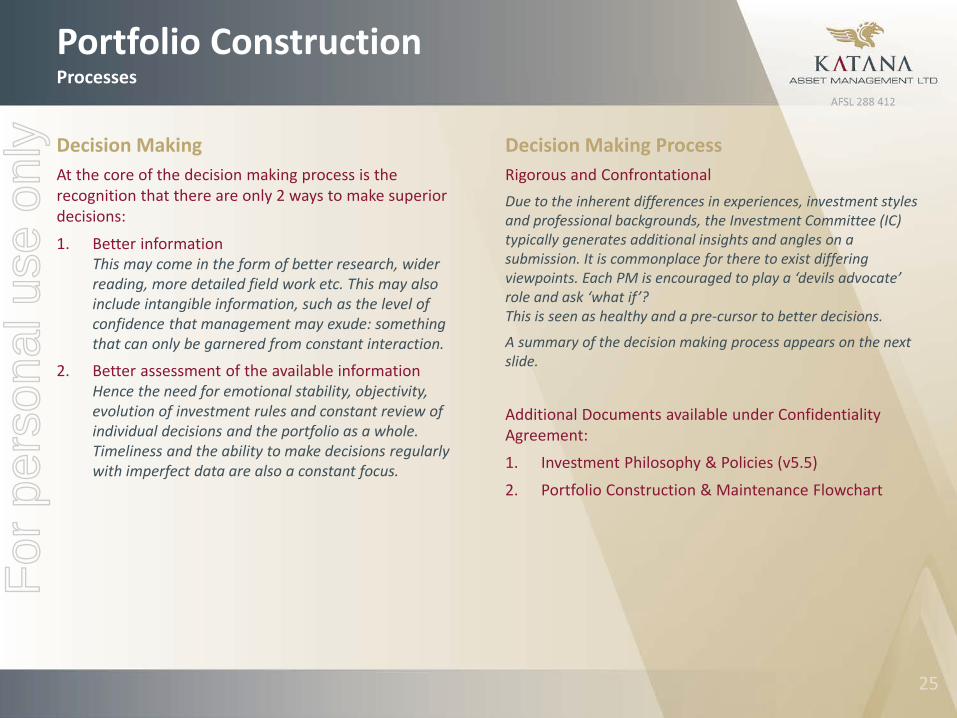
Decision MakingAt the core of the decision making process is the recognition that there are only 2 ways to make superior decisions:
1. Better information This may come in the form of better research, wider reading, more detailed field work etc. This may also include intangible information, such as the level of confidence that management may exude: something that can only be garnered from constant interaction.
2. Better assessment of the available informationHence the need for emotional stability, objectivity, evolution of investment rules and constant review of individual decisions and the portfolio as a whole.Timeliness and the ability to make decisions regularly with imperfect data are also a constant focus.
Decision Making ProcessRigorous and ConfrontationalDue to the inherent differences in experiences, investment styles and professional backgrounds, the Investment Committee (IC) typically generates additional insights and angles on a submission. It is commonplace for there to exist differing viewpoints. Each PM is encouraged to play a ‘devils advocate’ role and ask ‘what if’? This is seen as healthy and a pre-cursor to better decisions.
A summary of the decision making process appears on the next slide.
Additional Documents available under Confidentiality Agreement:
1. Investment Philosophy & Policies (v5.5)
2. Portfolio Construction & Maintenance Flowchart
For
per
sona
l use
onl
y
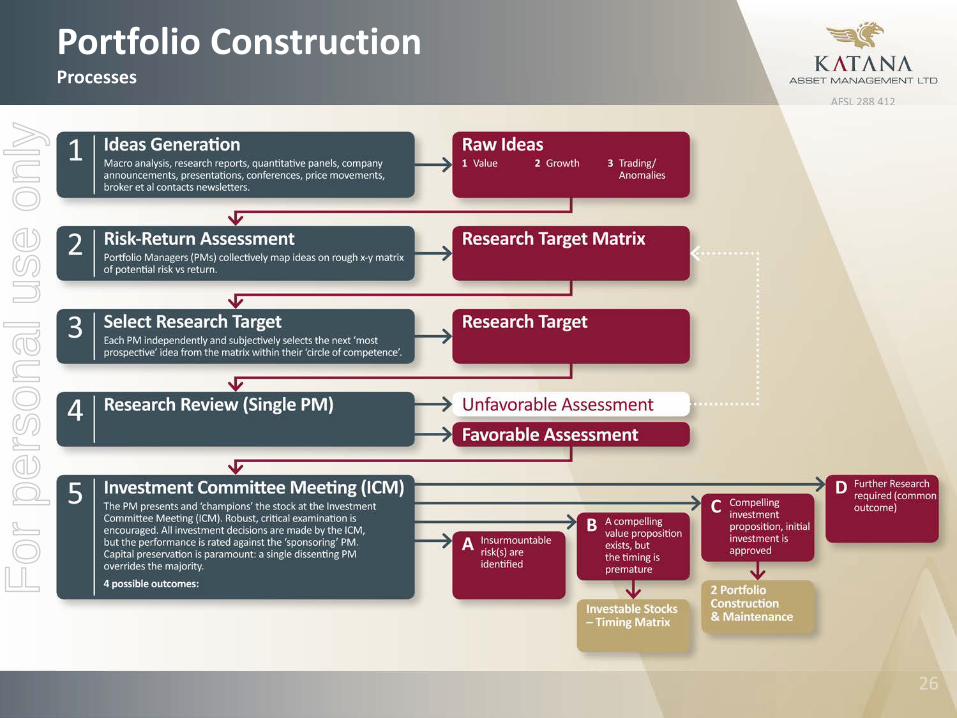
Portfolio ConstructionProcesses
For
per
sona
l use
onl
y
Performance HistoryAdvantages of a Listed Investment Company (LIC)
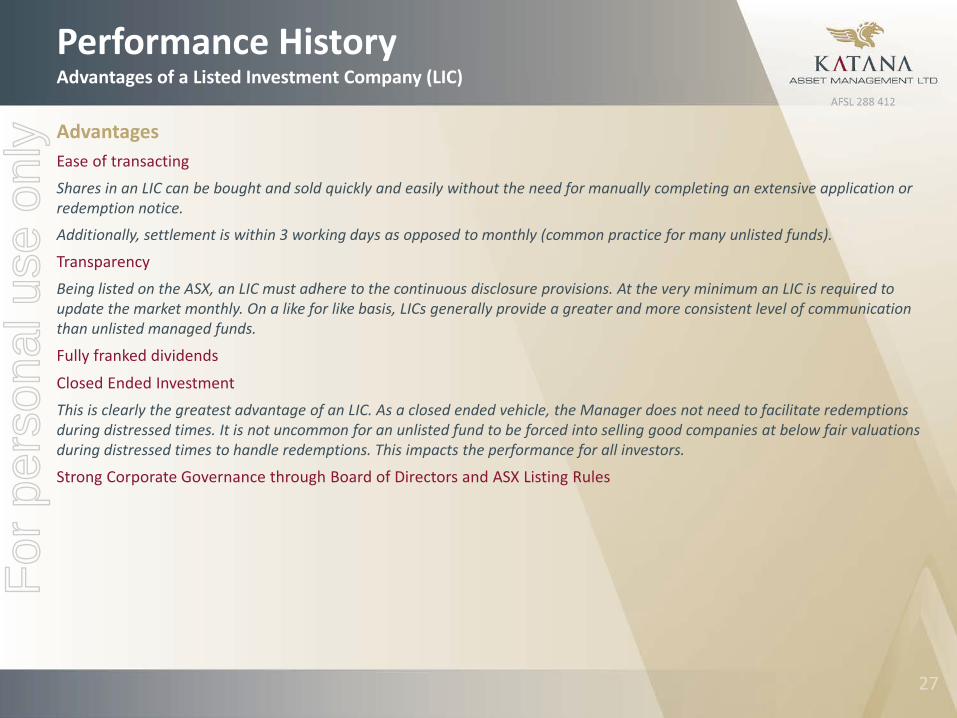
AdvantagesEase of transactingShares in an LIC can be bought and sold quickly and easily without the need for manually completing an extensive application or redemption notice.
Additionally, settlement is within 3 working days as opposed to monthly (common practice for many unlisted funds).
TransparencyBeing listed on the ASX, an LIC must adhere to the continuous disclosure provisions. At the very minimum an LIC is required to update the market monthly. On a like for like basis, LICs generally provide a greater and more consistent level of communicationthan unlisted managed funds.
Fully franked dividends
Closed Ended InvestmentThis is clearly the greatest advantage of an LIC. As a closed ended vehicle, the Manager does not need to facilitate redemptions during distressed times. It is not uncommon for an unlisted fund to be forced into selling good companies at below fair valuations during distressed times to handle redemptions. This impacts the performance for all investors.
Strong Corporate Governance through Board of Directors and ASX Listing Rules
For
per
sona
l use
onl
y
SummarySolid Foundation
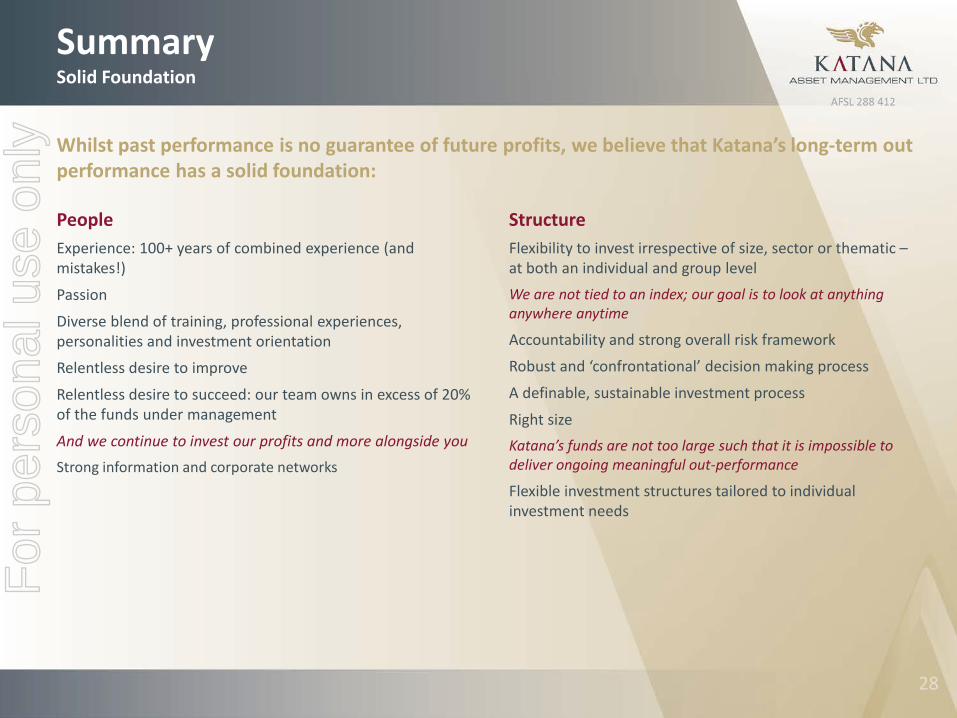
Whilst past performance is no guarantee of future profits, we believe that Katana’s long-term out performance has a solid foundation:
PeopleExperience: 100+ years of combined experience (and mistakes!)
Passion
Diverse blend of training, professional experiences, personalities and investment orientation
Relentless desire to improve
Relentless desire to succeed: our team owns in excess of 20% of the funds under management
And we continue to invest our profits and more alongside youStrong information and corporate networks
StructureFlexibility to invest irrespective of size, sector or thematic –at both an individual and group levelWe are not tied to an index; our goal is to look at anything anywhere anytime
Accountability and strong overall risk framework
Robust and ‘confrontational’ decision making process
A definable, sustainable investment process
Right sizeKatana’s funds are not too large such that it is impossible to deliver ongoing meaningful out-performance
Flexible investment structures tailored to individual investment needs
For
per
sona
l use
onl
y