Embed Size (px)
Citation preview
25
Kashmir Economic Review, Volume 29, Issue 1, June 2020 ------------------------------------------------------------------------------------------------------------------------------------------------------------------------------------------------------------------------------------
Kashmir Economic Review ISSN(P): 1011-081X, ISSN(E): 2706-9516
http://www.ker.org.pk
===========================================================================================
International Stock Markets Integration: A Case Study of
Selected OIC Countries
ABSTRACT AUTHORS
This study examines the integration in eight selected emerging
stock markets from the OIC countries namely Pakistan,
Bangladesh, Egypt, Indonesia, Iran, Saudi Arabia, Turkey, and
Malaysia for the period of March 1998 to March 2016. The
study adopts a combination approach by considering the
combination of two countries, then a combination of three
countries, and so on up to the nth combination of the stock
markets using the Autoregressive distributive lag approach.
The results show that there is a systematic pattern of long-run
equilibrium relationship among the stock markets of selected
OIC countries. Malaysia, Indonesia, and Turkey are found to
be leading stock markets in the selected group. The results of
this study will provide a pattern of beneficial portfolio
diversification to investors.
Humera Iram* Ph.D. Economics Student, International
Islamic University, Islamabad, Pakistan
Author’s Contributions: 2, 3, 4, 6
Muhammad Amin Visiting Lecturer, Department of
Economics and Finance, International
Islamic University, Islamabad, Pakistan
Author’s Contributions: 1, 5, 7
Keywords Please cite this article as:
Stock markets, Integration,
OIC countries, Portfolio
diversification
Iram, H. & Amin, M. (2020). International
stock markets integration: A case study of
selected OIC countries, Kashmir
Economic Review, 29(1), 25-43.
JEL Classification
G15, G11, F2
* Correspondence author
Author’s contribution in the article: 1-Conceived and designed the analysis, 2-Reviewed and compiled the literature,
3-Collected the data, 4-Contributed data or analysis tools, 5-Performed the analysis, 6-Wrote the paper, 7-Financial support for
the conduct of the study, 8-Other

International Stock Markets Integration …
26
1. INTRODUCTION
Studies on International stock market integration have become very important in the recent past for
investors as well as academicians. Many researchers have investigated the integration of stock markets from
different aspects (Wang et al., 2003; Mukherjee & Mishra, 2010; Horvath & Petrovski, 2013; Narayan et
al., 2014; Rizvi & Arshad, 2017). The stock market integration theory states that assets have the same level
of risk if there is no transaction cost, legal restrictions, taxes, and tariffs on the free mobility of equities
(Levine, 1997; Kose et al., 2009). During the last three decades, stock market integration has gained
considerable attention from researchers due to an increasing trend of equity flow from developed countries
to developing countries.
A vast literature is available on stock market integration both in developed and developing countries
(Buckberg, 1995; Marashdeh, 2005; Narayan et al., 2014; Teulon et al., 2014; Al Nasser & Hajilee, 2016).
However, there is little work in this area about the OIC nation-states. There are 57 OIC member countries
and they are geographically distributed in 6 regions. OIC countries constitute a big part of the world which
is mostly neglected in respect of stock markets’ integration. Of 57 OIC countries, 38 have functioning stock
exchanges, and 16 out of 38 countries are members of the Federation of Euro-Asian Stock Exchanges
(FEAS). OIC member stock exchanges have increased their share within the total world market during the
last decades and gained considerable attention as new emerging markets.
There are relatively very few studies that focused on the stock market integration of OIC countries (Hassan,
2003; Ceylan and Dogan, 2004; Majid et al., 2007; Majid & Kassim, 2010; Nurrachmi, 2018). Most of the
previous studies on the topic under consideration are explanatory and found evidence of stock market
integration. However, due to the emerging importance of OIC stock markets in the global world more
comprehensive studies are required that can provide more information about the nature of the integration
of OIC countries stock markets especially for the investors who want to diversify their portfolio through
investing in different combination of OIC countries stock exchange. Thus, this study aims to fulfill this gap
and attempts to provide a comprehensive analysis of the stock market integration of OIC countries.
This study is distinguished from others in the following respects; first, this study adopts a combination
approach, it considers the combination of two countries (28 combinations)1, the combination of three
countries (56 combinations), and so on up to the nth combination of the stock markets. Which provides the
opportunities to the investors, they can make portfolio according to their desire combination of Muslims
countries to strengthen the Muslims platform. Second, this study uses the Autoregressive distributive lag
approach, which is not used earlier by any researcher evaluating OIC stock markets’ integration.
The key objective of this study is to observe the financial integration among the stock markets of
Bangladesh, Egypt, Indonesia, Iran, Malaysia, Pakistan, Saudi Arabia, and Turkey2. More specifically, we
focus on
• Whether there has been any integration among selected OIC stock markets?
• Can investors diversify the risk by investing in selected OIC stock markets?
This study proceeds in the following way. Section two exhibits the relevant literature review of our study.
Section three describes data and methodology. Section four explains the results of estimation, significance,
1 𝑐2
8 = 8!
2!(8−2)! = 28 where n=8 (selected eight OIC countries) and r=2 (combinations of two countries)
2 Other countries' stock exchanges are not included mainly due to the data availability problem. However, the selected eight stock
exchanges are the major stock exchanges of OIC countries.
Kashmir Economic Review, Volume 29, Issue 1, June 2020
27
and interpretation. Section five concludes the study with some recommendations and future research
suggestions.
2. LITERATURE REVIEW
Many studies are conducted to find out cointegration among different countries. However, few studies
focused on OIC country's stock markets and none of the previous studies has used the ARDL approach for
estimation of the stock markets of OIC countries. The studies have used different methodologies and models
for finding stock market cointegration, some of the main methodologies and models that are used in
literature are CAMP, APT, VAR, Johansen maximum likelihood approach, and Engle-Granger
cointegration approach, etc.
Sharpe (1964), Lintner (1965), and Mosin (1966) independently developed one of the most famous financial
equilibrium model called the capital asset pricing model (CAPM). CAPM helped establish the foundation
of the modern portfolio theory. CAPM explains the relationship between the expected return and the risk
of an asset. Buckberg (1995) studied the emerging markets and their cointegration with global financial
markets by using international CAPM. The study used monthly data from 1977 to 1991, for twenty
emerging economies. During the period 1977 to 1984, six markets out of twenty rejected market integration
but from 1984 to 1991 eighteen markets were found to be integrated. This may be due to the capital flow
from developed countries to emerging economies during the 1980s. Najmudin et al. (2007) examined the
international stock market integration for eight stock markets over the period January 2003 to December
2016. The results of the study suggested that China and Philliphens stock markets are integrated. Whereas,
herding behavior is also found in these two markets. Moreover in other markets like Japan, Indonesia,
Malaysia, Uk, Singapore, and Thailand herding behavior was observed in the period of market crisis only.
Arbitrage Pricing Theory (APT) is a general theory of asset pricing, proposed by an economist Stephen
Ross in 1976 (Ross, 1976). APT explains that expected returns on an asset can be predicted as a linear
function of various macro-economic factors. Cho et al. (1986) used “Inter battery factor analysis” to
estimate the cointegration of eleven countries (US, Canada, France, Germany, Netherlands, Switzerland, U
K, Australia, Hong Kong, Singapore & Japan) using APT for the monthly period 1973- 1983. Their findings
showed the absence of any integration among the markets. The cause of rejection of their joint hypothesis
was not determined. Siahaan (2018) used APT to check the integration of Southeast Asian countries. The
results of the study suggest that the Indonesian stock market is mostly dominated and highly integrated with
other markets under consideration.
A VAR model is a set of k explanatory variables over a specific period as a linear combination of only their
past values, VAR model is developed by Chris Sims in 1980. Wang et al. (2003), studied the effects of the
Asian financial crisis on the African markets. They examined both the global and the regional integration
of African stock markets. They used data of daily stock indices closing prices from January 1996 to May
2002. The generalized impulse response function was used by them to estimate the dynamic linkages across
the markets of the US, South Africa, Morocco, Egypt, Nigeria, and Zimbabwe. Their findings showed that
short and long-run interdependence among African markets was limited and the regional integration
between these markets was weakened after the crisis.
According to the Engle-Granger approach developed in 1987, if two series are co-integrated then the linear
combination of two series must be stationary. Engle-Granger is a two-step method. Neaime (2002) used the
Engle-Granger approach to determine the integration of the MENA region and three developed stock
markets in the UK, USA, and France using weekly data up to December 2000. He found that there is strong
cointegration between the MENA region and the developed countries' markets but weak integration among
the MENA region countries (Turkey, Egypt, Morocco, Jordan). Saha and Bhunia (2012) investigated the

International Stock Markets Integration …
28
cointegration of the Indian stock market with leading South Asian countries stock exchanges. The results
of the study suggested that the Indian stock market is integrated with all other stock markets under
consideration for both the short and long term.
Johansen's maximum likelihood approach (1991) named after Soren Johansen provided comprehensive
testing in the presence of multiple cointegration relations. Choudhry (1997) examined the long-run
relationship between six Latin American stock markets and the US. The weekly stock indices from January
1989 to December 1993 were used to study the relationship between these emerging markets and also with
the US stock markets. Unit root tests, cointegration tests, and error correction models were used to examine
the empirical investigation. The findings of the study revealed that due to globalization of the emerging
markets in the 1980s and 1990s there existed a long-run stationary relationship within these emerging
markets and with the US stock markets.
ARDL procedure to cointegration is first introduced by Pesaran in 1997. ARDL is a model for time series
data in which a regression equation is used to predict the current value of a dependent variable say "Yt"
based on both current and lagged values of an independent variable and lagged (past values) of the
dependent variable. By using the ARDL method of cointegration Marashdeh (2005) studied the relationship
among four stock markets of the MENA region namely Turkey, Jordan, Egypt, and Morocco, and stock
markets in three developed countries, Germany, USA, and the UK. The study showed the integration among
four MENA markets but no cointegration among the markets of the MENA region and those developed
countries.
Ceylan and Dogan (2004) investigated the integration of selected eight OIC countries stock exchanges
namely Egypt, Turkey, Jordan, Morocco, Kuwait, Lebanon, Pakistan, and Oman. Their study used Engle-
Granger and Dynamic OLS method for estimation and perform pair-wise analysis. The result of the study
shows that among a total of 28 pair-wise combinations only two pairs are found to be cointegrated.
Moreover, Majid et al. (2007) also included eight countries for their analysis. These countries are Malaysia,
Indonesia, Bangladesh, Pakistan, Turkey, Egypt, Oman, and Kuwait. Their study found that only the stock
market of the Asian region is integrated. Ergun and Hassan (2009) examined four OIC countries Turkey,
Indonesia, Malaysia, and Pakistan, and using the Vector Error Correction Model provided evidence of the
long-run relationship.
3. METHODOLOGY
Monthly price indices of stock markets of countries namely Bangladesh, Egypt, Indonesia, Iran, Malaysia,
Pakistan, Saudi Arabia, and Turkey were used in the proposed study. All stock indices were taken from
international financial statistics from March 1998 to March 2016. Monthly data is chosen in this study
firstly to avoid false correlation problems commonly found in quarterly and annual data, and secondly to
avoid compromising on the available degrees of freedom required in selecting appropriate lag structures.
Whereas daily data was also deemed to contain too much noise and is affected by the day of the week effect.
The monthly observations provide a clear picture.
This study uses ARDL models to find the cointegration of selected OIC countries stock markets and
Augmented Dickey-Fuller (ADF) models for unit root test to check and make sure that the dependent
variable is of I(1) in level and none of the variables is of I(2) or higher order. The study begins with a unit
root test to check that while finding the cointegration between or among the countries' stock market, the
dependent country stock index should be I(1) & none of the independent countries stock markets is of I(2)
or higher order. Following Augmented Dickey-Fuller (ADF) models are used to check the unit root
hypothesis:
Kashmir Economic Review, Volume 29, Issue 1, June 2020
29
𝛥 𝑙𝑛 𝑆𝑡𝑦
= 𝛼1 + 𝛽 𝑙𝑛 𝑆𝑡−1𝑦
+ 𝛿 ∑ 𝛥𝑚𝑖=1 𝑙𝑛 𝑆𝑡−𝑖
𝑦+ 휀𝑡 (1)
𝛥 𝑙𝑛 𝑆𝑡𝑦
= 𝛼1 + 𝛼2𝑡 + 𝛽 𝑙𝑛 𝑆𝑡−1𝑦
+ 𝛿 ∑ 𝛥𝑚𝑖=1 𝑙𝑛 𝑆𝑡−𝑖
𝑦+ 휀𝑡 (2)
Where 𝑙𝑛 𝑆𝑡𝑦
represents the stock market index (in natural logs), 𝛼1 represents the constant term, 𝑡 represents
the trend term 𝛿 ∑ 𝛥𝑙𝑛𝑚∑𝑡−𝑖
𝑦
𝑖=1 represents the autoregressive term included in models to ensure the residual
(휀𝑡) is serially correlated. The hypothesis is:
𝐻0: 𝛽 = 0 non-stationary (unit root)
𝐻1: 𝛽 ≠ 0 Stationary (not unit root)
If a stock index had a unit root (null hypothesis cannot be rejected).
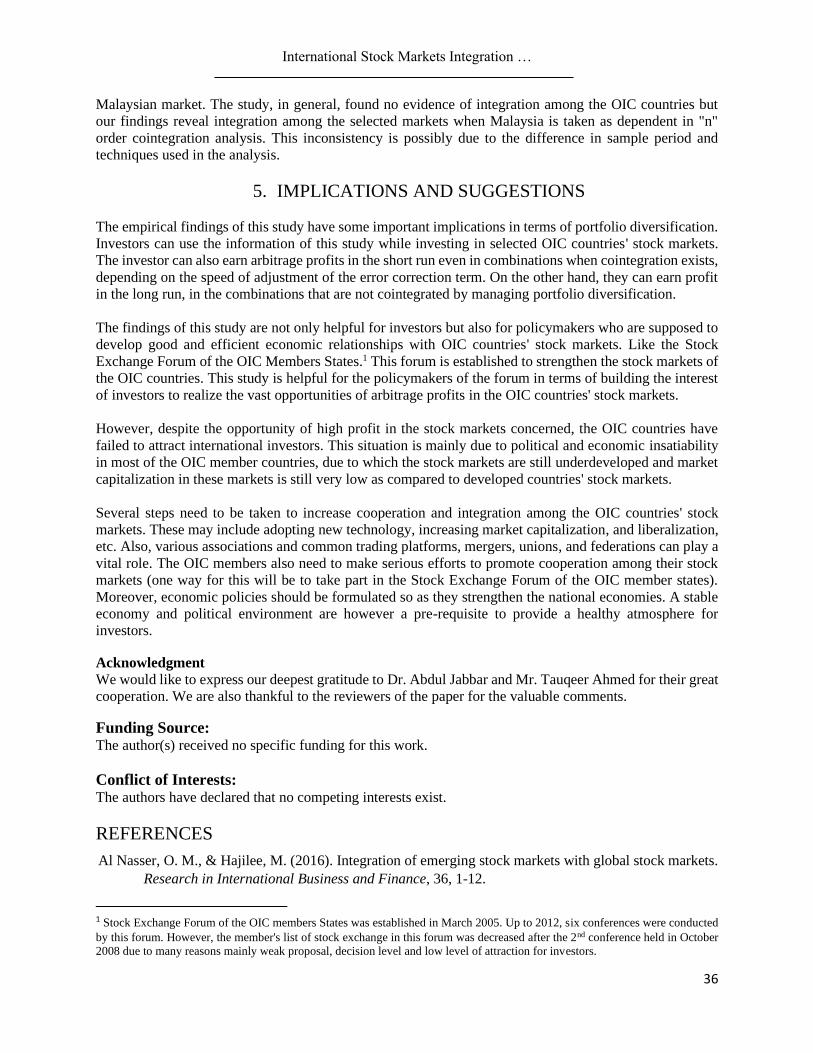
Appendix A shows the result of unit root, all the stock indices become stationary at the first difference in
both models (Intercept only, with Intercept & Trend). From the unit root test, it becomes clear, any stock
index can be taken as the dependent variable while finding cointegration through the ARDL approach
because all stock series are I(1). None of the stock series are I(2) and higher therefore any series can be
taken as the independent variable.
This study uses ARDL models to find the cointegration of selected OIC countries' stock. To examine the
nth order cointegration relationship among the selected OIC countries stock markets, we use a systematic
pattern in which (n-6) to nth order estimations are done through the ARDL method by taking one country
dependent, and its integration is checked against all other countries.3
First of all, the study sees the cointegration relationship taking the combinations of pairs of the selected
OIC countries stock markets. In pairwise cointegration testing total of twenty-eight combinations are
examined in two steps.4 In the first step, F-statistics is computed from the following model which tells stock
markets taken are co-integrated or not by comparing computed F-statistic with the Two sets of asymptotic
critical values are provided by Pesaran and Pesaran for two polar cases. One set assumes that all regressors
are I(1), and the other set assumes that all are I(0). These two sets of critical bounds provide a method of
distributing regressors into I(1) and I(0). If the computed F-statistics is greater than the upper bound critical
value, then we reject the null hypothesis of no cointegration and conclude that there exists a steady-state
equilibrium between the variables. If the computed F-statistics is less than the lower bound critical value,
then we cannot reject the null of no cointegration. If the computed F-statistics falls within the lower and
upper bound critical values, then the result will be considered inconclusive.
𝛥 𝑙𝑛 𝑆𝑡𝑦
= 𝛽0 + 𝛽1 𝑙𝑛 𝑆𝑡−1𝑦
+ 𝛽2 𝑙𝑛 𝑆𝑡−1𝑥 + ∑ 𝛽3𝑖𝛥𝑚1
𝑖=1 𝑙𝑛 𝑆𝑡−𝑖𝑦
+ ∑ 𝛽4𝑖𝛥𝑚2𝑖=0 𝑙𝑛 𝑆𝑡−𝑖
𝑥 + 휀𝑡 (3)
Where 𝑙𝑛 𝑆𝑡𝑦represents the stock index of Y country with natural log, 𝑙𝑛 𝑆𝑡
𝑥 represents the stock index of X
country with a natural log. The hypothesis is:
𝐻0: 𝛽1 = 𝛽2 = 0 (No cointegration)
𝐻1: 𝛽1 ≠ 𝛽2 ≠ 0 (Cointegration)
3 Where n is the number of selected stock markets of OIC countries (Eight countries have been taken by this study). First, see pair-
wise integration (n-6), then among three countries (n-5), and so on up to n.
4 𝑐𝑟𝑛 =
8!
2!(8−2)! = 28 Where n=8 (selected eight OIC countries) and r=2

International Stock Markets Integration …
30
In the second step, we estimate the long-run coefficients of the same equation by applying the ARDL error
correction models for those pairs of stock markets that show cointegration. From the following equation,
we get the residuals that we use in the unrestricted error correction model.
𝑙𝑛 𝑆𝑡𝑦
= 𝛼0 + 𝛼1 𝑙𝑛 𝑆𝑡𝑥 + 휀𝑡 (4)
Unrestricted Error correction Model:
𝛥 𝑙𝑛 𝑆𝑡𝑦
= 𝛽0 + ∑ 𝛽1𝑖𝛥𝑚1𝑖=1 𝑙𝑛 𝑆𝑡−𝑖
𝑦+ ∑ 𝛽2𝑖𝛥𝑚2
𝑖=0 𝑙𝑛 𝑆𝑡−𝑖𝑥 + 𝜆𝐸𝐶𝑡−1 + 𝜂𝑡 (5)
Where 𝜆 represents the speed of adjustment, EC represents the residuals obtained from equation (4)
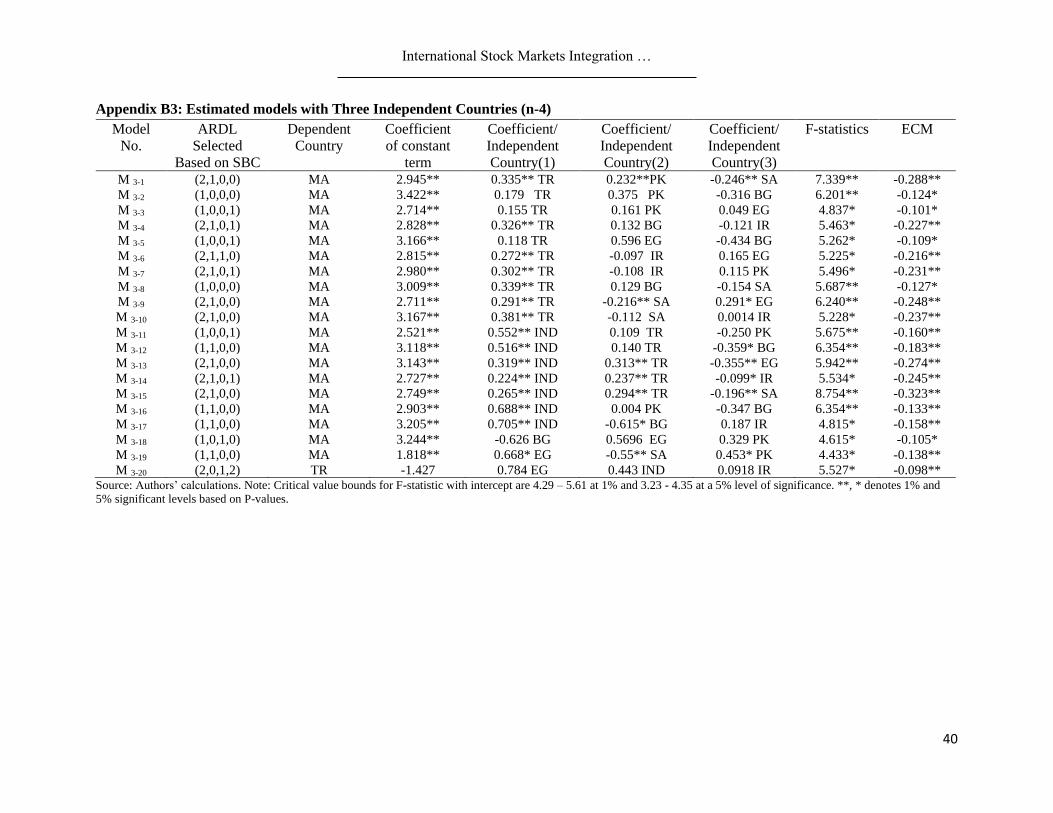
After testing pairwise, the study test cointegration of selected OIC countries stock markets using
combinations of three countries. A total of fifty-six combinations5 run to test cointegration among selected
OIC countries stock markets. Moreover, combinations of four countries are then taken into account and in
this case total, possible combinations are seventy which are checked by the model mentioned above.
Whereas, the same model is also applied to test the cointegration of the combinations of five countries stock
markets with possible combinations of fifty-six. According to the sequence, the combination of six
countries' stock markets with a total of twenty-eight combinations is tested for cointegration. Finally,
considering the last model in the chain, the study takes the combinations of seven countries at a time and
possible combinations are eight.
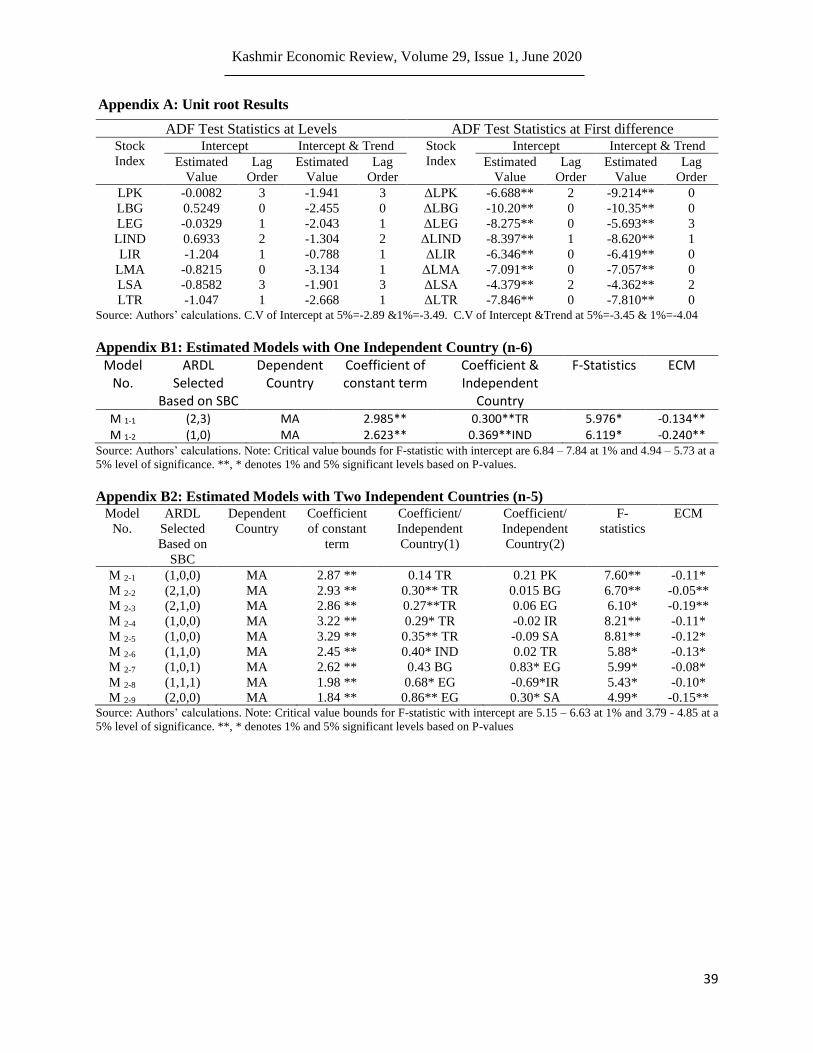
4. DATA AND SUMMARY STATISTICS
The Schwartz Bayesian criterion (SBC) is used to select lags in the models. According to Pesaran and Shin
(1998), SBC is preferable to the Akaike Information Criteria (AIC). We use a maximum of twelve lags
when pair-wise models are estimated to find cointegration, but as the number of regressors increases, the
number of lags decreases. Two levels of significance are used to check cointegration (1% and 5%). Only
those combinations are reported in the Appendix A that shows cointegration.
The results are given in the appendix B. whereas cointegration tests show that there is a systematic pattern
of long-run equilibrium relationship among the stock markets of selected OIC countries. The nth-order co-
integration test was performed and a total of 939 ARDL models were estimated. Results show that Malaysia,
Indonesia, and Turkey are the most important stock markets in the selected group. All the models were
found to be cointegrated with Malaysia, Indonesia, or Turkey stock markets. The results of this study
provide a pattern of beneficial portfolio diversification to investors. This study has tested different
combinations of stock markets in the selected OIC countries and the results are summarized in the following
figures.
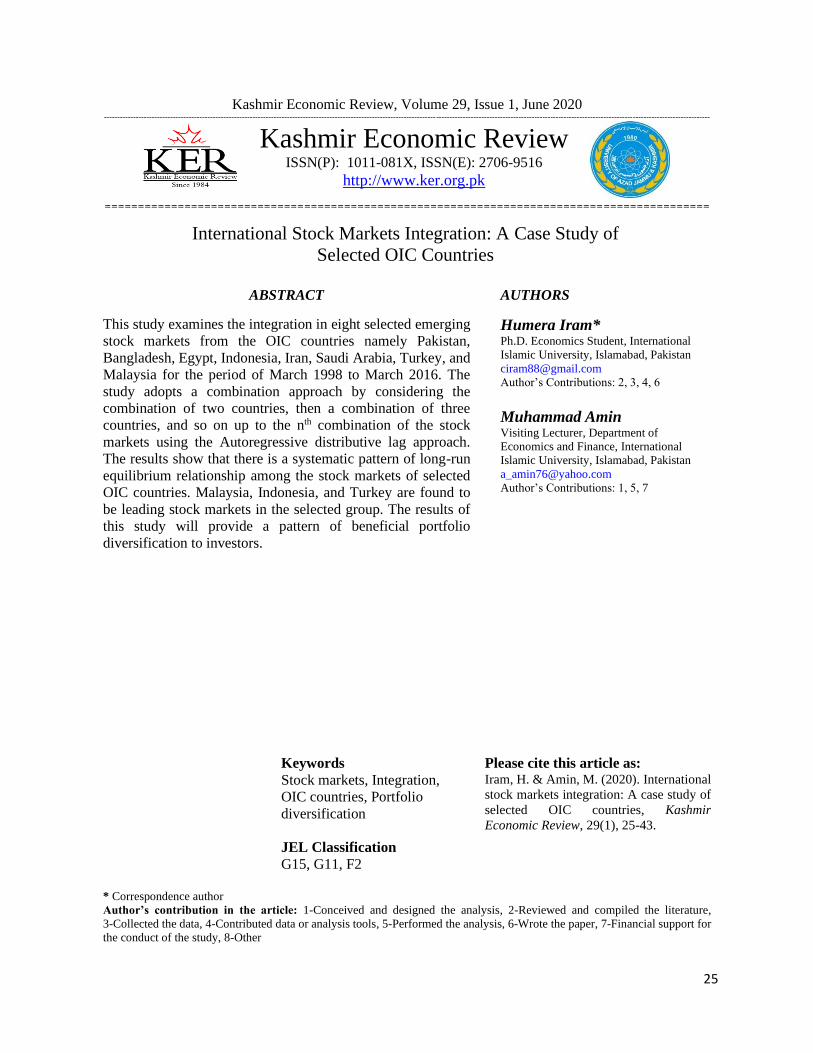
The basic structure of these figures is simple. Each figure has eight rows, the first row of the figures contains
a dependent variable and the remaining seven rows of the figures contain the independent variables. Row
one and two explain the pairwise (n-6) cointegration testing results. Here n is several countries that are 8.
As in figure 1 MA and TR stock market in the pair-wise testing are found to be cointegrated. These results
of pair are helpful for those who want to invest in only two OIC countries' stock markets. The investors can
get long run benefit by investing in any other pair of selected OIC countries expect TR and MA stock
markets but can get short-run arbitrage profit in this combination due to timing difference of opening and
closing of the stock markets.
5 𝑐3
8 = 8!
3!(8−3)! = 56, selected 8 OIC countries stock markets and 3 countries combinations.
Kashmir Economic Review, Volume 29, Issue 1, June 2020
31
Figure 1: Summarized results where dependent Malaysian stock exchange is pair-wise cointegrated with Turkey stock exchange
International Stock Markets Integration …
32
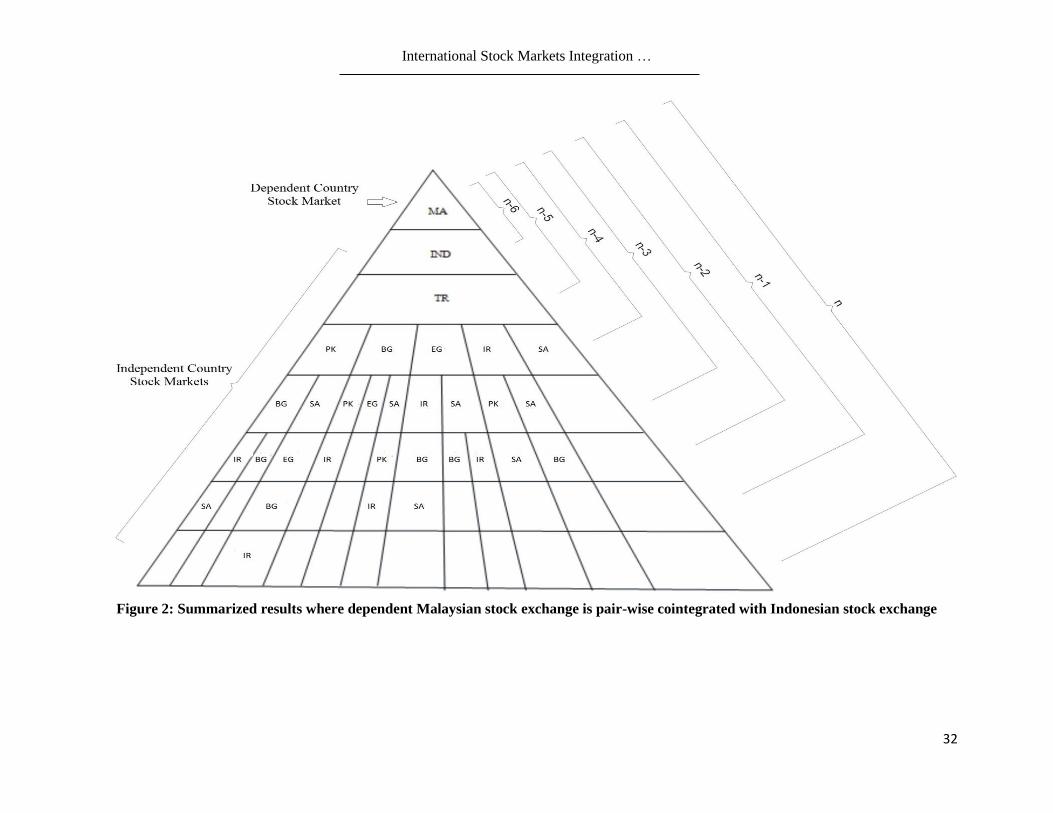
Figure 2: Summarized results where dependent Malaysian stock exchange is pair-wise cointegrated with Indonesian stock exchange
Kashmir Economic Review, Volume 29, Issue 1, June 2020
33
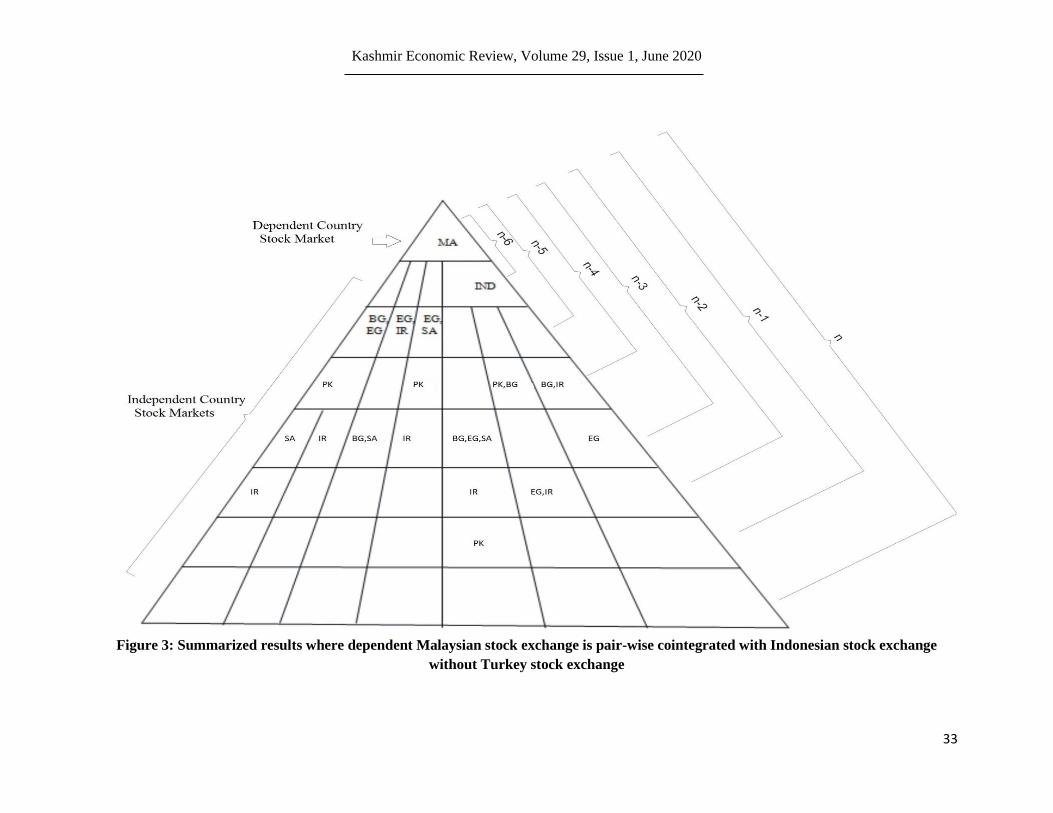
Figure 3: Summarized results where dependent Malaysian stock exchange is pair-wise cointegrated with Indonesian stock exchange
without Turkey stock exchange
International Stock Markets Integration …
34
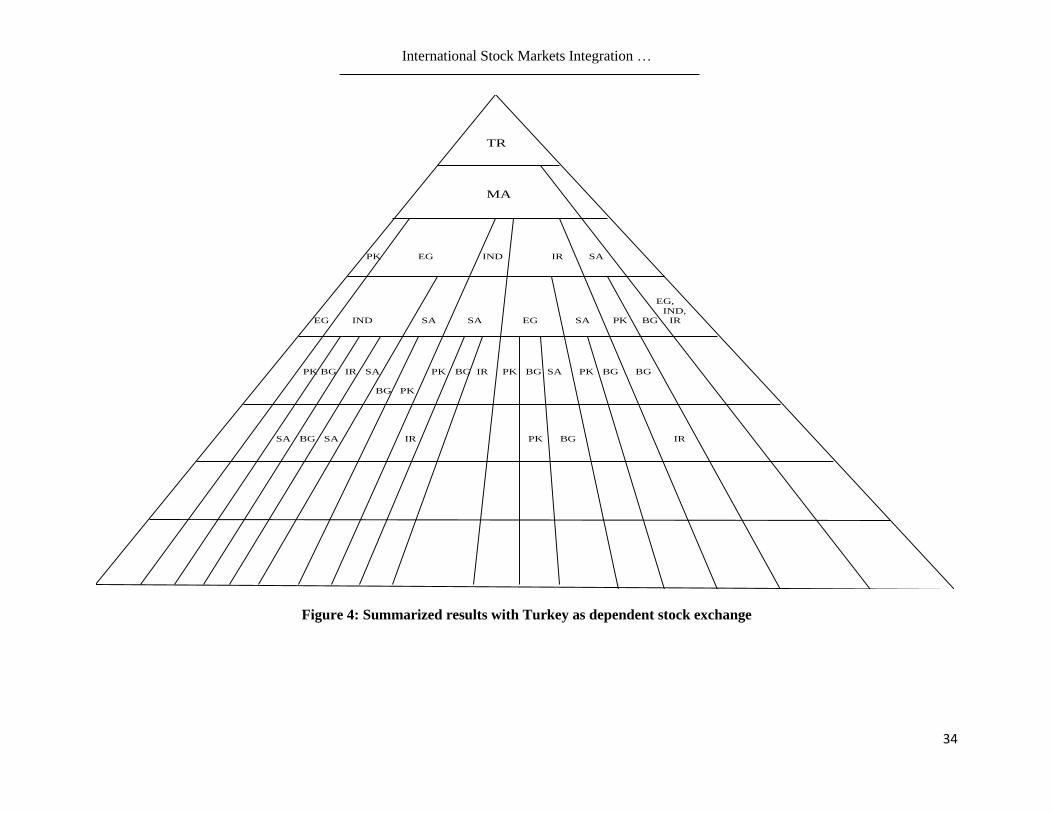
Figure 4: Summarized results with Turkey as dependent stock exchange
TR
MA
PK EG IND IR SA
EG,
IND,
EG IND SA SA EG SA PK BG IR
PK BG IR SA PK BG IR PK BG SA PK BG BG
BG PK
SA BG SA IR PK BG IR
Kashmir Economic Review, Volume 29, Issue 1, June 2020
35
The first three rows of the figures show the cointegration testing results with three countries (n-5) order.
Small boxes in the third rows show the number of combinations of three countries that are found to be
cointegrated. As in Figure 1, five combinations of the three countries are found to be cointegrated. So, the
investors that want to invest in only three OIC stock markets among selected OIC stock markets can obtain
higher profit in long run by managing their portfolio in such a way that at one point in time none of the
above combinations of three countries stock markets will be present in his portfolio.
The (n-4) order cointegration testing results are summarized in the first four rows of the figures. The sub
boxes followed by one box in the previous row, show the combinations of countries remain cointegrated
with the addition of one extra country. As in Figure 1 in (n-5) order MA, TR, and PK stock markets are
found to be cointegrated while in (n-4) order with four countries MA, TR, and PK stock markets remain
cointegrated with one extra stock market of SA. However, a unique combination in any order that doesn't
follow the countries cointegration in the previous order is also possible. As in figure 4, in (n-4) order
cointegration testing, the TR stock market is cointegrated with EG, IND, and IR and followed any previous
combination.
Results of (n-3) cointegration testing are summarized in the first five rows of the figures. The blank boxes
in the rows represent the fact that the previous combination of co-integrated countries is not followed in the
next order. As in Figure 1 in (n-4) order MA, TR, SA, and EG are found to be cointegrated but in (n-3)
order with the combination of MA, TR, SA, and EG, no other countries stock market is found to be
cointegrated so the proceeding box with this combination in row five is blank. Order (n-2) cointegration
testing results are written in the first six rows of the figures. As in Figure 1, four combinations of 6 countries
are found to be cointegrated in (n-2) order cointegration testing.
The first seven rows of the figure show the (n-1) order’s cointegration testing results. These results help
those investors who want to have a share of seven countries stock markets among selected OIC countries
at one point in time in their portfolio. Figure 1 shows that an investor can get arbitrage profit while having
any combination of shares of a combination of MA, TR, PK, EG, IR, SA, and BG.
All eight rows of the figures show the nth order cointegration testing results. In all figures, only one
combination of eight countries is found to be cointegrated that is shown in Figure 2, where the MA stock
market is dependent. Therefore, in all four figures total of 117 combinations of selected OIC countries are
found to be cointegrated among tested 939 combinations. So, 822 combinations from selected OIC
countries provide the opportunity to earn long-run portfolio diversification.
In comparison with other few studies on the topic under consideration, our findings are consistent and some
contradictions with Ugur and Hassan (2009). Their study used 4 OIC countries stock markets for integration
analysis namely Indonesia, Malaysia, Turkey, and Pakistan. The study shows that all stock markets are
cointegrated with each other. Our findings are in contrast with this study in the sense that Turkey stock
market affects all other stock markets and that it is most exogenous in the model. Despite the different
methods and sample sizes used in Ugru et al study, it is found that Turkey stock market has a dominant role
in the selected group of OIC countries as found in our study.
Another study on OIC stock market integration is by Majid et al. (2007). Some results of this study are also
consistent with our study with some conflict as well. The study used 8 OIC stock markets for analysis and
found that stock markets of the Asian region are generally cointegrated but no integration is found between
Bangladesh and Pakistan. These results are consistent with our results. However this study found no
cointegration between Mena regions stock markets but found cointegration between Turkey and Egypt,
these results contradict our findings. Study results show that the Malaysian stock market responded more
to shocks in the Indonesian stock market and this behavior of the Malaysian stock market is also observed
in our study. The results have contradictions with our findings where Bangladesh responded more to the
International Stock Markets Integration …
36
Malaysian market. The study, in general, found no evidence of integration among the OIC countries but
our findings reveal integration among the selected markets when Malaysia is taken as dependent in "n"
order cointegration analysis. This inconsistency is possibly due to the difference in sample period and
techniques used in the analysis.
5. IMPLICATIONS AND SUGGESTIONS
The empirical findings of this study have some important implications in terms of portfolio diversification.
Investors can use the information of this study while investing in selected OIC countries' stock markets.
The investor can also earn arbitrage profits in the short run even in combinations when cointegration exists,
depending on the speed of adjustment of the error correction term. On the other hand, they can earn profit
in the long run, in the combinations that are not cointegrated by managing portfolio diversification.
The findings of this study are not only helpful for investors but also for policymakers who are supposed to
develop good and efficient economic relationships with OIC countries' stock markets. Like the Stock
Exchange Forum of the OIC Members States.1 This forum is established to strengthen the stock markets of
the OIC countries. This study is helpful for the policymakers of the forum in terms of building the interest
of investors to realize the vast opportunities of arbitrage profits in the OIC countries' stock markets.
However, despite the opportunity of high profit in the stock markets concerned, the OIC countries have
failed to attract international investors. This situation is mainly due to political and economic insatiability
in most of the OIC member countries, due to which the stock markets are still underdeveloped and market
capitalization in these markets is still very low as compared to developed countries' stock markets.
Several steps need to be taken to increase cooperation and integration among the OIC countries' stock
markets. These may include adopting new technology, increasing market capitalization, and liberalization,
etc. Also, various associations and common trading platforms, mergers, unions, and federations can play a
vital role. The OIC members also need to make serious efforts to promote cooperation among their stock
markets (one way for this will be to take part in the Stock Exchange Forum of the OIC member states).
Moreover, economic policies should be formulated so as they strengthen the national economies. A stable
economy and political environment are however a pre-requisite to provide a healthy atmosphere for
investors.
Acknowledgment
We would like to express our deepest gratitude to Dr. Abdul Jabbar and Mr. Tauqeer Ahmed for their great
cooperation. We are also thankful to the reviewers of the paper for the valuable comments.
Funding Source: The author(s) received no specific funding for this work.
Conflict of Interests: The authors have declared that no competing interests exist.
REFERENCES
Al Nasser, O. M., & Hajilee, M. (2016). Integration of emerging stock markets with global stock markets.
Research in International Business and Finance, 36, 1-12.
1 Stock Exchange Forum of the OIC members States was established in March 2005. Up to 2012, six conferences were conducted
by this forum. However, the member's list of stock exchange in this forum was decreased after the 2nd conference held in October
2008 due to many reasons mainly weak proposal, decision level and low level of attraction for investors.

Kashmir Economic Review, Volume 29, Issue 1, June 2020
37
Buckberg, E. (1995). Emerging stock markets and international asset pricing. The World Bank
Economic Review, 9(1), 51-74.
Cho, D., Eun C., Cheol, S. & Senbet, L.W. (1986). International arbitrage pricing theory: An empirical
investigation. Journal of Finance, 41, 313-329.
Choudhry, T. (1997). Stochastic trends in stock prices: Evidence from Latin American markets.
Journal of Macroeconomics, 19, 285-304.
Ceylan, N. B. & Dogan, B. (2004). Co-movements of stock markets among selected OIC countries. Journal
of Economic Cooperation among Islamic Countries. 25(3), 47-62.
Ergun, U., & Hassan, S. M. N. A. (2009). Co-movement and linkages of emerging stock markets: A case
study from OIC member countries. Journal of Economic Cooperation and Development, 4(30),
105-119.
Hassan, M. K. (2003). Portfolio investment of the OIC countries and their implication on trade. Managerial
Finance, 29(2/3), 122-157.
Horvath, R., & Petrovski, D. (2013). International stock market integration: Central and South-Eastern
Europe compared. Economic Systems, 37(1), 81-91.
Kose, M. A., Prasad, E., Rogoff, K., & Wei, S. J. (2009). Financial globalization: a reappraisal. IMF
Staff Papers, 56(1), 8-62.
Levine, R. (1997). Financial development and economic growth: views and agenda. Journal of
Economic Literature. 35 (2): 688–725.
Majid, M., Yusof, R. M., & Razal, A. N. (2007). Dynamic financial linkages among selected OIC
countries. Journal of Economic Cooperation among Islamic Countries, 28(2).
Majid, M. S. A., & Kassim, S. H. (2010). Potential diversification benefits across global Islamic equity
markets. Journal of Economic Cooperation and Development, 31(4), 103-126.
Marashdeh, O. (1994). International Financial Market Integration: An Examination of Six Stock
Markets. Journal Pengurusan, 13, 89-100.
Mosin, J. (1966). Equilibrium in a capital asset market. Econometrica, 34, 768-783.
Mukherjee, K., & Mishra, R. K. (2010). Stock market integration and volatility spillover: India and its
major Asian counterparts. Research in International Business and Finance, 24(2), 235-251
Narayan, S., Sriananthakumar, S., & Islam, S. Z. (2014). Stock market integration of emerging Asian
economies: Patterns and causes. Economic Modelling, 39, 19-31.
Najmudin, S., Wahyudi, S., & Muharam, H. (2017). Applying an international CAPM to herding behaviour
model for integrated stock markets. Journal of International Studies, 10(4).
Neaime, S. (2002). Liberalization and financial integration of MENA stock markets. In A paper
presented at the ERF’s 9th annual conference on Finance and Banking.
Nurrachmi, R. (2018). Movements of Islamic stock indices in selected OIC countries. Al-
Muzara'ah, 6(2), 77-90.
Pesaran, H. M., & Shin, Y. (1998). An Autoregressive Distributed Lag Modeling approach to
cointegration analysis, In S. Storm, Ed., Econometrics and Economic Theory in the 20` Century:
The Ragnar Frisch Centennial Symposium, Cambridge University Press.
Rizvi, S. A. R., & Arshad, S. (2017). Analysis of the efficiency–integration nexus of Japanese stock
market. Physica A: Statistical Mechanics and its Applications, 470, 296-308.
Ross, S. (1976). The arbitrage theory of capital asset pricing. Journal of Economic Theory, 13, 341-360.
Saha, M., & Bhunia, A. (2012). Financial market integration of South Asian countries. Developing
Country Studies, 2(1), 45-52.
Siahaan, A. P. U. (2018). Multifactor APT approach towards predicted patterns of long-term ASEAN
financial market integration. https://osf.io/preprints/inarxiv/a6hr2/

International Stock Markets Integration …
38
Teulon, F., Guesmi, K., & Mankai, S. (2014). Regional stock market integration in Singapore: A
multivariate analysis. Economic modeling, 43, 217-224.
Ugur, E. & Hassan, A. S. M. N. (2009). Co-movements and linkages of emerging stock markets: A case
study from OIC member countries. Journal of Economic Cooperation & Development, 30, 105-
120.
Wang, Z., Yang, J., & Bessler, A. (2003). Financial crisis and African stock market integration. Applied
Economics Letters, 10, 527-533.
Kashmir Economic Review, Volume 29, Issue 1, June 2020
39
Appendix A: Unit root Results
Source: Authors’ calculations. C.V of Intercept at 5%=-2.89 &1%=-3.49. C.V of Intercept &Trend at 5%=-3.45 & 1%=-4.04
Appendix B1: Estimated Models with One Independent Country (n-6)
Model No.
ARDL Selected
Based on SBC
Dependent Country
Coefficient of constant term
Coefficient & Independent
Country
F-Statistics ECM
M 1-1 (2,3) MA 2.985** 0.300**TR 5.976* -0.134** M 1-2 (1,0) MA 2.623** 0.369**IND 6.119* -0.240**
Source: Authors’ calculations. Note: Critical value bounds for F-statistic with intercept are 6.84 – 7.84 at 1% and 4.94 – 5.73 at a
5% level of significance. **, * denotes 1% and 5% significant levels based on P-values.
Appendix B2: Estimated Models with Two Independent Countries (n-5) Model
No.
ARDL
Selected
Based on
SBC
Dependent
Country
Coefficient
of constant
term
Coefficient/
Independent
Country(1)
Coefficient/
Independent
Country(2)
F-
statistics
ECM
M 2-1 (1,0,0) MA 2.87 ** 0.14 TR 0.21 PK 7.60** -0.11*
M 2-2 (2,1,0) MA 2.93 ** 0.30** TR 0.015 BG 6.70** -0.05**
M 2-3 (2,1,0) MA 2.86 ** 0.27**TR 0.06 EG 6.10* -0.19**
M 2-4 (1,0,0) MA 3.22 ** 0.29* TR -0.02 IR 8.21** -0.11*
M 2-5 (1,0,0) MA 3.29 ** 0.35** TR -0.09 SA 8.81** -0.12*
M 2-6 (1,1,0) MA 2.45 ** 0.40* IND 0.02 TR 5.88* -0.13*
M 2-7 (1,0,1) MA 2.62 ** 0.43 BG 0.83* EG 5.99* -0.08*
M 2-8 (1,1,1) MA 1.98 ** 0.68* EG -0.69*IR 5.43* -0.10*
M 2-9 (2,0,0) MA 1.84 ** 0.86** EG 0.30* SA 4.99* -0.15** Source: Authors’ calculations. Note: Critical value bounds for F-statistic with intercept are 5.15 – 6.63 at 1% and 3.79 - 4.85 at a
5% level of significance. **, * denotes 1% and 5% significant levels based on P-values
ADF Test Statistics at Levels ADF Test Statistics at First difference Stock
Index
Intercept Intercept & Trend Stock
Index
Intercept Intercept & Trend
Estimated
Value
Lag
Order
Estimated
Value
Lag
Order
Estimated
Value
Lag
Order
Estimated
Value
Lag
Order
LPK -0.0082 3 -1.941 3 ΔLPK -6.688** 2 -9.214** 0
LBG 0.5249 0 -2.455 0 ΔLBG -10.20** 0 -10.35** 0
LEG -0.0329 1 -2.043 1 ΔLEG -8.275** 0 -5.693** 3
LIND 0.6933 2 -1.304 2 ΔLIND -8.397** 1 -8.620** 1
LIR -1.204 1 -0.788 1 ΔLIR -6.346** 0 -6.419** 0
LMA -0.8215 0 -3.134 1 ΔLMA -7.091** 0 -7.057** 0
LSA -0.8582 3 -1.901 3 ΔLSA -4.379** 2 -4.362** 2
LTR -1.047 1 -2.668 1 ΔLTR -7.846** 0 -7.810** 0
International Stock Markets Integration …
40
Appendix B3: Estimated models with Three Independent Countries (n-4)
Model
No.
ARDL
Selected
Based on SBC
Dependent
Country
Coefficient
of constant
term
Coefficient/
Independent
Country(1)
Coefficient/
Independent
Country(2)
Coefficient/
Independent
Country(3)
F-statistics ECM
M 3-1 (2,1,0,0) MA 2.945** 0.335** TR 0.232**PK -0.246** SA 7.339** -0.288**
M 3-2 (1,0,0,0) MA 3.422** 0.179 TR 0.375 PK -0.316 BG 6.201** -0.124*
M 3-3 (1,0,0,1) MA 2.714** 0.155 TR 0.161 PK 0.049 EG 4.837* -0.101*
M 3-4 (2,1,0,1) MA 2.828** 0.326** TR 0.132 BG -0.121 IR 5.463* -0.227**
M 3-5 (1,0,0,1) MA 3.166** 0.118 TR 0.596 EG -0.434 BG 5.262* -0.109*
M 3-6 (2,1,1,0) MA 2.815** 0.272** TR -0.097 IR 0.165 EG 5.225* -0.216**
M 3-7 (2,1,0,1) MA 2.980** 0.302** TR -0.108 IR 0.115 PK 5.496* -0.231**
M 3-8 (1,0,0,0) MA 3.009** 0.339** TR 0.129 BG -0.154 SA 5.687** -0.127*
M 3-9 (2,1,0,0) MA 2.711** 0.291** TR -0.216** SA 0.291* EG 6.240** -0.248**
M 3-10 (2,1,0,0) MA 3.167** 0.381** TR -0.112 SA 0.0014 IR 5.228* -0.237**
M 3-11 (1,0,0,1) MA 2.521** 0.552** IND 0.109 TR -0.250 PK 5.675** -0.160**
M 3-12 (1,1,0,0) MA 3.118** 0.516** IND 0.140 TR -0.359* BG 6.354** -0.183**
M 3-13 (2,1,0,0) MA 3.143** 0.319** IND 0.313** TR -0.355** EG 5.942** -0.274**
M 3-14 (2,1,0,1) MA 2.727** 0.224** IND 0.237** TR -0.099* IR 5.534* -0.245**
M 3-15 (2,1,0,0) MA 2.749** 0.265** IND 0.294** TR -0.196** SA 8.754** -0.323**
M 3-16 (1,1,0,0) MA 2.903** 0.688** IND 0.004 PK -0.347 BG 6.354** -0.133**
M 3-17 (1,1,0,0) MA 3.205** 0.705** IND -0.615* BG 0.187 IR 4.815* -0.158**
M 3-18 (1,0,1,0) MA 3.244** -0.626 BG 0.5696 EG 0.329 PK 4.615* -0.105*
M 3-19 (1,1,0,0) MA 1.818** 0.668* EG -0.55** SA 0.453* PK 4.433* -0.138**
M 3-20 (2,0,1,2) TR -1.427 0.784 EG 0.443 IND 0.0918 IR 5.527* -0.098** Source: Authors’ calculations. Note: Critical value bounds for F-statistic with intercept are 4.29 – 5.61 at 1% and 3.23 - 4.35 at a 5% level of significance. **, * denotes 1% and
5% significant levels based on P-values.

Kashmir Economic Review, Volume 29, Issue 1, June 2020
41
Appendix B4: Estimated models with Four Independent Countries (n-3)
Source: Authors’ calculations. Note: Critical value bounds for F-statistic with intercept are 3.74 - 5.06 at 1% and 2.86 - 4.01 at 5% level of significance. **, * denotes 1% and 5%
significant levels based on P-values.
Model
No.
ARDL
Selected
Based on
SBC
Dependent
Country
Coefficient
of constant
term
Coefficient/
Independent
Country(1)
Coefficient/
Independent
Country(2)
Coefficient/
Independent
Country(3)
Coefficient/
Independent
Country(4)
F-statistics ECM
M 4-1 (1,0,1,0,0) MA 2.472** 0.235*TR 0.380*PK -0.457**SA 0.268 EG 8.129** -0.202**
M 4-2 (1,0,0,0,1) MA 3.388** 0.116 TR 0.129 PK -0.521 BG 0.353 EG 5.552** -0.121*
M 4-3 (1,0,0,0,0) MA 2.877** 0.274**TR 0.472*PK -0.044 BG -0.350*SA 7.383** -0.187**
M 4-4 (1,0,1,0,1) MA 2.567** 0.172 TR 0.239 PK 0.185 EG -0.199 IR 5.634** -0.132*
M 4-5 (1,0,0,0,0) MA 3.023** 0.336*TR 0.117 BG 0.019 IR -0.162 SA 5.751** -0.125*
M 4-6 (1,0,0,0,0) MA 3.353** 0.195 TR -0.261 BG -0.049 IR 0.369 PK 5.850** -0.130*
M 4-7 (1,0,0,1,0) MA 2.538** 0.190 TR 0.695 EG -0.147 BG -0.326 SA 7.202** -0.143**
M 4-8 (1,0,1,0,0) MA 3.177** 0.112 TR 0.606 EG -0.449 BG 0.010 IR 5.860** -0.108*
M 4-9 (1,0,0,1,0) MA 2.355** 0.201 TR 0.035 IR 0.953 EG -0.385 SA 6.293** -0.146**
M 4-10 (1,0,0,0,0) MA 2.799** 0.274**TR -0.361*SA -0.005 IR 0.457**PK 6.729** -0.189**
M 4-11 (1,0,0,0,1) MA 2.920** 0.571**IND 0.235*TR -0.139 PK -0.339 EG 5.937** -0.201**
M 4-12 (1,1,0,0,0) MA 2.556** 0.407**IND 0.207**TR 0.035 PK -0.240*SA 7.303** -0.223**
M 4-13 (1,1,0,0,0) MA 3.05** 0.549**IND 0.154 TR -0.315 BG -0.079 PK 6.391** -0.189**
M 4-14 (1,1,0,0,0) MA 3.179** 0.533**IND 0.196 TR -0.275 BG -0.171 EG 6.691** -0.199**
M 4-15 (1,1,0,0,0) MA 2.851** 0.474**IND 0.205**TR -0.177 BG -0.151 SA 7.853** -0.224**
M 4-16 (1,1,0,0,0) MA 2.995** 0.504**IND 0.232*TR -0.411 EG -0.011 IR 6.077** -0.190**
M 4-17 (1,1,0,1,0) MA 2.735** 0.448**IND 0.269**TR -0.147 EG -0.203* SA 6.380** -0.260**
M 4-18 (1,0,0,1,0) MA 2.518** 0.554*IND 0.107 TR 0.002 IR -0.253 PK 5.694** -0.160**
M 4-19 (1,1,0,0,0) MA 2.464** 0.449**IND 0.185* TR 0.0708 IR -0.280* SA 7.124** -0.228**
M 4-20 (1,1,0,0,0) MA 2.624** 0.579**IND -0.334 BG 0.290 EG -0.131 SA 4.813* -0.147**
M 4-21 (1,1,0,0,0) MA 3.209** 0.7133**IND -0.612*BG 0.191 IR -0.017 EG 4.554* -0.158**
M 4-22 (1,0,0,1,0) MA 2.290** 0.503* PK -0.338 BG 0.794**EG -0.483* SA 5.044* -0.143**
M 4-23 (1,0,0,1,0) MA 3.260** 0.327 PK -0.635 BG 0.568 EG 0.008 IR 4.221* -0.105*
M 4-24 (1,0,1,0,0) MA 2.309** -0.398 BG 1.133**EG 0.164 IR -0.442 SA 4.296* -0.112**
M 4-25 (1,0,1,0,0) MA 1.803** 0.659*EG 0.053 IR 0.445 PK -0.591*SA 4.106* -0.138**

International Stock Markets Integration …
42
Appendix B5: Estimated models with Five Independent Countries (n-2) Model
No.
ARDL
Selected
Based on
SBC
Dependent
Country
Coefficient
of constant
term
Coefficient/
Independent
Country(1)
Coefficient/
Independent
Country(2)
Coefficient/
Independent
Country(3)
Coefficient/
Independent
Country(4)
Coefficient/
Independent
Country(5)
F-statistics
ECM
M 5-1 (1,0,0,0,0,1) MA 2.656** 0.21 TR 0.414* PK -0.182 BG -0.428**SA 0.379 EG 6.807** -0.198**
M 5-2 (1,0,0,1,0,0) MA 3.351** 0.138 TR 0.292 PK 0.318 EG -0.036 IR -0.464 BG 4.979** -0.125*
M 5-3 (1,0,0,1,0,0) MA 2.479** 0.237* TR 0.380* PK 0.266 EG -0.006 IR -0.452**SA 6.282** -0.203**
M 5-4 (1,0,0,0,0,0) MA 2.880** 0.273** TR -0.048 BG 0.004 IR -0.353*SA 0.473*PK 5.734** -0.186**
M 5-5 (1,1,0,0,0,0) MA 2.897** 0.618** IND 0.224* TR -0.185 PK -0.372 EG -0.045 IR 5.546** -0.202**
M 5-6 (1,1,0,0,0,0) MA 3.021** 0.559** IND 0.202* TR -0.066 PK -0.157 EG -0.245 BG 5.814** -0.204**
M 5-7 (1,1,0,0,1,0) MA 2.732** 0.435** IND 0.269** TR 0.023 PK -0.214*SA -0.145 EG 6.154** -0.260**
M 5-8 (1,1,0,0,0,0) MA 3.116** 0.735** IND 0.085 TR -0.501* BG -0.217 PK 0.188 IR 5.642** -0.196**
M 5-9 (1,1,0,0,0,0) MA 2.853** 0.446** IND 0.205** TR -0.18 BG -0.173 SA 0.052 PK 6.388** -0.225**
M 5-10 (1,1,0,0,0,0) MA 3.293** 0.617** IND 0.143 TR -0.190 EG 0.122 IR -0.435 BG 5.752** -0.197**
M 5-11 (1,1,0,1,0,0) MA 2.907** 0.473** IND 0.248** TR -0.064 EG -0.162 SA -0.160 BG 6.577** -0.256**
M 5-12 (1,1,0,0,0,0) MA 2.461** 0.459** IND 0.184* TR 0.073 IR -0.016 PK -0.275*SA 5.839** -0.227**
M 5-13 (1,1,0,0,0,0) MA 2.881** 0.569** IND 0.152* TR 0.166 IR -0.217*SA -0.330 BG 6.363** -0.241**
M 5-14 (1,0,0,1,0,0) MA 2.636** 0.697** IND -0.527** BG 0.223 EG -0.284**SA 0.279**IR 4.750** -0.232**
M 5-15 (1,1,0,0,0,0) MA 3.075** 0.849** IND -0235 PK -0.585* BG 0.015 EG 0.254*IR 4.192* -0.169**
M 5-16 (1,0,1,0,0,0) MA 2.380** -0.430 BG 0.807** EG 0.497* PK -0.549*SA 0.128 IR 3.994* -0.145**
M 5-17 (1,1,0,0,0,0) MA 2.609** -0.176 EG 0.488** IND 0.085 IR -0.260 SA 0.252**TR 7.404** -0.323**
M 5-18 (1,0,1,0,0,0) MA 2.527** -0.247 BG -0.800 EG 0.096 IR -0.384 SA 0.146 TR 5.251** -0.135* Source: Authors’ calculations. Note: Critical value bounds for F-statistic with intercept are 3.41 - 4.68 at 1% and 2.62 – 3.79 at 5% level of significance. **,* denotes 1% and 5%
significant levels based on P-values.

Kashmir Economic Review, Volume 29, Issue 1, June 2020
43
Appendix B6: Estimated models with Five Independent Countries (n-1) Model
No.
ARDL
Selected
Based on
SBC
Dependent
Country
Coefficient
of constant
term
Coefficient/
Independent
Country(1)
Coefficient/
Independent
Country(2)
Coefficient/
Independent
Country(3)
Coefficient/
Independent
Country(4)
Coefficient/
Independent
Country(5)
Coefficient/
Independent
Country(6)
F-
statistics
ECM
M 6-1 (1,1,0,0,1,0,0) MA 2.658** 0.190 TR 0.421*PK 0.424 EG 0.045 IR 0.457**SA -0.23 BG 5.372** -0.192**
M 6-2 (1,0,1,0,0,0,0) MA 2.609** 0.524**IND 0.251**TR -0.057 PK -0.184 EG -0.095 IR -0.240** SA 4.241* -0.321**
M 6-3 (1,1,0,1,0,0,0) MA 2.905** 0.449**IND 0.247**TR 0.043 PK -0.180 SA -0.058 EG -0.165 BG 5.530** -0.257**
M 6-4 (1,1,0,0,0,0,0) MA 3.152** 0.762**IND 0.170*TR -0.411**BG -0.238 PK 0.189*IR -0.195 EG 5.970** -0.276**
M 6-5 (1,0,0,0,1,0,1) MA 2.880** 0.608**IND 0.147 TR -0.338 BG -0.198 SA -0.058 PK 0.179 IR 5.401** -0.241**
M 6-6 (1,0,0,1,0,0,0) MA 2.862** 0.567**IND 0.192**TR -0.044 EG 0.168*IR -0.305*BG -0.237**SA 6.784** -0.318**
M 6-7 (1,0,1,0,0,0,0) MA 2.657** 0.784**IND -0.534**BG 0.201 EG -0.234 SA 0.304**IR -0.139 PK 4.485** -0.33**
Source: Authors’ calculations. Note: Critical value bounds for F-statistic with intercept are 2.45 – 3.61 at 5% and 3.15 - 4.43 at 1% level of significance. **,* denotes 1% and 5%
significant levels based on P-values
Appendix B7: Estimated models with Seven Independent Countries (n) Model
No.
ARDL
Selected
Based on
SBC
Dependent
Country
Coefficient
of constant
term
Coefficient/ Independent Country F-statistics
ECM
(1) (2) (3) (4) (5) (6) (7)
M 7-1 (1,0,1,0,0,0,
0,0)
MA 2.869** 0.621** IND 0.188** TR -0.081 PK -0.209* SA -0.051 EG -0.314 BG 0.185 IR 6.382** -0.316**
Source: Authors’ calculations. Note: Critical value bounds for F-statistic with intercept are 2.96 – 4.26 at 1% and 2.32 - 3.50 at a 5% level of significance. **, * denotes 1% and 5%
significant levels based on P-values.