Embed Size (px)
Citation preview

Karowe Diamond Mine Botswana NI 43-101 Independent Technical Report (Amended)* Prepared on Behalf of
Lucara Diamond Corp. Suite 2000 885 West Georgia Street Vancouver, BC Canada V6C 3E8
Prepared By:
Effective Date: 31 December 2013 Report Date: Revision 01 4 February 2014 *This report has been amended due to a transcription error identified in Table 14-20 in which the average values of diamonds in the 3-6 Gr and 8-10 Gr size categories were misstated. This error has been corrected.
Michael Lynn Dr Tom Nowicki Michael Valenta Beric Robinson Mark Gallagher Robin Bolton John Sexton
PrSciNat, FGSSA P.Geo P.Eng (Int) FSAIMM P.Eng P.Eng PrSciNat QV

Table of Contents
1 SUMMARY ....................................................................................................................... 10
1.1 Introduction ........................................................................................................................................................... 10
1.2 Property Location and Description ............................................................................................................... 10
1.3 Geology ................................................................................................................................................................... 12
1.4 Mineral Resources ............................................................................................................................................... 14
1.5 Mineral Reserves .................................................................................................................................................. 15
1.6 Plant Upgrades ..................................................................................................................................................... 17
1.7 Conclusions and Recommendations ........................................................................................................... 18
1.7.1 Risks ............................................................................................................................................................. 18
1.7.2 Recommendations ................................................................................................................................. 20
2 INTRODUCTION .............................................................................................................. 21
2.1 Scope of Work ...................................................................................................................................................... 21
2.2 Previous Technical Reports .............................................................................................................................. 21
2.3 Qualified Persons and Site Visits ................................................................................................................... 21
2.4 Principal Sources of Information ................................................................................................................... 23
3 RELIANCE ON OTHER EXPERTS ..................................................................................... 24
4 PROPERTY DESCRIPTION AND LOCATION .................................................................. 24
4.1 Overview of Botswana ....................................................................................................................................... 24
4.1.1 Types of Mineral Licence in Botswana ........................................................................................... 24
4.1.2 Fiscal Regime in Botswana .................................................................................................................. 25
4.2 Issuer’s Title, Location and Demarcation of Mining Licence .............................................................. 25
4.3 Permitting Rights and Agreements Relating to the Karowe Mine ................................................... 28
4.3.1 Surface Rights .......................................................................................................................................... 28
4.3.2 Taxes and Royalties ............................................................................................................................... 28
4.3.3 Obligations ................................................................................................................................................ 28
4.3.4 Environmental Liabilities ...................................................................................................................... 29
4.3.5 Permits ........................................................................................................................................................ 29
4.3.6 Legal Challenge ....................................................................................................................................... 29
5 ACCESSIBILITY, CLIMATE, LOCAL RESOURCES, INFRASTRUCTURE AND PHYSIOGRAPHY .............................................................................................................. 30
5.1 Accessibility ............................................................................................................................................................ 30
5.2 Access ....................................................................................................................................................................... 30
5.3 Climate ..................................................................................................................................................................... 30
5.4 Infrastructure and Local Resources .............................................................................................................. 31
NI 43-101 Technical Report on the Karowe Mine (Amended) – February 4 2014 Page: II

6 HISTORY ........................................................................................................................... 32
6.1 Early Work: De Beers Prospecting Botswana (Pty) Ltd and De Beers Botswana Mining Company (Pty) Ltd. .............................................................................................................................................. 32
6.2 Debswana Diamond Company (Pty) Ltd, PL17/86 ................................................................................. 32
6.3 De Beers Prospecting Botswana (Pty) Ltd, PL1/97 ................................................................................. 33
6.4 De Beers Prospecting Botswana (Pty) Ltd, PL13/2000 .......................................................................... 33
6.5 The Boteti Joint Venture ................................................................................................................................... 33
6.6 Boteti Exploration (Pty) Ltd and Boteti Mining (Pty) Ltd ...................................................................... 33
7 GEOLOGICAL SETTING AND MINERALIZATION .......................................................... 35
7.1 Local and Regional Geology ........................................................................................................................... 35
7.2 Property Geology ................................................................................................................................................ 37
7.3 Kimberlite Geology ............................................................................................................................................. 37
7.3.1 Calcretised kimberlite (CKIMB).......................................................................................................... 40
7.3.2 Weathered kimberlite (WK) ................................................................................................................ 40
7.3.3 Basalt breccia (BBX/KBBX) ................................................................................................................... 41
7.3.4 North Lobe kimberlite units ............................................................................................................... 41
7.3.5 Centre Lobe kimberlite units .............................................................................................................. 41
7.3.6 South Lobe kimberlite units ............................................................................................................... 42
8 DEPOSIT TYPES ................................................................................................................ 44
9 EXPLORATION ................................................................................................................. 46
9.1 Exploration approach and methodology ................................................................................................... 46
9.2 Geophysical Surveys ........................................................................................................................................... 47
10 DRILLING .......................................................................................................................... 49
11 SAMPLE PREPARATION, ANALYSES AND SECURITY .................................................. 51
11.1 Reverse Circulation, 12¼" Drilling ................................................................................................................ 51
11.2 Reverse Flood, 12¼" Drilling .......................................................................................................................... 51
11.3 Trench Samples .................................................................................................................................................... 52
11.4 Diamond Recovery .............................................................................................................................................. 52
12 DATA VERIFICATION ...................................................................................................... 54
12.1 Basis for geology model ................................................................................................................................... 54
12.2 Drill core logs ........................................................................................................................................................ 55
12.3 Internal dilution .................................................................................................................................................... 55
12.4 Geological Model ................................................................................................................................................ 55
12.5 Bulk density data ................................................................................................................................................. 56
12.6 LDD grade data .................................................................................................................................................... 56
12.7 Production data .................................................................................................................................................... 56
NI 43-101 Technical Report on the Karowe Mine (Amended) – February 4 2014 Page: III

12.7.1 Grade control data ................................................................................................................................. 56
12.7.2 Process data.............................................................................................................................................. 57
12.7.3 Diamond data .......................................................................................................................................... 57
13 MINERAL PROCESSING AND METALLURGICAL TESTING ........................................... 57
13.1 Current Mill Operation ...................................................................................................................................... 58
13.2 Comminution Teswork ...................................................................................................................................... 58
13.3 XRT Testwork ......................................................................................................................................................... 59
13.4 Diamond Breakage Analysis ............................................................................................................................ 60
13.5 Comment by the Qualified Person ............................................................................................................... 60
14 MINERAL RESOURCE ESTIMATE .................................................................................... 61
14.1 Geological Modelling ......................................................................................................................................... 62
14.1.1 Geology model update and volume estimates .......................................................................... 62
14.1.2 Geological Continuity ........................................................................................................................... 67
14.1.3 Confidence level of geological model ........................................................................................... 69
14.1.4 Block Model .............................................................................................................................................. 70
14.2 Bulk density and tonnage ................................................................................................................................ 71
14.2.1 Bulk density data .................................................................................................................................... 71
14.2.2 Bulk density estimation approach ................................................................................................... 73
14.2.3 Confidence level of bulk density / tonnage model................................................................... 75
14.3 Diamond Grade .................................................................................................................................................... 78
14.3.1 LDD sample data .................................................................................................................................... 78
14.3.2 Grade estimation approach ................................................................................................................ 80
14.3.3 Adjustment for recoverable grade .................................................................................................. 84
14.3.4 Confidence level of grade estimates .............................................................................................. 88
14.4 Size Frequency Distribution (SFD) ................................................................................................................. 88
14.4.1 Production and basis for definition of SFD .................................................................................. 88
14.4.2 Size Frequency Distribution................................................................................................................ 91
14.4.3 SFD continuity .......................................................................................................................................... 94
14.5 Diamond Value ..................................................................................................................................................... 96
14.5.1 Sales data ................................................................................................................................................... 96
14.5.2 Value estimates by size class and kimberlite lobe .................................................................... 98
14.5.3 Final values used for estimation ..................................................................................................... 100
14.5.4 Confidence level of average diamond value estimates and comparison with previous estimates .................................................................................................................................................. 101
14.5.5 Estimates of stockpile Mineral Resources................................................................................... 102
14.6 Mineral Resource statement ......................................................................................................................... 103
15 MINERAL RESERVE ESTIMATE ..................................................................................... 105 NI 43-101 Technical Report on the Karowe Mine (Amended) – February 4 2014 Page: IV

15.1 Key Assumptions and basis of Estimate ................................................................................................... 105
15.2 Mineral Reserve Statement ............................................................................................................................ 106
16 MINING METHODS ....................................................................................................... 107
16.1 Geotechnical and Hydrogeological Aspects and Pit Slope ............................................................... 107
16.1.1 Pit Slope Angle Review ...................................................................................................................... 107
16.2 Geotechnical Model ......................................................................................................................................... 111
16.2.1 Structural Model ................................................................................................................................... 111
16.2.2 Rock Mass Model ................................................................................................................................. 112
16.2.3 Hydrogeological Model ..................................................................................................................... 112
16.2.4 Pit Limit Blasting and Pit Slope Monitoring ............................................................................... 112
16.3 Life of Mine and Production Rates ............................................................................................................. 113
16.4 Mining Schedule ................................................................................................................................................ 115
16.5 Mining Fleet ......................................................................................................................................................... 116
16.6 Explosives .............................................................................................................................................................. 117
17 RECOVERY METHODS ................................................................................................... 118
17.1 Planned Plant Upgrade and Modifications ............................................................................................. 118
17.2 Process Description .......................................................................................................................................... 119
17.2.1 Primary Crusher ..................................................................................................................................... 120
17.2.2 Secondary Crusher Crusher .............................................................................................................. 120
17.2.3 AG Mill ...................................................................................................................................................... 120
17.2.4 Pebble Crusher ...................................................................................................................................... 120
17.2.5 Bulk Sorter Circuit................................................................................................................................. 120
17.2.6 Tertiary Crusher ..................................................................................................................................... 121
17.2.7 Fines DMS ................................................................................................................................................ 121
17.2.8 Recovery ................................................................................................................................................... 121
17.2.9 Water Circuit ........................................................................................................................................... 121
17.3 QPs Comments ................................................................................................................................................... 121
18 PROJECT INFRASTRUCTURE ........................................................................................ 123
18.1 Road and Air Access ......................................................................................................................................... 123
18.2 Infrastructure ....................................................................................................................................................... 123
18.3 Water Management.......................................................................................................................................... 123
18.4 Tailings Disposal ................................................................................................................................................ 123
18.5 Power ………………………………………………………………………………………………………………………………..125
18.6 Fuel ………………………………………………………………………………………………………………………………..126
18.7 Telecommunications ........................................................................................................................................ 126
18.8 Comments on infrastructure ......................................................................................................................... 126
NI 43-101 Technical Report on the Karowe Mine (Amended) – February 4 2014 Page: V

19 MARKET STUDIES AND CONTRACTS .......................................................................... 127
19.1 Sales of Exceptional Stones ........................................................................................................................... 127
19.2 Diamond Sales in 2013 .................................................................................................................................... 127
19.3 Outlook for Rough Diamond Prices ........................................................................................................... 127
19.4 Current Contracts .............................................................................................................................................. 129
19.5 QPs Comments on Market Studies and Contracts ............................................................................... 129
20 ENVIRONMENTAL STUDIES, PERMITING AND COMMUNITY IMPACT ................... 130
20.1 Environmental studies completed to date .............................................................................................. 130
20.2 Environmental Management ........................................................................................................................ 131
20.2.1 Slimes dam .............................................................................................................................................. 131
20.2.2 Processed kimberlite dump or tailings dam .............................................................................. 131
20.2.3 Waste rock dump ................................................................................................................................. 132
20.3 Social and Community .................................................................................................................................... 132
20.4 Mine Closure ....................................................................................................................................................... 132
20.4.1 Management Actions .......................................................................................................................... 133
21 CAPITAL AND OPERATING COSTS .............................................................................. 135
22 ECONOMIC ANALYSIS .................................................................................................. 136
23 ADJACENT PROPERTIES ............................................................................................... 139
23.1 Orapa Mine .......................................................................................................................................................... 139
23.2 Letlhakane Mine ................................................................................................................................................. 140
23.3 Damtshaa Mine .................................................................................................................................................. 140
23.4 Firestone Diamonds BK11 .............................................................................................................................. 141
23.5 Early Stage Projects .......................................................................................................................................... 141
24 OTHER RELEVANT DATA AND INFORMATION .......................................................... 143
25 INTERPRETATION AND CONCLUSIONS ...................................................................... 144
25.1 Risks ………………………………………………………………………………………………………………………………..145
26 RECOMMENDATIONS ................................................................................................... 147
27 REFERENCES ................................................................................................................... 148
List of Tables
Table 1-1 Kimberlite units identified in AK6 kimberlite geological model ................................................................ 14
Table 1-2 Mineral Resource Statement .................................................................................................................................... 15
Table 1-3 Mineral Reserve Statement ....................................................................................................................................... 16
Table 1-4 Summary of Key Risks for the Karowe Mine ...................................................................................................... 18
Table 4-1 List of corner points of ML2008/6L ....................................................................................................................... 25 NI 43-101 Technical Report on the Karowe Mine (Amended) – February 4 2014 Page: VI
Table 4-2 List of permits on the Karowe Mine ...................................................................................................................... 29
Table 5-1 Climate data for Letlhakane (en.climate-data.org) .......................................................................................... 31
Table 7-1 Stratigraphic thickness recorded on the AK6 Project property .................................................................. 37
Table 7-2 Kimberlite units identified in AK6 kimberlite geological model ................................................................ 38
Table 9-1 Summary of Exploration Programmes ................................................................................................................. 47
Table 9-2 Summary of high resolution geophysical surveys conducted over the AK6 Kimberlite .................. 48
Table 10-1 Summary of exploration drilling programmes on the AK6 Kimberlite ................................................. 49
Table 14-1 Updated 3D geology model volumes compared to previous model volumes ................................. 67
Table 14-2 Summary of data used for bulk density estimation ..................................................................................... 72
Table 14-3 Variogram parameters for bulk density (BD) estimation ............................................................................ 73
Table 14-4 Neighbourhood parameters for bulk density estimation .......................................................................... 73
Table 14-5 Summary of average (Avg) bulk densities (BD) applied to blocks uninformed by interpolation.74
Table 14-6 Sample and kriged block averages of bulk density (BD) by geology domain ................................... 77
Table 14-7 Summary by geological domain of LDD sample grade data used for grade estimation .............. 79
Table 14-8 Total LDD diamond recoveries by DTC size class grouped by lobe ...................................................... 80
Table 14-9 Variogram parameters for local grade estimation ........................................................................................ 81
Table 14-10 Neighbourhood parameters for local grade estimation “Minimum” and “Optimal” refer to the number of samples used to interpolate a block........................................................................................................ 81
Table 14-11 Summary of average grade values applied to blocks uninformed by interpolation .................... 81
Table 14-12 Comparison of sample and kriged (block) grades by rock type in AK6 ............................................ 84
Table 14-13 Reconciliation of corrected 1.0 mm block model grades with production data ............................ 87
Table 14-14 Summary of production data used for defining SFD for the AK6 kimberlite. ................................. 89
Table 14-15 Total carat recoveries by DTC size class for production parcels isolated from each lobe .......... 91
Table 14-16 AK6 modelled total diamond content SFD’s, recovery corrections and corrected SFD’s by lobe93
Table 14-17 Results of diamond sales from the Karowe Mine ....................................................................................... 97
Table 14-18 Average sales values achieved for +10.8 ct diamonds from the Karowe Mine by sales batch 98
Table 14-19 Production batches used for value estimation ............................................................................................ 99
Table 14-20 GTD average value estimates by size class (DTC, grainer and carat) .................................................. 99
Table 14-21 Final value estimates by size class and overall average diamond value for the North, South and Centre Lobes ................................................................................................................................................................. 101
Table 14-22 Mineral Resource Statement ............................................................................................................................. 104
Table 15-1 Mineral Reserve Statement .................................................................................................................................. 106
Table 16-1 Recommended Crest to Crest stack angles (SRK, 2013) ........................................................................... 107
Table 16-2 Mining Fleet................................................................................................................................................................ 116
Table 19-1 List of major contracts on the Karowe Mine ................................................................................................. 129
Table 20-1 Estimated cost of mine closure scenarios ...................................................................................................... 133
Table 21-1 Karowe Mine Operating Costs ............................................................................................................................ 135
Table 21-2 Karowe Mine Capital Costs................................................................................................................................... 135 NI 43-101 Technical Report on the Karowe Mine (Amended) – February 4 2014 Page: VII

Table 22-1 Cash Flow Analysis ................................................................................................................................................... 137
Table 23-1 Orapa Mine Summary ............................................................................................................................................ 139
Table 23-2 Letlhakane Mine Summary ................................................................................................................................... 140
Table 23-3 Damtshaa Mine Summary .................................................................................................................................... 140
Table 23-4 Firestone Diamonds BK11 (source: Firestone Diamonds annual reports) ......................................... 141
Table 25-1 Summary of Key Risks for the Karowe Mine ................................................................................................. 145
List of Figures
Figure 1-1 Locality Map of the Karowe Diamond Mine .................................................................................................... 11
Figure 1-2 Geological Model of AK6 Kimberlite ................................................................................................................... 13
Figure 1-2 Optimised pit shell with the geological model superimposed ................................................................. 17
Figure 4-1 Locality map .................................................................................................................................................................. 26
Figure 4-2 Plan of ML2008/6L...................................................................................................................................................... 27
Figure 7-1 Stratigraphy ................................................................................................................................................................... 36
Figure 7-2 Geological Model of AK6 Kimberlite ................................................................................................................... 39
Figure 7-3 Inclined profile views of the AK6 geological model highlighting internal domains ........................ 40
Figure 10-1 Map of the LDD holes and bulk sample trench............................................................................................ 50
Figure 10-2 The core shed at Karowe Mine ........................................................................................................................... 50
Figure 13-1 Principle of XRT Sorting (source: Tomra Sorting Solutions) .................................................................... 60
Figure 14-1 Plan view of the South Lobe of the updated AK6 3D geology model ................................................ 63
Figure 14-2 View of the AK6 3D geological model facing east ...................................................................................... 64
Figure 14-3 Plan views illustrating differences between the near-surface pipe outlines in the 2008 and 2013 geological models ...................................................................................................................................................... 65
Figure 14-4 Weathered portion of the AK6 geological model looking east, illustrating the updated weathered kimberlite model solids in relation to the weathering surface from the 2008 model ......... 65
Figure 14-5 Country rock dilution with depth from line scan measurements of drill core for the main kimberlite rock types in each lobe .................................................................................................................................. 69
Figure 14-6 Distribution of core holes drilled on the AK6 kimberlite .......................................................................... 70
Figure 14-7 Distribution of bulk density (BD) samples throughout the AK6 kimberlite ...................................... 71
Figure 14-8 AK6 bulk density profile with depth ................................................................................................................. 75
Figure 14-9 Inclined view facing NW showing comparison of interpolated bulk densities from the 2008 and 2013 block models in M/PK(S) ................................................................................................................................ 76
Figure 14-10 Distribution of AK6 LDD drill holes from which bulk samples were collected .............................. 78
Figure 14-11 AK6 grade profile with depth ............................................................................................................................ 82
Figure 14-12 Inclined view facing NW comparing interpolated grades for the M/PK(S) domain from the 2008 and 2013 block models ............................................................................................................................................ 83
NI 43-101 Technical Report on the Karowe Mine (Amended) – February 4 2014 Page: VIII

Figure 14-13 Grade-size curves comparing diamond production at 1.25 mm lower cut off to LDD sample data (1.0 mm lower cut off) for the Centre and South Lobes .............................................................................. 85
Figure 14-14 Comparison of recovered grade (cpht; 1.25 mm bottom cut-off) versus the 2013 block model predicted 1.0 mm grade (cpht) for six selected production periods................................................................. 87
Figure 14-15 Locations of mining blocks used for defining the SFD of diamond production from the Centre and South Lobes ...................................................................................................................................................... 90
Figure 14-16 Grade distribution plot showing diamond parcels used for modelling the SFD of the North, Centre and South Lobes ...................................................................................................................................................... 92
Figure 14-17 Cumulative log probability plot of final modelled SFD for each lobe .............................................. 94
Figure 14-18 Cumulative log-probability plot illustrating the SFD of LDD results by lobe in comparison with production data by lobe ........................................................................................................................................... 95
Figure 14-19 Cumulative log-probability plot illustrating the SFD of LDD recoveries grouped by depth within the South and Centre Lobes ................................................................................................................................ 96
Figure 15-1 Optimised pit shell with the geological model superimposed ............................................................ 106
Figure 16-1 Bench stack configurations (source: SRK, 2013) ......................................................................................... 108
Figure 16-2 Section of the final pit design showing the slope angles relative to rock types ........................... 109
Figure 16-3 Section of the final pit design relative to the optimal shell................................................................... 110
Figure 16-4 Stereonet of jointsets derived from weathered basalt joint data (source: Boteti Mining, 2013)111
Figure 16-5 Condition of the pit limit walls on the western margin of the pit (source: SRK, 2013) .............. 113
Figure 16-6 Section of the final pit showing the slope angles relative to rock types ......................................... 114
Figure 16-7 Section of the current pit looking east .......................................................................................................... 115
Figure 16-8 Life of Mine Mining Schedule ............................................................................................................................ 115
Figure 17-1 Current process and planned changes (source: DRA Group) ............................................................... 119
Figure 18-1 Topsoil and Tailings Facilities on the Karowe Mine .................................................................................. 124
Figure 19-1 Outlook for Rough Diamond Demand v Supply (source: Bain, 2012) ............................................... 128
Figure 23-1 Map of Mining and Prospecting Licences in the Orapa Area ............................................................... 142
List of Appendices
Appendix 1 : Glossary of terms
Appendix 2 : Certificates of Qualified Persons
NI 43-101 Technical Report on the Karowe Mine (Amended) – February 4 2014 Page: IX
1 SUMMARY
1.1 Introduction
The Karowe Diamond Mine (‘Karowe”) is an open pit diamond mine with associated key components including mining infrastructure, an access road, power supply and water supply.
This report has been prepared on behalf of Lucara Diamond Corp. (“Lucara”) and is an update of the status of Karowe (formerly known as “the AK6 Kimberlite Project” and the “Boteti Project”). Karowe is 100% owned by Lucara through its 100% owned subsidiary Boteti Mining (Pty) Ltd (“Boteti”) and commenced operations in April 2012 with a projected life of mine of at least 15 years.
This update has been prepared to report revised Mineral Resource and Mineral Reserve estimates for the mine. In addition, plant upgrades which are currently being implemented are reviewed. The production from Karowe is sold by tender both locally and internationally. Carat productions in 2013 totalled 440,751 ct. Gross revenues in 2012 were USD 54.6 million and in 2013 were USD 180.5 million. Gross revenues are budgeted to be approximately USD 164 million in 2014.
1.2 Property Location and Description
The property is Mining Licence (“ML”) 2008/6L issued in terms of the Mines and Minerals Act 1999, Part VI, and covers 1,523.0634 ha in the Central District of Botswana (Figure 1-1). The ML is in north central Botswana, 25 km south of the Orapa diamond mine and 23 km west of the Letlhakane diamond mine, centred on approximately 25° 28' 13" E / 21° 30' 35" S.
All mineral rights in Botswana are held by the State. Commercial mining takes place under Mining Licences issued on the authority of the Minister of Minerals, Energy and Water Resources.
ML2008/6L is 100% held by Boteti, a company incorporated in Botswana. The ML was originally issued on 28 October 2008, and was updated on 9 May 2011 to increase the area to the current extent. It is valid for 15 years and gives the right to mine for diamonds. The Government of Botswana holds no equity in the project.
The property lies on the northern fringe of the Kalahari Desert at an elevation of 1,022 m above sea level in central Botswana and is covered by sand savannah which supports a natural vegetation of trees, shrubs and grasses. The land slopes very gently to the north into the Makgadigadi Depression. The dry valley of the now fossil Letlhakane River, directed into the Depression, passes some 18 km to the northeast of the property and is the only notable physiographic feature in the immediate area.
The area around the property is communal agricultural land used mainly for cattle grazing with limited arable farming. Surface rights have been secured over the Mining Licence and provide sufficient space for rock dumps, tailings dams and mine infrastructure.
Electrical power is supplied to the Karowe Mine through the Botswana Power Corporation’s national grid on commercial terms. Water for the mine is derived from a strong aquifer at the contact of the Ntane Sandstone Formation and the overlying Karoo basalt.
NI 43-101 Technical Report on the Karowe Mine (Amended) – February 4 2014 Page: 10

Figure 1-1
Locality Map of the Karowe Diamond Mine
10 January 2013
NI 43-101 Technical Report on the Karowe Mine (Amended) – February 4 2014 Page: 11

1.3 Geology
The Karowe Mine is based on the AK6 kimberlite pipe, which is part of the Orapa Kimberlite Field (“OKF”) in Botswana. The bedrock of the region is covered by a thin veneer of wind-blown Kalahari sand and exposure is very poor. Rocks close to surface are often extensively calcretised and silcretised due to prolonged exposure on a late Tertiary erosion surface (the African Surface) which approximates to the present day land surface.
The OKF lies on the northern edge of the Central Kalahari Karoo Basin along which the Karoo succession dips very gently to the SSW and off-laps against the Precambrian rocks which occur at shallow depth within the Makgadikgadi Depression.
The OKF includes at least 83 kimberlite bodies, varying in size from insignificant dykes to the 110 ha AK1 kimberlite which is Debswana’s Orapa Mine. All kimberlite intrusions are of post-Karoo age. Of the 83 known kimberlite bodies, five (AK1, BK9, DK1, DK2 and AK6 which is the Karowe Mine) have been or are currently being mined, and a further four (BK1, BK11, BK12 and BK15) are recognized as potentially economic deposits.
The country rock at the Karowe Mine is sub-outcropping flood basalt of the Stormberg Lava Group (approximately 130 m thick on the Karowe property) which is underlain by a condensed sequence of Upper Carboniferous to Triassic sedimentary rocks of the Karoo Supergroup (approximately 245 m thick on the Karowe property). The Karoo sequence overlies granitic basement.
AK6 is a roughly north-south elongate kimberlite body with a near surface expression of ~3.3 ha and a maximum area of approximately 7 ha at ~120 m below surface. The body comprises three geologically distinct, coalescing pipes that taper with depth into discrete roots. These pipes are referred to as the North Lobe, Centre Lobe, and South Lobe.
The AK6 kimberlite is an opaque-mineral-rich monticellite kimberlite, texturally classified primarily as fragmental volcaniclastic kimberlite with lesser macrocrystic hypabyssal facies kimberlite of the Group 1 variety. The nature of the kimberlite differs between each lobe, with distinctions apparent in the textural characteristics, relative proportion of internal country-rock dilution, and degree or extent of weathering. The South Lobe is considered to be distinctly different from the North and Centre Lobes which are similar to each other in terms of their geological characteristics. The North and Centre Lobes exhibit internal textural complexity (reflected in apparent variations in degree of fragmentation and proportions of country-rock xenoliths) whereas the bulk of the South Lobe is more massive and internally homogeneous.
The upper parts of all three lobes contain severely calcretised and silcretised rock. This zone is typically approximately 10 m in thickness, but can be up to 20 m in places. Beneath the calcrete and silcrete, the kimberlite is highly weathered. The intensity of weathering decreases with depth with fresh kimberlite generally intersected at about 70 m to 90 m below present day surface.
The geological model and list of geological units are presented in Figure 1-2 and Table 1-1 respectively. A unit within the South Lobe (a variety of M/PK(S)) has been found to be hard, and to produce a very large DMS concentrate primarily as a consequence of an abundance of fresh olivine in the kimberlite. Plant upgrades are underway at Karowe to be able to effectively process this material.
NI 43-101 Technical Report on the Karowe Mine (Amended) – February 4 2014 Page: 12

Figure 1-2 Geological Model of AK6 Kimberlite
Inclined profile view of the geology model of the AK6 kimberlite. Geology domain names are indicated in white lettering. Dashed line indicates the maximum depth of the weathering horizon. Geology model modified after original De Beers model.
NI 43-101 Technical Report on the Karowe Mine (Amended) – February 4 2014 Page: 13

Table 1-1 Kimberlite units identified in AK6 kimberlite geological model
Lobe Unit Domain Description
North BBX BBX(N) Country-rock breccia
North CKIMB CKIMB(N) Calcretised kimberlite
North FK(N) FK(N) Fragmental kimberlite
North KBBX KBBX(N) Kimberlite and country-rock breccia
North WBBX WBBX(N) Weathered country-rock breccia
North WK(N) WK(N) Weathered kimberlite
Center BBX BBX(C) Country-rock breccia
Center CFK(C) CFK(C) Carbonate-rich fragmental kimberlite
Center CKIMB(C) CKIMB(C) Calcretised kimberlite
Center FK(C) FK(C) Fragmental kimberlite
Center KBBX KBBX(C) Kimberlite and country-rock breccia
Center WBBX WBBX(C) Weathered country-rock breccia
Center WK(C) WK(C) Weathered kimberlite
South BBX(S) BBX(S) Country-rock breccia
South CBBX(S) CBBX(S) Calcretised country-rock breccia
South CKIMB(S) CKIMB(S) Calcretised kimberlite
South EM/PK(S) EM/PK(S) Eastern magmatic/pyroclastic kimberlite
South INTBS INTBS(S) Large internal block of basalt
South M/PK(S) M/PK(S) Magmatic/pyroclastic kimberlite
South M/PK(S) 17+YIELD High-yield magmatic/pyroclastic kimberlite
South WBBX(S) WBBX(S) Weathered country-rock breccia
South WK(S) WK(S) Weathered kimberlite
South WM/PK(S) WM/PK(S) Western magmatic/pyroclastic kimberlite
Units occurring in more than one lobe (e.g. BBX, CKIMB) were modelled as separate domains for each lobe. The 17+YIELD material identified in the South Lobe is a variety of M/PK(S) kimberlite defined as a separate domain on account of its very high concentrate yield.
1.4 Mineral Resources
An updated Mineral Resource estimate was prepared by Mineral Services Canada Ltd (MSC) and published by Lucara on 18th December 2013. The updated Mineral Resource estimate makes very minor changes to the grade and volume estimates contained in the previous Mineral Resource estimate. However, the diamond revenue model is substantially improved, and is based on actual production sales figures from 2012 and 2013. The key reason behind the improved revenue model is that the occurrence of very large diamonds suspected from the earlier work, have been confirmed during mining, and the value of these stones can now be included in the Mineral Resource estimate for the mine.
NI 43-101 Technical Report on the Karowe Mine (Amended) – February 4 2014 Page: 14

The Mineral Resource statement is presented in Table 1-2.
Table 1-2 Mineral Resource Statement
Statement of the estimated remaining Mineral Resource Statement in the AK6 kimberlite deposit as of the 21st October, 2013. SP = Stockpile. LOM = Life of Mine. Volume, tonnes and carats are reported in millions (M)
1) Based on a recoverable grade model (1.25mm bottom cut off size) 2) Diamond price is based on diamonds recoverable with current Karowe plant process and November 2013
Price Book 3) Effective Date October 21, 2013 4) Mineral Resources are reported inclusive of Mineral Reserves 5) Mineral Resources that are not Mineral Reserves do not have demonstrated economic viability
1.5 Mineral Reserves
Mineral Reserve estimation is based on the updated Indicated Mineral Resource estimate. Inferred Resources have not been used to estimate Mineral Reserves. The Resource to Reserve conversion was performed by Lucara by conducting an open pit optimisation, using Whittle Four-X software. The outputs of this process include a mining schedule on which to base plant capacity, waste rock quantities, peak capacities and mining fleet parameters. It should be noted that the Whittle optimisation is ongoing and consideration is being given by Lucara to revise the mining schedule by not mining a portion of the North Lobe, portions of which may be sub-economic at depth due to dilution.
A trade-off study on the capital cost, plant efficiencies and size-revenue curve, indicated that the optimum bottom size cut-off for the project is 1.25 mm, and this is currently the bottom screen size cut-off in the Karowe plant. Mineral Reserves were estimated for the AK6 pipe, and active stockpile materials.
Classification ResourceVolume (Mm3)
Density (tpm3)
Tonnes (Mt)
Carats (Mct)
Grade (cpht) USD/ct
INDICATED North Lobe 0.74 2.48 1.83 0.30 16 217
Centre Lobe 2.53 2.56 6.49 1.27 20 351
South Lobe 13.50 2.81 37.89 5.89 16 413
Working SP 0.33 1.88 0.62 0.08 13 333
LOM SP 0.66 1.88 1.24 0.07 6 350
IND Total 17.76 2.71 48.07 7.61 16 393
INFERRED Centre Lobe 0.08 2.59 0.21 0.03 15 351
South Lobe 7.01 2.96 20.79 3.01 14 413
INF Total 7.09 2.96 21.00 3.04 14 412
NI 43-101 Technical Report on the Karowe Mine (Amended) – February 4 2014 Page: 15

In addition to defining the optimal pit shell, a double revenue pit shell was defined during the Feasibility Study in 2010. Double revenue sensitivity is performed to anticipate upswings in the future diamond market, providing a guide as to where the surface infrastructure, waste rock dumps, primary crusher, workshops etc. should be positioned in order to avoid the possibility of any future need for relocation. The location of surface infrastructure has been determined with consideration of the double revenue optimal pit shell.
There are no specific grade control programs. Generally all kimberlitic material within the optimal pit is considered to be economic, and will either be processed directly or stockpiled for possible future processing. Material from the pipe contact is stockpiled into a low grade stockpile for possible future processing. Portions of the pipe have been modelled as being diluted in the geological model, based on core drilling data. However, some diluted portions of the pipe have not been mapped. Mining recovery of 97% and dilution of 4.5% were applied in the optimisation to better simulate the physical operation. Plant recovery was set at 100%. Operating costs used in the Whittle optimisation are based on current contracts for outsourced mining and ore processing. Inter-ramp slope angles were derived from geotechnical work. These angles have been flattened by six degrees in basalt and nine degrees in kimberlite and sandstones to make allowance for haul roads.
The Mineral Reserve Statement is presented in Table 1-3.
Table 1-3 Mineral Reserve Statement
Lobe Category Tonnes Grade cpht
Revenue USD/ct
Revenue USD/tonne Carats
North Probable 991,965 18.4 217 40 182,217
Centre Probable 5,998,544 18.4 351 65 1,105,729
South Probable 25,261,762 15.1 413 62 3,803,981
LOM SP Probable 873,059 5.7 350 20 49,912
TOTAL Probable 33,125,330 15.5 394 61 5,141,839
Statement of the estimated remaining Mineral Reserve in the AK6 kimberlite Life of Mine optimal pit as of the 26th December, 2013. LOM SP – Life of Mine Stockpile.
1) Based on the updated Mineral Resource estimate (1.25mm bottom cut off size) 2) Diamond price is based on diamonds recoverable with current Karowe plant process and November 2013
Price Book 3) Rounding has been applied 4) Dilution of 4.5% and Mining Recovery of 97% applied 5) Mineral Reserve excludes loose stocks in pit and low grade stockpiles
NI 43-101 Technical Report on the Karowe Mine (Amended) – February 4 2014 Page: 16

Figure 1-3 Optimised pit shell with the geological model superimposed
Oblique view looking due east. The final pit will be approximately 800 m in the N-S direction, and 700 m in the E-W direction. The Mineral Reserve is defined by those portions of the Mineral Resource which occur within the optimised pit shell.
1.6 Plant Upgrades
Subsequent to the commissioning of the Mine during 2012, the plant has performed successfully. The AG mill, DMS circuit and recovery plant have all performed to expectation. However, Lucara recognised even at the Feasibility Study stage that the greatest metallurgical risks are the ability of the grinding circuit to grind the fresh hard kimberlite below the weathered zone, and the ability of the DMS circuit to cope with very high yield material from portions of the M/PK(S) unit identified in the geological model of the South Lobe which is expected to produce DMS yields in excess of 17%. A further risk that has become apparent following the recovery of exceptionally large, high value diamonds at Karowe, is the breakage of large stones.
To address these risks, a number of plant upgrades are planned during 2014 at a capital cost of approximately USD 50 million. The upgrades include the introduction of large diamond recovery circuit, which is designed to recover large stones prior to major crushing of ore, additional crushers to liberate diamonds from the hard fresh kimberlite, and additional DMS and X-ray capacity to cope with high DMS yields.
These plant changes carry their own risks, but these risks are being carefully managed by Lucara.
NI 43-101 Technical Report on the Karowe Mine (Amended) – February 4 2014 Page: 17

1.7 Conclusions and Recommendations
An updated Mineral Resource has been estimated for the Karowe Mine, based on a review of existing geological data, and updated grade and revenue information based on mining data and actual sales data collected during 2012 and 2013, and the November 2013 price book. The key change in the Mineral Resource estimate is the diamond revenue, which has increased. This is largely due to the recovery of exceptionally large and high value Type IIa diamonds at Karowe, as well as some ‘fancies’. The diamonds are currently sold by Lucara through an open tender system in both Gaborone and in Europe.
The updated Mineral Resource is the basis for an updated Mineral Reserve derived from a pit design based on an optimised Whittle shell. The pit design has changed very slightly since the original design from the 2010 Feasibility Study. With minor exceptions, the pit design satisfies geotechnical parameters, and a robust hydrogeological dewatering plan will both preserve the integrity of the pit walls when mining extends below the water table, and provide water for the plant operations. The pit optimisation is currently being reviewed to decide whether to mine a portion of highly diluted kimberlite in the North Lobe, and this is the area where the pit wall has deviated from the pit design.
The weathered portion of the AK6 kimberlite has largely been mined and processed, and fresh hard kimberlite will be increasingly encountered in the future. In order to address the challenges presented to the plant of hard kimberlite, high DMS yield material, and preservation of value of large diamonds, a number of upgrades to the plant will be implemented during 2014, with a capital cost of approximately USD 50 million.
The mining schedule produced from the Whittle optimisation and the Mineral Reserve estimate, have been used as the basis of for a financial model for the project. The financial model indicates that the mine has positive economics to its scheduled closure in 2027, and that the current NPV is USD 448.1 million (at 8% discount rate).
1.7.1 Risks
Risks for the Project are summarised in Table 1-4.
Table 1-4 Summary of Key Risks for the Karowe Mine
Risk Risk Class Risk Mitigation/Comment Residual
Risk Rating
Major safety, health and environmental incidents
SHE
Whilst each of these aspects are managed at Karowe, the SHE audit undertaken in 2013 identified the lack of an Environmental and Social Risk Assessment as an item for management attention. The ESRA has not yet been established
Low
Internal dilution of the kimberlite by basalt and other waste rock
Technical
The updated geological model has attempted to improve the mapping of internal dilution. The Mineral Reserve conversion has assumed internal dilution of 4.5%
Moderate
NI 43-101 Technical Report on the Karowe Mine (Amended) – February 4 2014 Page: 18
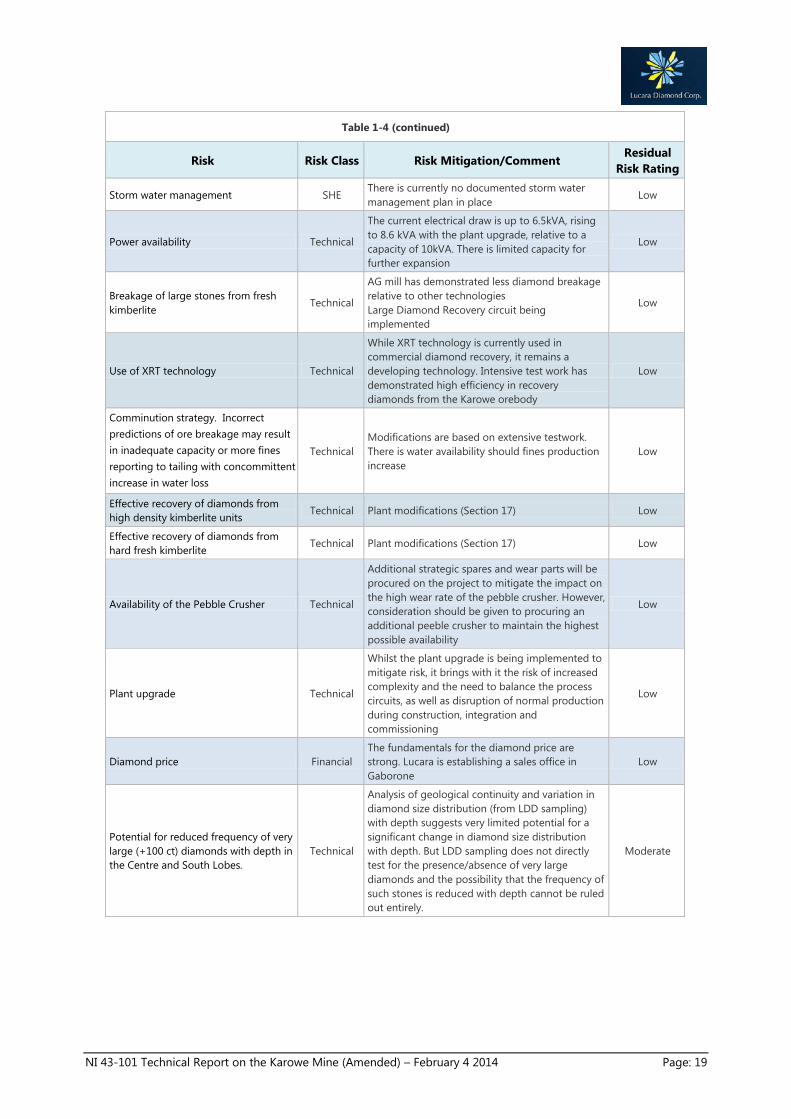
Table 1-4 (continued)
Risk Risk Class Risk Mitigation/Comment Residual
Risk Rating
Storm water management SHE There is currently no documented storm water management plan in place
Low
Power availability Technical
The current electrical draw is up to 6.5kVA, rising to 8.6 kVA with the plant upgrade, relative to a capacity of 10kVA. There is limited capacity for further expansion
Low
Breakage of large stones from fresh kimberlite
Technical
AG mill has demonstrated less diamond breakage relative to other technologies Large Diamond Recovery circuit being implemented
Low
Use of XRT technology Technical
While XRT technology is currently used in commercial diamond recovery, it remains a developing technology. Intensive test work has demonstrated high efficiency in recovery diamonds from the Karowe orebody
Low
Comminution strategy. Incorrect predictions of ore breakage may result in inadequate capacity or more fines reporting to tailing with concommittent increase in water loss
Technical Modifications are based on extensive testwork. There is water availability should fines production increase
Low
Effective recovery of diamonds from high density kimberlite units
Technical Plant modifications (Section 17) Low
Effective recovery of diamonds from hard fresh kimberlite
Technical Plant modifications (Section 17) Low
Availability of the Pebble Crusher Technical
Additional strategic spares and wear parts will be procured on the project to mitigate the impact on the high wear rate of the pebble crusher. However, consideration should be given to procuring an additional peeble crusher to maintain the highest possible availability
Low
Plant upgrade Technical
Whilst the plant upgrade is being implemented to mitigate risk, it brings with it the risk of increased complexity and the need to balance the process circuits, as well as disruption of normal production during construction, integration and commissioning
Low
Diamond price Financial The fundamentals for the diamond price are strong. Lucara is establishing a sales office in Gaborone
Low
Potential for reduced frequency of very large (+100 ct) diamonds with depth in the Centre and South Lobes.
Technical
Analysis of geological continuity and variation in diamond size distribution (from LDD sampling) with depth suggests very limited potential for a significant change in diamond size distribution with depth. But LDD sampling does not directly test for the presence/absence of very large diamonds and the possibility that the frequency of such stones is reduced with depth cannot be ruled out entirely.
Moderate
NI 43-101 Technical Report on the Karowe Mine (Amended) – February 4 2014 Page: 19

1.7.2 Recommendations
The Karowe Mine is in production and exploration activities and engineering studies have largely concluded. Lucara is currently implementing changes to the plant and managing risks identified and associated with this and other aspects of operating an open pit diamond mine. No other recommendations are provided by the QPs.
NI 43-101 Technical Report on the Karowe Mine (Amended) – February 4 2014 Page: 20

2 INTRODUCTION
The Karowe Mine is an open pit diamond mine with associated key components including mining infrastructure, an access road, power supply and water supply.
2.1 Scope of Work
This Independent Technical Report (“the Report”) has been prepared on behalf of Lucara and is an update of the status of the Karowe Mine (formerly known as “the AK6 Kimberlite Project” and the “Boteti Project”). Karowe is 100% owned by Lucara through its 100% owned subsidiary Boteti Mining (Pty) Ltd (“Boteti”) and commenced operations in April 2012 with a projected life of mine of at least 15 years. The update has been prepared to report revised Mineral Resource and Mineral Reserve estimates for the mine. In addition, plant upgrades which are currently being implemented are also reported. The production from Karowe is sold by tender both locally and internationally. Carat production in 2013 totalled 438,717 ct. Gross revenues in 2012 were USD 54.6 million and in 2013 were USD 180.5 million. Gross revenues are budgeted to be approximately USD 164 million in 2014.
The Report has been prepared to comply with disclosure and reporting requirements set forth in the Toronto Stock Exchange (TSX) Corporate Finance Manual, Canadian National Instrument 43-101 Standards of Disclosure for Mineral Projects, Companion Policy 43-101CP, Form 43-101F1 Technical Report (Form F1) of June 2011 and the CIM Definition Standards for Mineral Resources and Mineral Reserves adopted by the CIM Council in November 2010.
Unless otherwise stated, all monetary figures expressed in this report are in United States of America dollars (“USD”), all units are in metric measures, and the coordinate system used is geographic latitude and longitude expressed as decimal degrees with true North bearings. The datum for all maps is WGS84. A glossary of all technical terms and abbreviations is included in Appendix 1.
2.2 Previous Technical Reports
McGeorge, I.; Lynn, M.D.; Ferreira, J.J.; and Croll, R.C. (2010) NI 43-101 Technical Report on the Boteti Kimberlite Project, Botswana. The MSA Group, 25 March 2010
McGeorge, I.; Lynn, M.D.; Ferreira, J.J.; Croll, R.C.; Blair, D. and Morton, K. (2010) NI 43-101 Technical Report on the Feasibility Study for the AK6 Kimberlite Project, Botswana. The MSA Group, 31 December 2010
2.3 Qualified Persons and Site Visits
This Report has been compiled by Mr Michael Lynn, Dr Tom Nowicki, Mr Michael Valenta, Mr Mark Gallagher, Mr John Sexton, Mr Robin Bolton and Mr Beric Robinson.
Mr Lynn is a professional geologist with 28 years’ experience in various parts of Africa and India. He is a Principal Consultant – Diamonds with The MSA Group, a Fellow of the Geological Society of South Africa, a member in good standing with the South African Council for Natural Scientific Professions (SACNASP) and a member of the Society of Economic Geologists (SEG). Mr Lynn has the appropriate relevant qualifications, experience, competence and independence to act as a
NI 43-101 Technical Report on the Karowe Mine (Amended) – February 4 2014 Page: 21

“Qualified Person” as that term is defined in National Instrument 43-101 (Standards of Disclosure for Mineral Projects). His certificate as a Qualified Person is attached in Appendix 2. Site visits were undertaken by Mr Lynn during the periods 17th to 18th January 2010 to view the original marked drill sites and drill core; and again between 27 and 29 August 2012. The purpose of the latter site visit was to inspect the initial open pit, areas where the mapped pipe contacts differed from the original expected contacts modelled from the evaluation drilling, and to observe zones of internal dilution in drill core and within the pipe.
Dr Nowicki has 22 years’ experience as a geoscientist in mineral exploration, evaluation and mining. He is a Technical Director and Senior Principal Geoscientist with Mineral Services Canada Inc. and is a registered professional geoscientist with the Association of Professional Engineers and Geoscientists of British Columbia (APEGBC). Dr Nowicki has the appropriate relevant qualifications, experience, competence and independence to act as a “Qualified Person” as that term is defined in National Instrument 43-101 (Standards of Disclosure for Mineral Projects); his certificate as a Qualified Person is attached in Appendix 2. Dr Nowicki undertook a site visit to the Karowe Mine on the 3rd and 4th July 2013 to review mine and processing operations, to examine the kimberlite geology as exposed in the open pit at the time and to review selected drill cores intersecting the AK6 kimberlite pipe.
Mr Valenta is a registered Professional Engineer (Metallurgical) under the Washington Accord (Reg No. 200360005) and Managing Director of Metallicon Process Consulting (Pty) Ltd in South Africa. He is a fellow of the Southern African Institute of Mining and Metallurgy and a member and past president of the Mine Metallurgical Managers’ Association. He has 23 years’ experience in the metallurgical industry having started his career with South African mineral research organisation Mintek as a research engineer and then progressing to operations with Lonmin. These included managing the platinum concentrators and the precious metals refinery. He held the position of Consulting Metallurgist: Minerals Processing with Hatch South Africa for a number of years where he broadened his experience in plant design. Mr Valenta is currently the only metallurgical engineer registered on the Engineer’s Mobility Forum (“EMF”) international register in South Africa and has the appropriate relevant qualifications, experience, competence and independence to act as a “Qualified Person” as that term is defined in National Instrument 43-101 (Standards of Disclosure for Mineral Projects); his certificate as a Qualified Person is attached in Appendix 2. He visited the mine on the 17th of December to assess the requirements and risks associated with the planned upgrading of the plant.
Mr. Gallagher is a qualified mining engineer with 33 years of experience in various parts of Africa, Canada, Russia, Australia, Kazakhstan and South America. He is a Principal Consultant – MSG Consulting, a member in good standing of the South African Institute on Mining and Metallurgy and a member of the Institute of Quarrying. Mr. Gallagher has the appropriate relevant qualifications, experience, competence and independence to act as a “Qualified Person” as that term is defined in National Instrument 43-101 (Standards of Disclosure for Mineral Projects). His certificate as a Qualified Person is attached in Appendix 2. Site visits to the project were not undertaken by Mr. Gallagher.
Mr Robinson is a professional engineer and a member of the Engineering Council of South Africa and the South African Institute of Civil Engineers. He has worked continuously as an engineer for
NI 43-101 Technical Report on the Karowe Mine (Amended) – February 4 2014 Page: 22

over 35 years, and holds an honours degree in civil engineering from the University of Cape Town (1978), and a Graduate Diploma in Geotechnical Engineering from the University of the Witwatersrand (1991). He has worked on projects throughut Africa. Mr. Robinson has the appropriate relevant qualifications, experience, competence and independence to act as a “Qualified Person” as that term is defined in National Instrument 43-101 (Standards of Disclosure for Mineral Projects). His certificate as a Qualified Person is attached in Appendix 2. Site visits to the project were not undertaken by Mr. Robinson.
Mr Sexton is a professional financial analyst of mineral projects with over 39 years experience. He has worked as a financial analyst and modeller for Rand Mines Ltd, Goldfields of South Africa Ltd, and Anglogold Ashanti Ltd on mineral projects all over the world. He has provided financial modelling input to preliminary economic assessments/scoping studies, pre-feasibility studies, feasibility studies, and operating mines, as well as valuations of mineral properties. By virtue of his skills and experience, Mr Sexton is a Qualified Valuator (“QV”) as that term is defined by the Special Committee Of The Canadian Institute Of Mining, Metallurgy and Petroleum on Valuation of Mineral Properties (CIMVAL).
Mr Bolton is a professionally registered environmental scientists with 13 years consulting experience to the mining industry and has worked on projects throughout Africa. He is Principal Environmental Consultant with The MSA Group and a member of the International Association of Impact Assessment. Mr Bolton has the appropriate relevant qualifications, experience, competence and independence to act as a “Qualified Person” as that term is defined in National Instrument 43-101 (Standards of Disclosure for Mineral Projects). His certificate as a Qualified Person is attached in Appendix 2. A site visit to the mine was undertaken by Mr Bolton on 17th December 2013 to review the environmental management practices.
The authors of this report do not have and do not intend to obtain, any material interest in Lucara or the mineral properties in which Lucara has an interest. Our relationship with Lucara is solely one of professional association between client and independent consultants. This report is prepared in return for professional fees based upon agreed commercial rates and the payment of these fees is in no way contingent on the results of this report.
2.4 Principal Sources of Information
The Qualified Persons based their review on information provided by Lucara, along with technical reports by previously engaged consulting firms and other relevant published and unpublished data. A listing of the principal sources of information is included in Section 27 at the end of this Report.
The Qualified Persons have endeavoured, by making all reasonable enquiries, to confirm the authenticity and completeness of the technical data upon which the Report is based. A final draft of the Report was also provided to Lucara, along with a written request to identify any material errors or omissions prior to lodgement.
The Report has been prepared on information available up to and including December 31st 2013. The Qualified Persons have provided consent for the inclusion of the Independent Technical Report in public disclosure documents.
NI 43-101 Technical Report on the Karowe Mine (Amended) – February 4 2014 Page: 23

3 RELIANCE ON OTHER EXPERTS
The authors have not independently verified, nor are they qualified to verify the legal status of the Mining Licence that forms the subject of this report and are reliant on the information provided by Lucara. The present status of the Mining Licence is based on copies of the licence documents provided by Lucara. This Report has been prepared on the assumption that Lucara is the lawful holder of the Mining Licence.
Diamond value data reported in Section 14.5 were provided by GTD Diamond Consulting Ltd. (“GTD”). The QP has relied on these data as a basis for revenue estimates provided in Section 14.5.3 and 14.6. GTD, through its principals and employees, combines over 130 years of rough diamond valuation experience responsible for the valuation and sale of diamonds worth over USD 20 Billion in their respective careers. GTD has managed the sales of all Karowe diamond production to date.
4 PROPERTY DESCRIPTION AND LOCATION
4.1 Overview of Botswana
The Republic of Botswana gained independence from Great Britain in 1966 and has subsequently been governed by the Botswana Democratic Party in a multi-party democracy. It has the highest sovereign credit rating in Africa and is one of the world’s fastest growing economies.
Botswana is the world’s largest diamond producer by value, driven mainly by the large Jwaneng and Orapa Mines owned by Debswana. The Mining Code was revised in 1999 and is considered one of the most competitive and best administered in Africa. The mining laws are geared to ensure stability, deregulation and government transparency, and mining is governed by the Mines and Mineral Act 17 which came into effect on 1st December 1999. Botswana is rated by the Fraser Institute (2012) as the best destination in Africa for mining investment and by Transparency International as the least corrupt country in Africa.
4.1.1 Types of Mineral Licence in Botswana
In Botswana, mineral rights are vested in the state. There are four types of mineral licences:
• Prospecting Licence: A prospecting license is valid for an initial period of up to 3 years with 2 renewals each not exceeding 2 years each. At the end of each period the prospecting area is reduced by half or at lower proportion as the Minister may agree. The applicant must have access to or have adequate financial resources, technical competence and experience to carry out an effective exploration programme
• Retention Licence: This licence provides for prospectors who deem a project economically unviable in the short-term. The first three-year licence remains exclusive while a second three-year licence provides limited rights for third parties to reassess a prospect.
• Mining Licence: This licence is initially valid for a period of up to 25 years, as is reasonably required to carry out the mining programme. The holder of a licence may apply for unlimited reviews for a period up to 25 years. Additionally, mineral rights holders may be
NI 43-101 Technical Report on the Karowe Mine (Amended) – February 4 2014 Page: 24

required to permit the government to hold up to a 15% minority interest in mining undertakings. This will be on commercial terms with the Botswana Government paying its pro rata share of costs incurred.
• Minerals Permits: This permit allows companies to conduct small-scale mining operations for any mineral other than diamonds over an area not exceeding a half square kilometre. It is initially issued for five years, with unlimited renewal periods of up to five years each.
4.1.2 Fiscal Regime in Botswana
• The royalty rate on precious stones is 10%
• There is a negotiated rate of income tax for diamond projects (Section 4.3.2)
• 100% depreciation of capital expenditures is allowed
• There is a 15% dividend withholding tax on distribution to shareholders
• Mining equipment and spares are zero-rated, otherwise duties are payable
• There is 10% Value Added Tax (VAT) which applies to all but zero rated items, and applies
to mineral exports
• There is 15% taxation on revenues for downstream cutting and polishing of diamonds
4.2 Issuer’s Title, Location and Demarcation of Mining Licence
The property is Mining Licence (“ML”) 2008/6L issued in terms of the Mines and Minerals Act 1999, Part VI, and covering 1,523.0634 ha in the Central District of Botswana. The licence is in north-central Botswana, 25 km south of the Orapa diamond mine and 23 km west of the Letlhakane diamond mine, centred on approximately 25° 28' 13" E / 21° 30' 35" S.
All mineral rights in Botswana are held by the State. Commercial mining takes place under Mining Licences issued on the authority of the Minister of Minerals, Energy and Water Resources.
ML2008/6L is 100% held by Boteti, a company incorporated in Botswana. The ML was originally issued on 28th October 2008, and was updated on 9th May 2011 to increase the area to the current extent. It is valid for 15 years and gives the right to mine for diamonds. The Government of Botswana holds no equity in the project.
Table 4-1 List of corner points of ML2008/6L
Corner Points Longitude (East)1 Latitude (South)1
Degrees Minutes Seconds Degrees Minutes Seconds
A
25 27 17.3 21 29 31.1
B 25 29 13.7 21 29 31.1
C 25 29 13.7 21 31 59.1
D 25 27 17.3 21 31 59.1 1 WGS84 datum
NI 43-101 Technical Report on the Karowe Mine (Amended) – February 4 2014 Page: 25

Figure 4-1 Locality map
4 November 2013
NI 43-101 Technical Report on the Karowe Mine (Amended) – February 4 2014 Page: 26
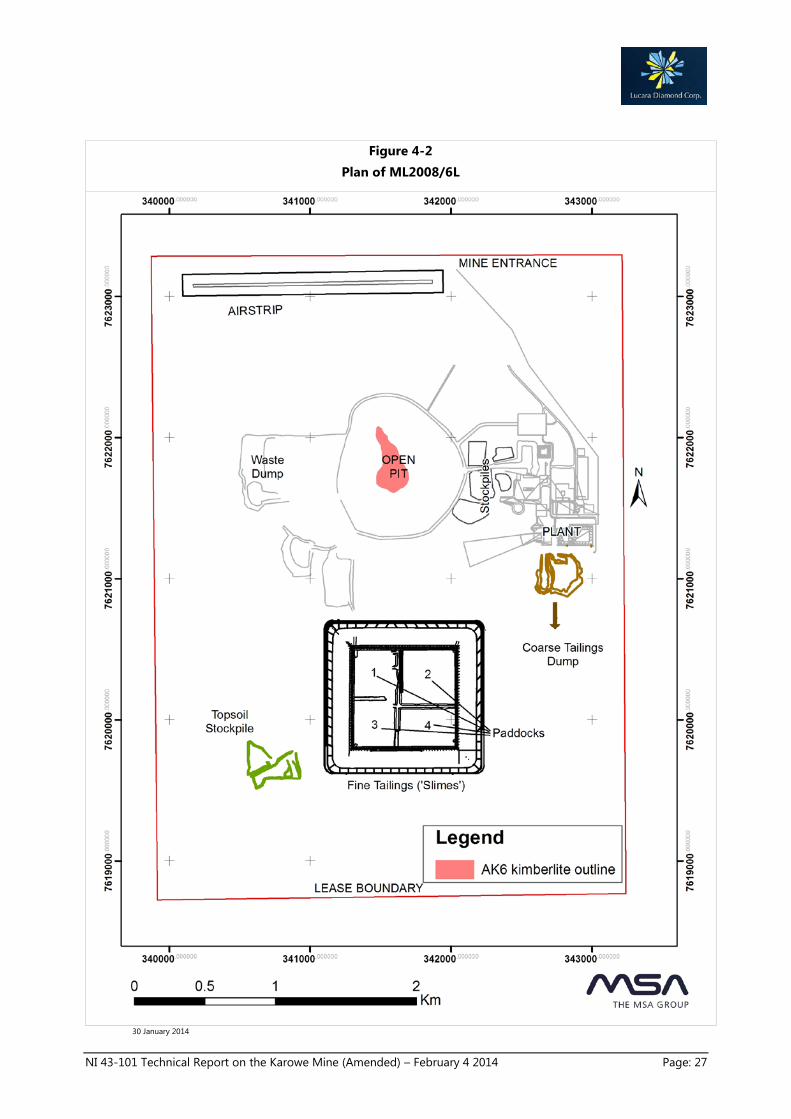
Figure 4-2 Plan of ML2008/6L
30 January 2014
NI 43-101 Technical Report on the Karowe Mine (Amended) – February 4 2014 Page: 27

4.3 Permitting Rights and Agreements Relating to the Karowe Mine
4.3.1 Surface Rights
The surface area of ML2008/6L was originally communal agricultural land administered by the Letlhakane Sub-Land Board, which falls under the Ngwato Land Board, Serowe. It was used for grazing livestock and limited arable farming. Boteti has obtained common law land rights for the ML2008/6L surface area and the access road. These rights will remain in force for the life of mine.
4.3.2 Taxes and Royalties
The Karowe Mine is taxed according to a prescribed schedule of the Income Tax Act. Profits from the Karowe Mine are taxed according to the annual tax rate formula as follows:
70-(1500/x) where x is the profitability ratio given by taxable income as a percentage of gross income (provided that the tax rate will not be less than the company rate). Boteti is allowed to offset withholding taxes against the variable Income Tax liability.
A royalty of 10% on actual sales of diamonds is levied by the Government of Botswana.
4.3.3 Obligations
Subject to the provisions of the Mines and Minerals Act, the holder of a mining licence shall:
• commence production on or before the date referred to in the programme of mining operations as the date by which he intends to work for profit
• develop and mine the mineral covered by his mining licence in accordance with the programme of mining operations as adjusted from time to time in accordance with good mining and environmental practice
• demarcate the mining area
• keep and maintain an address in Botswana
• maintain complete and accurate technical records of operations in the mining area;
• maintain accurate and systematic financial records of operations in the mining area;
• permit an authorized officer to inspect the books and records of the mine;
• submit reports, records and other information as the Ministry may reasonably require
• furnish the Ministry with a copy of the annual audited financial statements within six months of the end of each financial year.
Boteti has met all of these obligations.
NI 43-101 Technical Report on the Karowe Mine (Amended) – February 4 2014 Page: 28

4.3.4 Environmental Liabilities
Current environmental liabilities comprise those to be expected of an active mining operation. These include the open pit, processing plant, infrastructure buildings, a tailings dam, and waste rock storage facilities. The environmental permitting and closure plan is discussed in more detail in Section 20.
4.3.5 Permits
A list of permits held or in the process of being acquired by the Karowe Diamond Mine is presented in Table 4-2.
Table 4-2 List of permits on the Karowe Mine
4.3.6 Legal Challenge
In April 2010, legal proceedings were initiated against African Diamonds Plc, Lucara’s wholly-owned subsidiary, by two former directors of African Diamonds claiming entitlement to a 3% royalty on production from the AK6 diamond project (now the Karowe Mine). The claim was heard in the Botswana High Court in early June, 2011. The High Court delivered its ruling in August 2011, dismissing the claims against African Diamonds, with costs awarded against the plaintiffs. The plaintiffs appealed the ruling and this appeal was heard in the Gaborone Appeal
Statutory Permit Reference Number Responsible Authority Regulatory Instrument
EIA Permit DEA/BOD/7/9 XXVII (1360) Dept of Environmental Affairs EIA Act
Surface Rights LT/SLB/B/1 IV (231) Ngwato Land Board Tribal Land Act
Dumps Classification Registration in progress Dept of Mines Mines, Quarries, Worls and Machinery Act
Water Rights B6317, B6023, B5386 – B5389 Dept of Water Affairs Water Act
Borehole Certificates In place Dept of Water Affairs Boreholes Act
Possession and use of radioactive sources
BW0315/2011 Radiation Inspectorate Radiation Protection Act
Incinerator permit Application in progress Dept of Waste Management & Pollution Control
Waste Management Act
Waste facilities & sewage plant
Not yet licenced Dept of Waste Management & Pollution Control
Waste management Act
Waste carriers licence 02/11-020/12-004 Dept of Waste Management & Pollution Control
Waste Management Act
Blasting licence for magazine master
In place Dept of Mines Explosives Act
Licence to manufacture explosives
MMU 56973 Permit no 33/13 and MMU 114972 Permit no 29/13
Dept of Mines Explosives Act
Permit to carry bulk explosives
F35/13; F34/13; and F36/13 Dept of Mines Explosives Act
Magazine licence 386:00002948A and
385:00002947A Dept of Mines Explosives Act
NI 43-101 Technical Report on the Karowe Mine (Amended) – February 4 2014 Page: 29

Court on Jan 21, 2014. A ruling is expected from the court prior to the end of the first quarter 2014.
5 ACCESSIBILITY, CLIMATE, LOCAL RESOURCES, INFRASTRUCTURE AND
PHYSIOGRAPHY
5.1 Accessibility
The area lies on the northern fringe of the Kalahari Desert of central Botswana and is covered by sand savannah which supports a natural vegetation of trees, shrubs and grasses. The trees and shrubs are dominantly mopane (Colophospermum mopane) and tend to form thickets with intervening grassy patches. The natural vegetation has been modified by many years of cattle grazing and limited arable farming.
The property is at an elevation of 1,022 m above sea level and slopes very gently to the north into the Makgadigadi Depression. The dry valley of the now fossil Letlhakane River, directed into the Depression, passes some 18 km to the northeast of the property and is the only notable physiographic feature in the immediate area.
The area around the property is communal agricultural land used mainly for cattle grazing with limited arable farming. Surface rights have been secured over the Mining Licence and provide sufficient space for rock dumps, tailings dams and mine infrastructure.
5.2 Access
The property is accessed by 15 km of well-maintained all weather gravel and sand road from the tarred Letlhakane to Orapa road. Letlhakane village is the closest settlement and offers basic facilities. At the 2001 census Letlhakane had a population of 15,000 rising by 5.7% annually (Central Statistics Office, Gaborone), thus at present, probably has a population of 20,000 to 25,000. There are good telecommunications including cellular telephone networks in the area. Letlhakane is reached from the major cities of Gaborone and Francistown by good quality tarred roads. There is an 1800 metre airstrip at Karowe, however the closest airport with commercial flights is Francistown, some 200 km to the east and 2.5 hours away by road. There is also an airstrip within the nearby Debswana controlled Orapa Township. Both the Karowe and Orapa airstrips have immigration and customs facilities and can thus service international flights.
5.3 Climate
The climate is hot and semi-arid, with an average annual rainfall of 462 mm at Francistown, which falls almost entirely in the summer months from October to April. Summer maximum temperatures are high, generally >30°C, whilst winter days are mild and the nights cold (often <10°C) with occasional ground frost. High diurnal ranges are experienced in all seasons. The climate does not impede mining operations, which can continue year round.
NI 43-101 Technical Report on the Karowe Mine (Amended) – February 4 2014 Page: 30

Table 5-1 Climate data for Letlhakane (en.climate-data.org)
Jan Feb Mar Apr May June Jul Aug Sep Oct Nov Dec Avg Temp oC 24.6 24.0 23.0 20.7 17.1 14.2 14.1 16.8 21.1 24.6 24.9 24.5
Rainfall mm 80 72 46 25 2 1 0 0 5 23 46 63
5.4 Infrastructure and Local Resources
The area has a history of diamond mining dating back to 1971 when operations started at the nearby Orapa Mine, one of the largest diamond mines in the world. There is a reserve of qualified and experienced manpower in the immediate area. The major Ni-Cu mining operations at Tati Nickel, near Francistown, and at BCL, Selebi-Phikwe, have also added to the supply of labour with mining related skills.
In terms of ML2008/6L, the Government has undertaken to supply electrical power on commercial terms to the Karowe Mine through the Botswana Power Corporation’s national grid.
Water for the existing diamond mines derives from a strong aquifer at the contact of the Ntane Sandstone Formation and the overlying Karoo basalt. The Orapa, Letlhakane, and Damtshaa mines have a combined water demand of some 12M m3/yr and this aquifer has successfully supplied the mines for over 40 years. The additional demand of approximately 2.6M m3/yr from the Karowe Mine has been successfully met, and the aquifer remains robust.
Accommodation for personnel has been built by local companies and is leased by Boteti in Letlhakane.
NI 43-101 Technical Report on the Karowe Mine (Amended) – February 4 2014 Page: 31

6 HISTORY
The AK6 kimberlite was discovered by De Beers in 1969, but was initially considered to be small and low grade based on early work. Reassessment starting in 2003 revealed that the kimberlite was larger and had a higher grade than previously estimated.
6.1 Early Work: De Beers Prospecting Botswana (Pty) Ltd and De Beers Botswana Mining Company (Pty) Ltd.
The discovery of the AK6 kimberlite was part of the same exploration programme between 1967 and 1970 that discovered the Orapa kimberlite (named AK1) and the Letlhakane kimberlites (DK1 and DK2), in addition to some 29 other kimberlite intrusions.
De Beers Botswana Mining Company (Pty) Ltd. (the predecessor of the Debswana Diamond Mining Company (Pty) Ltd) held State Grant (“SG”) 14/72 from 16 September 1972 until 15 December 1975. Under the grant, De Beers carried out evaluation and the delineation of kimberlites discovered previously. In addition they carried out reconnaissance and detailed soil sampling.
Little data from the initial discovery and evaluation of the AK6 kimberlite is available, but it is known that the discovery was made from the interpretation of an aeromagnetic survey. The kimberlite was delineated with 44 percussion boreholes, 20 of which were recorded as intersecting kimberlite and 24 as intersecting basalt. De Beers interpreted the AK6 kimberlite to have an area of 3.3 ha and three 20 foot (~6.5 m) deep pits excavated in 1973 gave a grade of 0.07 ct/m3 (approximately 3.5 ct/100t; this sampling was not NI 43-101 compliant).
One vertical cored borehole was drilled into the kimberlite to a depth of 61 m. Weathered primary kimberlite was recorded from 8 m (De Beers, 1976).
Reconstruction from the later exploration programmes suggests that two of the pits were sunk into basalt breccia, as were many of the percussion boreholes. There were two cored holes, as well as possibly two large diameter holes drilled with a jumper (cable tool) rig.
6.2 Debswana Diamond Company (Pty) Ltd, PL17/86
The AK6 Project lies within former PL 17/86 held by Debswana from 1 July 1986 until 24 January 1998. The kimberlite lies within the area dropped at the second relinquishment. The AK6 kimberlite was not the focus of work on this licence, which concentrated on the discovery of additional kimberlite bodies in the immediate Orapa area, but it was drilled for geological information and to test its diamond content (Debswana, 1999). No details of how it was drilled or sampled are given, but it is stated as being 3.3 ha in area, comprising hard, dark green kimberlite breccia, and having a diamond grade of 0.42 ct/m3 (approximately 15 ct/100t; not NI 43-101 compliant).
NI 43-101 Technical Report on the Karowe Mine (Amended) – February 4 2014 Page: 32

6.3 De Beers Prospecting Botswana (Pty) Ltd, PL1/97
PL1/97 was issued to De Beers Prospecting Botswana (Pty) Ltd. (“Debot”) on 1 February 1997 and covered the AK6 kimberlite. However, the pipe was within the area dropped at first relinquishment in 2000, and no work was recorded on it.
6.4 De Beers Prospecting Botswana (Pty) Ltd, PL13/2000
In April 2000, Debot was granted PL13/2000 with an area of 9.95 km2 over the AK6 kimberlite. Three small diameter percussion boreholes showed the existence of the North and Central Lobes for the first time. The licence was renewed on 31 March 2003 with the area reduced to 4.90 km2. In September 2003 De Beers carried out high resolution ground magnetic surveys over kimberlites AK6, AK10 and BK11. The results of this work suggested that the AK6 kimberlite had a surface area of 9.5 ha, although this proved to be largely made up of the surrounding basalt breccia.
In December 2003, De Beers started a programme of five 12¼" boreholes intended to collect a 100 t bulk sample. The drilling was completed in February 2004, but the encouraging results only became available in October 2004, after the licence had been included in the Boteti Joint Venture.
6.5 The Boteti Joint Venture
On 17 April 2004, a joint venture heads of agreement was entered into between Kukama Mining and Exploration (Pty) Ltd and Debot for seven prospecting licences in the Orapa area totaling 1,344.27 km2 and including 29 previously discovered kimberlites, which included PL13/2000. A 12-month work programme was carried out per the heads of agreement, which resulted in the signing of a formal joint venture agreement on 20 October 2004 and the incorporation of Boteti. PL13/2000 was transferred into Boteti.
6.6 Boteti Exploration (Pty) Ltd and Boteti Mining (Pty) Ltd
The exploration work carried out by Debot on behalf of Boteti is described in Sections 9 to 12.
A Mining Licence application was submitted by the then Operator, Debot, on 28th September 2007. Previously, on 30th July 2007, Boteti had applied to the Government of Botswana under Section 25 of the Mines and Minerals Act for a Retention Licence over the AK6 kimberlite. On 9th September 2008, the Government informed Boteti that it would regard the period since the Retention Licence application as a negotiation period as allowed under Section 50 of the Act, and urged Boteti to apply for a Mining Licence. This was done, and ML2008/6L was issued effective from 28th October 2008.
On 24th May 2010, Boteti changed its name from “Boteti Exploration (Pty) Ltd” to Boteti Mining (Pty) Ltd.
NI 43-101 Technical Report on the Karowe Mine (Amended) – February 4 2014 Page: 33

Lucara purchased a 70.268% interest in Boteti from Debot in November 2009 for USD 49 million. Government approval which, under the Mines and Minerals Act Section 50 was a condition precedent for this transaction, was given on 18th December 2009. In April 2010, African Diamonds exercised its option to increase its interest by 10.268% at a cost of USD 7.3 million. In addition, African Diamonds acquired Wati Ventures and its interest of 1.351% to bring their total shareholding in Boteti to 40%.
In November 2010, Lucara and African Diamonds approved a plan for the construction of the Karowe Mine with full commissioning targeted for early 2012. On 20th December 2010, Lucara secured a 100% interest in the AK6 Project pursuant to an arrangement which combined the Company with African Diamonds Limited under a British court-approved scheme of arrangement.
On 25th July 2011, Lucara commenced trading its shares on the Botswana Stock Exchange, and on 29th August, Lucara commenced trading its shares on the TSX (after moving from the TSX Venture Exchange). On 25th November, Lucara commenced trading its shares on the NASDAQ OMX First North Exchange in Sweden.
In December 2011, the AK6 Project was renamed the Karowe Mine and construction of the mine was substantively completed by the end of March 2012 and the first production diamonds were recovered in April.
The first sale of rough diamonds from the Karowe Mine was held in June 2012 with gross total proceeds of USD 5.64 million and an average diamond value of USD 215/carat.
The commencement of full commercial production at the Karowe Mine was declared as of July 1, 2012 and by August 2012, the mine ramped up to full production.
In November 2012, Lucara recovered a 9.46 carat rare Type II blue diamond at Karowe Mine which it sold for USD 4.5 million.
A total of five sales of rough diamonds from the Karowe Mine, totaling 218,905 carats, took place during 2012. Sales were held in June, July, September, November and December. Total gross proceeds from these sales were USD 54.6 million.
In 2013, Lucara implemented a system for the sale of ‘Large and Exceptional Stones’ by tender. During 2013, a total of 46 stones were sold in three tenders through this system, including 12 stones of >100 ct each, and two stones of >200 ct each.
NI 43-101 Technical Report on the Karowe Mine (Amended) – February 4 2014 Page: 34
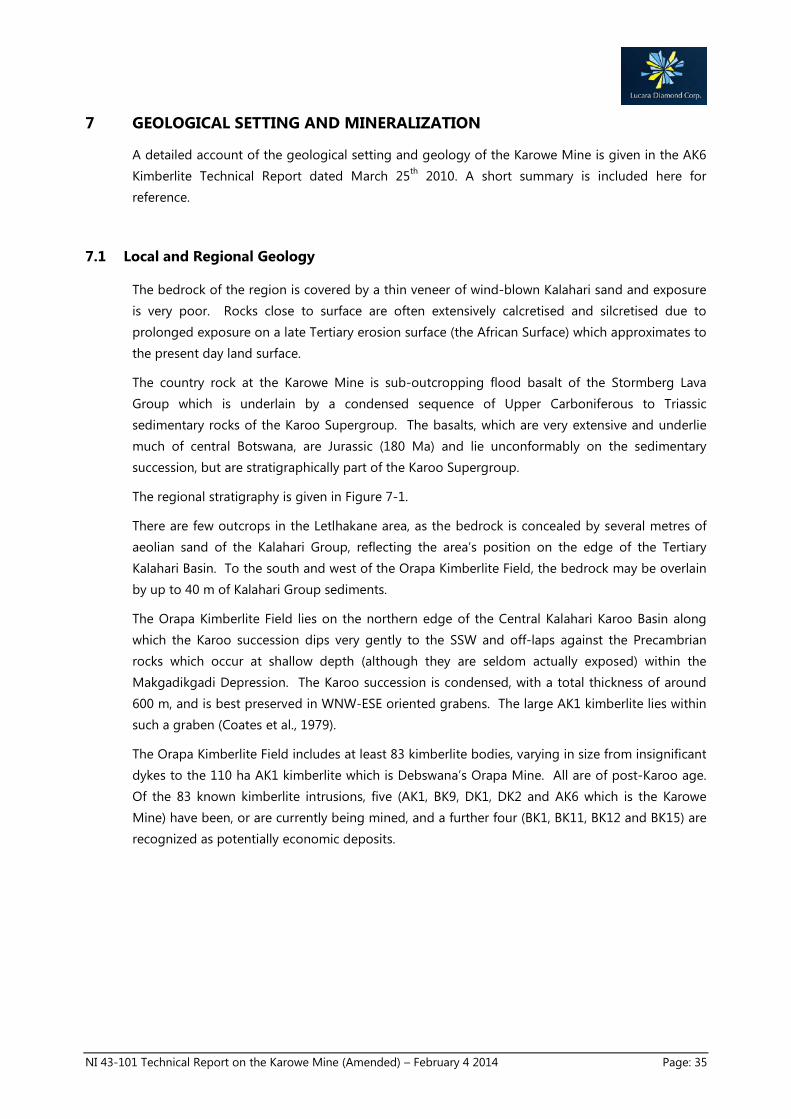
7 GEOLOGICAL SETTING AND MINERALIZATION
A detailed account of the geological setting and geology of the Karowe Mine is given in the AK6 Kimberlite Technical Report dated March 25th 2010. A short summary is included here for reference.
7.1 Local and Regional Geology
The bedrock of the region is covered by a thin veneer of wind-blown Kalahari sand and exposure is very poor. Rocks close to surface are often extensively calcretised and silcretised due to prolonged exposure on a late Tertiary erosion surface (the African Surface) which approximates to the present day land surface.
The country rock at the Karowe Mine is sub-outcropping flood basalt of the Stormberg Lava Group which is underlain by a condensed sequence of Upper Carboniferous to Triassic sedimentary rocks of the Karoo Supergroup. The basalts, which are very extensive and underlie much of central Botswana, are Jurassic (180 Ma) and lie unconformably on the sedimentary succession, but are stratigraphically part of the Karoo Supergroup.
The regional stratigraphy is given in Figure 7-1.
There are few outcrops in the Letlhakane area, as the bedrock is concealed by several metres of aeolian sand of the Kalahari Group, reflecting the area’s position on the edge of the Tertiary Kalahari Basin. To the south and west of the Orapa Kimberlite Field, the bedrock may be overlain by up to 40 m of Kalahari Group sediments.
The Orapa Kimberlite Field lies on the northern edge of the Central Kalahari Karoo Basin along which the Karoo succession dips very gently to the SSW and off-laps against the Precambrian rocks which occur at shallow depth (although they are seldom actually exposed) within the Makgadikgadi Depression. The Karoo succession is condensed, with a total thickness of around 600 m, and is best preserved in WNW-ESE oriented grabens. The large AK1 kimberlite lies within such a graben (Coates et al., 1979).
The Orapa Kimberlite Field includes at least 83 kimberlite bodies, varying in size from insignificant dykes to the 110 ha AK1 kimberlite which is Debswana’s Orapa Mine. All are of post-Karoo age. Of the 83 known kimberlite intrusions, five (AK1, BK9, DK1, DK2 and AK6 which is the Karowe Mine) have been, or are currently being mined, and a further four (BK1, BK11, BK12 and BK15) are recognized as potentially economic deposits.
NI 43-101 Technical Report on the Karowe Mine (Amended) – February 4 2014 Page: 35

Figure 7-1 Stratigraphy
Stratigraphic Unit Lithologies
Supergroup Group Formation
Kalahari Group
Not differentiated in this
area Windblown sand, overlying duricrusts
~~~~~~~~~~~~~~~~~unconformity~~~~~~~~~~~~~~~~~
Kimberlite intrusions
~~~~~~~~~~~~~~~~~unconformity~~~~~~~~~~~~~~~~~
Karoo Supergroup Stormberg Lava Group (Drakensberg Group)
Very extensive flood basalts
~~~~~~~~~~~~~~~~~unconformity~~~~~~~~~~~~~~~~~
Karoo Supergroup Lebung Group
Ntane Sandstone Formation
Aeolian sandstone
Mosolotsane Formation
Red mudstones (upper member), overlying red and green sandstones (lower member)
~~~~~~~~~~~~~~~~~unconformity~~~~~~~~~~~~~~~~~
Karoo Supergroup Ecca Group
Tlhabala Formation
Reddish grey non-carbonaceous siltstone, mudstone and shale. Weathers red, green or khaki
Tlapana Formation
Black carbonaceous shale and coal
Mea Arkose Formation
Coarse, white micaceous
sandstone and dark shales
~~~~~~~~~~~~~~~~~unconformity~~~~~~~~~~~~~~~~~
Granite gneiss and amphibolite
NI 43-101 Technical Report on the Karowe Mine (Amended) – February 4 2014 Page: 36

7.2 Property Geology
Drilling has shown the following country rock succession at the Karowe Mine property (Table 7-1). The volcanic and sedimentary units are almost flat lying.
Table 7-1 Stratigraphic thickness recorded on the AK6 Project property
Depth from surface Stratigraphic Unit
surface – ~8 m Kalahari Group
~8 – 135 m Karoo Basalt
135 – 255 m Lebung Group
255 – ~360 m Tlhabala Formation
~360 – ~480 m Tlapana Formation
>480 m Granitic basement
7.3 Kimberlite Geology
The geological summaries presented in this section, unless otherwise indicated, are extracted and summarized from internal De Beers documentation (Stiefenhofer, 2007; Hanekom et al., 2006; Tait and Maccelari, 2008). Mineral Services Canada has reviewed available relevant information, examined exposures of the kimberlite in the open pit and examined selected drill cores and is satisfied that the De Beers reports provide a reliable description of the geology of the AK6 body.
AK6 is a roughly north-south elongate kimberlite body with a near surface expression of ~3.3 ha and has a maximum area of approximately 7 ha at ~120 m below surface. The body comprises three geologically distinct, coalescing pipes that taper with depth into discrete roots. These “pipes” are referred to as the North Lobe, Centre Lobe, and South Lobe.
The AK6 kimberlite is an opaque-mineral-rich monticellite kimberlite, texturally classified primarily as fragmental volcaniclastic kimberlite with lesser macrocrystic hypabyssal facies kimberlite of the Group 1 variety (Field, 1989). The nature of the kimberlite differs between each lobe, with distinctions apparent in the textural characteristics, relative proportion of internal country-rock dilution, and degree or extent of weathering. The South Lobe is considered to be distinctly different from the North and Centre Lobes which are similar to each other in terms of their geological characteristics. The North and Centre Lobes exhibit significant textural complexity (reflected in apparent variations in degree of fragmentation and proportions of country-rock xenoliths) whereas the bulk of the South Lobe is more massive and internally homogeneous.
Kimberlite rock types identified in the AK6 kimberlite (encompassing true kimberlite as well as internal breccias dominated by basalt xenoliths) were grouped by De Beers into mappable units (Table 7-2) based on their geological characteristics and interpreted grade potential. This was based on extensive drill core logging supported by petrographic studies of representative samples,
NI 43-101 Technical Report on the Karowe Mine (Amended) – February 4 2014 Page: 37

analysis and interpretation of groundmass spinel composition, and whole-rock geochemical analysis (Stiefenhofer and Hanekom, 2005; Hanekom et al., 2006; Tait and Maccelari, 2008). The main geological features of each unit are summarised below and their interpreted spatial distribution, as reflected in the geology model of AK6, is illustrated in Figure 7-2 and 7-3. For the purposes of constructing the geological and grade model, each kimberlite unit occurring in each lobe was modelled as a separate geology solid, referred to in this report as a “domain” (Figure 7-2; Table 7-2).
Table 7-2 Kimberlite units identified in AK6 kimberlite geological model
Units occurring in more than one lobe (e.g. BBX, CKIMB) were modelled as separate domains for each lobe. The 17+YIELD material identified in the South Lobe is a variety of M/PK(S) kimberlite defined as a separate domain on account of its very high concentrate yield.
Lobe Unit Domain DescriptionNorth BBX BBX(N) Country rock brecciaNorth CKIMB CKIMB(N) Calcretised kimberliteNorth FK(N) FK(N) Fragmental kimberliteNorth KBBX KBBX(N) Kimberlite and country rock brecciaNorth WBBX WBBX(N) Weathered country rock brecciaNorth WK(N) WK(N) Weathered kimberlite
Center BBX BBX(C) Country rock brecciaCenter CFK(C) CFK(C) Carbonate-rich fragmental kimberliteCenter CKIMB(C) CKIMB(C) Calcretised kimberliteCenter FK(C) FK(C) Fragmental kimberliteCenter KBBX KBBX(C) Kimberlite and country rock breccia
Center WBBX WBBX(C) Weathered country rock brecciaCenter WK(C) WK(C) Weathered kimberliteSouth BBX(S) BBX(S) Country rock brecciaSouth CBBX(S) CBBX(S) Calcretised country rock brecciaSouth CKIMB(S) CKIMB(S) Calcretised kimberliteSouth EM/PK(S) EM/PK(S) Eastern magmatic/pyroclastic kimberliteSouth INTBS INTBS(S) Large internal block of basaltSouth M/PK(S) M/PK(S) Magmatic/pyroclastic kimberliteSouth M/PK(S) 17+YIELD High-yield magmatic/pyroclastic kimberliteSouth WBBX(S) WBBX(S) Weathered country rock brecciaSouth WK(S) WK(S) Weathered kimberliteSouth WM/PK(S) WM/PK(S) Western magmatic/pyroclastic kimberlite
NI 43-101 Technical Report on the Karowe Mine (Amended) – February 4 2014 Page: 38
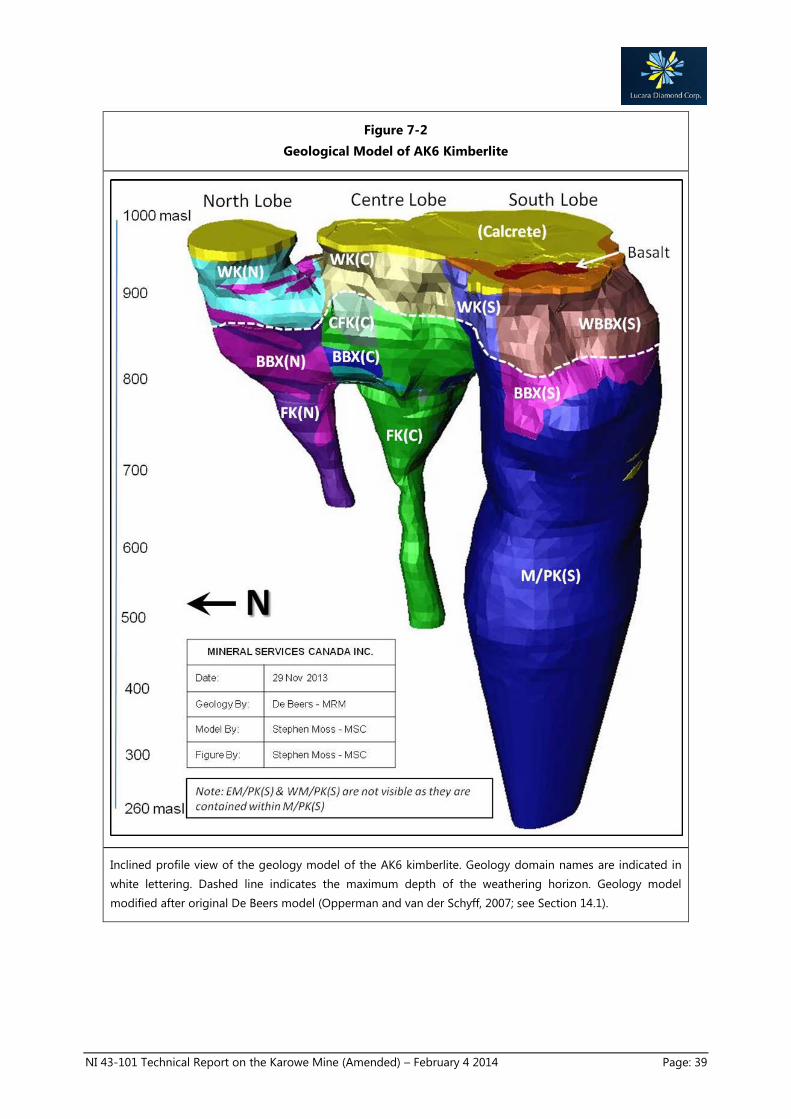
Figure 7-2 Geological Model of AK6 Kimberlite
Inclined profile view of the geology model of the AK6 kimberlite. Geology domain names are indicated in white lettering. Dashed line indicates the maximum depth of the weathering horizon. Geology model modified after original De Beers model (Opperman and van der Schyff, 2007; see Section 14.1).
NI 43-101 Technical Report on the Karowe Mine (Amended) – February 4 2014 Page: 39

Figure 7-3 Inclined profile views of the AK6 geological model highlighting internal domains
Inclined profile views of the geology model of the AK6 kimberlite highlighting the internal domains within the South Lobe (left panel) and Centre Lobe (right panel). Geology model modified after original De Beers model (Opperman and van der Schyff, 2007; see Section 14.1).
7.3.1 Calcretised kimberlite (CKIMB)
The upper parts of all three lobes contain severely calcretised and silcretised rock. This zone is typically approximately 10 m in thickness, extending up to 20 m in places. Due to the destruction of textures and resultant difficulty in recognizing specific lithologies within this zone, it has been modeled as a separate single unit extending across all three lobes (Opperman and van der Schyff, 2007). For Mineral Resource modelling purposes, the CKIMB unit was divided by lobe into three separate domains.
7.3.2 Weathered kimberlite (WK)
The upper 30 to 50 m of the kimberlite is highly weathered. The intensity of weathering decreases with depth with fresh kimberlite generally intersected at about 70 to 90 m below present day surface. Although the primary mineralogical and textural features of the kimberlite are obscured in the upper portions of the weathered zone, this material is seen to transition into the underlying
NI 43-101 Technical Report on the Karowe Mine (Amended) – February 4 2014 Page: 40

fresh kimberlite units in each lobe. Thus separate weathered units have been defined in each lobe for each of the geology domains where weathered equivalents of these domains are present at surface (Table 7-2; Figure 7-2 and 7-3). Separate models of these units are required as weathering has a significant impact on the percentage DMS yield as well as on the density of the kimberlite.
7.3.3 Basalt breccia (BBX/KBBX)
Each of the lobes is characterised by discontinuous zones of brecciated basalt (BBX), mixed with variable, but generally small amounts of kimberlite, typically less than 10%. The basalt breccias consist of large (meter-sized) to smaller basalt clasts set in a matrix of kimberlite. Basalt clasts are variably fractured and carbonate-veined and consist of vesicular and non-vesicular varieties. Opperman and van der Schyff (2007) only modelled the largest of these breccia zones and indicated that small zones of basalt breccia may be encountered in each of the pipes during mining or further evaluation. Given the density of coverage of available delineation drilling, however, large areas of high dilution that would significantly impact overall diamond grade are unlikely to be present. The bulk of the breccias occur close to the wall-rock contacts in each lobe. Basalt breccia represents a single geological unit, but for the Mineral Resource update documented in this report it has been separated into different domains by lobe (Table 7-2).
An additional geology unit (KBBX) was defined to encompass kimberlite breccias that are broadly similar to the BBX described above, but display lower levels of country-rock dilution (50% to 90%). KBBX zones appear to be interbedded and/or spatially associated with BBX domains. Tait and Maccelari (2008) interpreted KBBX deposits as either talus-type slump deposits or as deposits of possible pyroclastic origin (given their higher kimberlite content relative to BBX).
7.3.4 North Lobe kimberlite units
7.3.4.1 FK(N) – Fragmental kimberlite (North Lobe)
The North Lobe is predominantly infilled by a light greenish-grey, medium-grained (4 to 32 mm), matrix-supported, poorly sorted, massive fragmental volcaniclastic to superficially magmatic kimberlite (Hanekom et al., 2006). Basalt is the dominant country-rock xenolith type with lesser basement and Karoo sedimentary rock fragments. Two broad textural groups in the kimberlite of the North Lobe were identified: rocks with a matrix consisting of both serpentine and calcite, and samples with a matrix consisting predominantly of serpentine with minor calcite. No clear spatial distinction between the two groups could be resolved and the fragmental kimberlite was modeled as a single unit and domain.
7.3.5 Centre Lobe kimberlite units
The Centre Lobe is infilled by kimberlite that bears a superficial resemblance to the kimberlite from the North Lobe in that both lobes include non-fragmental, apparent magmatic material as well as fragmental volcaniclastic kimberlite (Hanekom et al., 2006). Macroscopically, colour and texture variations are common within Centre Lobe, but contacts between texturally distinct zones are generally gradational. Kimberlite textures locally alternate between superficially non-fragmental and more fragmental (volcaniclastic), similar to that of the North Lobe. The most consistent recognisable difference between the Centre Lobe and North Lobe kimberlite infill is a higher carbonate content in some samples from the Centre Lobe relative to North Lobe; a feature
NI 43-101 Technical Report on the Karowe Mine (Amended) – February 4 2014 Page: 41
that could reflect varying hydrothermal alteration processes (e.g. Stripp et al., 2006). Two main units of fresh kimberlite are recognised in the Centre Lobe.
7.3.5.1 CFK(C) – Carbonate-rich fragmental kimberlite (Centre Lobe)
The fresh infill in the upper part of Centre Lobe comprises a medium-grained (4 to 32 mm), matrix-supported, poorly-sorted and massive, carbonate-rich fragmental kimberlite. Basalt represents the dominant country-rock xenolith type with lesser basement and Karoo sedimentary rock fragments present. Microscopically, the majority of samples show carbonate infilling of void-space, highlighting the potential fragmental texture of the kimberlite. Point counting data reported by Hanekom et al. (2006) on a very limited sample suite suggest that the carbonate-rich fragmental kimberlite generally contains higher concentrations of olivine macrocrysts and lower country-rock xenolith concentrations than those of the fragmental kimberlite unit (see Section 7.3.5.2 below). The groundmass opaque-mineral content is also slightly higher, although overlap occurs.
7.3.5.2 FK(C) – Fragmental kimberlite (Centre Lobe)
The remaining fresh kimberlite within the Centre Lobe comprises matrix-supported, poorly sorted and massive fragmental kimberlite which is distinct from CFK(C) due to an apparent relative decrease in carbonate content. Hanekom et al., (2006) noted that samples showing clay alteration and thin magmatic selvages around olivine grains and country-rock xenoliths, i.e. a more volcaniclastic appearance, are generally but not exclusively associated with areas of increased country-rock xenolith content. This material is often greenish in colour and characterised by the presence of large blocks of basalt. Basalt breccia units in the Centre Lobe also occur within the fragmental kimberlite unit rather than in the carbonate-rich fragmental kimberlite unit. Basalt represents the dominant country-rock xenolith type with lesser basement and Karoo sedimentary rock fragments.
7.3.6 South Lobe kimberlite units
Previous reports summarizing detailed drill core logging, petrographic analyses, and geochemical analyses demonstrate the distinct character of the South Lobe kimberlite in comparison to that of the North and Centre Lobes (Hanekom et al., 2006; Stiefenhofer, 2007; Stiefenhofer and Hanekom, 2005). The upper, western part of the South Lobe is dominated by a weathered basalt breccia (WBBX(S)) with an underlying unaltered basalt breccia unit (BBX(S)), and also includes a large block (“floating reef”) of solid basalt recently recognised and mapped during mining activities.
7.3.6.1 M/PK(S) – Magmatic/pyroclastic kimberlite – South Lobe
The South Lobe is dominantly infilled by medium–grained to coarse (4 to >32 mm), matrix-supported, poorly-sorted and massive, macrocrystic magmatic/pyroclastic kimberlite. The name of this unit reflects the initial uncertainty with respect to the textural classification of the kimberlite. The kimberlite exhibits textures consistent with a magmatic or hypabyssal kimberlite (HK), but also exhibits subtle textures suggesting a possible pyroclastic origin (PK). Macroscopically the kimberlite is grey in colour and contains approximately 5% to 10% thermally metasomatised/altered country-rock xenoliths. Olivine grains are relatively fresh and abundant opaque minerals are present. Fresh monticellite is present and increases in abundance with depth.
NI 43-101 Technical Report on the Karowe Mine (Amended) – February 4 2014 Page: 42

Country-rock xenoliths are predominantly basalt with lesser basement and Karoo sedimentary rocks, but the overall proportion of crustal dilution is very low (typically <10%), rarely ranging up to a maximum of 25%. Minor zones of crude layering are locally apparent, defined by accumulations of olivine macrocrysts and sub-horizontal preferentially oriented crustal xenoliths. These zones range from 0.16 m to 1.5 m in thickness.
7.3.6.2 EM/PK(S) – Eastern diluted magmatic/pyroclastic kimberlite – South Lobe
A pipe-shaped internal kimberlite unit, defined by De Beers along the eastern part of the South Lobe, comprises coarse to medium-grained (4 to >32 mm), matrix-supported, poorly sorted and largely massive magmatic kimberlite which is distinct from M/PK(S) primarily due to an apparent increase in small (typically <1 cm) country-rock fragments, readily visible in drill core. Hanekom et al. (2006) reported that this unit contains fewer olivine macrocrysts in comparison with the remainder of the South Lobe and abundant coarse microlitic diopside was observed in thin section. Perovskite appears to be slightly more abundant in the diluted zones and the groundmass shows a greenish colour, possibly due to serpentinisation. Country-rock clasts primarily comprise basalt, with less common xenoliths of basement, and Karoo sedimentary rock. Basement fragments may locally be more abundant than in the M/PK(S) unit. Proportions of crustal dilution range from 3% to 10%. Greenish serpentinised zones are common. In addition to the visual differences, EM/PK(S) exhibits differences in whole rock geochemistry, percentage DMS yield and bulk density relative to M/PK(S).
7.3.6.3 WM/PK(S) – Western diluted magmatic/pyroclastic kimberlite – South Lobe
A pipe-shaped internal kimberlite unit has also been defined in the western portion of the South Lobe and displays geological characteristics that appear different to those of the M/PK(S) and EM/PK(S) units. WM/PK(S) comprises greenish-grey, medium-grained (4 to >32 mm), matrix-supported, poorly sorted, massive magmatic kimberlite, and is macroscopically distinct in colour due to its apparent altered character. This material shows additional differences in whole rock geochemistry, percentage DMS yield and rock density relative to EM/PK(S) and M/PK(S). Olivine is serpentinised and locally completely weathered out from drill core. Basalt represents the dominant country-rock lithology. Less common basement and rare black shale xenoliths are also present in places. Crustal dilution ranges from 7% to 36%. The geometry of this unit is somewhat speculative due to sparse drill coverage.
7.3.6.4 17+YIELD
Metallurgical testing and processing of large diameter drill samples indicated a substantial variation in the ratio of concentrate yield to wet head feed mass (Stiefenhofer, 2007). A cut-off value of 17% DMS yield was applied to large diameter drill samples, and the resulting envelope around these high yield samples forms a sub-zone within the interior core of the M/PK(S) unit that was modelled as a separate domain due to its metallurgical significance for processing. This solid is thus not a traditional geological boundary but rather an envelope defining a percentage yield value. The substantial variation in yield throughout the South Lobe is attributed to a combination of primary and secondary processes, including olivine concentration, alteration and country-rock dilution.
NI 43-101 Technical Report on the Karowe Mine (Amended) – February 4 2014 Page: 43

8 DEPOSIT TYPES
The AK6 kimberlite intrusion which comprises the Mineral Resource of the Karowe Mine is a kimberlite diatreme, or pipe, which was the feeder to a now eroded kimberlite volcano. Kimberlite is by far the most important primary source of natural diamond.
Diamonds are a high pressure (~50 Kbar) and temperature (~1,200°C) variety of carbon, which form at depths of at least 150 km below the earth’s surface. Kimberlite is a volcanic rock, which originates at great depth, between 150 km and 300 km, in the asthenosphere. Rapidly ascending kimberlite magma entrains diamonds, together with other rock fragments and minerals present at those depths.
Kimberlite is named after the diamond-mining town of Kimberley, South Africa, where the diamond-bearing rock type was first recognised. Prior to the Kimberley discoveries in the late 19th century, all world diamond production had been from alluvial deposits and the primary source was unknown.
Only a small minority of kimberlite bodies contain diamonds in sufficient concentrations to be considered as diamond ore. The great majority of kimberlites have zero or very low diamond contents. It has been found that those which do have elevated diamond tenors usually occur in areas of old and stable crust, which are typically found in the cratonic cores of continental blocks. Kimberlites within younger orogenic belts usually contain few or no diamonds. Cratonic areas are characterised by thick crust and low geothermal gradients.
The transportation of entrained diamonds to the surface must be rapid in order to prevent their resorption or retrogression to graphite as pressure is released. Kimberlite magma is very rich in volatiles, notably CO2, which makes this rapid ascent possible, and explosive breakthrough to the surface may start at depths of 2 to 3 km, giving rise to the characteristic carrot shaped pipe, or diatreme.
A number of challenges are inherent in sampling and evaluation of kimberlites, and any evaluation programme should be designed to mitigate these challenges:
Even in economically viable deposits, diamonds are usually present in extremely small quantities, and their distribution within the host tends to be erratic (e.g. a grade of 20 carats per hundred tonnes (cpht) is equivalent to 0.04 parts per million)
The size and value of stones is erratic and it is possible that the bulk of the value of a parcel of diamonds is attributable to a small number of individual stones or even a single stone
Drill sampling of hard kimberlite tends to break larger diamonds, and under-recover smaller diamonds due to a reduction in liberation
It is not uncommon for there to be multiple intrusions within a single kimberlite pipe, so that the later intrude the earlier ones. The tenor and quality of diamonds may vary between different facies and domains within the kimberlite pipe, therefore a good geological model and geologically controlled sampling are important in evaluation
To mitigate the evaluation challenges caused by these factors, very large samples are required. In most diamondiferous kimberlites, grade may be determined by relatively small samples and
NI 43-101 Technical Report on the Karowe Mine (Amended) – February 4 2014 Page: 44

analysis for diamonds using caustic fusion total liberation diamond content samples. This is because the diamond population in a kimberlite follows a log normal size distribution. The size frequency of the commercial sized diamond population can therefore be accurately estimated from the size frequency of the ‘microdiamond’ population. However, the microdiamond population does not provide adequate revenue information. In order to determine the typical revenues to be expected for a diamond deposit, the following is required:
Grade (cpht)
Diamond size frequency distribution (SFD)
Diamond revenue (USD/ct), measured by the valuation or sale of a complete parcel of diamonds at current prices
In order to measure a Mineral Resource with respect to diamonds, the following parameters must be defined:
Tonnage, which is the calculated volume of the ore deposit multiplied by its density (specific gravity)
Grade (at a specified bottom screen size cut-off)
Average diamond value (at the same bottom screen size cut-off)
Karowe produces diamonds of relatively high average value, which is at least in part due to the presence of Type IIa diamonds. Moore (2009) has reported the characteristics of Type IIa diamonds. These were originally distinguished on the basis of their infra-red (IR) spectra, with Type IIa stones characterised by their very low (<20 ppm) nitrogen contents. The Type IIa stones often have top quality white colours (D-G), a consequence of their low nitrogen contents. They include the largest gem diamond ever found, the 3,106 ct Cullinan, recovered from the Premier Mine, South Africa, as well as gems like the legendary Koh-i-noor, from India.
Type IIa diamonds have the following general characteristics:
Morphology is typically irregular and stones are often elongated and distorted. They are described as being highly resorbed. Very rarely, primary crystal faces are preserved
They can be almost any colour except yellow (reflecting the absence of nitrogen). Many are of top white colour (D,E,F or G), but they also occur in shades of brown.
Silicate, oxide and sulphide inclusions are rare
Unlike Type I diamonds, which cleave in steps, the Type IIa stones often show excellent planar cleavage – a characteristic linked to their low nitrogen contents
With rare exceptions, Type IIa stones do not fluoresce in ultra-violet light
The paragenesis of Type IIa diamonds does not appear to be linked to either the peridotitic or eclogitic suites. The presence or absence of peridotitic pyrope or eclogitic garnets does not therefore provide a direct indication of the presence or absence of Type IIa diamonds.
NI 43-101 Technical Report on the Karowe Mine (Amended) – February 4 2014 Page: 45

9 EXPLORATION
This section summarizes advanced exploration work on the AK6 kimberlite done by Boteti Exploration (Pty) Ltd from December 2003 until the completion of the final geological report in May 2007. All work was carried out by De Beers Prospecting Botswana (Pty) Ltd, the operator of the Boteti joint venture, under PL13/2000.
The AK6 kimberlite was continuously held by De Beers or Debswana under a succession of prospecting licences from the time of its discovery in 1969, until the project was acquired by Lucara in 2008. Limited and shallow sampling had shown that it was diamondiferous, but it was initially thought to be very low grade and relatively small (3.3 ha). Thus for many years it was not a priority for thorough exploration. Subsequent work documented a basalt breccia around and over parts of the kimberlite, which was not fully appreciated early in the exploration history of the resource, and that the resource was previously under-sampled. The current Mineral Resource and Mineral Reserve is based mainly on the exploration work described in this section, augmented by recent production and sales data.
9.1 Exploration approach and methodology
The exploration of AK6 kimberlite followed a staged approach, which can be summarized as follows:
Initial exploration work – prior to the Boteti Joint Venture, in late 2003, De Beers carried out geophysical surveys and drilled 5 x 12¼" holes, which gave a 97 t (in-situ) bulk sample. This resulted in a sampling grade of ~23 ct/100 t and good quality diamonds. Due to a 10-month lapse between the completion of drilling and the release of the sampling results, De Beers committed PL13/2000 to the Boteti Joint Venture prior to these encouraging results being known.
Advanced Exploration Phase 1 – Based on the initial work, the AK6 kimberlite was declared an “advanced exploration project”. The next step was to define a high confidence Inferred Mineral Resource and recover 500 ct from 13 large diameter drill holes at 70 m spacing. The external contacts and internal geology of the kimberlite were explored through an extensive programme of delineation drilling and high resolution geophysics.
Advanced Exploration Phase 2 – the results of phase 1 merited phase 2, the objective of which was to define an Indicated Mineral Resource and recover a large diamond parcel, ideally 3,000 ct, to reduce revenue uncertainty. Large diameter drill holes were placed at 50 m centres and trenches prepared for recovery of the required parcel of diamonds. Further delineation drilling was also done.
Advanced Phases 1 and 2 overlapped in time, due to a decision to fast track the project.
Initial conceptual mining studies showed that exploration should extend to 400 m below surface in the South Lobe, and 250 m below surface in the North and Central Lobes. These were the limits of possible open pit mining based on an initial economic assessment. The studies concluded that AK6 kimberlite was not likely to be an underground mining proposition.
NI 43-101 Technical Report on the Karowe Mine (Amended) – February 4 2014 Page: 46

Exploration by Boteti is summarized in Table 9-1 below. The drilling programmes are discussed in detail in Section 11 below.
Table 9-1 Summary of Exploration Programmes
Stage Work done Duration
100 tonne bulk sample
5 x 12¼" large diameter drill holes totaling 679 m.
2003 - 2005 DMS and diamond recovery
geophysical surveys
Advanced Exploration Program
Phase 1
44 x 6½" percussion holes for delineation totaling 4,575 m
2005 - 2006
12 x cored boreholes (NQ) as LDD pilots, totaling 2,980 m
17 x inclined boreholes (NQ) for delineation totaling 6,904 m
13 x 23" LDD totaling 3,699 m
DMS processing of 1,775 tonnes diamond recovery from 112 tonnes of concentrate
Advanced Exploration Program
Phase 2
11 x cored boreholes (NQ) as LDD pilots totaling 4,181 m
2006 - 2008
29 x inclined boreholes (NQ) for delineation totaling 8,679 m
12 x 23" LDD totaling 4,265 m
DMS processing of 2,235 tonnes
diamond recovery from 194 tonnes of concentrate
trenching
DMS processing
diamond recovery
9.2 Geophysical Surveys
The AK6 kimberlite was first detected from an aeromagnetic survey in 1969. During 2005, the kimberlite was surveyed by De Beers in great detail by four ground geophysical methods as outlined in Table 9-2 below. The geophysical data was used in the preparation of the first geological model and in volume calculations.
The geophysical surveys were highly effective in delineating the kimberlite. However drilling results show that the geophysical interpretations lead to an overestimate of the surface area of the kimberlite, since the surveys interpreted associated basalt breccias as “kimberlite”. This over-estimation has been subsequently resolved by detailed drilling.
NI 43-101 Technical Report on the Karowe Mine (Amended) – February 4 2014 Page: 47

Table 9-2 Summary of high resolution geophysical surveys conducted over the AK6 Kimberlite
Method Line km Comments
Magnetics 262.4 Very strong positive magnetic response, possibly influenced by basalt content
Gravity 62.6 Complex anomaly but overall a subtle Bouguer gravity negative due to the weathering of the pipe
Electro-magnetics (Geonics EM34 frequency domain)
57.6 Approximately defines kimberlite contacts
Controlled Source Audio-frequency Magneto-Tellurics (CSAMT)
Detected the three lobes at depth
NI 43-101 Technical Report on the Karowe Mine (Amended) – February 4 2014 Page: 48

10 DRILLING
Drilling of the AK6 kimberlite is described in detail in a previous technical report dated 25th March 2010.
Beginning in late 2003, extensive drilling works were undertaken on the AK6 kimberlite. The drilling can be divided into that done to delineate the extent of the kimberlite and to map its internal geology, and density, and that done to obtain large kimberlite samples for diamond grade and revenue estimation. The drilling is summarized in Table 10-1, grouped into the exploration phases described in Section 9 above. Borehole locations are illustrated in Figure 10-1. Drill core storage is shown in Figure 10-2.
Table 10-1 Summary of exploration drilling programmes on the AK6 Kimberlite
Phase of programme
Purpose of drilling Drill Type
Hole size
No. holes
Total metres Duration
100 tonne bulk sample
Initial sampling
percussion (reverse
circulation) 12¼" 5 679 late 2003-2/2004
Advanced Exploration
Program Phase 1
delineation percussion 6½" 44 4,575 2004-2005 delineation core NQ 17 6,904 2/2005-10/2005
piloting core NQ 12 2,979 bulk
sampling LDD 23" 13 3,699 7/2005-2/2006
Advanced Exploration
Program Phase 2
piloting core NQ 11 4,181 11/2005-08/2006 delineation core NQ 29 8,679 04/2006-02/2007
bulk sampling
LDD 23" 12 4,265 04/2006-08/2006
NI 43-101 Technical Report on the Karowe Mine (Amended) – February 4 2014 Page: 49

Figure 10-1
Map of the LDD holes and bulk sample trench
May 2006
Figure 10-2 The core shed at Karowe Mine
NI 43-101 Technical Report on the Karowe Mine (Amended) – February 4 2014 Page: 50

11 SAMPLE PREPARATION, ANALYSES AND SECURITY
The sample preparation, analyses and security measures applied during the original evaluation programme was described in the previous technical reports and is summarised here for reference.
Samples for macrodiamonds (+1.0 mm diamonds) were taken by means of:
• Five 12¼" reverse circulation boreholes
• 25 x 23" reverse flood airlift assist drilling
• Trenching, where sample was loosened by blasting and/or earthmoving equipment
All sample preparation and analysis was done by De Beers between 2003 and 2007.
11.1 Reverse Circulation, 12¼" Drilling
The sample returned by the drill was de-slimed on site, at the drill, using a 1.47 mm screen. No details of the quality control applied to this sample collection are available. For example, it is not known whether checks were made for +1.47 mm material passing into the undersize.
All the material from each borehole was combined and treated as a single sample. The samples were sent to the De Beers Evaluation Services Department (“ESD”) laboratory in Kimberley, South Africa, and a concentrate prepared using a DMS plant. No details of this work, or of quality control measures, are provided. The concentrate was shipped to the De Beers Group Exploration Macro-Diamond Laboratory (“GEMDL”) in Johannesburg for diamond recovery. Due to inadequate information, it is not possible to comment on the sample preparation, security and analytical procedures.
11.2 Reverse Flood, 12¼" Drilling
There were two phases of Large Diameter Drilling (“LDD”) work, the first from July 2005 – February 2006 (13 holes, 3,699 m) and the second from April 2006 – August 2006 (12 holes, 4,265 m). Sample preparation and analysis procedures were the same for both phases.
Sample returned from the drill was de-slimed to +1.0 mm at the drill using a vibrating screen. The undersize screen was monitored for loss of +1.0 mm material, and if observed, the drill was stopped until the problem was addressed.
The sample was collected from the screen in cubic meter sample bags, under supervision of a geologist. It was then transported to the DMS plant at the De Beers Letlhakane camp on a flat-bed lorry, also under the charge of the geologist. At the camp, the responsibility for the sample passed to the plant foreman.
The plant was a 10 t/hr dense media separation mobile unit. During phase 1, the plant received 1,775 t of headfeed, which produced 112 t of concentrate, giving an average DMS yield of 6%. Samples from the South Lobe had a significantly higher yield (7.8%) than those from the Central and North Lobes (mean 1.1%). This can be related to the higher density of the South Lobe
NI 43-101 Technical Report on the Karowe Mine (Amended) – February 4 2014 Page: 51

(average 2.78 t/m3) against the North and Central Lobes (average 2.43 t/m3). During phase 2, the total headfeed was 2,235 t which produced 194 t of concentrate, a yield of 8%.
Following processing, the concentrates were collected in plastic drums which were sealed with security tags, and stored within a secure cage. The drums were then placed in sea containers with infra-red motion detector surveillance. Concentrates were shipped to GEMDL in Johannesburg inside sealed shipping containers which were carried on flatbed trucks. The loading of the trucks was supervised by Debswana security and the Letlhakane police. Both Debswana security and the Letlhakane police escorted the trucks to the Botswana / South Africa border. Once cleared through customs, the trucks were escorted within South Africa by De Beers security officials. The documentation accompanying the concentrates was in accordance with the Kimberley Process.
11.3 Trench Samples
The trench samples were concentrated at the Letlhakane camp in a similar manner to the LDD samples, except that in order to reduce the volume of sample to be processed through the plant and GEMDL, part of the sample was treated with a +2.00 mm bottom screen cut-off.
Coarse +6.0 mm tailings from the DMS plant were re-crushed to -6.0 mm and resubmitted to capture diamonds locked in the larger size fraction. Undersize tailings (+1-6 mm) were discarded.
The trench material required some modifications to the plant, which also allowed the average feed rate to be increased to 12 t/hr. The modifications were:
• A mobile jaw crusher pre-crushed the trench samples to -100 mm
• A tertiary scrubber was added to reduce fines
• The secondary jaw crusher was replaced by a cone crusher in an attempt to reduce diamond breakage
• Installation of a tailings screen and conveyors
• Installation of a flocculant addition system at the de-sliming cyclone
• Replacement of the 200 mm degritting cyclone with a 350 mm degritting cyclone
Sample was taken to the Letlhakane camp in haul trucks owned by the mining contractor Strata Mining (Pty) Ltd. The samples were stockpiled within the camp security area and each pile marked with a metal tag bearing the sample number. The concentrates were collected and shipped in the manner described above for the LDD samples. Their treatment at GEMDL was as for the LDD samples.
11.4 Diamond Recovery
Diamond recovery was done at GEMDL in Johannesburg. The diamond recovery parameters at GEMDL were the same for all phases. The GEMDL facility is fully ISO17025 certified. The recovery area of the GEMDL is a security “red area” and is subject to access control, three tier surveillance and hands off processing.
NI 43-101 Technical Report on the Karowe Mine (Amended) – February 4 2014 Page: 52
The concentrates arrived at GEMDL in the same sealed 50 litre drums they had left the sample plant in. Samples weighing 10 kg or more (wet) were treated through the main processing section. Drums within one specific sample were combined to expedite treatment and ease of handling. Material of -4 mm was passed through a dry X-ray sorting process with subsequent magnetic scalping of the X-ray tails to recover non-luminescent diamonds. Material +4 mm was passed through a wet X-ray process (Flowsort) with the X-ray tailings dispatched as process tailings.
Diamond sorters removed diamonds from the prepared sample fractions. This was done inside secure glove boxes and recovered diamonds were placed into magnetically sealed diamond canisters.
All of the X-ray concentrates were sorted three times, and non-magnetic fractions were sorted once or twice. The sorting efficiency was set at 98% diamond recovery (per carat weight). Recovered diamonds were sent to the final sorting section and stripped concentrate tailings to the hand sort tailings packaging section. Final sorting consisted of a number of processes aimed at arriving at a DTC sieve class for each sample. There was also a de-falsification process which involves the removal of mis-identified material which is not diamond. If necessary an infra-red spectrometer was used to confirm diamond.
All equipment and floors were purged between consignments. For quality assurance, monitor diamonds were added to the sample by an external monitoring team. After defalsification, the monitor diamonds were removed.
The diamonds were then sieved using DTC standard diamond sieves. Larger diamonds (+ 3 sieve) were photographed. Diamond breakage studies were done on a selection of diamonds to estimate the amount of diamond damage on individual stones from the drilling and sample treatment processes. The impact of diamond damage on the size frequency distribution can be offset in the resource modelling process, by reference to microdiamond data. However, the impact on revenue estimation is more difficult to address.
The diamonds were then sent to Harry Oppenheimer House in Kimberley, for acid cleaning, re-sieving and final re-weighing. The X-ray tailings were reconstituted and put into 50 litres blue plastic drums, packed into 6 m shipping containers, and returned to site.
NI 43-101 Technical Report on the Karowe Mine (Amended) – February 4 2014 Page: 53

12 DATA VERIFICATION
A Mineral Resource estimate for the AK6 kimberlite pipe extending to a depth of 750 mbs (255 masl) was initially undertaken by De Beers in 2006 (Phase 1; Bush, 2006), and updated in 2007 to reflect changes to the geology model (Phase 2; Bush, 2007). A number of internal and external audit and assurance reviews were undertaken by various parties to determine the quality of data used to develop the AK6 Mineral Resource model. These are summarized in the technical report by MSA (2010). The Mineral Resource estimate was reviewed internally by the Mineral Resource Management (“MRM”) group at De Beers (De Beers MRM, 2006; De Beers MRM, 2007; Bosma, 2008) and the 2007 estimate was further reviewed externally by Z-Star (Bush, 2008a; Bush, 2008b) and Anglo American (Rice et al., 2008).
The review of the Mineral Resource estimate by Z-Star resulted in a small net decrease in the resource volume (1.3%) and total carats (0.35%). The independent review by Anglo American identified and corrected errors in the geological data, and resulted in a description of the geology model as coherent and robust, and the Mineral Resource estimate as comprehensive. The biggest risk identified was the revenue model, due to the relatively small parcel of diamonds valued at the time (MSA, 2010).
The De Beers Mineral Resource estimate, incorporating the results of internal and external reviews, was subsequently incorporated into a Feasibility Study reported by MSA in 2010. Minimal further verification of the technical work was possible for the 2010 report due to the long interval of time between completion of the work and when the report was commissioned (MSA, 2010).
The focus of the sections below is on verifying critical aspects of the previously reported Mineral Resource estimate (MSA, 2010), as well as of production and geological data obtained subsequent to 2010. Updates or modifications of the Mineral Resource estimate for AK6 required as a result of new information obtained subsequent to 2010 are discussed further in Section 14.
12.1 Basis for geology model
The different kimberlite units identified within each lobe of AK6 (see Section 7.3) were initially determined by De Beers on the basis of visual criteria, and subsequently supported using petrography and geochemistry data. The units identified to date represent either distinct kimberlite types with the potential for different diamond populations and/or diamond grade (e.g. M/PK(S), FK(N), FK(C)), or metallurgically-distinct zones such as “weathered” kimberlite (e.g. WK(S); WK(C); WK(N)) which have potential implications for mining and processing.
Petrography reports (Stiefenhofer, 2007; Field, 1989) were reviewed and the petrographic characteristics used to distinguish key kimberlite rock types and support macroscopic distinctions were found to be appropriate. No thin sections were available to review the petrography in detail.
The summary report and analysis of whole rock geochemistry data from 80 drill core samples spread across all three lobes from the pilot holes drilled adjacent to LDD holes (Stiefenhofer, 2007) was also reviewed. A distinct geochemical signature is apparent in plots of various trace element ratios (Zr/Ni; Nb/Y; TiO2/Y) for the South Lobe relative to the Centre and North Lobes; the Centre and North Lobes are compositionally similar. The geochemistry results were used to confirm observations from drill core logging and petrography, and to redefine the boundary
NI 43-101 Technical Report on the Karowe Mine (Amended) – February 4 2014 Page: 54

between the Centre and South Lobes. The boundary between the South and Centre Lobes does, however, remains poorly constrained due to the spacing of drill holes from which the samples were obtained.
The approach to identifying different kimberlite units is deemed by the QP to be broadly appropriate and consistent with industry practice.
12.2 Drill core logs
Drill core photographs for 44 of the 51 delineation (DDH) holes and 21 of the 23 pilot holes (PLT – drilled next to LDD holes) were reviewed by MSC and compared with digital lithology logs (assignment of intervals to kimberlite units) to evaluate the consistency and reliability of geological logging. No original paper logs were available for review. It was therefore not possible to check the original logging data and how this reconciles with kimberlite unit intervals recorded in the digital database. Nonetheless, the drill core photograph review provides a check on the overall consistency of the digital lithology logs as well as identification of potential errors therein. Based on observations of photos, logging data from 16 of the 74 drill cores were found to contain apparent minor errors in the form of an incorrectly applied logging code, incorrect down-hole distance of contacts, dilution estimation, and un-recognized intervals of distinct geology. In addition, three drill core logs (DDH041, DDH33, PLT 19) contained significant errors (>5 m down-hole difference) in the location of internal geology contacts and/or contacts between kimberlite and country rock, with potential implications on the overall pipe model volume. Nineteen holes were not photographed adequately to fully evaluate. While errors were detected by the review process, these are considered by the QP to be relatively minor and do not have a significant impact on the overall geology model and volume estimate for AK6.
In addition to the drill core photograph review, two drill cores were previously reviewed by MSA in 2010, and the QP reviewed an additional two drill holes in July 2013. These were found to be logged correctly and, in the case of the two drill holes reviewed by MSA, showed apparent consistency between the original logs and the digital logs (MSA, 2010). The positional accuracy and methodology of borehole surveys are commented on in MSA (2010).
12.3 Internal dilution
Estimates of the volume percent of wall-rock fragments (internal dilution) exceeding 0.5 to 1 cm in size were determined by line scan measurements over 0.3 m and 0.5 m intervals from 67 of 74 drill cores at approximately 4 to 5 m spacing down hole. The methods and data used by De Beers to estimate average percentage dilution for each kimberlite unit in AK6 are considered by the QP to be appropriate and the results a reasonable representation of the overall levels of internal dilution present. The line scan method is not comprehensive, but appears to provide representative coverage of the AK6 deposit and is broadly consistent with industry best practice. Independent analysis by MSC of line scan data yielded dilution estimates that are not materially different to those obtained by De Beers.
12.4 Geological Model
The original AK6 geology model was completed by Golder Associates Africa in 2007 (Opperman and van der Schyff, 2007). This model was further expanded by Farrow in 2007 by modelling a
NI 43-101 Technical Report on the Karowe Mine (Amended) – February 4 2014 Page: 55

domain of expected high DMS yield (17+YIELD) within the South Lobe magmatic/pyroclastic kimberlite. The Anglo American Technical Division (MinRED) conducted a project review during the Front End Engineering Design (“FEED”) phase of the project in 2008, and recommended an update to the model (Rice et al., 2008). The 2008 3D geology model update by Tait and Maccelari (2008) incorporated these recommendations, and represented the most recent model version for AK6 prior to 2013. This model was reviewed in GEOVIA’s GEMSTM software (GEMSTM) by MSC to verify that it represents a valid interpretation of the data available at the time.
The review of the 3D geology model did not identify any significant errors or concerns. MSC noted that the extent and geometry of the WM/PK(S) unit is very poorly constrained at present by drilling, in particular in the north-south direction, and thus may potentially be significantly larger than the interpretation indicated in the 2008 3D geology model. However, due to the relatively small size of this unit as well as the grade data and interpolation approach used for grade estimation (see Section 14.3), the Mineral Resource estimate of AK6 is not considered to be sensitive to potential variance in the size of WM/PK(S).
12.5 Bulk density data
The bulk density data used for estimation in 2008 were derived from sampling of drill cores from delineation drilling (2004 to 2006) and pilot holes drilled prior to the LDD drill holes (2005 to 2006). Bulk density (specific gravity) measurements were done on core samples using a water immersion method, by taking a 15 cm length of core and weighing it in air and in water and calculating moisture to derive wet and dry bulk densities (MSA, 2010). Details of the procedures followed are not available but the general approach used by De Beers is in line with industry best practise. MSC reviewed the dataset applied by De Beers in 2008 (Bush, 2008a), verified that bulk density samples were correctly coded according to the 2008 geology model solids, and further checked the data against original De Beers sample inventories for transcription errors. No significant data discrepancies were identified.
12.6 LDD grade data
Two large diameter drill (LDD) sampling programs were carried out in two phases from 2006 to 2007, during which a total of 30 holes comprising 8,635 m of 23 inch diameter drilling were completed. Samples comprising 12 m increments down hole were collected and processed from 24 of these LDD drill holes. The De Beers sample set used in the 2008 estimate (Bush, 2008a) was verified to conform to the 2008 geology model solids, and was checked against the original LDD sample results for transcription errors. This review identified several samples reported by Bush (2008a) that did not reflect the original LDD sample grades returned from processing and thus required correction before inclusion in the current Mineral Resource update.
12.7 Production data
12.7.1 Grade control data
The AK6 kimberlite has been mined for diamonds at Karowe Diamond Mine since April 2012. Detailed records of all ore haulage are maintained by Karowe Mine. Individual truck haul tally sheets are maintained on a daily basis for each different aspect of ore mining and stockpiling.
NI 43-101 Technical Report on the Karowe Mine (Amended) – February 4 2014 Page: 56

These records include the truck type, time of each trip, departure location, tipping destination and the material type being transferred (rock type, kimberlite lobe and bench from which it was derived). These data are captured by Karowe staff into ore depletion reconciliation workbooks, and survey volume calculations are used to verify the results obtained. These records provide a detailed breakdown of all ore movement on site and can be used with a high level of confidence to confirm the source material for plant production where the material was moved directly from the pit to the plant. While accurate records of stockpile material feed to the plant are maintained, ore from different source locations is blended on the stockpiles. Thus, when stockpile material forms a significant component of the plant head feed, it is not possible to accurately reconcile production periods and diamond parcels with a source location in the pit. The QP did not undertake a comprehensive audit of the grade control database. However, several of the hard copy tally sheets were compared with the Mineral Resource depletion records to check for consistency and these were found to be accurate.
The survey equipment used to generate mine survey data include a Trimble S8 Total Station and a Fujiyama Hi Target V30 GNSS RTK system. Valid calibration certificates for both these systems were observed and the survey data generated are considered to be of acceptable quality.
12.7.2 Process data
The Karowe Mine plant process was briefly reviewed and QA / QC procedures in place are considered to be within or better than industry standards. Quality control checks are in place for all plant processes, including (but not limited to): weekly belt cut testing and calibration of weightometers; weekly tracer testing of DMS cut-point and recovery x-ray efficiency; daily particle size distribution granulometry studies at key points in the process stream; and regular data capture and monitoring of process-related information at hourly, daily and weekly levels as required.
12.7.3 Diamond data
Diamond data used for the updated Mineral Resource estimate documented in this report include recoveries by production batch sieved according to standard Diamond Trading Company (“DTC”) size classes from DTC1 to DTC23, with diamonds larger than 10.8 ct recorded separately. Size data generated on site were compared with size data from the Karowe Mine diamond facility in Gaborone, where diamond parcels are further sized and parcelled for export, and a comprehensive audit of the individual weights of all +10.8 ct diamond was carried out. No significant discrepancies were noted. The diamond data used in this estimate are therefore considered to reliably reflect diamond production from the Karowe Mine up to the effective date of the estimate (21st October, 2013).
13 MINERAL PROCESSING AND METALLURGICAL TESTING
Subsequent to the commissioning of the Mine during 2012, the plant has performed successfully. The autogenous (AG) mill, Dense Media Separation (DMS) circuit and recovery plant have all performed to expectation. However, Lucara recognised even at the Feasibility Study stage that the greatest metallurgical risks are the ability of the grinding circuit to grind the fresh hard kimberlite
NI 43-101 Technical Report on the Karowe Mine (Amended) – February 4 2014 Page: 57

(in order to liberate diamonds) below the weathered zone, and the ability of the DMS circuit to cope with very high yield material from portions of the M/PK(S) unit identified in the geological model of the South Lobe (section 7.3.6.4) which is expected to produce DMS yields in excess of 17%. A further risk that has become apparent following the recovery of exceptionally large, high value diamonds at Karowe, is the breakage of large stones. Testwork has therefore been undertaken on technologies to mitigate these risks.
13.1 Current Mill Operation
A report “Site visit and evaluation of the Karowe AG mill treating hard ore Mineral FINAL REPORT)” dated 28th March 2013 prepared by CMD Consulting (Pty) Ltd made observations, conclusions and recommendations based on analysis of plant operational and testwork data. It was found that the mill specific energy was high for the type of ore being processed implying that there was upside in tonnage throughput by operating the mill in a more efficient manner. Evidence that the mill was not being run optimally, and not utilising the available power, included the fact that the mill was observed to be “slurry pooling” which affects the transfer of energy to promote breakage of the ore. Training was undertaken and operational protocols put in place. A further site visit to Karowe by CMD in June 2013 observed that the operational efficiencies had increased but there would be a need to increase the specific energy applied to the harder ore to achieve the target production of approximately 2.5 million tonnes per annum. It was suggested that this could be achieved by pre-crushing the ore or using a High Pressure Grinding Roll (“HPGR”) prior to milling. It was also observed that there was potential to improve mill total availability from between 85% and 90% to over 90% availability.
It was recommended that three aspects be considered as the first step to embarking on a project to improve the efficient operation of the mill:
• Understanding the variability of the ore from a particle size and competency perspective
• Understanding the effect of mill design parameters such as grate design, mill speed and
grate open area
• Understanding the response of the mill to varying operating conditions such as the pulp
density and mill load
Progress on the testwork to address these issues is ongoing, and no formal report has been produced to illustrate the progress made. However it does appear that the power draw on the mill has improved over the past few months, and the tendency to overload has been reduced.
13.2 Comminution Teswork
The results of the comminution test work have been reviewed by a number of metallurgical specialists and the consensus has been that a new proposed crusher-mill configuration will produce the required outcome. It has been established that the ore from the un-weathered parts of the Mineral Reserve, particularly portions of the geological unit M/PK(S) in the Southern Lobe of the deposit, is significantly harder than what has previously been processed. In addition, the design criteria used in the initial design did not cater for the increased ore hardness.
NI 43-101 Technical Report on the Karowe Mine (Amended) – February 4 2014 Page: 58

In order to understand the effect of the harder ore on the plant throughput and resultant product size, a number of mill simulations have been conducted. Various scenarios have been considered in the study.
Following consultation with Outotec (who supplied the existing mill) a grinding survey was conducted to verify the design of the new mill discharge grate and turbo pulp lifters. These test results have also been used to validate and update the mill simulations.
In order to confirm the simulation findings and provide further information on the actual performance of the mill, two grinding surveys were conducted with the hardest ore. This involved crash stopping the mill and taking feed and product samples from the mill and pebble crusher. SMC Testing (Pty) Ltd (SMC) comminution test results on the samples were used in further analysis and simulations.
As reported in the JkTech report no. 13019/P4 of May 2013, five samples from the Northern Lobe were submitted for SMC test work. Three of the samples were mill feed samples and the remaining two samples were pebble crusher feed.
The A*b values that are reported for the SMC tests are a measure of the resistance to impact of the ore. A smaller number indicates a harder ore and a larger number a softer ore. The Axb values reported for the mill feed samples ranged from 40.9 to 55.1. Based on the JkTech reference database these samples are defined as moderately hard to moderately soft.
The two pebble crusher feed samples yielded very similar A*b values of circa 45 (defined as medium hardness by the JkTech database).
These results indicate the large variability in competency of the mill feed that affects mill throughput.
13.3 XRT Testwork
Two X-Ray Transmission (XRT) test campaigns were undertaken in Germany at Tomra Sorting Solutions and RTT Steinert GmbH to evaluate the capabilities of their respective machines. The principle of the XRT sorter is illustrated in Figure 13-1.
The first test campaign consisted of throughput, yield and recovery testing on two size fractions using feed from Karowe. Various drill cores and rock types were also scanned to verify that the machines could distinguish between diamonds (carbon) and various gravel types.
The second sample campaign consisted of actual diamond recovery testwork. The machines were run at throughputs ascertained from the first campaign and various sized diamonds were added to determine actual diamond recoveries.
A number of tests were conducted with tracers and the results of the test work were convincing. It was noted that the XRT sorters are not as efficient on smaller diamonds. However, within the new circuit, XRT sorting will only be applied to Middles and Coarse streams. The sorters are also capacity limited and adequate buffer capacity and redundant capacity has been allowed for in the design.
NI 43-101 Technical Report on the Karowe Mine (Amended) – February 4 2014 Page: 59

Figure 13-1 Principle of XRT Sorting (source: Tomra Sorting Solutions)
13.4 Diamond Breakage Analysis
A breakage study was conducted by QTS Krystal Dinamika (2013) on diamonds produced at Karowe. Of particular interest are the observations made on large stones, including 18 exceptional stones sold during the November 2013 Large Stone Tender. It was found that the Breakage Index of 9.2% is very low in comparison with similar operations producing large high value Type IIa diamonds, and this fact is very encouraging for the preservation of stone value during diamond recovery at Karowe. However, it was noted that a significant amount of impact breakage and abrasion damage was observed. It was inferred that this damage was due to extended residence time in the mill, and it was recommended that this be investigated.
13.5 Comment by the Qualified Person
The QP concurs with the findings of CMD Consulting (Pty) Ltd in the analysis of the mill operation. The AG mill is the centre of the comminution circuit and there is opportunity to optimise its operational availability. There also exists an opportunity to increase the mill percentage solids thus increasing power draw. The QP agrees with the recommendations of CMD Consulting (Pty) Ltd to develop a database of the ore characteristics and consider a blending strategy to minimise the variability in mill feed characteristics.
The results of the XRT test work indicate that the unit will be suitable as a sorting technology. This is discussed in Section 17.
Diamond breakage and abrasion have been identified as issues and are the major consideration in the design of the plant modifications.
NI 43-101 Technical Report on the Karowe Mine (Amended) – February 4 2014 Page: 60
14 MINERAL RESOURCE ESTIMATE
This section summarises the data and methods used for updating the Mineral Resource estimate for the AK6 kimberlite. The previously reported Mineral Resource estimate (MSA, 2010) was based on the work of De Beers between 2002 and 2007 (see Sections 6, 9, 10 and 11), which culminated in a resource estimate in 2007 (Bush, 2007) that was reviewed and slightly modified by De Beers and Z-Star in 2008 (Tait and Maccelari, 2008; Bush, 2008a; Bush, 2008b; Bosma, 2008). The 2008 Mineral Resource estimate was derived by integrating the 2008 geology model with bulk density, diamond grade, and average diamond value data in a block model to provide local estimates of grade and bulk density and to determine total volumes, tonnes and diamond carats in AK6 (De Beers MRM, 2008). The updates to the resource estimate described in the sections below are thus discussed in comparison with the 2008 model results as reported in MSA (2010).
The process to update the Mineral Resource estimate from the previous estimate (MSA, 2010) can be summarised as follows:
• Following a careful review, MSC verified that the estimation approach taken by De Beers and Z-Star to generate local bulk density and grade estimates for the 2008 Mineral Resource model is appropriate and consistent with industry standards. The definition of variogram parameters and search constraints for the interpolation approach applied (ordinary kriging), while restricted in some cases due to data limitations, is considered to have been robust and the same approach was adopted by MSC for the current Mineral Resource update.
• The block model results reported by Bush (2008a) were successfully reproduced by MSC to ensure the correct geostatistical and model parameters were applied in the interpolation of the updated block model.
• The geology model was updated by MSC to reflect the findings from the data review and mapping by Karowe Mine geologists during recent mining activities.
• A block model with the same structure as that used for the 2008 estimate was constructed and updated by MSC in GEMSTM to reflect the updated geology model.
• The block model was populated with bulk density and grade values by interpolation of data from revised bulk density and LDD grade sample sets reflecting the new geology model.
• LDD sampling data were assessed in comparison with mine production data to derive a correction factor to convert modelled grade (based on 1.0 mm LDD diamond recoveries) to grade estimates recoverable by the Karowe Mine at its current operational parameters (1.25 mm bottom cut-off).
• LDD diamond results were investigated in detail and, in conjunction with the geology review, provide support for overall continuity in diamond size frequency distribution (SFD) with depth in each lobe of AK6.
NI 43-101 Technical Report on the Karowe Mine (Amended) – February 4 2014 Page: 61

• Diamond value estimates by size class, updated with recent production data, were applied
to recovery-corrected SFD models for production parcels from each of the lobes to derive average diamond values for each lobe.
14.1 Geological Modelling
The 2008 De Beers 3D geology model of AK6 was utilised as the basis for the updated geology model for the current Mineral Resource update. MSC has reviewed the methods and data used to generate previous versions of the AK6 geology model and is satisfied that they are appropriate and that the model is a reasonable representation of the available data. While geologically reasonable alternative models can be generated based on the available data, these are not considered to be significantly more likely than the models generated by De Beers and subsequently updated for the present resource estimate. Furthermore, variations in volume estimates derived from realistic alternative models are within limits of uncertainty that the QP regards as appropriate for Indicated and Inferred Mineral Resources, respectively.
14.1.1 Geology model update and volume estimates
Adjusted drill logs from the review of core photography (Section 12.2) were combined with information obtained from mapping in the open pit to update the geology model. Surveyed pipe wall contacts derived from mapping in the open pit were provided by Karowe Mine geology staff for elevations between 1,008 and 941 masl. Mapped internal geology boundaries between the weathered and fresh kimberlite, and between kimberlite and breccia were provided for the elevation range 1,008 to 958 masl. The weathered nature of the kimberlite exposed in the open pit did not permit mapping of the boundaries between the North, Centre and South Lobes.
Key updates to the 2008 3D geology model of AK6 are described below and illustrated in Figures 14-1 to 14-4:
• New kimberlite breccia zones (KBBX(S) and WKBBX(S)) were identified from open-pit mapping in the top 100 m of the west-southwest part of South Lobe (Figure 14-1). These zones were added to the BBX(S) and WBBX(S) domains, respectively, and were modelled to include drill core intersections with relatively high dilution (from DDH-13; DDH-09; PLT-021; PLT-04) previously included in the M/PK(S) domain.
• A new domain was modelled to encompass a large internal basalt block (INTBS(S)) that was identified by surface mapping in the upper 100 m of the west-southwest part of South Lobe (Figure 14-1).
• A new kimberlite breccia zone identified from surface mapping in the open-pit was modelled at ~50 m below surface in the southwest part of North Lobe and added to the BBX(N) domain (Figure 14-2).
• The North and Centre Lobe models were updated with a gap between them in the upper 80 m to reflect mapping results from the open pit (Figure 14-2).
• The outline of the North Lobe at surface was expanded based on surface mapping information, changing the surface area from 3,998 m2 to 6,338 m2 (Figure 14-3).
NI 43-101 Technical Report on the Karowe Mine (Amended) – February 4 2014 Page: 62

• The pipe margin in the uppermost 100 m on the west-southwest side of South Lobe was
moved inwards based on mapping in the open pit resulting in a reduced surface area for this portion of the pipe (Figure 14-3).
• The weathering surface dividing “fresh” from “weathered” geology domains was adjusted in the 3D geology model to reflect only internal geology contacts between weathered and fresh kimberlite, and no longer includes pipe-wall contacts between wall-rock and weathered kimberlite. This change results in 20% increase in the volume of weathered kimberlite (Figure 14-4).
Figure 14-1 Plan view of the South Lobe of the updated AK6 3D geology model
Plan view of the South Lobe showing the location of new modelled breccia zone WKBBX(S) and internal basalt domain INTBS(S) at 986 masl. Drill hole intersections of kimberlite (light blue) and basalt (red) for the horizontal plane corridor displayed are shown for reference.
NI 43-101 Technical Report on the Karowe Mine (Amended) – February 4 2014 Page: 63

Figure 14-2 View of the AK6 3D geological model facing east
View facing east showing the AK6 3D geology model from 1,000 masl to 520 masl. Arrows are shown indicating adjustments/additions to the model: the “gap” between the North Lobe and the Centre Lobe identified during mining; the WKBBX4(N) zone added to the BBX(N)); and the WKBBX(S) zone added to the WBBX(S) domain. Dashed black line indicates the approximate base of the open pit on the 21st October, 2013. .
NI 43-101 Technical Report on the Karowe Mine (Amended) – February 4 2014 Page: 64

Figure 14-3 Plan views illustrating differences between the near-surface pipe outlines in the 2008 and 2013
geological models
Plan views illustrating differences between the near-surface pipe outlines in the 2008 and 2013 geology models of the North (a) and South (b) Lobes. a) Plan view of North Lobe at 998 masl. b) Plan view of South Lobe at 1,005 masl. Gridline spacing on both maps is 50 m.
Figure 14-4 Weathered portion of the AK6 geological model looking east, illustrating the updated weathered
kimberlite model solids in relation to the weathering surface from the 2008 model
2008 model in purple. Depth changes of the weathered zone range from 10 to 30 m. Yellow = calcrete; pale blue = weathered kimberlite; orange = weathered basalt breccia; red = weathered kimberlite breccia. .
NI 43-101 Technical Report on the Karowe Mine (Amended) – February 4 2014 Page: 65

Rock types identified in the AK6 kimberlite were grouped by De Beers into mappable kimberlite units based on their geological characteristics and interpreted grade potential (see Section 7.3). For the purposes of constructing the geological and Mineral Resource model, the kimberlite units occurring in each lobe were modelled in GEMSTM as geological wireframe solids, referred to in this report as domains (Figure 7-2; Table 7-2). The updated geology model that forms the basis for the AK6 updated Mineral Resource estimate comprises 13 kimberlite domains and 10 breccia / basalt domains. In cases where a particular unit is discontinuous (i.e. breccia units), the modelled domain comprises more than one discrete wireframe solid. Domain volumes are summarised and compared with the 2008 models in Table 14-1.
The updates to the 3D geology model are considered to be minor and represent refinement of the previous model based on the availability of new mapping data. Differences in the estimated domain volumes between the 2008 model and the 2013 model are primarily the result of adjustments to the extents of the North, Centre and South Lobes near surface, and the shifting of the weathering profile to a deeper depth. It is noted that there is a considerable degree of uncertainty in the size and distribution of large basalt blocks and breccia domains within each of the Lobes. There is also considerable uncertainty in the volume of dilution-rich kimberlite in the WM/PK(S) domain in the South Lobe. While the degree of uncertainty with regards to these factors is not considered to be sufficient to result in unacceptable degrees of uncertainty in the overall estimate of tonnes, carats and grades, it does indicate potential for significant variation from the model on a local scale that should be factored into future mine plans.
NI 43-101 Technical Report on the Karowe Mine (Amended) – February 4 2014 Page: 66

Table 14-1 Updated 3D geology model volumes compared to previous model volumes
Previous model volumes were estimated by Tait and Maccelari, (2008)
14.1.2 Geological Continuity
To determine whether or not the data obtained by processing of kimberlite at surface can be used as a basis for evaluating material from deeper parts of the corresponding lobes, the degree
2008 2013 Volume diff. (m3) % diff.
BBX(S) 76 550 82 679 6 129 8
CBBX(S) 59 426 42 346 -17 080 -29
CKIMB(S) 145 998 163 021 17 023 12
EM/PK(S) 1 307 806 1 307 595 -211 0
M/PK(S) 16 527 328 16 036 321 -491 007 -3
WBBX(S) 479 823 567 409 87 586 18
WK(S) 1 471 304 1 864 291 392 987 27
WM/PK(S) 188 478 188 478 0 0
17+YIELD 1 314 981 1 315 481 500 0INTBS(S)1 na 51 523 na na
South 21 571 694 21 619 145 47 452 0BBX(C)2 587 183 268 126 -319 057 -54
CFK(C) 843 408 777 595 -65 813 -8
CKIMB(C) 75 240 88 341 13 101 17
FK(C) 1 471 651 1 433 860 -37 791 -3WBBX(C)2 na 7 958 na na
WK(C) 745 296 812 693 67 397 9KBBX(C)2 na 70 457 na na
Centre 3 722 777 3 459 030 -263 747 -7KBBX(N)2 84 227 2 672 -81 555 -97
CKIMB(N) 28 936 69 798 40 862 141
FK(N) 549 707 421 040 -128 667 -23
WK(N) 172 538 296 310 123 772 72BBX(N)2 na 282 381 na naWBBX(N)2 25 308 52 210 26 902 na
North 860 716 1 124 411 263 695 31Sub-Total (North+Centre) 4 583 494 4 583 442 -52 0
Total 26 155 187 26 202 587 47 400 01 Internal basalt "raft" or "reef" identified by Karowe Mine geologists during mining has been included as a distinct geology domain in the 2013 model
GEMSTM model volume (m3) Differences
2 Note: The combined BBX, KBBX and WBBX of the North/Central lobes from the 2008 model are split into separate domains corresponding to the North and Centre lobes, respectively, in the 2013 geology model
Geology domain
NI 43-101 Technical Report on the Karowe Mine (Amended) – February 4 2014 Page: 67

of geological continuity must be established within the key kimberlite units of AK6 with depth. Existing AK6 geology reports do not indicate any major geological discontinuity with depth, and grade variations within the individual lobes appear to be largely due to variable amounts of country-rock dilution (Stiefenhofer, 2007; Stiefenhofer and Hanekom, 2005). To confirm the degree of geological continuity, MSC reviewed surface exposure, drill core, petrography, geochemistry and dilution measurements. The key findings from this assessment are described below:
Surface and drill core observations
Limited examinations were made by MSC of kimberlite exposures in the open pit and in drill core during a site visits in July and October 2013. The geological continuity between the weathered (WK(S)) and fresh pyroclastic kimberlite (M/PK(S)) of the South Lobe was checked by examination of one drill core (DDH017), in which there was no evidence for a corresponding change in primary rock type. The observations did not highlight any major features or changes in the size and abundance of macroscopic constituents within the kimberlite that would support the presence of a major geological discontinuity at or close to the base of the weathered kimberlite. In contrast, the contact between M/PK(S) (South Lobe) and FK(C) (Centre Lobe) was clearly evident in this drill hole.
Drill core photograph observations
Drill core photographs for 44 of the 51 delineation (DDH) holes and 21 of the 23 pilot holes (PLT) were also reviewed and compared with digital lithology logs to evaluate the consistency and reliability of geological logging (see Section 12.2). During this review, macroscopic features of the drill core were examined to assess the apparent degree of geological continuity with depth for key rock types. Macroscopic observations of drill core photographs support the distinctions between M/PK(S) and FK(C), but do not indicate any significant differences between FK(C) and FK(N). The main kimberlite rock types within each lobe appear to be generally internally homogeneous with depth except for local variations in the size and abundance of country-rock xenoliths.
Internal dilution
Line-scan measurements of country-rock xenolith content (see Section 12.3) suggest very minor local variations in dilution within the main kimberlite rock type in South Lobe with depth (M/PK(S); Figure 14-5), with the exception of a small area intersected by two drill holes in the western half of the uppermost 100 m of the South Lobe. The amount of dilution present in FK(C) is on average approximately double that of the M/PK(S) in the South Lobe and shows a higher degree of horizontal and vertical variability (Figure 14-5). FK(N) has a similar dilution percentage to that observedin FK(C), and is also internally variable (Figure 14-5). With the exception of a possible decrease in dilution in FK(C) below 650 masl, the dilution data do not provide any evidence for significant geological changes with depth within the dominant kimberlite units making up AK6.
NI 43-101 Technical Report on the Karowe Mine (Amended) – February 4 2014 Page: 68
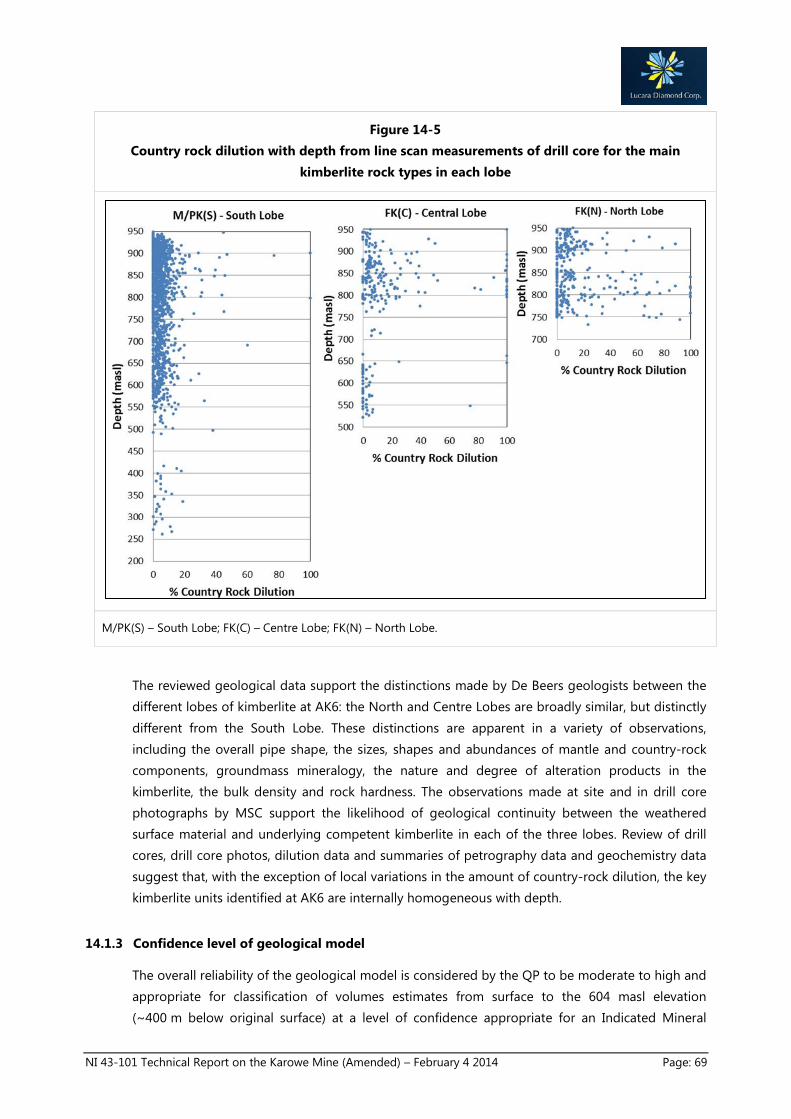
Figure 14-5 Country rock dilution with depth from line scan measurements of drill core for the main
kimberlite rock types in each lobe
M/PK(S) – South Lobe; FK(C) – Centre Lobe; FK(N) – North Lobe.
The reviewed geological data support the distinctions made by De Beers geologists between the different lobes of kimberlite at AK6: the North and Centre Lobes are broadly similar, but distinctly different from the South Lobe. These distinctions are apparent in a variety of observations, including the overall pipe shape, the sizes, shapes and abundances of mantle and country-rock components, groundmass mineralogy, the nature and degree of alteration products in the kimberlite, the bulk density and rock hardness. The observations made at site and in drill core photographs by MSC support the likelihood of geological continuity between the weathered surface material and underlying competent kimberlite in each of the three lobes. Review of drill cores, drill core photos, dilution data and summaries of petrography data and geochemistry data suggest that, with the exception of local variations in the amount of country-rock dilution, the key kimberlite units identified at AK6 are internally homogeneous with depth.
14.1.3 Confidence level of geological model
The overall reliability of the geological model is considered by the QP to be moderate to high and appropriate for classification of volumes estimates from surface to the 604 masl elevation (~400 m below original surface) at a level of confidence appropriate for an Indicated Mineral
NI 43-101 Technical Report on the Karowe Mine (Amended) – February 4 2014 Page: 69

Resource. This is based on the relatively high density of core and LDD drilling (Figure 14-6) as well as the thorough geological and geochemical approach taken to logging and definition of internal kimberlite units. Due to the significantly reduced density of drilling below 600 masl, the portion of AK6 from 604 masl to the base of the model at 260 masl is classified as an Inferred Mineral Resource.
Figure 14-6 Distribution of core holes drilled on the AK6 kimberlite
Section (left) and plan (right) views illustrating the distribution of core holes drilled on the AK6 kimberlite. These include vertical pilot holes drilled at effectively the same location as the LDD holes. The dashed line in the left panel indicates the base of the Indicated Resource (604 masl). Grid size on the right panel is 200 m.
14.1.4 Block Model
A block modelling approach has been used for estimation of volumes, tonnes and grade for the AK6 kimberlite. The block model structure established for the 2008 estimate was used for the current Mineral Resource update. It comprises 359,924 25 x 25 x 12 m blocks arranged in 68 rows (25 m wide), 79 columns (25 m wide) and 67 levels (12 m high). To accommodate the numerous domains present, a partial (percent) block modelling approach is required and was applied, for both the original 2008 estimate and the current update, using GEMSTM software. The block model folder structure was modified slightly to accommodate the minor revisions to the geology model, and was updated from the revised 3D geology solids with the percentage of each rock type within each block, calculated using the GEMSTM needling function with a horizontal needle orientation (3
NI 43-101 Technical Report on the Karowe Mine (Amended) – February 4 2014 Page: 70

x 3 needle density). Volumes for geology domains obtained from the block model were compared with the volumes of the 3D wire-frame solids and were found to be accurate to within 0.02%.
The block model was subsequently populated with bulk density and grade values based on the bulk density and grade samples as described in Sections 14.2 and 14.3 below.
14.2 Bulk density and tonnage
14.2.1 Bulk density data
The bulk density data used for estimation in 2008 was derived from sampling of drill cores from delineation drilling (2004 to 2006) and pilot holes drilled prior to the LDD drill holes (2005 to 2006). The method used for bulk density determination is described in Section 12.5 above. During Phase I drilling, one sample was taken for every 7 m of drill core. During Phase II drilling, bulk density was measured every 3 m. The spatial distribution of bulk density samples is illustrated in Figure 14-7.
Figure 14-7 Distribution of bulk density (BD) samples throughout the AK6 kimberlite
Left panel: cross-section showing projected position of BD samples in relation to pipe outlines. Dashed line in cross section represents the base of the Indicated Mineral Resource (604 masl). Right panel: Plan-view showing projected position of BD samples in relation to the pipe outline at 986 masl. Grid size on the right panel is 200 m.
Prior to the estimation exercise, the same sample set used by De Beers in 2008 (Bush, 2008a) was coded according to the updated 2013 geology model solids. As a result, a sub-set of samples
NI 43-101 Technical Report on the Karowe Mine (Amended) – February 4 2014 Page: 71

used by De Beers in 2008 was excluded from the current bulk density estimate because the samples are not within the revised extents of the geology model. The final bulk density sample data used for the Mineral Resource update are summarized and compared to the 2008 averages (Bush, 2008a) in Table 14-2. The updates to the bulk density dataset resulted in only minor changes in the average sample bulk densities for each modelled geology domain.
Table 14-2 Summary of data used for bulk density estimation
Bulk density values for kimberlite are variable between lobes and between fresh and weathered kimberlite varieties in each lobe. The average bulk density of samples from domains of weathered kimberlite ranges from ~2.2 tonnes per cubic meter (tpm3) in the Centre Lobe to ~2.5 tpm3 in the South Lobe. The average bulk density of fresh kimberlite in the North and Centre Lobes ranges from ~2.4 to 2.6 tpm3, whereas fresh kimberlite in the M/PK(S) domain that dominates the South Lobe is very dense (average of 2.9 tpm3) and the 17+YIELD domain yields an average of 3.0 tpm3.
n Avg (tpm3) n Avg (tpm3)BBX(S) Breccia 4 2.71 9 2.73 0.74CBBX(S) Breccia 4 2.23 3 2.19 -1.79CKIMB(S) S_Weathered 19 2.39 19 2.41 0.84EM/PK(S) S_Primary 123 2.76 122 2.77 0.36M/PK(S) S_Primary 1 040 2.86 976 2.88 0.81WBBX(S) S_Weathered 46 2.23 74 2.18 -2.36WK(S) S_Weathered 202 2.21 230 2.32 4.86WM/PK(S) S_Primary 43 2.56 44 2.56 -0.0117+YIELD S_Primary 135 3.00 132 3.01 0.27INTBS(S)1 Breccia na na 9 2.36 na
South 1 616 2.75 1 618 2.75 0.00BBX(C)2 Breccia 160 2.53 67 2.55 0.61CFK(C) C&N_Primary 171 2.61 156 2.61 -0.11CKIMB(C) C&N_Weathered 8 2.35 8 2.35 0.00FK(C) C&N_Primary 180 2.58 182 2.57 -0.44WBBX(C)2 C&N_Weathered 0 na 0 na naWK(C) C&N_Weathered 102 2.10 124 2.19 4.29KBBX(C)2 C&N_Weathered 23 2.58 20 2.59 0.39
Centre 644 2.50 557 2.49 -0.27CKIMB(N) C&N_Weathered 7 2.29 8 2.26 -1.53FK(N) C&N_Primary 158 2.43 138 2.43 -0.05WK(N) C&N_Weathered 26 2.16 50 2.28 5.60BBX(N)3 Breccia 0 na 86 2.53 naWBBX(N)2 C&N_Weathered 3 2.63 9 2.42 -7.91
North 194 2.39 291 2.43 1.59Total 2 454 2.65 2 466 2.65 0.0008
3KBBX(N) samples are included into BBX(N) totals
% Diff
1 Internal basalt block or "reef" identified by Karowe Mine geologists during mining2Note: The BBX, KBBX and WBBX of the North/Central lobes of the 2008 model are split into separate domains corresponding to North and Centre lobes, respectively, in the 2013 geology model.
2008 Density 2013 DensityBulk Density GroupGeology Domain
NI 43-101 Technical Report on the Karowe Mine (Amended) – February 4 2014 Page: 72
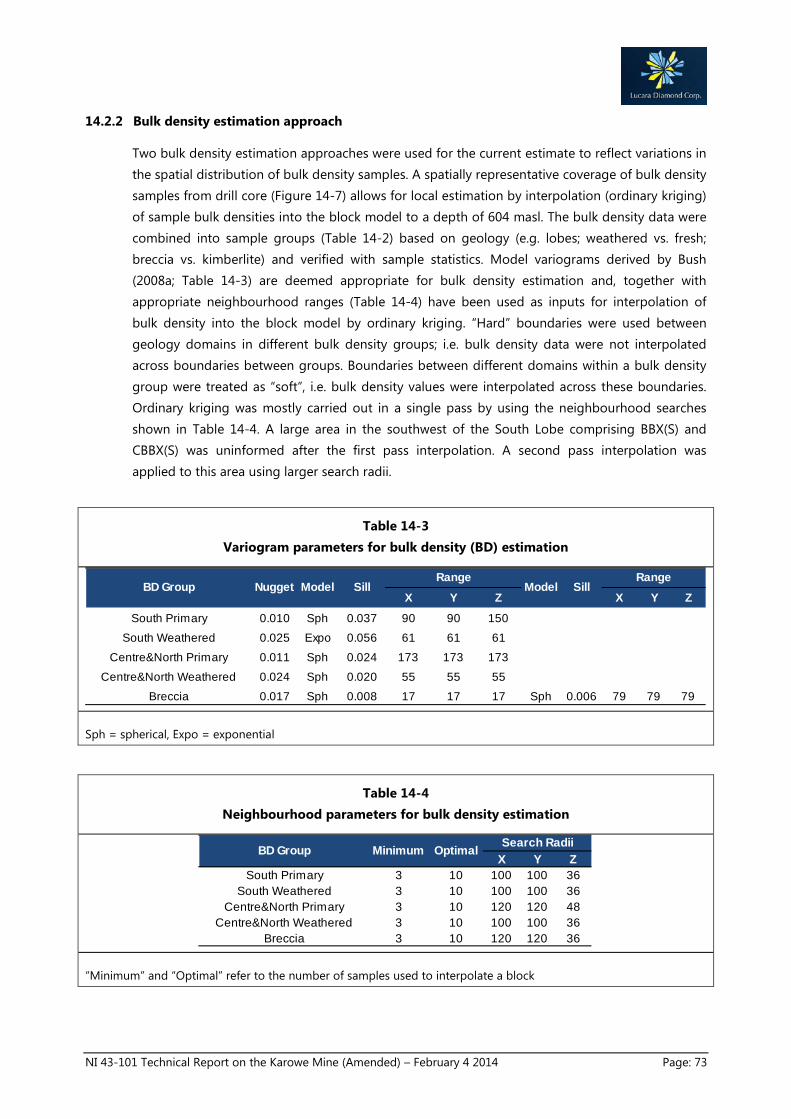
14.2.2 Bulk density estimation approach
Two bulk density estimation approaches were used for the current estimate to reflect variations in the spatial distribution of bulk density samples. A spatially representative coverage of bulk density samples from drill core (Figure 14-7) allows for local estimation by interpolation (ordinary kriging) of sample bulk densities into the block model to a depth of 604 masl. The bulk density data were combined into sample groups (Table 14-2) based on geology (e.g. lobes; weathered vs. fresh; breccia vs. kimberlite) and verified with sample statistics. Model variograms derived by Bush (2008a; Table 14-3) are deemed appropriate for bulk density estimation and, together with appropriate neighbourhood ranges (Table 14-4) have been used as inputs for interpolation of bulk density into the block model by ordinary kriging. “Hard” boundaries were used between geology domains in different bulk density groups; i.e. bulk density data were not interpolated across boundaries between groups. Boundaries between different domains within a bulk density group were treated as “soft”, i.e. bulk density values were interpolated across these boundaries. Ordinary kriging was mostly carried out in a single pass by using the neighbourhood searches shown in Table 14-4. A large area in the southwest of the South Lobe comprising BBX(S) and CBBX(S) was uninformed after the first pass interpolation. A second pass interpolation was applied to this area using larger search radii.
Table 14-3 Variogram parameters for bulk density (BD) estimation
Sph = spherical, Expo = exponential
Table 14-4 Neighbourhood parameters for bulk density estimation
“Minimum” and “Optimal” refer to the number of samples used to interpolate a block
X Y Z X Y Z
South Primary 0.010 Sph 0.037 90 90 150
South Weathered 0.025 Expo 0.056 61 61 61
Centre&North Primary 0.011 Sph 0.024 173 173 173
Centre&North Weathered 0.024 Sph 0.020 55 55 55
Breccia 0.017 Sph 0.008 17 17 17 Sph 0.006 79 79 79
Range RangeBD Group Nugget Model Sill Model Sill
X Y ZSouth Primary 3 10 100 100 36
South Weathered 3 10 100 100 36Centre&North Primary 3 10 120 120 48
Centre&North Weathered 3 10 100 100 36Breccia 3 10 120 120 36
Search RadiiBD Group Minimum Optimal
NI 43-101 Technical Report on the Karowe Mine (Amended) – February 4 2014 Page: 73

At depths below 604 masl, drill core coverage is insufficient for local bulk density estimation of some kimberlite units. Based on geological continuity established by drilling, average interpolated block bulk densities from proximal benches or sample averages were applied to blocks uninformed by interpolation to generate semi-local bulk density estimates. A summary of the average bulk densities applied to uninformed blocks is shown in Table 14-5.
Table 14-5 Summary of average (Avg) bulk densities (BD) applied to blocks uninformed by interpolation.
Figure 14-8 shows the average block bulk density by mining level from the 2013 updated block model compared with average sample densities for the same levels. The final updated bulk density model is effectively unchanged from that of the original De Beers model (Bush 2008a; Figure 14-8 and 14-9; Table 14-6) that formed the basis for the 2010 Mineral Resource estimate for AK6 (MSA, 2010). Minor differences between the current and the 2008 models are primarily due to the modifications made to the geology model (Section 14.1).
Block Model Total blocks Uninterpolated blocks Avg BD (tpm3) Range of blocks for average
BBX(C) 193 3 2.53 850 to 826 maslBBX(S) 78 3 2.73 None: sample average
CBBX(S) 31 2 2.19 None: sample averageM_PK(S) 3433 235 2.96 658 to 604 maslWK(C) 238 3 2.19 None: sample average
NI 43-101 Technical Report on the Karowe Mine (Amended) – February 4 2014 Page: 74

Figure 14-8 AK6 bulk density profile with depth
Solid lines indicate the average block bulk density per 12 m bench for the entire AK6 body and for each of the individual lobes. The average block bulk density by level for the 2010 estimate is shown for comparison. The dotted line indicates average sample values by 12 m bench.
14.2.3 Confidence level of bulk density / tonnage model
The block bulk density estimates were combined with volumes estimates determined from the percent block model to generate an estimate of the tonnes of each kimberlite unit within each block. Due to the comprehensive sample coverage and careful statistical and geostatistical treatment of the data, the bulk density model between surface and the 604 masl elevation is considered to be of high confidence and suitable to support an indicate Mineral Resource classification. Due to the reduced sample density below 604 masl, bulk density for the lower portion of the pipe is less reliably constrained but estimates are considered to be at an appropriate level of confidence for an Inferred Mineral Resource classification. In combination with confidence levels of volume estimates, as derived from the geology model (Section 14.1.3), the bulk density data support local estimates of kimberlite tonnes at an Indicated level of
NI 43-101 Technical Report on the Karowe Mine (Amended) – February 4 2014 Page: 75
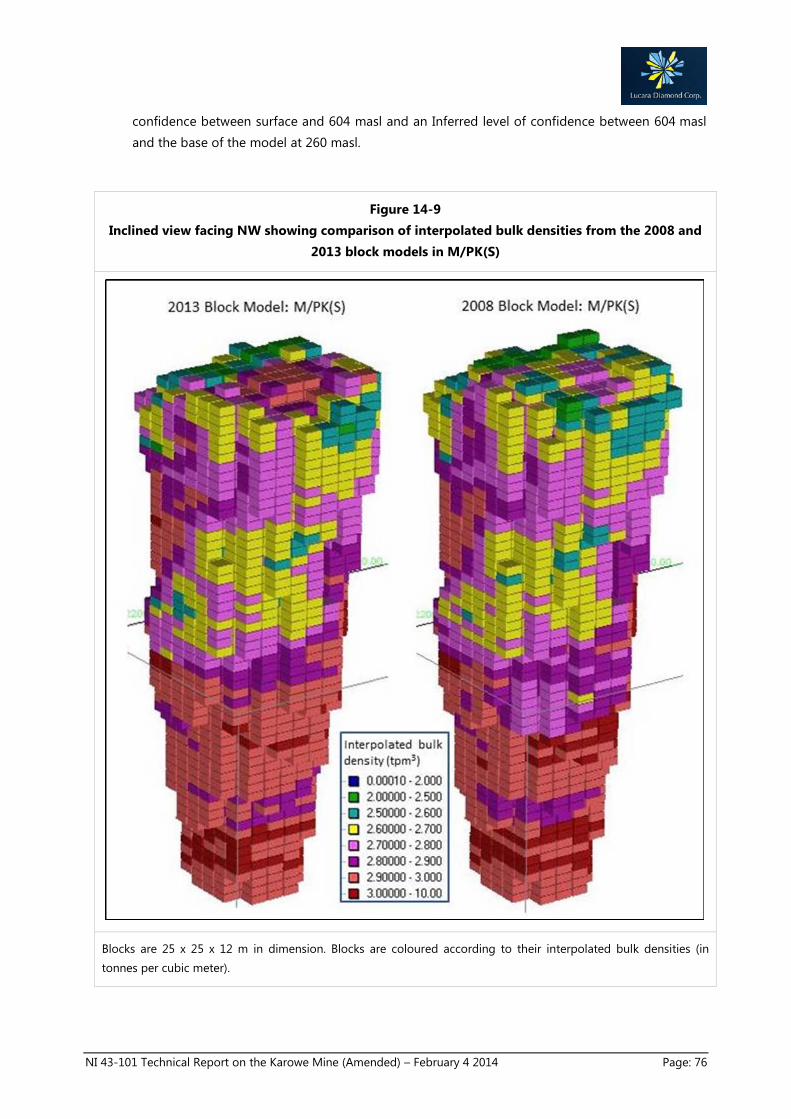
confidence between surface and 604 masl and an Inferred level of confidence between 604 masl and the base of the model at 260 masl.
Figure 14-9 Inclined view facing NW showing comparison of interpolated bulk densities from the 2008 and
2013 block models in M/PK(S)
Blocks are 25 x 25 x 12 m in dimension. Blocks are coloured according to their interpolated bulk densities (in tonnes per cubic meter).
NI 43-101 Technical Report on the Karowe Mine (Amended) – February 4 2014 Page: 76

Table 14-6 Sample and kriged block averages of bulk density (BD) by geology domain
Geology domain Sample BD (tpm3) Kriged (block) BD (tpm3)
2008 2013 2008 2013
BBX(S) 2.71 2.73 2.60 2.79
CBBX(S) 2.23 2.19 2.33 2.32
CKIMB(S) 2.39 2.41 2.18 2.18
EM/PK(S) 2.76 2.77 2.77 2.84
M/PK(S) 2.86 2.88 2.85 2.88
WBBX(S) 2.23 2.18 2.21 2.28
WK(S) 2.21 2.32 2.23 2.32
WM/PK(S) 2.56 2.56 2.74 2.78
17+YIELD 3.00 3.01 2.97 2.95
INTBS(S)1 na 2.36 na 2.32
South 2.75 2.75 2.76 2.76
BBXC)2 2.53 2.55 2.55 2.56
CFK(C) 2.61 2.61 2.59 2.57
CKIMB(C) 2.35 2.35 2.15 2.14
FK(C) 2.58 2.57 2.59 2.56
WBBX(C)2 2.63 2.42 2.31 2.37
WK(C) 2.10 2.19 2.15 2.24
KBBX(C)2 2.58 2.59 2.59 2.59
Centre 2.50 2.49 2.47 2.48
CKIMB(N) 2.29 2.26 2.20 2.18
FK(N) 2.43 2.43 2.44 2.44
WK(N) 2.16 2.28 2.31 2.30
BBX(N)3 na 2.53 na 2.53
WBBX(N)2 2.63 2.42 na 2.34
North 2.39 2.43 2.47 2.41
Total 2.65 2.65 2.76 2.76 1 Internal basalt block or "reef" identified by Karowe Mine geologists during mining has been included as a distinct geology domain in the 2013 model
2 The BBX, KBBX and WBBX of the North/Central lobes from the 2008 model are split into separate domains corresponding to the North and Centre lobes, respectively, in the 2013 geology model. 3 KBBX(N) samples are included into BBX(N) totals
NI 43-101 Technical Report on the Karowe Mine (Amended) – February 4 2014 Page: 77

14.3 Diamond Grade
14.3.1 LDD sample data
Two large diameter drill (“LDD”) sampling programs were carried out in two phases from 2006 to 2007, during which a total of 30 holes comprising 8,635 m of 23 inch diameter drilling were completed. Samples comprising 12 m increments down hole were collected and processed from 24 of these LDD drill holes. Holes were drilled vertically and are well-distributed across the pipe (Figure 14-10). Sample volumes were measured by caliper survey of all holes. These were used in conjunction with the carats of diamonds recovered from each sample to calculate sample grades in carats per cubic meter (cpm3).
Figure 14-10 Distribution of AK6 LDD drill holes from which bulk samples were collected
Left panel: Cross section view facing east showing depth extents of LDD sample coverage (thick black trace) in relation to projected pipe lobe models (thin black trace represents unsampled portion of LDD drill hole). Dashed line shows the base of the indicated Mineral Resource (604 masl). Right Panel: Plan view showing collar locations of sampled LDD drill holes. Grid size on the right panel is 100 m.
For the current update to the Mineral Resource estimate, the De Beers sample set from 2008 (Bush, 2008a) was coded to the updated 2013 geology model solids. As for the bulk density samples, some of the recoded LDD samples are completely or predominantly (>60%) outside of
NI 43-101 Technical Report on the Karowe Mine (Amended) – February 4 2014 Page: 78

the remodelled pipe, and have thus been excluded from the estimation dataset, along with all recoveries not directly attributable to samples (e.g. spillage and process purge during processing). A few samples, not used by Bush (2008a) because they were outside of the model were included in the revised grade estimate because of local changes to the geology model. The LDD sample grade data used to generate the updated grade model are summarised by modelled geology domain in Table 14-7 and LDD diamonds recoveries by lobe and DTC size class are provided in Table 14-8. Comparison with the original LDD sample data set used in support of the previous resource estimate (MSA, 2010; Bush, 2008a) reveals minor differences in average sample grade per geology domain. These can be readily explained by updates to the geology model and/or corrections of transcription errors from the original LDD sample results in previous estimates (see Section 12.6).
Table 14-7 Summary by geological domain of LDD sample grade data used for grade estimation
Avg = average. cpm3 = carats per cubic meter
Number Avg Grade (cpm3)BBX(S) S_Primary 1 0.05CBBX(S) S_Primary 0 naCKIMB(S) S_Primary 2 0.01EM/PK(S) S_Primary 43 1.37M/PK(S) S_Primary 213 0.52WBBX(S) S_Primary 12 0.22WK(S) S_Primary 61 0.53WM/PK(S) S_Primary 13 0.8217+YIELD S_Primary 38 0.35INTBS(S)1 S_Primary 0 na
South 383 0.59BBX (N/C to C)2 C&N_Primary 7 0.35CFK(C) C&N_Primary 40 0.82CKIMB(C) C&N_Primary 0 naFK(C) C&N_Primary 26 0.63WBBX(N/C to C)2 C&N_Primary 0 naWK(C) C&N_Primary 26 0.42KBBX(C)2 C&N_Primary 3 0.59
Centre 102 0.63CKIMB(N) C&N_Primary 0 naFK(N) C&N_Primary 25 0.49WK(N) C&N_Primary 8 1.47BBX(N/C to N)3 C&N_Primary 10 0.28WBBX(N/C to N)2 C&N_Primary 2 2.28
North 45 0.69Total 530 0.61
3 KBBX(N) samples are included into BBX(N) totals.
2013 Grade Samples
1 Internal basalt "raft" or "reef" identified by Karowe Mine geologists during mining.2 Note: The BBX, KBBX and WBBX of the North/Centre lobes from the 2008 model are split into separate domains corresponding to the North and Centre lobes, respectively, in the 2013 geology model.
Geology Domain Grade Group
NI 43-101 Technical Report on the Karowe Mine (Amended) – February 4 2014 Page: 79

Table 14-8 Total LDD diamond recoveries by DTC size class grouped by lobe
cpm3 = carats per cubic meter
14.3.2 Grade estimation approach
Two grade estimation approaches were used for the current estimate, reflecting variations in the spatial distribution of LDD samples.
A local grade estimation approach has been applied from surface to 604 masl where a spatially representative coverage of LDD sampling allows for interpolation (ordinary kriging) of the +1.0 mm sample grades into the block model. The grade data were combined into groups (Table 14-7) on the basis of geology (e.g. lobes; breccia vs. kimberlite) and grade sample statistics. In contrast to the bulk density analysis, grade groups did not distinguish equivalent weathered and fresh kimberlite types (i.e. these were included in the same groups). The variogram parameters determined by Bush (2008a; Table 14-9) were found to be appropriate despite the minor changes to the geology model and were used, together with the kriging neighbourhood parameters indicated in Table 14-10, as inputs for local grade estimation by ordinary kriging. There are insufficient data from the breccia units for variography (Bush, 2008a). Thus, the variograms for the associated grade group for primary kimberlite were used for the breccia units from each lobe. As for bulk density, boundaries between geology domains belonging to different grade groups were treated as “hard” in the interpolation process (sample data not interpolated across these boundaries). Boundaries between different domains within a grade group were treated as “soft”, i.e. grade values were interpolated across these boundaries. Two kriging passes were carried out
Ct St Ct St Ct StDTC-1 0.05 0 0.18 0 1.56 0DTC1 1.42 105 5.72 408 26.23 1876DTC2 1.78 78 11.13 519 38.65 1802DTC3 7.74 224 26.17 749 110.93 3179DTC5 8.32 117 19.57 269 91.8 1266DTC6 9.72 110 19.08 214 75.67 856DTC7 10.49 87 23.67 192 84.68 695DTC9 13.44 66 33.93 165 98.79 480DTC11 13.1 35 23.65 66 65.36 182DTC12 7.78 13 9.83 18 38.31 72DTC13 8.14 11 22.6 27 58.85 70DTC15 2.35 3 6.06 6 13.52 12DTC17 7.76 6 10.61 7 23.25 16DTC19 2.27 1 13.47 6 46.59 21DTC21 0 0 0 0 27.02 6DTC23 0 0 13.37 1 7.98 2Totals 94.36 856 239.04 2 647 809.19 10 535
Volume (m3)cpm3
Size
145 369 13090.652 0.648 0.618
North Lobe Centre Lobe South Lobe
NI 43-101 Technical Report on the Karowe Mine (Amended) – February 4 2014 Page: 80

for each group. The second pass comprised a larger search neighbourhood (Table 14-10) and was used to populate blocks uninformed from the first pass. For the South Lobe, the larger neighbourhood was used for the Breccia group only.
LDD sample coverage does not extend significantly below 604 masl and, where reliable local grade estimation is not possible, lower confidence global grade estimates have been applied. In these instances the average block grades from directly overlying or adjacent equivalent rock types were applied to the underlying areas to produce global grade estimates. A summary of the average grades applied to uninformed blocks is shown in Table 14-11.
Table 14-9 Variogram parameters for local grade estimation
Table 14-10 Neighbourhood parameters for local grade estimation “Minimum” and “Optimal” refer to the
number of samples used to interpolate a block
“Minimum” and “Optimal” refer to the number of samples used to interpolate a block
Table 14-11 Summary of average grade values applied to blocks uninformed by interpolation
cpm3 = carats per cubic meter
Figure 14-11 shows the average block grade by mining level from the 2013 updated block model compared with average sample grades for the same levels. The final updated +1.0 mm grade
X Y Z
South Primary 0.120 Spherical 0.175 115 115 83
Centre&North Primary 0.172 Spherical 0.133 90 90 77
RangeGrade Group Nugget Model Sill
X Y Z
South Primary (first-pass) 3 10 100 100 48
South Primary (second-pass) 3 10 150 150 96
C&N Primary (first-pass) 3 10 100 100 60
C&N Primary (second-pass) 3 10 150 150 108
Search RadiiGrade Group Minimum Optimal
Block Model Total blocks Uninterpolated blocks Avg Gr (cpm3)
Range of blocks for local average
M_PK(S) 3433 1100 0.56 658 to 610 masl
EM_PK(S) 428 89 0.57 610 to 574 masl
FK(C) 590 78 0.51 730 to 706 masl
NI 43-101 Technical Report on the Karowe Mine (Amended) – February 4 2014 Page: 81

model is effectively unchanged from that of the original De Beers model (Bush 2008a; Figure 14-12; Table 14-12) that formed the basis for the 2010 Mineral Resource estimate for AK6 (MSA, 2010). Minor differences between the current and the 2008 models are primarily due to the modifications made to the geology model (Section 14.1.1) as well as slight changes made to the applied LDD sample dataset (as per Section 12.6).
Estimated block grades in carats per cubic meter are combined with interpolated bulk density to calculate grades expressed as carats per hundred tonne (cpht) for each block.
Figure 14-11 AK6 grade profile with depth
Solid lines indicate the average block grade per 12 m level for the combined AK6 body and for each of the individual lobes. The average block grade by level for the 2010 estimate is shown for comparison. The dotted line indicates average sample values by bench
NI 43-101 Technical Report on the Karowe Mine (Amended) – February 4 2014 Page: 82

Figure 14-12 Inclined view facing NW comparing interpolated grades for the M/PK(S) domain from the 2008
and 2013 block models
Blocks are 25 x 25 x 12m in dimension. Blocks are coloured according to their interpolated grades (in carats per hundred tonnes).
NI 43-101 Technical Report on the Karowe Mine (Amended) – February 4 2014 Page: 83

Table 14-12 Comparison of sample and kriged (block) grades by rock type in AK6
Average sample and kriged grades from the 2008 block model by De Beers (Bush, 2008a) are also shown for comparison. cpm3 = carats per cubic meter.
14.3.3 Adjustment for recoverable grade
The grade estimates presented in the section above have been made on the basis of grade data from LDD samples processed with a 10 tonne per hour mobile DMS plant at a 1.0 mm bottom cut off. A recovery correction is required in order to convert these grades to an estimate of grade recoverable with the current Karowe plant configuration (1.25 mm bottom cut-off).
2008 2013 2008 2013
BBX(S) 0.12 0.05 0.14 0.21
CBBX(S) 0.00 na 0.14 0.17
CKIMB(S) 0.03 0.01 0.19 0.23
EM/PK(S) 1.20 1.37 1.00 0.92
M/PK(S) 0.56 0.52 0.59 0.61
WBBX(S) 0.13 0.22 0.15 0.20
WK(S) 0.50 0.53 0.42 0.54
WM/PK(S) 0.85 0.82 0.58 0.56
17+YIELD 0.35 0.35 0.42 0.45INTBS(S)1 na 0.00 na 0.00
South 0.60 0.594 0.56 0.56BBX (N/C to C)2 0.45 0.35 0.45 0.48
CFK(C) 0.86 0.82 0.79 0.77
CKIMB(C) na na 0.30 0.36
FK(C) 0.58 0.63 0.64 0.68WBBX(N/C to C)2 na na 0.86 1.16
WK(C) 0.36 0.42 0.52 0.58KBBX(C)2 0.46 0.59 0.43 0.43
Centre 0.60 0.63 0.64 0.63CKIMB(N) na na 0.69 0.77
FK(N) 0.61 0.49 0.64 0.60
WK(N) 1.74 1.47 1.06 1.03BBX(N/C to N)3 na 0.28 na 0.52WBBX(N/C to N)2 na 2.28 na 1.06
North 0.70 0.69 0.64 0.71Total 0.58 0.61 0.57 0.58
3 KBBX(N) samples are included into BBX(N) totals.
1 Internal basalt "raft" or "reef" identified by Karowe Mine geologists during mining.2 Note: The BBX, KBBX and WBBX of the North/Centre lobes from the 2008 model are split into separate domains corresponding to the North and Centre lobes, respectively, in the 2013 geology model.
Grade Samples (cpm3) Avg Kriged Block Grade (cpm3)Rock Type
NI 43-101 Technical Report on the Karowe Mine (Amended) – February 4 2014 Page: 84
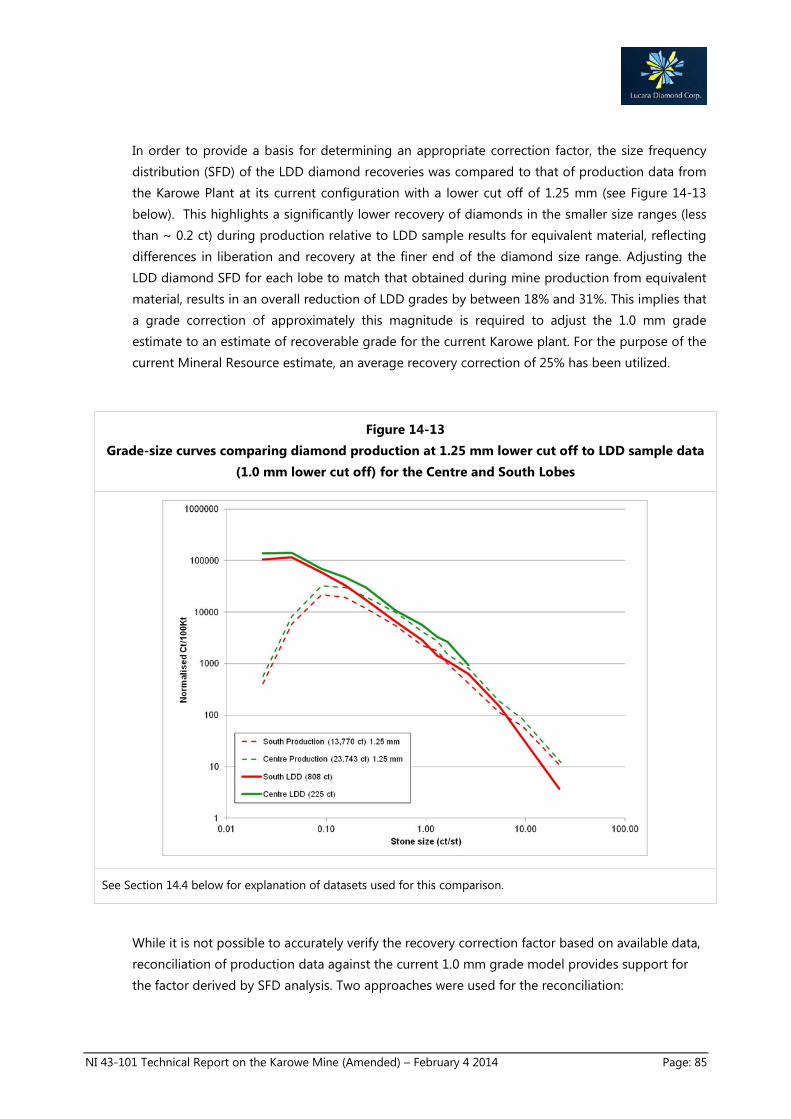
In order to provide a basis for determining an appropriate correction factor, the size frequency distribution (SFD) of the LDD diamond recoveries was compared to that of production data from the Karowe Plant at its current configuration with a lower cut off of 1.25 mm (see Figure 14-13 below). This highlights a significantly lower recovery of diamonds in the smaller size ranges (less than ~ 0.2 ct) during production relative to LDD sample results for equivalent material, reflecting differences in liberation and recovery at the finer end of the diamond size range. Adjusting the LDD diamond SFD for each lobe to match that obtained during mine production from equivalent material, results in an overall reduction of LDD grades by between 18% and 31%. This implies that a grade correction of approximately this magnitude is required to adjust the 1.0 mm grade estimate to an estimate of recoverable grade for the current Karowe plant. For the purpose of the current Mineral Resource estimate, an average recovery correction of 25% has been utilized.
Figure 14-13 Grade-size curves comparing diamond production at 1.25 mm lower cut off to LDD sample data
(1.0 mm lower cut off) for the Centre and South Lobes
See Section 14.4 below for explanation of datasets used for this comparison.
While it is not possible to accurately verify the recovery correction factor based on available data, reconciliation of production data against the current 1.0 mm grade model provides support for the factor derived by SFD analysis. Two approaches were used for the reconciliation:
NI 43-101 Technical Report on the Karowe Mine (Amended) – February 4 2014 Page: 85

a) Reconciliation of selected short production periods during which the material processed was
derived from one excavation location, with no significant addition of stockpile material and no concurrent stockpiling of (potentially lower grade) material from the excavation location. Six production periods were found to fulfil these criteria, amounting to 64 days of production, during which 420,000 wet tonnes were processed to produce 83,000 ct. Modelled solids were generated for each of these production batches based on surveys of the mine surface (provided by the Karowe Mine survey department) at the beginning and end of each period. These solids were intersected with the block model to generate predicted 1.0 mm grade estimates for each production period. Comparison of the estimated grade from the block model with the actual grade recovered from each production period (Figure 14-14) shows that in all cases the block model grade overestimates recoverable grade and, on average, the 1.0 mm block model grade is 22% higher than that achieved during production.
b) As further verification, a larger scale reconciliation of the 1.0 mm grade model with
production and stockpile data was carried out (Table 14-13). Production data spanning the period November 2012 to October 2013 (consistent plant recovery parameter of 1.25 mm bottom cut off) were collated and were compared with estimates of carats contained within the portion of the deposit mined during this period (as determined from survey data provided by the Karowe Mine survey department) based on the block model (see Table 14-13 below). The grade of material on the stockpiles is estimated so a full reconciliation is not possible. However, if no correction factor is applied to the block model grade estimates, production records would imply an average stockpile grade (determined by subtracting actual tonnes processed and carats produced from the total estimate tonnes and carats mined during the period in question) of ~20 cpht. This is considered highly unlikely because of current grade control and ore handling procedures at the Karowe mine (see Section 14.4.1 below) that involve a preferential allocation and / or retention of diluted lower-grade ore to the stockpile, implying that production grades should be significantly higher than the average grade of material remaining on stockpiles. If a 25% correction is applied to the total 1.0 mm carats estimated to have been removed during the relevant production period, the estimated grade of the material stockpiled during this period would be on the order of 5 cpht (Table 14-13). This is considered to be a realistic average estimate of the recoverable grade of the material stockpiled, and provides further support for a downward correction to the 1.0 mm model grades of approximately 25%, to produce “recoverable” grade estimates for the Karowe Mine process plant operating in its current configuration.
It is important to note that the recovery correction factor determined for this update of the Mineral Resource estimate is appropriate for the current Karowe plant configuration as well as the physical characteristics of the ore processed since November 2012. Significant changes to the plant configuration (e.g. modification of bottom cut off size, crusher settings, etc.) or to the average ore characteristics (e.g. hardness) will probably necessitate a revision of the correction factor.
NI 43-101 Technical Report on the Karowe Mine (Amended) – February 4 2014 Page: 86
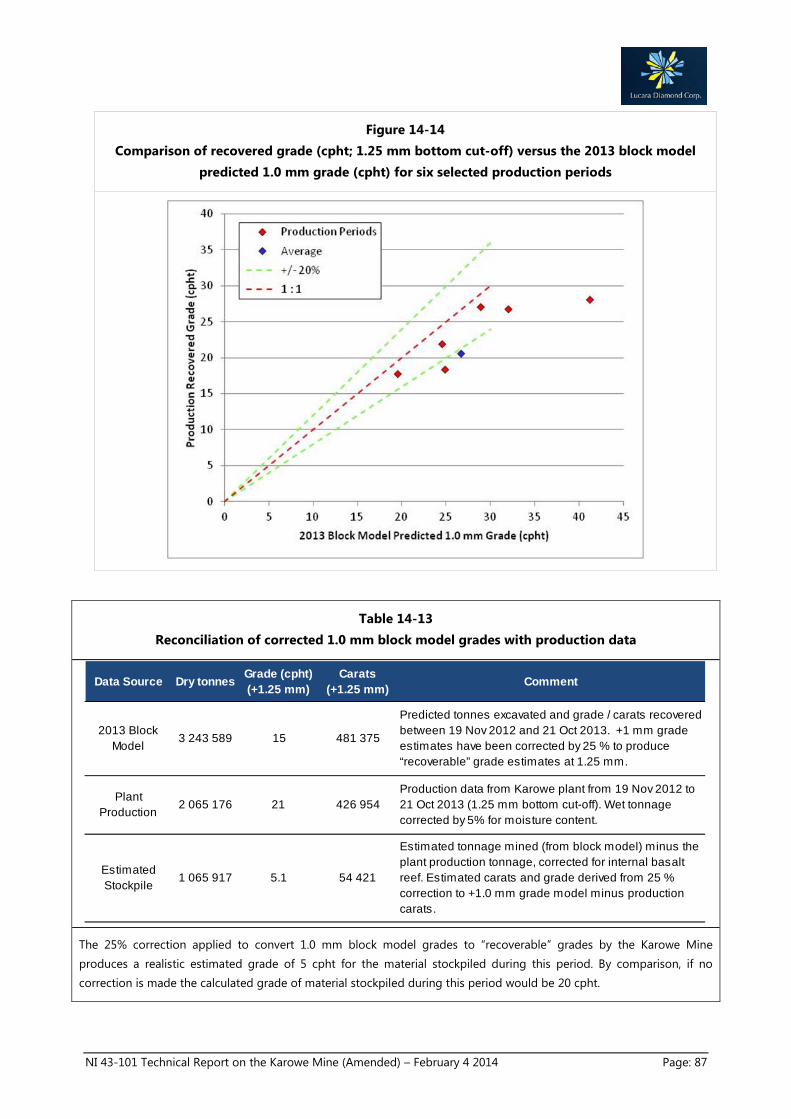
Figure 14-14 Comparison of recovered grade (cpht; 1.25 mm bottom cut-off) versus the 2013 block model
predicted 1.0 mm grade (cpht) for six selected production periods
Table 14-13 Reconciliation of corrected 1.0 mm block model grades with production data
The 25% correction applied to convert 1.0 mm block model grades to “recoverable” grades by the Karowe Mine produces a realistic estimated grade of 5 cpht for the material stockpiled during this period. By comparison, if no correction is made the calculated grade of material stockpiled during this period would be 20 cpht.
Data Source Dry tonnes Grade (cpht) (+1.25 mm)
Carats (+1.25 mm) Comment
Production data from Karowe plant from 19 Nov 2012 to 21 Oct 2013 (1.25 mm bottom cut-off). Wet tonnage corrected by 5% for moisture content.
1 065 917 5.1
Estimated tonnage mined (from block model) minus the plant production tonnage, corrected for internal basalt reef. Estimated carats and grade derived from 25 % correction to +1.0 mm grade model minus production carats.
2013 Block Model
3 243 589 15 481 375
Predicted tonnes excavated and grade / carats recovered between 19 Nov 2012 and 21 Oct 2013. +1 mm grade estimates have been corrected by 25 % to produce “recoverable” grade estimates at 1.25 mm.
Estimated Stockpile
54 421
Plant Production
2 065 176 21 426 954
NI 43-101 Technical Report on the Karowe Mine (Amended) – February 4 2014 Page: 87

14.3.4 Confidence level of grade estimates
As indicated in Section 14.3.1 the LDD sampling provides a representative spatial distribution of mini-bulk samples across the AK6 kimberlite to depths of approximately 400 m below surface (604 masl). This provides a basis for local estimation of grade for this portion of the body at a level of confidence that is appropriate for classification as an Indicated Mineral Resource. Grade is significantly less well constrained in the deeper portion of the body, between 604 masl and the base of the model at 260 masl. However, the demonstrated continuity of kimberlite units to depth provides a reasonable basis for the global estimates of average grade in this portion of the deposit, and for classification of this material as an Inferred Mineral Resource.
The grade models defined based on LDD samples represent diamonds recoverable by RC drilling and DMS processing with a bottom cut-off of 1.0 mm. As discussed in the previous section, conversion of the 1.0 mm grade model to a model of grade recoverable by the current Karowe plant (at a bottom cut-off of 1.25 mm) is not straightforward and introduces additional uncertainty to the final grade estimate. However, the maximum extent of uncertainty associated with the derived correction factor (25%) is considered to be of the order of ± 10%, considered by the QP to be an acceptable level of confidence for an Indicated Mineral Resource.
14.4 Size Frequency Distribution (SFD)
One of the key reasons for updating the AK6 Mineral Resource estimate is to factor in the improved understanding of diamond SFD obtained from the production of in excess of 600,000 ct of diamonds since the inception of mining in April 2012. This includes recoveries from a large (~84,000 t) controlled bulk sample (KD26B) obtained from the South Lobe in September/October 2013 to augment production representing this portion of the deposit. The production SFD’s were defined by isolating production batches from each of the three lobes and developing appropriate SFD models thereof. These were applied to updated diamond value data (see Section 14.5 below) to derive updated estimates of the average diamond value in each lobe. The updated SFD models based on production were also used to derive correction factors for determining recoverable grade estimates based on the 1.0 mm grade model obtained by interpolation of LDD data (see Section 14.3 above). In order to support application of production-based SFD models to the entire AK6 Mineral Resource, diamond data obtained from LDD samples were investigated to confirm continuity of diamond SFD characteristics with depth. The sections below describe the approach and data used to define SFD models and to support assumptions of continuity with depth.
14.4.1 Production and basis for definition of SFD
Production at the Karowe Mine is organised into batches based on exports of diamond parcels. A detailed record of ore movement is maintained at the Karowe Mine through records of truck haulage which include material origin, tipping point and the type of material. This has allowed for the assignment of material processed during specific production periods to the lobe from which it was sourced. When mixed stockpile material is fed to the plant, it is not possible to confidently
NI 43-101 Technical Report on the Karowe Mine (Amended) – February 4 2014 Page: 88

assign all production to specific lobes, resulting in high degrees of uncertainty during periods where a significant proportion of the plant head feed is derived from stockpiles.
Based on the detailed grade control data available, it was possible to select certain production batches as being mostly or entirely representative of specific lobes. Haulage data for these production batches were audited in detail and, where mixed stockpile material formed a significant component of the production, the data were not used. A further confirmation was obtained by verifying the drawdown of the mine pit surface through review of mine pit survey data before and after the production period of interest. The selected production periods that provide the basis for defining the SFD for the AK6 North, Centre and South Lobes, respectively, are summarised in Table 14-14. Production assigned to the South Lobe includes that from the controlled bulk sample (KD26B). More than 95% of each of the defined parcels is considered, at a high level of confidence, to be sourced from the specified lobe.
The Karowe Mine processing plant lower recovery size cut-off parameter changed on the 30th October 2012, with a decrease in the lower recovery size cut off from 1.5 mm to 1.25 mm. As no processing of pure North Lobe material has been carried out subsequent to this change, the parcels recovered at a 1.5 mm lower cut-off were used for defining a North Lobe SFD, with corrections applied to adjust the parcel for expected recovery at a 1.25 mm lower cut-off.
The locations of the mining blocks from which the relevant production batches in the Centre and South Lobes were sourced are shown in Figure 14-15. The areas from which production was obtained are considered to adequately represent the overall surface extent of these lobes. The large North Lobe parcel (not illustrated in Figure 14-15) is derived from mining of the entire upper portion of the North Lobe. The diamond datasets for each lobe represented by these production batches are summarised in Table 14-15 below. The parcel size available for the South Lobe is small relative to the larger parcels available for the other lobes, but it comprises ~14,000 ct with a total of 32 stones larger than 10.8 ct and is considered adequate for constraining SFD at high confidence level.
Table 14-14 Summary of production data used for defining SFD for the AK6 kimberlite.
Production Batch
Wet Tonnes Ct Wet Grade
(cpht)% North
Lobe% Centre
Lobe% South
Lobe Lobe
KD02A 26 204 8 710 33 100 0 0 North
KD02B 53 554 13 414 25 100 0 0 North
KD02C 46 166 12 455 27 100 0 0 North
KD03A 20 305 23 393 115 100 0 0 North
KD03A(1) 62 814 19 402 31 100 0 0 North
KD24A1 47 157 4 907 10 1 3 96 South
KD24D 97 295 14 352 15 0 98 2 Centre
KD25B 39 573 9 405 24 0 100 0 Centre
KD26B 84 173 8 875 11 0 0 100 South
NI 43-101 Technical Report on the Karowe Mine (Amended) – February 4 2014 Page: 89

Figure 14-15 Locations of mining blocks used for defining the SFD of diamond production from the Centre
and South Lobes
Note that the area of KD24A1 overlapping with the Centre Lobe represents an extremely marginal drawdown, with the majority of the material excavated derived from within the South Lobe. Grid size is 100 m.
NI 43-101 Technical Report on the Karowe Mine (Amended) – February 4 2014 Page: 90
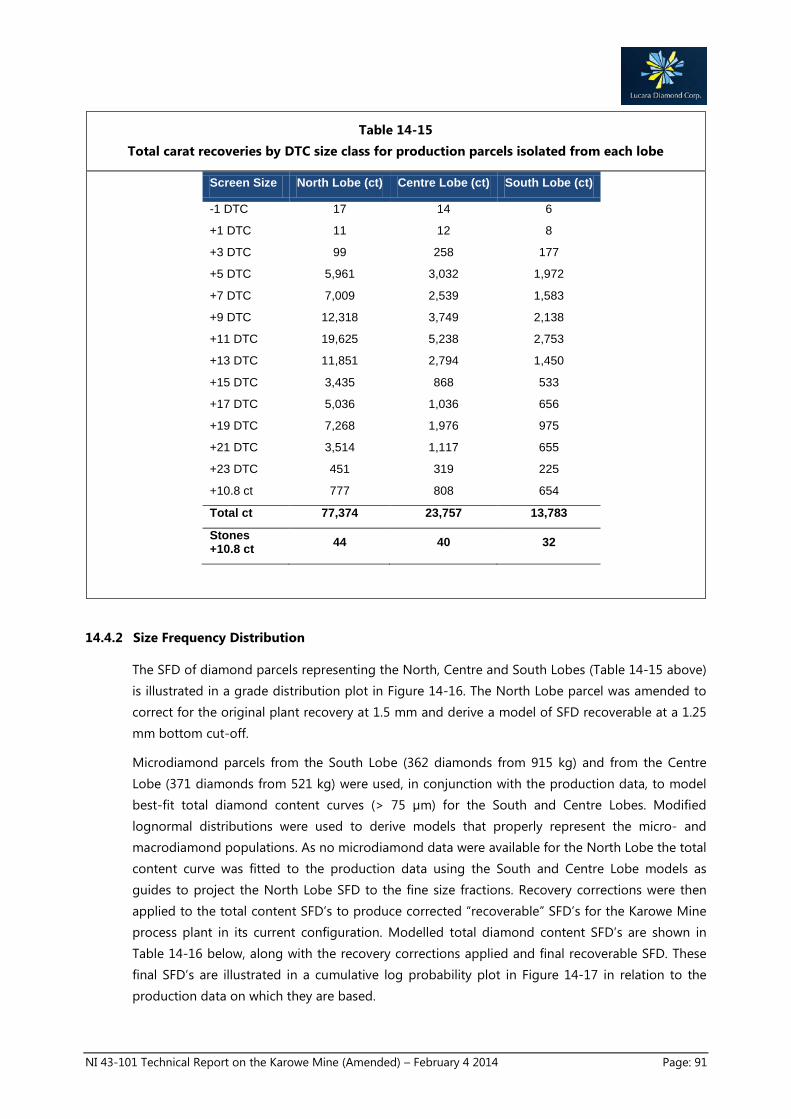
Table 14-15 Total carat recoveries by DTC size class for production parcels isolated from each lobe
14.4.2 Size Frequency Distribution
The SFD of diamond parcels representing the North, Centre and South Lobes (Table 14-15 above) is illustrated in a grade distribution plot in Figure 14-16. The North Lobe parcel was amended to correct for the original plant recovery at 1.5 mm and derive a model of SFD recoverable at a 1.25 mm bottom cut-off.
Microdiamond parcels from the South Lobe (362 diamonds from 915 kg) and from the Centre Lobe (371 diamonds from 521 kg) were used, in conjunction with the production data, to model best-fit total diamond content curves (> 75 µm) for the South and Centre Lobes. Modified lognormal distributions were used to derive models that properly represent the micro- and macrodiamond populations. As no microdiamond data were available for the North Lobe the total content curve was fitted to the production data using the South and Centre Lobe models as guides to project the North Lobe SFD to the fine size fractions. Recovery corrections were then applied to the total content SFD’s to produce corrected “recoverable” SFD’s for the Karowe Mine process plant in its current configuration. Modelled total diamond content SFD’s are shown in Table 14-16 below, along with the recovery corrections applied and final recoverable SFD. These final SFD’s are illustrated in a cumulative log probability plot in Figure 14-17 in relation to the production data on which they are based.
Screen Size North Lobe (ct) Centre Lobe (ct) South Lobe (ct)
-1 DTC 17 14 6
+1 DTC 11 12 8
+3 DTC 99 258 177
+5 DTC 5,961 3,032 1,972
+7 DTC 7,009 2,539 1,583
+9 DTC 12,318 3,749 2,138
+11 DTC 19,625 5,238 2,753
+13 DTC 11,851 2,794 1,450
+15 DTC 3,435 868 533
+17 DTC 5,036 1,036 656
+19 DTC 7,268 1,976 975
+21 DTC 3,514 1,117 655
+23 DTC 451 319 225
+10.8 ct 777 808 654
Total ct 77,374 23,757 13,783
Stones +10.8 ct 44 40 32
NI 43-101 Technical Report on the Karowe Mine (Amended) – February 4 2014 Page: 91

The North Lobe, while of higher grade, has produced a substantially lower frequency of large diamonds than the coarser grained South and Centre Lobes. Data for the South Lobe imply a higher relative frequency of large diamonds for this body compared to the Centre Lobe. However a relatively conservative approach has been adopted in modelling the coarse end of the South Lobe distribution, by adjusting the SFD to match the proportion of +23DTC and +10.8 ct diamonds observed in the parcel derived from the controlled bulk sample (KD26B) which is slightly lower than the overall average for the combined South Lobe parcel (KD26B + KD24A1). The extent of this adjustment is illustrated in Figure 14-17 which shows the discrepancy between modelled SFD and supporting production data for the coarse end of the South Lobe size distribution.
Figure 14-16 Grade distribution plot showing diamond parcels used for modelling the SFD of the North,
Centre and South Lobes
NI 43-101 Technical Report on the Karowe Mine (Amended) – February 4 2014 Page: 92

Table 14-16 AK6 modelled total diamond content SFD’s, recovery corrections and corrected SFD’s by lobe
The corrected SFD is equivalent to the recoverable grade model. Size classes for microdiamonds are by standard square mesh sieve sizes (in microns). The size breakdown for macrodiamonds (>1 DTC) is based on standard DTC, grainer (Gr) and carat (ct) size classes. The SFD is defined in this way for consistency with size classes used for diamond valuation
North Centre South North Centre South75 μm 0.37 0.44 0.52 0.0105 μm 0.97 1.20 1.29 0.0150 μm 1.91 2.51 2.57 0.0212 μm 3.38 4.24 4.64 0.0300 μm 9.37 11.70 11.91 0.0500 μm 24.28 28.28 27.22 0.0+1 DTC 12.11 12.58 11.98 0.1 0.04 0.05 0.05+3 DTC 8.49 8.50 8.17 3.1 0.94 1.28 1.16+5 DTC 10.58 10.13 9.91 29 11.20 14.60 13.45+7 DTC 4.84 4.08 4.08 59 10.25 11.74 11.06+9 DTC 6.05 4.58 4.68 72 15.75 16.25 15.64
+11 DTC 6.95 4.75 5.03 92 23.14 21.53 21.453-6 Gr 6.42 3.54 3.97 400 23.05 17.19 18.25
8-10 Gr 1.94 1.06 1.24 200 6.93 5.26 5.813-5 Ct 1.60 1.14 1.34 300 5.98 5.80 6.326-10 Ct 0.48 0.58 0.66 500 1.78 2.91 3.08+10.8 Ct 0.26 0.69 0.80 100 0.93 3.40 3.73
Recovery Correction (%)
Corrected SFD (% Ct)Size
Total Content Model (% Ct)
NI 43-101 Technical Report on the Karowe Mine (Amended) – February 4 2014 Page: 93

Figure 14-17 Cumulative log probability plot of final modelled SFD for each lobe
The plot shows the proportion of diamonds by weight below a given stone size. The production data on which the SFD models are based are shown for comparison (coloured symbols)
14.4.3 SFD continuity
The LDD data for AK6 were investigated by lobe, by elevation within each lobe and by rock type within each lobe to evaluate variations in SFD. Due to the relatively small size of the diamond parcel recovered from LDD samples (1,175 ct), it is not possible to reliably evaluate variations in SFD on the scale of sampling. However, by grouping the LDD samples into larger datasets meaningful observations can be made regarding variation in SFD with depth and between lobes.
The SFD’s of LDD diamond parcels grouped by lobe are shown in comparison with production SFD data in Figure 14-18 below. Due to the small size of the LDD parcels, the coarse end (> ~1.5 ct) of the size distribution is not reliably represented in the LDD datasets, in particular those for the Centre and North Lobes. In addition, due to different liberation and recovery parameters, the SFD curves representing LDD parcels are not directly comparable to those derived from production data. Nonetheless, aspects of the SFD data for the LDD parcels correlate well with those defined by production results for the same lobes. The overall size distribution differences observed in the production data for each lobe are broadly reflected in the LDD parcels and, despite the fact that the coarse end of the distribution is not well represented in the LDD dataset, the relative proportions of very coarse diamonds observed in the production batches from different lobes are reflected in the LDD data. This indicates that variations in the recoverable SFD between different portions of the AK6 deposit are reflected in the LDD diamond size data, suggesting that the LDD data can be used to assess the potential for variation in SFD with depth.
NI 43-101 Technical Report on the Karowe Mine (Amended) – February 4 2014 Page: 94

To evaluate variation in SFD with depth, the LDD data for the South and Centre Lobes were grouped based on the elevation range from which each sample was derived (Figure 14-19). While it is not possible to evaluate SFD variations on a local scale (e.g. by block or mining level), the results suggest that there is no significant overall change in SFD characteristics with depth on a large scale (e.g. between the upper and lower portions of each lobe). Similarly, grouping of LDD data by kimberlite unit provides no indication of significant variations in SFD between the main unweathered kimberlite units of the South or Centre Lobes. Due to the different recovery characteristics of weathered kimberlite as well as the small size of LDD parcels derived therefrom, it is not possible to reliably interpreted variations between equivalent weathered and fresh kimberlite units.
In conjunction with the confirmation of geological continuity discussed in Section 14.1.2, the analysis described above supports the use of SFD data for kimberlite production from shallow levels in each lobe to represent all kimberlite within that lobe.
Figure 14-18 Cumulative log-probability plot illustrating the SFD of LDD results by lobe in comparison with
production data by lobe
The plot shows the proportion of diamonds by weight below a given stone size. The Centre Lobe SFD has been corrected by excluding a single +13 ct diamond as a statistical outlier
NI 43-101 Technical Report on the Karowe Mine (Amended) – February 4 2014 Page: 95

Figure 14-19 Cumulative log-probability plot illustrating the SFD of LDD recoveries grouped by depth within
the South and Centre Lobes
The plot shows the proportion of diamonds by weight below a given stone size. The SFD of the North Lobe LDD parcel is shown for reference
14.5 Diamond Value
14.5.1 Sales data
More than 600,000 ct of diamond produced from AK6 have been sold up to November 2013. These sales have realised USD 230 million dollars of income at an average price of USD 365 per ct (Table 14-17). A significant population of very high value diamonds is present in the AK6 diamond population, and these stones have been extracted from regular sales parcels for separate sales in “Large Stone Tenders”, the sales results of which are shown in Table 14-17 as LST1 to LST3. With a single exception, all diamonds sold in these separate tenders were recovered from, or subsequent to sales batch KD008. Large high value diamonds (up to a maximum of USD 28,000 per ct, excluding rare blue stones with values of up to USD 470,000 per ct) were previously recovered and sold in sales batches KD001 to KD007, however they were not present in sufficient quantities to justify extraction for separate sales, and did not impact materially on the average sales prices for the earlier parcels.
NI 43-101 Technical Report on the Karowe Mine (Amended) – February 4 2014 Page: 96

Table 14-17 Results of diamond sales from the Karowe Mine
Large stone tender (LST) sales have been carried out for selected batches of exceptional large diamonds recovered during and subsequent to sale KD008
In order to analyse the sales data by lobe, the relative volume contribution of kimberlite from each lobe has been estimated as best as possible for each of the diamond sales batches. This was done based on grade control data from Karowe Mine and, for similar reasons to those described in Section 12.7 for allocation of daily production data to location in the pipe, it is not possible to precisely constrain the contribution from each lobe to each sale. Nonetheless, the exercise provides an approximate indication of the proportion of each sale parcel derived from each of the AK6 lobes. The percentage contribution by volume of each lobe to each sale parcel is shown along with the average sales values for all +10.8 ct diamonds in Table 14-18. Diamonds sold by large stone tender have been incorporated back into overall sales data for +10.8 ct diamonds based on the production period during which they were recovered. Sales values for +10.8 ct diamonds increased considerably from KD008 onwards, coinciding with the first introduction of a significant component of South Lobe material and an overall reduction in the percentage contribution from the North Lobe.
Sale Period Sale ID Ct USD USD/ct
Q2 2012 KD001 26 196 5 617 712 214
Q3 2012 KD002, 003 88 580 19 921 441 USD 225
Q4 2012 KD004, 005 100 982 29 170 881 USD 289
Q1 2013 KD006, 007 144 723 32 447 574 USD 224
Q2 2013 KD008 51 307 13 032 484 USD 254
Q3 2013 KD009, 010 130 683 38 128 673 USD 292
Q4 2013 KD011, 012 79 935 17 798 556 USD 223
April 2013 LST1 815 24 564 601 USD 30,129
August 2013 LST2 1 028 24 700 336 USD 24,028
November 2013 LST3 1 128 22 884 459 USD 20,288Total 625,375 228,266,718 USD 365
NI 43-101 Technical Report on the Karowe Mine (Amended) – February 4 2014 Page: 97

Table 14-18 Average sales values achieved for +10.8 ct diamonds from the Karowe Mine by sales
batch
The approximate percentage contribution by volume of material from the North, Centre and South Lobes to each sale parcel is provided.
1Based on compilation of Karowe Mine grade control data. The derived values are not precise due to feed of blended stockpile material to the plant, but are considered a reasonable approximation of where material processed was derived from.
2Sales data for KD012 available but recent grade control data not compiled.
14.5.2 Value estimates by size class and kimberlite lobe
Based on Karowe Mine grade control data, certain production periods have been identified as representing material that was wholly or predominantly derived from specific lobes. The production batches assessed for valuation purposes are shown in Table 14-19 below. In order to derive diamond parcels of sufficiently large size from each lobe to reliably represent diamond values in the large size classes (> ~ 5 ct), the criteria for selection of production batches were less restrictive than those used for definition of SFD (Section 14.4.1) and all production batches containing >75% of material from a single lobe were included. Each lobe is represented by more than 50,000 ct of diamond and valuation of these diamond parcels by size class forms the basis for constraining average diamond values for the updated Mineral Resource estimate reported here.
Sales data are not available for individual production batches as these were rolled together into larger parcels for sale. To obtain estimates of average value per size class for each of these batches, each production parcel has been assigned diamond values based on the November 2013 price book of GTD Diamond Consulting Ltd. (“GTD”) summarised by lobe in Table 14-20). The price book reflects reserve prices that are generally slightly lower than actual sales prices achieved
Sale ID Ct USD/ct % North Lobe1 % Centre Lobe1 % South Lobe1
KD001 334 789 85 15 0
KD002 250 1 248 100 0 0
KD003 961 1 846 70 30 0
KD004 1 715 1 098 20 80 0
KD005 987 1 613 40 60 0
KD006 799 1 260 25 75 0
KD007 952 1 968 30 70 0
KD008 2 332 12 156 15 50 35
KD009 1 984 13 290 10 35 55
KD010 4 272 3 566 5 60 35
KD011 2 922 6 117 0 70 30
KD012 2 183 9 112 Unknown2 Unknown2 Unknown2
Total 19 690 5 912
NI 43-101 Technical Report on the Karowe Mine (Amended) – February 4 2014 Page: 98

(the discount varies by sale, but typically averages ~15%), providing a conservative estimate of average diamond value.
Table 14-19 Production batches used for value estimation
Table 14-20 GTD average value estimates by size class (DTC, grainer and carat)
Values are for production parcels representing the Centre, North and South Lobes. Prices are based on the GTD November 2013 price book
Lobe Production Batch % Lobe Batch Ct Valuation Ct
KD02A 100 8 377
KD02B 100 13 260
KD02C 100 12 441
KD03A 100 23 173
KD03C2 96 3 297
KD04A2 100 9 960
KD24D 98 14 258
KD25A/B 87 25 261
KD26B - rev 100 8 895
KD22B1 84 10 379
KD23B 77 14 511
KD23D 85 7 591
KD24A1 96 4 821
KD26A 98 5 317
North 57 251
Centre 52 776
South 51 515
USD/ct Ct St1 USD/ct Ct St1 USD/ct Ct St1
+3 DTC 38 73 2 182 49 467 14 040 42 560 16 847
+5 DTC 52 4 584 64 259 54 6 605 92 588 46 6 872 96 330
+7 DTC 63 5 288 38 409 62 5 528 40 153 61 5 619 40 815
+9 DTC 84 9 116 40 516 69 8 406 37 361 68 8 307 36 918
+11 DTC 118 14 130 31 704 86 11 563 25 945 97 10 214 22 918
3-6 Gr 235 14 732 14 834 186 10 426 10 555 215 9 757 9 739
8-10 Gr 451 4 058 1 899 326 2 995 1 402 433 2 852 1 333
3-5 ct 753 3 552 935 573 3 203 843 716 3 049 802
6-10 ct 1 033 1 140 153 587 1 509 202 1 031 1 205 161
+10.8 ct 1 425 579 26 2 713 2 074 92 8 401 3 081 137
Size North Lobe South Lobe
1Stone counts derived on the basis of average stone w eights for each size class.
Centre Lobe
NI 43-101 Technical Report on the Karowe Mine (Amended) – February 4 2014 Page: 99

14.5.3 Final values used for estimation
The valuation process outlined in Section 14.5.2 above is considered to have generated reliable value estimates for all size ranges with the exception of the +10.8 ct size class. This is particularly relevant to the Centre and South Lobes for which +10.8 ct diamonds comprise a significant proportion of the total diamond population and contribute substantially to the average value thereof.
Due to blending of material from different lobes during most production periods it is difficult to conclusively derive accurate +10.8 ct diamond values for the South Lobe and Centre Lobe. The sales data indicate a dramatic increase in the average value of +10.8 ct diamonds sold from sale KD008 onwards (Table 14-18), corresponding with the inclusion of South Lobe material in production and processing. While this suggests that many of the high value +10.8 ct stones may be derived from the South Lobe, given the high proportion and higher grade of material processed from the Centre Lobe during the period represented by sales KD008 to KD012, it is very likely that the Centre Lobe has contributed substantially to the high value +10.8 ct diamonds sold. Reconciliation of revenue estimates based on the value data reflected in Table 14-20 (applied to the total estimated carats processed to date from each of the lobes) against the actual sales revenue achieved for the equivalent production periods indicates that the average value of specials (+10.8 ct stones) in the Centre and South Lobes are higher than is indicated by the valuation data represented in Table 14-20 .A significantly higher average value estimate for Centre and South Lobe specials is required to produce a reasonable reconciliation.
The +10.8 ct diamond values achieved during sales KD003 to KD007, for material that overall by volume was derived more from the Centre Lobe than from the North Lobe (with no contribution from South Lobe) are relatively low. However, the North Lobe returned grades up to double that of the Centre Lobe, and it is likely that, in terms of carats generated, more than 50% of the carats sold in sales KD003 to KD007 were derived from the North Lobe. High individual diamond values of up to USD 28,000 per carat were present in these earlier sales, and it is considered likely that these indicate the presence of high value diamonds from the Centre Lobe, the impact of which is reduced due to the large contribution of North Lobe diamonds to the early sales parcels.
Based on the indication from the value reconciliation that both the Centre Lobe and South Lobe are producing a significant component of high value diamonds, the average +10.8 ct sale value for sales KD003 to KD012 (USD 6,063/ct; representing 19,100 ct and approximately 870 stones derived predominantly from the Centre and South Lobes) was used as the final best estimate of the average value of +10.8 ct diamonds in both Centre and South Lobes.
Application of the final value estimates by size class to the recoverable size frequency distributions for each lobe returns average diamond values of USD 217, USD 351 and USD 413 per ct for the North, Centre and South Lobes, respectively (Table 14-21). Reconciliation of revenue estimates based on these average value estimates against actual revenues achieved over the mine life to date indicates that the former underestimates actual revenue by approximately 15%. This conservative approach has been adopted to allow for possible variation in the relative abundance and quality of high value diamonds with depth.
NI 43-101 Technical Report on the Karowe Mine (Amended) – February 4 2014 Page: 100

Table 14-21 Final value estimates by size class and overall average diamond value for the North, South and
Centre Lobes
Average diamond values (for 1.5 mm bottom cut-off) from the 2010 resource estimate (McGeorge et al, 2010) are shown for comparison
14.5.4 Confidence level of average diamond value estimates and comparison with previous estimates
The revised average diamond value estimates for the Centre and South Lobes are considerably higher than those on which the previous Mineral Resource estimate was based (MSA, 2010; Table 14-21). This stems from a number of factors that result largely from the incorporation of production and sales data into the updated average value estimates:
• Revision of the SFD models for all three lobes and in particular recognition that the Centre Lobe has a distinct, coarser distribution than the North Lobe (these were previously modelled to have the same SFD and value) and that both the Centre and South lobes have a high proportion (>3% by weight) of +10.8 ct diamonds;
• Incorporation of sales data from in excess of 600,000 carats of diamonds produced and
sold from the AK6 Mineral Reserve, in particular a large total parcel (~20,000 ct) of very large (+10.8 ct) diamonds, has resulted in a considerable increase in the estimated average value of large diamonds from the Centre and South Lobes.
Despite the very large production datasets on which the updated average diamond value estimates are based, the diamond value component of the AK6 Mineral Resource estimate is considered to have the greatest amount of uncertainty. This is due primarily to uncertainty in the frequency and average value of +10.8 ct diamonds in the Centre and South Lobes which
North Centre South+3 DTC 38 49 42
+5 DTC 52 54 46
+7 DTC 63 62 61
+9 DTC 84 69 68
+11 DTC 118 86 97
3 - 6 Gr 243 188 216
8 - 10 Gr 450 328 433
3-5 ct 753 573 716
6-10 ct 1033 587 1031
+10.8 ct 1425 6063 6063
All 217 351 4132010 values 276 276 231
Size Average Value ($/Ct)
NI 43-101 Technical Report on the Karowe Mine (Amended) – February 4 2014 Page: 101

contribute 59% and 55% to the average value from each lobe, respectively. As described in Section 14.5.3, it is difficult to reliably establish average values of +10.8 ct diamonds specifically derived from the South and Centre Lobes, respectively, and a combined estimate has been used based on the average value of such stones sold from both lobes. Given that the sales data provide significant (although not conclusive) support for +10.8 ct diamond values in the South Lobe that are on average higher than those in the Centre Lobe, the approach taken is considered to be conservative. Similarly, a conservative SFD model has been used for the proportion of +10.8 ct diamonds in the South Lobe, mitigating to some extent the uncertainty in the estimated frequency of recovery of such stones.
Given these conservative aspects of the value estimation approach used for the current resource update, the resultant average diamond value estimates are considered to be appropriate for classification of an Indicated Mineral Resource covering the portion of the deposit for which macrodiamond data are available, and where such data and associated geological information support the assumption of continuity in SFD. This does not apply below 604 masl, but geological continuity into the deep portion of the AK6 deposit provides a basis for assuming that similar diamond values will be realised, albeit at a significantly lower level of confidence i.e. Inferred Mineral Resource.
It should be noted that the confidence levels discussed above relate only to the intrinsic value of the AK6 diamonds, with the estimated average values reflecting diamonds prices prevalent in November 2013. They do not account for potential market fluctuations in diamond price through time.
14.5.5 Estimates of stockpile Mineral Resources
Total dry tonnes and carats contained in stockpiles at the Karowe Mine as of the 21st October 2013 were estimated by subtracting the total measured tonnes processed (based on plant weightometer data) and total carats recovered up to that date from the estimated tonnes and carats depleted from the updated 2013 block model (using estimated recoverable grade at 1.25 mm) over the same time period. The mine surface surveyed on the 21st October 2013 was used to cut the block model for estimation of depleted tonnes and carats. Processed tonnes derived from plant weightometer data were converted to dry tonnes using an assumed moisture content of 5%. In order to properly account for carats produced during the period up to the 30th October 2012, during which a 1.50 mm bottom cut-off was used on the Karowe plant, a correction was applied to production carats to reflect what would have been recovered at a 1.25 mm bottom cut-off. This was based on the SFD correction applied to the North Lobe diamond production (mostly produced at 1.50 mm bottom cut-off) to derive an SFD curve that was equivalent to that recoverable at a 1.25 mm bottom cut-off (see Section 14.4.2 above).
The total estimated dry tonnes and carats contained on the stockpiles, derived using the above-described approach were assigned to two groupings of stockpiles:
a) “Working” stockpiles, encompassing the High-grade, Medium-grade, Low-grade, “Contact” and “Pebbles” stockpiles; and
b) The Life Of Mine (LOM) stockpile, representing low grade material not intended for processing in the short to medium term.
NI 43-101 Technical Report on the Karowe Mine (Amended) – February 4 2014 Page: 102

Total estimated stockpile tonnes and carats were allocated to each of these two groupings based on the relative proportion of volume and carats in each grouping, as reflected in mine haulage records. Similarly, the proportion of carats from each lobe in each of the stockpile groupings was estimated based on mine haulage records in order to be able to estimate the average value (USD per carat) of diamonds contained in each stockpile. Mine haulage records were not used to directly estimate total stockpiled tonnes and carats due to: uncertainty in applicable bulking factor; derivation of grades and carats based on the 2010 grade model at a 1.5 mm bottom cut-off; and complex ore handling procedures that introduce uncertainty to estimates of the grade of material being stockpiled relative to that processed.
In contrast to the tonnage and carat estimates, the estimated volume of stockpiled kimberlite material at Karowe Mine as of the 21st October 2013 has been derived directly from mine haulage records. Mine records of hauled and stockpiled volumes are not subject to the factors outlined above that introduce uncertainty to estimates of tonnes and carats based on haulage data. The average bulk density of each stockpile grouping is derived from the volume and tonnage estimate as outlined above.
The confidence level of the total estimated tonnes and carats contained on the Karowe Mine stockpiles is considered to be equivalent to that of the block model on which it is based. Hence the stockpiles are classified as an Indicated Mineral Resource.
14.6 Mineral Resource statement
The estimates of kimberlite volume, bulk density, tonnage, grade and average diamond value described in the sections above have been integrated to generate an updated Mineral Resource estimate for the AK6 kimberlite, presented in Table 14-22. Estimated tonnes and carats reflect the depleted resource, with material mined up to the 21st of October 2013 removed from the original model. Resource grade and average value estimates reflect expected recoverable diamond production using the current Karowe plant configuration with a bottom cut-off of 1.25 mm. Any significant changes to the plant configuration, or the physical character of the kimberlite ore, will modify diamond recovery and necessitate an adjustment to estimated grade and average value. The AK6 Mineral Resource estimate is reported by lobe and by Mineral Resource classification. Classification is based on CIM definition standards for reporting of Mineral Resources (CIM, 2010).
For reasons outlined in the sections above, the upper ~ 400 m of the deposit (to an elevation of 604 masl) has been classified as an Indicated Mineral Resource, with an estimated total of 46.21 million tonnes of kimberlite ore, containing 7.46 million carats of diamonds at an average diamond value of USD 394 per carat.
The portion of the deposit from 604 masl to the base of the model at 260 masl is classified as an Inferred Mineral Resource, with an estimated total of 21.00 million tonnes of kimberlite ore, containing 3.04 million carats of diamonds at an average diamond value of USD 412 per carat.
NI 43-101 Technical Report on the Karowe Mine (Amended) – February 4 2014 Page: 103

Stockpiles at the Karowe Mine are estimated to comprise 1.86 million tonnes of kimberlite classified as an indicated mineral resource and containing 0.15 million carats of diamonds with an average value of USD 341 per carat.
Table 14-22 Mineral Resource Statement
Statement of the estimated remaining Mineral Resource Statement in the AK6 kimberlite deposit as of the 21st October, 2013. SP = Stockpile. LOM = Life of Mine. Volume, tonnes and carats are reported in millions (M)
1) Based on a recoverable grade model (1.25mm bottom cut off size) 2) Diamond price is based on diamonds recoverable with current Karowe plant process and November 2013
Price Book 3) Effective Date October 21, 2013 4) Mineral Resources are reported inclusive of Mineral Reserves 5) Mineral Resources that are not Mineral Reserves do not have demonstrated economic viability
Classification ResourceVolume (Mm3)
Density (tpm3)
Tonnes (Mt)
Carats (Mct)
Grade (cpht) USD/ct
INDICATED North Lobe 0.74 2.48 1.83 0.30 16 217
Centre Lobe 2.53 2.56 6.49 1.27 20 351
South Lobe 13.50 2.81 37.89 5.89 16 413
Working SP 0.33 1.88 0.62 0.08 13 333
LOM SP 0.66 1.88 1.24 0.07 6 350
IND Total 17.76 2.71 48.07 7.61 16 393
INFERRED Centre Lobe 0.08 2.59 0.21 0.03 15 351
South Lobe 7.01 2.96 20.79 3.01 14 413
INF Total 7.09 2.96 21.00 3.04 14 412
NI 43-101 Technical Report on the Karowe Mine (Amended) – February 4 2014 Page: 104

15 MINERAL RESERVE ESTIMATE
Mineral Reserve estimation is based on the updated Indicated Mineral Resource estimate. Inferred Resources have not been used to estimate Mineral Reserves. The Resource to Reserve conversion was performed by Lucara by conducting an open pit optimisation, using Whittle Four-X software (Figure 15-1). The outputs of this process include a mining schedule on which to base plant capacity, waste rock quantities, peak capacities and mining fleet parameters. The mining plan is reviewed in Section 16. It should be noted that the Whittle optimisation is ongoing and consideration is being given by Lucara to revising the mining schedule by not mining of a portion of the North Lobe which is highly diluted.
A trade-off study on the capital cost, plant efficiencies and size-revenue curve, indicated that the optimum bottom size cut-off for the project is 1.25 mm, and this is currently the bottom screen size cut-off in the Karowe plant. Mineral Reserves were estimated for the AK6 pipe, and active stockpile materials.
In addition to defining the optimal pit shell, a double revenue pit shell was defined during the Feasibility Study in 2010. Double revenue sensitivity is performed to anticipate upswings in the future diamond market, providing a guide as to where the surface infrastructure, waste rock dumps, primary crusher, workshops etc. should be positioned in order to avoid the possibility of any future need for relocation. The location of surface infrastructure has been determined with consideration of the double revenue optimal pit shell.
15.1 Key Assumptions and basis of Estimate
Diamond recovery factors have been factored into the Mineral Resource estimates on the basis of the current plant, and have not been re-factored in the estimation of the Mineral Reserve.
There are no specific grade control programs. Generally all kimberlitic material within the resource models is considered to be economic, and is either processed directly or stockpiled for possible future processing. Material from the pipe contact is stockpiled into a low grade stockpile for possible future processing. Portions of the pipe have been modelled as being diluted in the geological model, based on core drilling data. However, some diluted portions of the pipe have not been mapped. Mining recovery of 97% and dilution of 4.5% were applied in the optimisation to better simulate the physical operation. Plant recovery was set at 100%. Operating costs used in the Whittle optimisation are based on current contracts for outsourced mining and ore processing. Inter-ramp slope angles were derived from the geotechnical work reported in Section 16. These angles have been flattened by six degrees in basalt and nine degrees in kimberlite and sandstones to make allowance for haul roads.
The QP undertook his own Whittle optimisation for comparison with that undertaken by Lucara. The results of this comparison are almost identical and therefore in the QP’s opinion, the current LOM plan and Whittle shell is optimal.
NI 43-101 Technical Report on the Karowe Mine (Amended) – February 4 2014 Page: 105

15.2 Mineral Reserve Statement
The Mineral Reserve estimate is presented in Table 15-1.
Table 15-1 Mineral Reserve Statement
Lobe Category Tonnes Grade cpht
Revenue USD/ct
Revenue USD/tonne Carats
North Probable 991,965 18.4 217 40 182,217
Centre Probable 5,998,544 18.4 351 65 1,105,729
South Probable 25,261,762 15.1 413 62 3,803,981
LOM SP Probable 873,059 5.7 350 20 49,912
TOTAL Probable 33,125,330 15.5 394 61 5,141,839
Statement of the estimated remaining Mineral Reserve in the AK6 kimberlite Life of Mine optimal pit as of the 26th December, 2013. LOM SP – Life of Mine Stockpile.
1) Based on the updated Mineral Resource estimate (1.25mm bottom cut off size) 2) Diamond price is based on diamonds recoverable with current Karowe plant process and November 2013
Price Book 3) Rounding has been applied 4) Dilution of 4.5% and Mining Recovery of 97% applied 5) Mineral Reserve excludes loose stocks in pit and low grade stockpiles
Figure 15-1 Optimised pit shell with the geological model superimposed
Oblique view looking due east. The final pit will be approximately 800 m in the N-S direction, and 700 m in the E-W direction. The Mineral Reserve is defined by those portions of the Mineral Resource which occur within the optimised pit shell.
NI 43-101 Technical Report on the Karowe Mine (Amended) – February 4 2014 Page: 106

16 MINING METHODS
16.1 Geotechnical and Hydrogeological Aspects and Pit Slope
Data from a geotechnical drilling and slope dewatering study conducted by De Beers was used in the original mine design and this remains the basis of the pit design parameters. A rock mass, structural and country rock model of the area surrounding the AK6 optimised pit shell was constructed and the information used by SRK Consulting and De Beers to derive a slope angle recommendation by means of limit equilibrium modelling. This work was able to utilise the extensive knowledge base that Debswana has gained in over forty years of operating mines in the area. The geological and structural controls are well understood.
The geotechnical performance of the pit was reviewed by SRK Consulting in February 2013 (SRK, 2013), and the observations and recommendations from this report are summarised below.
16.1.1 Pit Slope Angle Review
SRK (2013) undertook an analysis of the planned pit slope angles in conjunction with the mine Geotechnical Engineer. Currently the mine is utilising Toe to Crest angles. While Toe to Crest angles represent the “real” angle over a specific height, berm widths will vary as the stack height increases, while a Crest to Crest angle has the berm widths at the same size. For a 96 m stack height, the stack angle will vary from 62° for a Crest to Crest slope, to 65° for a Toe to Crest slope. The consequence of this evaluation is that if a Toe to Crest angle is used in the design, berm widths decrease as the slope height is decreased, resulting in a berm width that is non-functional. To this end it was recommended that a Crest to Crest angle be used in updates to the pit design and that the design berm width be incorporated in the mining plan. Lucara has modified the pit model and adopted Crest to Crest angles for subsequent pit models. SRK (op. cit.) recommended pit slope angles (Crest to Crest) as shown in Table 16-1 and Figure 16-1.
Table 16-1 Recommended Crest to Crest stack angles (SRK, 2013)
Stack Stack Angle Berm Width Maximum Stack Height
Calcrete 60o 10.07 m 36 m
Basalt 62o 6.38 m 96 m
Sandstone 48o 10.71 m 96 m
Kimberlite 48o 10.71 m 96 m
The QP has reviewed the pit design and made the following observations:
• The pit design has been based on standard acceptable design criteria common to this size of mine and the application of enhancements such as ramp reduction from 25 m to 20m wide in lower levels to reduce shell footprint and to gain marginally more ore is acceptable
NI 43-101 Technical Report on the Karowe Mine (Amended) – February 4 2014 Page: 107

• The slope angles have been well adhered to (Figure 16-1) • The inter ramp high wall on the east side may need to have a geotechnical catch berm
incorporated
Figure 16-1 Bench stack configurations (source: SRK, 2013)
NI 43-101 Technical Report on the Karowe Mine (Amended) – February 4 2014 Page: 108

Figure 16-2 Section of the final pit design showing the slope angles relative to rock types
Section looking east. The grid lines are 200 m apart. The pit slope angles honour the geotechnical recommendations.
The final pit design was compared with the optimal Whittle shell to check that it conforms. The QP notes that the east-west section (Figure 16-3; C-D) shows very close correlation to the Whittle shell but the North South section (Figure 16-3; A-B) shows that the design in the north extends beyond the optimal Whittle shell. The reason for this is that upon excavation of the first bench, the pipe contacts were found to be slightly different to the original geological model. As a consequence, the pit design had to be modified. Mining of the North Lobe is currently subject to re-design, which may result in a portion of highly diluted kimberlite not being mined.
NI 43-101 Technical Report on the Karowe Mine (Amended) – February 4 2014 Page: 109

Figure 16-3 Section of the final pit design relative to the optimal shell
Brown line – QPs Optimal Whittle pit; Blue line – Lucara’s Optimal Whittle pit; Red line – Current pit design. There is very good correlation between Lucara’s optimal Whittle pit, and that produced by the QP during this review. There is also a very good correlation between the optimal Whittle pit and the current pit design in a E-W section (C-D). However, the current pit design is observed to be quite different to the optimal Whittle pit in the N-S section (A-B).
NI 43-101 Technical Report on the Karowe Mine (Amended) – February 4 2014 Page: 110
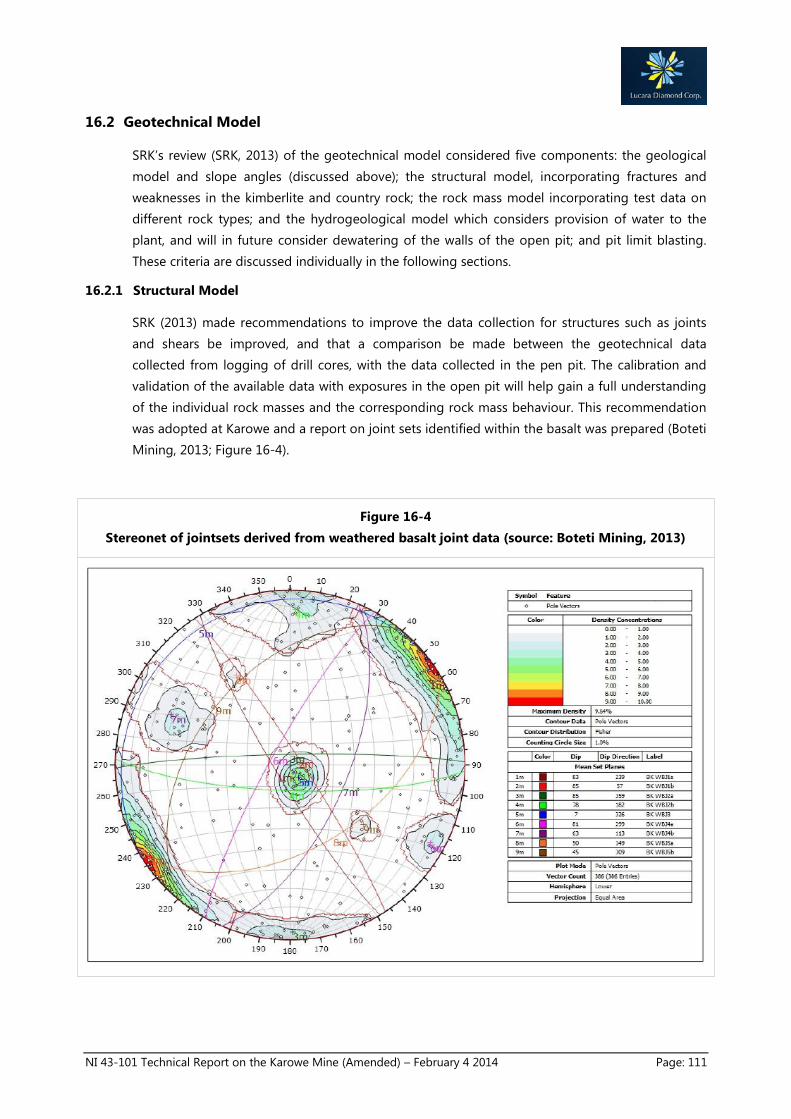
16.2 Geotechnical Model
SRK’s review (SRK, 2013) of the geotechnical model considered five components: the geological model and slope angles (discussed above); the structural model, incorporating fractures and weaknesses in the kimberlite and country rock; the rock mass model incorporating test data on different rock types; and the hydrogeological model which considers provision of water to the plant, and will in future consider dewatering of the walls of the open pit; and pit limit blasting. These criteria are discussed individually in the following sections.
16.2.1 Structural Model
SRK (2013) made recommendations to improve the data collection for structures such as joints and shears be improved, and that a comparison be made between the geotechnical data collected from logging of drill cores, with the data collected in the pen pit. The calibration and validation of the available data with exposures in the open pit will help gain a full understanding of the individual rock masses and the corresponding rock mass behaviour. This recommendation was adopted at Karowe and a report on joint sets identified within the basalt was prepared (Boteti Mining, 2013; Figure 16-4).
Figure 16-4 Stereonet of jointsets derived from weathered basalt joint data (source: Boteti Mining, 2013)
NI 43-101 Technical Report on the Karowe Mine (Amended) – February 4 2014 Page: 111
16.2.2 Rock Mass Model
The rock mass strength database comprises information collected by De Beers and SRK Consulting during the initial Feasibility Study (MSA, 2010). These data informed the initial pit slope angle design and remain the basis for ongoing planning.
16.2.3 Hydrogeological Model
Water is a precious resource in Botswana, and great effort has been put into establishing the mine’s water requirement, the availability of water in the local aquifer and the impact the mine will have on the aquifer, and ensuring efficient use of water on the project. The water supply and dewatering strategy for the Karowe Mine remains unchanged from that described in the previous technical report (MSA, 2010).
Sixteen pumping wells are in operation at Karowe currently extracting groundwater from the sandstone units, with the two observation wells in place reporting a drawdown of 50 m. Current focus is on water supply to the plant, with a secondary focus on pit slope dewatering. As the pit is deepened and the sandstones become exposed in the pit, more attention will be required on the slope dewatering with the prime requirement of the time element needed to effect drawdown.
The planned pit depth is 324 m below ground level (mbgl) but the rest water level is 50mbgl; therefore the open pit has a dewatering design. The neighbouring Debswana mines have successfully dewatered to 390mgbl using pit perimeter boreholes therefore the sump and pit-perimeter pumping method is considered by the QP to be appropriate for Karowe.
16.2.4 Pit Limit Blasting and Pit Slope Monitoring
For the required design intents to be achieved, good pit limit blasting is a pre-requisite for the successful implementation of steep slope angles. Figure 16-5 shows the pit limit walls on the western margin of the pit and it can be seen that existing slopes in the basalts at Karowe are performing exceptionally well, with good clean faces being achieved. The mining team is carefully cleaning final faces in the basalt by scaling and barring down operations while the mining equipment is in place. This practice is ensuring that the pit walls are stable.
Pit slope monitoring is required to confirm the design model and provide a basis for assessing and modifying slope designs in order to ensure that the slope design criteria are being achieved in terms of the operating performance. Currently, the primary tools at Karowe for slope monitoring are visual inspections for developing cracks, which, when observed should be recorded on the mine hazard plan, complemented by a robotic Trimble System.
This system involves a base station with reflective prism’s installed as pipe beacons on the open pit benches. Frequency of observations can be controlled with the system generating longitudinal and vertical displacements from which vector plans, both horizontal and vertical can be generated, indicating the patterns and rate of displacement of the rock mass as the pit slopes are mined. With these systems in place, displacement trends can be identified before the development of cracks on the pit walls and remedial actions timeously implemented.
NI 43-101 Technical Report on the Karowe Mine (Amended) – February 4 2014 Page: 112

Figure 16-5 Condition of the pit limit walls on the western margin of the pit (source: SRK, 2013)
Some crest damage is apparent above the lower ramp in the right hand photograph. However, in general the pit limits are performing well.
The mine has a pit evacuation procedure in the event that imminent geotechnical failures are identified.
16.3 Life of Mine and Production Rates
The effectiveness of the depletion schedule has been assessed using a volumetric measure; i.e. total tonnes of ore and waste mined over a particular period versus budget. The volumetric measure for the mine’s production to date appears to be very well managed as shown in Figure 16-5. To the end of September 2013, a total of 4.7 Mt of ore had been mined (10.5% below budget), and 9.3 Mt of waste had been mined (2.7% above budget).
Mining to date has focussed mainly on the North Lobe which is the smallest portion of the pipe and which has become very confined. In 2013 mining has shifted to the Central and Southern Lobes where bench access and operating width are much easier.
A section of the current pit is shown in Figure 16-7.
NI 43-101 Technical Report on the Karowe Mine (Amended) – February 4 2014 Page: 113

Figure 16-6 Section of the final pit showing the slope angles relative to rock types
In the QP’s opinion, the mine is doing well in waste tonnes mined but the ore tonnes are 10% under budget. This is not unusual for a new open pit. The ratio of ore tonnes down while waste tonnes up, for a small pit of this nature is healthy from a practical point of view as it demonstrates that the pit has been effectively stripped and should have adequate working space.
The life of mine stripping ratio is 2.46:1 waste/ore to the planned closure in 2027.
NI 43-101 Technical Report on the Karowe Mine (Amended) – February 4 2014 Page: 114
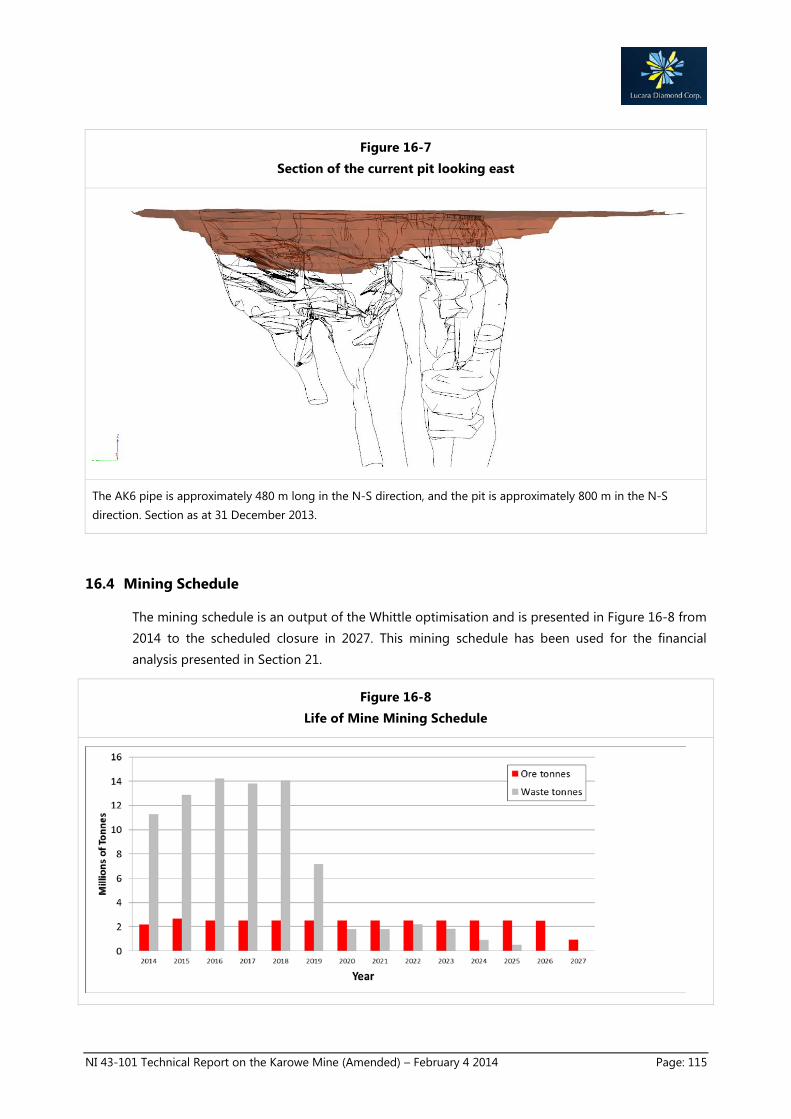
Figure 16-7 Section of the current pit looking east
The AK6 pipe is approximately 480 m long in the N-S direction, and the pit is approximately 800 m in the N-S direction. Section as at 31 December 2013.
16.4 Mining Schedule
The mining schedule is an output of the Whittle optimisation and is presented in Figure 16-8 from 2014 to the scheduled closure in 2027. This mining schedule has been used for the financial analysis presented in Section 21.
Figure 16-8 Life of Mine Mining Schedule
NI 43-101 Technical Report on the Karowe Mine (Amended) – February 4 2014 Page: 115

16.5 Mining Fleet
The mining fleet is owned and operated by Kalcon (Pty) Ltd. and is presented in Table 16-2
Table 16-2 Mining Fleet
PLANT NO. MACHINE TYPE
D038 CAT D7R DOZER
DO47 CAT D7R DOZER
DO61 CAT D9R DOZER
E108 CAT 345C EXCAVATOR
E164 CAT 390 EXCAVATOR
E171 CAT 374D EXCAVATOR
GO84 Cat 140H Motor Grader
J467 CAT 730 ADT
J471 CAT 730 ADT
J472 CAT 740B ADT
J473 CAT 740B ADT
J474 CAT 740B ADT
J475 CAT 740B ADT
J476 CAT 740B ADT
J488 CAT 740B ADT
J490 CAT 740B ADT
J493 CAT 740B ADT
J499 CAT 740B ADT
J500 CAT 740B ADT
J501 CAT 740B ADT
J502 CAT 740B ADT
J503 CAT 740B ADT
J504 CAT 740B ADT
J505 CAT 740B ADT
J506 CAT 740B ADT
J507 CAT 740B ADT
J508 CAT 740B ADT
BAR J04 CAT 730 ADT
K478 AXOR 2628 10000L D/BOWSER
LO51 CAT 966 LOADER
L052 CAT 966 LOADER
W086 Cat 725 ADT 23000L Water Cart
W102 Cat 725 ADT 23000L Water Cart
W106 Cat 725 ADT 23000L Water Cart
NI 43-101 Technical Report on the Karowe Mine (Amended) – February 4 2014 Page: 116

16.6 Explosives
Packaged explosives (EXPLOGEL range of product) are used for pre-splitting, but sometimes are used with ANFEX as a booster charge where minimal amounts of water are encountered in blastholes.
Production blasting uses ANFEX (dry holes) for both ore and waste, while Emulsion (referred to as Matrix) is used in wet holes for both ore and waste (mainly during the rainy season). These types of explosives are used in their pure form, not as BLENDS.
Blast initiation is done using non-electronic products.
NI 43-101 Technical Report on the Karowe Mine (Amended) – February 4 2014 Page: 117

17 RECOVERY METHODS
The upper 70 m of the AK6 kimberlite is significantly weathered, and most of this material has already been processed through the existing plant. It is anticipated that the fresher ore, particularly some of the ore from the South Lobe, is significantly harder than the weathered ore that has been already processed.
In addition, the more competent un-weathered ore has a higher density that will result in a higher DMS yield to the recovery plant. The current yield is in the order of 2% and indications are that it could reach values of up to 28% when processing a portion of the M/PK(S) geological unit from the South Lobe. A change to the circuit is therefore required in order to cater for the anticipated increase in the DMS yield.
The current flowsheet consists of primary crushed ROM being processed through a single autogenous grinding (“AG”) mill, with the +35 mm mill product crushed in a single pebble crusher and recirculated back to the mill. The +1.5, –35 mm mill product is processed through a DMS with the DMS sinks reporting to an X-ray recovery circuit consisting of a single pass coarse X-ray circuit and double pass fines and middles X-ray circuits. The -1.5 mm material is pumped to a degrit circuit where the grits report with the DMS tailings to the tailings dump and the slimes are pumped to a thickener and then to a tailings storage facility.
The current operation has recovered a higher than expected number of large diamonds and therefore the plant modifications include a large diamond recovery to recover large stones before they report to the pebble crusher circuit.
17.1 Planned Plant Upgrade and Modifications
The modifications to the current Karowe process plant are driven by the following factors:
• More competent ore body with depth
• The increase in the DMS yield to the Recovery Plant
• Opportunity for increasing the recovery of large diamonds
The increase in the ore body hardness has required several modifications to the comminution circuit so that the process plant can maintain a throughput of 350 tph. The comminution circuit upgrade consists of:
• a new secondary gyratory crusher
• a bleed circuit ahead of the AG mill
• new AG mill discharge grates
• the installation of turbo pulp lifters in the AG mill
• the inclusion of a bleed screen post the pebble crusher
All the above modifications allow for flexibility around the AG mill so that the load on the mill can be alleviated to varying degrees depending on the hardness of the ore.
NI 43-101 Technical Report on the Karowe Mine (Amended) – February 4 2014 Page: 118

The anticipated increase in DMS yield requires significant modifications to the flowsheet. With the expected increase in the hardness of the ore, the current DMS capacity is not sufficient and another concentration step is required. Several concentration processes were investigated to treat the +8,-32 mm comminution product and X-ray Transmissive technology has been selected for a number of reasons including the fact that it is not affected by variation in solids density.
The existing DMS will process the +1.5, –8 mm size fraction and because of the anticipated increase in the DMS yields, the recovery plant will be expanded to include a mass reduction step (magnetic rolls) and a new X-ray circuit, which is identical to the existing one.
A large diamond recovery circuit has also been included in the design to cater for the known occurrence of large diamonds in the ore body and to recover these before they are processed through the pebble crusher. The large diamond recovery circuit will treat the +32, –60 mm mill product before it reports to the pebble crusher. This will address the risk of an increase in diamond breakage with the increased number of crushers.
17.2 Process Description
The current flowsheet and proposed flowsheet changes are illustrated in Figure 1-1.
Figure 17-1 Current process and planned changes (source: DRA Group)
Current process in black and proposed changes in green
NI 43-101 Technical Report on the Karowe Mine (Amended) – February 4 2014 Page: 119

17.2.1 Primary Crusher
The current primary crusher configuration remains unchanged with ROM introduced into the tip bin and withdrawn via a belt feeder onto a vibrating grizzly feeder (“VGF”) sizing at 125 mm. The oversize is crushed in a jaw crusher and the VGF undersize and crusher product report to a sacrificial conveyor.
17.2.2 Secondary Crusher Crusher
Due to the increase in hardness of the material with depth, a secondary gyratory crusher will be installed ahead of the AG mill. The circuit consists of a bleed chute ahead of a scalping screen. The bleed chute allows for large material to bypass the secondary gyratory crusher, as some large material is still required in the circuit to allow for optimal milling. The more competent the ore, the less ore will be bled out of the secondary crushing circuit. The material will be sized ahead of the gyratory crusher at a nominal cut size of 60 mm, with the -60 mm material bypassing the crusher and the +60 mm reporting to the gyratory crusher. The crusher bypass and product will report to the existing AG mill feed stockpile.
17.2.3 AG Mill
The AG mill circuit remains largely unchanged. Material is withdrawn from the stockpile and conveyed to the AG mill. The AG mill product is sized at nominally 60 mm and 1.25 mm, with the +60 mm material reporting to the pebble crusher circuit, the +1.25, –60 mm reporting to the bulk sorter / DMS sizing screen and the -1.25 mm is pumped to the existing degrit / thickener circuit.
Changes to the existing AG mill circuit include the installation of turbo pulp lifters as well as discharge grates with larger openings. These are being fitted to accelerate the throughput through the AG mill.
17.2.4 Pebble Crusher
The oversize from the AG mill screen will be conveyed to the existing pebble crusher circuit. The circuit will remain unchanged except that the crusher gap will be closed down to 25 mm. The crusher product will be conveyed to a new bleed screen where the material will be sized at a nominal cut size of 32 mm. The oversize will report directly to the mill feed conveyor, thereby maintaining a real time feed particle size distribution to the mill. A proportion of the screen undersize can either be recycled through the AG mill or bled out of the comminution circuit. The more competent the ore feed, the more material will be bled out the circuit to alleviate the load on the comminution circuit.
17.2.5 Bulk Sorter Circuit
The +1.5, –60 mm mill product will be sized into four size fractions, namely: +1.5, –8 mm, +8, –14 mm, +14, –32 mm and +32, –60 mm. The +1.5, –8 mm material will report to the existing DMS,
NI 43-101 Technical Report on the Karowe Mine (Amended) – February 4 2014 Page: 120

while the other size fractions will report to a new Large Diamond Recovery (“LDR”) bulk sorter circuit consisting of high capacity X-ray Transmissive (“XRT”) sorting machines.
The concentrate from the XRT circuits will be hand sorted and then transferred to the existing sort house. The tailings from the LDR (+32, –60 mm) will be conveyed back to the pebble crusher circuit. The tailings from the middles bulk sorter circuit (+14, –32 mm) will be screened at a nominal cut size of 20mm and conveyed to a tertiary crusher and the -20mm screen product and the fines bulk sorter (+8, –14 mm) tailings will conveyed to the existing tailings conveyor.
17.2.6 Tertiary Crusher
A new tertiary crusher will be installed to liberate diamonds in the +20, –32 mm bulk sorter tailings. Material will be conveyed to a surge bin ahead of the crusher. Material will be withdrawn from the bin at a controlled rate via a pan feeder. The crusher will be water flushed and operate at a closed side setting of 12 mm. The crusher product will report to a dewatering screen and the screen oversize will be conveyed to either the the LDR or DMS sizing screens.
17.2.7 Fines DMS
The +1.5, –8 mm size fraction will be processed through the existing DMS plant. The DMS plant will remain unchanged, with the floats reporting to the existing tailings conveyor and the sinks reporting to the recovery circuit.
17.2.8 Recovery
The recovery plant is being been expanded to handle the increased DMS yields from harder and higher density fresh kimberlite, as well as ilmenite-rich geological units known in the South Lobe. The expansion includes a stage of bulk reduction using scalping and rare earth magnetic rolls. The non-magnetic fines will report to the existing recovery X-ray circuit and the non-magnetic middles fraction will report to a new X-ray circuit identical to the existing one. The recovery tailings will continue to report to a separate tailings stockpile and the concentrate to the existing sort house.
17.2.9 Water Circuit
The water circuit will remain largely unchanged except for the addition of an additional process water pump and degrit cyclone.
17.3 QPs Comments
The planned modifications to the plant are still in the process of being finalised. The process design criteria (“PDC”) is currently a “high-level” document and not yet complete. Despite this, the QP has considered the current flowsheet, and the modifications described above, and finds that the circuit proposed will address the stated requirements, i.e. address the increased hardness of ore, increased DMS yield and value protection of large diamonds. The following comments are made by the QP:
NI 43-101 Technical Report on the Karowe Mine (Amended) – February 4 2014 Page: 121

• Crushers historically have a very low availability and figures as low as 55% have been
quoted on some operations. There is a fall back contingency to introduce a second pebble crusher into the circuit if operational availability of a single crusher is problematic.
• It is possible that the AG mill comminution efficiency will not be as predicted on very hard material. This variability in ore hardness may result in a variation in mill efficiency and throughput. This risk has been mitigated by a number of approaches. Turbo Pulp Lifters are being commissioned to improve mill throughput. In addition, there is a bleed screen to a secondary crusher which allows material to be re-crushed before re-entering the mill in cases of exceptionally hard ore.
• The amount of fines generated from the harder ore may result in more (rather than less) fines reporting to tailings with a concommittent increase in water loss as a result of higher evaporative losses on the tailing storage facility. This is considered unlikely based on extensive testwork. However, there is adequate water availability, and the fine tailings capacity could be extended if required.
• The increased hardness of the ore feed increases the possibility of breaking large diamonds, with a consequent impact on revenue. The introduction of the Large Diamond Recovery plant is expected to mitigate this risk. XRT sorters have not been installed on an operating diamond mine before, but have been used extensively in the re-cycling industry. Conventional X-ray machines operate successfully on diamond mines, so it is expected that XRT machines will operate equally successfully. The XRT circuit has also been designed with a conservative approach with resect to throughput, allowing for operational downtime for maintenance.
• There may be disruption to normal production during construction, integration and commissioning of the plant upgrades. There is detailed planning in progress to manage the integration of the plant upgrades.
NI 43-101 Technical Report on the Karowe Mine (Amended) – February 4 2014 Page: 122

18 PROJECT INFRASTRUCTURE
18.1 Road and Air Access
The property is accessed by 15 km of well-maintained all weather gravel and sand road from the tarred Letlhakane to Orapa road.
International airlinks are available in Francistown and Gaborone. The mine also has its own private airstrip situated outside the ML, constructed of gravel. It is licenced for aircraft with a gross weight up to 5.7 t.
Haul roads are well demarcated and maintained.
18.2 Infrastructure
The mine infrastructure includes the plant, administrative offices, mine vehicle workshops, slimes dam, and various stockpile and waste dumps. Employees live in Letlhakane.
18.3 Water Management
The hydrogeology of the project has been very thoroughly investigated in preparation for mining to ensure optimal use of a precious resource in a semi-arid environment. The local aquifer is associated with Karoo sandstones overlain by basalt in the country rocks surrounding the kimberlite, and has successfully supplied the nearby Debswana Diamond Company (Pty) Ltd. (“Debswana”) mines at Orapa, Letlhakane and Damtshaa (total water demand of 12 m3/yr) for over 40 years. The water table is shallow (50 m), so the open pit will need to be dewatered to maintain dry pit slope conditions.
Water for the mine is provided by 16 wells situated around the periphery of the mine. These wells are part of a carefully planned and managed dewatering strategy which is aligned to environmental and geotechnical requirements of the mine (see Section 16.2.3).
18.4 Tailings Disposal
Karowe Diamond Mine generates DMS coarse tailings which are disposed of on a dry dump by conveyor, and fine tailings (slimes), which are disposed of onto 2nd Generation impoundment dams built and contained with mine overburden material. This section of the report comments upon the fine tailings disposal.
The information reviewed consisted of:
• “Scope and Technical Specification of Slimes Dam Second Lift” – Minopex Botswana document
• “Slimes dam action plan” – Boteti
• Typical wall cross-section – drawing DRA/Holley Associates
• A spreadsheet of 2013 monthly slimes tonnages and densities
• A schematic Mine layout
NI 43-101 Technical Report on the Karowe Mine (Amended) – February 4 2014 Page: 123

The available information indicates that the original design conceived a rectangular 2nd Generation slimes disposal facility measuring some 800 m by 800 m, divided into four quadrants or paddocks by orthogonal division walls. Three of the four paddocks have been constructed. A small return water pond is located in the 4th quadrant and deposition commenced in May 2012. Paddocks 2 and 3 have been filled. Paddock 4 is currently being utilized and will reportedly be full by the end of March 2014. Construction of paddock 1 walls and re-locating the return water sump, will have to be completed before then. Tenders from civil contractors are reported to be closing on the 22nd January so the process is underway. Paddock 1 will provide further capacity until the end of September 2014.
The deposition of slimes follows a conventional approach for such an application of widely spaced spigots or deposition pipes off a slurry ring main, lying on the top of the impoundment walls. This allows even filling of the paddock and control of the supernatant pond position.
Figure 18-1 Topsoil and Tailings Facilities on the Karowe Mine
NI 43-101 Technical Report on the Karowe Mine (Amended) – February 4 2014 Page: 124

Decanting of available supernatant water has so far been through gravity penstocks into the temporary return water dam from where pumps mounted on floating barges re-cycle the water to the process plant. The penstocks are to be replaced with floating barge mounted pumps delivering directly back to the process plant, thus obviating the need for a return water sump. The implication of this is that substantially more water will have to be carried on the paddocks to minimize decanting dirty water. The suctions on the barge pumps also need to draw from within a submerged sump, only skimming water off the surface. The risk of overtopping increases as each paddock nears capacity. A pumping system cannot cope with a rainstorm; so emergency overflow pipes should be installed into the lowest paddock as a precaution.
The plan is to raise all the paddocks in two 10 m increments to 1,031 and 1,040 masl respectively to ultimately provide around 14.2 Mm3 and 18.5 Mt capacity. At a disposal rate of around 115,000 t/month, the slimes facility should theoretically provide a life of approximately 13 years, i.e to 2027. The walls are to be raised with compacted earth or waste rock embankments using the downstream method. The design provides for very conservative slopes on the embankments, which should result in a very secure facility if developed accordingly.
No information was provided on the raising of the division walls. These will need to be raised on their centerline, meaning that the batters will extend over the tailings. The implication hereof is that the division walls can only be raised once the adjacent paddock is full with dried consolidated tailings with sufficient shear strength to support the construction vehicles and material being placed. This dictates that there have to be four paddocks. When the last paddock is being filled, the division walls on the diagonally opposite paddock can be raised. When the newly raised paddock is being filled, then the other two division walls can be raised.
The disposal plan is a fairly low risk conventional and somewhat conservative approach to 2nd Generation tailings dam development. The primary risk arises in the implementation over the life of the operation, as the wall development needs to be done timeously and according to the current design. If the foregoing is adequately managed and the cost of developing the paddock walls is affordable, the mine should have secure slimes capacity to scheduled closure.
18.5 Power
Electricity is supplied to the mine by the national grid serviced by the Botswana Power Corporation (“BPC”) from a substation at Orapa. The power line has a maximum capacity of 10 kVA. The currently maximum power draw of the mine is approximately 6.0 to 6.5 kVA of this capacity. Power requirements from the plant expansion will increase the maximum power draw by approximately 2.1 kVA, or approximately 80% of capacity.
NI 43-101 Technical Report on the Karowe Mine (Amended) – February 4 2014 Page: 125

18.6 Fuel
The mining contractor is Kalcon (Pty) Ltd which has a fuel depot on the mine. The depot is serviced by Puma Energy Botswana (Pty) Ltd and the mining contractor supplies the mine. The wholesale price of diesel is currently BWP 9.28/litre or approximately USD 1.05/litre.
18.7 Telecommunications
There is a land line telecommunication link to the mine from Letlhakane serviced by the Botswana Telecommunications Corporation (BTC). In addition, there is cellular network currently operated by Orange Botswana.
18.8 Comments on infrastructure
In the opinion of the QP, the existing mining infrastructure (upgraded as per the plans outlined in Section 17) is suitable to support the Mineral Reserve mine plan to 2027.
NI 43-101 Technical Report on the Karowe Mine (Amended) – February 4 2014 Page: 126

19 MARKET STUDIES AND CONTRACTS
In terms of the conditions of ML2008/6L, Boteti will hold open tenders for sale of diamonds in Botswana. In addition to this, Boteti has permission to sell diamonds by open tender internationally, and has the obligation to invite Botswana-based buyers to all tenders regardless of where they are held. The original permit to tender diamonds internationally expired at the end of 2013, but has been extended to the end of 2014. Boteti is currently upgrading the sales office in Gaborone which is expected to be fully operational by mid-2014.
The Boteti Diamond Valuator (“BDV”) and Government Diamond Valuator (“GDV”) each value and agree on a parcel value prior to all sales. The costs of the GDV are for the account of the Government. The agreed value price establishes a reserve price.
Royalty payments are calculated on the actual sales price for open tenders, and on the price agreed by the GDV and BDV for sales from non-open tenders.
19.1 Sales of Exceptional Stones
Karowe Mine produces a relatively large number of exceptionally large and valuable stones (often Type IIa stones of greater than 10.8 ct or fancy coloured stones such as blue or pink diamonds), and these stones tend to occupy a specific niche in the overall diamond market. Boteti has therefore implemented a series of separate tenders to sell these stones. Three ‘Exceptional Stone Tenders’ have been completed to date (see Table 14-17).
The occurrence of large high value stones adds to the robust economic viability of the Karowe Mine, since high value stone tend to be less negatively affected by downturns in the diamond market relative to smaller stones.
19.2 Diamond Sales in 2013
Total carats sold in 2013 were 438,717 ct and total sales revenue during the year was USD 180.5 million. This figure includes a total if USD 91 million from the sale of stones of >10.8 ct (54% of revenue).
Within these figures, 23 diamonds have sold for over USD 1 million each.
19.3 Outlook for Rough Diamond Prices
A number of price projections are available for the short-medium term on diamond prices. Amongst the most thoroughly researched are the reports published by Bain and Company in 2011; The Global Diamond Industry – Lifting the Veil; and in 2012, The Global Diamond Industry – A Portrait of Growth. These reports document the rapid growth of the diamond market in developing countries, most notably China and India, and the much slower growth in production from existing and new mines, and project that over the next few years to 2020, demand will outstrip supply. The logical conclusion from this is that rough diamond prices are likely to rise.
NI 43-101 Technical Report on the Karowe Mine (Amended) – February 4 2014 Page: 127

Figure 19-1
Outlook for Rough Diamond Demand v Supply (source: Bain, 2012)
CAGR – Compound Annual Growth rate
Bain (2012) identifies five potential factors that could disrupt the forecast presented in Figure 19-1. These factors are:
• Another recession like that which occurred in 2007-2008 would have a profound effect on the diamond market, which relies largely on discretionary spending on luxury items. Most economists regard this as unlikely.
• The development of an investment market for diamonds. This could lead to a possible increase in demand, which in turn could drive prices higher and create an even stronger outlook for producers. The most promising potential markets for diamonds as an investment would likely be developing markets such as China, India and Russia. Consumers in these markets consider high inflation a real possibility and are seeking a hedge against it.
• An increase in the acceptance of manufactured (‘synthetic’) gem-quality diamonds could negatively affect the market for natural stones. For consumers to embrace manufactured diamonds on a large scale, the price of high-quality manufactured stones would have to fall, which is only likely to happen if a technical breakthrough in manufacturing leads to a rapid increase to large-scale production. No such breakthrough is currently thought to be imminent. Compounding the unlikelihood of this risk is consumers’ general aversion to manufactured stones, and their apparent willingness to pay a premium for natural stones.
• In the past, generic marketing of diamonds (chiefly by De Beers) contributed greatly to the development of all the major diamond markets. While generic marketing has been replaced by branded advertising, many in the industry worry that it won’t be enough and lead to slower growth, especially in developing markets such as India and China. While
NI 43-101 Technical Report on the Karowe Mine (Amended) – February 4 2014 Page: 128
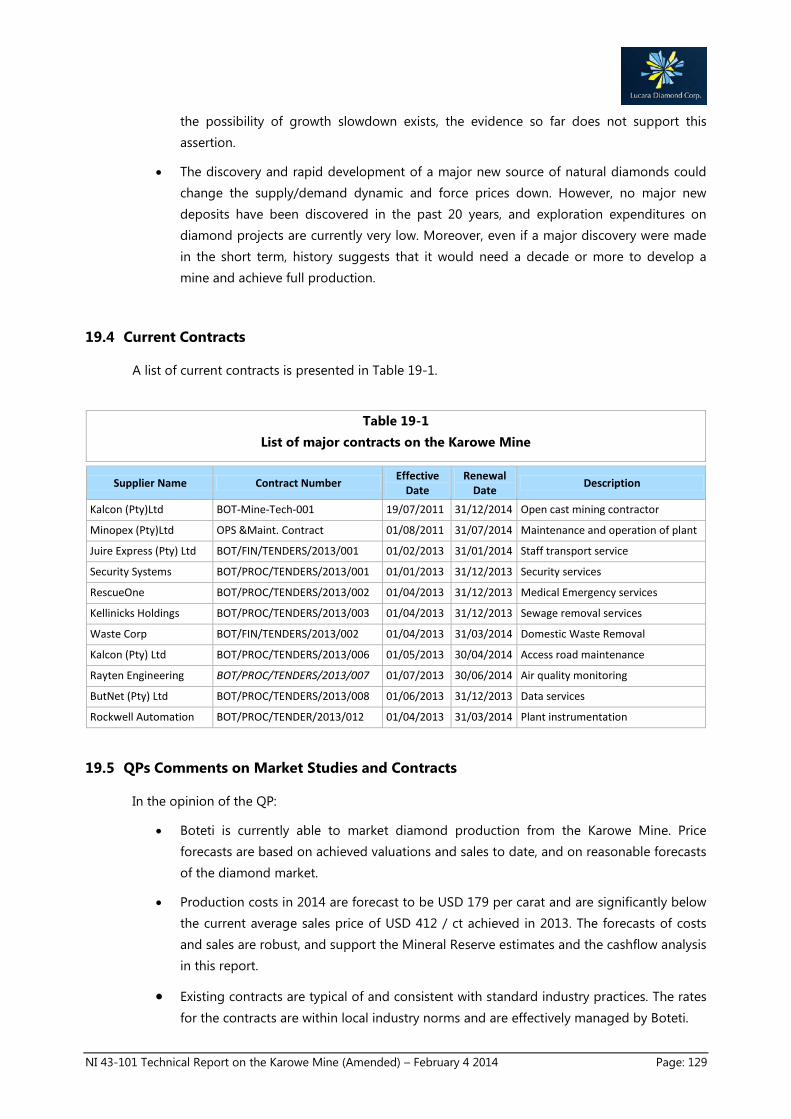
the possibility of growth slowdown exists, the evidence so far does not support this assertion.
• The discovery and rapid development of a major new source of natural diamonds could change the supply/demand dynamic and force prices down. However, no major new deposits have been discovered in the past 20 years, and exploration expenditures on diamond projects are currently very low. Moreover, even if a major discovery were made in the short term, history suggests that it would need a decade or more to develop a mine and achieve full production.
19.4 Current Contracts
A list of current contracts is presented in Table 19-1.
Table 19-1 List of major contracts on the Karowe Mine
Supplier Name Contract Number Effective Date
Renewal Date Description
Kalcon (Pty)Ltd BOT-Mine-Tech-001 19/07/2011 31/12/2014 Open cast mining contractor
Minopex (Pty)Ltd OPS &Maint. Contract 01/08/2011 31/07/2014 Maintenance and operation of plant
Juire Express (Pty) Ltd BOT/FIN/TENDERS/2013/001 01/02/2013 31/01/2014 Staff transport service
Security Systems BOT/PROC/TENDERS/2013/001 01/01/2013 31/12/2013 Security services
RescueOne BOT/PROC/TENDERS/2013/002 01/04/2013 31/12/2013 Medical Emergency services
Kellinicks Holdings BOT/PROC/TENDERS/2013/003 01/04/2013 31/12/2013 Sewage removal services
Waste Corp BOT/FIN/TENDERS/2013/002 01/04/2013 31/03/2014 Domestic Waste Removal
Kalcon (Pty) Ltd BOT/PROC/TENDERS/2013/006 01/05/2013 30/04/2014 Access road maintenance
Rayten Engineering BOT/PROC/TENDERS/2013/007 01/07/2013 30/06/2014 Air quality monitoring
ButNet (Pty) Ltd BOT/PROC/TENDERS/2013/008 01/06/2013 31/12/2013 Data services
Rockwell Automation BOT/PROC/TENDER/2013/012 01/04/2013 31/03/2014 Plant instrumentation
19.5 QPs Comments on Market Studies and Contracts
In the opinion of the QP:
• Boteti is currently able to market diamond production from the Karowe Mine. Price forecasts are based on achieved valuations and sales to date, and on reasonable forecasts of the diamond market.
• Production costs in 2014 are forecast to be USD 179 per carat and are significantly below the current average sales price of USD 412 / ct achieved in 2013. The forecasts of costs and sales are robust, and support the Mineral Reserve estimates and the cashflow analysis in this report.
• Existing contracts are typical of and consistent with standard industry practices. The rates for the contracts are within local industry norms and are effectively managed by Boteti.
NI 43-101 Technical Report on the Karowe Mine (Amended) – February 4 2014 Page: 129

20 ENVIRONMENTAL STUDIES, PERMITING AND COMMUNITY IMPACT
Several key legislations and regulations are pertinent to Boteti’s Karowe Diamond Mine (KDM) operation. These are listed and summarised in Table 4-2. In addition to these, the mine will require a permit for a waste disposal site which is currently being constructed on the mine. An Environmental Management Plan (“EMP”) for the waste site has been approved by the Department of Environmental Affairs. Once the facility is completed, a permit from the Department of Waste Management and Pollution Control will need to be obtained. Clarity is also required on the trans-boundary movement of hazardous waste which is disposed of in South Africa.
A mining license has been issued in favour of Boteti Exploration (Pty) Ltd No. 2008/6L. Two subsequent mining license amendments were granted by the Ministry of Minerals, Energy and Water Resources on the 18th June 2010 and the 6th September 2010 respectively.
Water permits/licenses have been applied for and approved.
20.1 Environmental studies completed to date
Two pre-mining environmental studies were conducted for the Karowe Mine (previously known as the AK6 project), namely an Environmental Impact Assessment (“EIA”) Study for AK6 (Geoflux, 2007) and EMP for the AK6 Diamond Mine (SiVEST, 2010). The Department of Environmental Affairs approved both studies in 2008 and 2010, respectively. The mine was commissioned in October 2011.
The EIA compiled by Geoflux was granted approval by the Department of Environmental Affairs, Botswana on 6th February 2008, with three conditions attached:
• The mitigation measures and impact management/monitoring recommendations that are outlined in the EMP are implemented in totality
• All electrical equipment or appliances are PCB-free and proof to that effect should be available during monitoring and auditing of the project (PCB or Polychlorinated Biphenyls are chemicals which have been identified as posing a risk to the development of children’s nervous and immune systems and to hamper brain development. They were subsequently banned in a number of countries)
• Planning permission is granted by the relevant authorities
In the QP’s opinion, and based on observations during a site visit (17th December 2013), Boteti has met these conditions.
In accordance with the Tribal Land Act (2004), surface rights are required for the mine to go ahead. As outlined in the most recent Feasibility Study (May 2010), the surface area of the Mining License lies within communal agricultural land administered by the Letlhakane Sub-Land Board, which falls under the Ngwato Land Board, Serowe. This area is currently used for grazing
NI 43-101 Technical Report on the Karowe Mine (Amended) – February 4 2014 Page: 130

livestock and limited arable farming. Boteti has obtained common law land rights for the Mining License area and the access road. These rights will remain in force for the life of mine (LOM) (EBS, 2012).
The Archaeological Impact Assessment was approved and an Archaeological Clearance Certificate issued which are both are included in Appendix 5.1B of the EIA (EBS, 2012).
Subsequent to the EIAs/EMPs and related approvals, the new Environmental Assessment Act (EA, 2011) and EIA Regulations (2012) were enacted.
Boteti Mining Pty Ltd commissioned Geoflux (Pty) Ltd to conduct an EMP for the Karowe Mine in 2013. The latest EMP study aligns and revises the aforementioned studies to comply with the requirements of the EA Act.
An environmental compliance audit was conducted in October 2013 with the final report expected to be submitted to the mine in January 2014.
An Environmental and social due diligence was conducted in October 2012. The findings which could materially impact on the operations ability include:
• The mine water balance needs to be calibrated according to actual process data;
• The groundwater model requires updating;
• Ad hoc dumping of coarse slimes in an unstructured and unplanned fashion;
In the QP’s opinion, there are no known environmental issues that could materially impact the Karowe Mine’s ability to extract the Mineral Reserves.
20.2 Environmental Management
The following description of the slimes dam, tailings dam and waste rock dump is taken from the current EMP (Geoflux, 2013).
20.2.1 Slimes dam
The slimes dam is located south of the open pit. The square shaped slimes dam is split into four equal sized compartments with a total footprint of approximately 146 ha. The compartments are operated on a rotational basis (approximately three continuous months per annum for each). The intention is to reduce the size of the wet beach and therefore to minimise evaporation and seepage losses. The water storage dams accommodate decant water from the slimes dam in order to minimise storage on the top surface of the slimes dam, to limit the discharge of contaminated water to the environment, and eventually to return the maximum amount of water to the plant.
20.2.2 Processed kimberlite dump or tailings dam
The processed kimberlite dump is located east of the slimes dam (Figure 18-1). The rectangular shaped processed kimberlite dump is split into four strips (portions A to D) of equal length with a total footprint of approximately 51 ha. A conveyor with a spreader places the tailings material from the final dump elevation (1,045 mamsl) at angle of repose. Dump construction will
NI 43-101 Technical Report on the Karowe Mine (Amended) – February 4 2014 Page: 131

commence on the strip adjacent to the mining lease boundary. Dump development will then continue in a sequence from east to west. The maximum vertical height of the processed kimberlite dump will be 30 m. At the conclusion of mining, the final dump will have a slope of 1:3 and be covered with topsoil and vegetated, as part of the final closure plan.
20.2.3 Waste rock dump
The waste rock dump is located west of the slimes dam. The square shaped waste rock dump accommodates excess waste rock (not used for slimes dam impoundment embankment construction). The footprint of the waste rock dump is approximately 100 ha.The waste rock is placed mechanically using the mining fleet. The side slopes will be constructed to a gradient of 1:3 and the maximum vertical height of the waste rock dump will be 25 m.
A water balance is available and continually updated. The site has been designed to manage storm water and measures are also in place to maximize water recovery.
Environmental monitoring includes ongoing surface and groundwater quality monitoring and dust fallout monitoring. The monitoring program is stipulated in the current EMP. Water quality reports are produced annually, while the dust fallout reports are generated monthly. A plan for closure phase monitoring needs to be compiled and to form part of the mine’s existing Environmental Management System.
The mine’s environmental department is headed by the Safety, Health and Environment (SHE) Manager, Mr. Herbert Kebafetotse with the assistance of an environmental officer. Karowe makes use of the risk management software IsoMetrix to manage their SHE risks.
20.3 Social and Community
There are currently no social or community commitments to which Karowe Mine needs to deliver.
Community meetings are held on a quarterly basis. These meetings serve to brief the community on mine developments and to hear of their concerns.
A neighboring farmer who was resettled when the mine was constructed, had an issue with reduced ground water availability and declining quality. The mine has subsequently provided suitable alternate land and suitable water.
There are no other community issues that were raised or that have been identified.
20.4 Mine Closure
The mine closure and rehabilitation plan is a requirement under Section 65 of the Botswana Mines and Minerals Act (1999), under which Boteti Mining (Pty) Ltd is obliged, as part of the Environmental Obligations (sub-sections 3 and 4), to ensure that the concession area is progressively rehabilitated and ultimately reclaimed at the end of life of mine to the Director of Mines satisfaction. Further in terms of the Karowe Mine EMP (approved in terms of the EA Act),
NI 43-101 Technical Report on the Karowe Mine (Amended) – February 4 2014 Page: 132

Boteti Mining has committed to develop and implement a mine closure plan during the Life of Mine and post cessation of operations.
The initial conceptual mine closure plan for Karowe was incorporated into the pre-mining EIA (approved 2008) and the EMP submitted and approved in 2010 following Lucara’s takeover of the then AK6 Diamond Mine project. The conceptual plan at these stages did not include cost estimates for both unscheduled and scheduled closure. A high level cost estimate was made in June 2011 during the Karowe Mine construction phase and the amounts obtained for both unscheduled and scheduled closure were BWP 41.3 million and BWP 123.6 million respectively (approximately USD 4.67 million and USD 13,89 million respectively).
In August 2013, Boteti Mining commissioned Geoflux and Redco/E Tek to undertake the development of the closure and rehabilitation plan, with the intent to improve the closure cost estimation and following Botswana mining law requirements as well as industry best practice.
The closure cost estimate was developed mainly for two scenarios, viz. unscheduled (premature) closure (that is the liability at this stage) and the scheduled closure liability at the end of Life of Mine (Table 20-1). A third scenario, i.e. closure cost at LOM without any concurrent rehabilitation during operations, was developed to give an indication of the final liability that may be encountered if the rehabilitation plan is not implemented as planned. The scheduled closure liability assessment takes into consideration concurrent rehabilitation actions.
Table 20-1 Estimated cost of mine closure scenarios
Closure Scenario Cost (Botswana Pula) Approximate Equivalent USD amount1
Unscheduled Closure BWP 80.6M USD 9.1M
Scheduled Closure with Concurrent Rehabilitation BWP 112.2M USD 12.7M
Scheduled Closure without Concurrent Rehabilitation BWP 183.8M USD 20.8M 1 The exchange rate on 14th January 2014 was USD 1 = BWP 8.8261
20.4.1 Management Actions
The following actions were recommended during the last environmental audit of the mine to ensure relevance of the mine closure plan: • Establishment of a suitable instrument for closure/rehabilitation funding
• Update and maintain a database of all mine infrastructure facilities. These include quantities, salvage costs, demolition costs, rehabilitation costs, and possible alternate end uses for each facility
• Development of site specific detailed rehabilitation design and actions and their integration into operational plan to accommodate concurrent rehabilitation
NI 43-101 Technical Report on the Karowe Mine (Amended) – February 4 2014 Page: 133

• Discussion and agreement on closure criteria and end land use with the authorities and
stakeholders including neighbouring communities
• Determine potential social impacts and benefits associated with the environmental quality and potential future land use alternatives of the site, including consideration of possible uses of site infrastructure. This should culminate in the development of Social Closure Plan and integration of social requirements into the overall mine closure and rehabilitation plan
• Develop a comprehensive environmental and social risk assessment (“ESRA”) by identifying, evaluating and mitigating all potential risks. The ESRA should be based on standard 5x5 matrix, which considers Risk Consequence in terms of Health and Safety, Environment, Financial, Legal and Regulatory and Reputation/Social/Community aspects. The Probability of these risk occurring are determined based on a scale of 1 to 5, where the highest value representing almost certain
• Carry out rehabilitation trials to determine the best technique for rehabilitation of the slimes dams, tailing dump and waste rock dumps
• Conduct annual review of the closure and rehabilitation costs. This exercise should document and evaluate expenditure on concurrent rehabilitation activities
• Develop Closure and Rehabilitation programme with identified sequence and schedule of closure activities
• Conduct a comprehensive review of the closure and rehabilitation plan every three years
• Draft a final closure and rehabilitation plan three years before cessation of mining operations
• Develop alternative deposition strategies for the residue facilities, as well as material handling strategies for the materials that will be beneficial during rehabilitation (topsoil, overburden) to support the proposed rehabilitation and closure actions. This may include for example the deposition of the waste rock dump in lifts with benches to reduce reshaping costs and with an alternative layout or geometry to reduce haul distances, side lengths to be reshaped etc.
• Plan, design and implement rehabilitation trials
These actions now constitute part of the environmental management action plan on the mine.
NI 43-101 Technical Report on the Karowe Mine (Amended) – February 4 2014 Page: 134

21 CAPITAL AND OPERATING COSTS
Operating costs are presented in Table 21-1 and are based on the current Whittle optimisation and mining schedule, which in turn has defined the Mineral Reserve. The mine is scheduled to deliver approximately 2.5 Mt to the mill annually from 2015 onwards. This figure will be less in 2014 due to scheduled operational downtime on the plant as integration of the plant upgrades takes place.
Table 21-1 Karowe Mine Operating Costs
Cost item 2014 Cost
USD/tonne
Ore Mined cash costs 3.02
Waste Mined cash costs 2.97
Processing cash cost (per tonne milled) 8.62
Administration costs (per tonne milled) 3.23
All in cash operating costs (per tonne milled) 31.89
Capital costs for the mine are presented in Table 21-2. The mine is currently implementing a plant upgrade which will:
• Permit processing of high yield geological units which comprise part of the Mineral Reserve
• Introduce a large diamond recovery circuit which will significantly reduce the risk of breakage of large diamonds by the existing plant, when harder kimberlite is introduced
The key aspects of the design upgrade are presented in Section 17. However, the final design parameters were not completed as of the date of this report. The current estimate for the plant upgrade is USD 50 million.
Table 21-2 Karowe Mine Capital Costs
Cost item 2014 Cost
Plant upgrade1 USD 50 m
Operating Capital2 USD 2.97 m
1The total capital cost of the plant upgrade has not yet been finalised and this is the current estimate 2The operating capital (or ‘stay in business costs’) are annual costs that provide financial liquidity to the mining operations.
NI 43-101 Technical Report on the Karowe Mine (Amended) – February 4 2014 Page: 135
22 ECONOMIC ANALYSIS
An updated financial model has been produced by Lucara incorporating the following inputs:
• The current Mineral Reserve estimate based on the most recent optimised Whittle shell, with mining rates to 2027 and the November 2013 diamond price book
• An assumed increase in diamond value (real) of 3% per annum. This increase is based on the reasonable assumptions that global diamond prices will recover as the world economy recovers
• An annual increase in mining costs (real) of 10% per annum (to allow for longer transport distances as the open pit deepens)
• Taxes and royalty payments as they currently apply (Section 4.3.2)
• Boteti administrative costs of USD 2.15 million per annum
• Sales and marketing costs of USD 2.97 million per annum
A cash flow analysis is presented in Table 22-1. The net present value of the project at an 8% discount rate is USD 448.1 million.
NI 43-101 Technical Report on the Karowe Mine (Amended) – February 4 2014 Page: 136

Table 22-1 Cash Flow Analysis
Life of Mine (years) 14 Costs$/t ore mined 5.28$ $/t ore treated 27.32$ $/ct recovered 188.69$
Year 2014 2015 2016 2017 2018 2019 2020 2021 2022 2023 2024 2025 2026 2027
DIAMOND VALUE Annual PriceIncrease
North Lobe (US$/ct) 3.0% 222$ 229$ 236$ 243$ 250$ 258$ 266$ 274$ 282$ 290$ 299$ 308$ 317$ 327$ Central Lobe (US$/ct) 3.0% 360$ 371$ 382$ 393$ 405$ 417$ 430$ 442$ 456$ 469$ 484$ 498$ 513$ 528$ South Lobe (US$/ct) 3.0% 423$ 436$ 449$ 463$ 476$ 491$ 505$ 521$ 536$ 552$ 569$ 586$ 604$ 622$ Final Inventory (US$/ct) 3.0% -$ -$ -$ -$ -$ -$ -$ -$ -$ -$ -$ -$ -$ 622$
MININGOre to Plant TotalsNorth Lobe (tonnes) 998 242 25 024 17 483 151 695 258 617 360 073 33 002 119 386 26 057 6 899 5 0 0 0 0Central Lobe (tonnes) 6 341 762 735 817 680 064 475 821 1 029 781 336 591 635 041 1 023 565 351 068 471 349 517 111 67 790 17 749 14 0South Lobe (tonnes) 26 204 776 1 434 007 1 974 349 1 900 751 1 242 186 1 824 608 1 851 984 1 393 358 2 134 709 2 037 024 1 999 095 2 449 900 2 493 739 2 507 067 962 000Total (tonnes) 33 544 779 2 194 848 2 671 895 2 528 267 2 530 584 2 521 273 2 520 026 2 536 310 2 511 835 2 515 272 2 516 212 2 517 690 2 511 488 2 507 080 962 000
Waste Rock (tonnes) 82 538 093 11 280 754 12 881 143 14 214 881 13 812 408 14 044 811 7 176 377 1 803 201 1 825 564 2 205 544 1 853 201 924 056 515 752 400 0Total Tonnes Mined (tonnes) 116 082 872 13 475 602 15 553 038 16 743 148 16 342 993 16 566 084 9 696 403 4 339 511 4 337 399 4 720 816 4 369 413 3 441 746 3 027 240 2 507 481 962 000Strip Ratio 2.46 5.14 4.82 5.62 5.46 5.57 2.85 0.71 0.73 0.88 0.74 0.37 0.21 0.00 0.00
PROCESS MILLTonnes to Mill (tonnes) 33 544 779 2 194 848 2 671 895 2 528 267 2 530 584 2 521 273 2 520 026 2 536 310 2 511 835 2 515 272 2 516 212 2 517 690 2 511 488 2 507 080 962 000
PROCESSED GRADENorth Lobe (cpht) 18.40 27.50 24.55 20.70 22.71 17.53 14.27 9.35 10.61 9.38 9.37 0.00 0.00 0.00 0.00Central Lobe (cpht) 18.79 25.00 24.90 22.81 21.57 17.32 15.22 14.06 15.27 14.63 14.25 14.54 13.75 13.75 0.00South Lobe (cpht) 14.73 15.90 15.09 15.79 11.83 15.55 14.12 11.49 14.18 14.49 15.34 16.12 17.98 14.80 6.60
RECOVERYProcess Plant
Efficiency TotalsNorth Lobe (cts) 100.0% 183 707 6 881 4 293 31 403 58 745 63 107 4 708 11 157 2 766 647 1 - - - - Central Lobe (cts) 100.0% 1 191 492 183 990 169 349 108 544 222 155 58 294 96 662 143 937 53 622 68 944 73 693 9 858 2 441 2 - South Lobe (cts) 100.0% 3 861 104 228 011 297 944 300 168 146 926 283 778 261 529 160 050 302 725 295 196 306 735 394 972 448 388 371 157 63 524Total Carats Recovered (cts) 5 236 303 418 882 471 586 440 115 427 826 405 179 362 898 315 145 359 112 364 787 380 429 404 830 450 829 371 159 63 524
REVENUE TotalsNorth Lobe (US$ 000's) 45 117$ 1 530$ 983$ 7 410$ 14 278$ 15 798$ 1 214$ 2 963$ 757$ 182$ 0$ -$ -$ -$ -$ Central Lobe (US$ 000's) 479 196$ 66 195$ 62 755$ 41 430$ 87 337$ 23 605$ 40 315$ 61 834$ 23 726$ 31 421$ 34 593$ 4 767$ 1 216$ 1$ -$ South Lobe (US$ 000's) 2 009 951$ 96 523$ 129 911$ 134 807$ 67 965$ 135 208$ 128 345$ 80 901$ 157 609$ 158 300$ 169 423$ 224 705$ 262 747$ 224 016$ 39 491$ Final Inventory (US$ 000's) 43 492$ -$ -$ -$ -$ -$ -$ -$ -$ -$ -$ -$ -$ -$ 43 492$ Total Gross Revenue (US$ 000's) 2 577 756$ 164 248$ 193 650$ 183 647$ 169 580$ 174 611$ 169 875$ 145 698$ 182 092$ 189 904$ 204 017$ 229 472$ 263 963$ 224 017$ 82 983$
CAPITAL EXPENDITURE TotalsStay in Business (US$ 000's) 37 000$ 3 500$ 3 500$ 3 000$ 3 000$ 3 500$ 3 500$ 3 000$ 3 000$ 3 500$ 2 500$ 2 000$ 2 000$ 500$ 500$ Project Expenditures (US$ 000's) 50 000$ 50 000$ -$ -$ -$ -$ -$ -$ -$ -$ -$ -$ -$ -$ -$ Rehabilitation (US$ 000's) 18 793$ -$ -$ -$ -$ -$ -$ -$ -$ -$ -$ -$ -$ 14 195$ 4 598$ Total Capital Cost (US$ 000's) 105 793$ 53 500$ 3 500$ 3 000$ 3 000$ 3 500$ 3 500$ 3 000$ 3 000$ 3 500$ 2 500$ 2 000$ 2 000$ 14 695$ 5 098$
NI 43-101 Technical Report on the Karowe Mine (Amended) – February 4 2014 Page: 137

Table 21-1 continued
OPERATING COSTS
MININGAnnual Price
IncreaseOre mined (US$/t mined 10.0% 3.02$ 3.32$ 3.65$ 4.01$ 4.42$ 4.86$ 5.34$ 5.88$ 6.47$ 7.11$ 7.82$ 8.61$ 9.47$ 10.41$ Waste mined (US$/t waste mined) 10.0% 2.97$ 3.27$ 3.59$ 3.95$ 4.35$ 4.78$ 5.26$ 5.79$ 6.36$ 7.00$ 7.70$ 8.47$ 9.32$ 10.25$ Processing (US$/t treated) 0.0% 8.62$ 9.12$ 9.12$ 9.12$ 9.12$ 9.12$ 9.12$ 9.12$ 9.12$ 9.12$ 9.12$ 9.12$ 9.12$ 9.12$
OPERATING COSTS TotalsOre mined (US$ 000's) 176 967$ 10 488$ 10 516$ 10 007$ 10 362$ 10 644$ 12 734$ 17 265$ 17 154$ 17 140$ 18 663$ 20 447$ 21 529$ 18$ -$ Waste mined (US$ 000's) 335 119$ 33 492$ 42 068$ 51 066$ 54 582$ 61 051$ 34 314$ 9 484$ 10 562$ 14 037$ 12 974$ 7 116$ 4 369$ 4$ -$ Processing (US$ 000's) 304 970$ 18 929$ 24 379$ 23 068$ 23 089$ 23 004$ 22 993$ 23 142$ 22 918$ 22 950$ 22 958$ 22 972$ 22 915$ 22 875$ 8 777$ Site Admin Costs (US$ 000's) 99 294$ 7 092$ 7 092$ 7 092$ 7 092$ 7 092$ 7 092$ 7 092$ 7 092$ 7 092$ 7 092$ 7 092$ 7 092$ 7 092$ 7 092$ Total Production Cash Costs (US$ 000's) 916 350$ 70 001$ 84 055$ 91 234$ 95 126$ 101 792$ 77 134$ 56 984$ 57 727$ 61 218$ 61 688$ 57 628$ 55 905$ 29 989$ 15 870$
FIXED COSTSBoteti Admin Costs (US$ 000's) 30 089$ 2 149$ 2 149$ 2 149$ 2 149$ 2 149$ 2 149$ 2 149$ 2 149$ 2 149$ 2 149$ 2 149$ 2 149$ 2 149$ 2 149$ Sales and Marketing costs (US$ 000's) 41 598$ 2 971$ 2 971$ 2 971$ 2 971$ 2 971$ 2 971$ 2 971$ 2 971$ 2 971$ 2 971$ 2 971$ 2 971$ 2 971$ 2 971$ Total Fixed Costs (US$ 000's) 71 687$ 82 214$ 96 268$ 103 447$ 107 339$ 114 005$ 89 347$ 69 196$ 69 939$ 73 431$ 73 900$ 69 840$ 68 118$ 42 202$ 28 083$ TOTAL OPERATING COSTS (US$ 000's) 988 037$ 75 122$ 89 175$ 96 355$ 100 246$ 106 913$ 82 254$ 62 104$ 62 847$ 66 339$ 66 808$ 62 748$ 61 026$ 35 110$ 20 990$
CASH FLOW TotalsRevenue (US$ 000's) 2 577 756$ 164 248$ 193 650$ 183 647$ 169 580$ 174 611$ 169 875$ 145 698$ 182 092$ 189 904$ 204 017$ 229 472$ 263 963$ 224 017$ 82 983$ Operating Costs (US$ 000's) 916 350$ 70 001$ 84 055$ 91 234$ 95 126$ 101 792$ 77 134$ 56 984$ 57 727$ 61 218$ 61 688$ 57 628$ 55 905$ 29 989$ 15 870$ Gross Margin 1 661 406$ 94 247$ 109 595$ 92 413$ 74 454$ 72 819$ 92 741$ 88 715$ 124 366$ 128 686$ 142 329$ 171 844$ 208 057$ 194 027$ 67 113$ Royalties (US$ 000's) 10.0% 257 776$ 16 425$ 19 365$ 18 365$ 16 958$ 17 461$ 16 987$ 14 570$ 18 209$ 18 990$ 20 402$ 22 947$ 26 396$ 22 402$ 8 298$ Cash Operating Margin (US$ 000's) 1 403 630$ 77 822$ 90 230$ 74 048$ 57 496$ 55 358$ 75 753$ 74 145$ 106 157$ 109 695$ 121 927$ 148 897$ 181 661$ 171 626$ 58 815$ Boteti Admin costs (US$ 000's) 2.5% 30 089$ 2 149$ 2 149$ 2 149$ 2 149$ 2 149$ 2 149$ 2 149$ 2 149$ 2 149$ 2 149$ 2 149$ 2 149$ 2 149$ 2 149$ Sales and Marketing costs (US$ 000's) 41 598$ 2 971$ 2 971$ 2 971$ 2 971$ 2 971$ 2 971$ 2 971$ 2 971$ 2 971$ 2 971$ 2 971$ 2 971$ 2 971$ 2 971$ Income Before Taxes (US$ 000's) 1 331 943$ 72 702$ 85 109$ 68 928$ 52 376$ 50 238$ 70 633$ 69 024$ 101 036$ 104 575$ 116 807$ 143 776$ 176 541$ 166 505$ 53 694$ Income Taxes (US$ 000's) 477 181$ -$ 16 928$ 18 602$ 10 863$ 10 282$ 21 512$ 24 362$ 41 311$ 42 267$ 49 412$ 64 823$ 82 584$ 72 664$ 21 570$ Net Income (US$ 000's) 854 762$ 72 702$ 68 181$ 50 325$ 41 513$ 39 955$ 49 121$ 44 662$ 59 725$ 62 308$ 67 395$ 78 954$ 93 957$ 93 841$ 32 124$ Capital Expenditure (US$ 000's) 105 793$ 53 500$ 3 500$ 3 000$ 3 000$ 3 500$ 3 500$ 3 000$ 3 000$ 3 500$ 2 500$ 2 000$ 2 000$ 14 695$ 5 098$ Free Cash Flow After Tax (US$ 000's) 748 969$ 19 202$ 64 681$ 47 325$ 38 513$ 36 455$ 45 621$ 41 662$ 56 725$ 58 808$ 64 895$ 76 954$ 91 957$ 79 145$ 27 026$
Disc Rate US$ '000sNPV 0.0% 748 969
5.0% 535 1848.0% 448 12210.0% 401 80412.0% 362 78815.0% 315 06020.0% 256 415
100% PROJECT
NI 43-101 Technical Report on the Karowe Mine (Amended) – February 4 2014 Page: 138

23 ADJACENT PROPERTIES
The Karowe Mine is based on the AK6 kimberlite pipe, which is part of the Orapa kimberlite field. A total of nine kimberlite pipes in this field are either operating mines, or have recently been mined.
23.1 Orapa Mine
Table 23-1 Orapa Mine Summary
1Source: De Beers Operating and Financial Review 2012 2Source: Anglo American Annual Report 2012
Orapa is the second largest commercially exploited kimberlite in the world. (The largest is Mwadui in Tanzania, currently being mined by Petra Diamonds, but the grade at Mwadui is very much lower than Orapa).
Owner Debswana Diamond Mining Company (Pty) Limited
Mining Licence1 ML 10/71 valid until 2029
Area of Licence1 269.4 km2
Mining Started1 1971
Mining Method1 open pit
Grade1 ~90.5 ct/100t in 2012
Production1 11.09 M ct in 2012
Geology1 Kimberlite AK1, 110.6 ha
Life of Mine2 2029 and beyond.
Resource/Reserve2 85.7 Mct
NI 43-101 Technical Report on the Karowe Mine (Amended) – February 4 2014 Page: 139

23.2 Letlhakane Mine
The Letlhakane Mine produces diamonds of very high quality. There are plans to re-treat tailings at the Letlhakane Mine.
Table 23-2 Letlhakane Mine Summary
1Source: De Beers Operating and Financial Review 2012 2Source: Anglo American Annual Report 2012
23.3 Damtshaa Mine
Table 23-3 Damtshaa Mine Summary
1Source: De Beers Operating and Financial Review 2012 2Source: Anglo American Annual Report 2012
The Damtshaa Mine is designed to exploit four relatively low grade kimberlites which were discovered by De Beers in the 1960s and 1970s.
Owner Debswana Diamond Mining Company (Pty) Limited
Mining Licence1 ML 8/75 valid until 2029
Area of Licence1 25 km2
Mining Started1 1977
Mining Method1 open pit
Grade1 ~34.4 ct/100t in 2012
Production1 764,000 ct in 2012
Geology1 Kimberlites DK01 (11.6 ha) and DK02 (3.6 ha)
Life of Mine2 2017
Resource/Reserve2 800,000 ct
Owner1 Debswana Diamond Mining Company (Pty) Limited
Mining Licence1 ML 1/2000 valid until 2029
Area of Licence1 10 km2. The Mining Licence has three sub-areas, one including kimberlites BK9 + BK12; one for BK1 and one for BK15.
Mining Started1 2002
Mining Method1 open pit
Grade1 ~13.7 ct/100t in 2012
Production1 191,000 ct in 2012
Geology1 Kimberlites BK9 (11 ha); BK12 (3 ha); BK15 (2.5 ha); and BK1 (5 ha)
Life of Mine2 2030
Resource/Reserve2 4.1 Mct
NI 43-101 Technical Report on the Karowe Mine (Amended) – February 4 2014 Page: 140

23.4 Firestone Diamonds BK11
Firestone Diamonds plc, listed on the London Alternative Investment Market (“AIM”) is the controlling partner and operator in Monak Ventures (Pty) Ltd (Firestone Diamonds plc 90%; other interests 10%) which has developed the BK11 kimberlite, 5.2 km northeast of the Karowe Mine.
The following information is taken from Firestone Diamonds annual reports of 2011 to 2013. Plant difficulties leading to under-recovery of diamonds and requiring further capital to address, and a weak diamond market, led to a decision in February 2012 to place the BK11 Mine on care and maintenance.
Table 23-4 Firestone Diamonds BK11 (source: Firestone Diamonds annual reports)
Owner1 Monak Ventures (Pty) Ltd
Mining Licence unknown
Area of Licence
Mining started1 July 2010
Mining method1 Open pit1
Grade1 Average of 2.0 cpht achieved from July 2010 to September 2011
Production1 16,026 ct in 2011 and 2012
Geology1 Kimberlite BK11 (8 ha)
Life of Mine1 10 years
Mineral Resource2 11 Mt at an average grade of 6.9 cpht (Inferred) 1Source: Firestone Diamonds annual reports 2011, 2012 and 2013 2Source: Firestone Diamonds Press Release 30 March 2009
23.5 Early Stage Projects
A number of other companies remain active in exploration in the Orapa area. Figure 23-1 shows the licence holdings of a number of exploration companies, as well as the main kimberlite pipes with known economic significance mentioned in the text in this Section.
NI 43-101 Technical Report on the Karowe Mine (Amended) – February 4 2014 Page: 141

Figure 23-1 Map of Mining and Prospecting Licences in the Orapa Area
Licence data provided by the Government of Botswana on 15 May 2012. Map produced on 18 November 2013
NI 43-101 Technical Report on the Karowe Mine (Amended) – February 4 2014 Page: 142

24 OTHER RELEVANT DATA AND INFORMATION
There are no other data relevant to this report.
NI 43-101 Technical Report on the Karowe Mine (Amended) – February 4 2014 Page: 143

25 INTERPRETATION AND CONCLUSIONS
An updated Mineral Resource has been estimated for the Karowe Mine, based on a review of existing geological data, and updated grade and revenue information based on mining data and actual sales data collected during 2012 and 2013, and the November 2013 price book. The key change in the Mineral Resource estimate is the diamond revenue, which has increased. This is largely due to the recovery of exceptionally large and high value Type IIa diamonds at Karowe, as well as some ‘fancies’. The diamonds are currently sold by Lucara through an open tender system in both Gaborone and in Europe.
The updated Mineral Resource is the basis for an updated Mineral Reserve derived from a pit design based on an optimised Whittle shell. The pit design has changed very slightly since the original design from the 2010 Feasibility Study. With minor exceptions, the pit design satisfies geotechnical parameters, and a robust hydrogeological dewatering plan will both preserve the integrity of the pit walls when mining extends below the water table, and provide water for the plant operations. The pit optimisation is currently being reviewed to decide whether to mine a portion of highly diluted kimberlite in the North Lobe, and this is the area where the pit wall has deviated from the pit design.
The weathered portion of the AK6 kimberlite has largely been mined and processed, and fresh hard kimberlite will be increasingly encountered in the future. In order to address the challenges presented to the plant of hard kimberlite, high DMS yield material, and preservation of value of large diamonds, a number of upgrades to the plant will be implemented during 2014, with a capital cost of approximately USD 50 million.
The mining schedule produced from the Whittle optimisation and the Mineral Reserve estimate, have been used as the basis of for a financial model for the project. The financial model indicates that the mine has positive economics to its scheduled close in 2027, and that the current NPV is USD 448.1 million at 8% discount rate.
NI 43-101 Technical Report on the Karowe Mine (Amended) – February 4 2014 Page: 144

25.1 Risks
Risks for the Project are summarised in Table 25-1.
Table 25-1 Summary of Key Risks for the Karowe Mine
Risk Risk Class Risk Mitigation/Comment Residual
Risk Rating
Major safety, health and environmental incidents
SHE
Whilst each of these aspects are managed at Karowe, the SHE audit undertaken in 2013 identified the lack of an Environmental and Social Risk Assessment as an item for management attention. The ESRA has not yet been established
Low
Internal dilution of the kimberlite by basalt and other waste rock
Technical
The updated geological model has attempted to improve the mapping of internal dilution. The Mineral Reserve conversion has assumed internal dilution of 4.5%
Moderate
Storm water management SHE There is currently no documented storm water management plan in place
Low
Power availability Technical
The current electrical draw is up to 6.5kVA, rising to 8.6 kVA with the plant upgrade, relative to a capacity of 10kVA. There is limited capacity for further expansion
Low
Breakage of large stones from fresh kimberlite
Technical
AG mill has demonstrated less diamond breakage relative to other technologies Large Diamond Recovery circuit being implemented
Low
Use of XRT technology Technical
While XRT technology is currently used in commercial diamond recovery, it remains a developing technology. Intensive test work has demonstrated high efficiency in recovery diamonds from the Karowe orebody
Low
Comminution strategy. Incorrect predictions of ore breakage may result in inadequate capacity or more fines reporting to tailing with concommittent increase in water loss
Technical Modifications are based on extensive testwork. There is additional water availability if required
Low
Effective recovery of diamonds from high density kimberlite units
Technical Plant modifications (Section 17) Low
Effective recovery of diamonds from hard fresh kimberlite
Technical Plant modifications (Section 17) Low
Availability of the Pebble Crusher Technical
Additional strategic spares and wear parts will be procured on the project to mitigate the impact on the high wear rate of the pebble crusher. However, consideration should be given to procuring an additional peeble crusher to maintain the highest possible availability
Low
Plant upgrade Technical
Whilst the plant upgrade is being implemented to mitigate risk, it brings with it the risk of increased complexity and the need to balance the process circuits, as well as disruption of normal production during construction, integration and commissioning
Low
NI 43-101 Technical Report on the Karowe Mine (Amended) – February 4 2014 Page: 145

Table 25-1 (continued)
Risk Risk Class Risk Mitigation/Comment Residual
Risk Rating
Diamond price Financial The fundamentals for the diamond price are strong. Lucara is establishing a sales office in Gaborone
Low
Potential for reduced frequency of very large (+100 ct) diamonds with depth in the Centre and South Lobes.
Technical
Analysis of geological continuity and variation in diamond size distribution (from LDD sampling) with depth suggests very limited potential for a significant change in diamond size distribution with depth. But LDD sampling does not directly test for the presence/absence of very large diamonds and the possibility that the frequency of such stones is reduced with depth cannot be ruled out entirely.
Moderate
NI 43-101 Technical Report on the Karowe Mine (Amended) – February 4 2014 Page: 146
26 RECOMMENDATIONS
The Karowe Mine is in production and exploration activities and engineering studies have largely concluded. Lucara is currently implementing changes to the plant and managing risks identified and associated with this and other aspects of operating an open pit diamond mine. No other recommendations are provided by the QPs.
NI 43-101 Technical Report on the Karowe Mine (Amended) – February 4 2014 Page: 147

27 REFERENCES
Bain and Company 2012: The Diamond Industry – Portrait of Growth Bosma, P., 2008: AK6 Mineral Resource Classification review. Unpublished internal Memo, De Beers Group Services (Pty) Ltd. – MRM Boteti Mining 2013: Joint Data Analysis – Weathered Basalt Report. August 2013 Bush, D.E., 2006: AK6 Phase 1 – Mineral Resource Estimate. Unpublished internal report, De Beers Mineral Resource Management (MRM). Bush, D.E., 2007: AK6 Phase 2 – Mineral Resource Estimate. Unpublished internal report, DeBeers Mineral Resource Management (MRM). Bush, D.E., 2008a: Review of the AK6 Mineral Resource Estimate. Unpublished report prepared by Z-Star for De Beers Group Services (Pty) Ltd. Bush, D.E., 2008b: Technical Note: Mineral Resource statement for AK6; from surface to 750m depth. Unpublished report prepared by Z-Star for De Beers Group Services (Pty) Ltd. CIM (2010). CIM definitions and standards for Mineral Resources and mineral reserves. November 27, 2010. Coates, J.N.M, Davies, J., Gould, D., Hutchins, D.G., Jones, C.R., Key, R.M., Massey, N.W.D., Reeves, C.V., Stansfield, G. and Walker, I.R. (1979). The Kalatraverse One Report. Geological Survey Department, Botswana, Bulletin 21. De Beers MRM 2006: AK06 Phase 1 – Mineral Resource Classification Data Review. Unpublished report prepared by De Beers Mineral Resource Management (MRM) for De Beers Group Services (Pty.) Ltd. De Beers MRM 2007: AK06 Phase 2 – Mineral Resource Classification Data Review. Unpublished report prepared by De Beers Mineral Resource Management (MRM) for De Beers Group Services (Pty.) Ltd. Environmental Business Strategies (Pty) Ltd (EBS) 2012.. Boteti mine: Environmental & social due diligence, October 2012. Prepared for Lucara Diamond Corporation. October 2012. Rev 0. Farrow, D.J., 2007. Three dimensional model of differing yield zones within the M/PK of the South Lobe, AK6 kimberlite, Botswana. Unpublished internal report, De Beers Group Services (Pty.) Ltd. Field, M., 1989: The Petrography of core specimens from Orapa-AK6, Botswana. Unpublished internal by Kimberlite Petrology Unit (KPU report no: PI/89-090) for De Beers Consolidated Mines Ltd.
NI 43-101 Technical Report on the Karowe Mine (Amended) – February 4 2014 Page: 148

Geoflux (pty) Ltd (2007) Environmental Impact Assessment of the proposed AK6 Mine. Report in 6 volumes dated 28th September 2007 Geoflux 2013: Geoflux (Pty) Ltd. Environmental Management Plan for the Karowe Diamond Mine. June 2013. Geoflux 2013: Geoflux (Pty) Ltd. Closure and Rehabilitation Plan Report. August 2013. Government of Botswana (1999) Mines and Minerals Act. Act 17 of 1999 Government of Botswana (2004) Tribal Land Act. Act 24 of 2004 Government of Botswana Hanekom, A., Farrow, D.J., Stiefenhofer, J., 2005: Report on initial three dimensional geological model of the AK6 occurrence, Botswana. Unpublished internal report, De Beers Geological Survey (DGBS), Mineral Resource Management (MRM). Hanekom, A., Stiefenhofer., J., 2006: Geological Interpretation of AK6 – An Update. Unpublished internal report, De Beers Geological Survey (DGBS), Mineral Resource Management (MRM). Hanekom, A., Stiefenhofer, J., Robey, J.v.A., 2006: Geology of the AK6 kimberlite – current knowledge and progress update. Unpublished internal report, De Beers Geological Survey (DGBS), Mineral Resource Management (MRM). MSA 2010: NI 43-101 Technical Report on the Feasibility Study for the AK6 Kimberlite Project, Botswana, Effective Date 12August 2010, unpublished technical report prepared by MSA Geoservices (Pty) Ltd for Lucara Diamond Corp., posted to www.sedar.com. Opperman, A, and van der Schyff, W., (Golder Associates Africa) 2007: Phase 2 Three-Dimensional Geological Modelling of the AK6 kimberlite, Botswana. Unpublished report prepared by Golder Associates Africa (Pty) Ltd. for De Beers Group Services (Pty). QTS Krystal Dinamika 2013: A study of diamond breakage and damage of the South Lobe resource sample and related diamonds (unpublished) Rice, PM, Jooste, R.D., Mapukula, E., (Angle American; MinRED) 2008: Level II review - De Beers AK6 Geology review. Report MRE-DEBE01-0001-05-08. Unpublished technical report prepared by Anglo American plc. (MinRED) for De Beers Group Services (Pty) Ltd. Rikhotso, C, Winzar, D., 2006: Orapa AK6 Resource Definition Project, Core and Large Diameter Drilling Programmes. Phase 1 Final Report, vols. I and II. De Beers Prospecting Botswana (Pty) Ltd internal report
NI 43-101 Technical Report on the Karowe Mine (Amended) – February 4 2014 Page: 149

SiVest (2010)Environmental Management Plan (EMP) for the AK6 Diamond Mine SRK 2013: Karowe Diamond Mine Geotechnical Review, February 2013 Stiefenhofer, J., 2007: Geology of the AK6 kimberlite July 2007. Unpublished internal report, De Beers Mineral Resource Management (MRM). Stiefenhofer, J, Hanekom, A., 2005: Geology of the A/K6 kimberlite – current knowledge and progress update. Unpublished internal report, De Beers Mineral Resource Management (MRM). Stripp, G.R., Field, M., Schumacher, J.C., Sparks, R.S.J., Cressey, G., 2006: Post-emplacement serpentinization and related hydrothermal metamorphism in a kimberlite from Venetia, South Africa. Journal of Metamorphic Geology, 24, pp. 515 to 534. Tait, M.A., Maccelari, M.G., 2008: Update to the three dimensional geological model of the AK6 kimberlite, Botswana: modifications following the 2008 front end engineering design (FEED) review by ATD. Unpublished internal report, De Beers Group Services (Pty.) Ltd.
NI 43-101 Technical Report on the Karowe Mine (Amended) – February 4 2014 Page: 150

APPENDIX 1:
Glossary of Terms
NI 43-101 Technical Report on the Karowe Mine (Amended) – February 4 2014 Page: 151
Glossary
amsl Above Mean Sea Level
Archaean The geologic eon from about 3,800 to 2,500 million years ago.
basalt A mafic volcanic rock composed chiefly of plagioclase and pyroxene. It is the extrusive equivalent of gabbro.
carbonate A rock, usually of sedimentary origin, composed primarily of calcium, magnesium or iron and CO3. Essential component of limestones and marbles.
chromite An iron chromium oxide: FeCr2O4. It is an oxide mineral belonging to the spinel group.
density A measure of the amount of matter contained by a given volume.
dip The angle at which a planar feature, such as bedding or schistosity, is inclined from the horizontal.
dolerite Medium-grained intrusive igneous rock of basaltic composition (plagioclase + clinopyroxene)
dunite An igneous, plutonic rock, of ultramafic composition, with coarse-grained texture. The mineral assemblage is greater than 90% olivine.
dyke A tabular body, typically of igneous rock, which cuts across the structure of another older rock.
fault A crack in the earth's crust resulting from the displacement of one side with respect to the other.
fancy A term used to describe diamonds of unusual and rare colour, for example blues, pinks and greens
gabbro A mafic igneous rock composed chiefly of plagioclase and clinopyroxene, sometimes with olivine. It is the intrusive equivalent of basalt.
gneiss A common and widely-distributed metamorphic rock having bands or veins, but not schistose.
grade A measure that describes the concentration of a valuable natural material in a mineral deposit.
granite A common widely occurring type of intrusive, felsic, igneous rock. Granite usually has a medium- to coarse-grained texture.
igneous Pertaining to a rock that has crystallized out of a melt.
NI 43-101 Technical Report on the Karowe Mine (Amended) – February 4 2014 Page: 152

intrusion Liquid rock that forms under Earth's surface. Magma
from under the surface is slowly pushed up from deep within the earth into any cracks or spaces it can find, sometimes pushing existing country rock out of the way, a process that can take millions of years. As the rock slowly cools into a solid, the different parts of the magma crystallize into minerals
kimberlite A type of potassic, carbon dioxide containing, volcanic rock (peridotite) best known for sometimes containing diamonds.
lithology A description of a rock’s physical characteristics visible at outcrop, in hand or core samples or with low magnification microscopy, such as colour, texture, grain size, or composition.
mafic A type of rock that is rich in magnesium and iron
magnetite An iron oxide mineral with the chemical formula Fe3O4
and a member of the spinel group.
mica A group of hydrous aluminosilicate minerals characterized by highly perfect cleavage, so that they readily separate into very thin leaves.
Natural Remanant Magnetisation (NRM)
The permanent magnetism of a rock caused by the alignment of magnetic particles in the rock with the Earth’s magnetic field at the time the rock formed.
olivine A magnesium iron silicate mineral with the formula (Mg,Fe)2SiO4.
peridotite A dense, coarse-grained igneous rock, consisting mostly of the minerals olivine and pyroxene. Peridotite is ultramafic, as the rock contains less than 45% silica. It is high in magnesium, reflecting the high proportions of magnesium-rich olivine, with appreciable iron.
QAQC Quality assurance and quality control.
quartz The most abundant mineral on the earth's surface, of chemical composition silicon dioxide, SiO2.
SOPs Standard Operating Procedures
SG Specific gravity. The ratio of the density (mass of a unit volume) of a substance to the density (mass of the same unit volume) of a reference substance.
shale A fine-grained, clastic sedimentary rock composed of mud that is a mix of flakes of clay minerals and tiny fragments (silt-sized particles) of other minerals, especially quartz and calcite.
NI 43-101 Technical Report on the Karowe Mine (Amended) – February 4 2014 Page: 153

special Refers to a gem quality diamond of greater than 10.8 ct.
Type IIa diamond Diamonds characterised by their very low (<20 ppm) nitrogen contents. The Type IIa stones often have top quality white colours (D-G), a consequence of their low nitrogen contents. They include the largest gem diamond ever found, the 3,106 ct Cullinan, recovered from the Premier Mine, South Africa, as well as gems like the legendary Koh-i-noor, from India.
ultramafic rock (also referred to as ultrabasic) rocks are igneous and meta-igneous rocks with very low silica content (less than 45%), generally >18% MgO, high FeO, low potassium, and are composed of usually greater than 90% mafic minerals (dark coloured, high magnesium and iron content).
weathering Mechanical or chemical breaking down of rocks in situ by weather or other causes.
NI 43-101 Technical Report on the Karowe Mine (Amended) – February 4 2014 Page: 154

APPENDIX 2 Certificates of Qualified Persons
NI 43-101 Technical Report on the Karowe Mine (Amended) – February 4 2014 Page: 155

Mr Michael David Lynn
The MSA Group 20B Rothesay Ave, Craighall Park, Johannesburg, 2196
CERTIFICATE OF QUALIFIED PERSON
I, Michael David Lynn, with business address at 20B Rothesay Ave, Craighall Park, Johannesburg, do hereby certify that:
1. I am a Principal Consultant at The MSA Group (Pty) Ltd located at 20B Rothesay Avenue, Craighall Park, Johannesburg, South Africa
2. This certificate applies to the Technical Report entitled "Karowe Diamond Mine Botswana NI 43-101 Independent Technical Report (Amended)" dated 4th February 2014, for Lucara Diamond Corp. (the "Issuer"), and I am responsible for sections 1-6, 7.1-7.2, 8-11, 19, 23, and 25-27 of the report.
3. I graduated with an Honours degree in Geology from Portsmouth Polytechnic in June 1984, and with a Master’s Degree in Exploration Geology from Rhodes University in January 1991.
4. I have worked continuously as a geologist for a total of 28 years. This experience includes technical and management roles focussed on diamond exploration and the management and execution of diamond exploration and evaluation programmes in East, West, Central and Southern Africa as well as India.
5. I am a registered Professional Scientist (Pr.Sci.Nat. registration number 400148/11), specializing in diamonds and other commodities.
6. I have read the definition of “Qualified Person” set out in National Instrument 43-101 and certify that by reason of my education, affiliation with a professional association (as defined in NI 43-101) and past relevant work experience, I am a “Qualified Person” for the purposes of NI 43-101. 7. I most recently visited the Karowe Mine during the period 27 and 29 August 2012 to observe the initial open pit and kimberlite pipe contact zones where actual contacts were found to vary slightly from modelled contacts based on the drilling, and to observe zones of internal dilution in drill core and within the pipe. 8. I have not received, nor do I expect to receive, any interest, directly or indirectly, from the Issuer, or of any affiliate thereof, and I am independent of the Issuer within the meaning of Section 1.5 of NI 43-101.
9. I have had no prior involvement with the property that is the subject of this Independent Technical Report other than in connection with the preparation of this and previously prepared Independent Technical Reports.
10. As of the date of this certificate, to the best of my knowledge, information and belief, the parts of the technical report for which I am responsible contain all scientific and technical information that is required to be disclosed to make the technical report not misleading.

- 2 -
11. I consent to the public filing of the technical report titled "Karowe Diamond Mine Botswana NI 43-101 Independent Technical Report (Amended)" dated 4th February 2014 (the “Technical Report”) by Lucara Diamond Corp. (the issuer). I also consent to any extracts from or a summary of the Technical Report being included in public disclosures by the issuer.
12. I consent to the filing of this Technical Report with any stock exchange or other regulatory authority, and any publication by them for regulatory purposes, including electronic publication in the public company files on their websites accessible by the public, of this Technical Report. Dated this 4th day of February, 2014 “Signed and sealed”
“Michael Lynn” (signed and sealed)
Principal Consultant – The MSA Group (Pty) Ltd
361063 v1

Thomas E Nowicki Mineral Services Canada Inc.
501 – 88 Lonsdale Avenue, North Vancouver, BC, Canada, V7M 2E6
CERTIFICATE OF QUALIFIED PERSON
I, Thomas E Nowicki, with business address at 501 – 88 Lonsdale Avenue, North Vancouver, BC, Canada, V7M 2E6, do hereby certify that:
1. I have contributed to the report titled "Karowe Diamond Mine Botswana NI 43-101 Independent Technical Report (Amended)" dated 4th February 2014, for Lucara Diamond Corp. (the "Issuer"), and I am responsible for sections 7.3, 12 and 14 of the report.
2. I personally visited the Karowe Mine near Letlhakane in Botswana on the 3rd and 4th of July 2013 as
part of the due diligence necessary to complete this report. 3. I hold a Bachelor of Science (Honours) in Geology and Ph.D. in geochemistry from the University of
Cape Town (South Africa) and a Master Degree in Economic Geology from Rhodes University (Grahamstown, South Africa).
4. With the exception of periods of study, I have practiced my profession within the mining industry continuously for 26 years.
5. I am a registered Professional Geoscientist in good standing with the Association of Professional Engineers and Geoscientists of the province of British Columbia, Canada, with registration #30747.
6. I am currently employed as Technical Director and Senior Principal geoscientist with Mineral Services Canada Inc., a geological consuting firm specialising in diamond exploration and evaluation services.
7. I have not received, not do I expect to receive any interest, directly or indirectly, from the Issuer, or from any affiliate thereof, and I am independent of the Issuer within the meaning of of section 1.5 of NI43-101.
8. I have had no prior involvement with the property that is the subject of this Indpendent Technical Report other than in connection with the preparation of this and previously prepared independent technical reports.
9. I have read National Instrument NI 43-101 and Form 43-101F1 and, by reason of education and past relevant work experience, I fulfill the requirements to be a ‘Qualified Person” for the purposes of NI 43-101. The parts of the technical report for which I am responsible have been prepared in compliance with National Instrument 43-101 and Form 43-101F1.

- 2 -
10. As of the date of this certificate, to the best of my knowledge, information and belief, the parts of the technical report for which I am responsible contain all scientific and technical information that is required to be disclosed to make the technical report not misleading.
11. I consent to the public filing of the technical report titled "Karowe Diamond Mine Botswana NI 43-101 Independent Technical Report (Amended)" dated 4th February 2014 by Lucara Diamond Corp. (the Issuer). I also consent to any extracts from or summary of the Indeendent Technical Report being included in public disclosures by the Issuer.
Dated this 4th day of February, 2014 “Signed and sealed”
“Thomas E Nowicki” (signed and sealed)
Mineral Services Canada Inc.
361063 v1

Michael Valenta
Metallicon Process Consulting (Pty) Ltd 9 Howitzer Street, Ifafi, North West Province, South Africa
CERTIFICATE OF QUALIFIED PERSON
I, Michael Valenta, with business address at 9 Howitzer Street, Ifafi, North West Province, South Africa, do hereby certify that:
1. I have contributed to the report titled, "Karowe Diamond Mine Botswana NI 43-101 Independent Technical Report (Amended)" dated 4th February 2014, for Lucara Diamond Corp. (the "Issuer"), and I am responsible for sections 13 and 17 of the report.
2. I personally visited the Karowe Mine near Letlhakane in Botswana on 16 December 2013 as part of the due diligence necessary to compile this report.
3. I hold a BSc (Eng) Metallurgy degree from the University of the Witwatersrand.
4. I have practiced my profession within the mining industry continuously for 23 years.
5. I am a registered Professional Engineer, specializing in Metallurgy in the country of South Africa, with Registration on the International Register as a Professional Engineer as defined by the Washington Accord. I am also a Fellow of the Southern African Institute of Mining and Metallurgy.
6. I am currently employed as Managing Director with Metallicon Process Consulting (Pty) Ltd, an engineering specialising in process engineering.
7. I have not received, nor do I expect to receive, any interest, directly or indirectly, from the Issuer, or of any affiliate thereof, and I am independent of the Issuer within the meaning of Section 1.5 of NI 43-101.
8. I have had no prior involvement with the property that is the subject of this Independent Technical Report other than in connection with the preparation of this Independent Technical Report.
9. I have read National Instrument 43-101 and Form 43-101F1 and, by reason of education and past relevant work experience, I fulfill the requirements to be a "Qualified Person" for the purposes of NI 43-101. The parts of the technical report for which I am responsible have been prepared in compliance with National Instrument 43-101 and Form 43-101F1.
10. As of the date of this certificate, to the best of my knowledge, information and belief, the parts of the technical report for which I am responsible contain all scientific and technical information that is required to be disclosed to make the technical report not misleading.
11. I consent to the public filing of the technical report titled "Karowe Diamond Mine Botswana NI 43-101 Independent Technical Report (Amended)" dated 4th February 2014 (the “Technical Report”)

- 2 -
by Lucara Diamond Corp. (the issuer). I also consent to any extracts from or a summary of the Technical Report being included in public disclosures by the issuer.
Dated this 4th day of February 2014.
“Michael Valenta” (signed and sealed) Managing Director Metallicon Process Consulting (Pty) Ltd
361063 v1

Mark Shane Gallagher
MSG Consulting
22 Willson Street
Fairland
Johannesburg
2195
CERTIFICATE OF QUALIFIED PERSON
I, Mark Shane Gallagher with business address at 22 Willson Street, Fairland, Johannesburg, 2195, do hereby certify that:
1. I have contributed to the report titled, "Karowe Diamond Mine Botswana NI 43-101 Independent Technical Report (Amended)" dated 4th February 2014, for Lucara Diamond Corp. (the "Issuer"), and I am responsible for sections 15, 16 and 17 of the report.
2. I have not personally visited the Karowe Mine near Letlhakane in Botswana as part of the due diligence necessary to compile this report.
3. I hold a Bachelor of Technology degree from the University of the Johannesburg.
4. I have practiced my profession as a mining engineer within the mining industry continuously for 33 years.
5. I am currently employed as a Principle Consultant with MSG Consulting a provider of mining engineering optimisation, design and operational consulting services to the mining industry.
6. I have not received, nor do I expect to receive, any interest, directly or indirectly, from the Issuer, or of any affiliate thereof, and I am independent of the Issuer within the meaning of Section 1.5 of NI 43-101.
7. I have had prior involvement with the property that is the subject of this Independent Technical Report. In addition to the connection with the preparation of this and previously prepared independent technical reports I was the lead for the mining department during the feasibility study conducted by De Beers in 2008. The project was known as AK06 at that time.
8. I have read National Instrument 43-101 and Form 43-101F1 and, by reason of education and past relevant work experience, I fulfill the requirements to be a "Qualified Person" for the purposes of NI 43-101. The parts of the technical report for which I am responsible have been prepared in compliance with National Instrument 43-101 and Form 43-101F1.
- 2 -
361063 v1
9. As of the date of this certificate, to the best of my knowledge, information and belief, the parts of the technical report for which I am responsible contain all scientific and technical information that is required to be disclosed to make the technical report not misleading.
10. I consent to the public filing of the technical report titled "Karowe Diamond Mine Botswana NI 43-101 Independent Technical Report (Amended)" dated 4th February 2014 (the “Technical Report”) by Lucara Diamond Corp. (the issuer). I also consent to any extracts from or a summary of the Technical Report being included in public disclosures by the issuer.
Dated this 4th day of February, 2014.
“Mark Shane Gallagher” (signed and sealed)
MSG Consulting.
22 Willson Street
Fairland
Johannesburg
2195

Robin George Ian Bolton
The MSA Group 20B Rothesay Ave, Craighall Park, Johannesburg, 2196
CERTIFICATE OF QUALIFIED PERSON
I, Robin George Ian Bolton, with business address at 20B Rothesay Ave, Craighall Park, Johannesburg, do hereby certify that:
1. I have contributed to the report titled, "Karowe Diamond Mine Botswana NI 43-101 Independent Technical Report (Amended)" dated 4th February 2014, for Lucara Diamond Corp. (the "Issuer"), and I am responsible for section 20 of the report.
2. I personally visited the Karowe Mine near Letlhakane in Botswana on 16, 17 and 18th of December 2013 as part of the due diligence necessary to compile this report.
3. I hold a Bsc (Hons) in Microbiology from the University of Natal, a Bsc (Hons) in Water Utilisation from the University of Pretoria and a business management qualification from the GIBS institute.
4. I have practiced my profession within the mining industry continuously for 13 years.
5. I am a registered Professional Scientist (Pr.Sci.Nat.), specializing in mining and environmental issues in South Africa and other African countries.
6. I am currently employed as a Principal Environmental Consultant with The MSA Group, a provider of exploration, geology, mineral resource and reserve estimation, mining and environmental consulting services to the mining industry.
7. I have not received, nor do I expect to receive, any interest, directly or indirectly, from the Issuer, or of any affiliate thereof, and I am independent of the Issuer within the meaning of Section 1.5 of NI 43-101.
8. I have had no prior involvement with the property that is the subject of this Independent Technical Report other than in connection with the preparation of this and previously prepared independent technical reports.
9. I have read National Instrument 43-101 and Form 43-101F1 and, by reason of education and past relevant work experience, I fulfill the requirements to be a "Qualified Person" for the purposes of NI 43-101. The parts of the technical report for which I am responsible have been prepared in compliance with National Instrument 43-101 and Form 43-101F1.
10. As of the date of this certificate, to the best of my knowledge, information and belief, the parts of the technical report for which I am responsible contain all scientific and technical information that is required to be disclosed to make the technical report not misleading.

- 2 -
11. I consent to the public filing of the technical report titled "Karowe Diamond Mine Botswana NI 43-101 Independent Technical Report (Amended)" dated 4th February 2014 (the “Technical Report”) by Lucara Diamond Corp. (the issuer). I also consent to any extracts from or a summary of the Technical Report being included in public disclosures by the issuer.
Dated this 4th day of February, 2014.
“Robin George Ian Bolton” (signed and sealed)
The MSA Group (Pty) Ltd.
20B Rothesay Avenue
Craighall Park
Johannesburg
2196
361063 v1
Beric Robinson Beric Robinson Tailings
248A Indus St, Waterkloof Ridge, Pretoria
CERTIFICATE OF QUALIFIED PERSON
I, Beric Robinson, with business address at 248A Indus St, Waterkloof Ridge, Pretoria do hereby certify that:
1. I have contributed to the report titled, "Karowe Diamond Mine Botswana NI 43-101 Independent Technical Report (Amended)" dated 4th February 2014, for Lucara Diamond Corp. (the "Issuer"), and I am responsible for section 18 of the report.
2. I did not visit the Karowe Mine near Letlhakane in Botswana.
3. I hold a BSc Civil Engineering degree from the University of Cape Town.
4. I have practiced my profession within the mining industry continuously for 26 years.
5. I am a registered Professional Engineer, specializing in tailings in the country of South Africa, with #830034.
6. I am currently employed as a Tailings Consultant with Beric Robinson Tailings, specializing in tailings disposal design, operation and management oversight and review.
7. I have not received, nor do I expect to receive, any interest, directly or indirectly, from the Issuer, or of any affiliate thereof, and I am independent of the Issuer within the meaning of Section 1.5 of NI 43-101.
8. I have had no prior involvement with the property that is the subject of this Independent Technical Report other than in connection with the preparation of this and previously prepared independent technical reports.
9. I have read National Instrument 43-101 and Form 43-101F1 and, by reason of education and past relevant work experience, I fulfill the requirements to be a "Qualified Person" for the purposes of NI 43-101. The parts of the technical report for which I am responsible have been prepared in compliance with National Instrument 43-101 and Form 43-101F1.
10. As of the date of this certificate, to the best of my knowledge, information and belief, the parts of the technical report for which I am responsible contain all scientific and technical information that is required to be disclosed to make the technical report not misleading.
11. I consent to the public filing of the technical report titled "Karowe Diamond Mine Botswana NI 43-101 Independent Technical Report (Amended)" dated 4th February 2014 (the “Technical Report”) by the Issuer. I also consent to any extracts from or a summary of the Technical Report being included in public disclosures by the issuer.

- 2 -
Dated this 4th day of February, 2014.
“Beric Robinson” (signed and sealed) _______________________________ Beric Robinson Beric Robinson Tailings 248A Indus Str, Waterkloof Ridge, Pretoria
361063 v1

John Francis Winchester Sexton
The MSA Group (Pty) Ltd.
20B Rothesay Avenue
Craighall Park
Johannesburg
2196
CERTIFICATE OF QUALIFIED PERSON
I, John Francis Winchester Sexton with business address at 20B Rothesay Avenue, Craighall Park, Johannesburg, 2196, do hereby certify that:
1. I have contributed to the report titled, "Karowe Diamond Mine Botswana NI 43-101 Independent Technical Report (Amended)" dated 4th February 2014, for Lucara Diamond Corp. (the "Issuer"), and I am responsible for sections 21 and 22 of the report.
2. I have not personally visited the Karowe Mine near Letlhakane in Botswana as part of the due diligence necessary to compile this report.
3. I hold a Bachelor of Science degree and a Bachelor of Commerce degree, both from the University of the Witwatersrand and a Master of Business Leadership degree from the University of South Africa.
4. I have practiced my profession as a mining analyst within the mining industry continuously for 38 years.
5. I am currently employed as an Associate Consultant with The MSA Group (Pty) Ltd. a provider of exploration, geology, mineral resource and reserve estimation, mining and environmental consulting services to the mining industry.
6. I have not received, nor do I expect to receive, any interest, directly or indirectly, from the Issuer, or of any affiliate thereof, and I am independent of the Issuer within the meaning of Section 1.5 of NI 43-101.
7. I have had no prior involvement with the property that is the subject of this Independent Technical Report other than in connection with the preparation of this and previously prepared independent technical reports.
8. I have read National Instrument 43-101 and Form 43-101F1 and, by reason of education and past relevant work experience, I fulfill the requirements to be a "Qualified Person" for the purposes of

- 2 -
361063 v1
NI 43-101. The parts of the technical report for which I am responsible have been prepared in compliance with National Instrument 43-101 and Form 43-101F1.
9. As of the date of this certificate, to the best of my knowledge, information and belief, the parts of the technical report for which I am responsible contain all scientific and technical information that is required to be disclosed to make the technical report not misleading.
10. I consent to the public filing of the technical report titled "Karowe Diamond Mine Botswana NI 43-101 Independent Technical Report (Amended)" dated 4th February 2014 (the “Technical Report”) by Lucara Diamond Corp. (the issuer). I also consent to any extracts from or a summary of the Technical Report being included in public disclosures by the issuer.
Dated this 4th day of February, 2014.
“John Francis Winchester Sexton” (signed and sealed)
The MSA Group (Pty) Ltd.
20B Rothesay Avenue
Craighall Park
Johannesburg
2196