Embed Size (px)
Citation preview
1
Global Climate Change: What the Future Holds, and What We Can Do About It
Dr. David KaroweProfessor, Department of Biological Sciences
Schedule of Topics
September 29: Recent climate change (Dave Karowe)
2
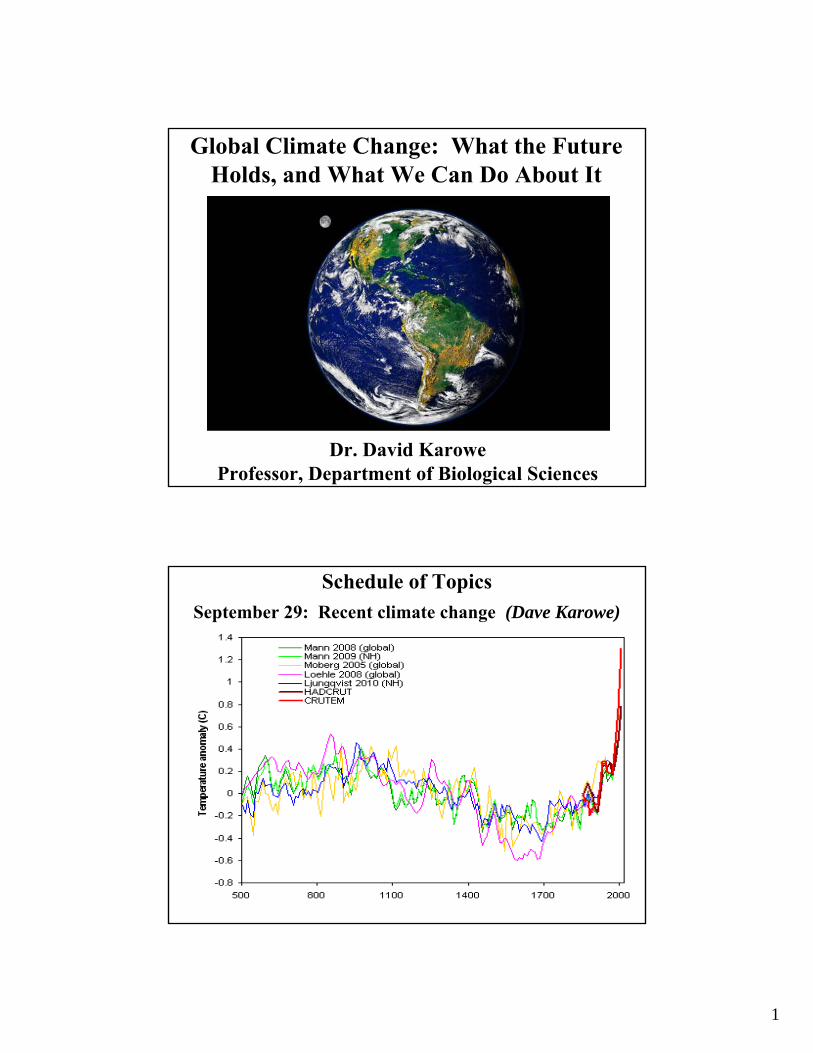
October 6: Future climate change (Dave Karowe)
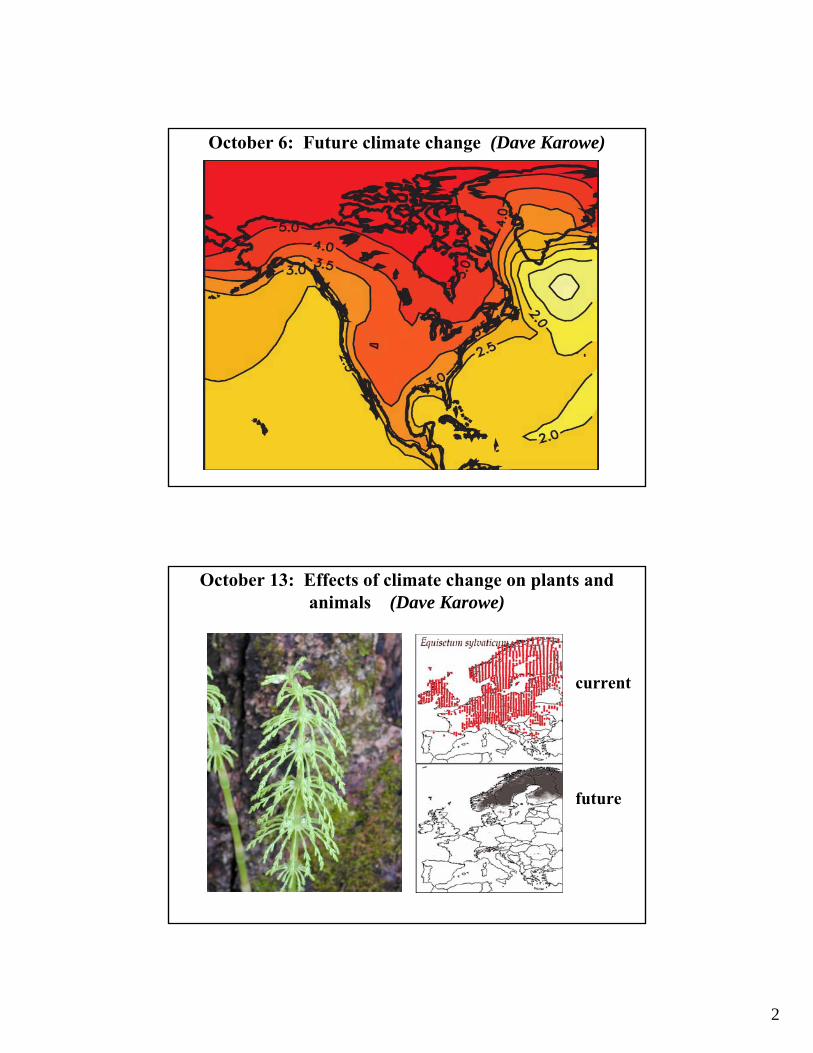
October 13: Effects of climate change on plants and animals (Dave Karowe)
current
future

3
October 20: Effects of climate change on aquatic ecosystems (Chuck Ide)
October 27: Effects of climate change on human health (Dave Karowe)

4
November 3: Economics of climate change (Dave Karowe)Skeptics arguments (Dave Karowe)
November 10: Biofuels, carbon capture and storage (Steve Bertman and Dave Barnes)

5
November 17: Wind, solar, and personal behaviors (John Patten and Dave Karowe)
Earth’s climate has always changed
Over the last billion years:
- but most or all large changes (≥2o C) have taken hundreds of thousands or millions of years
6
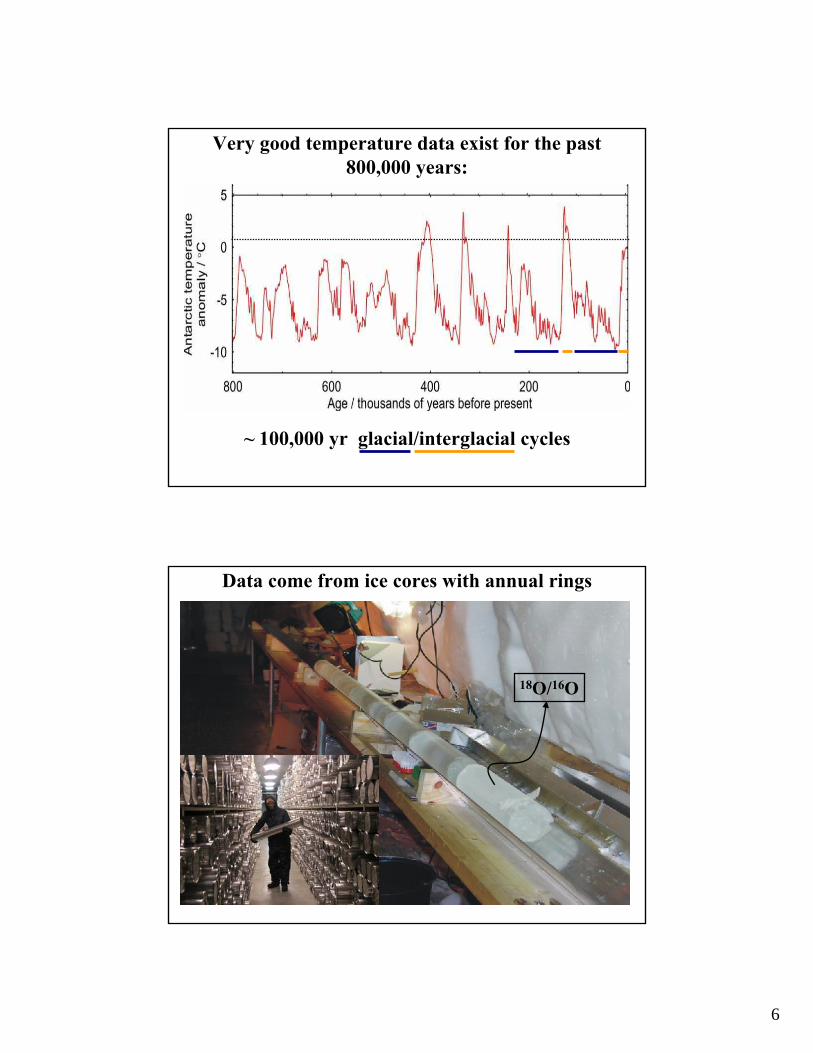
Very good temperature data exist for the past 800,000 years:
~ 100,000 yr glacial/interglacial cycles
Data come from ice cores with annual rings
18O/16O
7
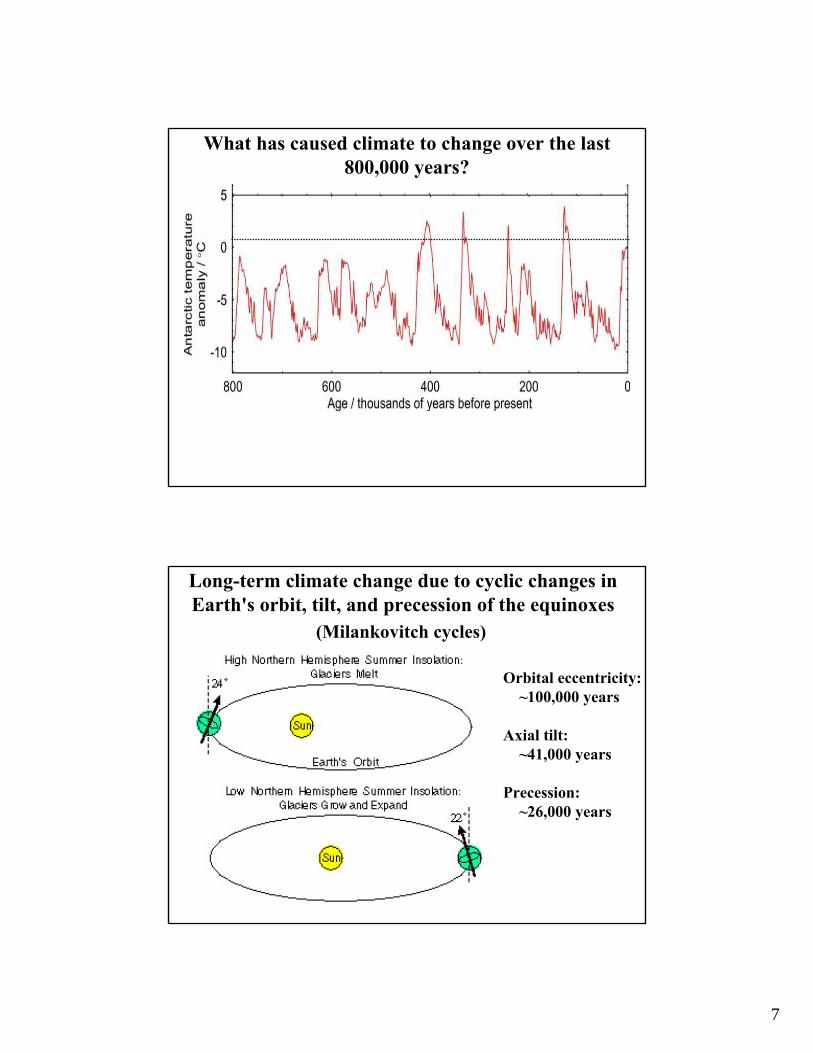
What has caused climate to change over the last 800,000 years?
Long-term climate change due to cyclic changes in Earth's orbit, tilt, and precession of the equinoxes
(Milankovitch cycles)
Orbital eccentricity:~100,000 years
Axial tilt:~41,000 years
Precession:~26,000 years
8
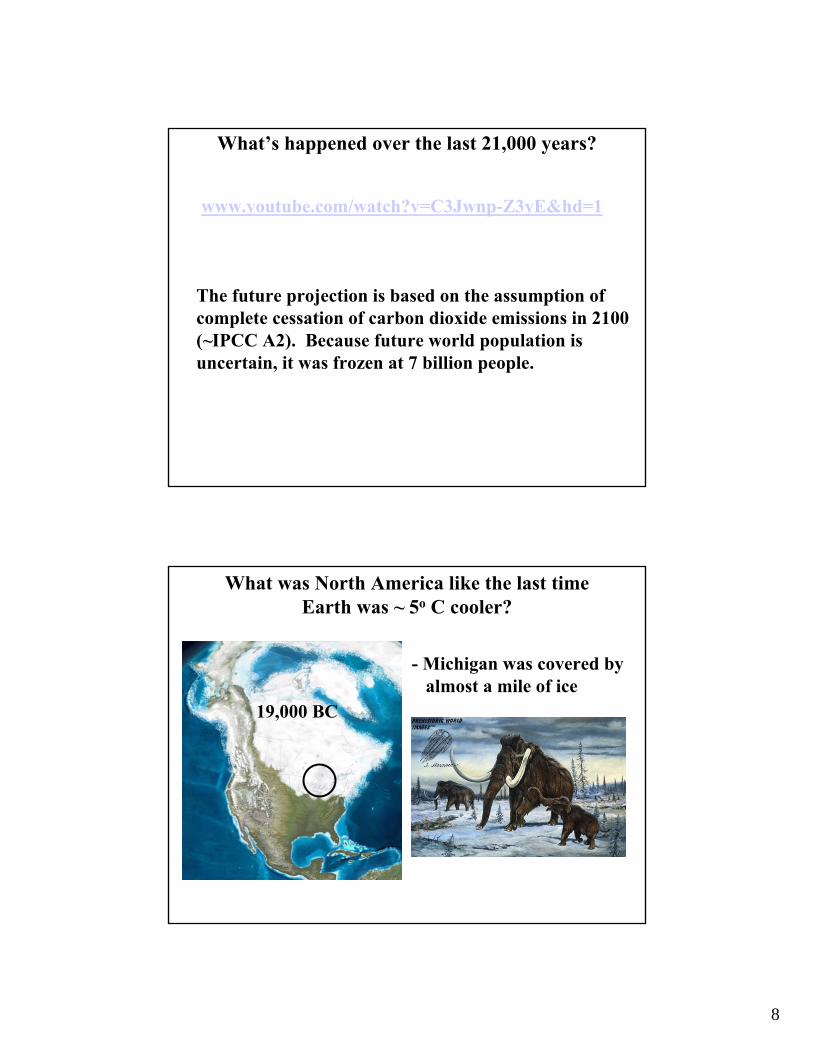
What’s happened over the last 21,000 years?
www.youtube.com/watch?v=C3Jwnp-Z3yE&hd=1
The future projection is based on the assumption of complete cessation of carbon dioxide emissions in 2100 (~IPCC A2). Because future world population is uncertain, it was frozen at 7 billion people.
What was North America like the last time Earth was ~ 5o C cooler?
- Michigan was covered by almost a mile of ice
19,000 BC
9
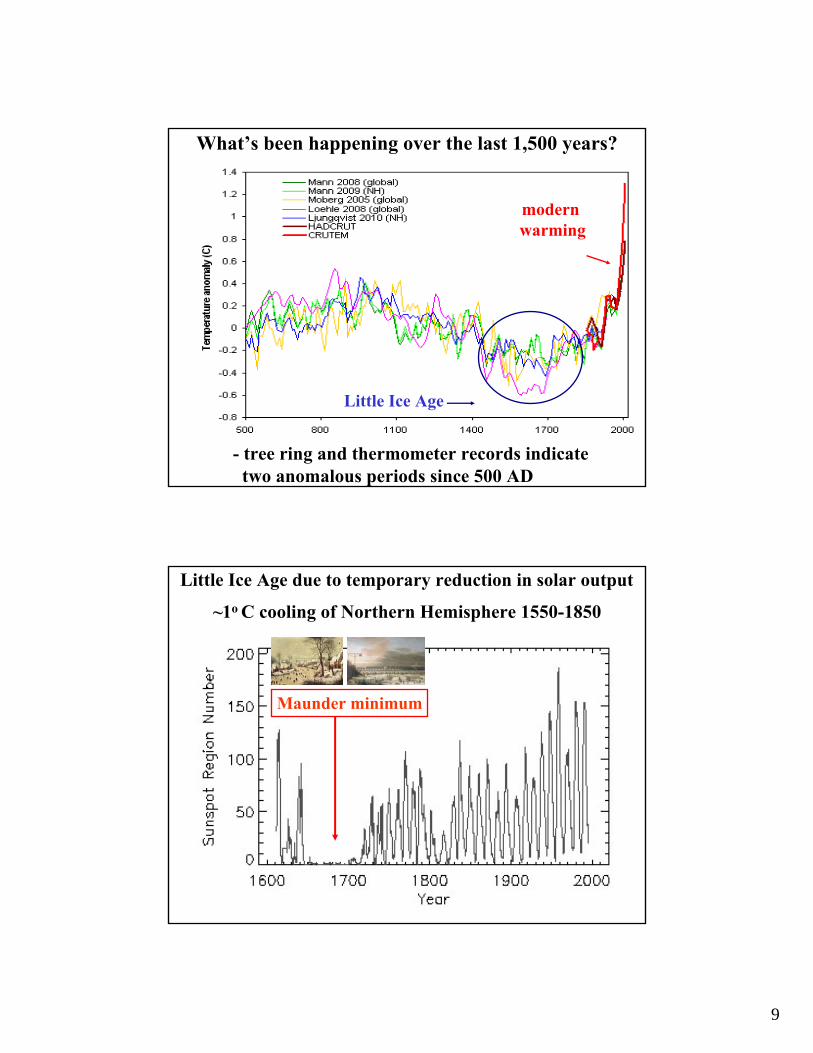
Little Ice Age
modern warming
What’s been happening over the last 1,500 years?
- tree ring and thermometer records indicate two anomalous periods since 500 AD
Maunder minimum
Little Ice Age due to temporary reduction in solar output
~1o C cooling of Northern Hemisphere 1550-1850

10
What’s been happening over the last 130 years?
modern warming
Tem
per
atu
re C
han
ge
(oC
) 10 warmest years in history: 2010, 2005, 2007, 2009, 1998*,
2007, 2002, 2003, 2004, and 2008
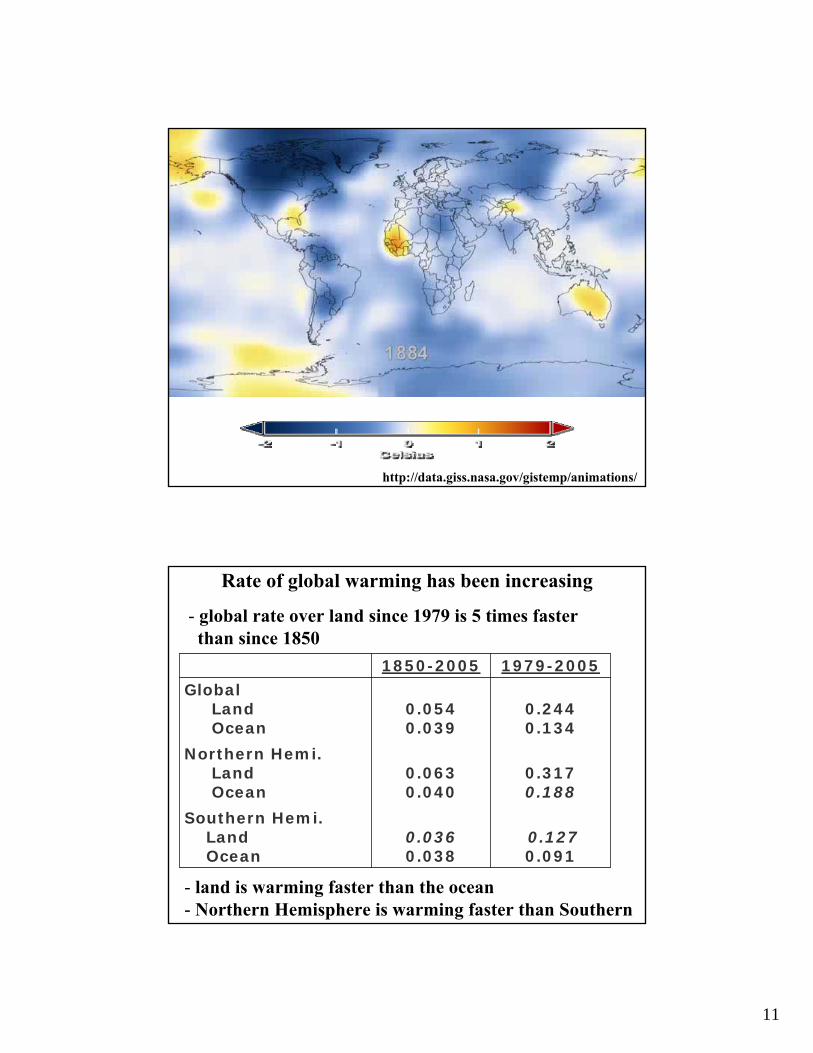
Since 1880, Earth has warmed ~ 0.8o C
11
Temperature difference relative to 1950-1980
http://data.giss.nasa.gov/gistemp/animations/
0.244 0.134
0.317 0.188
0.127 0.091
0.054 0.039
0.063 0.040
0.036 0.038
GlobalLandOcean
Northern Hemi.LandOcean
Southern Hemi. LandOcean
1979-20051850-2005
Rate of global warming has been increasing
- global rate over land since 1979 is 5 times faster than since 1850
- land is warming faster than the ocean- Northern Hemisphere is warming faster than Southern

12
Since 1900, greatest warming in northern North America, Asian interior, and southeastern Brazil
In Western Hemisphere, greatest warming in winter; in Eastern Hemisphere, greatest warming in spring
- but warming has occurred in all seasons

13
Temperature relative the 1951-1980 mean
Since 1979, Michigan has warmed by ~0.75 oC
- pronounced latitudinal pattern to recent warming
Arctic Antarctic peninsula
Temperature relative the 1951-1980 mean
Did 2010 feel like a particularly warm year?
- Michigan was ~0.75o C above the 1951-1980 mean

14
Last summer was Michigan’s 6th warmest on record
This summer was Michigan’s 18th warmest on record

15
Since 1900, no consistent trend in total global precipitation
But heavy precipitation events now account for a higher percent of total precipitation

16
Severe storms cause flooding, erosion, disease
Flooding has increased globally in the last 50 years
17
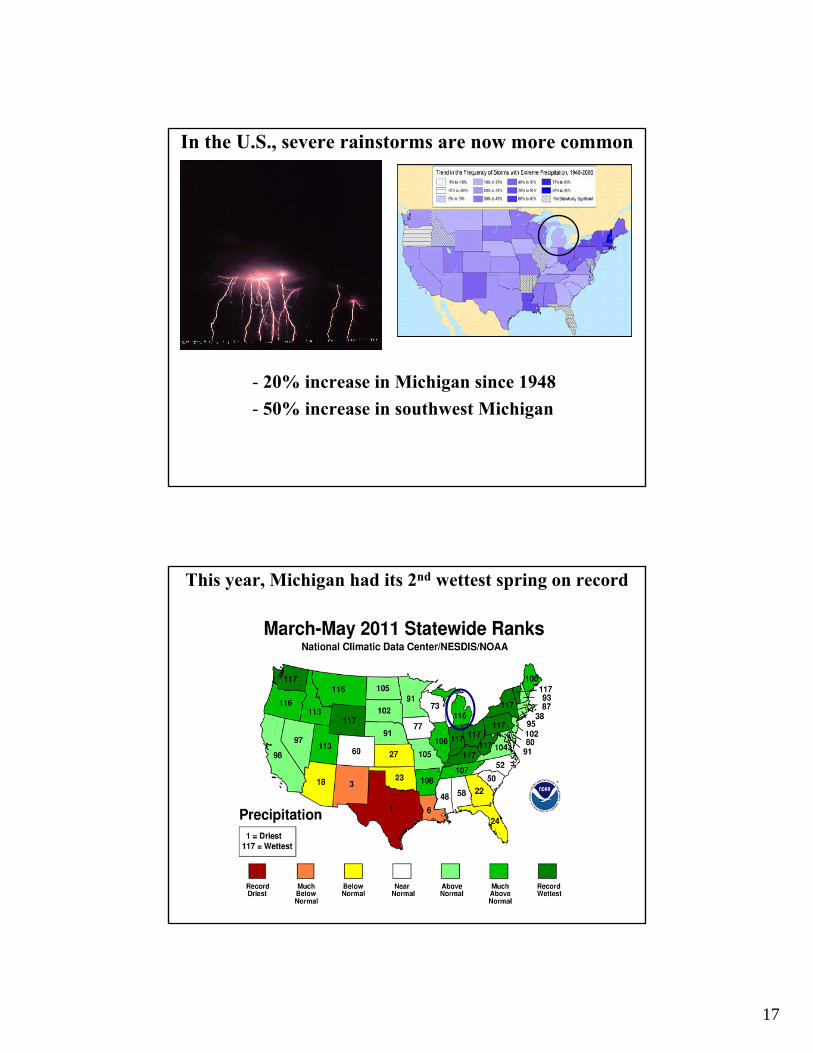
In the U.S., severe rainstorms are now more common
- 20% increase in Michigan since 1948
- 50% increase in southwest Michigan
This year, Michigan had its 2nd wettest spring on record
18
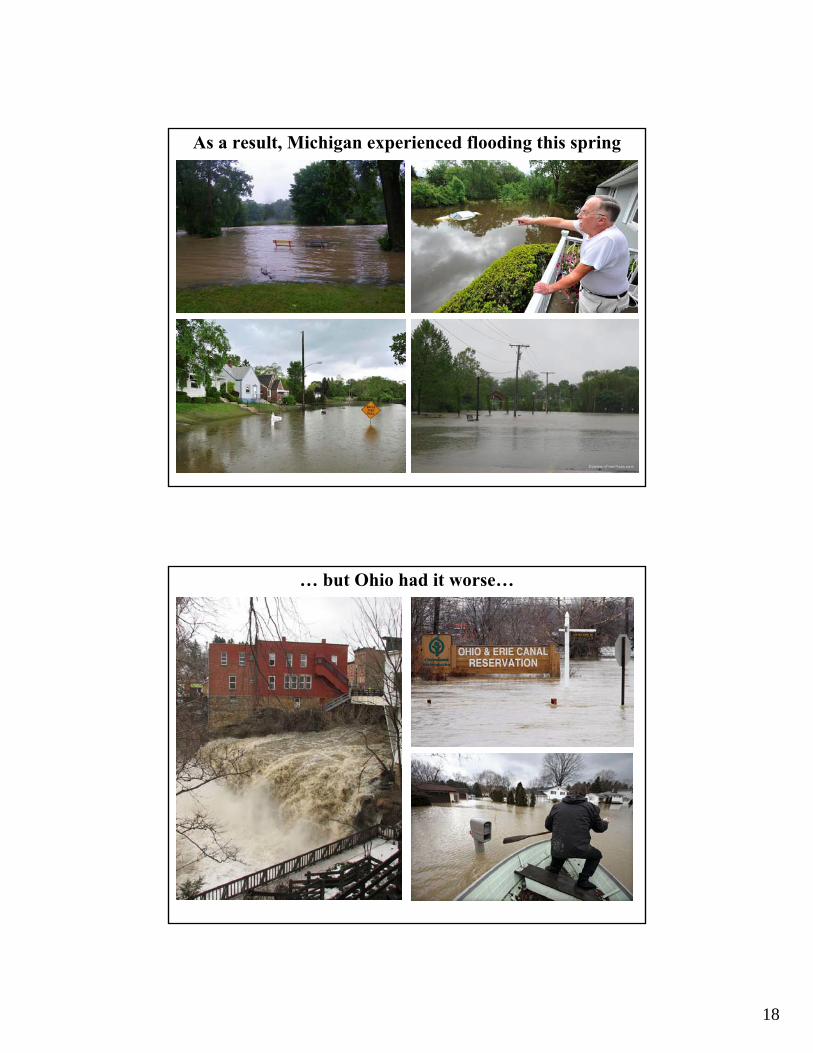
As a result, Michigan experienced flooding this spring
… but Ohio had it worse…

19
And there was extensive flooding along Mississippi
Tunica, Mississippi
Droughts have also increased, especially since 1950
- droughts are more widespread because of warmingsince 1950
20
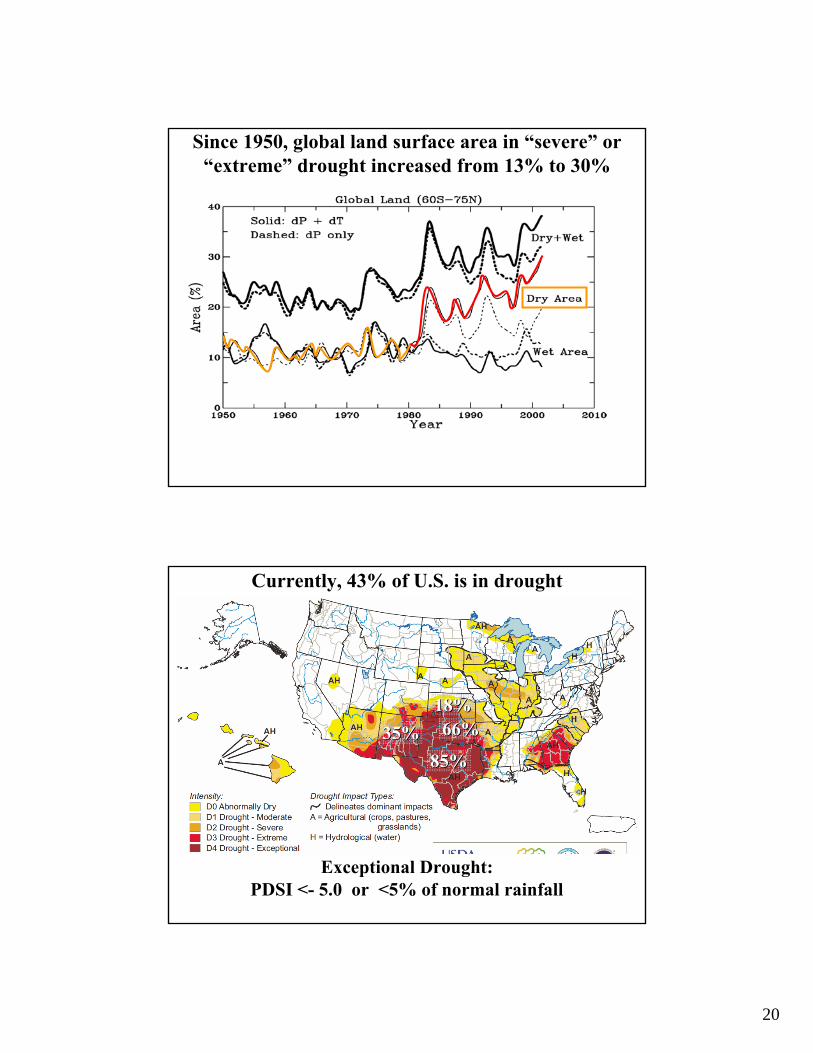
Since 1950, global land surface area in “severe” or “extreme” drought increased from 13% to 30%
Currently, 43% of U.S. is in drought
Exceptional Drought: PDSI <- 5.0 or <5% of normal rainfall
35% 35%
18% 18% 66% 66%
85% 85%
21
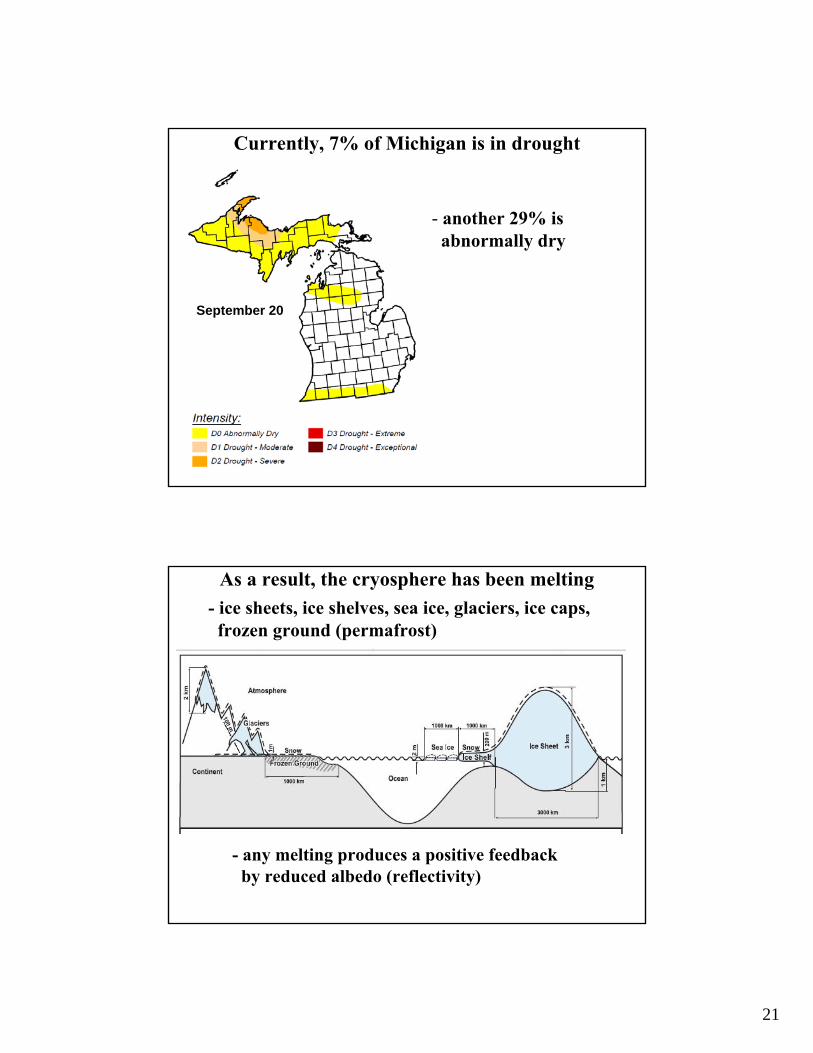
Currently, 7% of Michigan is in drought
- another 29% isabnormally dry
September 20
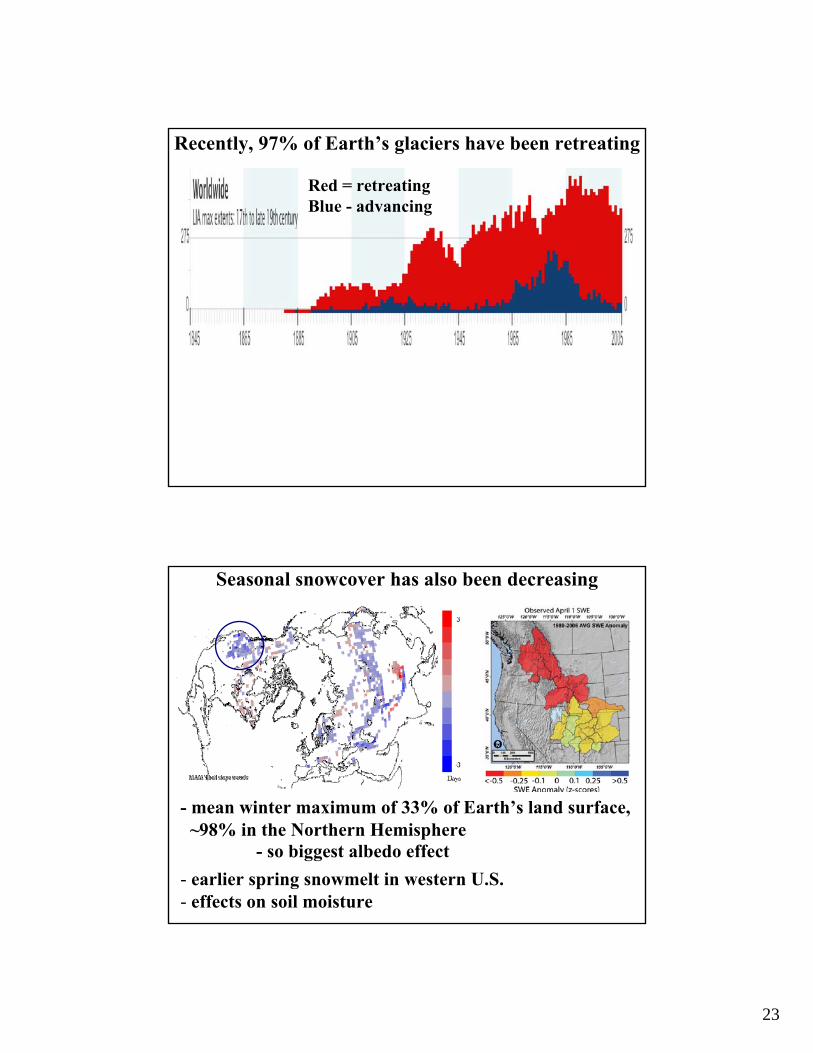
As a result, the cryosphere has been melting
- any melting produces a positive feedback by reduced albedo (reflectivity)
- ice sheets, ice shelves, sea ice, glaciers, ice caps, frozen ground (permafrost)

22
Arctic summer sea ice extent (area) has been decreasing by up to 10% per decade
- record low in 2007
- thickness has decreased by >40% since 1960
http://nsidc.org/sotc/sea_ice_animation.html
Glaciers have been retreating worldwide
- ice loss from 30 ‘reference’ glaciers from 1996-2005 was twice as fast as the previous decade, and four times as fast as thedecade before that (1976-1985)
1978 2000
23
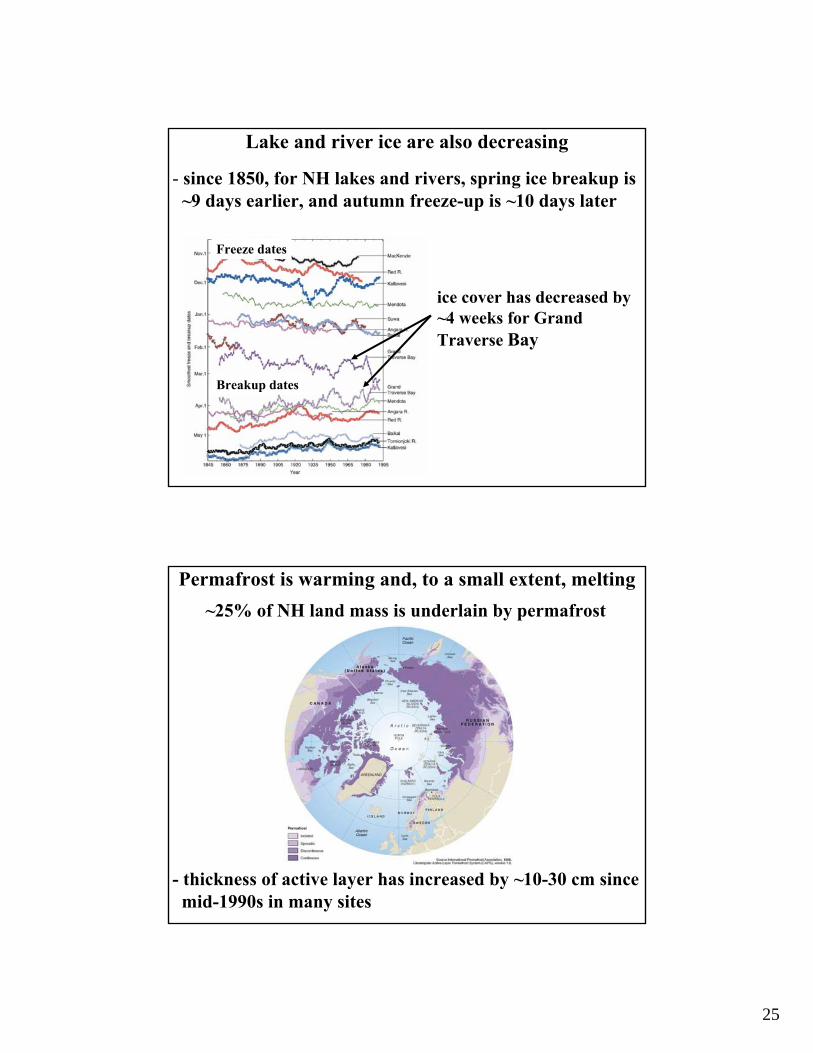
Red = retreatingBlue - advancing
Recently, 97% of Earth’s glaciers have been retreating
Seasonal snowcover has also been decreasing
- mean winter maximum of 33% of Earth’s land surface, ~98% in the Northern Hemisphere
- so biggest albedo effect
- earlier spring snowmelt in western U.S. - effects on soil moisture

24
Greenland ice sheet is melting at an accelerating rate
- meltwater also accelerates ice slippage into ocean
Antarctic ice shelves are shattering
- recent collapse of Wilkins Ice Shelf
25
Lake and river ice are also decreasing
- since 1850, for NH lakes and rivers, spring ice breakup is ~9 days earlier, and autumn freeze-up is ~10 days later
ice cover has decreased by ~4 weeks for Grand Traverse Bay
Freeze dates
Breakup dates
Permafrost is warming and, to a small extent, melting
~25% of NH land mass is underlain by permafrost
- thickness of active layer has increased by ~10-30 cm sincemid-1990s in many sites

26
Warming is detectable to ~40 meters in many places
Can climate change be due to “natural variation”?
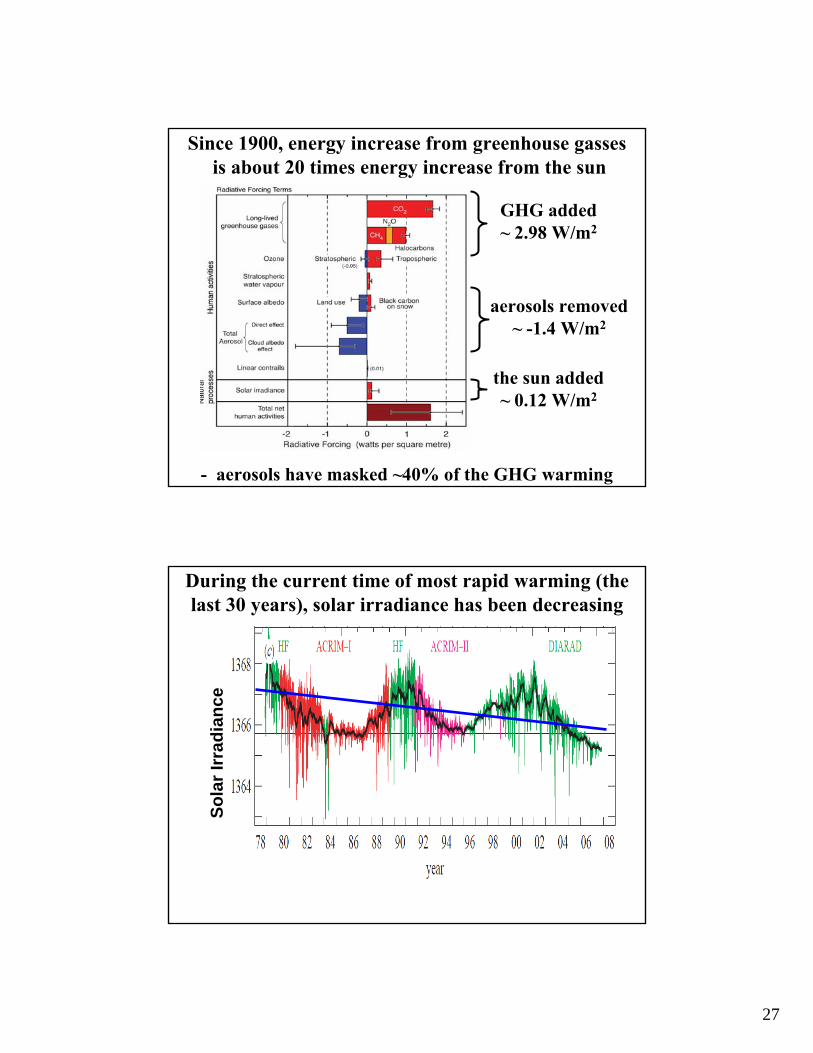
Since 1900, energy increase from greenhouse gassesis about 20 times energy increase from the sun
27
- aerosols have masked ~40% of the GHG warming
GHG added ~ 2.98 W/m2
aerosols removed ~ -1.4 W/m2
the sun added ~ 0.12 W/m2
Since 1900, energy increase from greenhouse gassesis about 20 times energy increase from the sun
During the current time of most rapid warming (the last 30 years), solar irradiance has been decreasing
So
lar
Irra
dia
nce

28
“natural variation” would most likely have caused a slight cooling since 1900
Finally, models do a good job of replicating past climate change only if they use anthropogenic forcings
So what’s really causing current warming?Greenhouse gasses
GHGs let visible wavelengths pass, but absorb and re-radiate IR (heat)
Some greenhouse effect is necessaryfor life on Earth
29
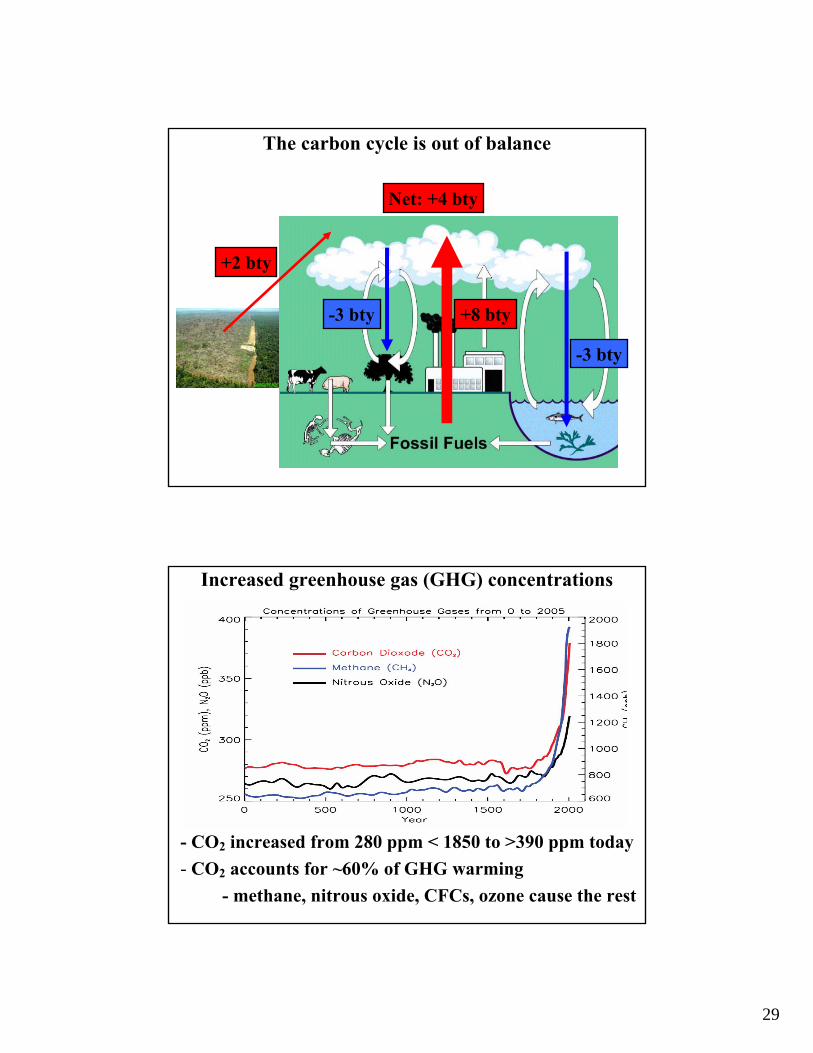
The carbon cycle is out of balance
Net: +4 bty
-3 bty
+8 bty
+2 bty
-3 bty
Increased greenhouse gas (GHG) concentrations
- CO2 increased from 280 ppm < 1850 to >390 ppm today
- CO2 accounts for ~60% of GHG warming
- methane, nitrous oxide, CFCs, ozone cause the rest
30
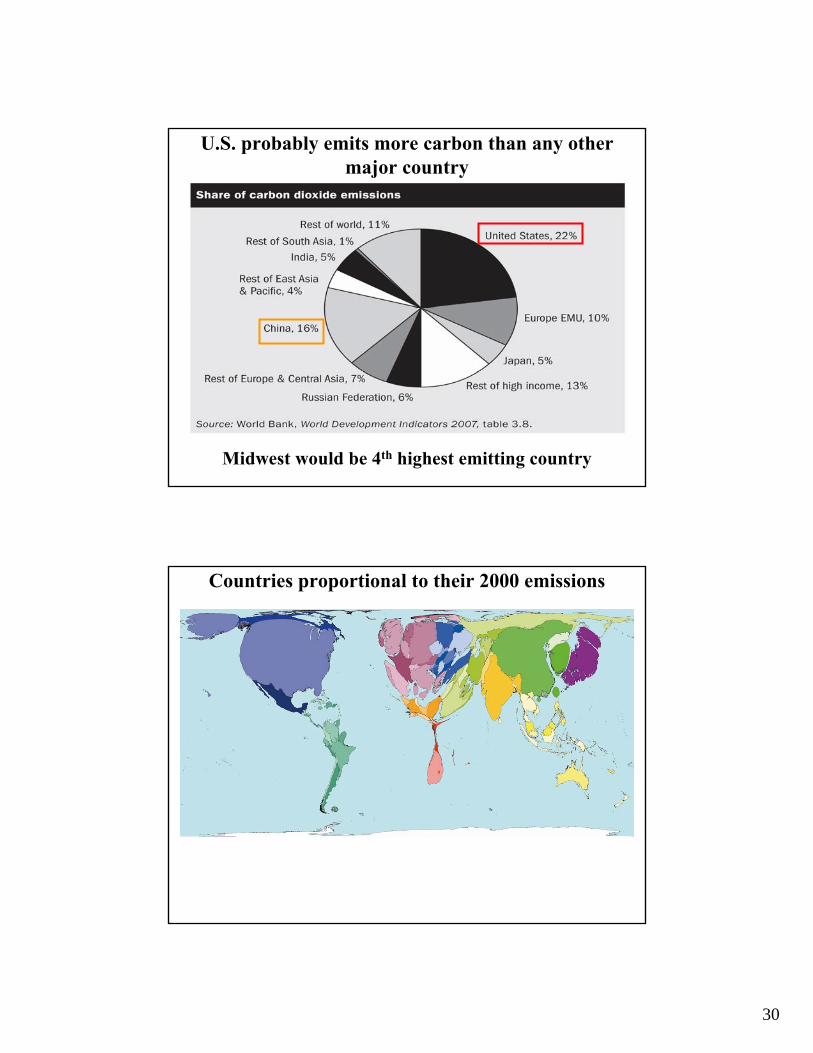
U.S. probably emits more carbon than any other major country
Midwest would be 4th highest emitting country
Countries proportional to their 2000 emissions

31
U.S. also emits the most carbon per capita
Residential and transportation sectors account for about half of US energy consumption
(~80% cars and trucks)
(~80% heating and appliances)
32
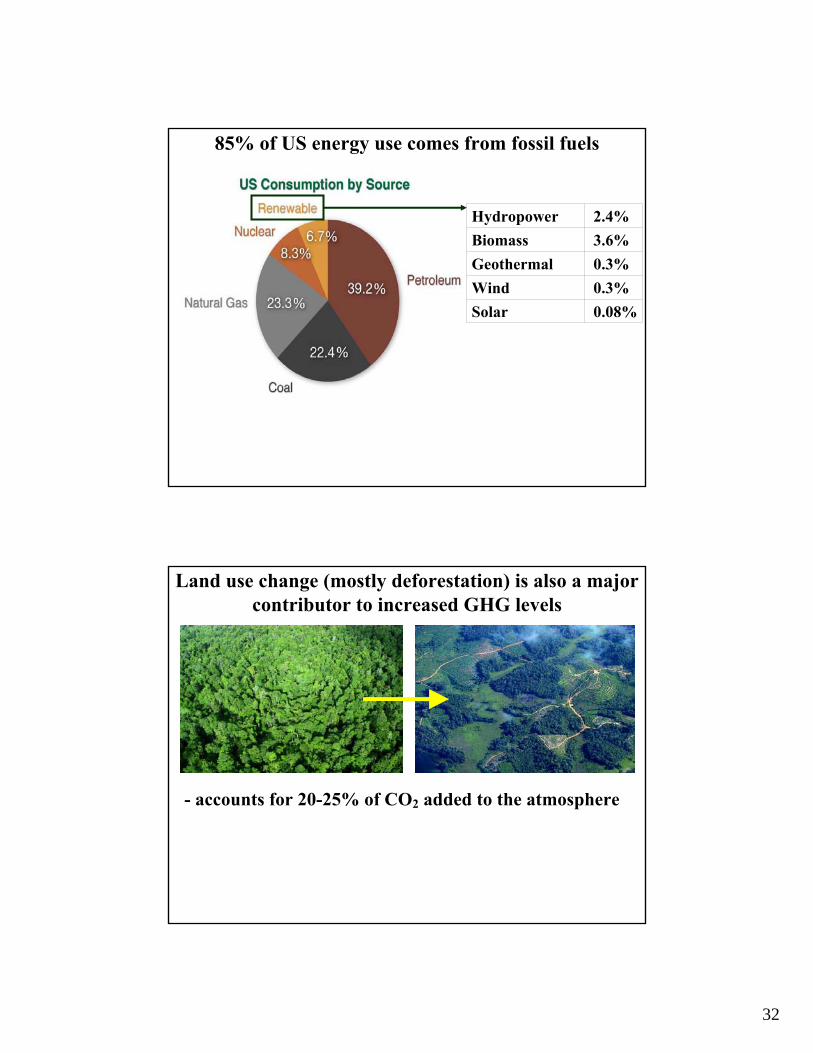
85% of US energy use comes from fossil fuels
0.08%Solar
0.3%Wind
0.3%Geothermal
3.6%Biomass
2.4%Hydropower
Land use change (mostly deforestation) is also a major contributor to increased GHG levels
- accounts for 20-25% of CO2 added to the atmosphere

33
Best estimate: ~95% of current warming is due to human activities
DeforestationGreenhouse gas emissions