Embed Size (px)
Citation preview

The State of Agriculture in GhanaKarl PauwTowards Agricultural Innovation in Ghana: An Evidence-Based Approach9 May 2018, Accra

Presentation overview
• Economic growth & the role of agriculture
• Agricultural productivity
• Markets, trade & agribusiness
• Concluding thoughts on research & policy implications

Economic growth & the role of agriculture

Ghana’s growth performance: 2007–2013 • Rapid growth 2007–2010
(7.3%), driven largely by services sector growth
• Accelerated further during 2010–2013 (10.2%) on the back of the “oil boom”
Source: MoF (2018)
0%
2%
4%
6%
8%
10%
12%
0%
10%
20%
30%
40%
50%
60%
70%
80%
90%
100%
2007-10 2010-13 2013-17 2017-21*
Ave
rage
gro
wth
rat
e (%
)
Sect
or
con
trib
uti
on
to
GD
P g
row
th (
%)
Growth rates and shares
Agriculture share Industry share
Services share GDP growth

Ghana’s growth performance: 2013–2017
• Growth slowed to 4.8%. Why? ‒ Gold and crude oil price collapse
‒ Govt. foreign debt (Younger 2016)
• Result: ‒ Double-digit inflation during 2012–
2018
‒ Sharp exchange rate depreciation
‒ Rising recurrent budget share0
20
40
60
80
100
120
140
160
Jun
-12
Jan
-13
Au
g-1
3
Mar
-14
Oct
-14
May
-15
Dec
-15
Jul-
16
Feb
-17
Sep
-17
Ind
ex
Global commodity price trends(Index: June 2012 = 100)
Cocoa
Gold
Crude
Source: IndexMundi (2018)

Agricultural growth performance
• Agricultural growth lagged national GDP growth
‒ Last achieved 6.0% CAADP target during 2008–2009
‒ Averaged only 3.3% per annum since 2010
• Agriculture’s contribution to national GDP growth disproportionately low
Source: MoF (2018)
0%
2%
4%
6%
8%
10%
12%
0%
10%
20%
30%
40%
50%
60%
70%
80%
90%
100%
2007-10 2010-13 2013-17 2017-21*
Ave
rage
gro
wth
rat
e (%
)
Sect
or
con
trib
uti
on
to
GD
P g
row
th (
%)
Growth rates and shares
Agriculture share Industry share Services share
GDP growth Agric GDP growth
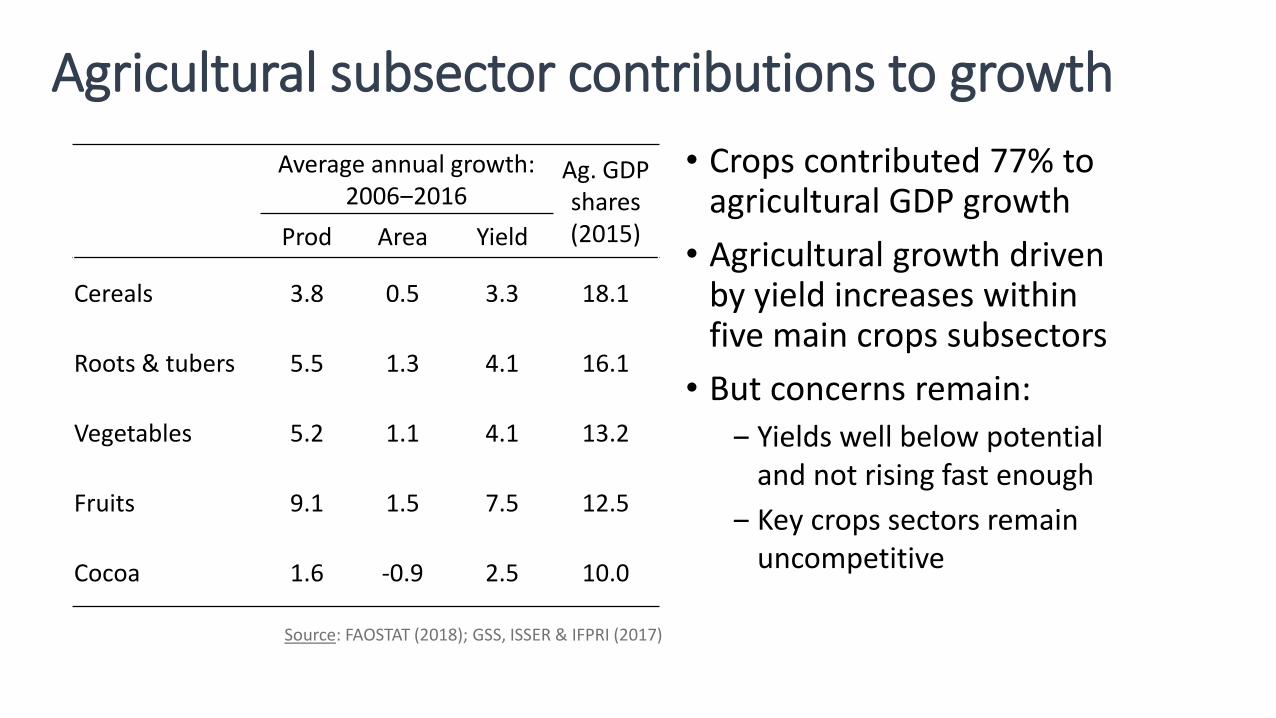
Agricultural subsector contributions to growth
Average annual growth: 2006‒2016
Ag. GDP shares (2015)Prod Area Yield
Cereals 3.8 0.5 3.3 18.1
Roots & tubers 5.5 1.3 4.1 16.1
Vegetables 5.2 1.1 4.1 13.2
Fruits 9.1 1.5 7.5 12.5
Cocoa 1.6 -0.9 2.5 10.0
Source: FAOSTAT (2018); GSS, ISSER & IFPRI (2017)
• Crops contributed 77% to agricultural GDP growth
• Agricultural growth driven by yield increases within five main crops subsectors
• But concerns remain: ‒ Yields well below potential
and not rising fast enough
‒ Key crops sectors remain uncompetitive

Growth outlook: 2018–2021
• Stronger growth
forecasted (6.2%)
• However, lack of economic
diversification a concern
(ISSER 2017)
• Agricultural growth
expected to recover (5.2%)
due to anticipated yield
increases
0%
2%
4%
6%
8%
10%
12%
0%
10%
20%
30%
40%
50%
60%
70%
80%
90%
100%
2007-10 2010-13 2013-17 2017-21*
Ave
rage
gro
wth
rat
e (%
)
Sect
or
con
trib
uti
on
to
GD
P g
row
th (
%)
Growth rates and shares
Agriculture share Industry share
Services share GDP growth

Agricultural productivity
Credit: VisualHunt

Labor productivity identity
𝑌
𝐿=𝑌
𝐴∗𝐴
𝐿
• Labor productivity Τ𝑌 𝐿 requires growth in land productivity Τ𝑌 𝐴 or an increase in land per worker Τ𝐴 𝐿
• Ghana: declining agriculture labor share has helped, but gains offset by low productivity growth
→ Reflects slow rate of technology adoption & soil fertility challenges (Jayne et al. 2015)
Labor productivity
Land productivity (yield)
Land availability per worker
Technology adoption
• Evidence is mixed and circumstantial, but generally modern seed and
fertilizer application has benefits; for example:
‒ Yields (profits) of imported hybrid maize seeds (Adikanfo) are 57% (37%)
higher than those of the commonly used OPV (Obaatanpa) (Van Asselt et al.
2018)
‒ Other countries with similar agroecological conditions have raised yields
substantially through technology adoption (Ragasa et al. 2014)
• Despite this, Ghana adoption rates remain low:
‒ Only 5% of farmers use hybrid seeds; varieties are outdated
‒ Fertilizer application rates around 13kg/ha (Houssou et al. 2017)

Why do farmers underinvest?
• The “usual suspects” include: ‒ Cost of inputs (incl. labor): resource or credit constraints‒ Risk and uncertainty: market price risk, production shocks‒ Supply-side factors: availability or authenticity of seed or fertilizer
• Research can aid our understanding; for example‒ Farmers who received weather insurance spent more on inputs than those
who received cash grants (Karlan et al. 2014)‒ Exposure to (successful) technologies often an important determinant of
adoption (Van Asselt et al. 2018b; Fosu et al. 2018)‒ Yield penalties for now following recommended practices, e.g., seed and
fertilizer use, weeding and refilling, pest management, or natural resource management

Do subsidies encourage fertilizer adoption?
• Fertilizer use in Ghana sensitive to subsidy program budget... in both directions
• Fertilizer demand is a question about value-cost ratio (VCR)
0
50
100
150
0
100
200
300
400
500
2008 2009 2010 2011 2012 2013 2014 2015 2016 Sub
sid
y co
st (
GH
¢ m
illio
ns)
Qu
anti
ty (
mt
tho
usa
nd
s)
Fertilizer use & FSP costs
Total fertilizer use Government subsidy cost
𝑉𝐶𝑅 =𝑃𝑀𝑃𝐹
× 𝐹𝑈𝐸
• Sustained fertilizer demand typically requires VCR ≥ 2 (Crawford & Kelly 2002)
• Fertilizer subsidy programs (FSPs) are an “easy” policy response, but sustainability is determined by FUE

Fertilizer value-cost ratios (VCRs) in Ghana
0
1
2
3
4
5
6
No subsidy 50% subsidy
VCR in 2017
Low response High response
• Theoretically, FUE around 20kg grain/kg N; likely range on farmer-managed fields is 8–16kg (Jayne et al. 2015)
• VCR < 2 at unsubsidized prices & low response rates; VCR > 2 at subsidized prices: inefficient farmers also encouraged to purchase fertilizer
• Long-run sustainability of FSPs requires improvements in FUE. How?
‒ Soil- and (crop-) specific fertilizer recommendations given varying soil types across agroecological zones (Chapoto & Tetteh 2014)
‒ Complementary soil and water conservation practices, e.g., crop rotation, use of organic matter, etc. (Marenya& Barret 2009)
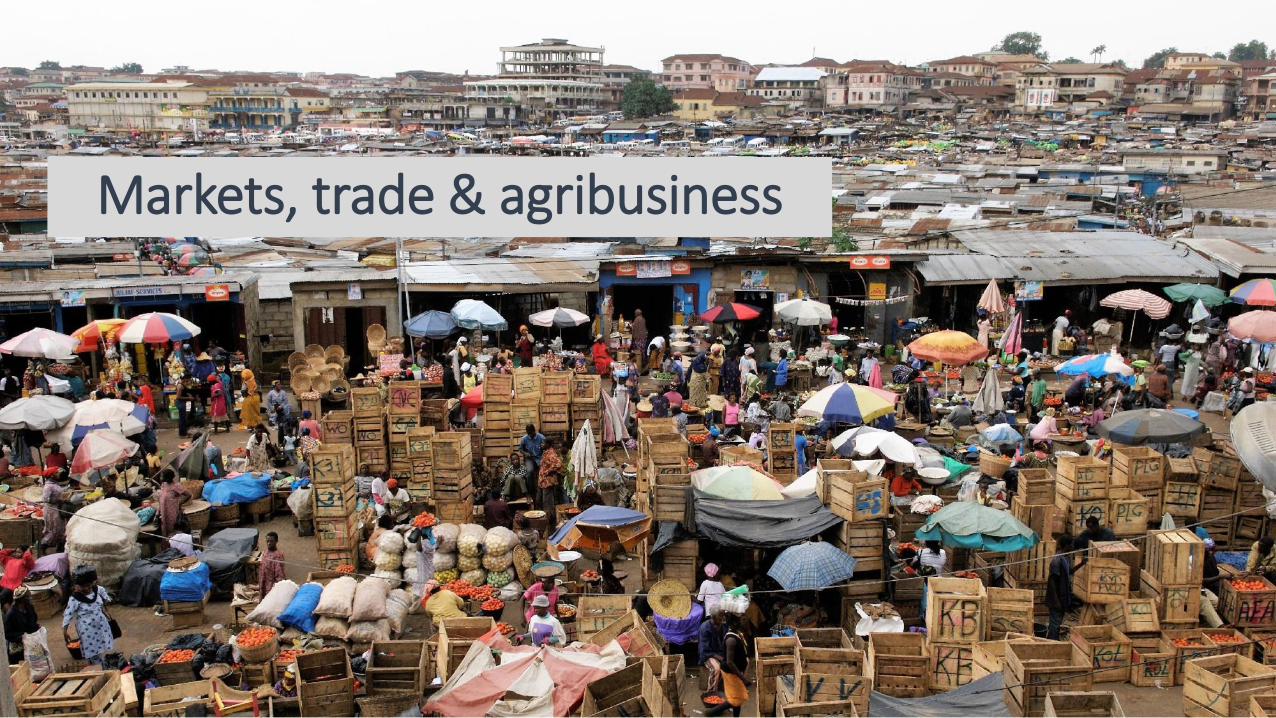
Markets, trade & agribusiness

Africa’s changing food system• Growing urban middle class increasingly demands higher quality processed
foods (Tschirley et al. 2015); consumption among urban poor shifting to cheap convenience foods (Dixon et al. 2007)
• Dietary shifts regarded by some as an opportunity to expand and modernize African food industries
• Yet, food needs increasingly met through imports (Rakotoarisoa et al. 2012). Why?
‒ Slow pace of sustainable agricultural intensification (Binswanger-Mkhize and Savastano 2017)
‒ Compliance with food safety or quality standards (Hensen and Jaffee 2006)‒ Barriers to enter urban food markets (Ngeleza and Robinson 2013) ‒ Logistical challenges (Demont et al. 2017) and the poor business climate (Gelb
et al. 2014)

Ghana food trade: is the deficit rising?
• Food imports tripled (GH¢ 1.5–4.5bn) during 2009–2013 (GSS 2014)
• Imports make up 8-14% of primary agricultural products; 47% of agroprocessing products (Arndt and Hartley 2017)
• Even basic food commodities among top-ten imported items, i.e., milled rice, poultry products, sugar, and tomato paste (GSS 2014); not counting significant quantities of fresh produce entering informally from neighboring countries (Van Asselt et al. 2018c)
• Food and agricultural exports also rising such that the official trade deficit is negligible, but if we exclude cocoa and account for informal food trade, the deficit appears to be growing

Lessons from a vegetable competitiveness study
• Although yields are low, vegetable production is profitable, even more than cereals (Van Asselt et al. 2018c)
• Ghana has the potential to meet its own demand, but depends extensively on imported fresh produce. Why?
‒ Competitiveness: inappropriate or less-preferred varieties linked to inadequate research system
‒ Seasonality: production not year-round, even under irrigation; but this is also an opportunity
‒ Market access: agents control access, especially in certain value chains; but does this reduce competition or strengthen market structure?

Lessons from agribusiness studies
• Survey of food processing firms shows 23% left the industry & most others shed jobs during 2014–2017 (Andam & Asante 2018)
• Poultry and aquaculture business face challenges: ‒ Productivity constraints along the entire value chain (including feeds); chicken
meat production costs double that of competitors (Andam et al. 2017)
‒ Local tilapia production expanded 25-fold in a decade, but fish varieties and feed costs lead to price increases and lack of demand (Ragasa et al. 2018)
• Quality differences between imported and local rice means demand increases met almost exclusively by imports (Ayeduvor 2018)
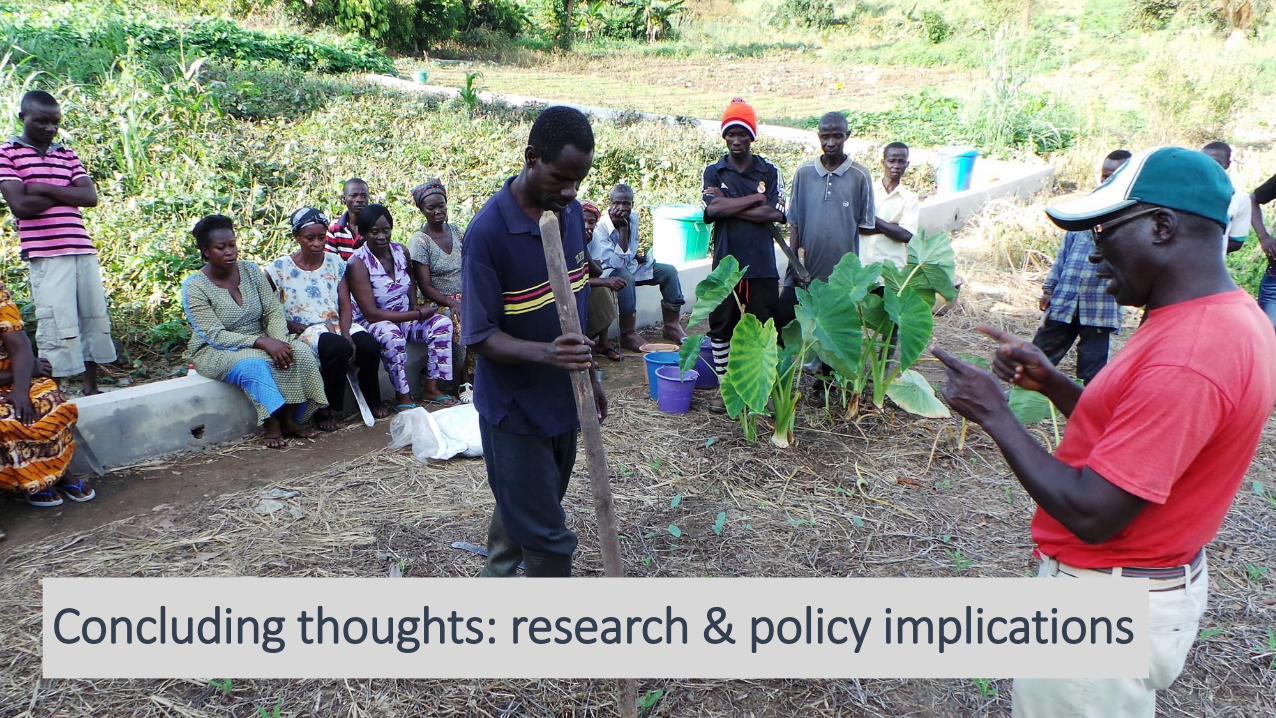
Concluding thoughts: research & policy implications

Many additional important topics…
• Talked about technology adoption and value chain development; several additional topics will be addressed at this conference:
‒ Extension services & agronomic practices
‒ Insurance & credit markets
‒ Contract farming & market linkages
‒ Land tenure & investments
• Other important topics include‒ Agriculture-nutrition linkages
‒ Food safety & trade
‒ Public agricultural investments
‒ Governance & service delivery
Ghana, Burkina Faso, Kenya, Zambia

In summary…
• Slow agricultural productivity growth continues to constrain farm income growth
• Low yields associated with limited technology adoption & poor soils
• Trade and agroprocessing also constrained: infrastructure; market access; intermediate input supplies; costs of doing business; etc.
• Increased reliance on food imports, even for basic foodstuffs
• Raises concerns about the pace and nature of agricultural and economic transformation in Ghana
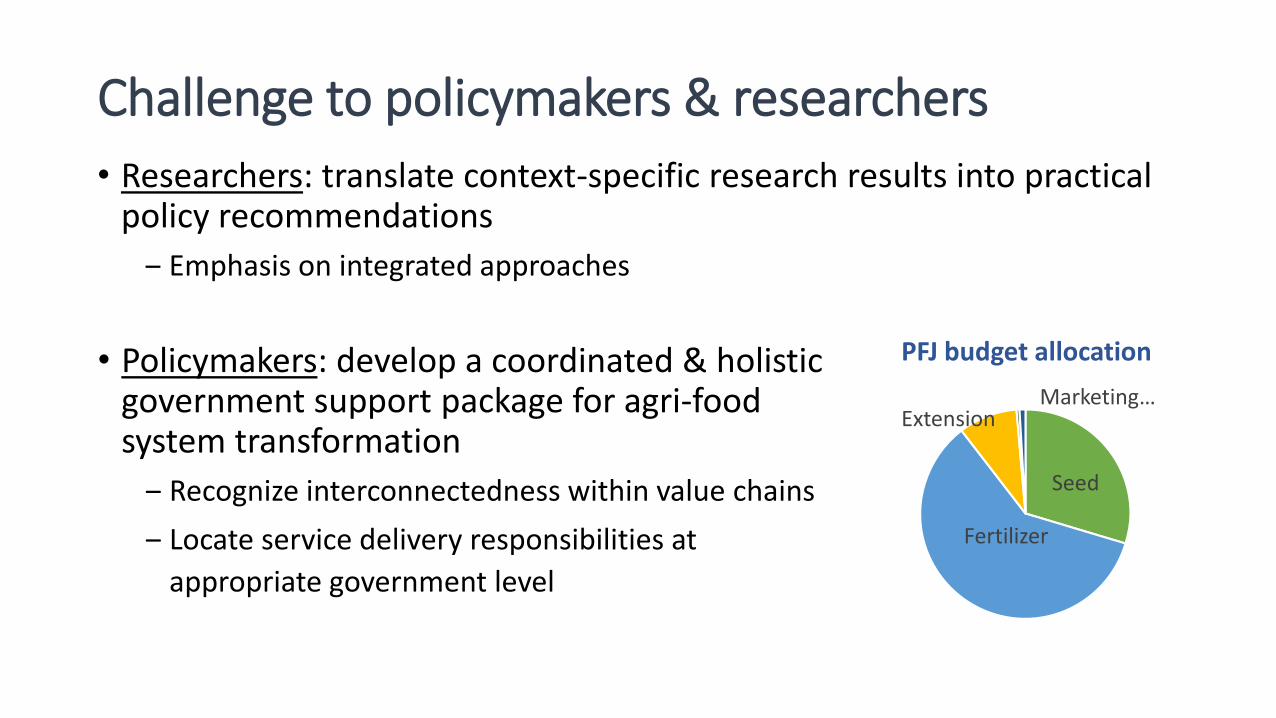
Challenge to policymakers & researchers
• Policymakers: develop a coordinated & holistic government support package for agri-food system transformation
‒ Recognize interconnectedness within value chains
‒ Locate service delivery responsibilities at
appropriate government level
Seed
Fertilizer
ExtensionMarketing…
PFJ budget allocation
• Researchers: translate context-specific research results into practical policy recommendations
‒ Emphasis on integrated approaches

Credit (all images): VisualHunt
http://gssp.ifpri.info


![A Theoretical Study on Van Der Pauw Measurement …The van der Pauw method [1] is one of the most util-ized measurement methods for the evaluation of electri-cal properties in semiconductor](https://img.pdfslide.us/doc/110x75/5e339665516e6a41a877a6fa/a-theoretical-study-on-van-der-pauw-measurement-the-van-der-pauw-method-1-is-one.jpg)