Embed Size (px)
Citation preview
BurnVoir Corporate Finance Limited
BurnVoir Company Research 6 November 2016
Kalium Lakes Limited.
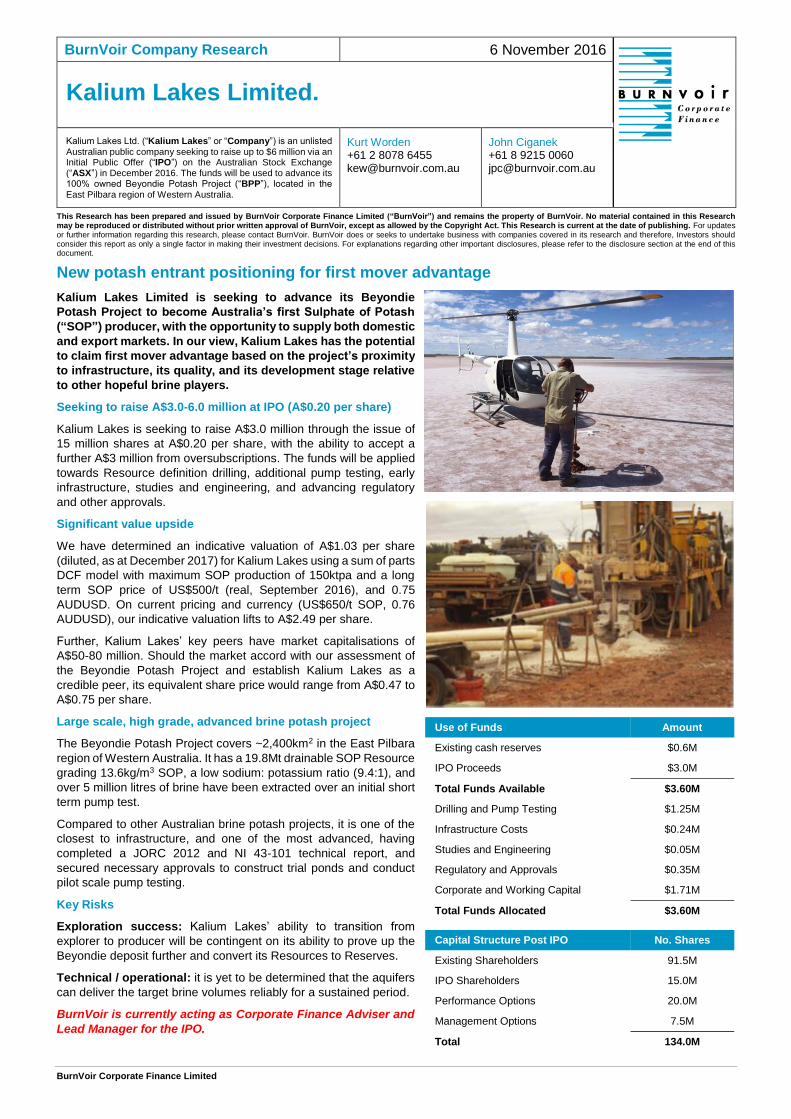
Kalium Lakes Ltd. (“Kalium Lakes” or “Company”) is an unlisted Australian public company seeking to raise up to $6 million via an Initial Public Offer (“IPO”) on the Australian Stock Exchange (“ASX”) in December 2016. The funds will be used to advance its 100% owned Beyondie Potash Project (“BPP”), located in the East Pilbara region of Western Australia.
Kurt Worden +61 2 8078 6455 [email protected]
John Ciganek +61 8 9215 0060 [email protected]
This Research has been prepared and issued by BurnVoir Corporate Finance Limited (“BurnVoir”) and remains the property of BurnVoir. No material contained in this Research may be reproduced or distributed without prior written approval of BurnVoir, except as allowed by the Copyright Act. This Research is current at the date of publishing. For updates or further information regarding this research, please contact BurnVoir. BurnVoir does or seeks to undertake business with companies covered in its research and therefore, Investors should consider this report as only a single factor in making their investment decisions. For explanations regarding other important disclosures, please refer to the disclosure section at the end of this document.
New potash entrant positioning for first mover advantage
Kalium Lakes Limited is seeking to advance its Beyondie
Potash Project to become Australia’s first Sulphate of Potash
(“SOP”) producer, with the opportunity to supply both domestic
and export markets. In our view, Kalium Lakes has the potential
to claim first mover advantage based on the project’s proximity
to infrastructure, its quality, and its development stage relative
to other hopeful brine players.
Seeking to raise A$3.0-6.0 million at IPO (A$0.20 per share)
Kalium Lakes is seeking to raise A$3.0 million through the issue of
15 million shares at A$0.20 per share, with the ability to accept a
further A$3 million from oversubscriptions. The funds will be applied
towards Resource definition drilling, additional pump testing, early
infrastructure, studies and engineering, and advancing regulatory
and other approvals.
Significant value upside
We have determined an indicative valuation of A$1.03 per share
(diluted, as at December 2017) for Kalium Lakes using a sum of parts
DCF model with maximum SOP production of 150ktpa and a long
term SOP price of US$500/t (real, September 2016), and 0.75
AUDUSD. On current pricing and currency (US$650/t SOP, 0.76
AUDUSD), our indicative valuation lifts to A$2.49 per share.
Further, Kalium Lakes’ key peers have market capitalisations of
A$50-80 million. Should the market accord with our assessment of
the Beyondie Potash Project and establish Kalium Lakes as a
credible peer, its equivalent share price would range from A$0.47 to
A$0.75 per share.
Large scale, high grade, advanced brine potash project
The Beyondie Potash Project covers ~2,400km2 in the East Pilbara
region of Western Australia. It has a 19.8Mt drainable SOP Resource
grading 13.6kg/m3 SOP, a low sodium: potassium ratio (9.4:1), and
over 5 million litres of brine have been extracted over an initial short
term pump test.
Compared to other Australian brine potash projects, it is one of the
closest to infrastructure, and one of the most advanced, having
completed a JORC 2012 and NI 43-101 technical report, and
secured necessary approvals to construct trial ponds and conduct
pilot scale pump testing.
Key Risks
Exploration success: Kalium Lakes’ ability to transition from
explorer to producer will be contingent on its ability to prove up the
Beyondie deposit further and convert its Resources to Reserves.
Technical / operational: it is yet to be determined that the aquifers
can deliver the target brine volumes reliably for a sustained period.
BurnVoir is currently acting as Corporate Finance Adviser and
Lead Manager for the IPO.
Use of Funds Amount
Existing cash reserves $0.6M
IPO Proceeds $3.0M
Total Funds Available $3.60M
Drilling and Pump Testing $1.25M
Infrastructure Costs $0.24M
Studies and Engineering $0.05M
Regulatory and Approvals $0.35M
Corporate and Working Capital $1.71M
Total Funds Allocated $3.60M
Capital Structure Post IPO No. Shares
Existing Shareholders 91.5M
IPO Shareholders 15.0M
Performance Options 20.0M
Management Options 7.5M
Total 134.0M
Kalium Lakes Ltd. BurnVoir Research
BurnVoir Corporate Finance Limited 6 November 2016 2
Investment Rationale
Kalium Lakes offers leverage to the ‘feed the world’ thematic
ASX-listed SOP explorer / developers have received strong market support, given their leverage to the
‘feed the world’ thematic, i.e. the ability to immediately deliver improved crop yields, given the increasing
pressure on agricultural resources to meet the demands of an expanding global population, which
continues to encroach upon arable land.
A realistic chance to become Australia’s first SOP producer
Closest deposit to infrastructure
One of the highest grade brine potash deposits in Australia
Opportunity to be the first to supply Australia’s SOP demand
There are a handful of brine potash explorers / developers listed on the ASX, most with projects in the
arid regions of Western Australia.
Kalium Lakes’ Beyondie Potash Project is very well located with respect to existing infrastructure, being
among the closest to sealed roads, gas pipeline infrastructure, and ports.
The Beyondie Potash Project is also one of the highest grade brine potash deposits in Australia, has
one of the lowest sodium: potassium ratios, and has one of the best reported geological /
hydrogeological architectures, based on the existence of a basal sand aquifer from which over five
million litres of brine has been successfully extracted during an initial short term pump test.
Finally, Kalium Lakes is well advanced compared to many of its peers regarding both the technical
aspects of the project (evidenced by the work undertaken by German specialists K-UTEC’s as described
in Snowden’s Independent Expert Report in the Prospectus) as well as key permitting and approvals,
having secured the necessary permits to construct trial ponds, conduct pilot scale pump testing, and
produce a bulk sample which can be processed through a pilot scale facility in Germany to provide
product for assessment by end users.
For these reasons, we consider Kalium Lakes a plausible chance to claim first mover advantage in
becoming Australia’s first domestic SOP producer.
Why is this important? Historically Australia has imported 300kt potash per annum, with internal demand
for SOP of approximately 70ktpa. In 2014-2015, this rose to 454kt. Currently, domestic end users are
paying A$975/t SOP FOT Kwinana. A Western Australian producer could price its product more
competitively, and capture market share, while still being able to deliver to the growing Asian market.
The opportunity to be re-rated on listing
Kalium would be worth A$0.47/sh to A$0.75/sh if the market considers Kalium Lakes as an equivalent peer of the key SOP players in Australia
On listing, Kalium Lakes will have a market capitalisation of A$21.3 million, assuming A$3 million is
raised at IPO. A number of its peers including Salt Lake Potash Limited, Reward Minerals Limited, and
Agrimin Limited, have market capitalisations of A$50-80 million.
Should the market share our view regarding the key attributes of the Beyondie Potash Project, there is
the potential for the valuation gap to narrow. If Kalium Lakes is valued at a similar level to the peers
listed above, its equivalent share price would be A$0.47 per share to A$0.75 per share.
Indicative DCF modelling supports a A$1.03 per share valuation
Indicative DCF supports a valuation of A$1.03/sh
We have modelled a 150ktpa operation, using capital and operating cost assumptions based on
estimates published by Kalium Lakes’ peers. Our indicative valuation for a fully funded project is
A$178.1 million, equivalent to A$1.03 per share (diluted), assuming a US$500/t SOP price and 0.75
AUDUSD. At the current pricing and currency (US$650/t, 0.76 AUDUSD), our valuation lifts to A$389.3
million, equivalent to A$2.49 per share (diluted).
SOP – a safer way to seek leverage to potash
Market fundamentals are positive for SOP
SOP represents about 10% of the global potassium fertiliser market (~6Mtpa), with the bulk being MOP,
(Muriate of Potash or potassium chloride), comprising 55Mtpa. SOP has an advantage over MOP in
that it does not contain chloride, which can be harmful to certain crops), and it contains sulphur, a
secondary nutrient. However, SOP trades at a premium to MOP, due to the scarcity of supply, and
which is underpinned by the high cost of production from secondary sources (e.g., Mannheim Process).
SOP demand is forecast to grow by 3.7% CAGR by 2020. Market share of SOP is expected to increase
from approximately 10% to 28% in 2028. Demand is anticipated to be driven by China, the world’s
largest consumer of potash (45%), Brazil, the world’s largest citrus producer (currently consuming only
32ktpa), and India, a large tobacco and tea grower (estimated to consume only 50ktpa currently).
On the supply side, there are few primary sources, the most obvious being moderate to large capex
development projects in Africa, in addition to brines, which are typically the lower cost producers.
Australia is one of the few regions globally where salt lakes have the requisite potassic brine chemistry.
Kalium Lakes Ltd. BurnVoir Research
BurnVoir Corporate Finance Limited 6 November 2016 3
Peer Analysis – building the case for a re-rate
There are a number of ASX-listed Western Australian brine potash explorer / developers against whom
Kalium Lakes can be compared. These include Agrimin Ltd (AMN AU), Goldphyre Resources Ltd (GPH
AU), Reward Minerals Ltd (RWD AU), Rum Jungle Resources Ltd (RUM ASX), and Salt Lake Potash
Ltd (SO4 AU).
When assessing Kalium Lakes’ Beyondie Potash Project against the projects of its ASX-listed peers,
we considered three key themes, to determine how the market is valuing these companies, and to form
a view of where the Company might be positioned upon listing on the ASX. These themes are:
Proximity to infrastructure: How remote is the asset from existing infrastructure and the
markets? This will affect the project economics and may prove to be a barrier to entry for some
brine SOP developers.
Asset quality: What is the brine grade? On what basis is the Mineral Resource defined, and in
particular, how much is drainable / extractable? Are the target aquifers in clays or sands? Have
flow rates been determined? What is the sodium: potassium ratio of the brine, i.e., how much
table salt needs to be produced and sent to waste for each tonne of SOP produced? These factors
will all impact the project economics.
Relative development stage: Has pump testing been undertaken? Are approvals in place to
construct trial ponds of sufficient size to allow continuous pump testing i.e., hectare-scale? Have
transport and logistics discussions been instigated, and to what level? Have scoping / technical
studies been undertaken? Are Native Title Agreements in place? These factors reduce the
execution risk and timing for production.
Collectively, these factors allow the better projects to be identified, provide a basis for assessing how
likely they are to be developed, and what their likelihood of claiming first mover advantage might be,
given Australia imports 100% of its SOP needs.
Proximity to infrastructure
78km from the highway and gas pipeline
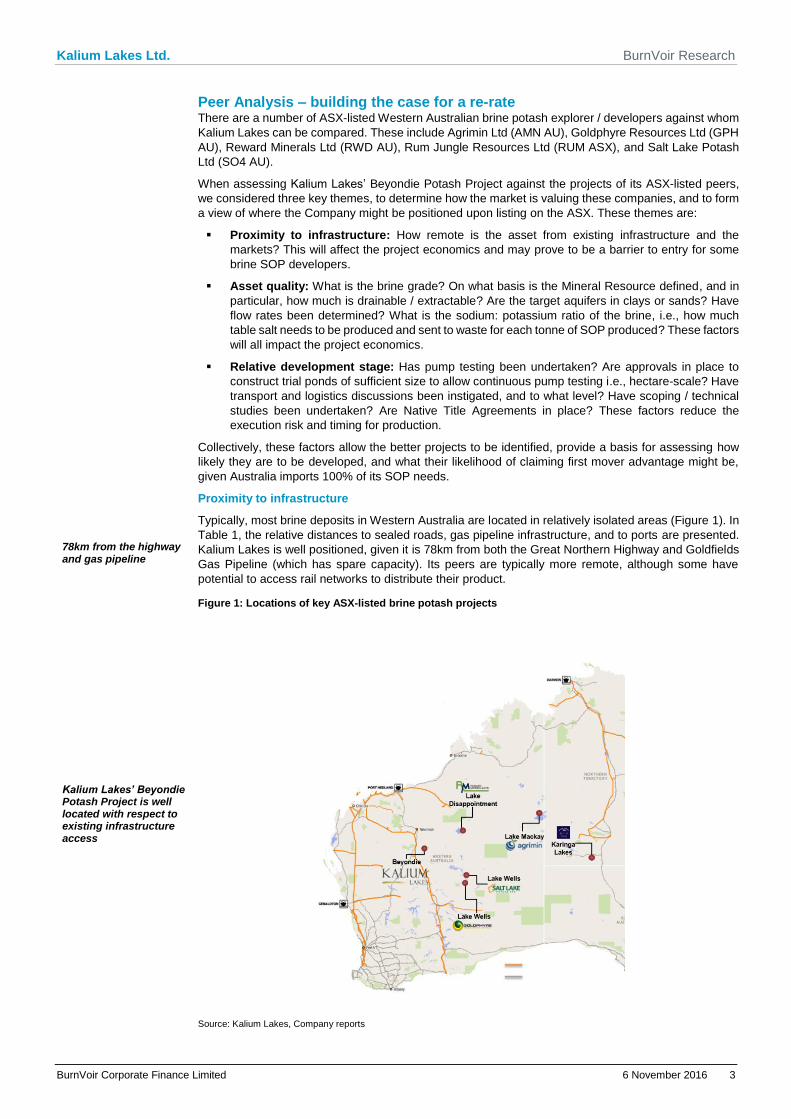
Typically, most brine deposits in Western Australia are located in relatively isolated areas (Figure 1). In
Table 1, the relative distances to sealed roads, gas pipeline infrastructure, and to ports are presented.
Kalium Lakes is well positioned, given it is 78km from both the Great Northern Highway and Goldfields
Gas Pipeline (which has spare capacity). Its peers are typically more remote, although some have
potential to access rail networks to distribute their product.
Figure 1: Locations of key ASX-listed brine potash projects
Kalium Lakes’ Beyondie Potash Project is well located with respect to existing infrastructure access
Source: Kalium Lakes, Company reports
Kalium Lakes Ltd. BurnVoir Research
BurnVoir Corporate Finance Limited 6 November 2016 4
Table 1: Distance to Infrastructure of Australian Development Stage Potash Projects
Factor KLL AMN RWD SO4 RUM GPH
Distance to Sealed Road 78km 590km 360km 195km 1-25km 168km
Distance to Port 700 or 862km 2,300km 877 or 1,371km 1,105km 1,825km 4,078km
Distance to Gas Pipeline 78km 290km 175km 245km 150km 243km
Source: Kalium Lakes, Company reports
Asset Quality – Resource size
JORC 2012 and CIM – compliant Resource
In Table 2 below we compare several key attributes of each major deposit. Most companies have
Mineral Resources which would support long life operations.
Reward Minerals has the largest Mineral Resource at present, however it cannot be directly compared
with the other peers, given it is reported on a Total Brine Volume / in-situ basis rather than on a Drainable
Brine basis. We anticipate Reward Minerals’ resource will be closer to its peers (lower) after adjusting
for drainability, given its Mineral Resource comprises clay-based aquifers, with only the upper parts
likely amenable to extraction. Salt Lake Potash also reports on a Total Brine Volume basis.
The industry is moving towards reporting Drainable Brine standards, which includes a measure of the
recoverability of the contained brine. This is also consistent with the Canadian Institute of Mining
Metallurgy and Petroleum (“CIM”) reporting standards.
Asset Quality – Brine Grade
Reward Minerals and Kalium Lakes have the highest reported brine grades, at 13.7kg/m3 SOP and 13.6
g/m3 SOP respectively. These two deposits are part of the same drainage system. These grades are
significantly higher than the remainder of the peers, which typically have Mineral Resource grades
ranging from 8-9 kg/m3 SOP. Grade is important when determining capital costs to achieve a certain
production target: the lower the grade, the more trenches / bores that will be required to meet production,
and the larger the evaporation field and water to be evaporated.
Table 2: Comparison of deposit characteristics
Factor KLL AMN RWD SO4 RUM GPH
In-situ Resource 148.3 163.7 563.6 82.8 21.8 69.6
Drainable Resource 19.8 23.4 37.6 18.1 7.1 18.4
Potassium grade (kg/m3 SOP) 13.6 8.3 13.7 8.8 8.4-10.6 8.1
Sodium: potassium ratio 9.4:1 Not stated 15:1 22:1 Not stated 14:1
Type of Aquifer Sand Clay Clay Silt Sand Sand
Demonstrated Flow Rates litres / second) >5M l in 36hrs (Testing) 3.3 4.0 10.1 (Testing)
Source: Kalium Lakes, Company reports, BurnVoir estimates
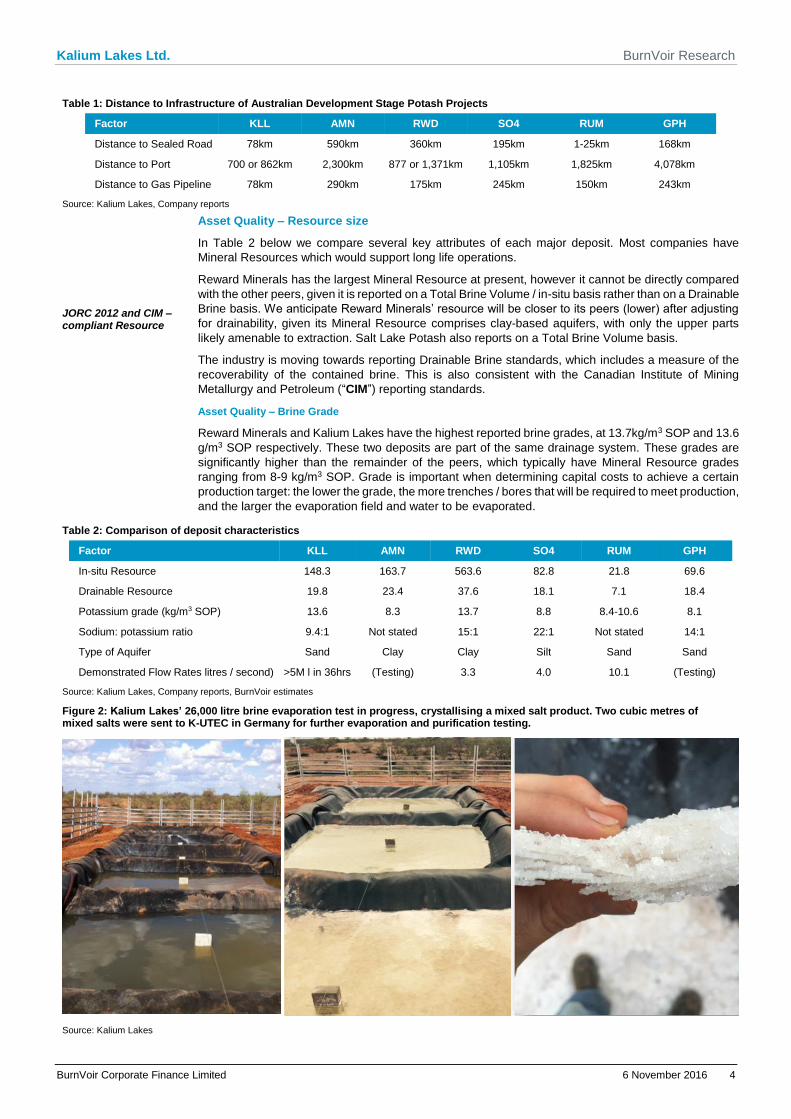
Figure 2: Kalium Lakes’ 26,000 litre brine evaporation test in progress, crystallising a mixed salt product. Two cubic metres of mixed salts were sent to K-UTEC in Germany for further evaporation and purification testing.
Source: Kalium Lakes
Kalium Lakes Ltd. BurnVoir Research
BurnVoir Corporate Finance Limited 6 November 2016 5
Asset Quality – sodium-potassium ratio
Low Na:K ratio
The sodium: potassium (Na:K) ratio is an important factor often not reported by the brine potash
developers. The higher the Na:K ratio, the more halite or common salt (NaCl) will be produced as
tailings. The Na:K ratio can therefore be considered as a proxy for the waste: ore ratio.
Kalium Lakes has a Na:K ratio of 10:1, whereas some of its peers have revealed ratios of up to 22:1
from assay data reported in ASX announcements.
Asset Quality – Clay vs sand aquifer
The Beyondie Potash Project has a basal sand aquifer
Deposits comprising brine-laden clay aquifers will have lower specific yields and therefore, lower brine
extraction characteristics than those comprising the more porous sands and gravels. Simply put, about
5% of total water can be recovered from clay versus 65% from sand. Therefore, clay-based deposits
are less likely to be viable or limited to the upper 5-10m of the lake surface, significantly reducing the
Resource size, and potential for Resource to Reserve conversion.
Extraction of brine from clay-dominated aquifers will be limited to trenching, and will require extensive
trenching networks (hundreds of kilometres) to be able to achieve significant production targets. This in
turn may have environmental implications, including barriers to permitting or rehabilitation costs.
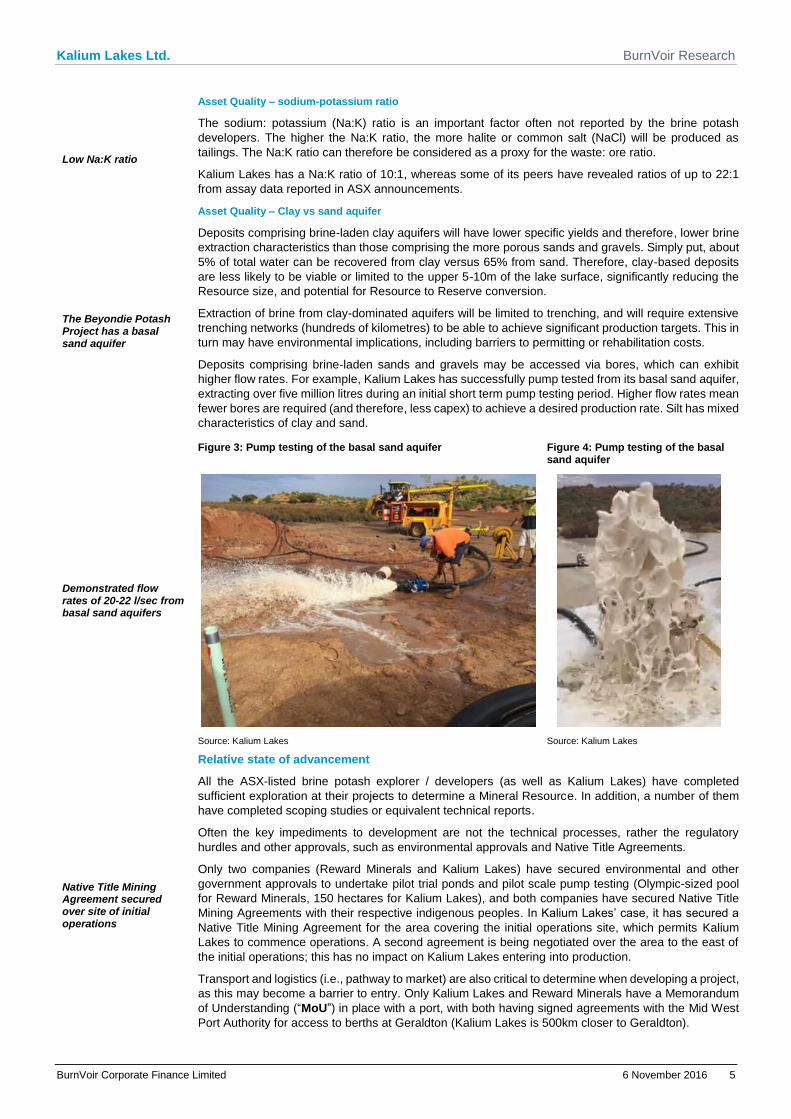
Deposits comprising brine-laden sands and gravels may be accessed via bores, which can exhibit
higher flow rates. For example, Kalium Lakes has successfully pump tested from its basal sand aquifer,
extracting over five million litres during an initial short term pump testing period. Higher flow rates mean
fewer bores are required (and therefore, less capex) to achieve a desired production rate. Silt has mixed
characteristics of clay and sand.
Figure 3: Pump testing of the basal sand aquifer Figure 4: Pump testing of the basal
sand aquifer
Demonstrated flow rates of 20-22 l/sec from basal sand aquifers
Source: Kalium Lakes Source: Kalium Lakes
Relative state of advancement
Native Title Mining Agreement secured over site of initial operations
All the ASX-listed brine potash explorer / developers (as well as Kalium Lakes) have completed
sufficient exploration at their projects to determine a Mineral Resource. In addition, a number of them
have completed scoping studies or equivalent technical reports.
Often the key impediments to development are not the technical processes, rather the regulatory
hurdles and other approvals, such as environmental approvals and Native Title Agreements.
Only two companies (Reward Minerals and Kalium Lakes) have secured environmental and other
government approvals to undertake pilot trial ponds and pilot scale pump testing (Olympic-sized pool
for Reward Minerals, 150 hectares for Kalium Lakes), and both companies have secured Native Title
Mining Agreements with their respective indigenous peoples. In Kalium Lakes’ case, it has secured a
Native Title Mining Agreement for the area covering the initial operations site, which permits Kalium
Lakes to commence operations. A second agreement is being negotiated over the area to the east of
the initial operations; this has no impact on Kalium Lakes entering into production.
Transport and logistics (i.e., pathway to market) are also critical to determine when developing a project,
as this may become a barrier to entry. Only Kalium Lakes and Reward Minerals have a Memorandum
of Understanding (“MoU”) in place with a port, with both having signed agreements with the Mid West
Port Authority for access to berths at Geraldton (Kalium Lakes is 500km closer to Geraldton).
Kalium Lakes Ltd. BurnVoir Research
BurnVoir Corporate Finance Limited 6 November 2016 6
Table 3: Comparison of development stage
Factor KLL AMN RWD SO4 RUM GPH
Technical Study / Reports
Multiple Scoping Study
Complete Scoping Study
Complete Scoping Study
Complete Scoping Study
Underway
Native Title Agreements One of two
Mining Agreements
Exploration Access
Agreement
Mining Agreement
Exploration Access
Agreement
Exploration Access
Agreement
Exploration Access
Agreement
Permits for Pilot Ponds Yes - Yes Submitted - -
Port / Rail Agreements Port MOU - Port MOU - - -
Source: Kalium Lakes, Company reports
Relative Valuation: How do they stack up?
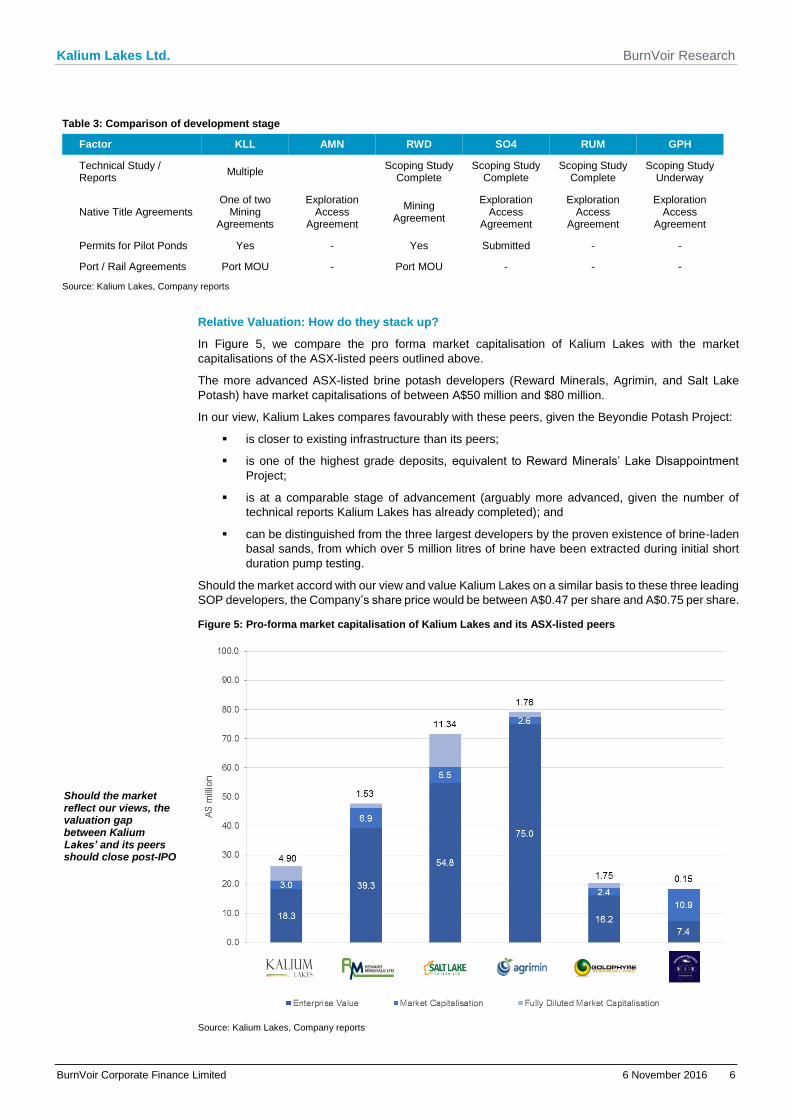
In Figure 5, we compare the pro forma market capitalisation of Kalium Lakes with the market
capitalisations of the ASX-listed peers outlined above.
The more advanced ASX-listed brine potash developers (Reward Minerals, Agrimin, and Salt Lake
Potash) have market capitalisations of between A$50 million and $80 million.
In our view, Kalium Lakes compares favourably with these peers, given the Beyondie Potash Project:
is closer to existing infrastructure than its peers;
is one of the highest grade deposits, equivalent to Reward Minerals’ Lake Disappointment
Project;
is at a comparable stage of advancement (arguably more advanced, given the number of
technical reports Kalium Lakes has already completed); and
can be distinguished from the three largest developers by the proven existence of brine-laden
basal sands, from which over 5 million litres of brine have been extracted during initial short
duration pump testing.
Should the market accord with our view and value Kalium Lakes on a similar basis to these three leading
SOP developers, the Company’s share price would be between A$0.47 per share and A$0.75 per share.
Figure 5: Pro-forma market capitalisation of Kalium Lakes and its ASX-listed peers
Should the market reflect our views, the valuation gap between Kalium Lakes’ and its peers should close post-IPO
Source: Kalium Lakes, Company reports
Kalium Lakes Ltd. BurnVoir Research
BurnVoir Corporate Finance Limited 6 November 2016 7
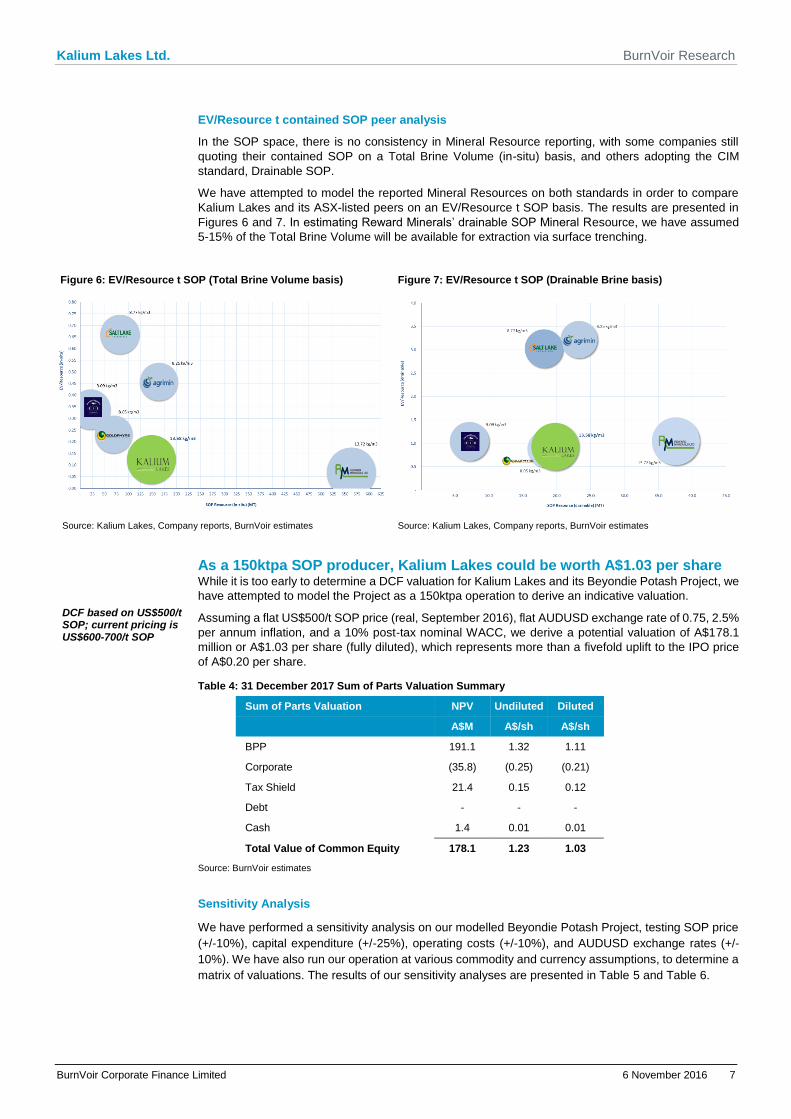
EV/Resource t contained SOP peer analysis
In the SOP space, there is no consistency in Mineral Resource reporting, with some companies still
quoting their contained SOP on a Total Brine Volume (in-situ) basis, and others adopting the CIM
standard, Drainable SOP.
We have attempted to model the reported Mineral Resources on both standards in order to compare
Kalium Lakes and its ASX-listed peers on an EV/Resource t SOP basis. The results are presented in
Figures 6 and 7. In estimating Reward Minerals’ drainable SOP Mineral Resource, we have assumed
5-15% of the Total Brine Volume will be available for extraction via surface trenching.
Figure 6: EV/Resource t SOP (Total Brine Volume basis) Figure 7: EV/Resource t SOP (Drainable Brine basis)
Source: Kalium Lakes, Company reports, BurnVoir estimates Source: Kalium Lakes, Company reports, BurnVoir estimates
As a 150ktpa SOP producer, Kalium Lakes could be worth A$1.03 per share
DCF based on US$500/t SOP; current pricing is US$600-700/t SOP
While it is too early to determine a DCF valuation for Kalium Lakes and its Beyondie Potash Project, we
have attempted to model the Project as a 150ktpa operation to derive an indicative valuation.
Assuming a flat US$500/t SOP price (real, September 2016), flat AUDUSD exchange rate of 0.75, 2.5%
per annum inflation, and a 10% post-tax nominal WACC, we derive a potential valuation of A$178.1
million or A$1.03 per share (fully diluted), which represents more than a fivefold uplift to the IPO price
of A$0.20 per share.
Table 4: 31 December 2017 Sum of Parts Valuation Summary
Sum of Parts Valuation NPV Undiluted Diluted
A$M A$/sh A$/sh
BPP 191.1 1.32 1.11
Corporate (35.8) (0.25) (0.21)
Tax Shield 21.4 0.15 0.12
Debt - - -
Cash 1.4 0.01 0.01
Total Value of Common Equity 178.1 1.23 1.03
Source: BurnVoir estimates
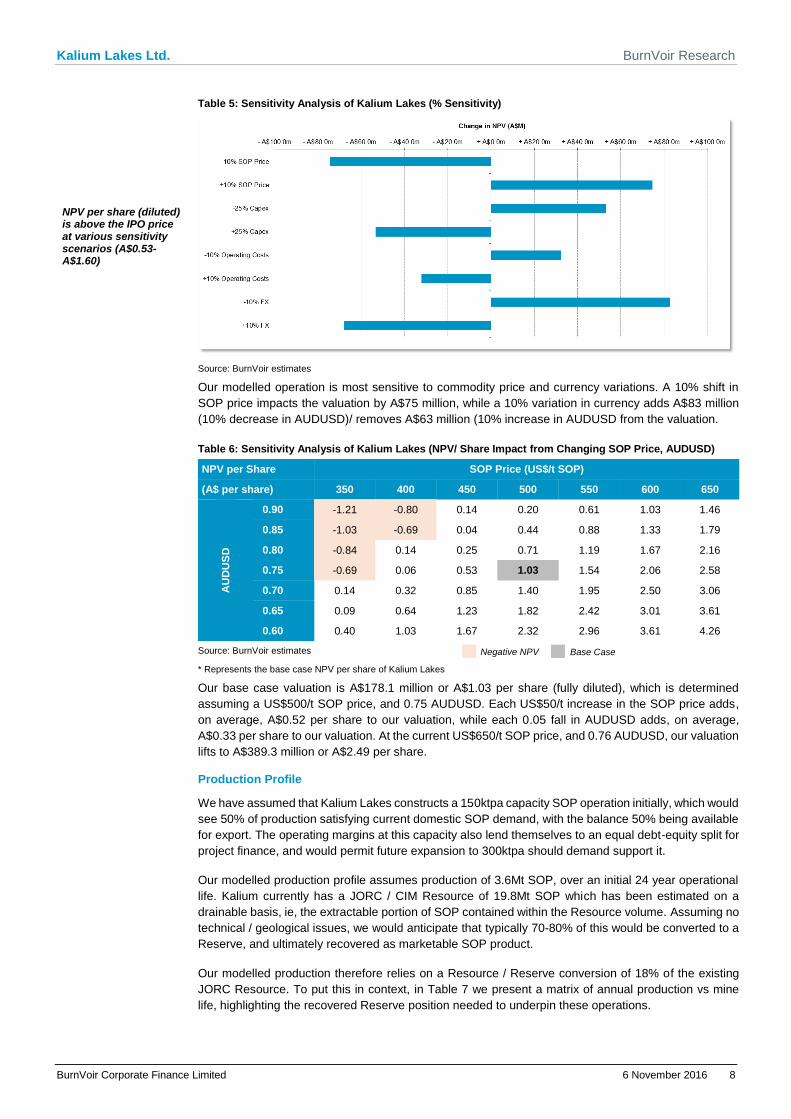
Sensitivity Analysis
We have performed a sensitivity analysis on our modelled Beyondie Potash Project, testing SOP price
(+/-10%), capital expenditure (+/-25%), operating costs (+/-10%), and AUDUSD exchange rates (+/-
10%). We have also run our operation at various commodity and currency assumptions, to determine a
matrix of valuations. The results of our sensitivity analyses are presented in Table 5 and Table 6.
Kalium Lakes Ltd. BurnVoir Research
BurnVoir Corporate Finance Limited 6 November 2016 8
Table 5: Sensitivity Analysis of Kalium Lakes (% Sensitivity)
NPV per share (diluted) is above the IPO price at various sensitivity scenarios (A$0.53-A$1.60)
Source: BurnVoir estimates
Our modelled operation is most sensitive to commodity price and currency variations. A 10% shift in
SOP price impacts the valuation by A$75 million, while a 10% variation in currency adds A$83 million
(10% decrease in AUDUSD)/ removes A$63 million (10% increase in AUDUSD from the valuation.
Table 6: Sensitivity Analysis of Kalium Lakes (NPV/ Share Impact from Changing SOP Price, AUDUSD)
NPV per Share SOP Price (US$/t SOP)
(A$ per share) 350 400 450 500 550 600 650
AU
DU
SD
0.90 -1.21 -0.80 0.14 0.20 0.61 1.03 1.46
0.85 -1.03 -0.69 0.04 0.44 0.88 1.33 1.79
0.80 -0.84 0.14 0.25 0.71 1.19 1.67 2.16
0.75 -0.69 0.06 0.53 1.03 1.54 2.06 2.58
0.70 0.14 0.32 0.85 1.40 1.95 2.50 3.06
0.65 0.09 0.64 1.23 1.82 2.42 3.01 3.61
0.60 0.40 1.03 1.67 2.32 2.96 3.61 4.26
Source: BurnVoir estimates
* Represents the base case NPV per share of Kalium Lakes
Our base case valuation is A$178.1 million or A$1.03 per share (fully diluted), which is determined
assuming a US$500/t SOP price, and 0.75 AUDUSD. Each US$50/t increase in the SOP price adds,
on average, A$0.52 per share to our valuation, while each 0.05 fall in AUDUSD adds, on average,
A$0.33 per share to our valuation. At the current US$650/t SOP price, and 0.76 AUDUSD, our valuation
lifts to A$389.3 million or A$2.49 per share.
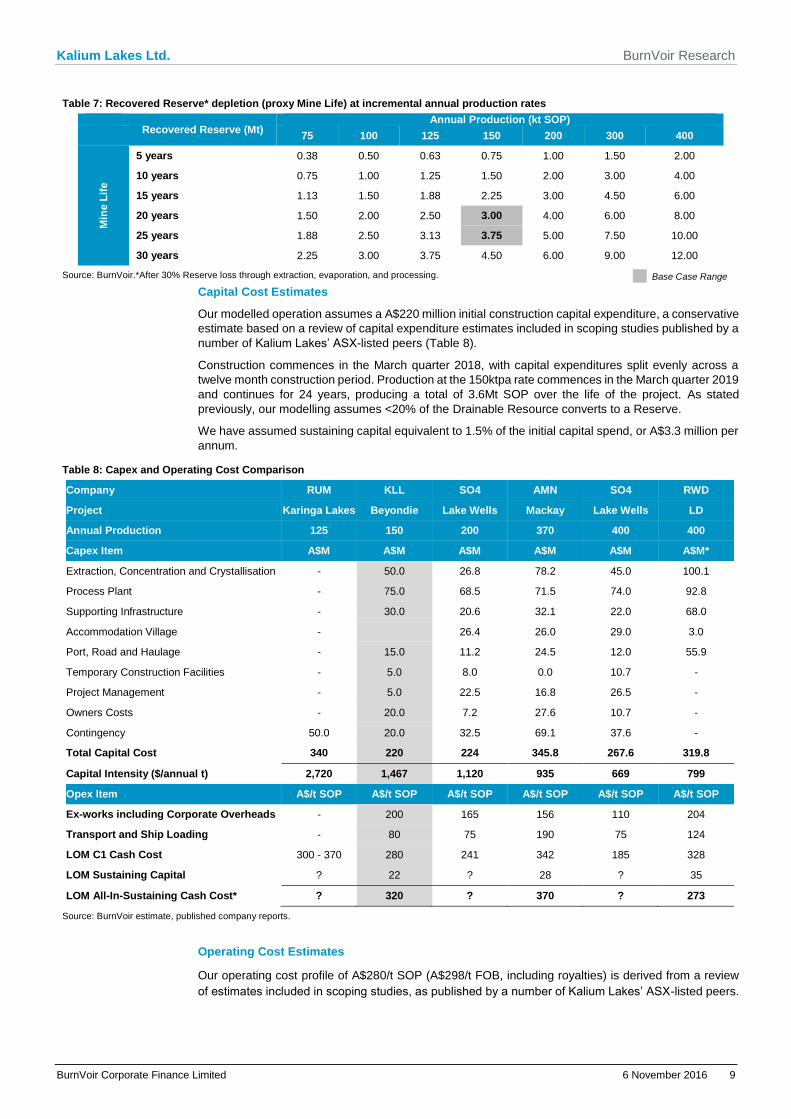
Production Profile
We have assumed that Kalium Lakes constructs a 150ktpa capacity SOP operation initially, which would
see 50% of production satisfying current domestic SOP demand, with the balance 50% being available
for export. The operating margins at this capacity also lend themselves to an equal debt-equity split for
project finance, and would permit future expansion to 300ktpa should demand support it.
Our modelled production profile assumes production of 3.6Mt SOP, over an initial 24 year operational
life. Kalium currently has a JORC / CIM Resource of 19.8Mt SOP which has been estimated on a
drainable basis, ie, the extractable portion of SOP contained within the Resource volume. Assuming no
technical / geological issues, we would anticipate that typically 70-80% of this would be converted to a
Reserve, and ultimately recovered as marketable SOP product.
Our modelled production therefore relies on a Resource / Reserve conversion of 18% of the existing
JORC Resource. To put this in context, in Table 7 we present a matrix of annual production vs mine
life, highlighting the recovered Reserve position needed to underpin these operations.
Negative NPV Base Case
Kalium Lakes Ltd. BurnVoir Research
BurnVoir Corporate Finance Limited 6 November 2016 9
Table 7: Recovered Reserve* depletion (proxy Mine Life) at incremental annual production rates
Recovered Reserve (Mt)
Annual Production (kt SOP) 75 100 125 150 200 300 400
Min
e L
ife
5 years 0.38 0.50 0.63 0.75 1.00 1.50 2.00
10 years 0.75 1.00 1.25 1.50 2.00 3.00 4.00
15 years 1.13 1.50 1.88 2.25 3.00 4.50 6.00
20 years 1.50 2.00 2.50 3.00 4.00 6.00 8.00
25 years 1.88 2.50 3.13 3.75 5.00 7.50 10.00
30 years 2.25 3.00 3.75 4.50 6.00 9.00 12.00
Source: BurnVoir.*After 30% Reserve loss through extraction, evaporation, and processing.
Capital Cost Estimates
Our modelled operation assumes a A$220 million initial construction capital expenditure, a conservative
estimate based on a review of capital expenditure estimates included in scoping studies published by a
number of Kalium Lakes’ ASX-listed peers (Table 8).
Construction commences in the March quarter 2018, with capital expenditures split evenly across a
twelve month construction period. Production at the 150ktpa rate commences in the March quarter 2019
and continues for 24 years, producing a total of 3.6Mt SOP over the life of the project. As stated
previously, our modelling assumes <20% of the Drainable Resource converts to a Reserve.
We have assumed sustaining capital equivalent to 1.5% of the initial capital spend, or A$3.3 million per
annum.
Table 8: Capex and Operating Cost Comparison
Company RUM KLL SO4 AMN SO4 RWD
Project Karinga Lakes Beyondie Lake Wells Mackay Lake Wells LD
Annual Production 125 150 200 370 400 400
Capex Item A$M A$M A$M A$M A$M A$M*
Extraction, Concentration and Crystallisation - 50.0 26.8 78.2 45.0 100.1
Process Plant - 75.0 68.5 71.5 74.0 92.8
Supporting Infrastructure - 30.0 20.6 32.1 22.0 68.0
Accommodation Village - 26.4 26.0 29.0 3.0
Port, Road and Haulage - 15.0 11.2 24.5 12.0 55.9
Temporary Construction Facilities - 5.0 8.0 0.0 10.7 -
Project Management - 5.0 22.5 16.8 26.5 -
Owners Costs - 20.0 7.2 27.6 10.7 -
Contingency 50.0 20.0 32.5 69.1 37.6 -
Total Capital Cost 340 220 224 345.8 267.6 319.8
Capital Intensity ($/annual t) 2,720 1,467 1,120 935 669 799
Opex Item A$/t SOP A$/t SOP A$/t SOP A$/t SOP A$/t SOP A$/t SOP
Ex-works including Corporate Overheads - 200 165 156 110 204
Transport and Ship Loading - 80 75 190 75 124
LOM C1 Cash Cost 300 - 370 280 241 342 185 328
LOM Sustaining Capital ? 22 ? 28 ? 35
LOM All-In-Sustaining Cash Cost* ? 320 ? 370 ? 273
Source: BurnVoir estimate, published company reports.
Operating Cost Estimates
Our operating cost profile of A$280/t SOP (A$298/t FOB, including royalties) is derived from a review
of estimates included in scoping studies, as published by a number of Kalium Lakes’ ASX-listed peers.
Base Case Range
Kalium Lakes Ltd. BurnVoir Research
BurnVoir Corporate Finance Limited 6 November 2016 10
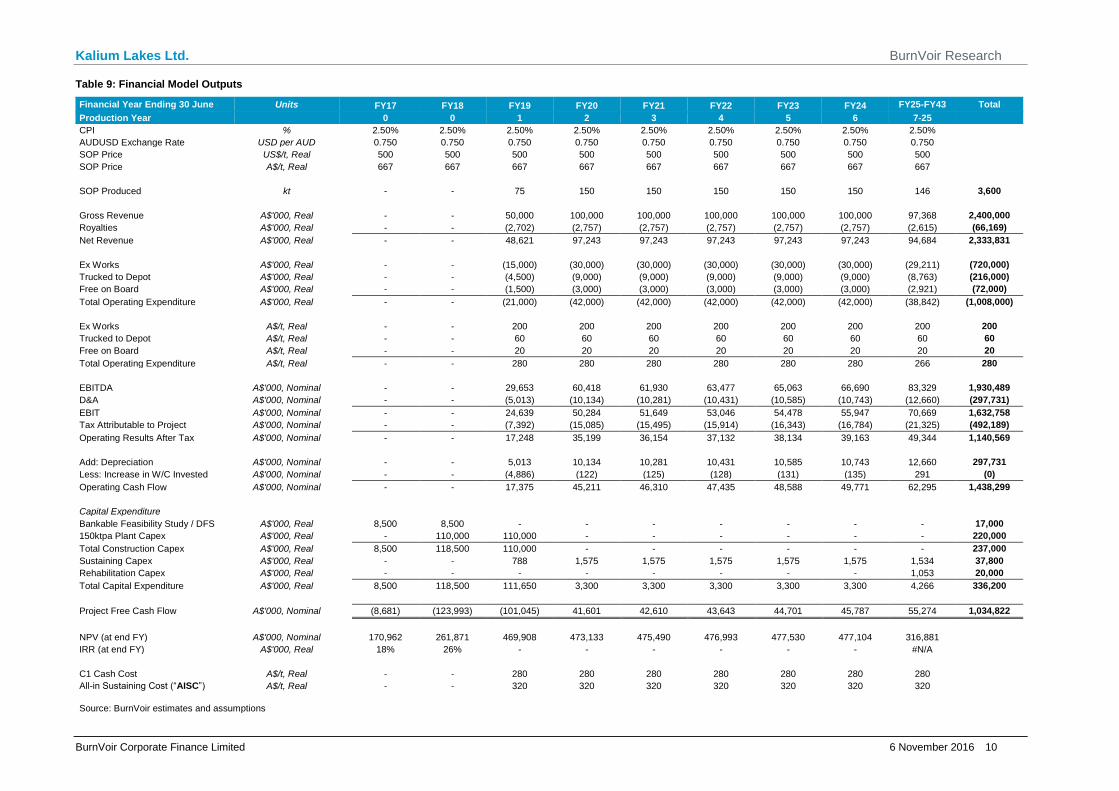
Table 9: Financial Model Outputs
Financial Year Ending 30 June Units FY17 FY18 FY19 FY20 FY21 FY22 FY23 FY24 FY25-FY43 Total
Production Year 0 0 1 2 3 4 5 6 7-25
CPI % 2.50% 2.50% 2.50% 2.50% 2.50% 2.50% 2.50% 2.50% 2.50%
AUDUSD Exchange Rate USD per AUD 0.750 0.750 0.750 0.750 0.750 0.750 0.750 0.750 0.750
SOP Price US$/t, Real 500 500 500 500 500 500 500 500 500
SOP Price A$/t, Real 667 667 667 667 667 667 667 667 667
SOP Produced kt - - 75 150 150 150 150 150 146 3,600
Gross Revenue A$'000, Real - - 50,000 100,000 100,000 100,000 100,000 100,000 97,368 2,400,000
Royalties A$'000, Real - - (2,702) (2,757) (2,757) (2,757) (2,757) (2,757) (2,615) (66,169)
Net Revenue A$'000, Real - - 48,621 97,243 97,243 97,243 97,243 97,243 94,684 2,333,831
Ex Works A$'000, Real - - (15,000) (30,000) (30,000) (30,000) (30,000) (30,000) (29,211) (720,000)
Trucked to Depot A$'000, Real - - (4,500) (9,000) (9,000) (9,000) (9,000) (9,000) (8,763) (216,000)
Free on Board A$'000, Real - - (1,500) (3,000) (3,000) (3,000) (3,000) (3,000) (2,921) (72,000)
Total Operating Expenditure A$'000, Real - - (21,000) (42,000) (42,000) (42,000) (42,000) (42,000) (38,842) (1,008,000)
Ex Works A$/t, Real - - 200 200 200 200 200 200 200 200
Trucked to Depot A$/t, Real - - 60 60 60 60 60 60 60 60
Free on Board A$/t, Real - - 20 20 20 20 20 20 20 20
Total Operating Expenditure A$/t, Real - - 280 280 280 280 280 280 266 280
EBITDA A$'000, Nominal - - 29,653 60,418 61,930 63,477 65,063 66,690 83,329 1,930,489
D&A A$'000, Nominal - - (5,013) (10,134) (10,281) (10,431) (10,585) (10,743) (12,660) (297,731)
EBIT A$'000, Nominal - - 24,639 50,284 51,649 53,046 54,478 55,947 70,669 1,632,758
Tax Attributable to Project A$'000, Nominal - - (7,392) (15,085) (15,495) (15,914) (16,343) (16,784) (21,325) (492,189)
Operating Results After Tax A$'000, Nominal - - 17,248 35,199 36,154 37,132 38,134 39,163 49,344 1,140,569
Add: Depreciation A$'000, Nominal - - 5,013 10,134 10,281 10,431 10,585 10,743 12,660 297,731
Less: Increase in W/C Invested A$'000, Nominal - - (4,886) (122) (125) (128) (131) (135) 291 (0)
Operating Cash Flow A$'000, Nominal - - 17,375 45,211 46,310 47,435 48,588 49,771 62,295 1,438,299
Capital Expenditure
Bankable Feasibility Study / DFS A$'000, Real 8,500 8,500 - - - - - - - 17,000
150ktpa Plant Capex A$'000, Real - 110,000 110,000 - - - - - - 220,000
Total Construction Capex A$'000, Real 8,500 118,500 110,000 - - - - - - 237,000
Sustaining Capex A$'000, Real - - 788 1,575 1,575 1,575 1,575 1,575 1,534 37,800
Rehabilitation Capex A$'000, Real - - - - - - - - 1,053 20,000
Total Capital Expenditure A$'000, Real 8,500 118,500 111,650 3,300 3,300 3,300 3,300 3,300 4,266 336,200
Project Free Cash Flow A$'000, Nominal (8,681) (123,993) (101,045) 41,601 42,610 43,643 44,701 45,787 55,274 1,034,822
NPV (at end FY) A$'000, Nominal 170,962 261,871 469,908 473,133 475,490 476,993 477,530 477,104 316,881
IRR (at end FY) A$'000, Real 18% 26% - - - - - - #N/A
C1 Cash Cost A$/t, Real - - 280 280 280 280 280 280 280
All-in Sustaining Cost (“AISC”) A$/t, Real - - 320 320 320 320 320 320 320
Source: BurnVoir estimates and assumptions
Kalium Lakes Ltd. BurnVoir Research
BurnVoir Corporate Finance Limited 6 November 2016 11
Royalties
The Beyondie Potash Project will be subject to Government royalties, Native Title Royalties, and a
Founders’ Royalty.
There does not appear to be a provision for potash products in the Mining Regulations 1981. We
assume salt is the closest product to use as a basis, given SOP is derived as a salt from evaporation
and purification. Salt royalties are covered under State Agreements and the Mining Regulations 1981.
A recent WA Government review (2015) recommended that all salt production be treated under the
Mining Regulations 1981, and subject to a specific royalty based on Amount A (currently A$0.73/t). We
have assumed this royalty rate in our model.
The Native Title royalty under the Gingirana Mining Agreement has been set at 0.75% and we have
assumed any subsequent Mining Agreements will be of the same royalty amount.
There is also a 1.9% royalty on gross revenues from potash production, payable to the three founding
shareholders of Kalium Lakes Potash Pty Ltd. These individuals are Brett Hazelden, Rudolph van
Niekerk, and Brent Smoothy. Each of the royalties have been factored into our modelled revenue.
Financing
We have assumed the cost to completion of the Definitive Feasibility Study (“DFS”) will $20 million
(including corporate overheads), which will be funded by the proceeds of the $5 million IPO (assuming
$2 million is raised from oversubscriptions), and a further A$15 million equity raise in June quarter 2017,
at an assumed issue price of A$0.52 per share (representing a 60% discount to the NPV at the
preceding quarter and is within the valuation range of A$0.47 to A$0.75 per share if Kalium Lakes is
valued at a similar level to its SOP peers in Australia).
Based on our pricing assumptions which approximate a bank’s price path, the Beyondie Potash Project
can support A$120 million debt while maintaining typical project financing debt covenants.
The balance of the A$120 million capital expenditure (allowing for capitalised interest during
construction and corporate overheads) will need to be equity funded, which will likely involve offtake
agreements including pre-payments, and conventional equity.
The modelling assumes an A$120 million conventional equity raising in the March quarter 2018, at
A$0.92 per share (representing a 25% discount to the NPV at the preceding quarter) and no pre-
payments are included. The A$120 million debt facility is drawn down in the June quarter 2018, once
the equity raising has completed. Our debt facility has a seven year tenor, with a sculpted repayment
profile, and all in interest rate of 8.1%.
Initial Public Offer
Kalium Lakes is seeking to raise A$3.0 million via an Initial Public Offering on the ASX, with the ability
to accept a further A$3 million from oversubscriptions. The IPO is priced at A$0.20 per share, resulting
in a pre-market valuation of A$18.3 million. Post-IPO, Kalium Lakes will have a market capitalisation of
A$21.3-A$24.3 million, scaling with any additional funding raised. Proceeds will be applied toward
Resource definition drilling, prolonged pump testing, studies and engineering, and advancing regulatory
requirements and approvals.
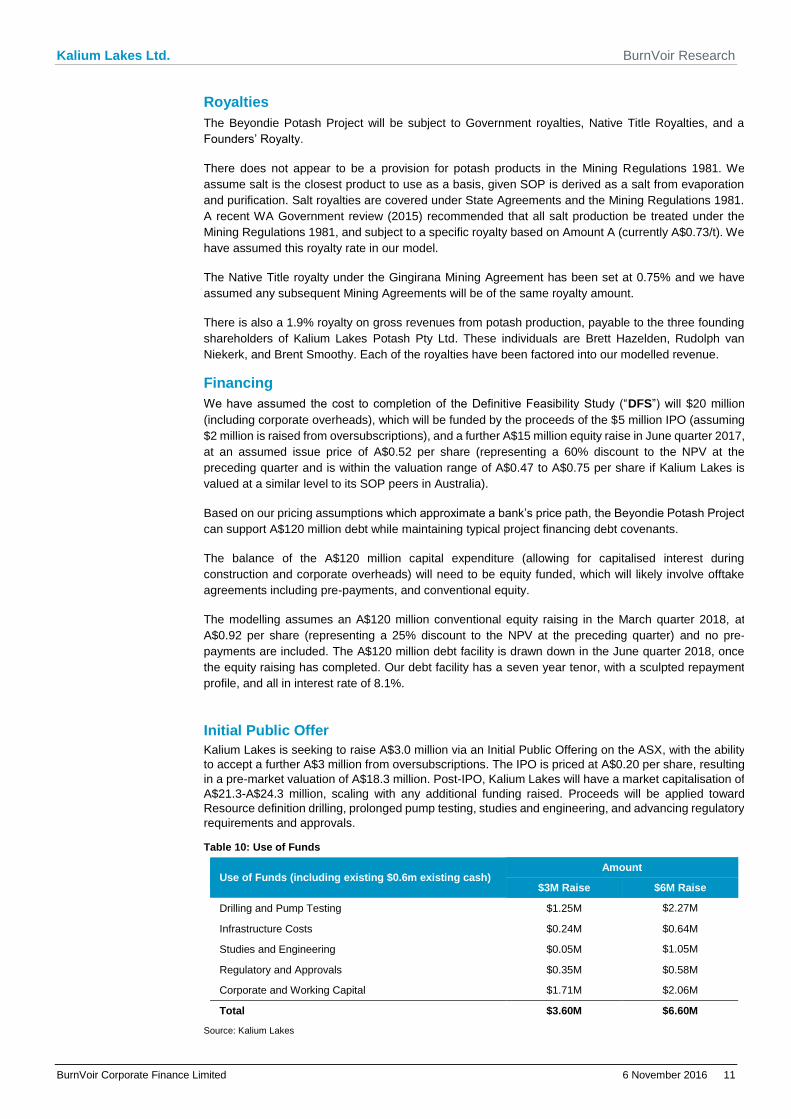
Table 10: Use of Funds
Use of Funds (including existing $0.6m existing cash) Amount
$3M Raise $6M Raise
Drilling and Pump Testing $1.25M $2.27M
Infrastructure Costs $0.24M $0.64M
Studies and Engineering $0.05M $1.05M
Regulatory and Approvals $0.35M $0.58M
Corporate and Working Capital $1.71M $2.06M
Total $3.60M $6.60M
Source: Kalium Lakes
Kalium Lakes Ltd. BurnVoir Research
BurnVoir Corporate Finance Limited 6 November 2016 12
Table 11: Key Dates
Event Date
Lodgement of IPO Prospectus Friday, 4th November
Opening Date of Offer Friday 14th November
Closing Date of Offer Monday 12th December
Expected Issue and Allotment of IPO Shares Thursday 15th December
Expected Holding Statement Despatch Date Friday 16th December
Expected Official Quotation of Shares on ASX Monday 19th December
Source: Kalium Lakes
Capital Structure
Shares
There are presently 91.5 Million shares on issue in Kalium Lakes. A further 15 million shares will be
issued under the IPO, lifting the total number of shares on issue to 106.5 million.
Performance Options
There are 20.0 million Performance Rights on issue to the company founders (Brett Hazelden, Rudolph
van Niekerk, and Brent Smoothy), which vest if key milestones for the Beyondie Potash Project are
achieved within five years These milestones are:
Completion of the DFS (5 million);
Securing project finance (5 million); and
Achieving commercial production of SOP (10 million).
Management Options
There are 7.5 Management Options on issue, which have a three year term, and an exercise price of
$0.25 per share. These are held by the Chairman Mal Randall (4.0 million), Non-Executive Director
Brendan O’Hara (2.0 million), with 0.50 million each issued to Company Secretary Gareth Widger, and
Brad Cribb and Cary Rossetti, both members of Kalium Lakes’ management team.
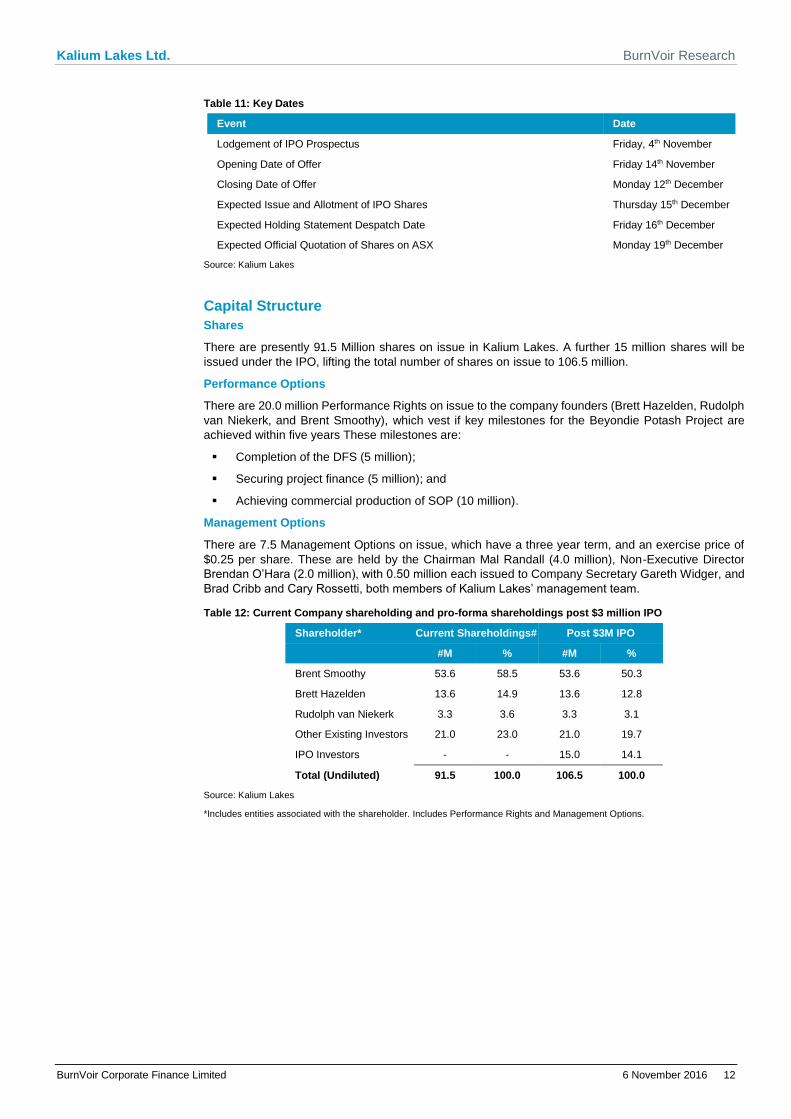
Table 12: Current Company shareholding and pro-forma shareholdings post $3 million IPO
Shareholder* Current Shareholdings# Post $3M IPO
#M % #M %
Brent Smoothy 53.6 58.5 53.6 50.3
Brett Hazelden 13.6 14.9 13.6 12.8
Rudolph van Niekerk 3.3 3.6 3.3 3.1
Other Existing Investors 21.0 23.0 21.0 19.7
IPO Investors - - 15.0 14.1
Total (Undiluted) 91.5 100.0 106.5 100.0
Source: Kalium Lakes
*Includes entities associated with the shareholder. Includes Performance Rights and Management Options.
Kalium Lakes Ltd. BurnVoir Research
BurnVoir Corporate Finance Limited 6 November 2016 13
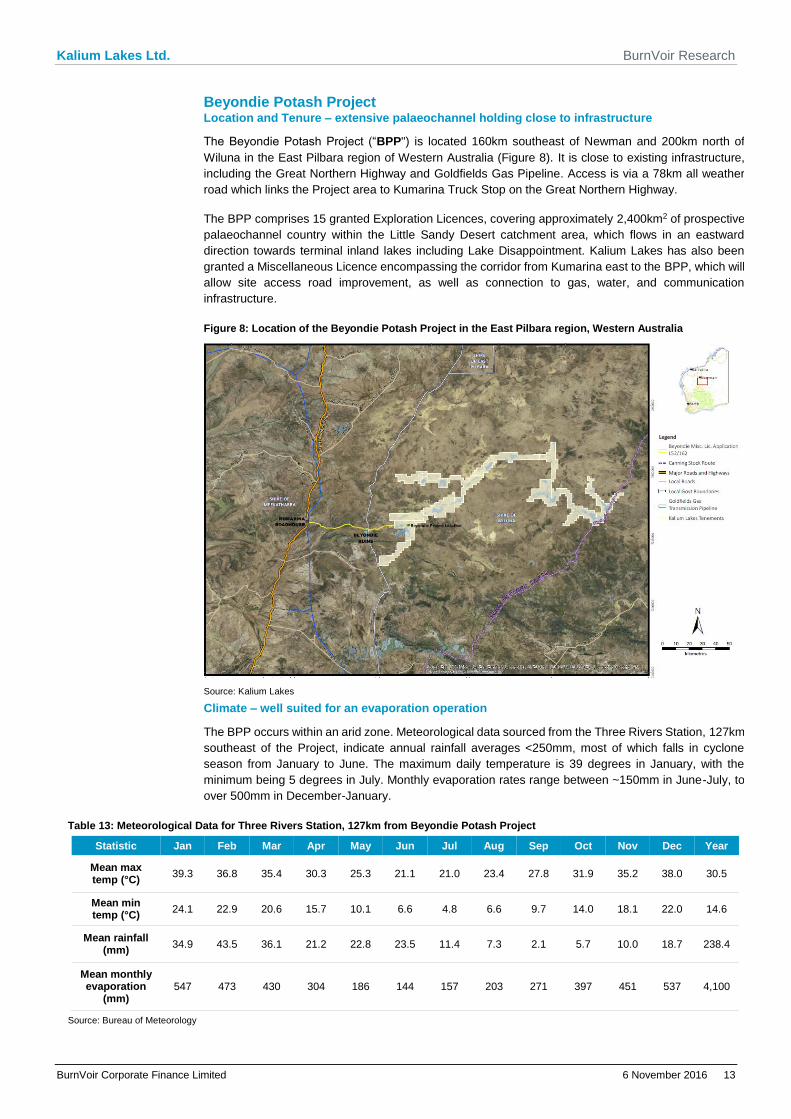
Beyondie Potash Project Location and Tenure – extensive palaeochannel holding close to infrastructure
The Beyondie Potash Project (“BPP") is located 160km southeast of Newman and 200km north of
Wiluna in the East Pilbara region of Western Australia (Figure 8). It is close to existing infrastructure,
including the Great Northern Highway and Goldfields Gas Pipeline. Access is via a 78km all weather
road which links the Project area to Kumarina Truck Stop on the Great Northern Highway.
The BPP comprises 15 granted Exploration Licences, covering approximately 2,400km2 of prospective
palaeochannel country within the Little Sandy Desert catchment area, which flows in an eastward
direction towards terminal inland lakes including Lake Disappointment. Kalium Lakes has also been
granted a Miscellaneous Licence encompassing the corridor from Kumarina east to the BPP, which will
allow site access road improvement, as well as connection to gas, water, and communication
infrastructure.
Figure 8: Location of the Beyondie Potash Project in the East Pilbara region, Western Australia
Source: Kalium Lakes
Climate – well suited for an evaporation operation
The BPP occurs within an arid zone. Meteorological data sourced from the Three Rivers Station, 127km
southeast of the Project, indicate annual rainfall averages <250mm, most of which falls in cyclone
season from January to June. The maximum daily temperature is 39 degrees in January, with the
minimum being 5 degrees in July. Monthly evaporation rates range between ~150mm in June-July, to
over 500mm in December-January.
Table 13: Meteorological Data for Three Rivers Station, 127km from Beyondie Potash Project
Statistic Jan Feb Mar Apr May Jun Jul Aug Sep Oct Nov Dec Year
Mean max temp (°C)
39.3 36.8 35.4 30.3 25.3 21.1 21.0 23.4 27.8 31.9 35.2 38.0 30.5
Mean min temp (°C)
24.1 22.9 20.6 15.7 10.1 6.6 4.8 6.6 9.7 14.0 18.1 22.0 14.6
Mean rainfall (mm)
34.9 43.5 36.1 21.2 22.8 23.5 11.4 7.3 2.1 5.7 10.0 18.7 238.4
Mean monthly evaporation
(mm) 547 473 430 304 186 144 157 203 271 397 451 537 4,100
Source: Bureau of Meteorology
Kalium Lakes Ltd. BurnVoir Research
BurnVoir Corporate Finance Limited 6 November 2016 14
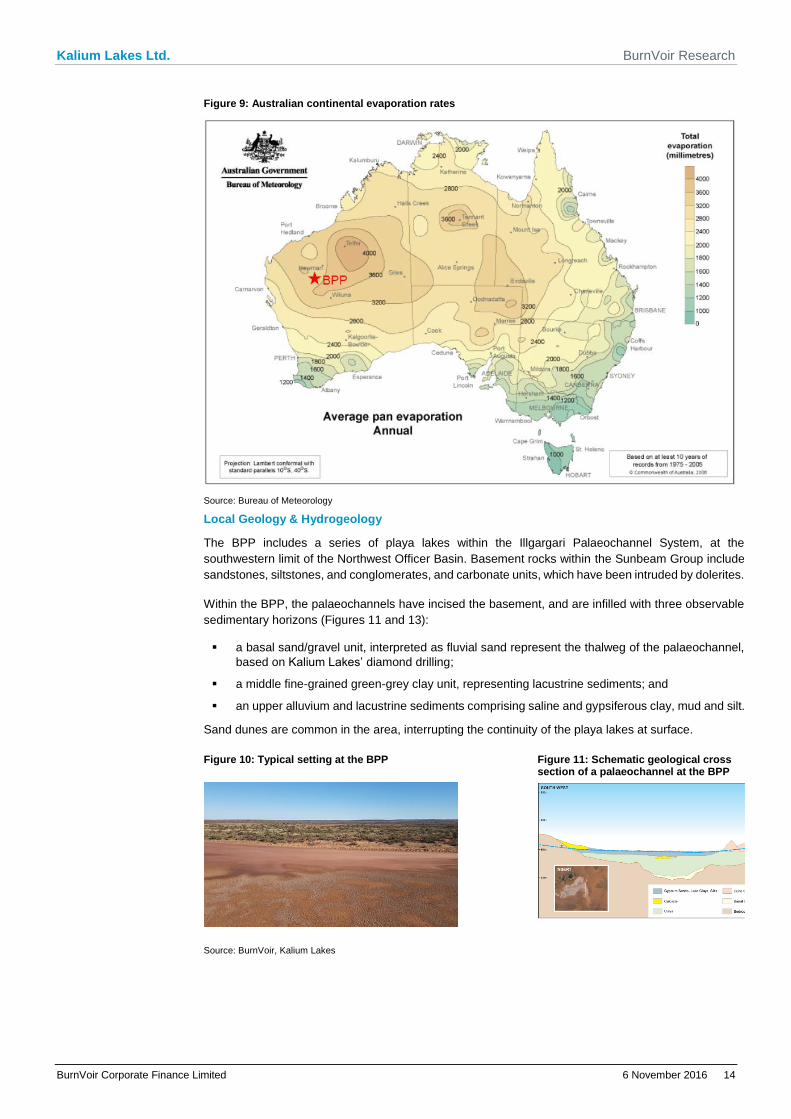
Figure 9: Australian continental evaporation rates
Source: Bureau of Meteorology
Local Geology & Hydrogeology
The BPP includes a series of playa lakes within the Illgargari Palaeochannel System, at the
southwestern limit of the Northwest Officer Basin. Basement rocks within the Sunbeam Group include
sandstones, siltstones, and conglomerates, and carbonate units, which have been intruded by dolerites.
Within the BPP, the palaeochannels have incised the basement, and are infilled with three observable
sedimentary horizons (Figures 11 and 13):
a basal sand/gravel unit, interpreted as fluvial sand represent the thalweg of the palaeochannel,
based on Kalium Lakes’ diamond drilling;
a middle fine-grained green-grey clay unit, representing lacustrine sediments; and
an upper alluvium and lacustrine sediments comprising saline and gypsiferous clay, mud and silt.
Sand dunes are common in the area, interrupting the continuity of the playa lakes at surface.
Figure 10: Typical setting at the BPP Figure 11: Schematic geological cross
section of a palaeochannel at the BPP
Source: BurnVoir, Kalium Lakes
Kalium Lakes Ltd. BurnVoir Research
BurnVoir Corporate Finance Limited 6 November 2016 15
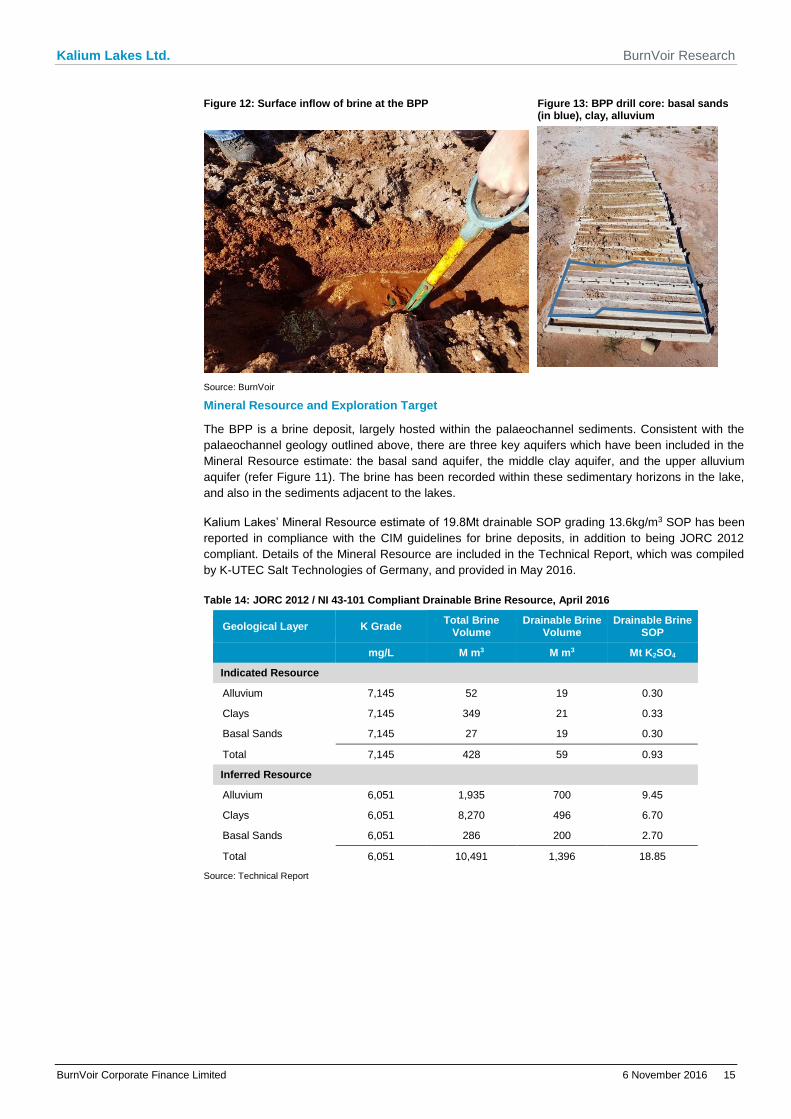
Figure 12: Surface inflow of brine at the BPP Figure 13: BPP drill core: basal sands
(in blue), clay, alluvium
Source: BurnVoir
Mineral Resource and Exploration Target
The BPP is a brine deposit, largely hosted within the palaeochannel sediments. Consistent with the
palaeochannel geology outlined above, there are three key aquifers which have been included in the
Mineral Resource estimate: the basal sand aquifer, the middle clay aquifer, and the upper alluvium
aquifer (refer Figure 11). The brine has been recorded within these sedimentary horizons in the lake,
and also in the sediments adjacent to the lakes.
Kalium Lakes’ Mineral Resource estimate of 19.8Mt drainable SOP grading 13.6kg/m3 SOP has been
reported in compliance with the CIM guidelines for brine deposits, in addition to being JORC 2012
compliant. Details of the Mineral Resource are included in the Technical Report, which was compiled
by K-UTEC Salt Technologies of Germany, and provided in May 2016.
Table 14: JORC 2012 / NI 43-101 Compliant Drainable Brine Resource, April 2016
Geological Layer K Grade Total Brine
Volume Drainable Brine
Volume Drainable Brine
SOP
mg/L M m3 M m3 Mt K2SO4
Indicated Resource
Alluvium 7,145 52 19 0.30
Clays 7,145 349 21 0.33
Basal Sands 7,145 27 19 0.30
Total 7,145 428 59 0.93
Inferred Resource
Alluvium 6,051 1,935 700 9.45
Clays 6,051 8,270 496 6.70
Basal Sands 6,051 286 200 2.70
Total 6,051 10,491 1,396 18.85
Source: Technical Report
Kalium Lakes Ltd. BurnVoir Research
BurnVoir Corporate Finance Limited 6 November 2016 16
Table 15: Exploration Target
Geological Layer K Grade Total Brine
Volume Drainable Brine
Volume Drainable Brine
SOP
mg/L M m3 M m3 Mt K2SO4
Minimum Exploration Target
Alluvium 1,100 2,186 546 1.34
Clays 1,100 19,512 434 1.06
Basal Sands 1,100 806 461 1.13
Total 1,100 22,504 1,441 3.53
Maximum Exploration Target
Alluvium 4,515 2,733 1,093 11.01
Clays 4,515 23,848 1,734 17.46
Basal Sands 4,515 1,036 691 6.96
Total 4,515 27,617 3,518 35.43
Source: Technical Report
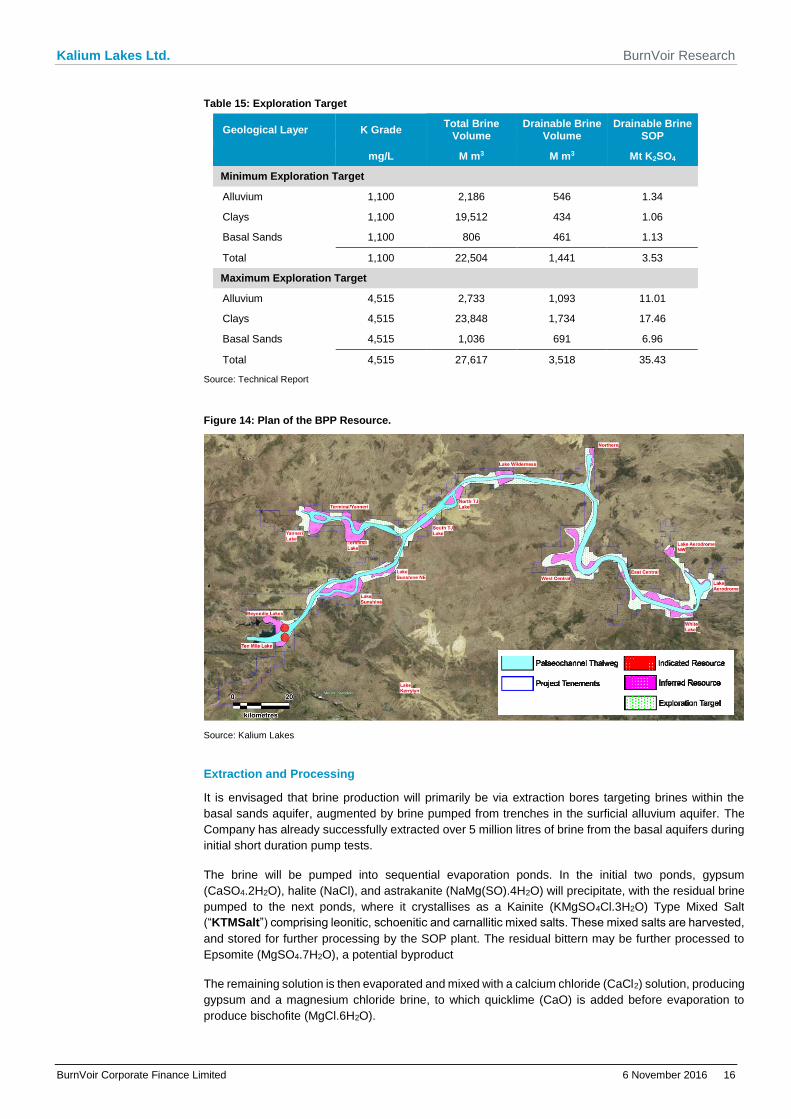
Figure 14: Plan of the BPP Resource.
Source: Kalium Lakes
Extraction and Processing
It is envisaged that brine production will primarily be via extraction bores targeting brines within the
basal sands aquifer, augmented by brine pumped from trenches in the surficial alluvium aquifer. The
Company has already successfully extracted over 5 million litres of brine from the basal aquifers during
initial short duration pump tests.
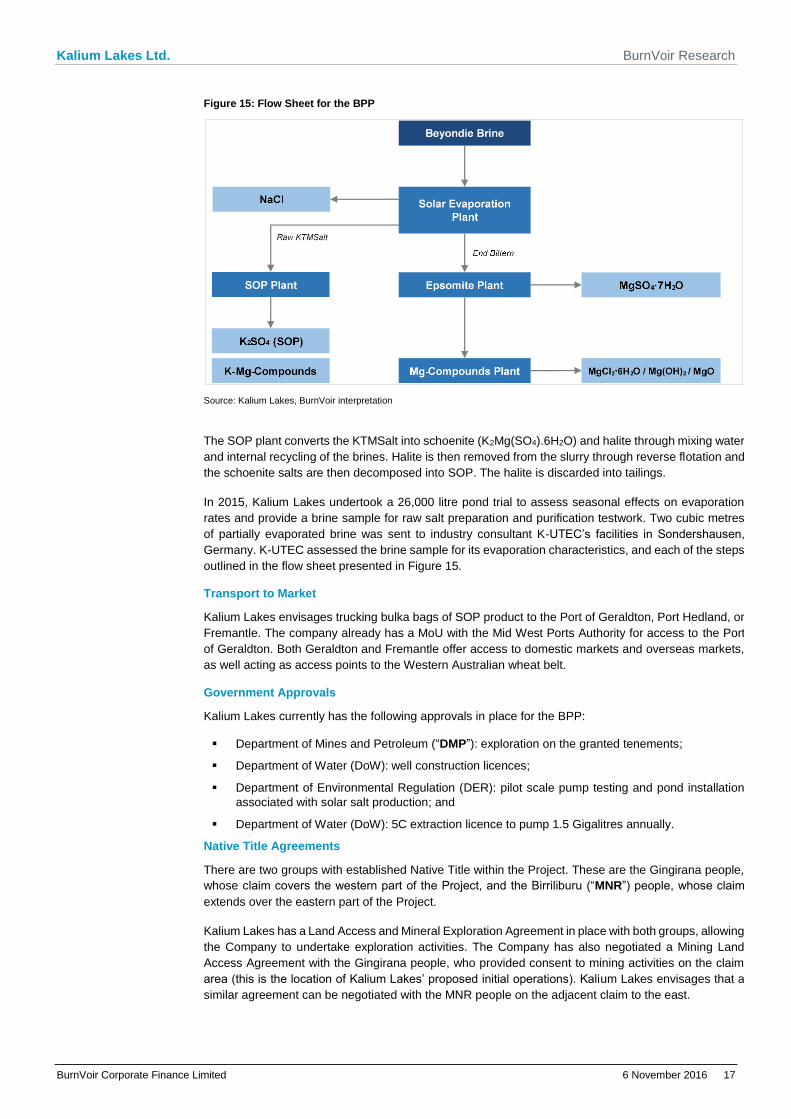
The brine will be pumped into sequential evaporation ponds. In the initial two ponds, gypsum
(CaSO4.2H2O), halite (NaCl), and astrakanite (NaMg(SO).4H2O) will precipitate, with the residual brine
pumped to the next ponds, where it crystallises as a Kainite (KMgSO4Cl.3H2O) Type Mixed Salt
(“KTMSalt”) comprising leonitic, schoenitic and carnallitic mixed salts. These mixed salts are harvested,
and stored for further processing by the SOP plant. The residual bittern may be further processed to
Epsomite (MgSO4.7H2O), a potential byproduct
The remaining solution is then evaporated and mixed with a calcium chloride (CaCl2) solution, producing
gypsum and a magnesium chloride brine, to which quicklime (CaO) is added before evaporation to
produce bischofite (MgCl.6H2O).
Kalium Lakes Ltd. BurnVoir Research
BurnVoir Corporate Finance Limited 6 November 2016 17
Figure 15: Flow Sheet for the BPP
Source: Kalium Lakes, BurnVoir interpretation
The SOP plant converts the KTMSalt into schoenite (K2Mg(SO4).6H2O) and halite through mixing water
and internal recycling of the brines. Halite is then removed from the slurry through reverse flotation and
the schoenite salts are then decomposed into SOP. The halite is discarded into tailings.
In 2015, Kalium Lakes undertook a 26,000 litre pond trial to assess seasonal effects on evaporation
rates and provide a brine sample for raw salt preparation and purification testwork. Two cubic metres
of partially evaporated brine was sent to industry consultant K-UTEC’s facilities in Sondershausen,
Germany. K-UTEC assessed the brine sample for its evaporation characteristics, and each of the steps
outlined in the flow sheet presented in Figure 15.
Transport to Market
Kalium Lakes envisages trucking bulka bags of SOP product to the Port of Geraldton, Port Hedland, or
Fremantle. The company already has a MoU with the Mid West Ports Authority for access to the Port
of Geraldton. Both Geraldton and Fremantle offer access to domestic markets and overseas markets,
as well acting as access points to the Western Australian wheat belt.
Government Approvals
Kalium Lakes currently has the following approvals in place for the BPP:
Department of Mines and Petroleum (“DMP”): exploration on the granted tenements;
Department of Water (DoW): well construction licences;
Department of Environmental Regulation (DER): pilot scale pump testing and pond installation
associated with solar salt production; and
Department of Water (DoW): 5C extraction licence to pump 1.5 Gigalitres annually.
Native Title Agreements
There are two groups with established Native Title within the Project. These are the Gingirana people,
whose claim covers the western part of the Project, and the Birriliburu (“MNR”) people, whose claim
extends over the eastern part of the Project.
Kalium Lakes has a Land Access and Mineral Exploration Agreement in place with both groups, allowing
the Company to undertake exploration activities. The Company has also negotiated a Mining Land
Access Agreement with the Gingirana people, who provided consent to mining activities on the claim
area (this is the location of Kalium Lakes’ proposed initial operations). Kalium Lakes envisages that a
similar agreement can be negotiated with the MNR people on the adjacent claim to the east.
Kalium Lakes Ltd. BurnVoir Research
BurnVoir Corporate Finance Limited 6 November 2016 18
Potash Themes
Growing population requires increased agricultural yields
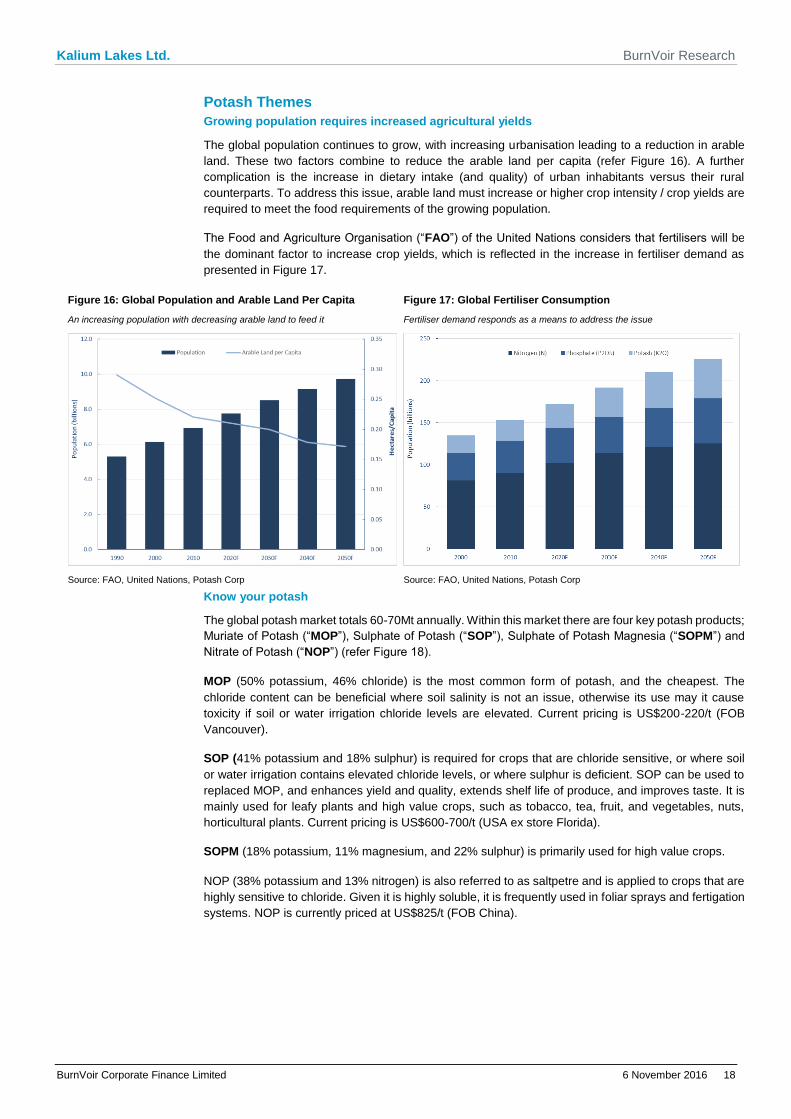
The global population continues to grow, with increasing urbanisation leading to a reduction in arable
land. These two factors combine to reduce the arable land per capita (refer Figure 16). A further
complication is the increase in dietary intake (and quality) of urban inhabitants versus their rural
counterparts. To address this issue, arable land must increase or higher crop intensity / crop yields are
required to meet the food requirements of the growing population.
The Food and Agriculture Organisation (“FAO”) of the United Nations considers that fertilisers will be
the dominant factor to increase crop yields, which is reflected in the increase in fertiliser demand as
presented in Figure 17.
Figure 16: Global Population and Arable Land Per Capita
An increasing population with decreasing arable land to feed it
Figure 17: Global Fertiliser Consumption
Fertiliser demand responds as a means to address the issue
Source: FAO, United Nations, Potash Corp Source: FAO, United Nations, Potash Corp
Know your potash
The global potash market totals 60-70Mt annually. Within this market there are four key potash products;
Muriate of Potash (“MOP”), Sulphate of Potash (“SOP”), Sulphate of Potash Magnesia (“SOPM”) and
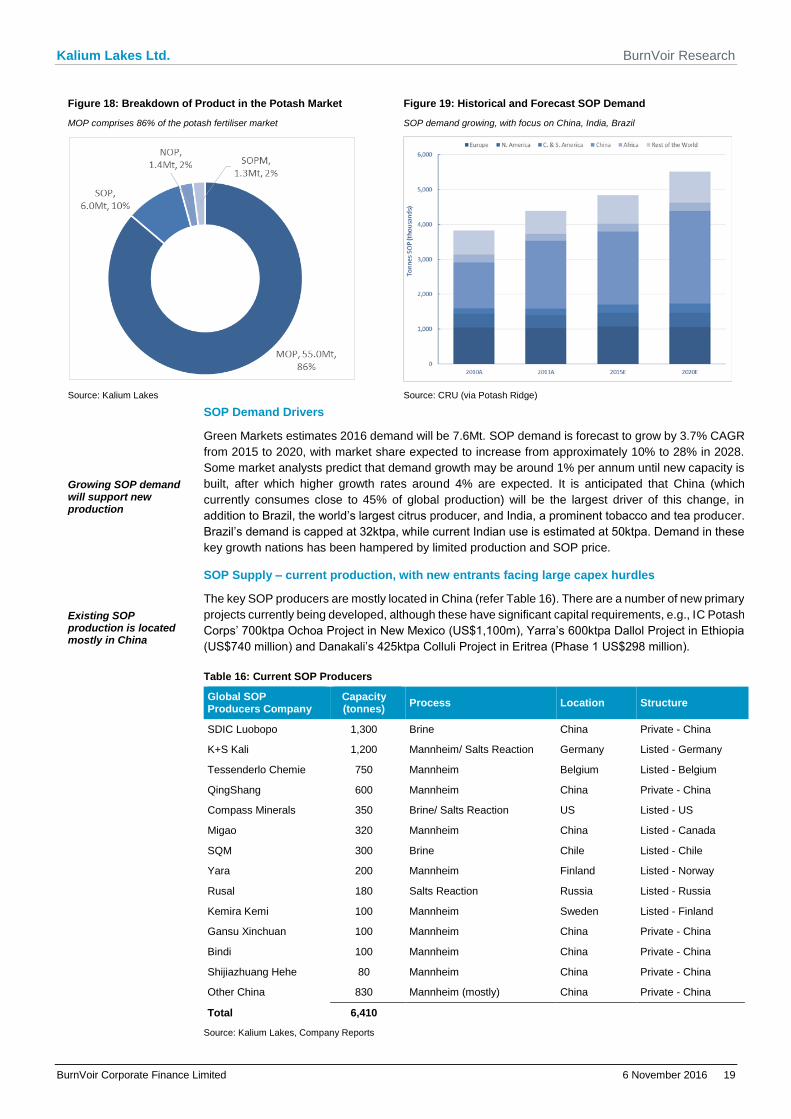
Nitrate of Potash (“NOP”) (refer Figure 18).
MOP (50% potassium, 46% chloride) is the most common form of potash, and the cheapest. The
chloride content can be beneficial where soil salinity is not an issue, otherwise its use may it cause
toxicity if soil or water irrigation chloride levels are elevated. Current pricing is US$200-220/t (FOB
Vancouver).
SOP (41% potassium and 18% sulphur) is required for crops that are chloride sensitive, or where soil
or water irrigation contains elevated chloride levels, or where sulphur is deficient. SOP can be used to
replaced MOP, and enhances yield and quality, extends shelf life of produce, and improves taste. It is
mainly used for leafy plants and high value crops, such as tobacco, tea, fruit, and vegetables, nuts,
horticultural plants. Current pricing is US$600-700/t (USA ex store Florida).
SOPM (18% potassium, 11% magnesium, and 22% sulphur) is primarily used for high value crops.
NOP (38% potassium and 13% nitrogen) is also referred to as saltpetre and is applied to crops that are
highly sensitive to chloride. Given it is highly soluble, it is frequently used in foliar sprays and fertigation
systems. NOP is currently priced at US$825/t (FOB China).
Kalium Lakes Ltd. BurnVoir Research
BurnVoir Corporate Finance Limited 6 November 2016 19
Figure 18: Breakdown of Product in the Potash Market
MOP comprises 86% of the potash fertiliser market
Figure 19: Historical and Forecast SOP Demand
SOP demand growing, with focus on China, India, Brazil
Source: Kalium Lakes Source: CRU (via Potash Ridge)
SOP Demand Drivers
Growing SOP demand will support new production
Green Markets estimates 2016 demand will be 7.6Mt. SOP demand is forecast to grow by 3.7% CAGR
from 2015 to 2020, with market share expected to increase from approximately 10% to 28% in 2028.
Some market analysts predict that demand growth may be around 1% per annum until new capacity is
built, after which higher growth rates around 4% are expected. It is anticipated that China (which
currently consumes close to 45% of global production) will be the largest driver of this change, in
addition to Brazil, the world’s largest citrus producer, and India, a prominent tobacco and tea producer.
Brazil’s demand is capped at 32ktpa, while current Indian use is estimated at 50ktpa. Demand in these
key growth nations has been hampered by limited production and SOP price.
SOP Supply – current production, with new entrants facing large capex hurdles
Existing SOP production is located mostly in China
The key SOP producers are mostly located in China (refer Table 16). There are a number of new primary
projects currently being developed, although these have significant capital requirements, e.g., IC Potash
Corps’ 700ktpa Ochoa Project in New Mexico (US$1,100m), Yarra’s 600ktpa Dallol Project in Ethiopia
(US$740 million) and Danakali’s 425ktpa Colluli Project in Eritrea (Phase 1 US$298 million).
Table 16: Current SOP Producers
Global SOP Producers Company
Capacity (tonnes)
Process Location Structure
SDIC Luobopo 1,300 Brine China Private - China
K+S Kali 1,200 Mannheim/ Salts Reaction Germany Listed - Germany
Tessenderlo Chemie 750 Mannheim Belgium Listed - Belgium
QingShang 600 Mannheim China Private - China
Compass Minerals 350 Brine/ Salts Reaction US Listed - US
Migao 320 Mannheim China Listed - Canada
SQM 300 Brine Chile Listed - Chile
Yara 200 Mannheim Finland Listed - Norway
Rusal 180 Salts Reaction Russia Listed - Russia
Kemira Kemi 100 Mannheim Sweden Listed - Finland
Gansu Xinchuan 100 Mannheim China Private - China
Bindi 100 Mannheim China Private - China
Shijiazhuang Hehe 80 Mannheim China Private - China
Other China 830 Mannheim (mostly) China Private - China
Total 6,410
Source: Kalium Lakes, Company Reports
Kalium Lakes Ltd. BurnVoir Research
BurnVoir Corporate Finance Limited 6 November 2016 20
SOP Pricing – underpinned by the high cost of production, Chinese export tariffs
SOP / MOP premium is at historic highs
Despite the much publicised fall in MOP price to historic lows, SOP prices have been slightly more
resilient, with the current six-year lows exacerbated by major US producer Compass Minerals actions,
considered to have lowered its selling price to limit the demand for competitive Chilean, Egyptian, and
Chinese exports.
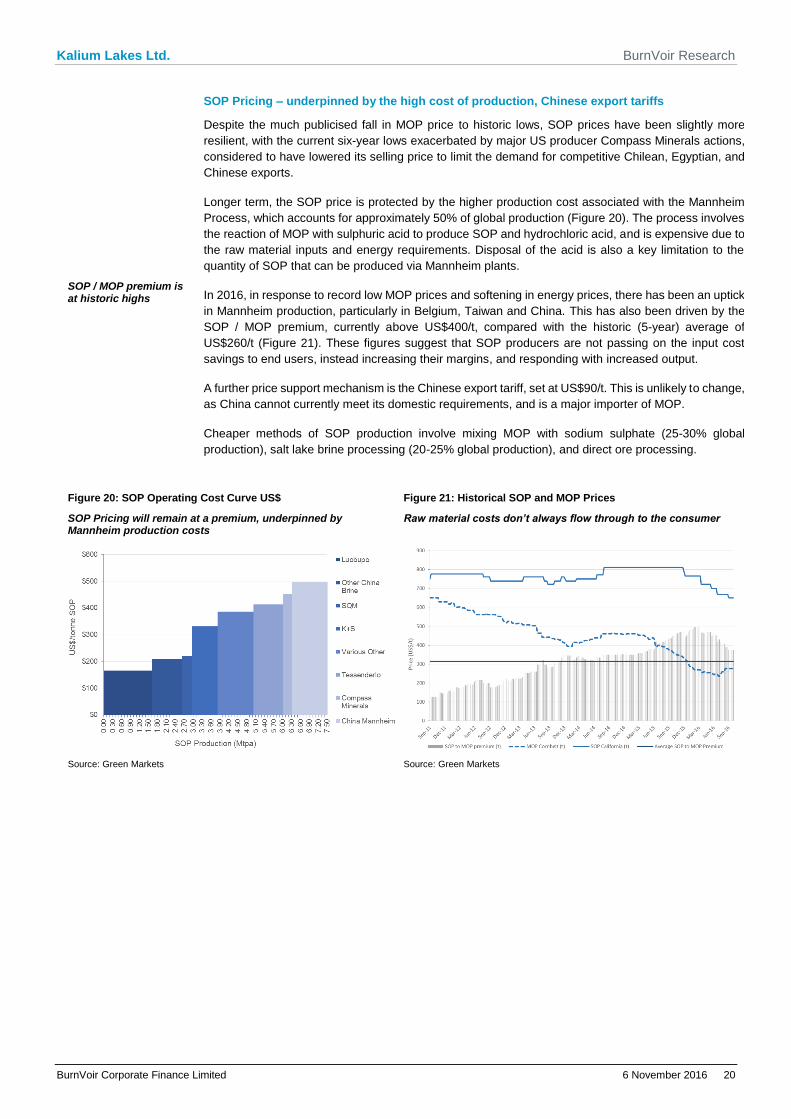
Longer term, the SOP price is protected by the higher production cost associated with the Mannheim
Process, which accounts for approximately 50% of global production (Figure 20). The process involves
the reaction of MOP with sulphuric acid to produce SOP and hydrochloric acid, and is expensive due to
the raw material inputs and energy requirements. Disposal of the acid is also a key limitation to the
quantity of SOP that can be produced via Mannheim plants.
In 2016, in response to record low MOP prices and softening in energy prices, there has been an uptick
in Mannheim production, particularly in Belgium, Taiwan and China. This has also been driven by the
SOP / MOP premium, currently above US$400/t, compared with the historic (5-year) average of
US$260/t (Figure 21). These figures suggest that SOP producers are not passing on the input cost
savings to end users, instead increasing their margins, and responding with increased output.
A further price support mechanism is the Chinese export tariff, set at US$90/t. This is unlikely to change,
as China cannot currently meet its domestic requirements, and is a major importer of MOP.
Cheaper methods of SOP production involve mixing MOP with sodium sulphate (25-30% global
production), salt lake brine processing (20-25% global production), and direct ore processing.
Figure 20: SOP Operating Cost Curve US$
SOP Pricing will remain at a premium, underpinned by Mannheim production costs
Figure 21: Historical SOP and MOP Prices
Raw material costs don’t always flow through to the consumer
Source: Green Markets Source: Green Markets
Kalium Lakes Ltd. BurnVoir Research
BurnVoir Corporate Finance Limited 6 November 2016 21
Investment Risks
Commodity Price: Given its primary business focus, Kalium Lakes will be affected by market sentiment
towards the SOP price.
Currency: The SOP price is US dollar denominated. Therefore, the Company’s future earnings are
exposed to AUDUSD currency movements.
Project Development Risk: Kalium Lakes’ ability to transition from explorer to producer will be
contingent on its ability to prove up the BPP further and convert its Mineral Resources to Ore Reserves
as well as mitigate the risk of construction cost blowouts or construction delays.
Native Title Risk: Kalium Lakes has secured one of the two Native Title Mining Agreements required
for the Beyondie Potash Project. The remaining agreement is currently at the negotiation stage. While
this is not required for the initial planned operation, it will be required if Kalium Lakes wants to extract
brine from the tenements further to the east of the Project.
Government Risk: Government policy changes may impact on the permitting / approvals process,
which could impact Kalium Lakes’ ability to deliver and operate the Project. There is also risk regarding
the DMP’s determination of the applicable royalty for potash; if it determines that potash does not attract
a specific royalty under Amount A per the Mining Regulations 1981, there is a risk of a higher royalty
being applied, leading to lower revenues from the Project.
Financing Risk: All operational and cash flow forecasts are made with the underlying assumption that
Kalium Lakes is able to raise the equity financing detailed in this research note, as well as additional
project financing before development of BPP.
Operating Risk: Once in production, Kalium Lakes will be subject to the usual operating risks that
producers face, which may include weather, processing issues, etc.
Key risks include hydrogeological risks, including such as the recovered brine grade being less than
expected, or highly variable, or not consistently achieving required extraction rates. This would reduce
brine recoverability, result in poor product quality and cause production/ ramp-up delays. Other key
technical risk include being able to extract the brine in way that does not compromise the aquifers. The
Company would also need to manage the brine chemistry through the SOP plant to deliver a product
that meets offtaker / market specifications.
Risks are inherently higher for single project companies due to a lack of diversification.
Delayed Market Entry Risk: Entering the market as quickly as possible is crucial to developing the
BPP. Demand for domestic SOP supply is limited, thus initiating production and locking down offtake
contracts before competing developers will be crucial. If Kalium Lakes is unable to enter production
quickly enough, there is a risk it could get locked out from offtakers, thereby threatening the viability of
the Project or exposing the Project to spot market price volatility.
Key Personnel: Kalium Lakes has assembled a team with extensive geological expertise in the area.
Exploration and production could be affected if these personnel depart.
Liquidity: Following the pre-IPO and IPO raisings, Kalium Lakes will continue to have a tightly held
register, with the top shareholder controlling more than 43% of the register. These shares will likely be
escrowed for a period of up to 24 months. There is no guarantee that there will be an ongoing liquid
market for Kalium Lakes’ shares, and if illiquidity arises, there is a risk that shareholders may not be
able to realise their investment in the Company.
Board of Directors Mal Randall B.Chem, FAICD – Non-Executive Chairman
Mr Randall is a chemical engineer with over 41 years’ experience in corporate management and
marketing in the resources sector, including more than 20 years with the Rio Tinto group of companies.
His experience extends over a broad range of commodities including iron ore, diamonds, base metals,
coal, uranium, mineral sands, and industrial minerals both in Australia and internationally.
Kalium Lakes Ltd. BurnVoir Research
BurnVoir Corporate Finance Limited 6 November 2016 22
Mr Randall has been an independent non-executive director of Thundelarra Resources Ltd since 2003
and is currently on the boards of MZI Resources Ltd (Chairman), Summit Resources Ltd, and Magnetite
Mines Ltd.
Mr Randall owns 0.45 million shares in the Company, equating to 0.5% of the shares outstanding, and
has 4.0 million Management Options, which have a three year exercise period, and a strike price of
$0.25 per share.
Brett Hazelden B.Sc, MBA, GAICD – Managing Director
Mr Hazelden is a metallurgist with over 19 years’ experience in project management, engineering design and operations within the Australasian resources industry, having previously studied, managed, and executed projects from small scale through to multibillion dollar complex projects.
His experience includes project management, feasibility study evaluation, engineering & design, estimating, financial evaluation, cost control, scheduling, contracts & procurement, business risk and strategic development. Brett has previously worked for iron ore companies including Ferraus Ltd and Iron Ore Holdings Ltd, gold producer Newcrest, engineering and construction firms such as Fluor Corporation, and for Rio Tinto as a metallurgist. Brett’s work experience extends across various iron, copper and gold projects located in South and Western Australia, and Indonesia.
Mr Hazelden owns 13.6 million shares in the Company, equating to 14.9% of the shares outstanding.
He also has 4.2 million Performance Options, which are zero exercise price options, and which vest on
achievement of key project milestones for the Beyondie Potash Project including completion of a DFS,
securing project financing, and commercial production.
As a founding shareholder of Kalium Lakes Potash Pty Ltd, Mr Hazelden is entitled to a royalty on
potash production. The Royalty Deed between Kalium Lakes Potash Pty and a unit trust, of which the
founding shareholders including Mr Hazelden are beneficiaries, grants a royalty of 1.9% of gross
revenue from potash produced to the unit trust. The other beneficiaries are Rudolph van Niekerk and
Brent Smoothy.
Rudolph van Niekerk B.Eng, GAICD – Non-Executive Director
Mr van Niekerk is a mechanical engineer with more than 12 years’ experience in project and business
management. He has held various roles in management of projects and operations, being responsible
for financial evaluation, risk review and management, project management, study management,
development of capital and operating cost estimates, budget development and cost control, design
management, planning, reporting, contract administration, quality control, expediting, construction,
commissioning, production ramp-up and project hand-over to operations. Mr van Niekerk has worked
extensively in iron ore projects located in the Plibara region for Ferraus Ltd and Iron Ore Holdings Ltd,
on a gold project for Newcrest in Indonesia as well as for AngloGold Ashanti and Dowding Reynard &
Associates on several gold and platinum projects located in South Africa.
Mr van Niekerk owns 3.3 million shares in the Company, equating to 3.62% of the shares outstanding.
He also has 1.2 million Performance Options, which are zero exercise price options, and which vest on
achievement of key project milestones for the Beyondie Potash Project including completion of a DFS,
securing project financing, and commercial production.
As a founding shareholder of Kalium Lakes Potash Pty Ltd, Mr van Niekerk is entitled to a royalty on
potash production. The Royalty Deed between Kalium Lakes Potash Pty and a unit trust, of which the
founding shareholders including Mr van Niekerk are beneficiaries, grants a royalty of 1.9% of gross
revenue from potash produced to the unit trust. The other beneficiaries are Brett Hazelden and Brent
Smoothy.
Brendan O’Hara B.Juris, LLB, SS Fin – Non-Executive Director
Mr O’Hara holds Bachelor of Jurisprudence (Hons) and Bachelor of Laws. He is a Senior Fellow of FINSIA and a former legal practitioner of the Supreme Court of WA and a member of the Business Law Section of the Law Council of Australia. His previous roles include eight years as Executive Chairman of ASX-listed Summit Resources Limited, and State Executive Director of the ASX.
Mr O’Hara does not own any shares in the Company. However, he has 2.0 million Management Options,
which have a three year exercise period, and a strike price of $0.25 per share.
Kalium Lakes Ltd. BurnVoir Research
BurnVoir Corporate Finance Limited 6 November 2016 23
This Research has been prepared and issued by BurnVoir Corporate Finance Limited (“BurnVoir”) and remains the property of BurnVoir. No material contained in
this Research may be reproduced or distributed, except as allowed by the Copyright Act, without the prior written approval of BurnVoir.
This report has been prepared and issued (in Australia) by BurnVoir Corporate Finance Limited (ABN 84 097 814 134 / AFS Licence No. 247 387) (“BurnVoir”) and is subject to
the disclosures and restrictions set out below.
Analyst Certification
The research analyst(s) identified on the cover of this report individually certify that in respect of each security or issuer that the research analyst covers that this report accurately reflects his or her personal views about any and all of the subject issuer(s) or securities.
Disclosure
BurnVoir has been appointed Corporate Finance Advisor and Joint Lead Manager to the Initial Public Offering as announced in the Prospectus published by the company on 30 August 2016.
Contact with Kalium Lakes Ltd. has been made during the preparation of this report for assistance with verification of facts.
BurnVoir and its associates (as defined in Chapter 1 of the Corporations Act 2001), officers, directors, employees and agents, from time to time, may own or have positions in securities of the company(ies) covered in this report and may trade in the securities mentioned either as principal or agent or may be materially interested in such securities.
BurnVoir does and seeks to do business with companies covered in its research reports. As a result, investors should consider this report as only a single factor in making their investment decision.
Disclaimer & Warning
This report may contain general advice or recommendations which, while believed to be accurate at the time of publication, are not appropriate for all persons or accounts. This report does not purport to contain all the information that a prospective investor may require. Before making an investment or trading decision, the recipient must consider Market developments subsequent to the date of this document, and whether the advice is appropriate in light of his or her financial circumstances or seek further advice on its appropriateness or should form his/her own independent view given the person’s investment objectives, financial situation and particular needs regarding any securities or Financial Products mentioned herein. Information in this document has been obtained from sources believed to be true but neither BurnVoir nor its associates make any recommendation or warranty concerning the Financial Products or the accuracy, or reliability or completeness of the information or the performance of the companies referred to in this document. Past performance is not indicative of future performance. This document is not an offer, invitation, solicitation or recommendation with respect to the subscription for, purchase or sale of any Financial Product, and neither this document or anything in it shall form the basis of any contract or commitment. Although every attempt has been made to verify the accuracy of the information contained in the document, liability for any errors or omissions (except any statutory liability which cannot be excluded) is specifically excluded by BurnVoir, its associates, officers, directors, employees and agents. The securities of such company(ies) may not be eligible for sale in all jurisdictions or to all categories of investors.
Country specific disclosures
US Investors: This material is intended for use by “major U.S. institutional investors” (as defined in Rule 15(a)-6 of the U.S. Securities Exchange Act of 1934, (SEA 1934)). The
information upon which this material is based was obtained from sources believed to be reliable, but has not been independently verified. Therefore, its accuracy is not guaranteed. Additional and supporting information is available upon request. This is not an offer or solicitation of an offer to buy or sell any security or to make any investment. Any opinion or estimate constitutes the preparer's best judgement as of the date of preparation and is subject to change without notice. BurnVoir and their associates or affiliates, and their respective officers, directors and employees may buy or sell securities mentioned herein as agent or principal for their own account.
United Kingdom: This report is issued and distributed by BurnVoir only to persons falling within Articles 19 (5), 38, 47 and 49, of the Financial Services and Markets Act 2000 (Financial Promotion) Order 2005, (all such persons together being referred to as “relevant persons”). Directors, officers and employees of such entities are also included provided their responsibilities regarding those entitles involve engaging in investment activity. Persons who do not have professional experience relating to investments should not rely on this document.
Canada: The investments or investment services referred to in this document are available in Canada only to “Designated Institutions”, as defined by the Securities Act (Ontario).
Other International Investors: International investors outside the US, UK or Canada are encouraged to contact their local regulatory authorities to determine whether any restrictions apply to their ability to purchase this investment.
Recipient Representations/Warranties: By accepting this report, the recipient represents and warrants that he or she is entitled to receive such report in accordance with the restrictions set out in this document and agrees to be bound by the limitations contained herein. Any failure to comply with these limitations may constitute a violation of law.