Embed Size (px)
Citation preview

VOT 78152
THE STUDY ON THE DEVELOPMENT OF SATURATION PROFILE IN
SOIL SLOPE
(KAJIAN MENGENAI PERKEMBANGAN PROFIL KETEPUAN DALAM TANAH CERUN)
NURLY GOFAR LEE MIN LEE
FAKULTI KEJURUTERAAN AWAM UNIVERSITI TEKNOLOGI MALAYSIA
2008

i
ACKNOWLEDGEMENT
We would like to thank Universiti Teknologi Malaysia for funding the
research through Initial Research Grant Scheme for Students (IRGS). This research
would not be accomplished without the financial aids provided.
The research was shaped through interaction with many academicians. For
this, we are deeply grateful to Professor Dr. Harianto Rahardjo, Dr. David Toll,
Professor Dr. Roslan Zainal Abidin, Professor Dr. Faisal Ali, Professor Dr. Mohd
Amin Mohd Sam, and Mr. Low Tian Huat for sharing their valuable experiences.
We extend our gratitude to all the technical staffs of Department of
Geotechnics and Transportation, Faculty of Civil Engineering, Universiti Teknologi
Malaysia for their assistance in laboratory and field works. Besides, we sincerely
thank fellow Master and Undergraduate students including Mohamed Elbyhagi,
Wisam, Maiziz, Amir Hasyim, Sim Kay Huei, Tan She Hooi, Yang Eik Hien, Elango,
and Nadasan, for their involvement in part of this research.

ii
ABSTRACT
This study was carried out to investigate the mechanisms involved in the
development of saturation profiles in soil. A series of laboratory tests were
conducted to monitor the saturation profiles in four types of soil under various
rainfall conditions. The understanding in saturation profile is essential to predict
the shear strength of soil, particularly for slope stability problem. The study showed
that the saturation profile in soil could be effectively monitored through a fabricated
soil column model. The effect of rainfall pattern on the saturation profile of
coarse-grained soil is relatively insignificant. Conversely, the saturation profile in
fine-grained soil could be significantly altered when the soil is subjected to a
prolonged rainfall. It is believed that the findings from the present study could lead
to better understanding of saturation profile in soil, and subsequently contributing
efforts in mitigating rainfall-induced slope failure.

iii
ABSTRAK
Kajian ini dijalankan untuk mengkaji mekanisme yang terlibat dalam
perkembangan profil ketepuan dalam tanah. Satu siri ujian makmal telah dijalankan
untuk memantau profil ketepuan empat jenis tanah dalam pelbagai keadaan hujan.
Kefahaman dalam profil ketepuan adalah penting untuk meramal kekuatan tanah
terutamanya bagi masalah kestabilan cerun. Kajian ini menunjukkan profil
ketepuan tanah dapat dimantau dengan efektifnya dengan menggunakan satu model
tiang tanah. Kesan corak hujan terhadap profil ketepuan tanah berbutiran kasar
didapati kurang ternyata. Sebaliknya, profil ketepuan dalam tanah berbutiiran halus
berubah dengan banyak apabila tanah terdedah kepada hujan yang berpanjangan.
Adalah diharapkan bahawa penemuan daripada kajian ini dapat memberi kefahaman
yang lebih mendalam mengenai profil ketepuan tanah, dan seterusnya memberi
sumbangan dalam pencegahan tanah runtuh akibat hujan.

iv
TABLE OF CONTENTS
CHAPTER TITLE PAGE
TITLE OF PROJECT
ACKNOWLEDGEMENT
ABSTRACT
ABSTRAK
TABLE OF CONTENTS
LIST OF TABLES
LIST OF FIGURES
LIST OF SYMBOLS
LIST OF APPENDICES
i
ii
iii
iv
vii
viii
x
xi
1 INTRODUCTION 1
1.1 Background of the Study
1.2 Objectives
1.3 Scope of the Study
1.4 Significance of the Study
1
2
3
3
2 LITERATURE STUDY 4
2.1 Introduction
2.2 Hydraulic Properties of Soil
2.2.1 Soil Water Characteristic Curve (SWCC)
2.2.2 Hydraulic Conductivity Function
2.3 Rainfall Infiltration Model
4
4
5
6
8

v
2.4 Wetting Front and Redistribution
2.5 One-Dimensional Infiltration test
11
14
2.6 Concluding Remarks
16
3 METHODOLOGY 18
3.1 Introduction 18
3.2 Setup of Soil Column Model 20
3.2.1 Soil Column
3.2.2 Water Flow System
3.2.3 Instrumentations
3.2.4 Data Logging and Acquisition System
21
23
24
27
4 DATA AND DISCUSSIONS
4.1 Introduction
29
29
4.2 Soil Materials
4.3 Experimental Design
4.4 Relationships between Infiltration and Runoff
29
33
35
4.5 Saturation Profiles 37
4.6 Suction Redistributions 40
4.7 Concluding Remarks 41
5 CONCLUSIONS AND SUGGESTIONS 43
5.1 Introduction
5.2 Conclusions
43
43
5.2.1 Laboratory Model for Saturation Profile Study
5.2.2 Dominant Factors Affecting Saturation Profile
5.2.3 Development of Saturation Profile
44
44
45
5.3 Suggestions for Future Researches
45

vi
REFERENCES
Appendix A
List of Related Publications
47
51-58
59

vii
LIST OF TABLES TABLE NO. TITLE PAGE
4.1 Physical properties of the soils 32 4.2 Experimental design for Infiltration Tests
33
viii
LIST OF FIGURES FIGURE NO. TITLE PAGE
2.1 Typical absorption and desorption SWCC (Zhan and Ng, 2004)
5
2.2 Typical suction-dependent hydraulic conductivity function
7
2.3 Relationship between rainfall and infiltration
10
2.4 Development of wetting front
12
2.5 Volumetric water content and suction in the development of wetting front
13
2.6 Redistribution of soil moisture for (a) Lf < Lcr and (b) Lf > Lcr
14
2.7 Schematic diagram of soil column developed by Yang et al. (2004)
16
3.1 Research framework
19
3.2 Three-dimensional diagram of the laboratory model setup 20
3.3 Photograph of the laboratory model setup
21
3.4 Components of the soil column model
22
3.5 An assembled (a) Tensiometer-transducer, (b) Gypsum block
25
3.6 (a) Photograph, (b) Three-dimensional diagram, and (c) Cross-sectional view of the tensiometer connector
26
ix
3.7 (a) Photograph, (b) Three-dimensional diagram, and (c) Cross-sectional view of the gypsum block connector
26
3.8 Data acquisition system
28
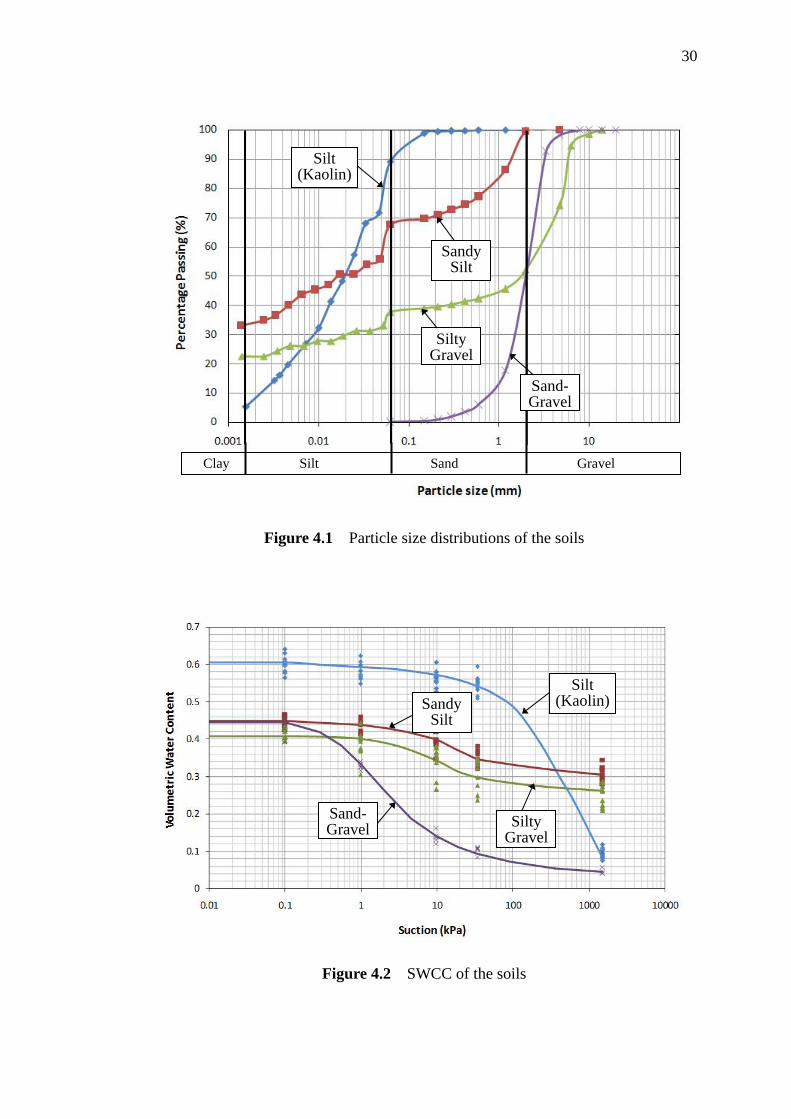
4.1 Particle size distribution of the soils
30
4.2 4.3 4.4
SWCC of the soils Hydraulic conductivity function of the soils SEM images of (a) sand-gravel, (b) silty gravel, (c) sandy silt, and (d) silt (kaolin)
30
31
31
4.5 The setup of soil column models for (a) sand-gravel, (b) silty gravel, (c) sandy silt, and (d) silt (kaolin)
34
4.6 Relationships between rainfall and surface runoff for (a) silty gravel, (b) sandy silt, and (c) silt (kaolin)
35
4.7 Cracks formed at the surface of silt (kaolin)
36
4.8 Saturation profiles in (a) sand-gravel, (b) silty gravel, (c) sandy silt, and (d) silt (kaolin)
38
4.9 Suction redistributions in (a) sand-gravel, (b) silty gravel, (c) sandy silt, and (d) silt (kaolin)
40

x
LIST OF SYMBOLS
Aev - Air entry value
I - Rainfall intensity
k - Water coefficient of permeability
ksat - Saturated permeability
Lf - Wetting front depth
mw - Slope of soil water characteristic curve (SWCC)
q - Rainfall unit flux
Q - Rainfall total flux
S - Wetting front capillary suction
Sr - Degree of saturation
t - Time
tp - Time when surface runoff start to occur
θ - Volumetric water content
ψ - Suction

xi
LIST OF APPENDICES APPENDIX TITLE
PAGE
A Program for CR10X Data Logger
51
CHAPTER 1
INTRODUCTION 1.1 Background of the Study
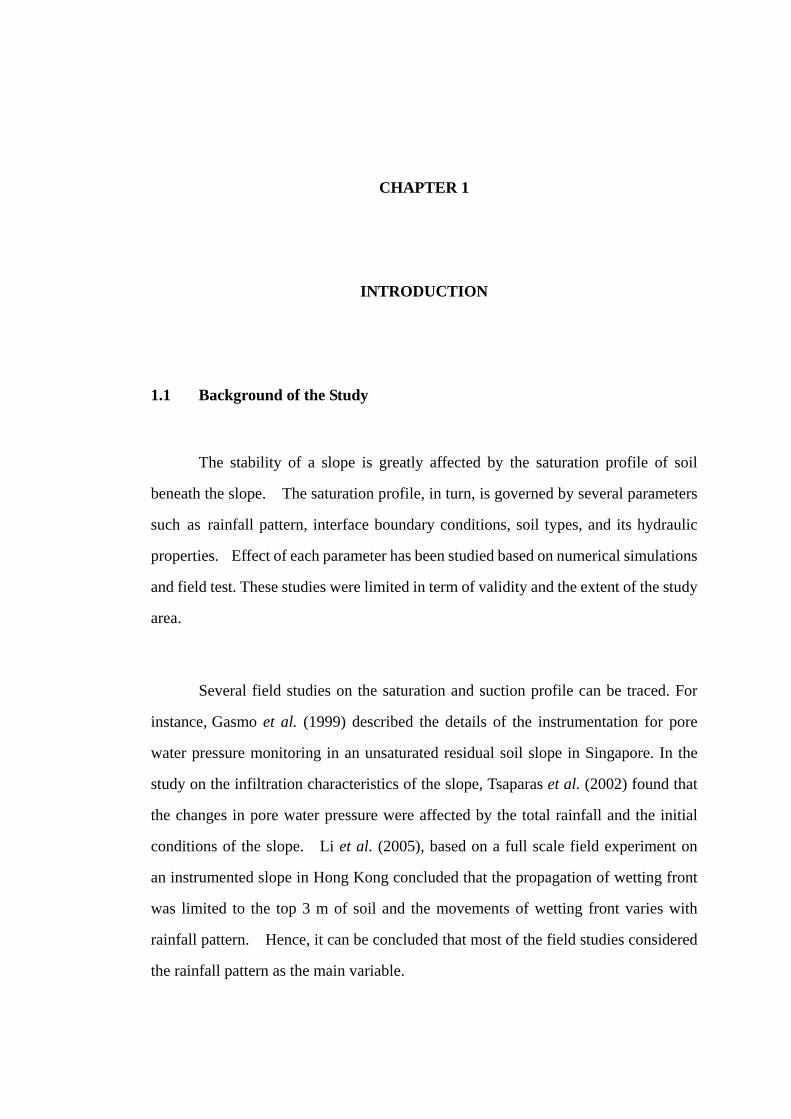
The stability of a slope is greatly affected by the saturation profile of soil
beneath the slope. The saturation profile, in turn, is governed by several parameters
such as rainfall pattern, interface boundary conditions, soil types, and its hydraulic
properties. Effect of each parameter has been studied based on numerical simulations
and field test. These studies were limited in term of validity and the extent of the study
area. Several field studies on the saturation and suction profile can be traced. For
instance, Gasmo et al. (1999) described the details of the instrumentation for pore
water pressure monitoring in an unsaturated residual soil slope in Singapore. In the
study on the infiltration characteristics of the slope, Tsaparas et al. (2002) found that
the changes in pore water pressure were affected by the total rainfall and the initial
conditions of the slope. Li et al. (2005), based on a full scale field experiment on
an instrumented slope in Hong Kong concluded that the propagation of wetting front
was limited to the top 3 m of soil and the movements of wetting front varies with
rainfall pattern. Hence, it can be concluded that most of the field studies considered
the rainfall pattern as the main variable.

2
The effect of soil type on the saturation profile has been studied numerically
by several researchers, i.e. Tsaparas et al. (2002), Pradel and Raad (1993), Cai and
Ugai (2004) and Gofar et al. (2007). Most of the studies suggested that the soil
with low permeability should contribute to higher degree of saturation compared to
high permeable soil. Apparently, more variables can be taken into account, owing
to the rapid development in computing power and numerical analyzing tools.
However, the validity of the result becomes a major concern as the soil could behave
differently in actual condition. This research looked into several variables affecting the development of
saturation profile, including rainfall pattern, soil type and boundary conditions. The
ability to combine those parameters into a comprehensive laboratory model enhanced
the understanding on the saturation profile beneath a soil slope. 1.2 Objectives The study was carried out in fulfillment of the following objectives:
i. To fabricate a small scale laboratory model for investigation of the
mechanisms involved in the development of saturation profile.
ii. To study the dominant factors affecting each mechanism.
iii. To study the overall mechanism in the comprehensive laboratory model
3
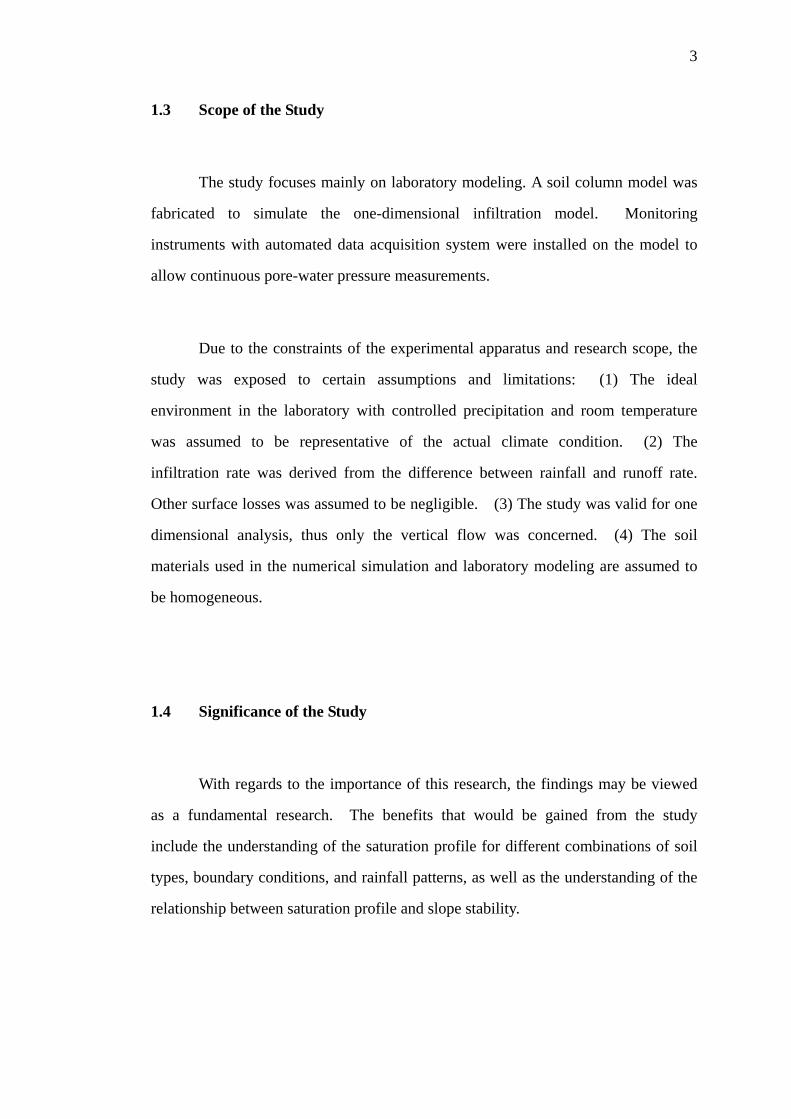
1.3 Scope of the Study
The study focuses mainly on laboratory modeling. A soil column model was
fabricated to simulate the one-dimensional infiltration model. Monitoring
instruments with automated data acquisition system were installed on the model to
allow continuous pore-water pressure measurements. Due to the constraints of the experimental apparatus and research scope, the
study was exposed to certain assumptions and limitations: (1) The ideal
environment in the laboratory with controlled precipitation and room temperature
was assumed to be representative of the actual climate condition. (2) The
infiltration rate was derived from the difference between rainfall and runoff rate.
Other surface losses was assumed to be negligible. (3) The study was valid for one
dimensional analysis, thus only the vertical flow was concerned. (4) The soil
materials used in the numerical simulation and laboratory modeling are assumed to
be homogeneous. 1.4 Significance of the Study
With regards to the importance of this research, the findings may be viewed
as a fundamental research. The benefits that would be gained from the study
include the understanding of the saturation profile for different combinations of soil
types, boundary conditions, and rainfall patterns, as well as the understanding of the
relationship between saturation profile and slope stability.
CHAPTER 2
LITERATURE STUDY 2.1 Introduction
This chapter provides the basic and clinical researches on the topic of
saturation profile in soil. Considerable literatures relevant to the topic are available.
Most of the literatures were directed towards determining the saturation profile under
certain rainfall condition, development of wetting front, and studies on the hydraulic
properties of unsaturated soils, and case studies from different parts of the world.
The one-dimensional infiltration tests carried out by previous researchers are also
reviewed in the latter part of this chapter.
2.2 Hydraulic Properties of Soil
The hydraulic properties of soil can be attributed to water retention
characteristic (soil water characteristic curve) and water coefficient of permeability
(hydraulic conductivity function).
5
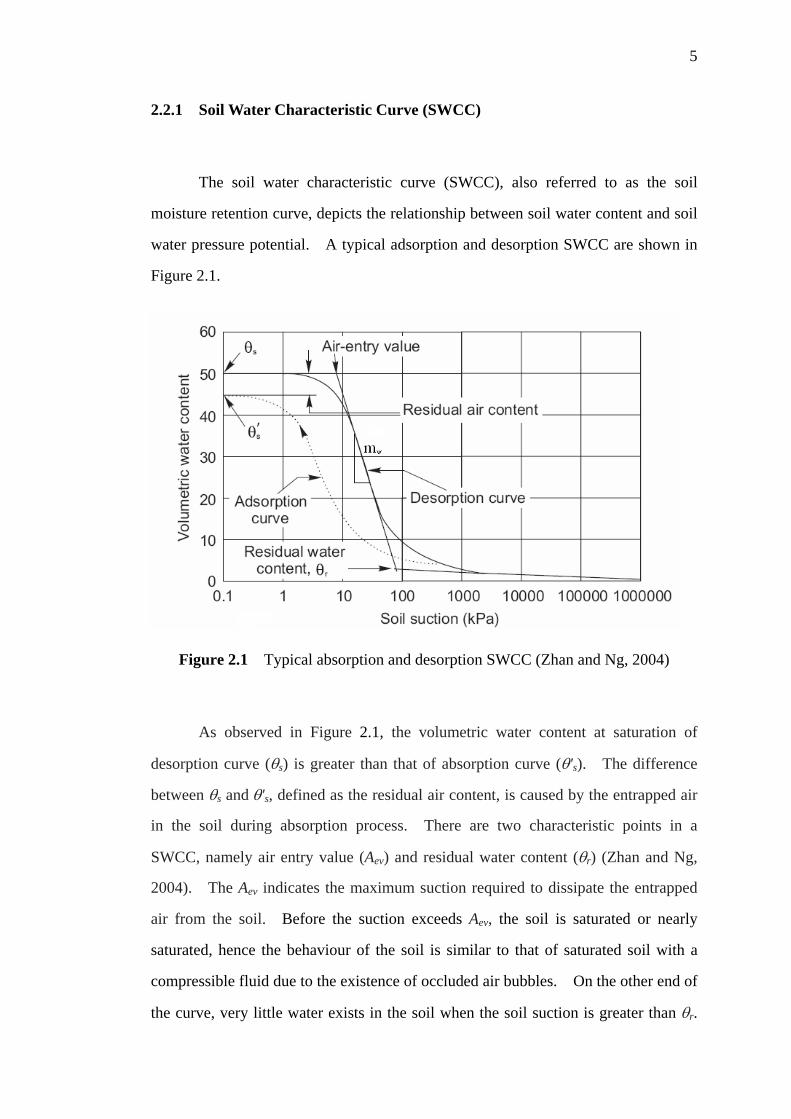
2.2.1 Soil Water Characteristic Curve (SWCC) The soil water characteristic curve (SWCC), also referred to as the soil
moisture retention curve, depicts the relationship between soil water content and soil
water pressure potential. A typical adsorption and desorption SWCC are shown in
Figure 2.1.
Figure 2.1 Typical absorption and desorption SWCC (Zhan and Ng, 2004) As observed in Figure 2.1, the volumetric water content at saturation of
desorption curve (θs) is greater than that of absorption curve (θ's). The difference
between θs and θ's, defined as the residual air content, is caused by the entrapped air
in the soil during absorption process. There are two characteristic points in a
SWCC, namely air entry value (Aev) and residual water content (θr) (Zhan and Ng,
2004). The Aev indicates the maximum suction required to dissipate the entrapped
air from the soil. Before the suction exceeds Aev, the soil is saturated or nearly
saturated, hence the behaviour of the soil is similar to that of saturated soil with a
compressible fluid due to the existence of occluded air bubbles. On the other end of
the curve, very little water exists in the soil when the soil suction is greater than θr.

6
The effect of water content on the behaviour of soil is thus negligible. As the result,
the soil at these two unsaturated stages is not the main concern for the behaviour of
unsaturated soil (Bao et al., 1998). What is of greater concern is the SWCC
between Aev and θr, in which both air and water phases are continuous or partially
continuous, and the soil properties are strongly related to its water content or
negative pore-water pressure (Zhan and Ng, 2004). The rate of changes in negative
pore-water pressure corresponding to volumetric water content is represented by the
slope of SWCC (mw).
A wide-array of methods can be used to obtain the SWCC, depending on the
desired path (absorption or desorption) and the range of matric suction. Laboratory
SWCC test can be conducted by using pressure plate test (for suction less than 1500
kPa), salt solution method (for suction greater than 1500 kPa), and capillary rise open
tube method (for absorption SWCC), while field SWCC can be obtained by taking
the field measurements of water content and suction by moisture probe and
tensiometer, simultaneously. Alternatively, the SWCC can be predicted by using
empirical relationships, as proposed by several researchers included Fredlund and
Xing (1994), Agus et al. (2001) and Gitirana and Fredlund (2004).
2.2.2 Hydraulic Conductivity Function
The water coefficient of permeability (k) represents the soil’s ability to
transmit and drain water. This, in turn, indicates the ability of the soil to change
matric suction as a result of environmental changes (Fredlund and Rahardjo, 1993).
Water coefficient of permeability of saturated soil is a function of void ratio (e) only.
For unsaturated soil, the water coefficient of permeability is a function of void ratio
(e) and volumetric water content (θ). This relationship is commonly expressed by a
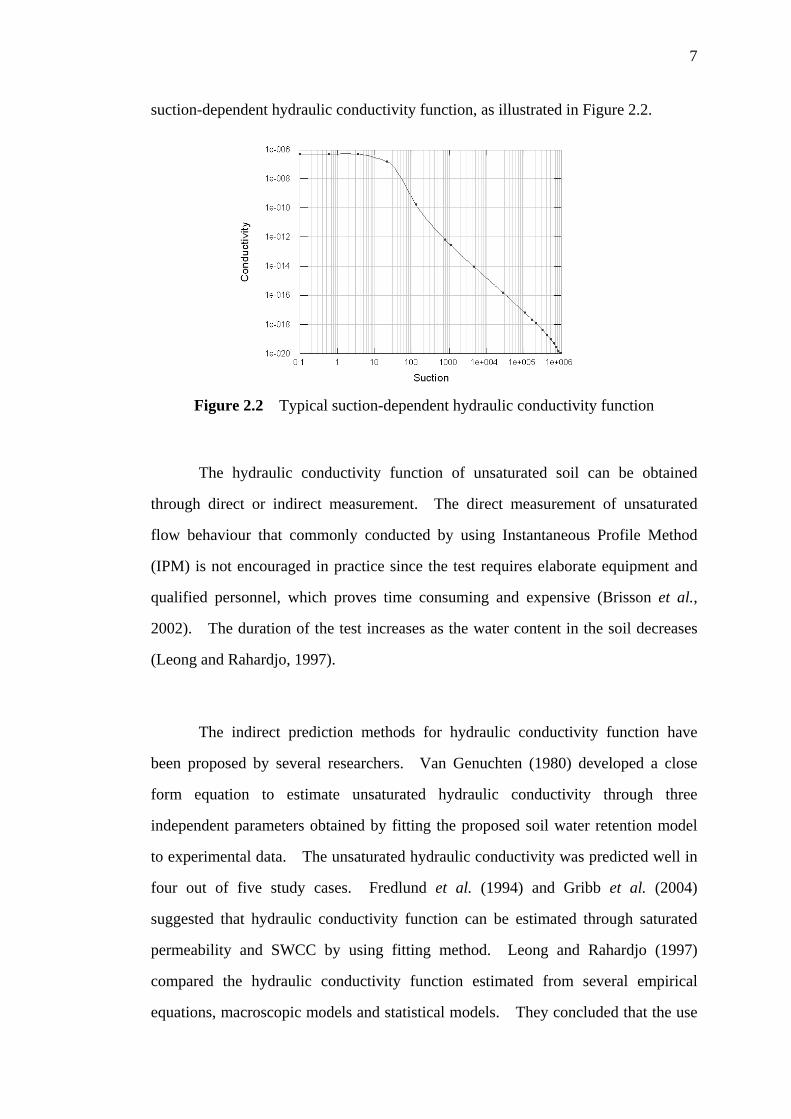
7
suction-dependent hydraulic conductivity function, as illustrated in Figure 2.2.
Figure 2.2 Typical suction-dependent hydraulic conductivity function The hydraulic conductivity function of unsaturated soil can be obtained
through direct or indirect measurement. The direct measurement of unsaturated
flow behaviour that commonly conducted by using Instantaneous Profile Method
(IPM) is not encouraged in practice since the test requires elaborate equipment and
qualified personnel, which proves time consuming and expensive (Brisson et al.,
2002). The duration of the test increases as the water content in the soil decreases
(Leong and Rahardjo, 1997). The indirect prediction methods for hydraulic conductivity function have
been proposed by several researchers. Van Genuchten (1980) developed a close
form equation to estimate unsaturated hydraulic conductivity through three
independent parameters obtained by fitting the proposed soil water retention model
to experimental data. The unsaturated hydraulic conductivity was predicted well in
four out of five study cases. Fredlund et al. (1994) and Gribb et al. (2004)
suggested that hydraulic conductivity function can be estimated through saturated
permeability and SWCC by using fitting method. Leong and Rahardjo (1997)
compared the hydraulic conductivity function estimated from several empirical
equations, macroscopic models and statistical models. They concluded that the use
8
of newly developed empirical equations could give a good fit to the experimental
data. In conclusion, methods of predicting hydraulic conductivity function
indirectly can be used with confidence when no experimental data are feasible.
2.3 Rainfall Infiltration Model
Studies of rainfall infiltration have been performed systematically since the
1970s (Sung and Seung, 2002). From the definitions, the rainfall may be separated
into four components, i.e. runoff, infiltration, interception (rainfall that is caught on
the vegetation surfaces), and evapotranspiration (ET). Interception and ET are
often disregarded when identifying rainfall components because they represent a
small portion of the total rainfall (Joel et al. 2002). These simplifications leave the
approximation of rainfall is nearly equal to the infiltration and runoff. One of the earliest physical infiltration models was developed by Green and
Ampt (1911). Based on the model, the time (t) required to saturate the soil to a
depth (Lf) is:
⎥⎦
⎤⎢⎣
⎡ +−= )ln(
SLS
SLk
t ff
w
μ (2.1)
Where, μ = differences between the volumetric water content before and after wetting
kw = hydraulic conductivity of wetted zone
S = wetting front capillary suction
9
The infiltration rate (If) is the rate at which water enter the soil surface. The
Green-Ampt model predicts:
f
fwf L
LSkI
+= (2.2)
In Green and Ampt’s model of infiltration, water from precipitation is
assumed to enter the soil as a sharp wetting front. The soil above the front is
assumed to be saturated. The soil below of the front is assumed at some uniform
initial moisture. This model gives a very reasonable prediction even when
compared with other more rigorous approaches based on unsaturated flow (Bouwer,
1966). Other researchers such as Mein and Larson (1973), Neuman (1976),
Loáiciga and Huang (2007) have produced a similar infiltration equation with some
modifications.
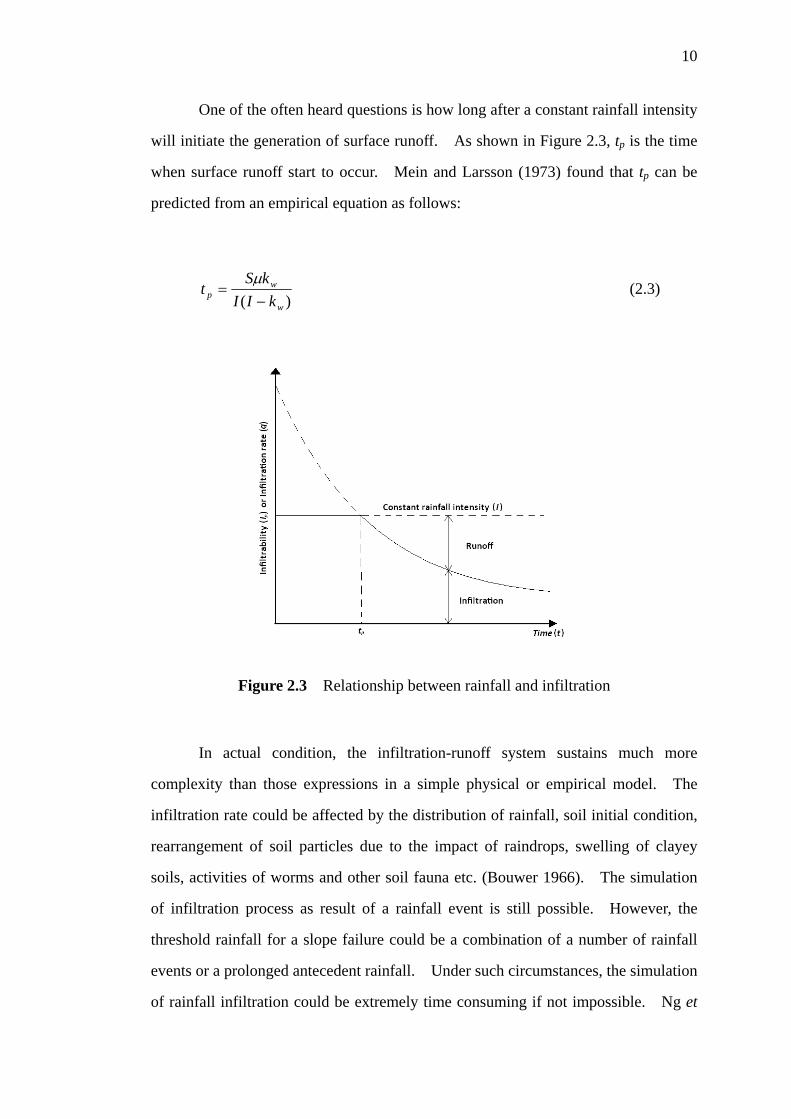
Figure 2.3 shows the relationship between rainfall and infiltration. Initially
the infiltrability (Ip) is greater than the rainfall intensity (I). Thus, the infiltration
rate (If) is limited by the I. After a period of constant rainfall, the Ip decreases over
time to a rate of less than I. At this stage, the If is controlled by the Ip, and surface
runoff takes place. Horton (1933) found that when there is plenty of water available
for infiltration, the infiltration rate follows the limiting function of Ip, until a constant
rate known as infiltration capacity is reached. Freeze and Cherry (1979) found that
the infiltration capacity is equal to the saturated permeability of soil (ksat). This
finding was supported by Mein and Larson (1973) who found that the infiltration rate
is initially exceeded the saturated permeability of soil, but drops to a value identical
to the saturated permeability when the soil becomes fully saturated.
10
One of the often heard questions is how long after a constant rainfall intensity
will initiate the generation of surface runoff. As shown in Figure 2.3, tp is the time
when surface runoff start to occur. Mein and Larsson (1973) found that tp can be
predicted from an empirical equation as follows:
)( w
wp kII
kSt
−=
μ (2.3)
Figure 2.3 Relationship between rainfall and infiltration In actual condition, the infiltration-runoff system sustains much more
complexity than those expressions in a simple physical or empirical model. The
infiltration rate could be affected by the distribution of rainfall, soil initial condition,
rearrangement of soil particles due to the impact of raindrops, swelling of clayey
soils, activities of worms and other soil fauna etc. (Bouwer 1966). The simulation
of infiltration process as result of a rainfall event is still possible. However, the
threshold rainfall for a slope failure could be a combination of a number of rainfall
events or a prolonged antecedent rainfall. Under such circumstances, the simulation
of rainfall infiltration could be extremely time consuming if not impossible. Ng et
11
al. (2003) who carried out their studies on the rainfall-induced slope failure in Hong
Kong suggested that, on average, 40% of rainfall considered as surface loss.
Rahardjo et al. (2004) made another assumption in Singapore by suggesting 60% of
rainfall contributed to the surface loss. Despite of the fact that such correlation
could be vague, it is still an acceptable assumption in practice.
2.4 Wetting Front and Redistribution Wetting front and redistribution are two important phenomena in the
saturation profile of unsaturated soil. As mentioned earlier, the conceptual model
based on a sharp wetting front approach was first developed by Green and Ampt
(1911). The studies in wetting front have been extended by numerous researchers,
with the likes of Lumb (1962), Bouwer (1966), Mein and Farrel (1974), Pradel and
Raad (1993), Kim et al. (2006), and Wang et al. (2003). Recent studies attempted
to correlate the wetting front with the redistribution in order to provide a more
comprehensive explanation to the soil moisture movement after the infiltration
processes (Youngs, 1958; Jury et al., 2003; Wang et al., 2003).
As illustrated in Figure 2.4, the wetting front depth (Lf) under uniform
amount of rainfall infiltration (P) can be approximated to:
iaf
PLθθ −
= (2.4)
Where θa is the average moisture content in the wetted zone, and θi is the
initial moisture content (Wang et al., 2003).
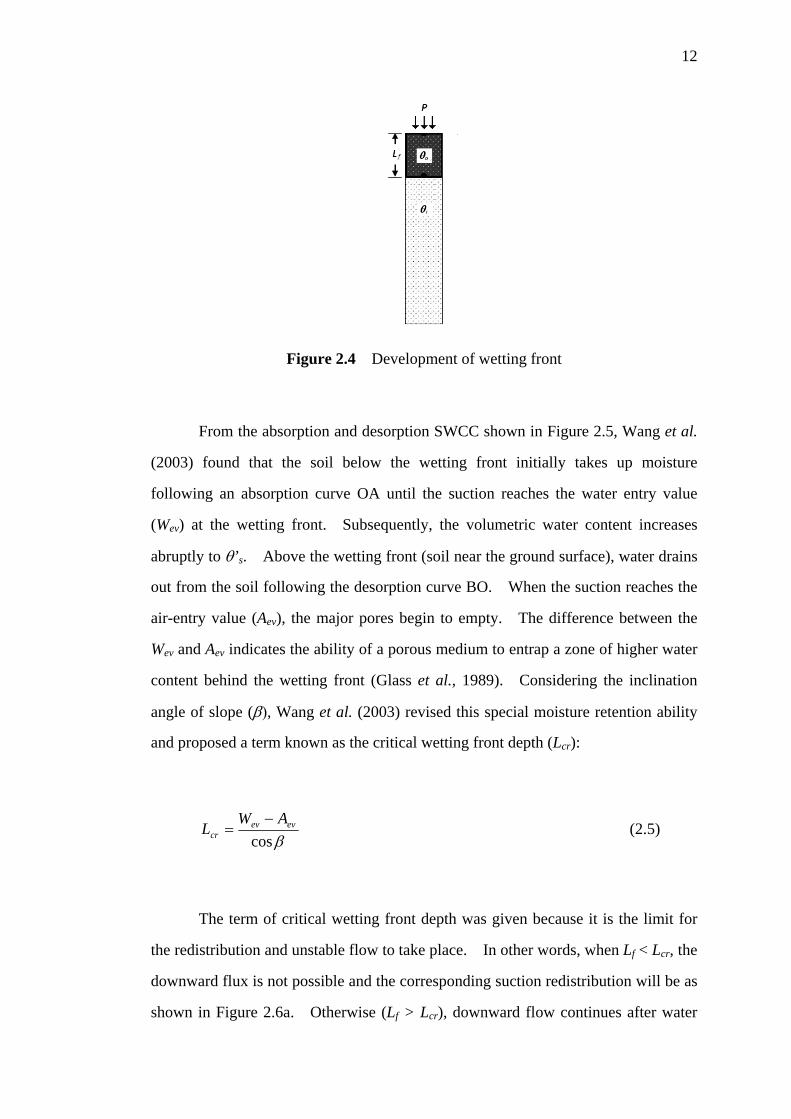
12
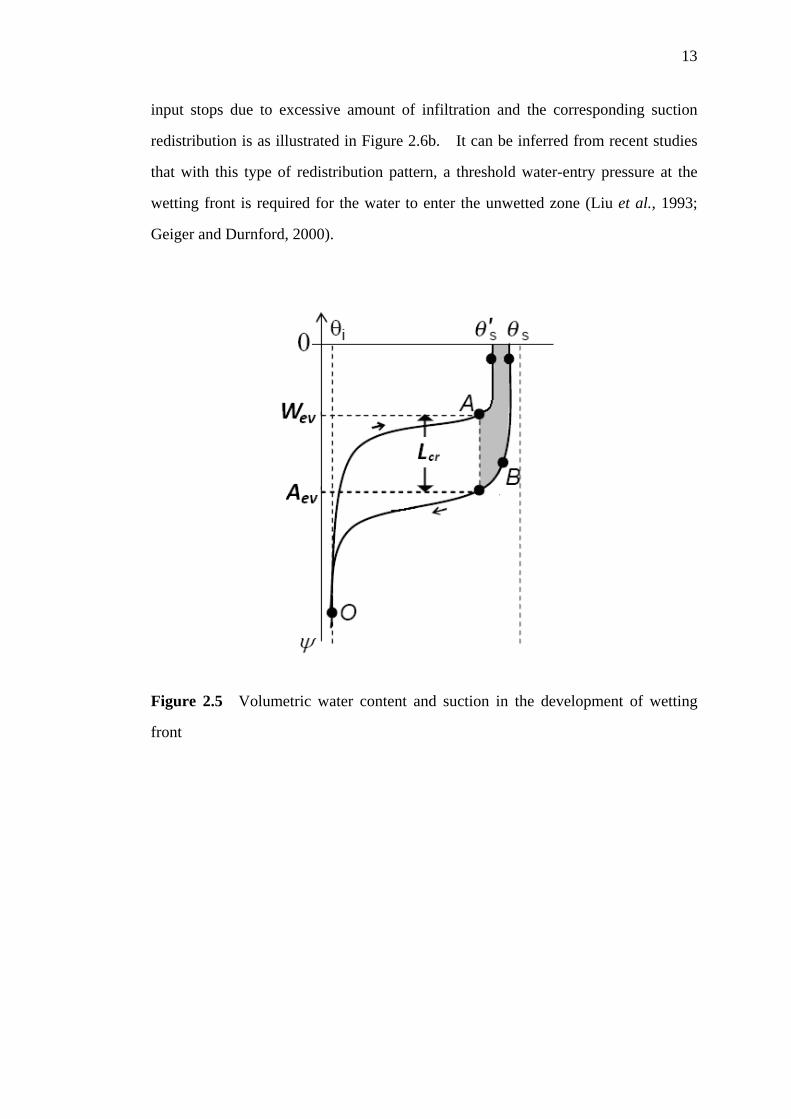
Figure 2.4 Development of wetting front From the absorption and desorption SWCC shown in Figure 2.5, Wang et al.
(2003) found that the soil below the wetting front initially takes up moisture
following an absorption curve OA until the suction reaches the water entry value
(Wev) at the wetting front. Subsequently, the volumetric water content increases
abruptly to θ’s. Above the wetting front (soil near the ground surface), water drains
out from the soil following the desorption curve BO. When the suction reaches the
air-entry value (Aev), the major pores begin to empty. The difference between the
Wev and Aev indicates the ability of a porous medium to entrap a zone of higher water
content behind the wetting front (Glass et al., 1989). Considering the inclination
angle of slope (β), Wang et al. (2003) revised this special moisture retention ability
and proposed a term known as the critical wetting front depth (Lcr):
βcosevev
crAW
L−
= (2.5)
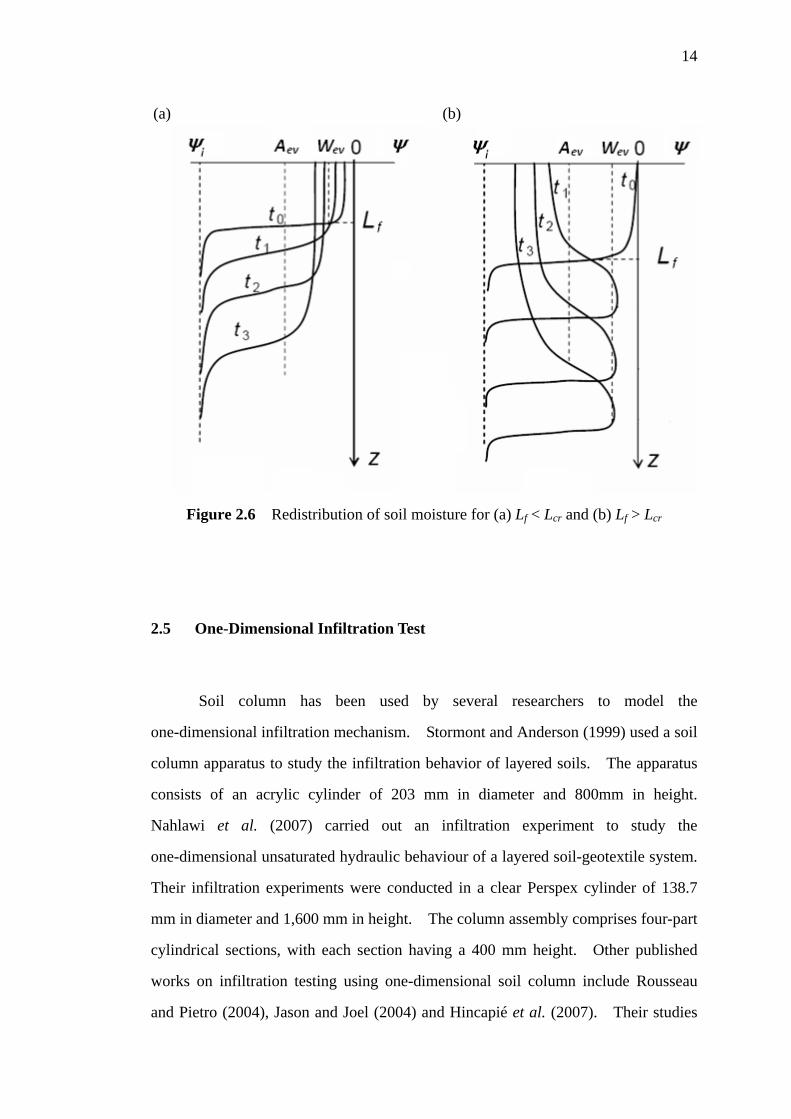
The term of critical wetting front depth was given because it is the limit for
the redistribution and unstable flow to take place. In other words, when Lf < Lcr, the
downward flux is not possible and the corresponding suction redistribution will be as
shown in Figure 2.6a. Otherwise (Lf > Lcr), downward flow continues after water
13
input stops due to excessive amount of infiltration and the corresponding suction
redistribution is as illustrated in Figure 2.6b. It can be inferred from recent studies
that with this type of redistribution pattern, a threshold water-entry pressure at the
wetting front is required for the water to enter the unwetted zone (Liu et al., 1993;
Geiger and Durnford, 2000).
Figure 2.5 Volumetric water content and suction in the development of wetting
front
14
Figure 2.6 Redistribution of soil moisture for (a) Lf < Lcr and (b) Lf > Lcr
2.5 One-Dimensional Infiltration Test
Soil column has been used by several researchers to model the
one-dimensional infiltration mechanism. Stormont and Anderson (1999) used a soil
column apparatus to study the infiltration behavior of layered soils. The apparatus
consists of an acrylic cylinder of 203 mm in diameter and 800mm in height.
Nahlawi et al. (2007) carried out an infiltration experiment to study the
one-dimensional unsaturated hydraulic behaviour of a layered soil-geotextile system.
Their infiltration experiments were conducted in a clear Perspex cylinder of 138.7
mm in diameter and 1,600 mm in height. The column assembly comprises four-part
cylindrical sections, with each section having a 400 mm height. Other published
works on infiltration testing using one-dimensional soil column include Rousseau
and Pietro (2004), Jason and Joel (2004) and Hincapié et al. (2007). Their studies
(b) (a)
15
mainly focused on the investigation of the transportation of contaminants, chemical
solutes and leachate in soil.
The modeling of infiltration mechanism by the soil column infiltration test
can be traced from the studies conducted by Yang et al. (2004b) and Yang et al.
(2006). Yang et al. (2006) investigated the effect of rainfall intensity and duration
on infiltration mechanism through a large scale soil column apparatus, and provide
experimental evidence for soil water redistribution and hysteresis. The details and
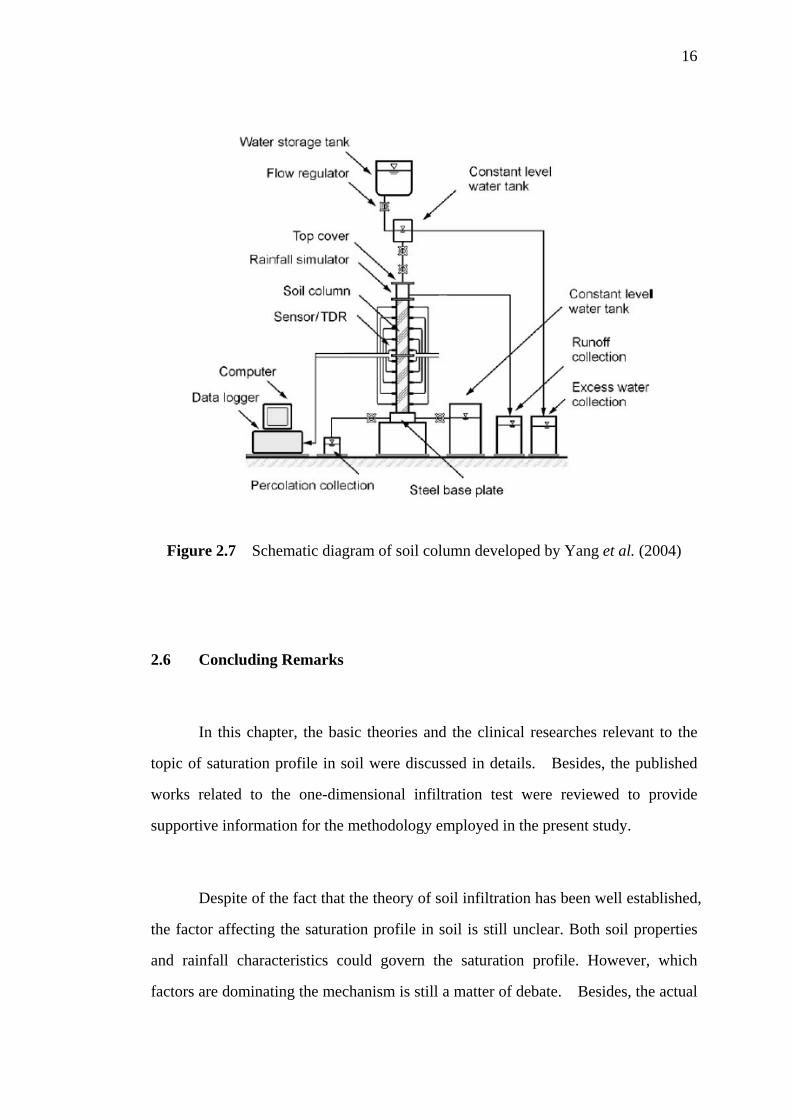
the performance of the apparatus are described by Yang et al. (2004b). Figure 2.7 shows the schematic diagram of the soil column apparatus
developed by Yang et al. (2004b). The soil column was made of acrylic and
supported by a steel frame. The soil column was 1.5m in height with the internal
diameter of 190mm. Two types of instruments were installed on the soil column
model, i.e. tensiometer for suction measurement, and TDR for volumetric water
content measurement. The measurements were logged automatically into a data
logger. Water circulation system was installed to circulate the water discharged
during the tests.
A few criteria should be considered in the design of soil column model to
accommodate the requirements of specific research, i.e. the dimension, the material
and the boundary conditions of the model. Generally, it is recommended that the
diameter of the soil column is ten times greater than the soil particle size in order to
minimize the boundary effect on the test results. Lim et al. (1996) measured the
pore-water pressure changes during rainfall in a slope in Singapore and concluded
that the pore-water pressure changes occurred within the depths of 1.5m. It is thus
essential to use a soil column with sufficient length and dimensions for pore-water
pressure monitoring. Besides, the boundary conditions of the soil column should
also be properly defined to represent the desired condition.
16
Figure 2.7 Schematic diagram of soil column developed by Yang et al. (2004)
2.6 Concluding Remarks In this chapter, the basic theories and the clinical researches relevant to the
topic of saturation profile in soil were discussed in details. Besides, the published
works related to the one-dimensional infiltration test were reviewed to provide
supportive information for the methodology employed in the present study.
Despite of the fact that the theory of soil infiltration has been well established,
the factor affecting the saturation profile in soil is still unclear. Both soil properties
and rainfall characteristics could govern the saturation profile. However, which
factors are dominating the mechanism is still a matter of debate. Besides, the actual

17
behavior of different types of soil under various rainfall patterns has attracted the
interest of researchers. It is the research gaps such as this that provoked this study
to be carried out.
CHAPTER 3
METHODOLOGY 3.1 Introduction
The main objective of this research is to investigate the mechanisms involved
in the development of saturation profile. To achieve these objectives, five phases of
research activities were undertaken, i.e. research initialization, preliminary
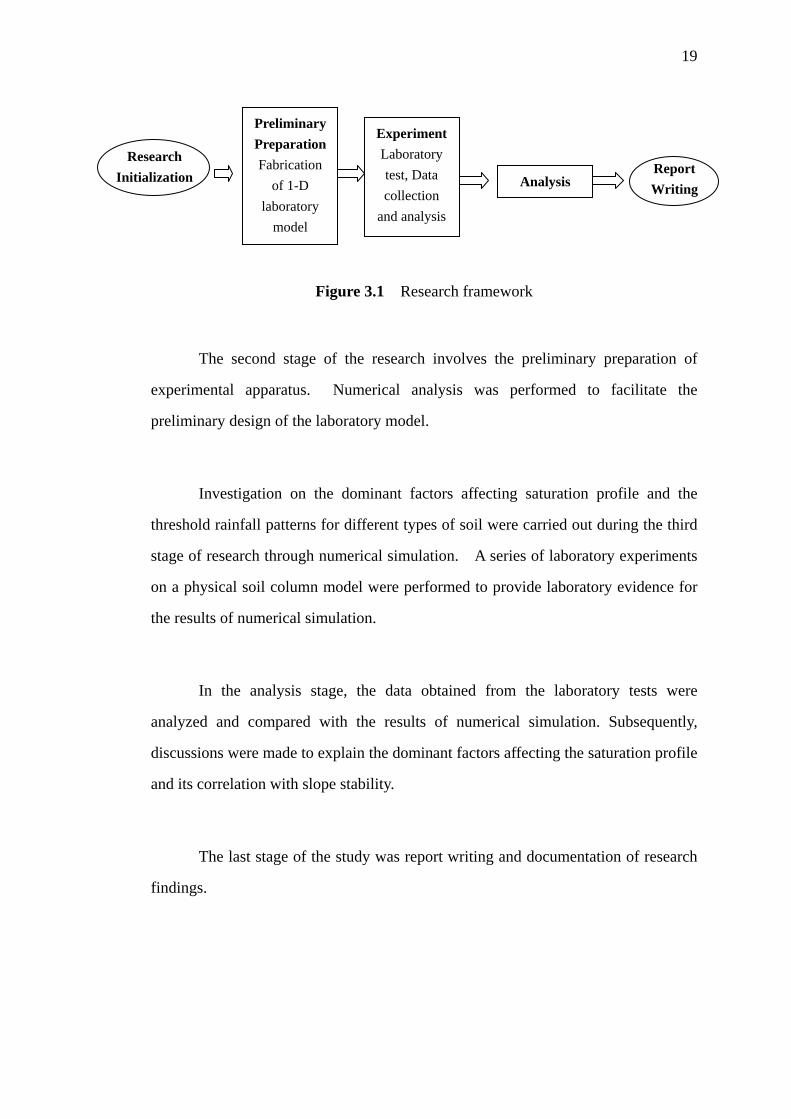
preparation, experiments, analysis, and generalization. Figure 3.1 shows the flow
chart of the research activities. The study was initiated by critically reviewing published works related to the
topic of rainfall-induced slope failure in order to develop a strong background of the
research. The knowledge on the state of the art of the research topic was gained
through consultation with several well-known experts such as Professor Harianto
Rahardjo from Nanyang Technological University Singapore, Dr. David Toll from
University of Durham, Professor Faisal Ali from University of Malaya, Professor
Roslan Zainal Abidin from University Technology Mara, and Mr. Law Tien Huat
from Mohd. Asby Consultant Sdn. Bhd. Problem statement and hypothesis were
formed based on the literature reviews and the professional opinions from experts.
19
Figure 3.1 Research framework
The second stage of the research involves the preliminary preparation of
experimental apparatus. Numerical analysis was performed to facilitate the
preliminary design of the laboratory model. Investigation on the dominant factors affecting saturation profile and the
threshold rainfall patterns for different types of soil were carried out during the third
stage of research through numerical simulation. A series of laboratory experiments
on a physical soil column model were performed to provide laboratory evidence for
the results of numerical simulation. In the analysis stage, the data obtained from the laboratory tests were
analyzed and compared with the results of numerical simulation. Subsequently,
discussions were made to explain the dominant factors affecting the saturation profile
and its correlation with slope stability. The last stage of the study was report writing and documentation of research
findings.
Research Initialization
Preliminary Preparation Fabrication
of 1-D laboratory
model
Experiment Laboratory test, Data collection
and analysis
Analysis Report Writing
20
3.2 Setup of Soil Column Model
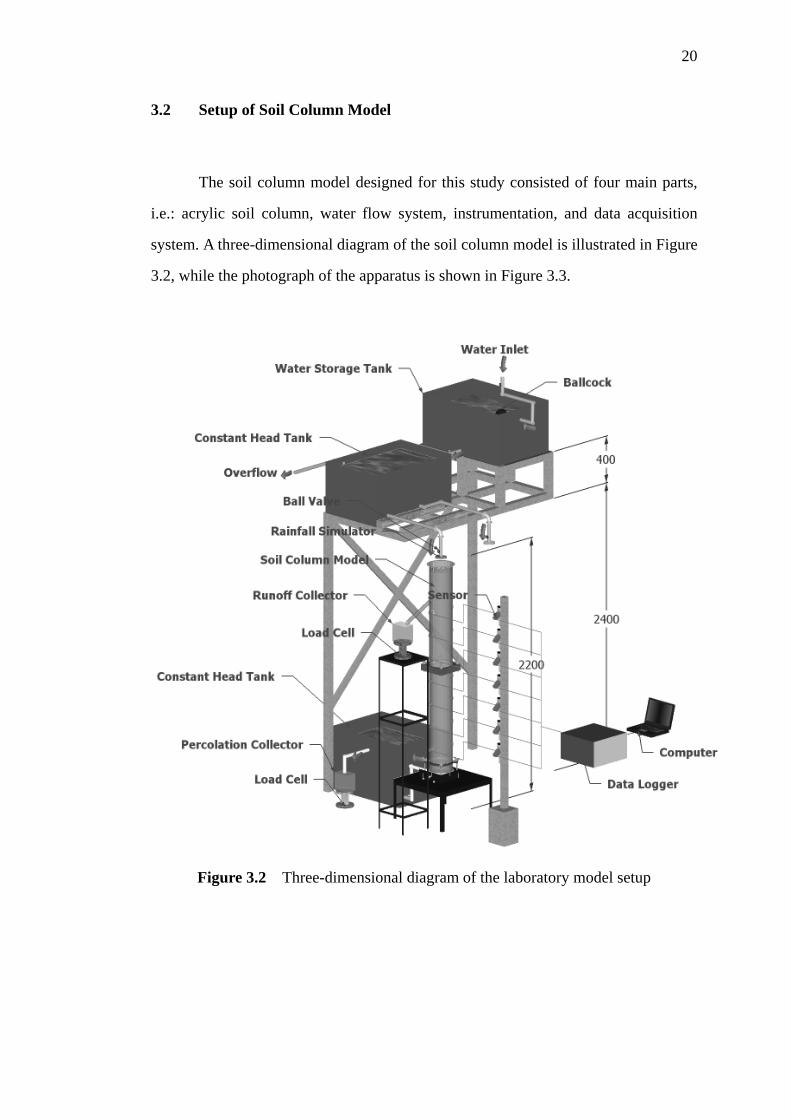
The soil column model designed for this study consisted of four main parts,
i.e.: acrylic soil column, water flow system, instrumentation, and data acquisition
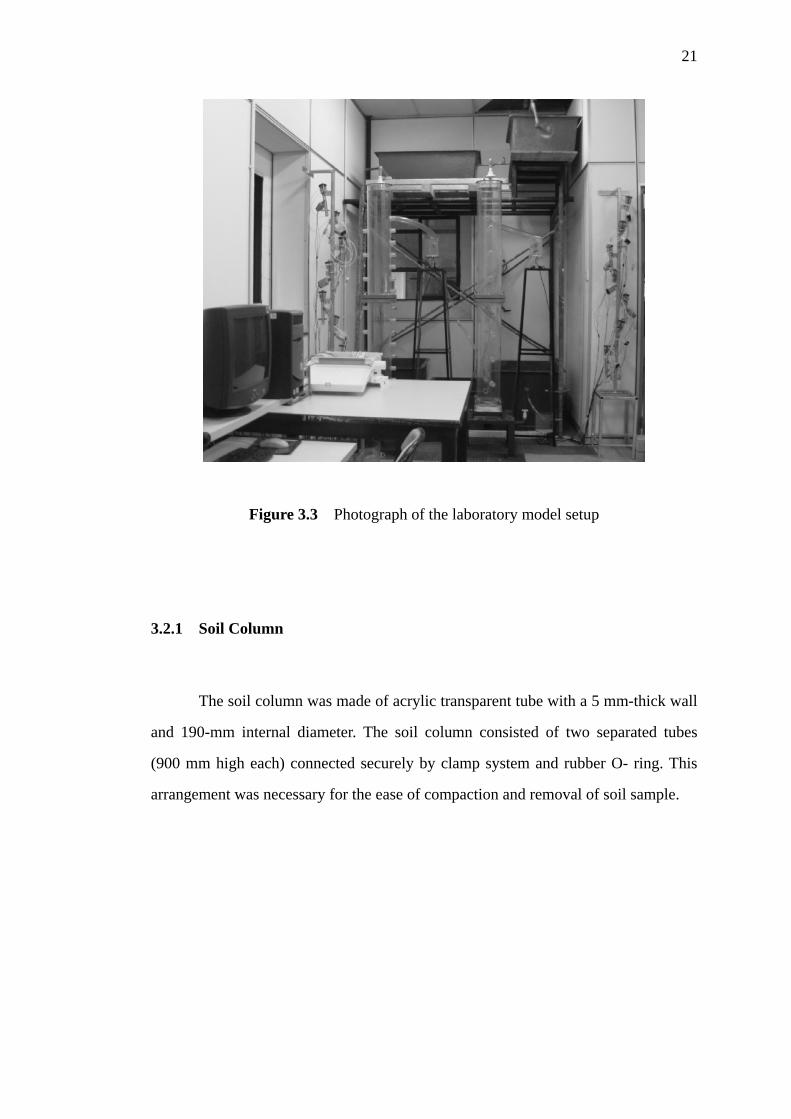
system. A three-dimensional diagram of the soil column model is illustrated in Figure
3.2, while the photograph of the apparatus is shown in Figure 3.3.
Figure 3.2 Three-dimensional diagram of the laboratory model setup
21
Figure 3.3 Photograph of the laboratory model setup 3.2.1 Soil Column
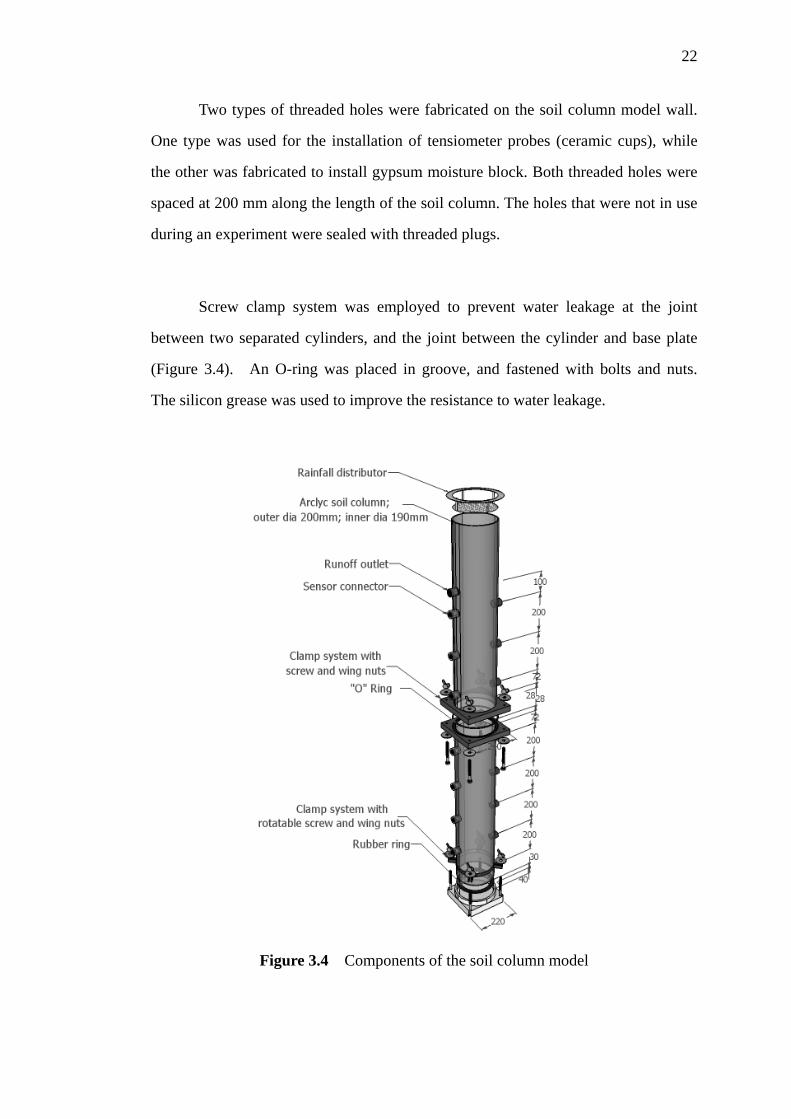
The soil column was made of acrylic transparent tube with a 5 mm-thick wall
and 190-mm internal diameter. The soil column consisted of two separated tubes
(900 mm high each) connected securely by clamp system and rubber O- ring. This
arrangement was necessary for the ease of compaction and removal of soil sample.
22
Two types of threaded holes were fabricated on the soil column model wall.
One type was used for the installation of tensiometer probes (ceramic cups), while
the other was fabricated to install gypsum moisture block. Both threaded holes were
spaced at 200 mm along the length of the soil column. The holes that were not in use
during an experiment were sealed with threaded plugs. Screw clamp system was employed to prevent water leakage at the joint
between two separated cylinders, and the joint between the cylinder and base plate
(Figure 3.4). An O-ring was placed in groove, and fastened with bolts and nuts.
The silicon grease was used to improve the resistance to water leakage.
Figure 3.4 Components of the soil column model

23
3.2.2 Water Flow System
The water flow system of the infiltration column comprises three parts, i.e.
inflow/rainfall control, overflow/runoff discharge, and percolation discharge (Figure
3.2)
The inflow/rainfall control consisted of a water storage tank, a constant head
tank, a flow regulator (ball valve), and a rainfall distributor. The water storage tank
with storage capacity of 216 L was placed 2.8 m from the ground surface. The
function of the water storage tank is to provide continuous water flow into the
constant head tank. The constant head tank, which was placed immediately below the
water storage tank, had a storage capacity of 216L and a constant head of 0.3 m.
Water in the storage tank flowed into the constant head tank through a control valve.
An overflow outlet was placed at the same level with the inlet flow of constant head
tank to create the constant head condition during the test. Beneath the constant head
tank was a flow regulator, by which simulated rainfall rate was precisely controlled.
Note that this system could only produce flow rate greater than 5mL/min (q = 2.94
×10-6 m/s).
A perforated aluminum plate was placed on top of the soil column to avoid
excessive raindrop energy that may cause erosion on the surface of soils. When a
rainfall was applied, the water flowed through the holes of the plate and dripped onto
a piece of filter paper that was placed in contact with the surface of the soil column.
Through these arrangements, water was delivered to the soil surface in a relatively
uniform pattern.
The second component of the water flow system is the overflow / runoff
discharge. The overflow discharge system was used to create the no-ponding upper
24
boundary condition for the soil column. The overflow was discharged as runoff
through the outlet located at the soil surface. The runoff was then directed to a load
cell that has the capacity of 2 kg, to quantify the runoff rate. Alternatively, the
ponding condition can be created by sealing the runoff outlet with a threaded plug. The last component of the water flow system is the outlet for the discharge of
percolated flow. A constant head tank was placed on the floor to maintain the water
table at the bottom of the soil column. This was intended to form a clear lower
boundary condition. The constant head tank with large open area helped to produce a
constant water table with a minimum fluctuation and to allow percolated water in the
soil column to drain out freely. The constant head tank was connected to the soil
column through a flexible tube. Gravels with the average size of 5mm and a filter
paper were placed at the bottom of the soil column to avoid turbulent discharge flow.
When water percolated through the soil column, the water flow into the constant
head tank and drain out through an overflow outlet placed at the tank. The overflow
was directed to a load cell to quantify the rate of percolated flow. 3.2.3 Instrumentations
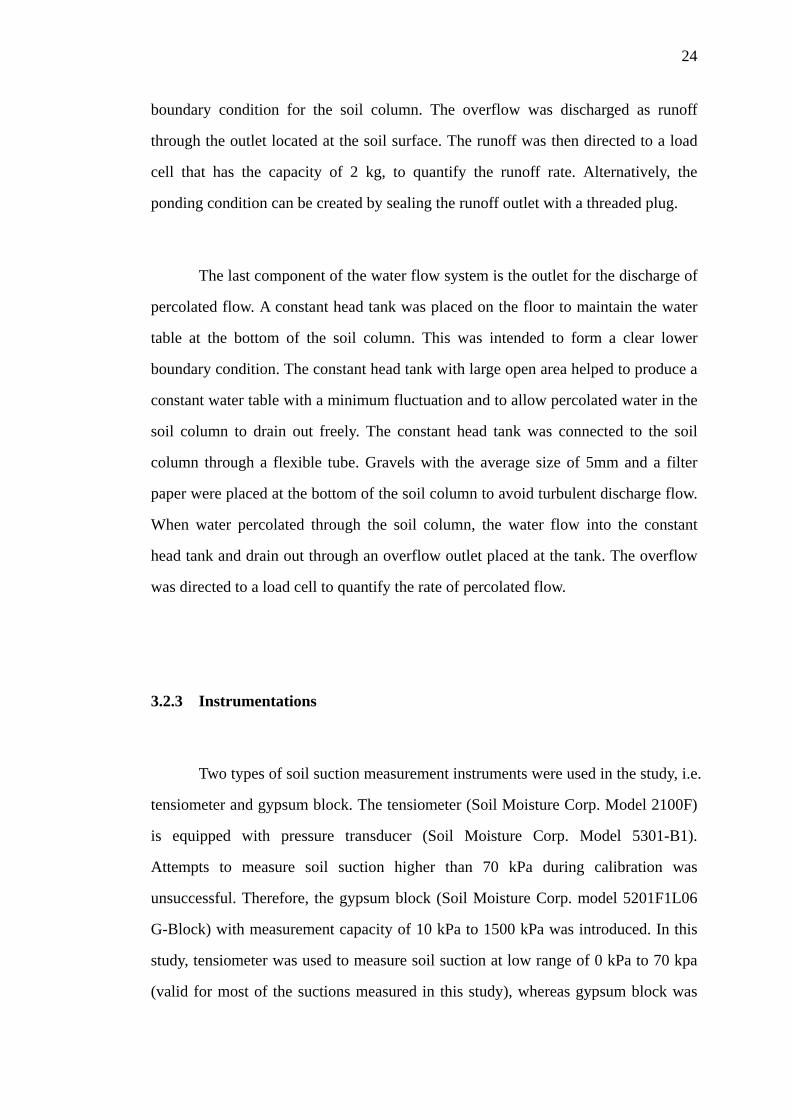
Two types of soil suction measurement instruments were used in the study, i.e.
tensiometer and gypsum block. The tensiometer (Soil Moisture Corp. Model 2100F)
is equipped with pressure transducer (Soil Moisture Corp. Model 5301-B1).
Attempts to measure soil suction higher than 70 kPa during calibration was
unsuccessful. Therefore, the gypsum block (Soil Moisture Corp. model 5201F1L06
G-Block) with measurement capacity of 10 kPa to 1500 kPa was introduced. In this
study, tensiometer was used to measure soil suction at low range of 0 kPa to 70 kpa
(valid for most of the suctions measured in this study), whereas gypsum block was
25
used to ensure that any suction higher than 70kPa could be traced during the process
of setting up initial condition and redistribution. Figure 3.5a and 3.5b show an
assembled tensiometer-transducer and gypsum block, respectively.
(a) (b)
Figure 3.5 (a) An assembled tensiometer-transducer, (b) Gypsum block
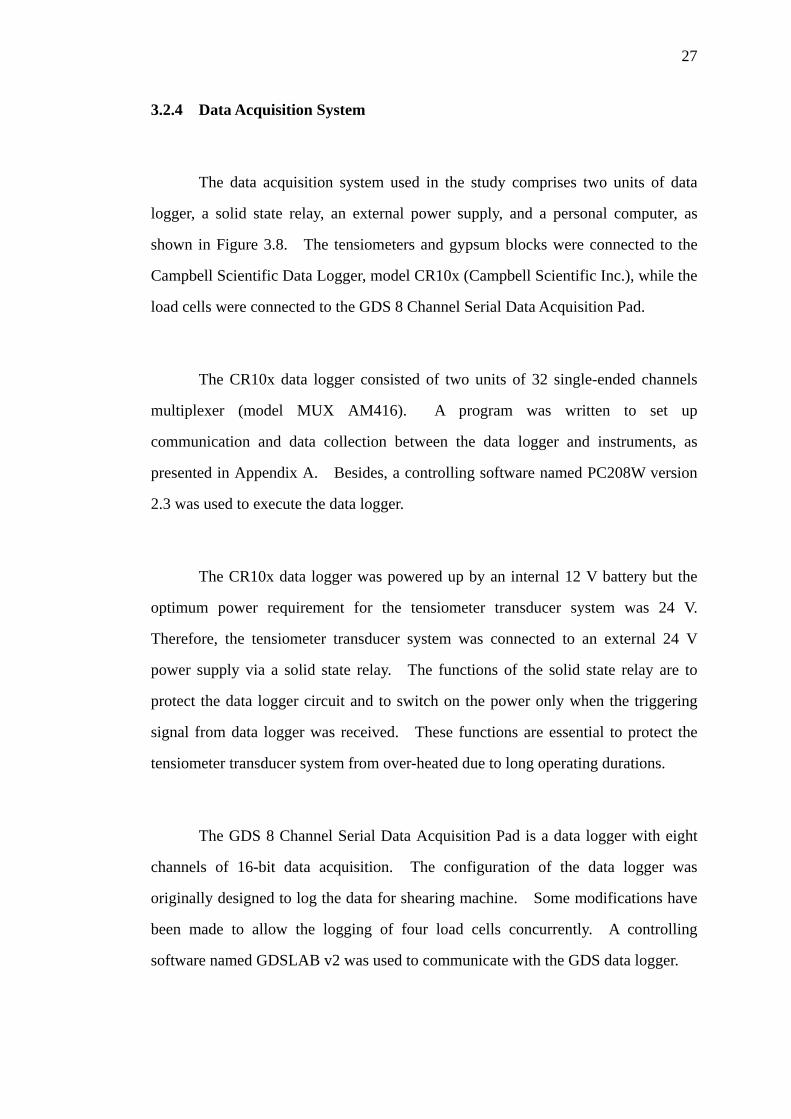
A ceramic cup was installed into the soil column through a predrilled hole
after compacting the soil column. The method offers the advantages of protecting the
ceramic cup from damage during soil compaction, but care should be taken to ensure
that the ceramic cup was closely contacted with the soil particles. To mount the
ceramic cup and the tube assembly on the wall of the acrylic column, holes with
threaded housing were fabricated on the column wall. A specially designed connector
that fit well into the threaded housing, O-ring, and sealing tape were used to form a
good seal at the connection. The details of the connector are shown in Figure 3.6.
The connection of gypsum block to soil column consisted of two parts
(Figure 3.7). The first part was fitted into the housing, while the second part,
facilitated by an “O” Ring, was used to seal the wire fitting to the connector. Since
the gypsum block sensor was connected to the data logger via two wires, it was
essential to use a wire fitting to provide a cylindrical shape for the ease of sealing.
The silicon grout sealer was injected into the space in between the wire fitting and
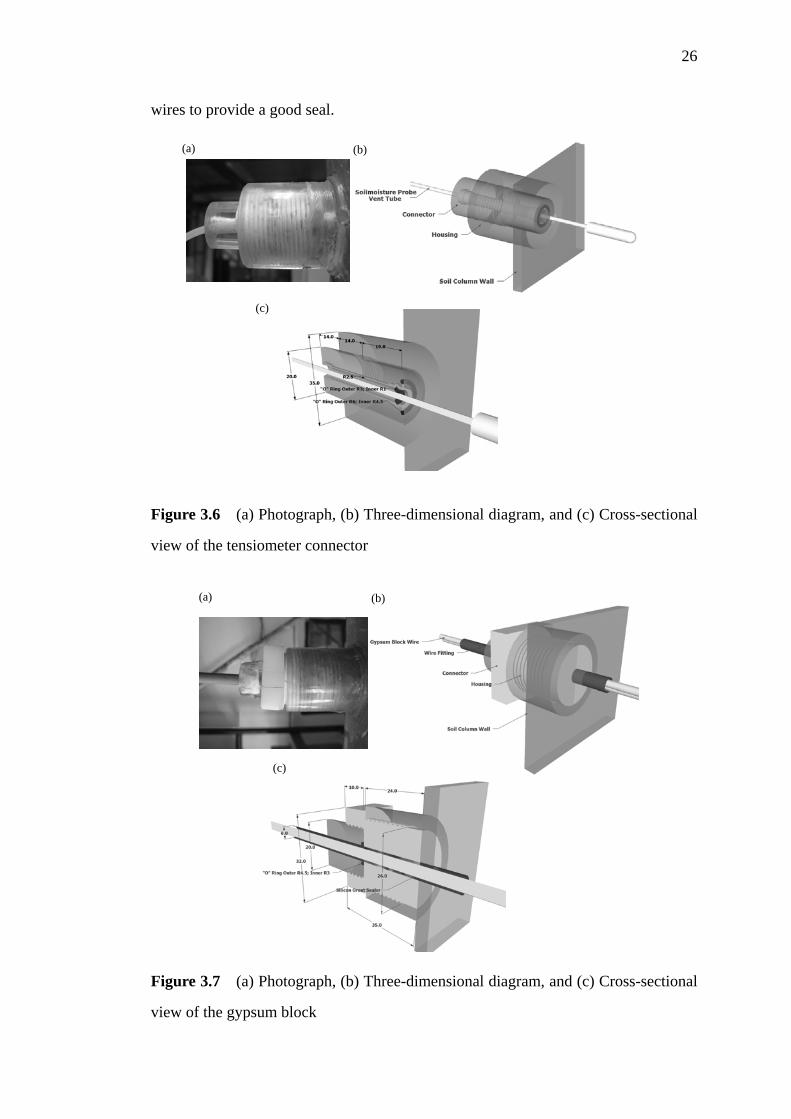
26
wires to provide a good seal.
Figure 3.6 (a) Photograph, (b) Three-dimensional diagram, and (c) Cross-sectional
view of the tensiometer connector
Figure 3.7 (a) Photograph, (b) Three-dimensional diagram, and (c) Cross-sectional
view of the gypsum block
(c)
(a) (b)
(c)
(a) (b)
27
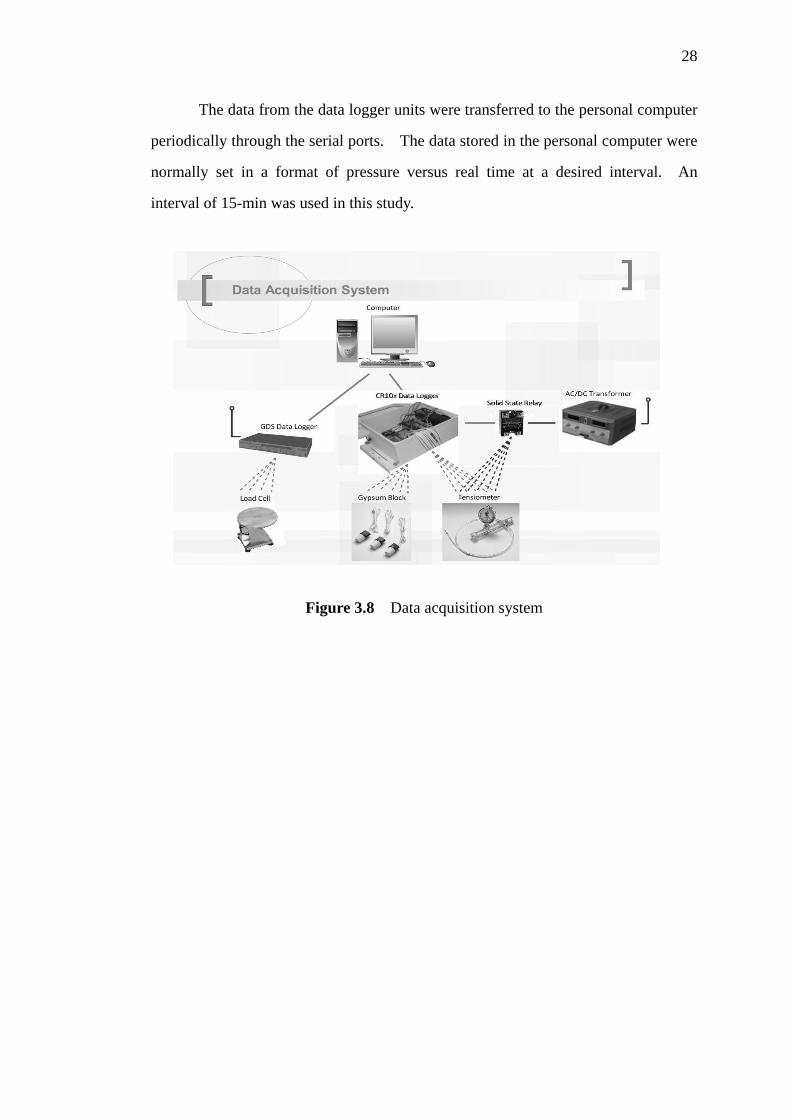
3.2.4 Data Acquisition System
The data acquisition system used in the study comprises two units of data
logger, a solid state relay, an external power supply, and a personal computer, as
shown in Figure 3.8. The tensiometers and gypsum blocks were connected to the
Campbell Scientific Data Logger, model CR10x (Campbell Scientific Inc.), while the
load cells were connected to the GDS 8 Channel Serial Data Acquisition Pad.
The CR10x data logger consisted of two units of 32 single-ended channels
multiplexer (model MUX AM416). A program was written to set up
communication and data collection between the data logger and instruments, as
presented in Appendix A. Besides, a controlling software named PC208W version
2.3 was used to execute the data logger. The CR10x data logger was powered up by an internal 12 V battery but the
optimum power requirement for the tensiometer transducer system was 24 V.
Therefore, the tensiometer transducer system was connected to an external 24 V
power supply via a solid state relay. The functions of the solid state relay are to
protect the data logger circuit and to switch on the power only when the triggering
signal from data logger was received. These functions are essential to protect the
tensiometer transducer system from over-heated due to long operating durations.
The GDS 8 Channel Serial Data Acquisition Pad is a data logger with eight
channels of 16-bit data acquisition. The configuration of the data logger was
originally designed to log the data for shearing machine. Some modifications have
been made to allow the logging of four load cells concurrently. A controlling
software named GDSLAB v2 was used to communicate with the GDS data logger.
28
The data from the data logger units were transferred to the personal computer
periodically through the serial ports. The data stored in the personal computer were
normally set in a format of pressure versus real time at a desired interval. An
interval of 15-min was used in this study.
Figure 3.8 Data acquisition system
CHAPTER 4
DATA AND DISCUSSIONS 4.1 Introduction
This chapter presents the results of one-dimensional infiltration tests carried
out in the laboratory. A total of ten tests were carried out for different combinations
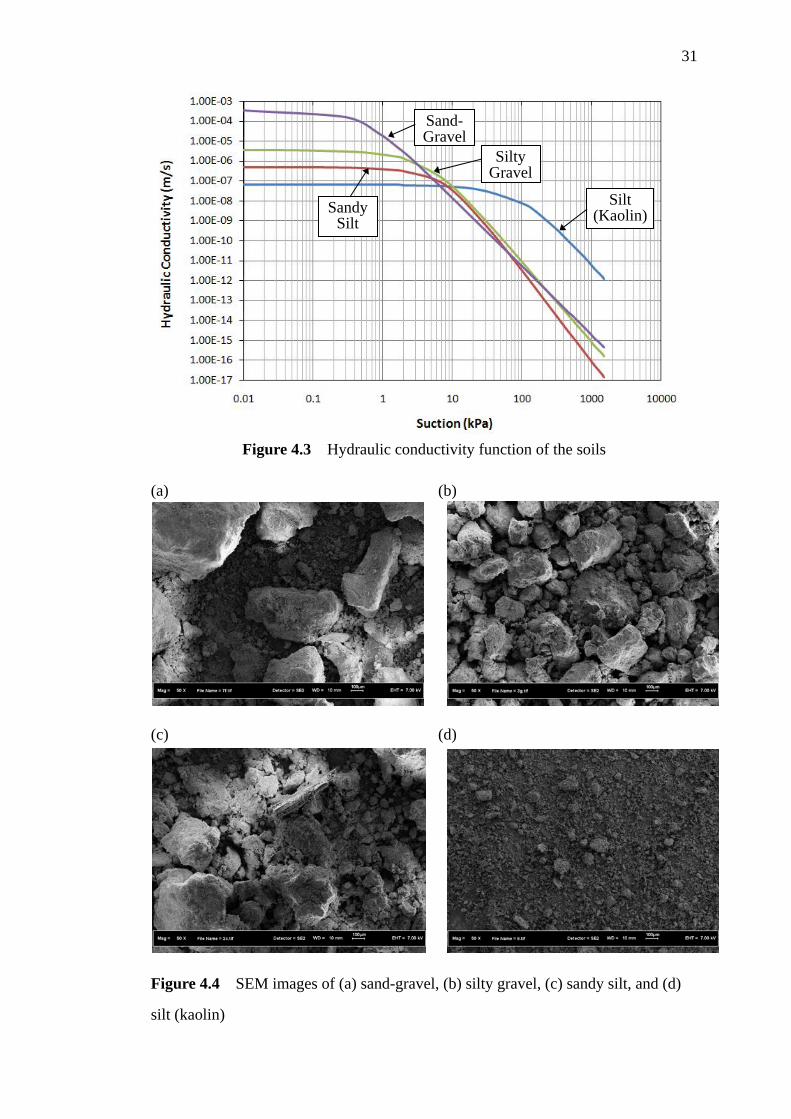
of rainfall patterns and soil types. 4.2 Soil Materials
Four types of soil were employed in the study, i.e. sand-gravel, silty gravel,
sandy silt, and silt (kaolin). These soil types were chosen to simulate a maximum, a
minimum, and the intermediate conditions with respect to the hydraulic properties
and particle sizes of soils. A series of laboratory tests were conducted to determine
the soil properties. Figure 4.1, 4.2, 4.3, and 4.4 shows the particle size distribution
(PSD), soil water characteristic curve (SWCC), hydraulic conductivity functions and
scanning electron micrograph (SEM) images of the soils, respectively. The physical
properties of the soils are tabulated in Table 4.1.
30
Figure 4.1 Particle size distributions of the soils
Figure 4.2 SWCC of the soils
Clay Silt Sand Gravel
Sand- Gravel
Sandy Silt
Silty Gravel
Silt(Kaolin)
Sand-Gravel
Sandy Silt
Silty Gravel
Silt (Kaolin)
31
Figure 4.3 Hydraulic conductivity function of the soils (a) (b)
(c) (d)
Figure 4.4 SEM images of (a) sand-gravel, (b) silty gravel, (c) sandy silt, and (d)
silt (kaolin)
Sand-Gravel
Sandy Silt
Silty Gravel
Silt (Kaolin)
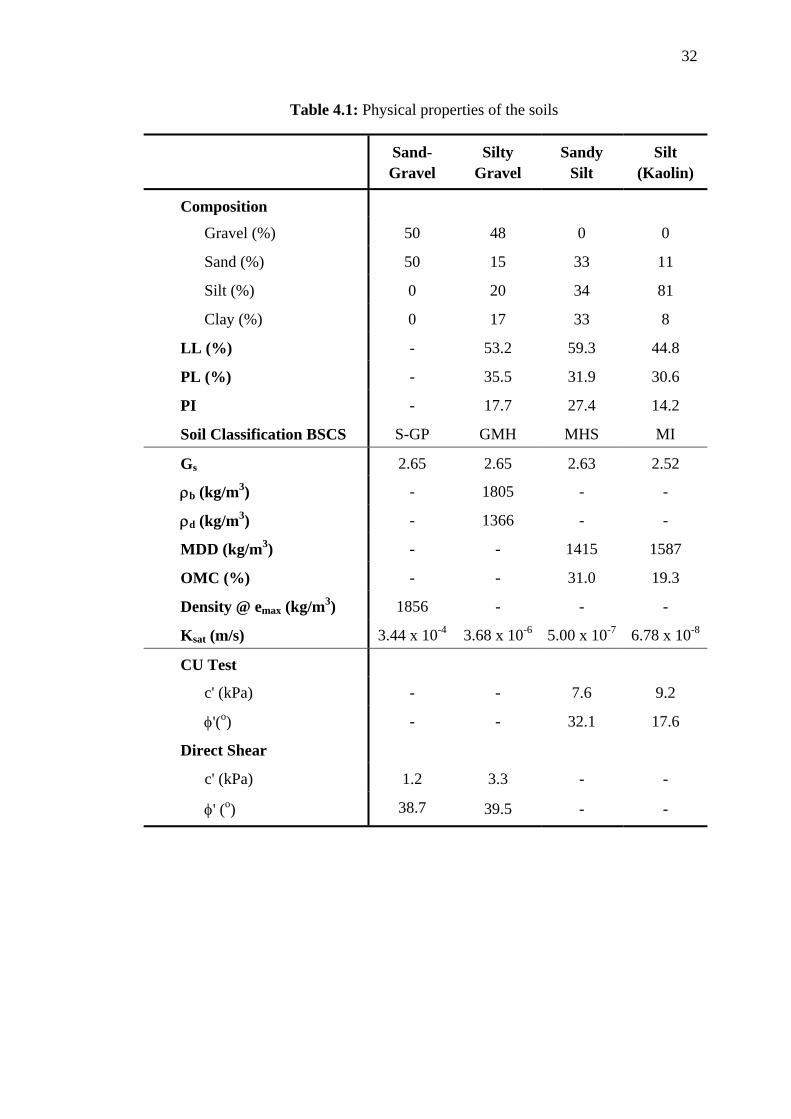
32
Table 4.1: Physical properties of the soils
Sand- Gravel
Silty Gravel
Sandy Silt
Silt (Kaolin)
Composition
Gravel (%) 50 48 0 0
Sand (%) 50 15 33 11
Silt (%) 0 20 34 81
Clay (%) 0 17 33 8
LL (%) - 53.2 59.3 44.8
PL (%) - 35.5 31.9 30.6
PI - 17.7 27.4 14.2
Soil Classification BSCS S-GP GMH MHS MI
Gs 2.65 2.65 2.63 2.52
ρb (kg/m3) - 1805 - -
ρd (kg/m3) - 1366 - -
MDD (kg/m3) - - 1415 1587
OMC (%) - - 31.0 19.3
Density @ emax (kg/m3) 1856 - - -
Ksat (m/s) 3.44 x 10⁻⁴ 3.68 x 10⁻⁶ 5.00 x 10⁻⁷ 6.78 x 10⁻⁸
CU Test
c' (kPa) - - 7.6 9.2
φ'(o) - - 32.1 17.6
Direct Shear
c' (kPa) 1.2 3.3 - -
φ' (o) 38.7 39.5 - -
33
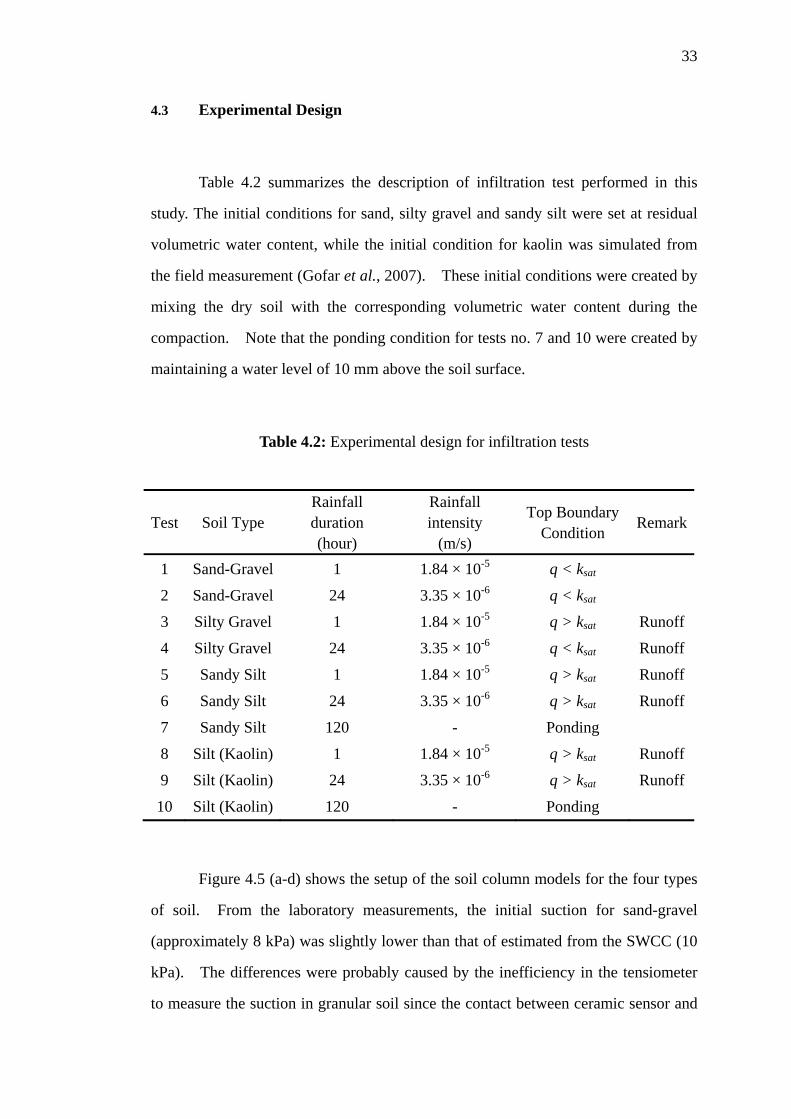
4.3 Experimental Design
Table 4.2 summarizes the description of infiltration test performed in this
study. The initial conditions for sand, silty gravel and sandy silt were set at residual
volumetric water content, while the initial condition for kaolin was simulated from
the field measurement (Gofar et al., 2007). These initial conditions were created by
mixing the dry soil with the corresponding volumetric water content during the
compaction. Note that the ponding condition for tests no. 7 and 10 were created by
maintaining a water level of 10 mm above the soil surface.
Table 4.2: Experimental design for infiltration tests
Figure 4.5 (a-d) shows the setup of the soil column models for the four types
of soil. From the laboratory measurements, the initial suction for sand-gravel
(approximately 8 kPa) was slightly lower than that of estimated from the SWCC (10
kPa). The differences were probably caused by the inefficiency in the tensiometer
to measure the suction in granular soil since the contact between ceramic sensor and
Test Soil Type Rainfall duration (hour)
Rainfall intensity
(m/s)
Top Boundary Condition Remark
1 Sand-Gravel 1 1.84 × 10⁻⁵ q < ksat
2 Sand-Gravel 24 3.35 × 10⁻⁶ q < ksat
3 Silty Gravel 1 1.84 × 10⁻⁵ q > ksat Runoff
4 Silty Gravel 24 3.35 × 10⁻⁶ q < ksat Runoff
5 Sandy Silt 1 1.84 × 10⁻⁵ q > ksat Runoff
6 Sandy Silt 24 3.35 × 10⁻⁶ q > ksat Runoff
7 Sandy Silt 120 - Ponding
8 Silt (Kaolin) 1 1.84 × 10⁻⁵ q > ksat Runoff
9 Silt (Kaolin) 24 3.35 × 10⁻⁶ q > ksat Runoff
10 Silt (Kaolin) 120 - Ponding
34
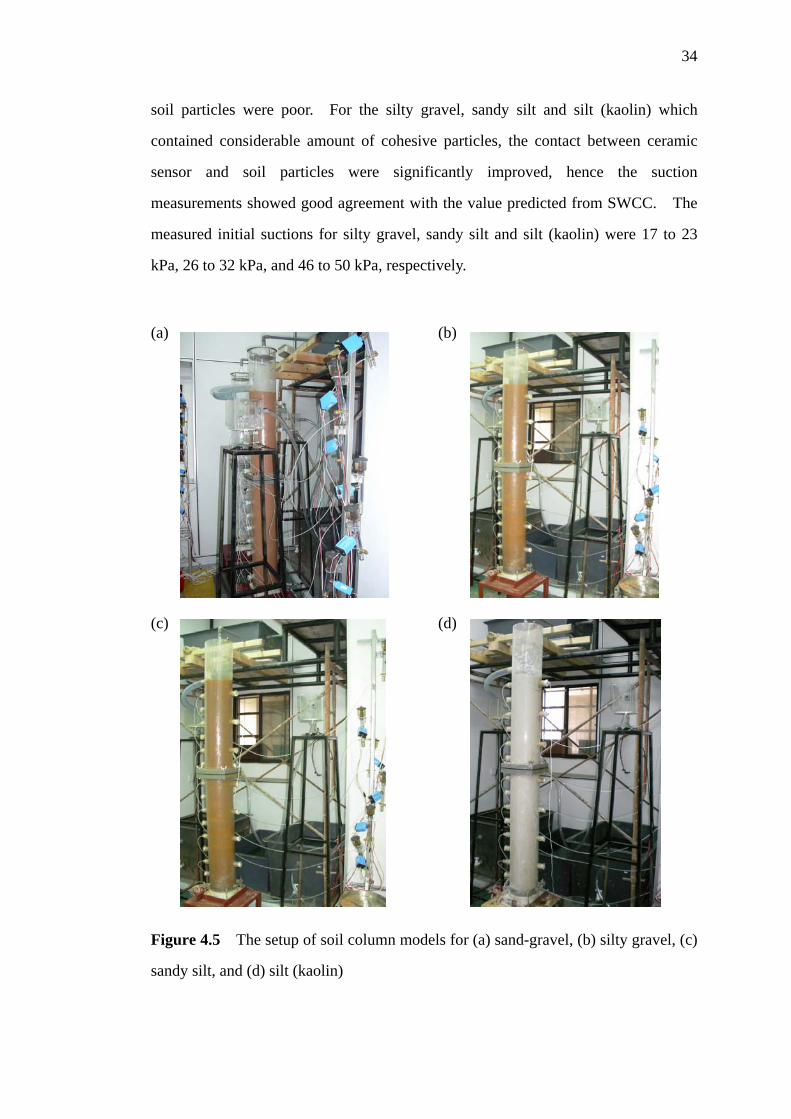
soil particles were poor. For the silty gravel, sandy silt and silt (kaolin) which
contained considerable amount of cohesive particles, the contact between ceramic
sensor and soil particles were significantly improved, hence the suction
measurements showed good agreement with the value predicted from SWCC. The
measured initial suctions for silty gravel, sandy silt and silt (kaolin) were 17 to 23
kPa, 26 to 32 kPa, and 46 to 50 kPa, respectively. (a) (b) (c) (d) Figure 4.5 The setup of soil column models for (a) sand-gravel, (b) silty gravel, (c)
sandy silt, and (d) silt (kaolin)
35
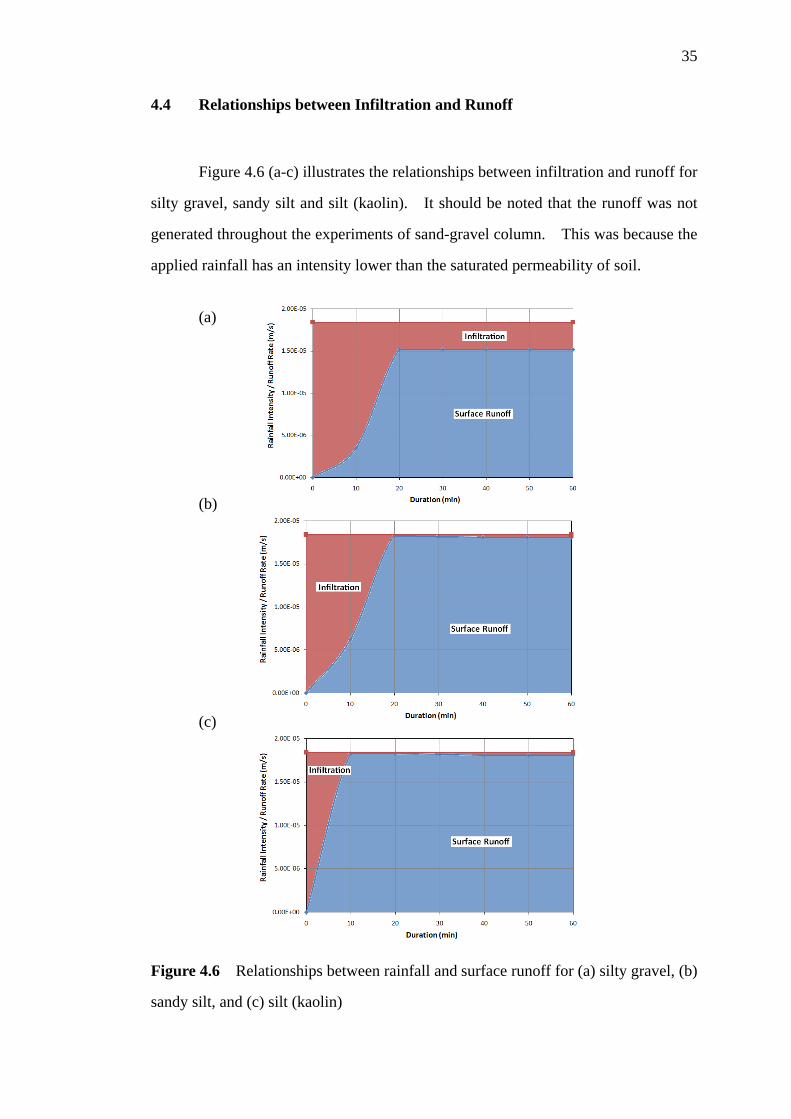
4.4 Relationships between Infiltration and Runoff Figure 4.6 (a-c) illustrates the relationships between infiltration and runoff for
silty gravel, sandy silt and silt (kaolin). It should be noted that the runoff was not
generated throughout the experiments of sand-gravel column. This was because the
applied rainfall has an intensity lower than the saturated permeability of soil.
(a)
(b)
(c)
Figure 4.6 Relationships between rainfall and surface runoff for (a) silty gravel, (b)
sandy silt, and (c) silt (kaolin)
36
As shown in Figure 4.6a, the rainfall infiltrated effectively into the silty
gravel for the first 10 minutes. Subsequently, the surface runoff was generated and
the rate of infiltration and runoff became constant after 20 minutes. The measured
runoff rate was 1.52 × 10⁻⁵ m/s indicating large portion of rainfall has contributed to
the surface runoff (the applied rainfall = 1.84 × 10⁻⁵ m/s). Subtracting the surface
runoff from the applied rainfall, the effective infiltration rate was 3.2 × 10⁻⁶ m/s.
This value was very close to the saturated permeability of silty gravel (ksat = 3.68 ×
10-6 m/s).
The amount of surface runoff was greater for the soils with lower saturated
permeability. For instances, the runoff rate of sandy silt (ksat = 5.00 × 10⁻⁷ m/s)
constant at 1.81 × 10⁻⁵ m/s, indicating the infiltration rate was 3.0 × 10⁻⁷ m/s. As
for the silt (ksat = 6.78 × 10⁻⁸ m/s), the runoff rate constant at 1.83 × 10⁻⁵ m/s with the
infiltration rate approximated to 1.0 × 10⁻⁷ m/s. This infiltration rate, however, was
almost twice the magnitude of saturated permeability of silt (kaolin) obtained from
the falling head permeability test. It was thought that the tendencies of silt (kaolin)
to shrink and crack have caused the infiltration capacities far in exceedance of the
expected saturated permeability. This finding was supported by the observation of
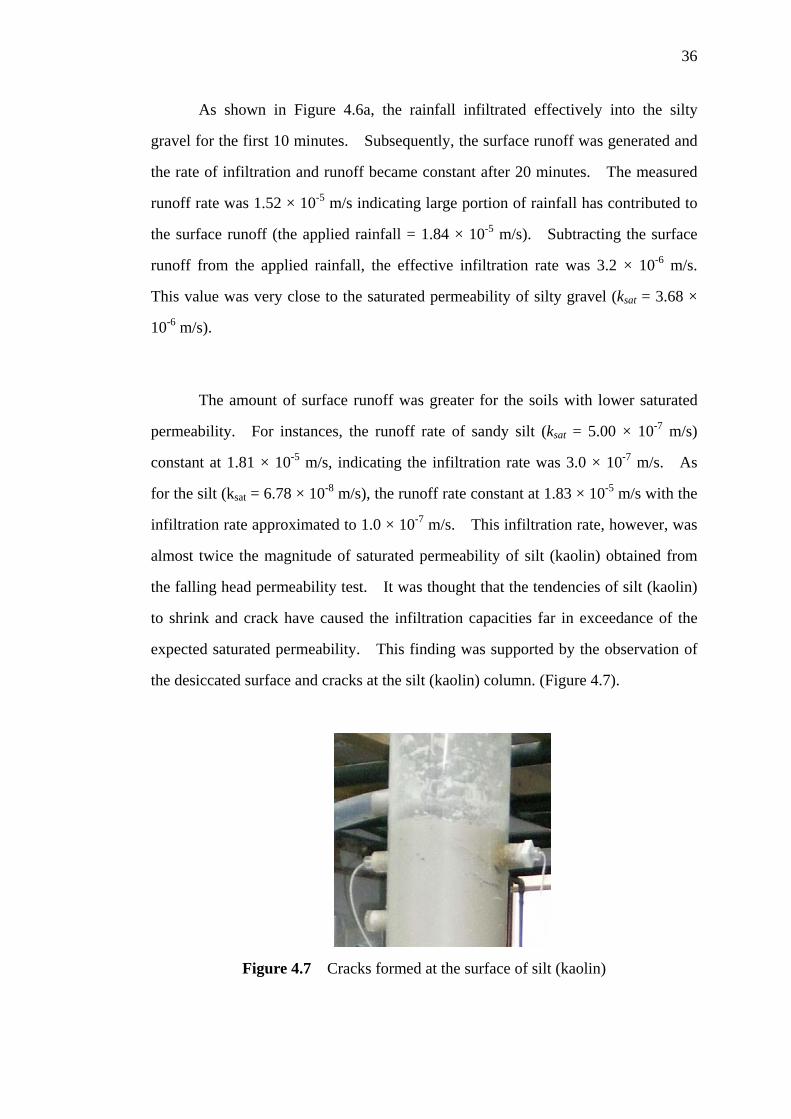
the desiccated surface and cracks at the silt (kaolin) column. (Figure 4.7).
Figure 4.7 Cracks formed at the surface of silt (kaolin)
37
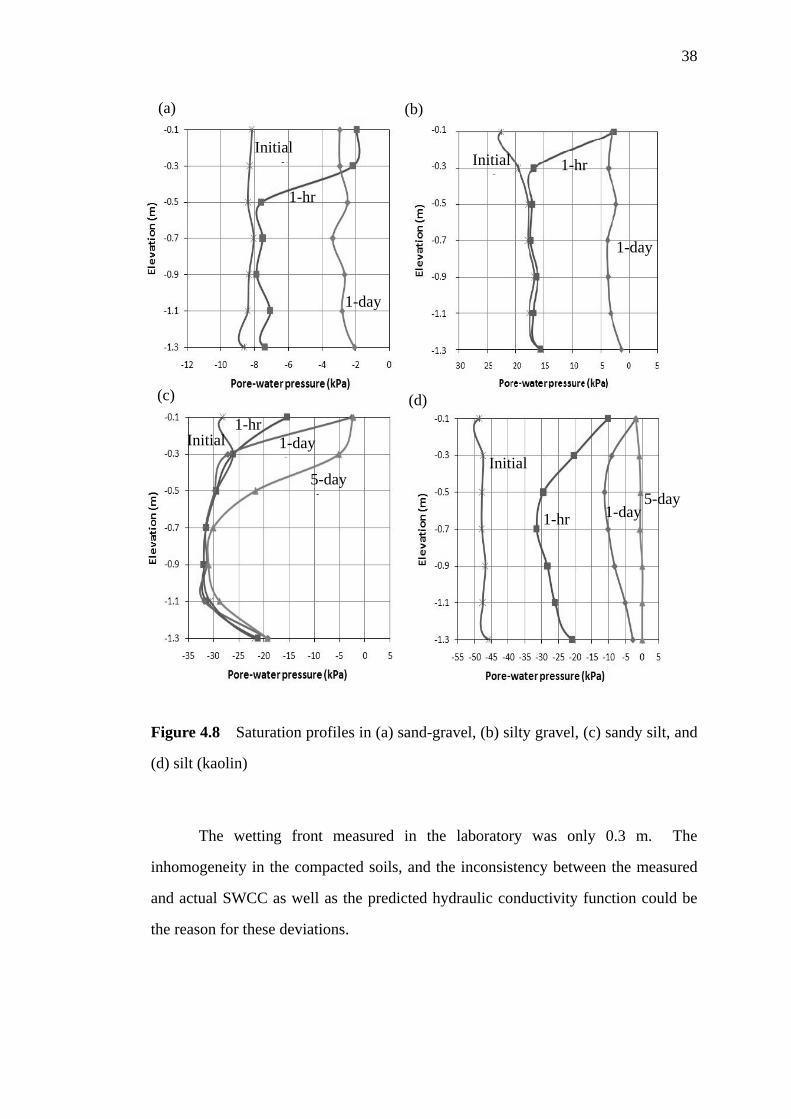
4.5 Saturation Profiles
The saturation profiles for the prescribed test combinations were measured as
shown in Figure 4.8. In the sand-gravel column (Figure 4.8a), the short and intense
1-hour major rainfall has resulted in the lowest minimum suction value, but limited
to a very shallow depth of 0.3 m. Conversely, the wetting front resulted from the
long and less intense 24-hour major rainfall has advanced beyond the entire length of
the soil column (1.5m). This was revealed through the measurement of percolated
flow at the bottom of the soil column after eight hours of rainfall. Whilst the
wetting front was much deeper, the minimum suction value induced by the 24-hour
major rainfall was just slightly higher than that of 1-hour major rainfall. The silty gravel column exhibited similar trend as the sand-gravel (Figure
4.8b). It should be noted that the intensity of 1-hour rainfall (1.84 × 10⁻⁵ m/s) was
greater than the saturated permeability of silty gravel (ksat = 3.68 × 10⁻⁶ m/s). Under
such circumstances, the effective infiltration of silty gravel was controlled by the
saturated permeability, hence the minimum suction value induced by the 1-hour
rainfall was almost identical to that of 24-hour rainfall (i = 3.35 × 10⁻⁶ m/s).
Nonetheless, the 24-hour rainfall still resulted in deeper wetting front than the 1-hour
rainfall. The results implied that for q/ksat < 1, the minimum suction value is
governed by the rainfall intensity, while the wetting front depth was influenced by
the total amount of rainfall infiltrated into the soil. As for q/ksat > 1, the infiltration
and minimum suction value was controlled by the saturated permeability, while the
wetting front depth was only influenced by the rainfall duration.
38
(a) (b)
(c) (d)
Figure 4.8 Saturation profiles in (a) sand-gravel, (b) silty gravel, (c) sandy silt, and
(d) silt (kaolin)
The wetting front measured in the laboratory was only 0.3 m. The
inhomogeneity in the compacted soils, and the inconsistency between the measured
and actual SWCC as well as the predicted hydraulic conductivity function could be
the reason for these deviations.
1-day
1-hr
Initial di
1-day l
1-hr Initial di i
1-day l
1-hr Initial
di5-day l
1-day 1-hr
Initial di
5-day
39
In addition to the 1-hour and 24-hour major rainfalls, a ponding condition
was created in the sandy silt column to study the response of suction distribution to
the infiltration of longer duration (5 days). Whilst the minimum suction value was
the same as the 24-hour major rainfall, the 5-day infiltration has resulted in a deeper
wetting front.
The mechanism of suction loss in sandy silt under rainfall infiltration
condition is as follows: (1) the low saturated permeability of sandy silt limits the
infiltrated rainfall amount, hence large amount of rainfall contributes to runoff, (2)
the infiltrated rainfall reduces the soil suction gradually until a minimum suction
value is achieved, (3) beyond this point, the rainfall infiltration will cause deeper
propagation of wetting front. Apparently, the long duration rainfall appears to be a
more critical rainfall for sandy silt.
For the silt (kaolin) column, the suction distribution measured in the
laboratory was generally lower than that of numerical prediction (Figure 4.8d). The
results indicated that more water was actually infiltrating into the soil due to the
cracks and desiccated surfaces. Besides, the capillary rise effect was found very
significant in kaolin. The upward flow from the simulated water table has caused
the suction loss at the bottom of the soil column. In conclusion, the initial suction of coarse-grained soil is lower than
fine-grained soil. In fact, the suctions of 2 to 4 kPa were very common for
sand-gravel soil under typical rainfall condition. While the initial suction of
fine-grained soil was higher, the capillary rise effect from the water table was
comparatively significant. It is thus essential to consider the effect of water table on
the suction distribution of fine-grained soil slope if the water table is high.
40
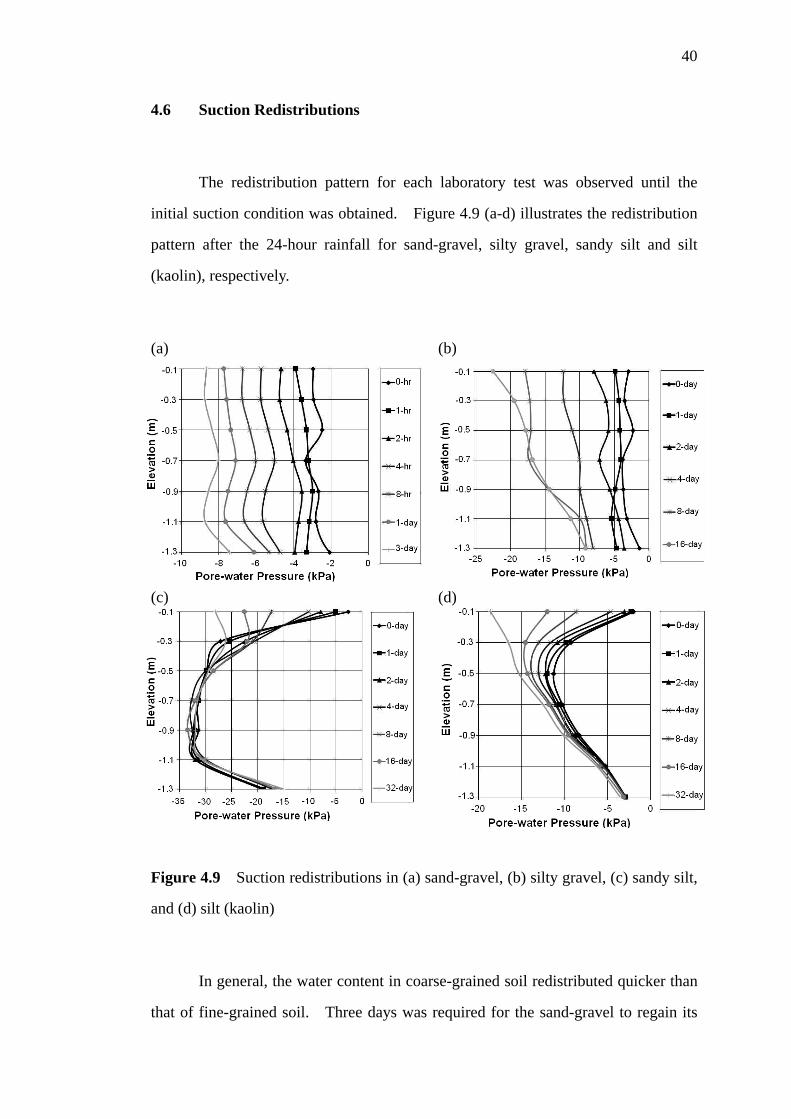
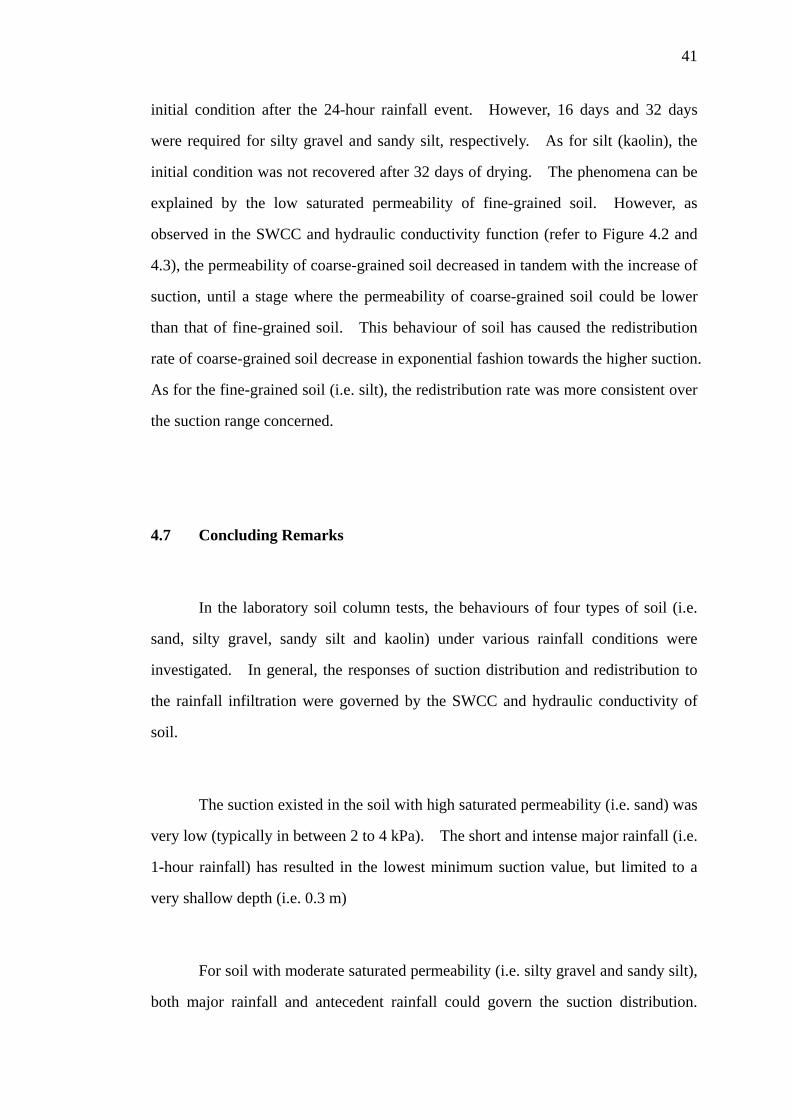
4.6 Suction Redistributions
The redistribution pattern for each laboratory test was observed until the
initial suction condition was obtained. Figure 4.9 (a-d) illustrates the redistribution
pattern after the 24-hour rainfall for sand-gravel, silty gravel, sandy silt and silt
(kaolin), respectively.
(a) (b)
(c) (d)
Figure 4.9 Suction redistributions in (a) sand-gravel, (b) silty gravel, (c) sandy silt,
and (d) silt (kaolin)
In general, the water content in coarse-grained soil redistributed quicker than
that of fine-grained soil. Three days was required for the sand-gravel to regain its
41
initial condition after the 24-hour rainfall event. However, 16 days and 32 days
were required for silty gravel and sandy silt, respectively. As for silt (kaolin), the
initial condition was not recovered after 32 days of drying. The phenomena can be
explained by the low saturated permeability of fine-grained soil. However, as
observed in the SWCC and hydraulic conductivity function (refer to Figure 4.2 and
4.3), the permeability of coarse-grained soil decreased in tandem with the increase of
suction, until a stage where the permeability of coarse-grained soil could be lower
than that of fine-grained soil. This behaviour of soil has caused the redistribution
rate of coarse-grained soil decrease in exponential fashion towards the higher suction.
As for the fine-grained soil (i.e. silt), the redistribution rate was more consistent over
the suction range concerned. 4.7 Concluding Remarks
In the laboratory soil column tests, the behaviours of four types of soil (i.e.
sand, silty gravel, sandy silt and kaolin) under various rainfall conditions were
investigated. In general, the responses of suction distribution and redistribution to
the rainfall infiltration were governed by the SWCC and hydraulic conductivity of
soil. The suction existed in the soil with high saturated permeability (i.e. sand) was
very low (typically in between 2 to 4 kPa). The short and intense major rainfall (i.e.
1-hour rainfall) has resulted in the lowest minimum suction value, but limited to a
very shallow depth (i.e. 0.3 m) For soil with moderate saturated permeability (i.e. silty gravel and sandy silt),
both major rainfall and antecedent rainfall could govern the suction distribution.
42
The initial suctions existed in these types of soil were relatively high (18 to 33 kPa).
However, the redistribution rate was significantly reduced by the existence of the
fine particles. For soil with low saturated permeability (i.e. silt), the suction distribution was
more influenced by the duration of rainfall. The longer the duration of rainfall, the
lower the suction generated. At the initial condition, the suction in silt (kaolin) can
be as high as 50kPa. However, the suction decreased gradually when the soil
column was subjected to rainfall infiltration. The lowest suction measured in the
laboratory test was 0kPa, indicating q/ksat > 1. Despite of the fact that the
infiltration was limited by the soil’s saturated permeability, the suction can be altered
significantly with little changes in the water content. Besides, the shrink and crack
behaviours of clayey soil permitted more water to infiltrate into the soil through the
desiccated surface. In general, the water content in the coarse-grained soil redistributed quicker
than the fine-grained soil. The initial suctions were regained in sand-gravel, silty
gravel and sandy silt after 3 day, 16 days, and 32 days, respectively. However, the
initial condition of 50 kPa in silt (kaolin) was not recovered after 32 days of drying.
The slow redistribution rate can be attributed to the high water retention ability and
low saturated permeability of fine-grained soil.
CHAPTER 5
CONCLUSIONS AND SUGGESTIONS 5.1 Introduction A study on the saturation profile for various combinations of rainfall pattern
and soil type is reported in this thesis. The specific objectives of the study were
stated in the Chapter 1, as the ultimate goal of the study is to investigate the
mechanisms involved in the development of saturation profile. In this Chapter, the
conclusions of the study are presented after which the recommendations for further
research are presented. 5.2 Conclusions
The main outcomes and conclusions of the study are drawn in view of the
objectives as formulated on page 2.
44
5.2.1 Laboratory Model for Saturation Profile Study
A soil column model was fabricated to study the saturation profile in four
types of soil under various rainfall conditions. The model was found to be function
properly to quantify the rainfall intensity, surface runoff rate, pore-water pressure,
and percolated flow rate.
5.2.2 Dominant Factors Affecting Saturation Profile
The rainfall patterns and soil properties are two important parameters
affecting the saturation profile developed in the soil. Generally, the coarse-grained
soil is characterized by high permeability and low water retention ability. As such,
the suction existed in the coarse-grained soil is generally low, typically within 2 to
4kPa. Under these circumstances, the effect of rainfall pattern on the saturation
profile of coarse-grained soil is relatively insignificant compared to fine-grained soil.
Conversely, the fine-grained soil is characterized by low permeability and
high water retention ability. Whilst the response of suction variation to the rainfall
infiltration is considerably slow, the variation of suction can be very significant due
to the wide differences of suction between dry condition and wet condition. The
prolonged rainfall could induce greater changes in saturation profile of this type of
soil. The shrink and crack nature of the fine-grained soil has not helped the
problem but allow more water to infiltrate into the surficial soil through the
desiccated surface.

45
5.2.3 Development of Saturation Profile
The mechanism of the development of saturation profile in soil can be
explained as follows: (1) the saturated permeability of soil controls the infiltrated
rainfall amount if the rainfall intensity is higher than the soil’s permeability, (2) the
infiltrated rainfall retains near the soil surface and saturate the soil gradually until a
minimum suction value is achieved, (3) beyond this point, the rainfall infiltration will
cause deeper propagation of wetting front. Apparently, the longer rainfall duration
would cause deeper wetting front in soil. In general, the saturation profile observed
in the laboratory model showed good agreement with the results from numerical
simulation. Nonetheless, the accuracy of the numerical predictions is governed by
the consistency of the soil properties input parameters e.g. SWCC and hydraulic
conductivity between numerical simulation and actual soil behaviour. 5.3 Suggestions for Future Researches In light of the limitations of the present study, a few areas were identified
where further research were required:
i. The study on a full scale model constructed under natural environment.
From the field measurement, it was found that the changes in ambient
environment (i.e. solar radiation, humidity, temperature etc.) could also alter
the soil suction. It would enhance the findings from the present study by
accounting more surface boundary conditions.
ii. The numerical simulation and laboratory modeling by using two
dimensional slope model. The two dimensional analysis is required to
consider for the horizontal flow in the soil slope.

46
iii. The study on the behaviour of layered soil. The behaviour of
homogeneous soil has been investigated in the present study. It is believed
that the findings from the present study could provide the fundamental
knowledge for the study in the behaviour of layered soil which sustained
much more complexity.
iv. The improvement on the laboratory modeling technique, particularly for
the rainfall simulator. An advanced rainfall simulator should be used to
enable the simulation of low rainfall intensity for longer duration of
antecedent rainfall. Besides, the installation of Time-Domain Reflectometry
(TDR) probe that provides the measurement of volumetric water content
would allow the inferences of the suction measurements from tensiometer.
v. The study on the mitigation measures of rainfall-induced slope failure.
The mechanisms of the rainfall-induced slope failure for different types of
soil have been identified in this study. The further study may look into the
possible mitigation measures.
47
REFERENCES Agus, S.S., Leong, E.C. and Rahardjo, H. (2001). Soil-Water Characteristic Curves
of Singapore Residual Soils. Journal of Geotechnical and Geological
Engineering. 19: 285-309.
Bao, C.G., Gong, B. and Zhan, L. (1998). Properties of Unsaturated Soils and Slope
Stability of Expansive Soil. Keynote Lecture, 2nd Int. Conf. on Unsaturated
Soils. Beijing, China.
Bouwer, H. (1966). Rapid Field Measurement of Air Entry Value and Hydraulic
Conductivity of Soil as Significant Parameters in Flow System Analysis. Water
Resources Research. 2(4): 729-738.
Brisson, P., Garga, V.K. and Vanapalli, S.K. (2002) Determination of Unsaturated
Flow Characteristics of Nickel Mine Tailings. 55th Canadian Geotechnical
Conference, Niagara, Canada, October 2002.
Cai, F. and Ugai, K. (2004). Numerical Analysis of Rainfall Effects on Slope
Stability. International Journal of Geomechanics, ASCE. 4(2): 69-78.
Fredlund, D.G. and Rahardjo, H. (1993). Soil Mechanics for Unsaturated Soils. New
York: John Wiley & Sons, Inc.
Fredlund, D. G. and Xing, A. (1994). Equations for the Soil-Water Characteristic
Curve. Canadian Geotechical Journal. 31: 521–532.
Fredlund, D.G., Xing, A. and Huang, S. (1994). Predicting the Permeability Function
for Unsaturated Soils Using the Soil-Water Character Curve. Canadian
Geotechnical Journal. 31(3): 533-546
Freeze, R. A. and Cherry, J. A. (1979). Groundwater. New York: Prentice-Hall, Inc.
Gasmo, J. M., Rahardjo, H., and Leong, E. C. (2000). Infiltration Effects on Stability
of a Residual Soil Slope. Computer Geotechnique. 26: 145–165.
Geiger, S.L., and Durnford, D.S. (2000). Infiltration in Homogeneous Sands and a
Mechanistic Model of Unstable Flow. Soil Science Society of America Journal.
64: 460-469.

48
GEO-SLOPE International Ltd. (2004). Seepage Modeling with SEEP/W. Calgary,
Alta., Canada.
Gitirana, G.Jr. and Fredlund, D.G. (2004). Soil-Water Characteristic Curve Equation
with Independent Properties. Journal of Geotechnical and Geoenvironmental
Engineering, ASCE. 130(2): 209-212.
Glass, R.J., Steenhuis, T.S., and Parlange, J.Y. (1989). Wetting Front Instability,
Experimental Determination of Relationships between System Parameters and
Two Dimensional Unstable Flow Field Behavior in Initially Dry Porous Media.
Water Resource Research. 25: 1195-1207.
Gofar, N., Lee, M.L. and Kassim, A. (2007) Stability of Unsaturated Slopes
Subjected to Rainfall Infiltration. Proceedings of the Fourth International
Conference on Disaster Prevention and Rehabilitation, Semarang 10-11
September 2007: 158-167.
Green, W.H. and Ampt, G.A.. (1911). Studies on Soil Physics I. The Flow of Air and
Water through Soils. Journal of Agricultural Research. 4: 1-24.
Gribb, M.M., Kodesova, R. and Ordway, S.E. (2004). Comparison of Soil Hydraulic
Property Measurement Methods. Journal of Geotechnical and
Geoenvironmental Engineering, ASCE. 130(10): 1084-1095.
Horton, R.E. (1933). The role of infiltration in the hydrological cycle. Trans.
American Geophys. Union. 14: 446-460.
Joel, A., Messing, I., Seguel, O., and Casanova, M. (2002). Measurement of surface
water runoff from plots of two different sizes. Hydrological Processes. 16(7):
1467-1478.
Kim, J., Park, S. and Jeong, S. (2006). Effect of Wetting Front Suction Loss on
Stability of Unsaturated Soil Slopes. Unsaturated Soils, Seepage, and
Environmental Geotechnics, ASCE. 148: 70-77.
Leong, E.C. and Rahardjo, H. (1997). Permeability Functions for Unsaturated Soils.
Journal of Geotechnical and Geoenvironmental Engineering, ASCE. 123(12):
1118-1126.
49
Li, A.G., Tham, L.G., Yue, G.Q., Lee, C.F. and Law, K.T. (2005). Comparison of
Field and Laboratory Soil-Water Characteristic Curves. Journal of
Geotechnical and Geoenvironmental Engineering, ASCE. 131(9): 1176-1180.
Liu, Y., Bierck, B.R., Selker, J.S., Steenhuis, T.S. and Parlange, J.Y. (1993). High
Density X-Ray and Tensiometer Measurements in Rapidly Changing
Preferential Flow Fields. Soil Science Society of America Journal. 57:
1188-1192.
Loáiciga, H.A. and Huang, A. (2007). Ponding Analysis with Green-and-Ampt
Infiltration. Journal of Hydrologic Engineering, ASCE. 12(1): 109-112.
Lumb, P. B. (1962). The Properties of Decomposed Granite: Geo- technique. 12:
226-243.
Lumb, P. B. (1975) Slope Failures in Hong Kong. Journal of Engineering Geology.
8: 31–65.
Mein, R.G. and Farrell, D.A. (1974). Determination of Wetting front Suction in the
Green-Ampt Equation. Soil Science Society of America, Proceeding. 38:
872-876.
Mein, R.G. and Larson, C.L. (1973). Modeling Infiltration during a Steady Rain.
Water Resources Research. 9(2): 384-394.
Neuman, S.P. (1976). Wetting Front Pressure Head in the Infiltration Model of
Green and Ampt. Water Resources Research. 12(3): 564-566.
Ng, C.W.W., Zhan, L.T., Bao, C.G., Fredlund, D.G., and Gong, B.W. (2003).
Performance of Unsaturated Expansive Soil Slope Subjected to Artificial
Rainfall Infiltration. Géotechnique. 53(2): 143–157.
Pradel, D. and Raad, G. (1993). Effect of Permeability on Surficial Stability of
Homogeneous Slopes. Journal of Geotechnical Engineering, ASCE. 119(2):
315-332.
Sung, E.C. and Seung, R.L. (2002). Evaluation of Surficial Stability for
Homogeneous Slopes Considering Rainfall Characteristics. Journal of
Geotechnical and Geoenvironmental Engineering, ASCE. 128(9): 756-763.

50
Tsaparas I., Rahardjo, H., Toll D.G. and Leong E.C. (2002). Controlling Parameters
for Rainfall-Induced Landslides. Comput. and Geotech. 29: 1-27.
Van Genuchten, M.T. (1980). A closed-form equation for predicting the hydraulic
conductivity of unsaturated soils. Soil Science Society of America Journal. 44:
892–898.
Wang, Z., Tuli, A. and Jury,W.A. (2003). Unstable Flow during Redistribution in
Homogeneous Soil. Vadose Zone Journal. 2: 52-60.
Zhan, T.L.T. and Ng, C.W.W. (2004). Analytical Analysis of Rainfall Infiltration
Mechanism in Unsaturated Soils. International Journal of Geomechanics,
ASCE. 4(4): 273-284

51
APPENDIX A
52
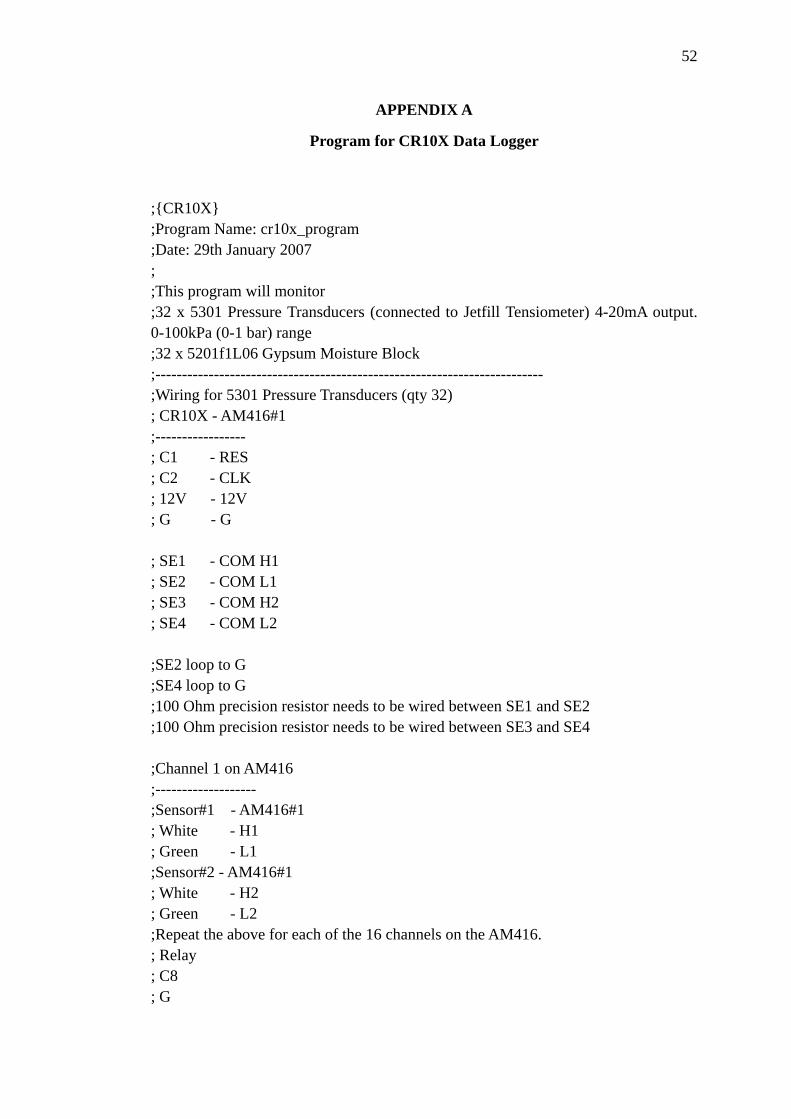
APPENDIX A
Program for CR10X Data Logger
;{CR10X} ;Program Name: cr10x_program ;Date: 29th January 2007 ; ;This program will monitor ;32 x 5301 Pressure Transducers (connected to Jetfill Tensiometer) 4-20mA output. 0-100kPa (0-1 bar) range ;32 x 5201f1L06 Gypsum Moisture Block ;------------------------------------------------------------------------- ;Wiring for 5301 Pressure Transducers (qty 32) ; CR10X - AM416#1 ;----------------- ; C1 - RES ; C2 - CLK ; 12V - 12V ; G - G ; SE1 - COM H1 ; SE2 - COM L1 ; SE3 - COM H2 ; SE4 - COM L2 ;SE2 loop to G ;SE4 loop to G ;100 Ohm precision resistor needs to be wired between SE1 and SE2 ;100 Ohm precision resistor needs to be wired between SE3 and SE4 ;Channel 1 on AM416 ;------------------- ;Sensor#1 - AM416#1 ; White - H1 ; Green - L1 ;Sensor#2 - AM416#1 ; White - H2 ; Green - L2 ;Repeat the above for each of the 16 channels on the AM416. ; Relay ; C8 ; G

53
;Note: The Pressure Transducers require a independent 24V power supply. The power supply is to be connected to the sensors via a relay (see wiring above) ; The ground for the sensor power supply and the CR10X power supply need to be linked. ;------------------------------------------------------------------------- ;Wiring for the 5201f1L106 Gyspsum Blocks (qty 32) ; CR10X - AM416#2 ;------------------------------------ ; C3 - RES ; C4 - CLK ; 12V - 12V ; G - G ; SE5 - COM H1 ; AG - COM L1 ; SE6 - COM H2 ; AG - COM L2 ;Channel 1 on AM416 ;------------------- ;Sensor#1 - AM416#1 ; Wire1 - H1 ; Wire2 - L1 ;Sensor#2 - AM416#1 ; Wire1 - H2 ; Wire2 - L2 ;Repeat the above for each of the 16 channels on the AM416 ; 1k Ohm resistor needs to be wired between E1 and SE5 ; 1k Ohm resistor needs to be wired between E1 and SE6 ;------------------------------------------------------------------------- *Table 1 Program 01: 10 Execution Interval (seconds) ; ;------------------------------------------------------------- ; Every minute, set Flag 1 to measure the sensors. Flag 1 can be set manually at any time to make measurements. 32: If time is (P92) 1: 0 Minutes (Seconds --) into a 2: 1 Interval (same units as above) 3: 11 Set Flag 1 High ;-------------------------------------------------------------
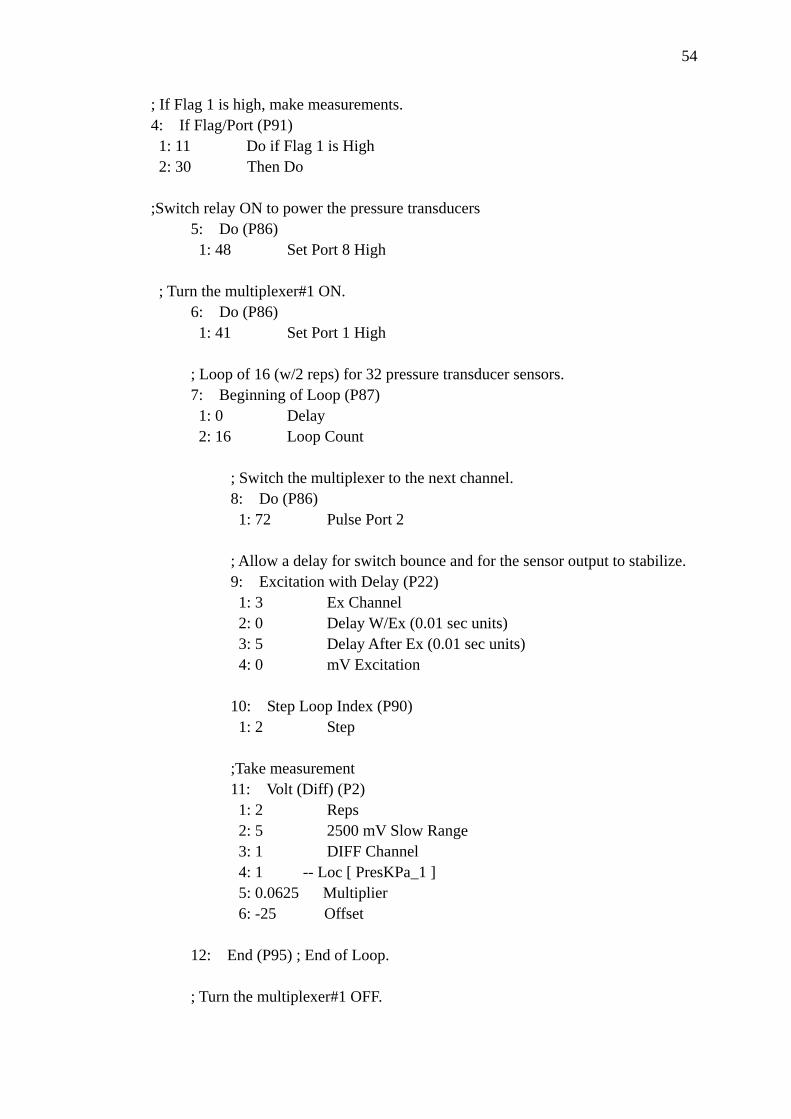
54
; If Flag 1 is high, make measurements. 4: If Flag/Port (P91) 1: 11 Do if Flag 1 is High 2: 30 Then Do ;Switch relay ON to power the pressure transducers 5: Do (P86) 1: 48 Set Port 8 High ; Turn the multiplexer#1 ON. 6: Do (P86) 1: 41 Set Port 1 High ; Loop of 16 (w/2 reps) for 32 pressure transducer sensors. 7: Beginning of Loop (P87) 1: 0 Delay 2: 16 Loop Count ; Switch the multiplexer to the next channel. 8: Do (P86) 1: 72 Pulse Port 2 ; Allow a delay for switch bounce and for the sensor output to stabilize. 9: Excitation with Delay (P22) 1: 3 Ex Channel 2: 0 Delay W/Ex (0.01 sec units) 3: 5 Delay After Ex (0.01 sec units) 4: 0 mV Excitation 10: Step Loop Index (P90) 1: 2 Step ;Take measurement 11: Volt (Diff) (P2) 1: 2 Reps 2: 5 2500 mV Slow Range 3: 1 DIFF Channel 4: 1 -- Loc [ PresKPa_1 ] 5: 0.0625 Multiplier 6: -25 Offset 12: End (P95) ; End of Loop. ; Turn the multiplexer#1 OFF.
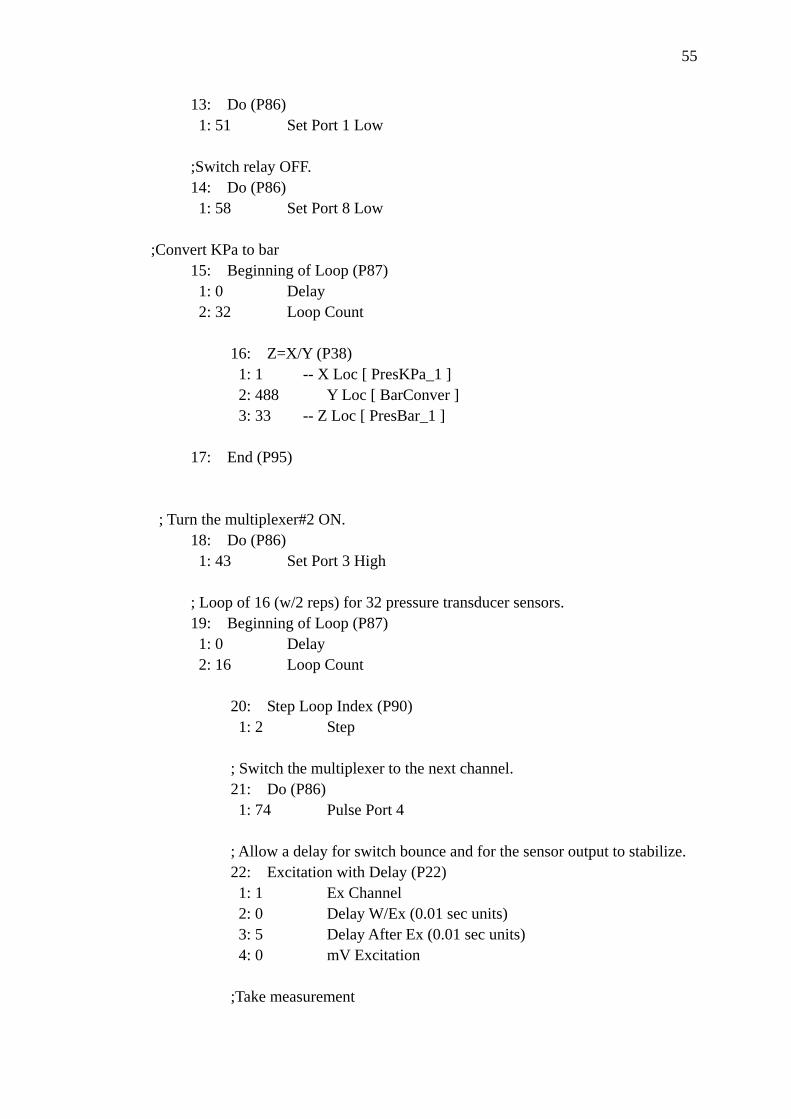
55
13: Do (P86) 1: 51 Set Port 1 Low ;Switch relay OFF. 14: Do (P86) 1: 58 Set Port 8 Low ;Convert KPa to bar 15: Beginning of Loop (P87) 1: 0 Delay 2: 32 Loop Count 16: Z=X/Y (P38) 1: 1 -- X Loc [ PresKPa_1 ] 2: 488 Y Loc [ BarConver ] 3: 33 -- Z Loc [ PresBar_1 ] 17: End (P95) ; Turn the multiplexer#2 ON. 18: Do (P86) 1: 43 Set Port 3 High ; Loop of 16 (w/2 reps) for 32 pressure transducer sensors. 19: Beginning of Loop (P87) 1: 0 Delay 2: 16 Loop Count 20: Step Loop Index (P90) 1: 2 Step ; Switch the multiplexer to the next channel. 21: Do (P86) 1: 74 Pulse Port 4 ; Allow a delay for switch bounce and for the sensor output to stabilize. 22: Excitation with Delay (P22) 1: 1 Ex Channel 2: 0 Delay W/Ex (0.01 sec units) 3: 5 Delay After Ex (0.01 sec units) 4: 0 mV Excitation ;Take measurement
56
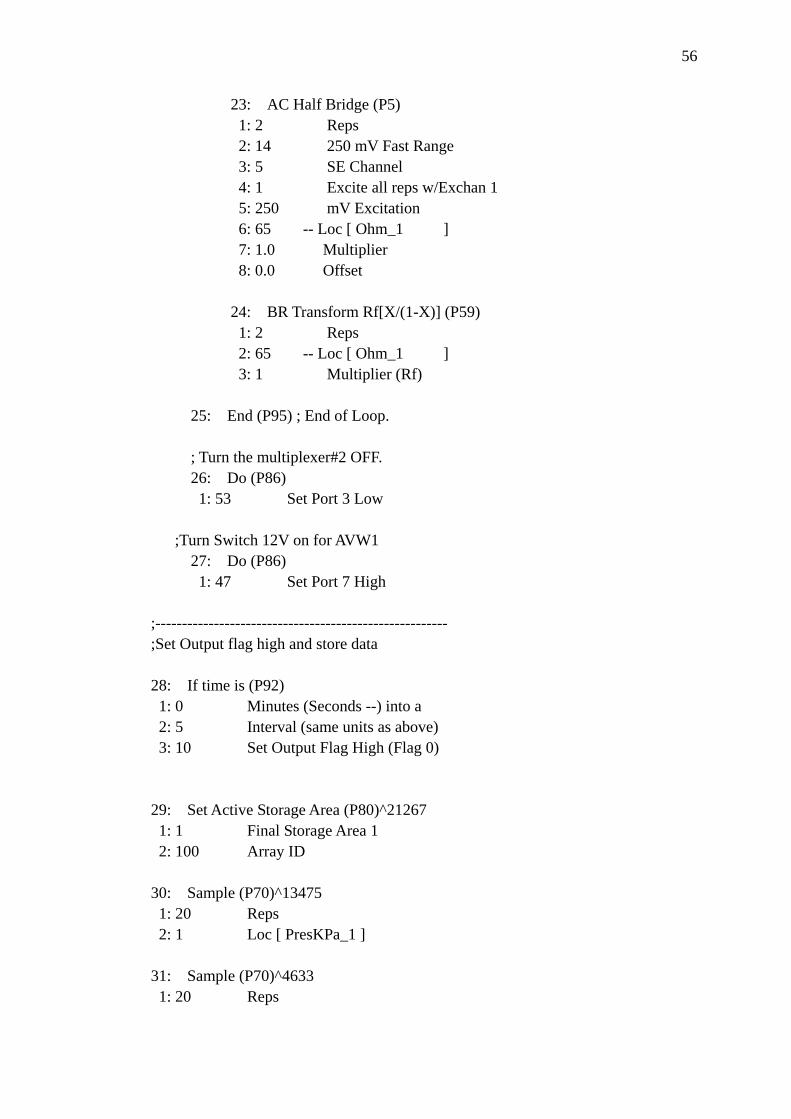
23: AC Half Bridge (P5) 1: 2 Reps 2: 14 250 mV Fast Range 3: 5 SE Channel 4: 1 Excite all reps w/Exchan 1 5: 250 mV Excitation 6: 65 -- Loc [ Ohm_1 ] 7: 1.0 Multiplier 8: 0.0 Offset 24: BR Transform Rf[X/(1-X)] (P59) 1: 2 Reps 2: 65 -- Loc [ Ohm_1 ] 3: 1 Multiplier (Rf) 25: End (P95) ; End of Loop. ; Turn the multiplexer#2 OFF. 26: Do (P86) 1: 53 Set Port 3 Low ;Turn Switch 12V on for AVW1 27: Do (P86) 1: 47 Set Port 7 High ;------------------------------------------------------- ;Set Output flag high and store data 28: If time is (P92) 1: 0 Minutes (Seconds --) into a 2: 5 Interval (same units as above) 3: 10 Set Output Flag High (Flag 0) 29: Set Active Storage Area (P80)^21267 1: 1 Final Storage Area 1 2: 100 Array ID 30: Sample (P70)^13475 1: 20 Reps 2: 1 Loc [ PresKPa_1 ] 31: Sample (P70)^4633 1: 20 Reps
57
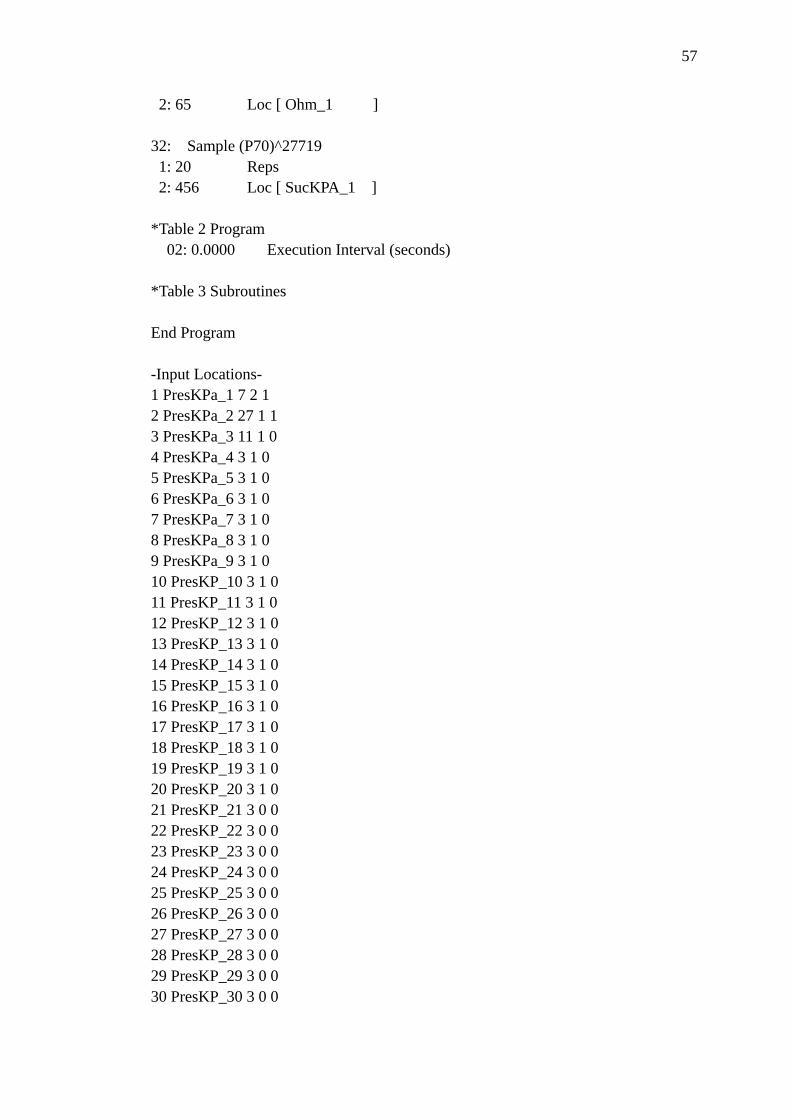
2: 65 Loc [ Ohm_1 ] 32: Sample (P70)^27719 1: 20 Reps 2: 456 Loc [ SucKPA_1 ] *Table 2 Program 02: 0.0000 Execution Interval (seconds) *Table 3 Subroutines End Program -Input Locations- 1 PresKPa_1 7 2 1 2 PresKPa_2 27 1 1 3 PresKPa_3 11 1 0 4 PresKPa_4 3 1 0 5 PresKPa_5 3 1 0 6 PresKPa_6 3 1 0 7 PresKPa_7 3 1 0 8 PresKPa_8 3 1 0 9 PresKPa_9 3 1 0 10 PresKP_10 3 1 0 11 PresKP_11 3 1 0 12 PresKP_12 3 1 0 13 PresKP_13 3 1 0 14 PresKP_14 3 1 0 15 PresKP_15 3 1 0 16 PresKP_16 3 1 0 17 PresKP_17 3 1 0 18 PresKP_18 3 1 0 19 PresKP_19 3 1 0 20 PresKP_20 3 1 0 21 PresKP_21 3 0 0 22 PresKP_22 3 0 0 23 PresKP_23 3 0 0 24 PresKP_24 3 0 0 25 PresKP_25 3 0 0 26 PresKP_26 3 0 0 27 PresKP_27 3 0 0 28 PresKP_28 3 0 0 29 PresKP_29 3 0 0 30 PresKP_30 3 0 0
58
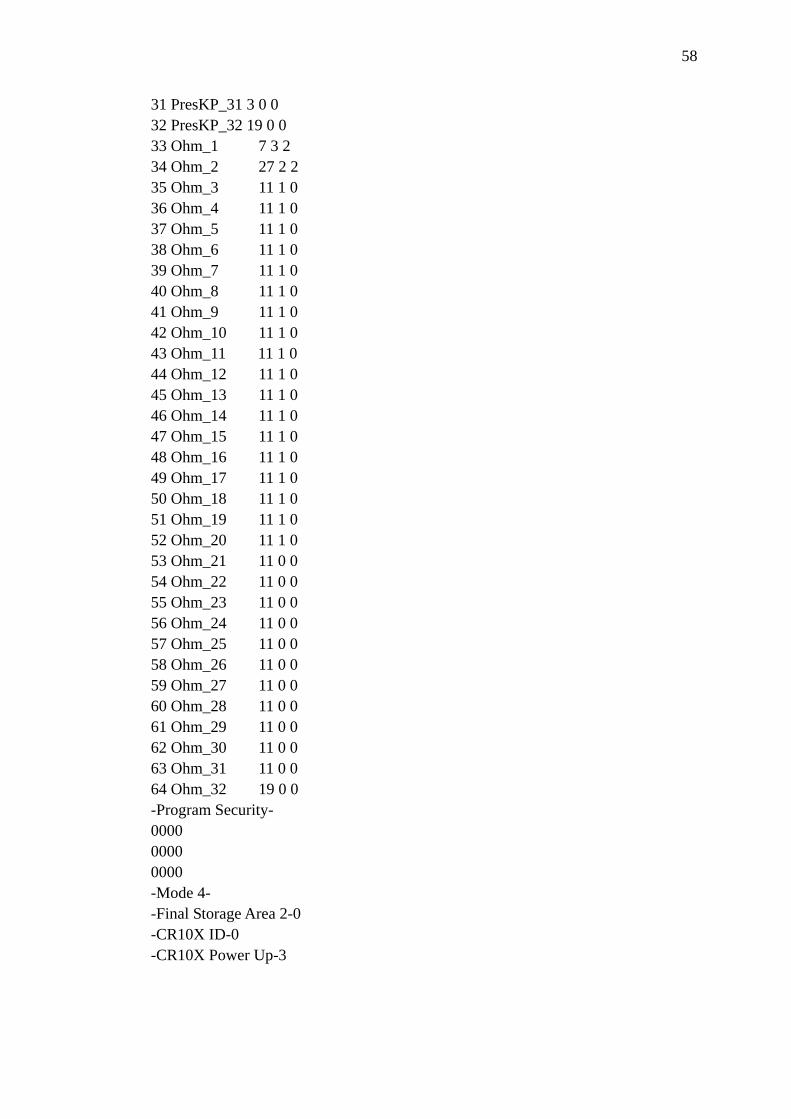
31 PresKP_31 3 0 0 32 PresKP_32 19 0 0 33 Ohm_1 7 3 2 34 Ohm_2 27 2 2 35 Ohm_3 11 1 0 36 Ohm_4 11 1 0 37 Ohm_5 11 1 0 38 Ohm_6 11 1 0 39 Ohm_7 11 1 0 40 Ohm_8 11 1 0 41 Ohm_9 11 1 0 42 Ohm_10 11 1 0 43 Ohm_11 11 1 0 44 Ohm_12 11 1 0 45 Ohm_13 11 1 0 46 Ohm_14 11 1 0 47 Ohm_15 11 1 0 48 Ohm_16 11 1 0 49 Ohm_17 11 1 0 50 Ohm_18 11 1 0 51 Ohm_19 11 1 0 52 Ohm_20 11 1 0 53 Ohm_21 11 0 0 54 Ohm_22 11 0 0 55 Ohm_23 11 0 0 56 Ohm_24 11 0 0 57 Ohm_25 11 0 0 58 Ohm_26 11 0 0 59 Ohm_27 11 0 0 60 Ohm_28 11 0 0 61 Ohm_29 11 0 0 62 Ohm_30 11 0 0 63 Ohm_31 11 0 0 64 Ohm_32 19 0 0 -Program Security- 0000 0000 0000 -Mode 4- -Final Storage Area 2-0 -CR10X ID-0 -CR10X Power Up-3

59
LIST OF RELATED PUBLICATIONS i. Gofar, N., Lee, M.L. and Kassim, A. (2006). Effect of Surface Boundary
Condition on Rainfall Infiltration. Jurnal Teknologi B, UTM. 44. iii. Gofar, N., Lee, M.L. and Kassim, A. (2008). Instrumented Soil Column Model
for Rainfall Infiltration Study. Proceeding, International Conference on Geotechnical and Highway Engineering (GEOTROPIKA 2008). 26-27 May 2008, Kuala Lumpur.