Embed Size (px)
Citation preview
Oct 20, 2016
KAJARIA CERAMICS LIMITED
Investor Update – Q2 FY 17 / H1 FY17
1/14
Investor Update Q2 FY 17 / H1 FY17
Content
Chairman’s Message
Financial Performance - Q2 FY 17 / H1 FY17
Balance sheet perspective
Joint Venture / Subsidiaries
Income Statement
Shareholding Pattern
2/14
Investor Update Q2 FY 17 / H1 FY17
Chairman’s Message
3/14
Kajaria has made its mark in the global business village. Your Company was the only Indian company to feature among the Top-10 global tile manufacturing companies* – truly living upto the Government’s ‘Make in India’ call – an initiative devised to transform India into a global design and manufacturing hub. Against this satisfying achievement, the Company’s financial performance ,during the quarter under review remained below the historical average. Revenue grew by 3% over the corresponding period in the previous fiscal while EBIDTA and Net Profit for the quarter grew by 7% and 8% respectively over the same period. Going ahead, the business landscape appears promising because of passing of GST Bill. OROP; Normal monsoon; a 25 bps cut in interest rates by the RBI are expected to increase disposable income in the hands of the average Indian leading to increased discretionary spending. *Source: Ceramic World Review
Investor Update Q2 FY 17 / H1 FY17
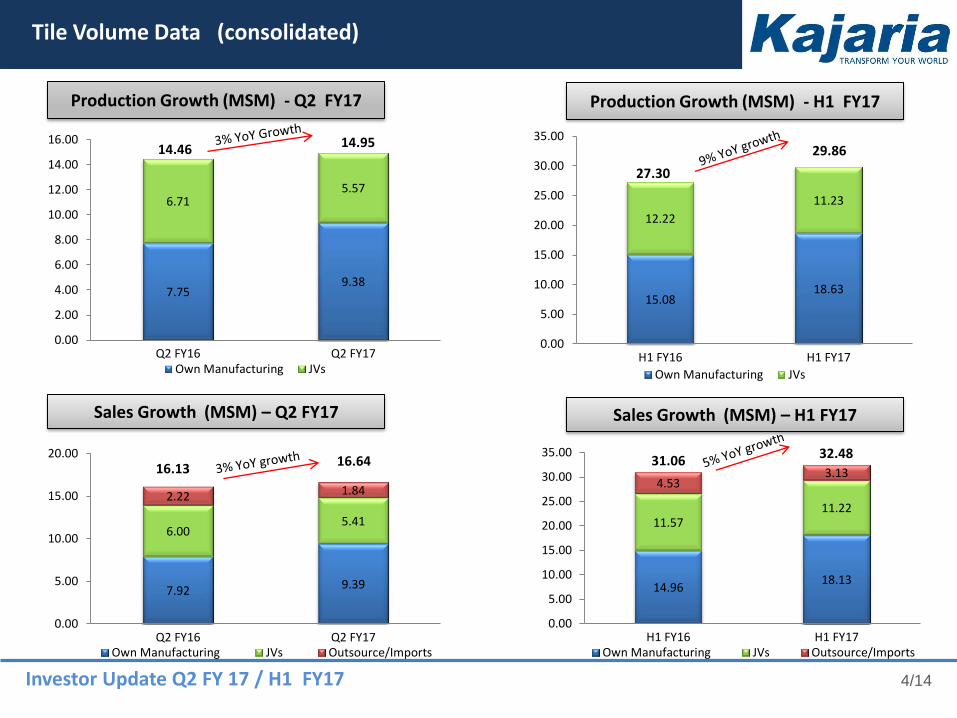
Tile Volume Data (consolidated)
4/14
Production Growth (MSM) - Q2 FY17
Sales Growth (MSM) – Q2 FY17
Production Growth (MSM) - H1 FY17
Sales Growth (MSM) – H1 FY17
7.75 9.38
6.71 5.57
0.00
2.00
4.00
6.00
8.00
10.00
12.00
14.00
16.00
Q2 FY16 Q2 FY17Own Manufacturing JVs
14.46 14.95
15.08 18.63
12.22
11.23
0.00
5.00
10.00
15.00
20.00
25.00
30.00
35.00
H1 FY16 H1 FY17
Own Manufacturing JVs
27.30
29.86
7.92 9.39
6.00 5.41
2.22 1.84
0.00
5.00
10.00
15.00
20.00
Q2 FY16 Q2 FY17Own Manufacturing JVs Outsource/Imports
16.13 16.64
14.96 18.13
11.57 11.22
4.53 3.13
0.00
5.00
10.00
15.00
20.00
25.00
30.00
35.00
H1 FY16 H1 FY17Own Manufacturing JVs Outsource/Imports
31.06 32.48
Investor Update Q2 FY 17 / H1 FY17
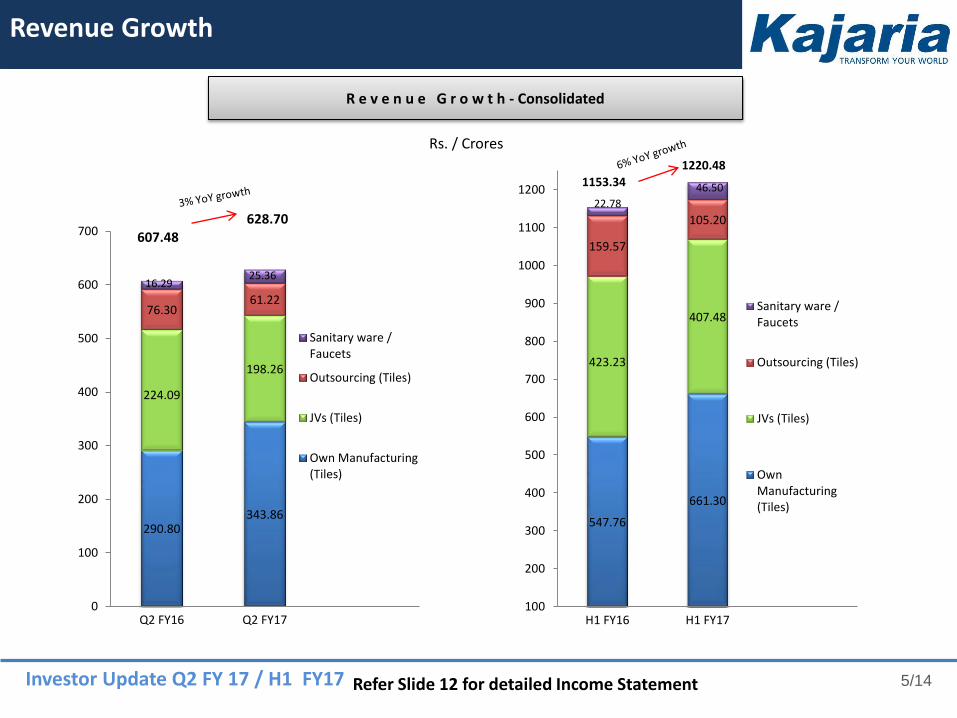
Revenue Growth
R e v e n u e G r o w t h - Consolidated
Refer Slide 12 for detailed Income Statement 5/14
Rs. / Crores
290.80 343.86
224.09
198.26
76.30 61.22
0
100
200
300
400
500
600
700
Q2 FY16 Q2 FY17
Sanitary ware /Faucets
Outsourcing (Tiles)
JVs (Tiles)
Own Manufacturing(Tiles)
607.48
628.70
16.29 25.36
547.76
661.30
423.23
407.48
159.57
105.20
100
200
300
400
500
600
700
800
900
1000
1100
1200
H1 FY16 H1 FY17
Sanitary ware /Faucets
Outsourcing (Tiles)
JVs (Tiles)
OwnManufacturing(Tiles)
1153.34
1220.48
22.78
46.50
Investor Update Q2 FY 17 / H1 FY17
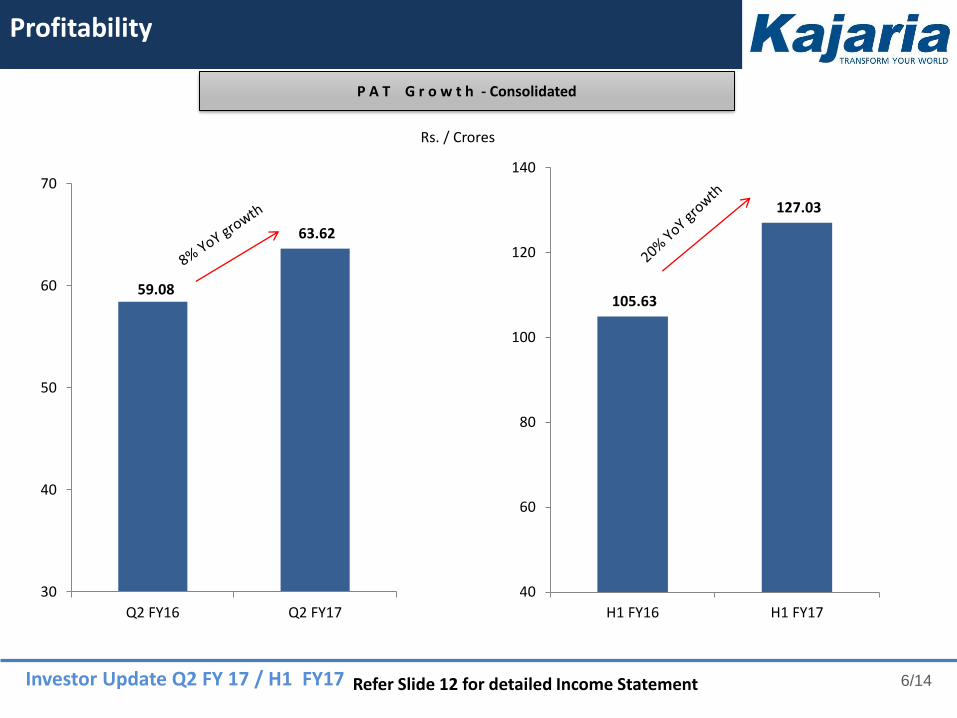
Profitability
P A T G r o w t h - Consolidated
Refer Slide 12 for detailed Income Statement 6/14
Rs. / Crores
59.08
63.62
30
40
50
60
70
Q2 FY16 Q2 FY17
105.63
127.03
40
60
80
100
120
140
H1 FY16 H1 FY17
Investor Update Q2 FY 17 / H1 FY17
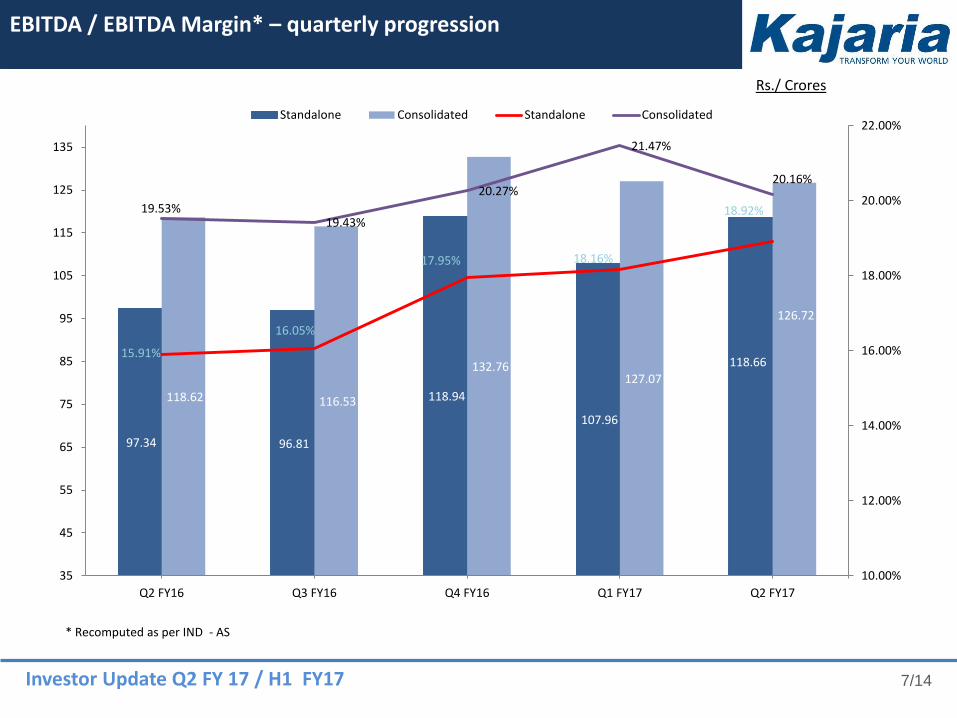
EBITDA / EBITDA Margin* – quarterly progression
Rs./ Crores
7/14
* Recomputed as per IND - AS
97.34 96.81
118.94
107.96
118.66
118.62 116.53
132.76 127.07
126.72
15.91%
16.05%
17.95% 18.16%
18.92% 19.53% 19.43%
20.27%
21.47%
20.16%
10.00%
12.00%
14.00%
16.00%
18.00%
20.00%
22.00%
35
45
55
65
75
85
95
105
115
125
135
Q2 FY16 Q3 FY16 Q4 FY16 Q1 FY17 Q2 FY17
Standalone Consolidated Standalone Consolidated
Investor Update Q2 FY 17 / H1 FY17
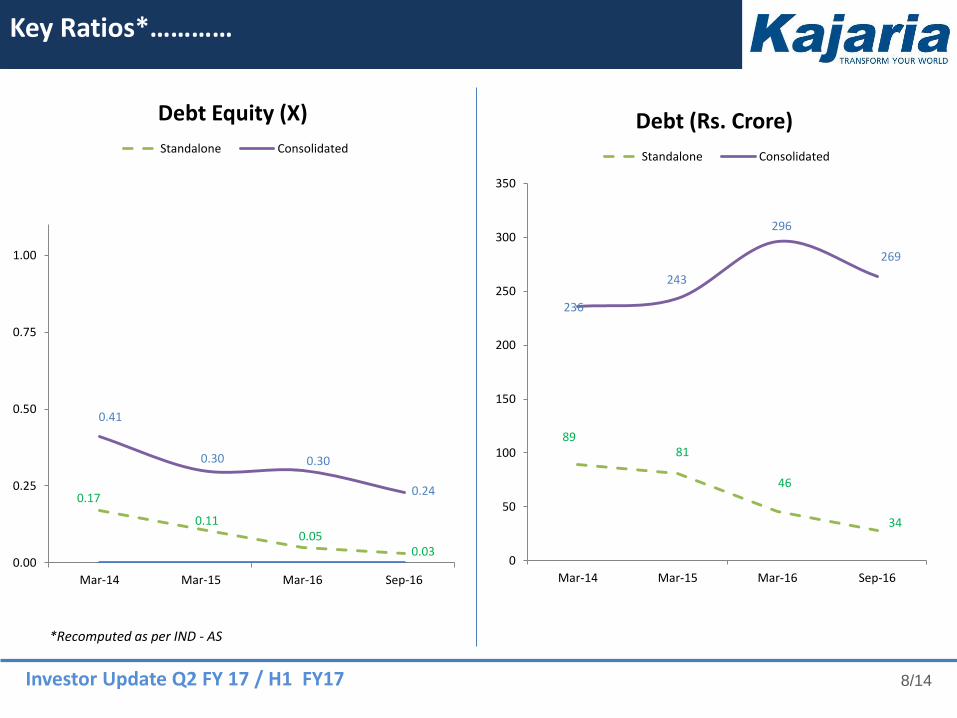
Key Ratios*…………
8/14
*Recomputed as per IND - AS
89 81
46
34
236
243
296
269
0
50
100
150
200
250
300
350
Mar-14 Mar-15 Mar-16 Sep-16
Debt (Rs. Crore)
Standalone Consolidated
0.17
0.11 0.05
0.03
0.41
0.30 0.30
0.24
0.00
0.25
0.50
0.75
1.00
Mar-14 Mar-15 Mar-16 Sep-16
Debt Equity (X)
Standalone Consolidated
Investor Update Q2 FY 17 / H1 FY17
9/14
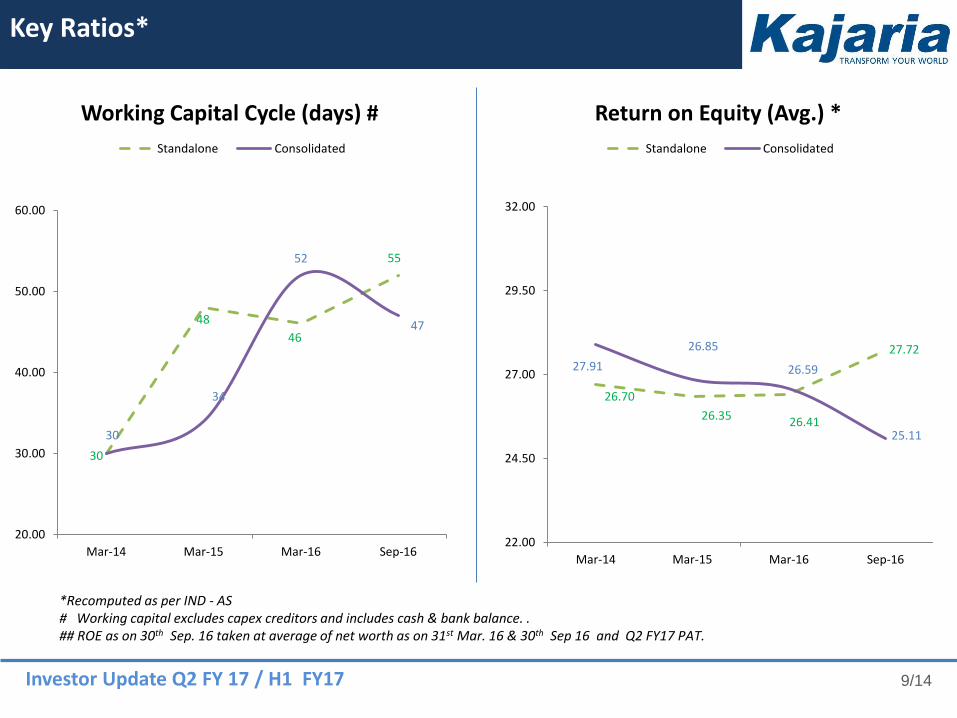
# Working capital excludes capex creditors and includes cash & bank balance. . ## ROE as on 30th Sep. 16 taken at average of net worth as on 31st Mar. 16 & 30th Sep 16 and Q2 FY17 PAT.
Key Ratios*
*Recomputed as per IND - AS
30
48
46
55
30
34
52
47
20.00
30.00
40.00
50.00
60.00
Mar-14 Mar-15 Mar-16 Sep-16
Working Capital Cycle (days) #
Standalone Consolidated
26.70
26.35 26.41
27.72
27.91
26.85
26.59
25.11
22.00
24.50
27.00
29.50
32.00
Mar-14 Mar-15 Mar-16 Sep-16
Return on Equity (Avg.) *
Standalone Consolidated
Investor Update Q2 FY 17 / H1 FY17
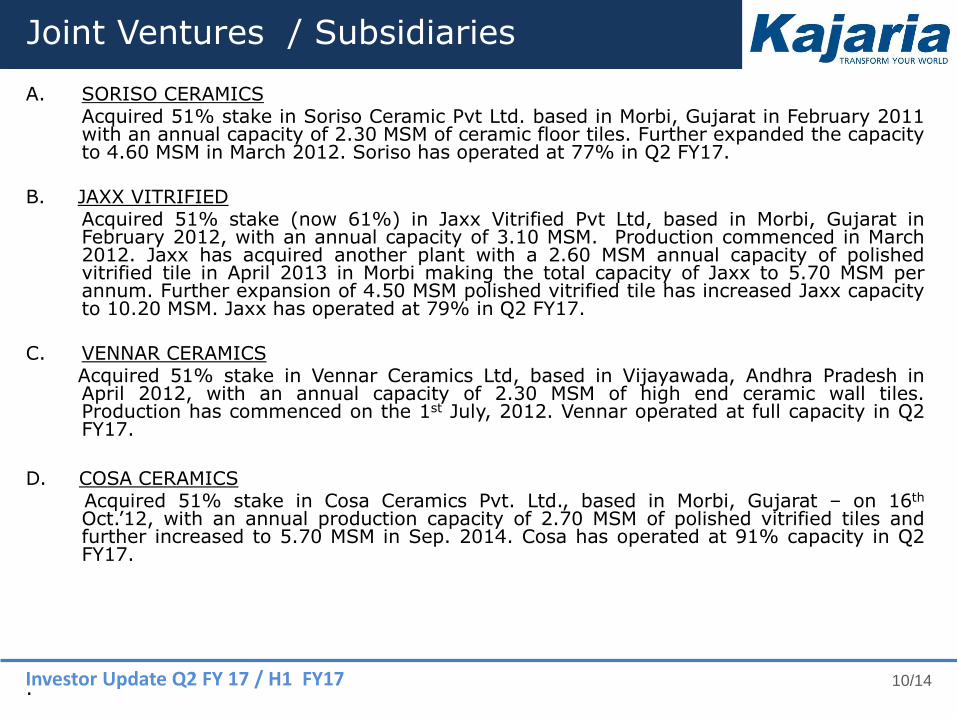
A. SORISO CERAMICS Acquired 51% stake in Soriso Ceramic Pvt Ltd. based in Morbi, Gujarat in February 2011
with an annual capacity of 2.30 MSM of ceramic floor tiles. Further expanded the capacity to 4.60 MSM in March 2012. Soriso has operated at 77% in Q2 FY17.
B. JAXX VITRIFIED Acquired 51% stake (now 61%) in Jaxx Vitrified Pvt Ltd, based in Morbi, Gujarat in
February 2012, with an annual capacity of 3.10 MSM. Production commenced in March 2012. Jaxx has acquired another plant with a 2.60 MSM annual capacity of polished vitrified tile in April 2013 in Morbi making the total capacity of Jaxx to 5.70 MSM per annum. Further expansion of 4.50 MSM polished vitrified tile has increased Jaxx capacity to 10.20 MSM. Jaxx has operated at 79% in Q2 FY17.
C. VENNAR CERAMICS Acquired 51% stake in Vennar Ceramics Ltd, based in Vijayawada, Andhra Pradesh in
April 2012, with an annual capacity of 2.30 MSM of high end ceramic wall tiles. Production has commenced on the 1st July, 2012. Vennar operated at full capacity in Q2 FY17.
D. COSA CERAMICS Acquired 51% stake in Cosa Ceramics Pvt. Ltd., based in Morbi, Gujarat – on 16th
Oct.’12, with an annual production capacity of 2.70 MSM of polished vitrified tiles and further increased to 5.70 MSM in Sep. 2014. Cosa has operated at 91% capacity in Q2 FY17.
.
Joint Ventures / Subsidiaries
10/14
Investor Update Q2 FY 17 / H1 FY17
11/14
Joint Ventures / Subsidiaries
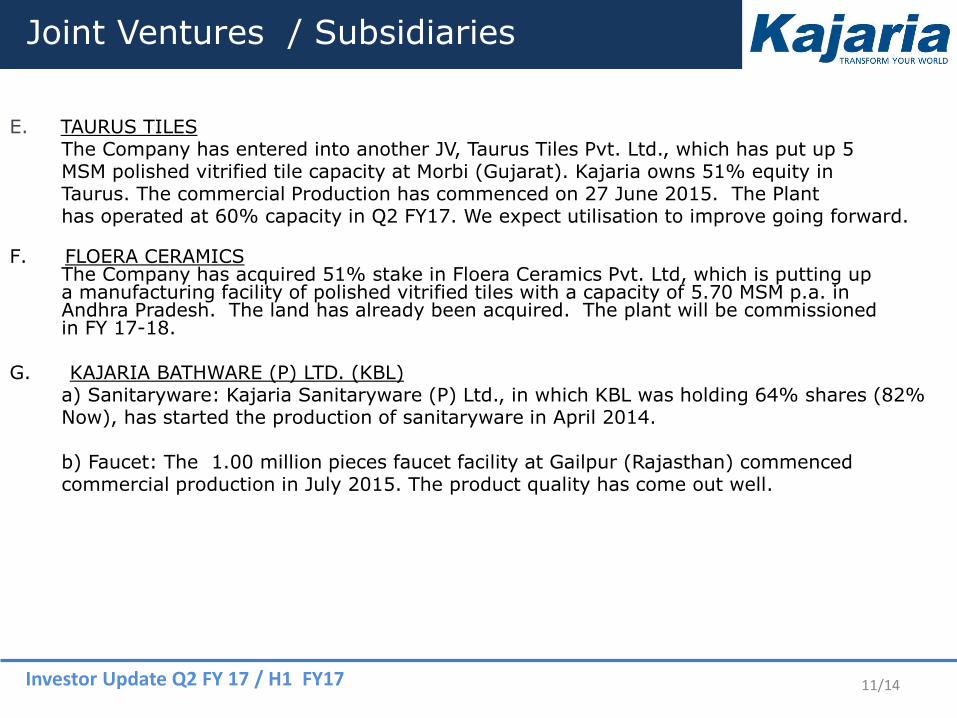
E. TAURUS TILES The Company has entered into another JV, Taurus Tiles Pvt. Ltd., which has put up 5 MSM polished vitrified tile capacity at Morbi (Gujarat). Kajaria owns 51% equity in Taurus. The commercial Production has commenced on 27 June 2015. The Plant has operated at 60% capacity in Q2 FY17. We expect utilisation to improve going forward. F. FLOERA CERAMICS The Company has acquired 51% stake in Floera Ceramics Pvt. Ltd, which is putting up a manufacturing facility of polished vitrified tiles with a capacity of 5.70 MSM p.a. in Andhra Pradesh. The land has already been acquired. The plant will be commissioned in FY 17-18. G. KAJARIA BATHWARE (P) LTD. (KBL) a) Sanitaryware: Kajaria Sanitaryware (P) Ltd., in which KBL was holding 64% shares (82% Now), has started the production of sanitaryware in April 2014. b) Faucet: The 1.00 million pieces faucet facility at Gailpur (Rajasthan) commenced commercial production in July 2015. The product quality has come out well.
Investor Update Q2 FY 17 / H1 FY17
Income Statement
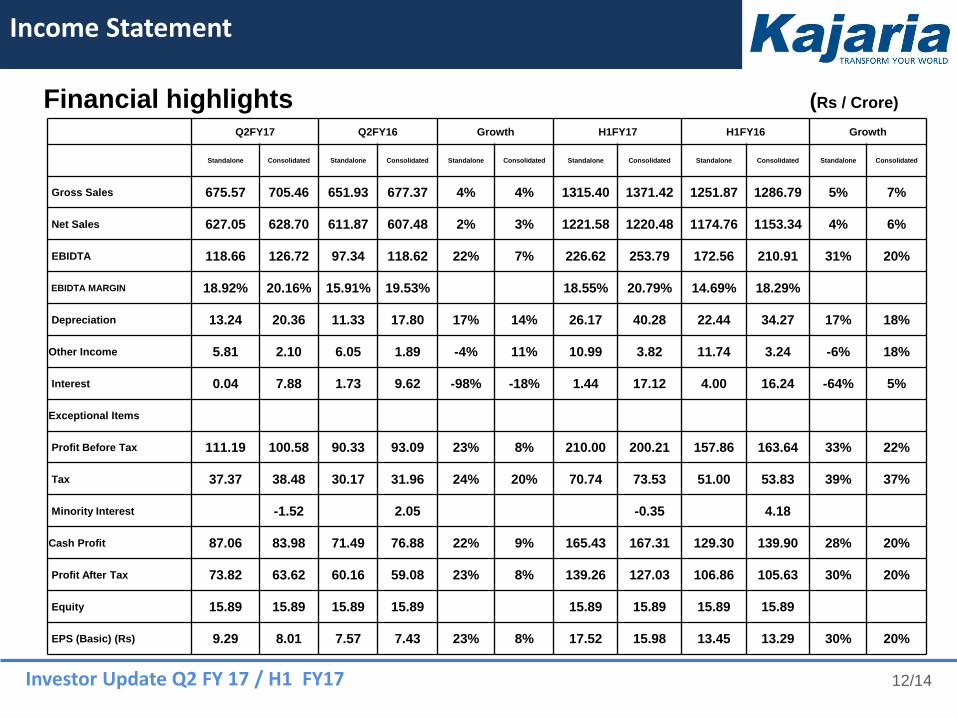
Financial highlights (Rs / Crore)
12/14
Q2FY17 Q2FY16 Growth H1FY17 H1FY16 Growth
Standalone Consolidated Standalone Consolidated Standalone Consolidated Standalone Consolidated Standalone Consolidated Standalone Consolidated
Gross Sales 675.57 705.46 651.93 677.37 4% 4% 1315.40 1371.42 1251.87 1286.79 5% 7%
Net Sales 627.05 628.70 611.87 607.48 2% 3% 1221.58 1220.48 1174.76 1153.34 4% 6%
EBIDTA 118.66 126.72 97.34 118.62 22% 7% 226.62 253.79 172.56 210.91 31% 20%
EBIDTA MARGIN 18.92% 20.16% 15.91% 19.53% 18.55% 20.79% 14.69% 18.29%
Depreciation 13.24 20.36 11.33 17.80 17% 14% 26.17 40.28 22.44 34.27 17% 18%
Other Income 5.81 2.10 6.05 1.89 -4% 11% 10.99 3.82 11.74 3.24 -6% 18%
Interest 0.04 7.88 1.73 9.62 -98% -18% 1.44 17.12 4.00 16.24 -64% 5%
Exceptional Items
Profit Before Tax 111.19 100.58 90.33 93.09 23% 8% 210.00 200.21 157.86 163.64 33% 22%
Tax 37.37 38.48 30.17 31.96 24% 20% 70.74 73.53 51.00 53.83 39% 37%
Minority Interest -1.52 2.05 -0.35 4.18
Cash Profit 87.06 83.98 71.49 76.88 22% 9% 165.43 167.31 129.30 139.90 28% 20%
Profit After Tax 73.82 63.62 60.16 59.08 23% 8% 139.26 127.03 106.86 105.63 30% 20%
Equity 15.89 15.89 15.89 15.89 15.89 15.89 15.89 15.89
EPS (Basic) (Rs) 9.29 8.01 7.57 7.43 23% 8% 17.52 15.98 13.45 13.29 30% 20%
Investor Update Q2 FY 17 / H1 FY17
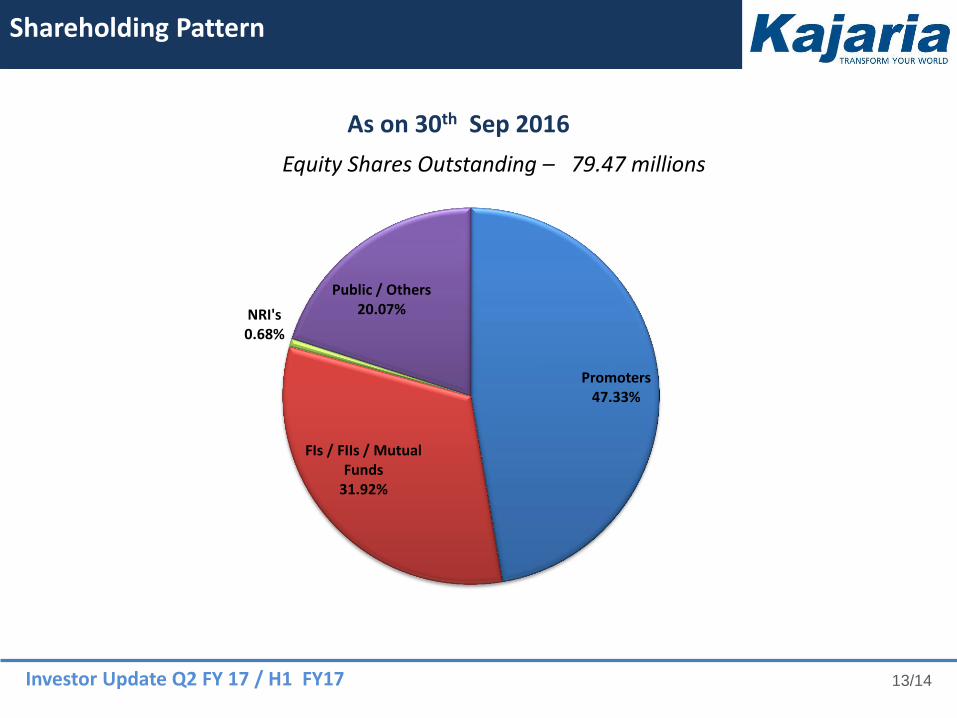
Shareholding Pattern
As on 30th Sep 2016
Equity Shares Outstanding – 79.47 millions
13/14
Promoters 47.33%
FIs / FIIs / Mutual Funds
31.92%
NRI's 0.68%
Public / Others 20.07%
Investor Update Q2 FY 17 / H1 FY17
About Us
Kajaria Ceramics is the largest manufacturer of ceramic/vitrified tiles in India and the 9th largest in the world. It has an annual capacity of 68.60 mn. sq. meters presently, distributed across nine plants - one in Sikandrabad (UP), one in Gailpur (Rajasthan), One in Malutana (Rajasthan), five in Morbi (Gujarat) and one in Vijaywada (AP).
Adjudged as the “Best Managed Company” in the small-cap category for the year 2014 by Asia Money, a financial Institutional Investor Group. For further information, please visit www.kajariaceramics.com or contact:
Mr. Sanjeev Agarwal CFO +91 11 26946409 (Board), +91 11 41064110 (Direct) Email: [email protected]
14/14
Disclaimer: Certain Statements in this document may be forward-looking within the meaning of applicable laws and regulations. And actual results might differ substantially from those expressed or implied. Such statements are subject to certain risks and uncertainties like regulatory changes, local political or economic developments, technological risks, and many other factors could cause our actual results to differ. Kajaria Ceramics Limited will not be in any way responsible for any action taken based on such statements.