Embed Size (px)
Citation preview

P14372 Actively Stabilized Hand-Held Laser Pointer
Kaitlin PeranskiSpencer WasilewskiKyle JensenKyle LasherJeremy BerkeChris Caporale

Agenda• Problem Definition Review• Executive Summary• System Review• Detailed Design Review• Detailed Risk Assessment• Test Plans• Bill of Materials• Cost Analysis• Project Plan for MSD II

Problem Definition Review

Problem Definition• There are many people today who use laser for various
applications: to aid in presentations, medical imaging, and defense. Under many use scenarios they are negatively affected by unwanted vibrations; one such example is a nervous presenter using a laser pointer. New Scale Technologies (NST) has developed a module that steers a laser beam using piezoelectrics and mirrors. Currently they cannot actively detect and compensate for hand vibrations. To reduce this gap, a handheld and user friendly unit is to be developed utilizing the NST module. Concerns for development include: response time, operating temperature and duration, and unwanted motion attenuation.

Customer Needs
Engineering Requirements

Executive Summary• Target Frequency Range: 1-20 Hz• Cost Analysis: Total < $350• Test Bench Design: < $100• Response Time Analysis:
• Required = 12.5 ms• Capability = 10 ms (worst case)
• Power Consumption: 1.4 Watts• Heat Generation: Surface temperature of 95o F• Comparison of Gyroscopes and Accelerometers:
Beyond 80 cm, gyroscopes are more accurate• Housing: Aluminum, 139X42X32 mm

System Review

System Architecture

Concept Selection
Concept 1• Battery• Gyroscope• Low Pass Filter• Processor• Communication to NST
Module
Concept 2• Battery• Accelerometer• Integrator/Low Pass
Filter• Processor• Communication to NST

Gyroscope VS Acceleromter

Required Response Time• Highest hand jitter frequency = 20 Hz• Sample rate = 4*frequency = 80 Hz = .0125 sec• Required time = .0125 sec or 12.5 ms to
accurately reduce vibrations

Response Time Breakdown
• NST• Data Acquisition• Software Interpretation and Control• Communication to NST

Tested Circuit

Response Time Measurements
Total Time Zoomed to Zero (Delay)

Total Response Time• NST ~ 2 ms (worst case scenario)• Data Acquisition ~ 2 ms• Software Interpretation and Control ~ 2-5 ms• Communication to NST ~ .2 ms• Total Time = 9.9 to 10 ms• Gives 2.5 ms of overhead

Agenda• Detailed Design Review
• Schematic Drawings• Control Algorithm• Thermal Resistance Analysis• Device Housing/Layout• Test Bench Design

Detailed Review

Block Schematic: Our System

Gyroscope Schematic

• InvenSense ITG-3200
• Sample Rate: 8kHz
• Operating Current: 6.5mA
• Operating Voltage: 3.3V
• Full Scale Range: 2000°/s
• Fast Mode 400kHz I2C Interface
• Simple breakout board with mounting holes
Gyroscope

Power Supply and Charger

• UnionFortune 063450 Cells
• 1000mAh LiPo
• 2 cells in parallel for 2000mAh total
• Battery life close to 4 hours
• -25°C to 60°C Operating Temperature
• Nominal Voltage: 3.7V
• Maximum Current: 1A (wire limited)
Battery

Processor Schematic

• SparkFun Arduino Fio v3
• 8MHz Clock
• 16 Digital I/Os
• 6 Analog I/Os
• 150mA Current Draw
• Built in 3.3v regulator and LiPo charger
• Built in switch
• I2C, SPI, USB compatible
Processor

Deriving the Transfer Function
y [n ]= y [n−1]+ T s x [n]
y ( z )= z− 1 y ( z )+ T s x ( z )
H (z )=T s
1−z−1
C (z )=−T s zz−1
y ( z )[ z−1 ]=−T z x ( z )
y [n+ 1]− y [n ]=−T s x [n+ 1 ]
n '=n+ 1
y [n ' ]= y [n '−1]−T s x [n ' ]
n ' → n
y [n ]= y [n−1]−T s x [n]
?

Pole Zero Map C (z )=−T s zz−1
=−T s1− z−1

Bode Plot

Sample Input (f = 1 Hz)
Green is input, Red is output

Control Algorithmy [n ]= y [n−1]−T s x [n]
Poll Gyro For Data(I2C)
Subtract Gyro DataFrom Accumulator
Acc > 15?
Acc < -15?
Acc = 0
Wait
Compute EncoderCounts
Send to NST Module
Re-Center NST Module

First Control Scheme
0 2 4 6 8 10 12 14-0.6
-0.4
-0.2
0
0.2
0.4Gyro Output
Ang
ular
Vel
ocity
(D
eg/s
)
Time (s)
0 2 4 6 8 10 12 14-1.5
-1
-0.5
0
0.5Integrated Gyro Data
Ang
ular
Dis
plac
emen
t (D
eg/s
)
Time (s)
0 2 4 6 8 10 12 14-0.5
0
0.5
1
1.5Computed Correction
Ang
ular
Dis
plac
emen
t (D
eg/s
)
Time (s)

Second Control Scheme
0 2 4 6 8 10 12 14-0.6
-0.5
-0.4
-0.3
-0.2
-0.1
0
0.1
0.2
0.3
0.4Gyroscope Output
Deg
/s
s
0 2 4 6 8 10 12 14-0.4
-0.2
0
0.2
0.4
0.6
0.8
1
1.2Computed Correction
Deg
s
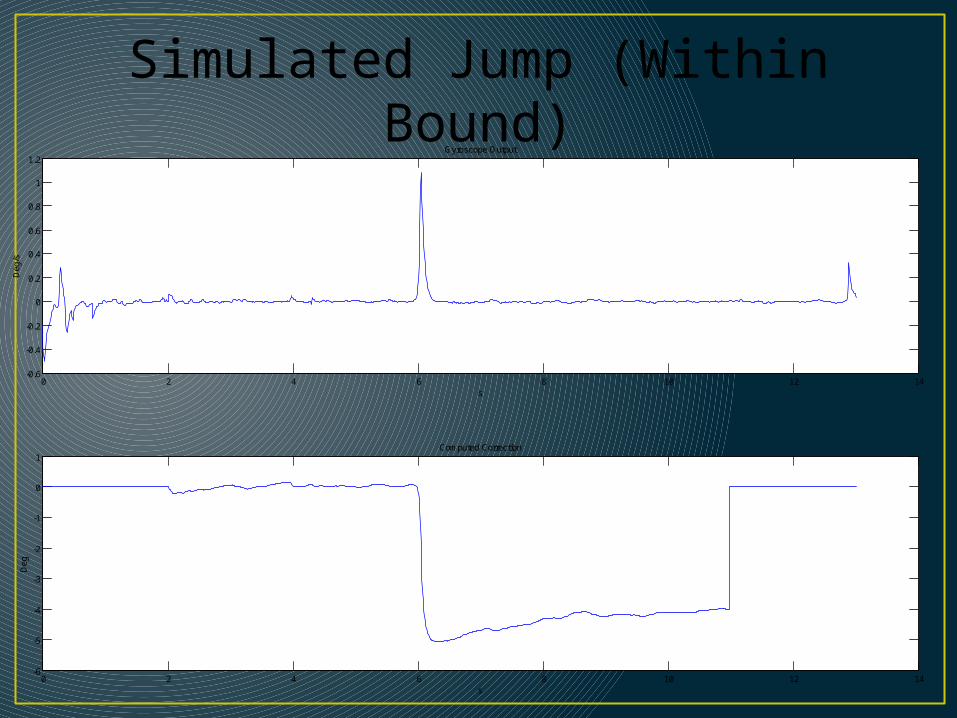
Simulated Jump (Within Bound)
0 2 4 6 8 10 12 14-0.6
-0.4
-0.2
0
0.2
0.4
0.6
0.8
1
1.2Gyroscope Output
Deg
/s
s
0 2 4 6 8 10 12 14-6
-5
-4
-3
-2
-1
0
1Computed Correction
Deg
s

Simulated Jump (Bound Crossing)
0 2 4 6 8 10 12 14-1
-0.5
0
0.5
1
1.5
2
2.5Gyroscope Output
Deg
/s
s
0 2 4 6 8 10 12 14-16
-14
-12
-10
-8
-6
-4
-2
0
2Computed Correction
Deg
s
Delay = .1s

Simulated Jump (Bound Crossing)
0 2 4 6 8 10 12 14-1
0
1
2
3
4
5
6Gyroscope Output
Deg
/s
s
0 2 4 6 8 10 12 14-16
-14
-12
-10
-8
-6
-4
-2
0
2Computed Correction
Deg
s
Delay = .5 s

Thermal Resistance Analysis• Surface temperature of housing• Assuming hand insulating half the surface and
=68°F

Thermal Resistance Analysis
RAir RHandRHousing
RHousingRAir Ratm
TH TS
TH TS
QQ1,TC1
Q2,TC2
THand
T∞
95°F98°F98°F116°F
68°F96°F96°F116°F
Thermal Resistance Analysis
• Assuming TC1=TC2=TC

Thermal Resistance Conclusions• Top surface = 96• Bottom surface (surface with hand) = 97• Temperature at surface of chip = 117
Q - Heat Generation, Chip
Air
Air
Housing
Housing
Hand
T∞
Thand

Device Housing: Shell
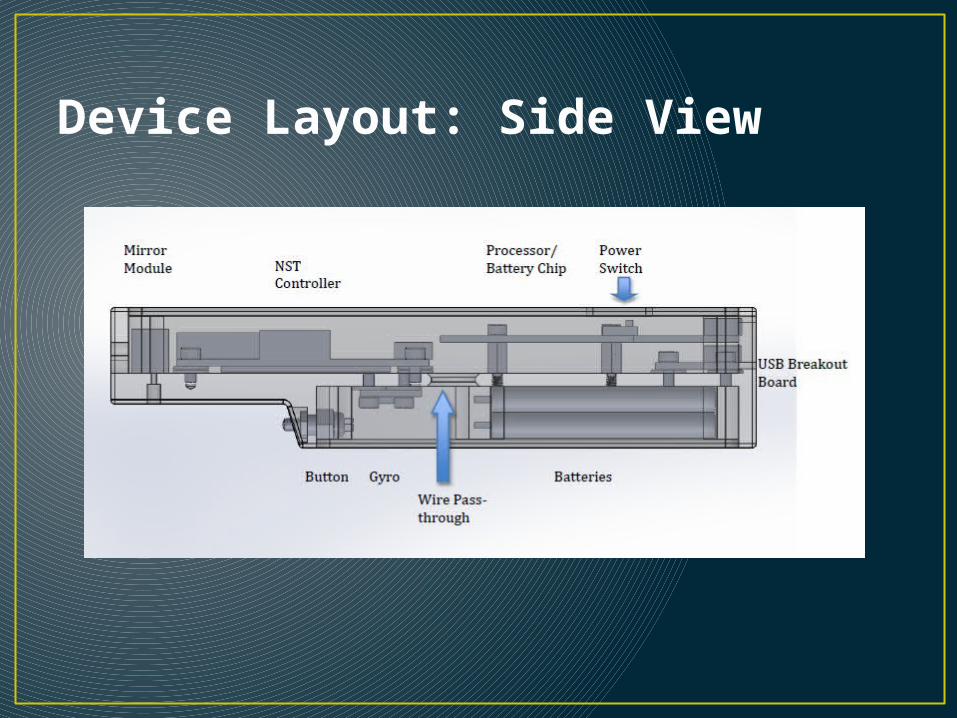
Device Layout: Side View

Device Layout: Side View

Device Layout: Side View with Screws

Device Layout: Top View

Device Layout: Bottom View

Device Layout: Rear View
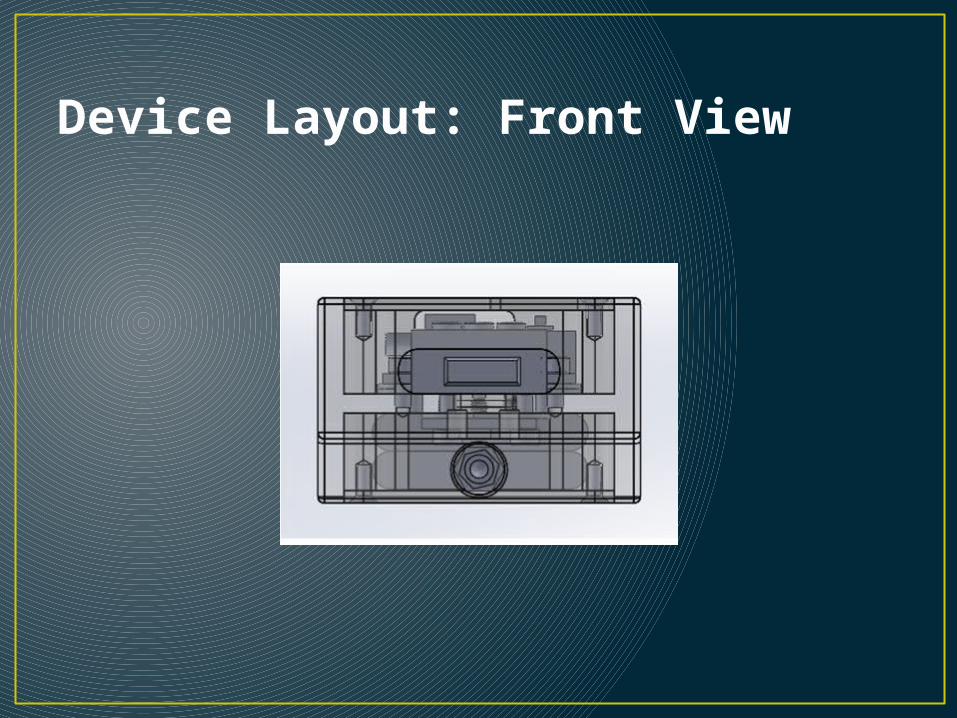
Device Layout: Front View
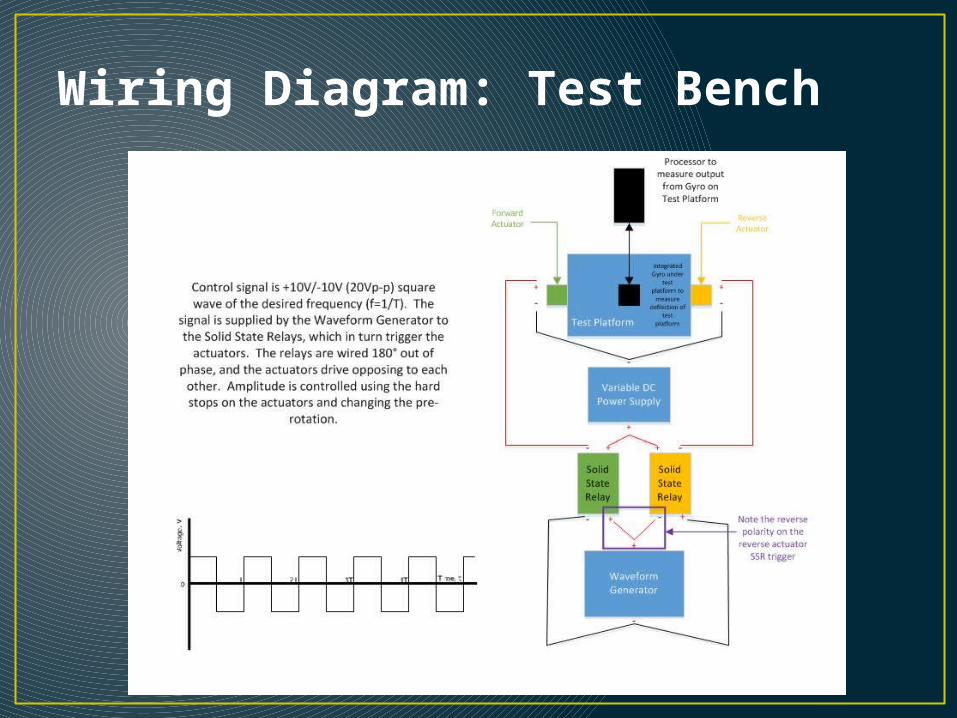
Wiring Diagram: Test Bench

Test Bench Design

Test Bench

Test Bench
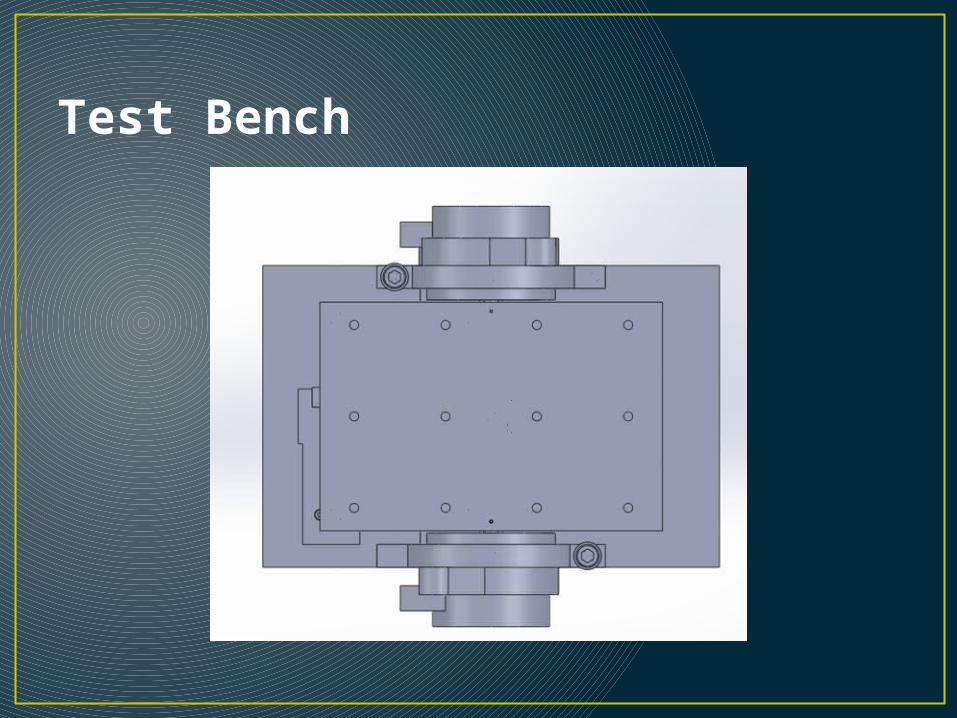
Test Bench

Test Bench

Test Bench

Agenda• Detailed Risk Assessment• Test Plans• Bill of Materials• Cost Analysis• MSD II Project Schedule
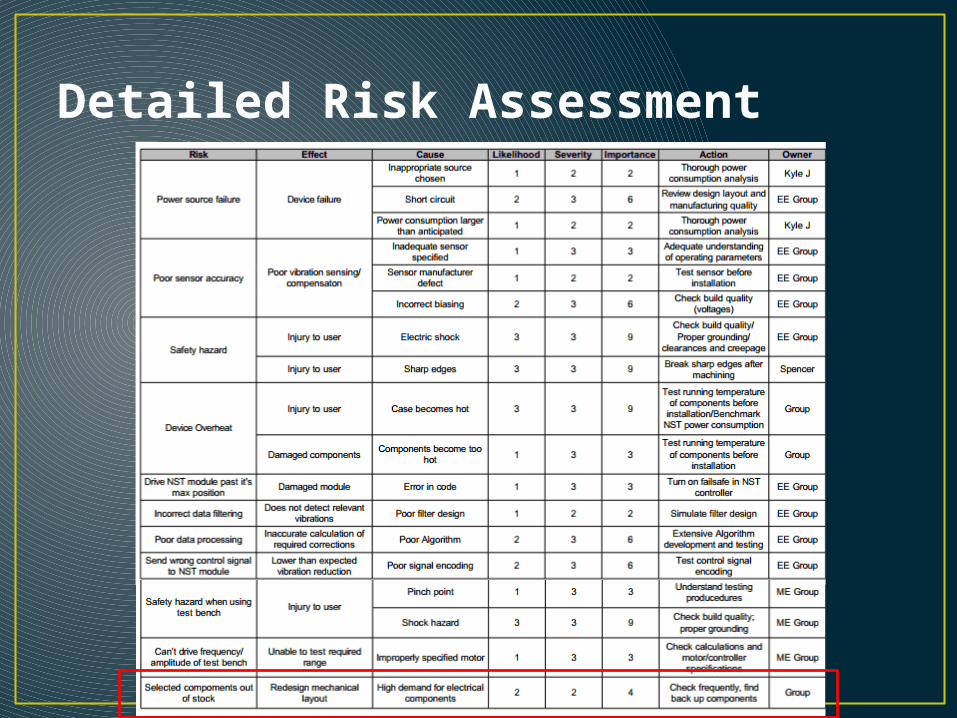
Detailed Risk Assessment

Test Plans• Validate control algorithm code• Validate gyroscope within device• Verify test bench functionality• Calibrate test bench using second gyroscope• Confirm battery life and heat generation• Confirm surface and chip temperature

Cost Analysis

MSD I Project Plan

MSD II Project Plan

THANK YOU!

Appendix

Housing Drawing

Housing Drawing

Housing Drawing

Housing Drawing