Embed Size (px)
Citation preview

Kaipara Harbour Estuary Monitoring Programme 2014
Date: 30/10/2014 Author: Richard Griffiths (Northland Regional Council)


Northland Regional Council Estuary Monitoring Programme: Kaipara Harbour 2014 i
Table of contents Table of contents ........................................................................................................................... i Executive summary ....................................................................................................................... v
Sediment grain size ................................................................................................................... v
Sediment nutrients .................................................................................................................... v
Sediment metals ........................................................................................................................ v
Ecology .................................................................................................................................... vi Relating ecological and sediment data .................................................................................... vii
1 Introduction ............................................................................................................................ 1
1.1 Background .................................................................................................................... 1
1.2 Study area ...................................................................................................................... 1
2. Methods ................................................................................................................................. 6
2.1 Field methods ................................................................................................................. 6
2.1.1 Sampling sites ......................................................................................................... 6
2.1.2 Timing of sampling ................................................................................................... 6
2.1.3 Ecological sampling ................................................................................................. 6
2.1.4 Sediment properties ................................................................................................. 6
2.2 Data analysis .................................................................................................................. 8
3 Results ................................................................................................................................. 10
3.1 Sediment grain size ...................................................................................................... 10
3.2 Sediment TOC and nutrient concentrations .................................................................. 12
3.2.1 TOC ....................................................................................................................... 12
3.2.2 Total nitrogen ......................................................................................................... 13
3.2.3 Total phosphorus ................................................................................................... 14
3.2.4 Comparison with previous nutrient concentrations in the Kaipara Harbour............. 15
3.2.5 Comparison of nutrient concentrations in Northland estuaries ............................... 15
3.3 Sediment metal concentrations ..................................................................................... 16
3.3.1 Cadmium ............................................................................................................... 16
3.3.2 Chromium .............................................................................................................. 17
3.3.3 Copper ................................................................................................................... 18
3.3.4 Nickel ..................................................................................................................... 19
3.3.5 Lead ...................................................................................................................... 20
3.3.6 Zinc ........................................................................................................................ 21
3.3.7 Comparison with previous metal concentrations recorded in the Kaipara Harbour . 22
3.3.8 Comparison of metal concentrations in Northland estuaries .................................. 22
3.4 Ecology ......................................................................................................................... 23
3.4.1 Biodiversity ............................................................................................................ 23
3.4.2 Multivariate analysis of intertidal ecological data ................................................... 26

Northland Regional Council Estuary Monitoring Programme: Kaipara Harbour 2014 ii
3.4.3 Shellfish ................................................................................................................. 33
3.4.4 Non-indigenous species ......................................................................................... 36
3.5 Relating inter-tidal community structure and sediment properties ................................. 39
4 Discussion ........................................................................................................................... 40
4.1 Sediment grain size ...................................................................................................... 40
4.2 Sediment TOC and nutrient concentrations .................................................................. 40
4.3 Sediment metals ........................................................................................................... 41
4.4 Ecology ......................................................................................................................... 42
4.5 Shellfish ........................................................................................................................ 43
4.6 Non-indigenous species ................................................................................................ 43
4.7 Relating ecological and sediment data .......................................................................... 44
5 Acknowledgements .............................................................................................................. 45
Appendix 1 Land Use in the northern Kaipara Harbour catchment .......................................... 48
Appendix 2 Site co-ordinates (NZGD 2000 New Zealand Transverse Mercator) ..................... 49
Appendix 3 Field notes ............................................................................................................ 50
Appendix 4 Sediment results ................................................................................................... 53
Appendix 5 Diversity indices .................................................................................................... 56

Northland Regional Council Estuary Monitoring Programme: Kaipara Harbour 2014 iii
Tables Table 1. Sediment quality guidelines.. .......................................................................................... 8 Table 2. Sediment nutrient guidelines. . ....................................................................................... 8 Table 3. Concentrations of nutrients and AFDW at four sites previously surveyed. . .................. 15 Table 4. Mean sediment nutrient concentrations in Northland estuaries. .................................... 15 Table 5. Concentrations of metals at four sites previously surveyed. . ....................................... 22 Table 6. Mean metal concentrations recorded in Northland estuaries ........................................ 22 Table 7. Community types, based on MDS and cluster analysis in the Kaipara Harbour 2014. .. 30 Table 8. Community types the Kaipara Harbour 2014, based on Hewitt and Funnell’s (2005) ecological classification rules. ..................................................................................................... 32 Table 9. DISTLM marginal tests for log10 sediment properties and abundance data from the Kaipara Harbour in 2014. ............................................................................................................ 39

Northland Regional Council Estuary Monitoring Programme: Kaipara Harbour 2014 iv
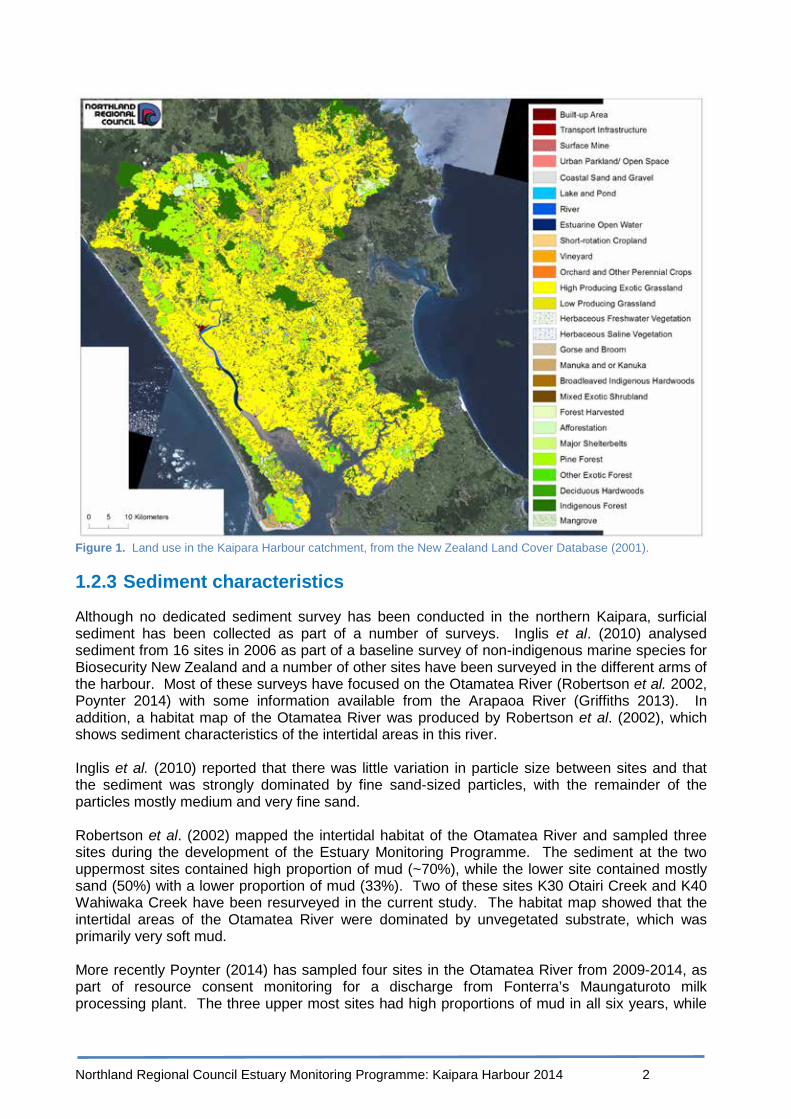
Figures Figure 1. Land use in the Kaipara Harbour catchment, from the New Zealand Land Cover Database (2001). .......................................................................................................................... 2
Figure 2. Location of sampling sites in the northern Kaipara Harbour. ......................................... 7
Figure 3. Sediment grain size characteristics of intertidal sites in the Kaipara Harbour. ............. 10
Figure 4. Firm sandy substrate at K38 Sandy Bay. .................................................................... 11
Figure 5. Soft mud at K41 Kaiwaka River. .................................................................................. 11
Figure 6. Total organic carbon (TOC %) concentrations in the Kaipara Harbour 2014. .............. 12
Figure 7 Sediment nitrogen concentrations in the Kaipara Harbour 2014. .................................. 13
Figure 8. Sediment phosphorus concentrations in the Kaipara Harbour 2014. ........................... 14
Figure 9. Sediment cadmium concentrations in the Kaipara Harbour, 2014. .............................. 16
Figure 10. Sediment chromium concentrations in the Kaipara Harbour, 2014. ........................... 17
Figure 11. Sediment copper concentrations in the Kaipara Harbour, 2014. ................................ 18
Figure 12. Sediment nickel concentrations in the Kaipara Harbour, 2014 .................................. 19
Figure 13. Sediment lead concentrations in the Kaipara Harbour, 2014 ..................................... 20
Figure 14. Sediment zinc concentrations in the Kaipara Harbour, 2014 ..................................... 21
Figure 15. The total number of taxa. .......................................................................................... 24
Figure 16. The total number of individuals.................................................................................. 24
Figure 17. Taxonomic groups. .................................................................................................... 25
Figure 18. Shannon-Wiener diversity. ........................................................................................ 25
Figure 19. K18 Tauhara. ............................................................................................................ 27
Figure 20. K28 Sandy Beach. .................................................................................................... 27
Figure 21. Group average linkage cluster of Bray-Curtis similarities from square root transformed abundance data collected from Kaipara harbour 2014 ................................................................ 28
Figure 22. Non-metric MDS ordination of Bray-Curtis similarities from square root transformed abundance data collected from the Kaipara Harbour in 2014. Sites closest together are more similar. ........................................................................................................................................ 29
Figure 23. Ecological community groupings of intertidal sites based on cluster and MDS analysis of abundance data from the Kaipara Harbour in 2014 ................................................................. 29
Figure 24. Ecological community types in the Kaipara Harbour 2014, based on Hewitt and Funnell’s (2005) ecological classification rules ............................................................................ 31
Figure 25. Density of cockles in cores collected in the Kaipara Harbour in 2014. ....................... 33
Figure 26. Density of pipi in cores collected in the Kaipara Harbour in 2014. ............................. 34
Figure 27. Density of wedge shells in cores collected in the Kaipara Harbour in 2014. .............. 35
Figure 28. Density of Theora lubrica in cores collected in the Kaipara Harbour in 2014. ............ 36
Figure 29. Density of Asian date mussel in cores collected in the Kaipara Harbour in 2014. ....... 37
Figure 30. Asian date mussels on Fifty Acre Bank. .................................................................... 38
Figure 31. Firm sand in the centre of Fifty Acre Bank. ................................................................ 38
Figure 31. Map of Pacific oyster reef on the Avril flats. ............................................................... 38

Northland Regional Council Estuary Monitoring Programme: Kaipara Harbour 2014 v
Executive summary In 2014, Northland Regional Council (Council) sampled 44 intertidal sites throughout the northern Kaipara Harbour in order to survey the sediment quality and ecological status of the harbour. The survey methods were adapted from the Estuary Monitoring Protocol (Robertson et al. 2002), which was developed by Cawthron for use by regional councils. The survey involved sampling the physical and chemical properties of the sediment (metal and nutrient concentrations), and the ecological communities of intertidal habitats. The survey will provide baseline data to track changes in the health of the harbour over time and complement the existing data from Council’s two estuary monitoring sites in the Arapaoa River arm of the Kaipara Harbour.
Sediment grain size The sediment grain size characteristics displayed a general pattern of high proportions of mud in tidal creak environments such as the Arapaoa River, Otamatea River and the Oruawharo River, giving way to more fine and medium sand in the main Wairoa River arm and towards the harbour entrance.
Sediment nutrients While nutrients are essential for all forms of life, nutrients that enter the environment from anthropogenic sources, such as fertiliser, stormwater and treated wastewater may exceed the needs of an ecosystem and have adverse effects on the health of the harbour. In an enriched environment the sediment may become oxygen depleted and animals may die or migrate from the affected area. Consequently the community may become less diverse as it is recolonised by a smaller number of opportunist species that are tolerant of low oxygen conditions. Using criteria developed by Robertson and Stevens (2007), 13 sites were classified as ‘enriched’ for total organic carbon (TOC), ten sites were classified as ‘enriched’ for phosphorus and four sites were ‘enriched’ for nitrogen. In addition, the mean nitrogen concentration in the northern Kaipara Harbour was higher than most values previously recorded in Northland estuaries. Higher mean nitrogen values have only previously been found by Council in the Bay of Islands and the Hokianga Harbour. The nitrogen concentration recorded at K36 Matanginui, in the upper Wairoa arm, was also particularly high in comparison to other sites surveyed recently by Council. The mean phosphorus and TOC levels recorded in the northern Kaipara Harbour were towards the middle of the range of values recorded for other estuaries surveyed by Council. A similar pattern was observed for levels of TOC, nitrogen and phosphorus, with the highest levels recorded at mud dominated sites in the upper reaches of the different arms of the harbour, with levels generally decreasing down each arm towards the entrance of the harbour. This pattern is consistent with these sites being located close to potential freshwater inputs of nutrients, in depositional tidal creek environments with higher proportions of mud. Sediment carbon and nutrients absorb onto mineral surfaces and tend to increase with decreasing sediment grain size. Potential sources of nutrients to the Kaipara Harbour include municipal wastewater treatment plants, seepage from the wastewater network and septic tanks, stormwater, runoff from agricultural land and discharges from farm dairy effluent systems and dairy processing plants.
Sediment metals Heavy metals can have lethal and sub lethal effects on benthic invertebrates. In a contaminated environment the species diversity and species richness may decrease as the community

Northland Regional Council Estuary Monitoring Programme: Kaipara Harbour 2014 vi
becomes dominated by a smaller number of more tolerant species, which are able to survive and reproduce in these conditions. The concentration of nickel at K34 Burgess Island Inner exceeded the Australian and New Zealand Guidelines for Fresh and Marine Water Quality (ANZECC) ISQG-Low effect trigger values (Australian New Zealand Environment Conservation Council 2000) and the concentration of copper exceeded the threshold effect level developed by MacDonald et al. (1996). The relatively high concentrations of nickel and copper at this site are surprising as there are no obvious sources of metal contaminants in the vicinity and two other sites located relatively close to this site did not have elevated metal concentrations. The concentration of copper at K41 Kaiwaka River also exceeded the threshold effect level. Potential sources of metal contaminants at this site include discharges from a waste water treatment plant, road run off and stormwater discharges. At the other 42 sites all of the metal concentrations were below (ANZECC) ISQG-Low effect trigger values (Australian New Zealand Environment Conservation Council 2000) and the threshold effect levels developed by MacDonald et al. (1996). This suggests that the concentrations of metals at most sites in the northern Kaipara are unlikely to be having an adverse effect on the ecology. Within the northern Kaipara Harbour the highest concentrations of metals were generally recorded in the upper reaches of the Wairoa River and in tidal creek environments of the other arms of the harbour. These sites are generally located in depositional environments where there were high proportions of mud. Heavy metal absorption tends to increase as sediment grain size decreases, which reflects the tendency for heavy metals to be preferentially absorbed onto the large surface area of fine grained sediments rich in clay minerals (Abrahim et al. 2007). The lowest concentrations were generally recorded along the Pouto shoreline in the main Wairoa arm of the harbour.
Ecology The intertidal habitats surveyed were reasonably varied, including sheltered muddy tidal creek environments, sand flats, sand banks, and exposed sandy beaches. One sample was also collected from an area of Pacific oyster reef. Sites were located on the mid inter-tidal so no mangrove forests were sampled. No seagrass beds were encountered and we are not aware of any intertidal or subtidal seagrass beds in the northern Kaipara Harbour. Cluster analysis and non-metric multi-dimensional scaling (MDS) ordination was undertaken to examine the ecological data. Cluster analysis and MDS ordination are visual displays of a species similarity matrix which can help to identify groups of samples. This analysis identified four main groups. The first group (Group A) included sites found on sheltered mud flats in the different arms of the harbour and was characterised by polychaete worms, and the invasive bivalve Theora lubrica. A second group (Group B) comprised sites found in the upper reaches of the estuarine arms of the harbour with a high proportion of mud and was characterised by oligochaete and polychaete worms. A third group (Group C) included sites found on more sandy sites in the main Wairoa arm of the harbour. This group was characterised by the cockle Austrovenus stutchburyi, the polychaete worm Aonides trifida, and the wedge shell Macomona liliana. The fourth group (Group D) comprised four sites located on exposed sand flats and sand banks in the main Wairoa arm of the harbour. This group was characterised by the bivalves Soletellina sp., the wedge shell Macomona liliana and the cockle Austrovenus stutchburyi. Sites in Group A and Group B tended to have lower species richness, lower total number of individuals and lower Shannon-Wiener diversity scores than sites in Group C and Group D. In addition, although biomass was not measured in this survey it is likely that sites in Group C and D had much higher biomass than sites in Group A and Group B. This is likely because sites in Group A and B were characterised by small animals (marine worms) and generally had low

Northland Regional Council Estuary Monitoring Programme: Kaipara Harbour 2014 vii
abundances of large bodied animals (e.g. cockles, pipi and wedge shells), while sites in Groups C and D were characterised by high abundances of large bodied shellfish. The cluster analysis and MDS ordination also identified a fifth group (Group E) comprising just two sites, which were both located in the upper reaches of the Oruawharo River. A further four sites were not part of these five groups: K18 Tauhara, K19 Tauhara Creek K28 Sandy Beach, and K27 Moturoa Island. K18 Tauhara, K19 Tauhara Creek and K28 Sandy Beach all had low species richness and low abundances of animals. Only two cores were analysed from K27 Moturoa Island and the taxa found in these two cores were quite different resulting in a very low within-site similarity.
Relating ecological and sediment data A distance-based linear model (DISTLM) showed that all the sediment properties, except coarse sand had significant relationships to the intertidal community structure. When examined individually the proportion of mud and TOC explained the highest amount of the variation in the ecological data with these properties able to explain 17% and 16% of the variation in the ecological data respectively. DISTLM also showed that the combination of mud, medium sand, TOC, lead, chromium, zinc and phosphorus explained 39% of the variation in the community structure. Previous analysis of data collected from Council’s two sentinel sites in the Arapaoa River arm of the Kaipara Harbour also showed that the sediment properties were significantly related to the ecological data (Griffiths 2013a). The significant relationship between these sediment properties and the ecological data indicates that the physical and chemical characteristics of the sediment have influenced the ecological communities found in the northern Kaipara Harbour.

Northland Regional Council Estuary Monitoring Programme: Kaipara Harbour 2014 1
1 Introduction 1.1 Background Council has implemented Estuary Monitoring Programmes in the Whāngārei Harbour, Kerikeri Inlet, Ruakaka Estuary, Whangaroa Harbour, and the Arapaoa arm of the Kaipara Harbour. In total 13 ‘sentinel’ sites are surveyed in these five estuaries. These programmes assess the health of representative ‘sentinel’ sites and provide baseline data, which can be used to track changes in the health of these sites over time. These sites were initially sampled annually (2008-2011) in order to determine the baseline conditions and the natural variability of the ecological communities. They are currently sampled every two years. In order to provide more spatial information about the sediment quality and ecological status of the northern Kaipara Harbour, Council undertook a survey of 44 intertidal sites throughout the harbour in 2014. This survey will provide baseline data to track changes in the health of the harbour over time. It will also complement the existing data from the two sentinel sites in the Arapaoa River (Griffiths 2013a) and previous surveys of the Whāngārei Harbour (Griffiths 2012) and Waitangi Estuary (Griffiths 2013b). The monitoring methods have been adapted from the Estuary Monitoring Protocol (Robertson et al. 2002), which was developed by Cawthron for use by regional councils, and involves sampling the physical and chemical properties of the sediment, and the ecological communities of representative intertidal habitats. The methods are similar to those used to monitor the ecological communities and sediment quality at Council’s existing sentinel sites in the Arapaoa River (Griffiths 2013a) and those used in Council’s previous surveys of the Whāngārei Harbour and Waitangi Estuary (Griffiths 2012 & Griffiths 2013b).
1.2 Study area 1.2.1 The harbour
The Kaipara Harbour is a drowned river valley system located on the west coast of the Northland peninsula. The harbour covers an area of approximately 743km2 and is the largest estuarine system in the southern hemisphere. The harbour is connected to the Pacific Ocean via an entrance 6km wide between Kaipara Head and Papakanui Spit. The northern portion of the harbour consists of four main arms: the Wairoa River arm, the Oruawharo River, the Otamatea River and the Arapaoa River, with numerous smaller creeks and rivers feeding into these arms. The southern Kaipara comprises a large basin with a number of creeks and rivers feeding into it.
1.2.2 The catchment
The northern portion of the catchment comprises 450,000ha. Catchment analysis using the land use classification from the New Zealand Land Cover Database LCDB2 (2001) indicated that in 2001, 62% (278,670ha) of the catchment was covered by high producing exotic grassland, 13% (57,142ha) with plantation forestry, and 15% (68,411ha) with indigenous forest (Figure 1 & Appendix 1).
Northland Regional Council Estuary Monitoring Programme: Kaipara Harbour 2014 2
Figure 1. Land use in the Kaipara Harbour catchment, from the New Zealand Land Cover Database (2001).
1.2.3 Sediment characteristics
Although no dedicated sediment survey has been conducted in the northern Kaipara, surficial sediment has been collected as part of a number of surveys. Inglis et al. (2010) analysed sediment from 16 sites in 2006 as part of a baseline survey of non-indigenous marine species for Biosecurity New Zealand and a number of other sites have been surveyed in the different arms of the harbour. Most of these surveys have focused on the Otamatea River (Robertson et al. 2002, Poynter 2014) with some information available from the Arapaoa River (Griffiths 2013). In addition, a habitat map of the Otamatea River was produced by Robertson et al. (2002), which shows sediment characteristics of the intertidal areas in this river. Inglis et al. (2010) reported that there was little variation in particle size between sites and that the sediment was strongly dominated by fine sand-sized particles, with the remainder of the particles mostly medium and very fine sand. Robertson et al. (2002) mapped the intertidal habitat of the Otamatea River and sampled three sites during the development of the Estuary Monitoring Programme. The sediment at the two uppermost sites contained high proportion of mud (~70%), while the lower site contained mostly sand (50%) with a lower proportion of mud (33%). Two of these sites K30 Otairi Creek and K40 Wahiwaka Creek have been resurveyed in the current study. The habitat map showed that the intertidal areas of the Otamatea River were dominated by unvegetated substrate, which was primarily very soft mud. More recently Poynter (2014) has sampled four sites in the Otamatea River from 2009-2014, as part of resource consent monitoring for a discharge from Fonterra’s Maungaturoto milk processing plant. The three upper most sites had high proportions of mud in all six years, while

Northland Regional Council Estuary Monitoring Programme: Kaipara Harbour 2014 3
the lower site (close to K39 Hanerau Stream in this survey) contained approximately equally proportions of mud, and sand. Results from Council’s two sentinel sites in the Arapaoa (K2 Te Kopua Point and K38 Whakapirau in this survey) showed that the proportions of different sediment grain sizes had remained relatively stable over the three years of sampling (2009-2011) (Griffiths 2013). Sediment collected from Te Kopua had a high proportion of mud (~40%) and fine sand (~57%) while sediments collected from Whakapirau consisted of approximately 65% fine sand, 25% mud and 10% medium sand in all three years. 1.2.4 Sediment nutrients Again no dedicated survey of sediment nutrients has been conducted but other surveys have also analysed sediment nutrient concentrations. In addition to the surveys discussed in the previous section Boffa Miskell also sampled 10 sites in the Otamatea River and two sites in the Oruawharo River (Boffa Miskell Ltd. 2000) as part of an investigation of the ecology of the Otamatea River and any effects arising from the discharge of process water from Kiwi Dairy’s processing plant at Maungaturoto. Inglis et al. (2010) analysed the organic content of sediments (loss on ignition) at 16 sites in the northern Kaipara Harbour. They reported that organic content was generally higher at upper harbour sites and lower in the outer harbour around the heads. The results ranged from 0.5% at Waionui Inlet to a maximum of 5.7% at Hargreaves Point. In the Otamatea River, Boffa Miskell (2000) reported that TOC ranged from 1.1 to 2.8g/100g and showed a general pattern of decreasing levels with distance down the estuary. Using an enrichment classification developed by Robertson and Stevens (2007) eight sites would have been classified as ‘enriched’ and two sites as ‘low to moderately enriched’ for TOC. Concentrations of total nitrogen ranged from 1400 to 2400mg/kg and were fairly uniform in the mid and upper estuary with the lowest values recorded at the two lowermost sites. Six sites would have been classified as ‘enriched’ and four sites as ‘low to moderately enriched’ using Robertson and Stevens’s classification for nitrogen. Total phosphorus showed a pattern of higher concentrations in the lower part of the estuary, with the exception of the lowermost site and values ranged from 363 to 533mg/kg. Seven sites would have been classified as ‘low to moderately enriched’ and three sites as ‘enriched’ using Robertson and Stevens’s classification for phosphorus. At the two sites in the Oruawharo River , the values were at levels which indicate the sites were ‘enriched’ for TOC and total nitrogen, and ‘low to moderately enriched’ for phosphorus. Robertson et al. (2002) reported that nitrogen concentrations at the three sites sampled in the Otamatea ranged from 1192 – 1942mg/kg and phosphorus concentrations ranged from 468 to 572mg/kg. All three sites would have been classified as ‘low to moderately enriched’ for nitrogen. One site (K40 Wahiwaka Creek in this survey) would have been classified as ‘low to moderately enriched’ for phosphorus and the other two sites as ‘enriched’ (one of these sites is K30 Otairi Creek in this survey). More recently Poynter (2014) has sampled four sites in the Otamatea River between 2009 and 2014. Levels at the three uppermost sites were generally higher than at the lower site for TOC, nitrogen and phosphorus. TOC at the three uppermost sites ranged from 1.4 – 2 g/100g and these sites would be classified as ‘low to moderately enriched’ using Robertson and Stevens’s classification, while the lower site would be classified as ‘good’. Concentrations of nitrogen at the three upper sites ranged from < 1300 to 2600mg/kg and from 700-1500 mg/kg at the lowest site between 2009 and 2014. Using Robertson and Stevens’s classification all four sites would have been classified as ‘low to moderately enriched’ for nitrogen in 2014.
Northland Regional Council Estuary Monitoring Programme: Kaipara Harbour 2014 4
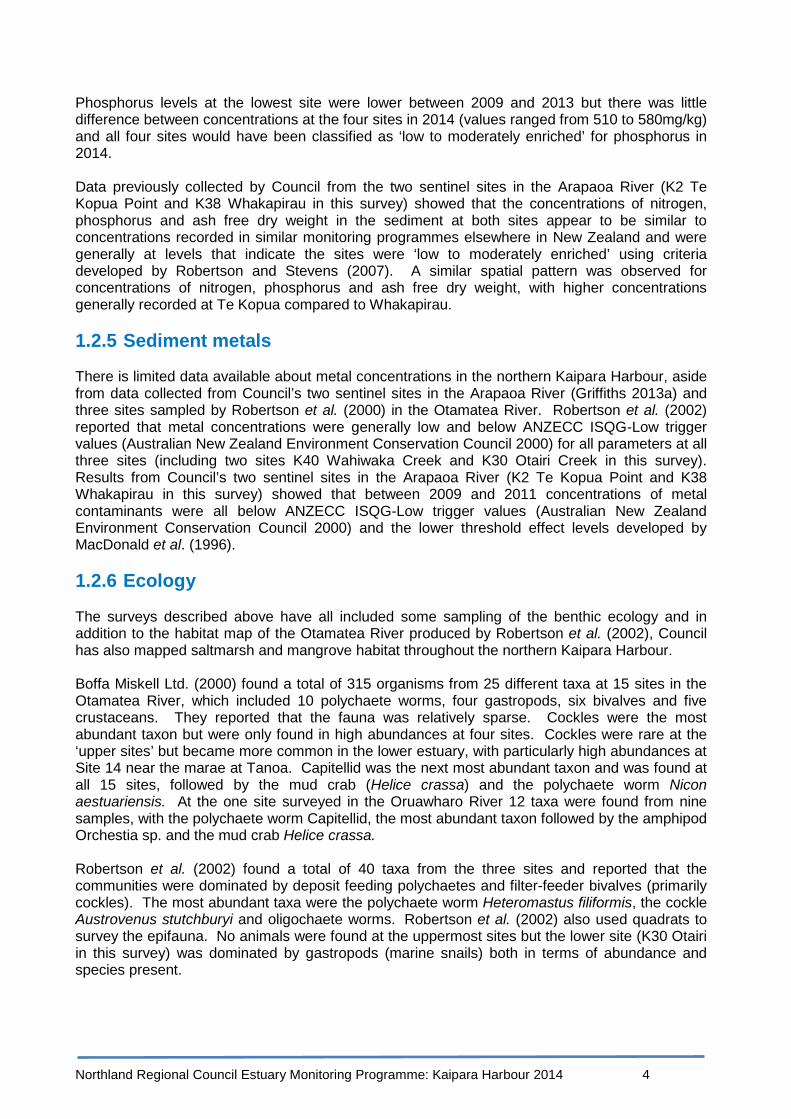
Phosphorus levels at the lowest site were lower between 2009 and 2013 but there was little difference between concentrations at the four sites in 2014 (values ranged from 510 to 580mg/kg) and all four sites would have been classified as ‘low to moderately enriched’ for phosphorus in 2014. Data previously collected by Council from the two sentinel sites in the Arapaoa River (K2 Te Kopua Point and K38 Whakapirau in this survey) showed that the concentrations of nitrogen, phosphorus and ash free dry weight in the sediment at both sites appear to be similar to concentrations recorded in similar monitoring programmes elsewhere in New Zealand and were generally at levels that indicate the sites were ‘low to moderately enriched’ using criteria developed by Robertson and Stevens (2007). A similar spatial pattern was observed for concentrations of nitrogen, phosphorus and ash free dry weight, with higher concentrations generally recorded at Te Kopua compared to Whakapirau. 1.2.5 Sediment metals There is limited data available about metal concentrations in the northern Kaipara Harbour, aside from data collected from Council’s two sentinel sites in the Arapaoa River (Griffiths 2013a) and three sites sampled by Robertson et al. (2000) in the Otamatea River. Robertson et al. (2002) reported that metal concentrations were generally low and below ANZECC ISQG-Low trigger values (Australian New Zealand Environment Conservation Council 2000) for all parameters at all three sites (including two sites K40 Wahiwaka Creek and K30 Otairi Creek in this survey). Results from Council’s two sentinel sites in the Arapaoa River (K2 Te Kopua Point and K38 Whakapirau in this survey) showed that between 2009 and 2011 concentrations of metal contaminants were all below ANZECC ISQG-Low trigger values (Australian New Zealand Environment Conservation Council 2000) and the lower threshold effect levels developed by MacDonald et al. (1996). 1.2.6 Ecology The surveys described above have all included some sampling of the benthic ecology and in addition to the habitat map of the Otamatea River produced by Robertson et al. (2002), Council has also mapped saltmarsh and mangrove habitat throughout the northern Kaipara Harbour. Boffa Miskell Ltd. (2000) found a total of 315 organisms from 25 different taxa at 15 sites in the Otamatea River, which included 10 polychaete worms, four gastropods, six bivalves and five crustaceans. They reported that the fauna was relatively sparse. Cockles were the most abundant taxon but were only found in high abundances at four sites. Cockles were rare at the ‘upper sites’ but became more common in the lower estuary, with particularly high abundances at Site 14 near the marae at Tanoa. Capitellid was the next most abundant taxon and was found at all 15 sites, followed by the mud crab (Helice crassa) and the polychaete worm Nicon aestuariensis. At the one site surveyed in the Oruawharo River 12 taxa were found from nine samples, with the polychaete worm Capitellid, the most abundant taxon followed by the amphipod Orchestia sp. and the mud crab Helice crassa. Robertson et al. (2002) found a total of 40 taxa from the three sites and reported that the communities were dominated by deposit feeding polychaetes and filter-feeder bivalves (primarily cockles). The most abundant taxa were the polychaete worm Heteromastus filiformis, the cockle Austrovenus stutchburyi and oligochaete worms. Robertson et al. (2002) also used quadrats to survey the epifauna. No animals were found at the uppermost sites but the lower site (K30 Otairi in this survey) was dominated by gastropods (marine snails) both in terms of abundance and species present.

Northland Regional Council Estuary Monitoring Programme: Kaipara Harbour 2014 5
More recently Poynter (2014) found 44 taxa at four sites in the Otamatea River. In 2014 Site 1 was dominated by oligochaete worms, the polychaete worm paranoid sp1 and the invasive bivalve Theora lubrica. Between 2009 and 2013 oligochaete worms, the polychaete worm paranoid sp1 and copepod sp. 1 were numerically dominant. At Site 2 oligochaete worms and the polychaete worm paranoid sp.1 were the most abundant taxa throughout the study period with copepod sp1 and the polychaete worms Boccardia (Paraboccardia) syrtis and Heteromastus filiformis also abundant. At Site 3 the polychaete worms Boccardia (Paraboccardia) syrtis, paranoid sp1, Heteromastus filiformis, oligochaete worms and the copepod sp1 were abundant throughout the study period. Site 4 was characterised by Paranoid sp1 and Paranoid sp2. The invasive bivalve Theora lubrica was also abundant. Data from Council’s two sentinel sites in the Arapaoa River (K2 Te Kopua Point and K38 Whakapirau in this survey) showed that the ecological communities at both these sites were dominated by the invasive bivalve Theora lubrica and polychaete worms (Griffiths 2013). At Te Kopua (K2 in the current study) the invasive bivalve Theora lubrica and the polychaete worms Paraonidae sp.#2 and Heteromastus filiformis were abundant while at Whakapirau (K38 in the current study) the invasive bivalve, Theora lubrica and the polychaete worms Paraonidae sp.#2 and Paraonidae sp.#1 were abundant. Council has mapped the extent of mangrove and saltmarsh habitats in the northern Kaipara Harbour. Saltmarsh and mangrove habitat were hand digitalised at a scale of 1:2000 using aerial images from both 1977 and 2002. In 2002 saltmarsh habitat covered 340.8 ha and mangrove forest covered 2386.1 ha.

Northland Regional Council Estuary Monitoring Programme: Kaipara Harbour 2014 6
2. Methods 2.1 Field methods The methods and techniques used in the current survey have been adapted from those outlined in the Estuarine Monitoring Protocol by Robertson et al. (2002) and are similar to those used in Council’s existing Estuary Monitoring Programme in the Kaipara Harbour (Griffiths 2013a) and recent surveys of the Whangarei Harbour (Griffiths 2012) and Waitangi Estuary (Griffiths 2013b).
2.1.1 Sampling sites
A total of 44 intertidal sites were sampled in the current survey. This included the two sentinel sites (K2 Te Kopua Point Bay and K38 Whakapirau) that are monitored in Council’s Estuary Monitoring Programme (Griffiths 2013) and two sites (K30 Otairi Creek and K40 Wahiwaka Creek) previously sampled by Robertson et al. (2002) during the development of the Estuary Monitoring Protocol. The remaining sample sites were selected in order to ensure a good geographical spread throughout the harbour. All the site co-ordinates were fixed with a GPS (Appendix 2). Field notes made at each site are presented in Appendix 3.
2.1.2 Timing of sampling
Sampling was conducted between 18 March and 4 April 2014.
2.1.3 Ecological sampling
The ecology was sampled using a perspex core (with a diameter of 150mm and 150mm deep). Three core samples were collected at each site, with replicates taken at 15m intervals along a 30m transect positioned parallel to the shoreline. All core samples were sieved through a 500µm mesh and the material retained in the sieve brought back to Council’s laboratory. All organisms retained were preserved with ethanol and stained with rose bengal. Sorting and identification of all organisms was conducted by the Cawthron Institute. One of the core samples from both K27 and K35 were compromised during processing and were therefore not included in the analysis. Fish (Osteicthyes) and insects (Insecta) identified from the samples were excluded from analysis as these animals are not marine benthic invertebrates and copepods, nematodes and ostracods were also excluded as these are considered meiofauna (J. Hewitt 2014. pers. Comm. 2/10). Individuals identified as belonging to the taxon categories ‘Nereididae (unidentified juveniles)’, ‘Gatropoda unidentified juveniles’, ‘Bivalves unidentified’, ‘Bivalves unidentified juveniles’, ‘Decapoda (interminable)’ and ‘Decapoda juvenile’ were not used in the calculations of biodiversity indices or multivariate analysis because these group are composites of several species and if they were included the adults would also need to be aggregated. This data was included in the calculations of ‘number of individuals’ and the ‘number of taxonomic groups’ at each site.
2.1.4 Sediment properties
One surface sediment sample of approximately 200 grams wet weight (consisting of the surface 2cm) was collected at each site. The sample was collected from the centre of the 30m transect within 1m of the central ecological core sample. Samples were stored on ice in zip lock bags. Sediment samples were analysed externally by Water Care Laboratory Services to determine ash free dry weight (AFDW), total nitrogen, total phosphorus, total cadmium, total chromium, total copper, total zinc, total nickel and total lead. Total organic carbon (TOC) was calculated from ash

Northland Regional Council Estuary Monitoring Programme: Kaipara Harbour 2014 7
Figure 2. Location of sampling sites in the northern Kaipara Harbour.

Northland Regional Council Estuary Monitoring Programme: Kaipara Harbour 2014 8
free dry-weight (AFDW) using the formula =0.4 x (AFDW) + 0.0025 x (AFDW)2 (Robertson et al. 2002). Sediment grain size was analysed by Waikato University with a laser diffraction particle analyser. The raw sediment data is presented in Appendix 4.
2.2 Data analysis The sediment metal results were assessed against ANZECC ISQG-Low trigger values (Australian New Zealand Environment Conservation Council 2000) and the threshold effect levels developed by MacDonald et al. (1996) (Table 1). ANZECC guidelines do not include trigger values for nutrients or TOC in marine sediments and there are currently no nationally accepted guideline values. Instead sediment TOC and nutrient concentrations were assessed against a classification developed by Robertson and Stevens (2007) (Table 2). Table 1. Sediment quality guidelines. All units are mg/kg.
MacDonald et al. (1996) ANZECC (2000)
TEL ISQG-Low ISQG-High
Copper 18.7 65 270 Lead 30.2 50 220 Zinc 124 200 410 Chromium 52.3 80 370 Nickel 15.9 21 52 Cadmium 0.68 1.5 10
Table 2. Sediment nutrient guidelines. Nitrogen and phosphorus units are mg/kg.
Good Low to moderately
enriched
enriched Very enriched
Nitrogen <500 500-2000 2000-4000 >4000 Phosphorus <200 200-500 500-1000 >1000 TOC <1% 1-2% 2-5% 5%
The ecological data was analysed using PRIMER v6.1.12 & PERMANOVA V1.0.2 (Plymouth Marine Laboratory, Plymouth, UK). Three measures of biological diversity were calculated: species richness (s); the total number of individuals (n); and the Shannon-Wiener diversity index for each core sample. Mean values were then calculated for each site. An expression of within-site variability was also calculated by determining the Bray-Curtis similarity between individual site replicates. The biodiversity scores are presented in Appendix 5. The species abundance data was also examined with cluster analysis and non-metric multidimensional scaling (MDS) using a Bray-Curtis similarity matrix. Cluster analysis and MDS ordination are visual displays of a species similarity matrix which can help to identify groups of samples. Samples close to each other on the MDS plot are more similar to each other. The mean species abundances from the three core samples were used for this analysis. A square root transformation was also performed on the species abundance data in order to downplay the influence of numerically dominant taxa (Clark & Warwick 2001). Cluster analysis was also used to examine the ecological data. An arbitrary similarity of 30% was used with the cluster analysis to separate sites into ‘groups’ containing similar ecological communities. Permanova, using permutations, was then performed to test for differences between the species assemblages of these groupings. Primer’s similarity percentage routine (SIMPER) (Clarke & Warwick 1994) was

Northland Regional Council Estuary Monitoring Programme: Kaipara Harbour 2014 9
then performed to examine which taxa contributed most to the similarity of the ecological communities of each ‘group’. Results of the SIMPER analysis are presented in Appendix 6. A system of ecological classification rules developed by Hewitt and Funnel (2005), in their survey of benthic habitats of the southern Kaipara was also used (Box 1), to allow for comparisons with their work. A distance-based linear model (DISTLM) was then used to model the relationship between the ecological data and physical and sediment chemical properties (McArdle & Anderson 2001). Prior to this analysis the sediment data was log10 transformed. Cadmium was not included in this analysis as all of the results were below laboratory detection limits. Box.1
1. Did the sites have densities of adult wedge shells (Macomona liliana), cockles (Austrovenus stutchburyi), or pipi (Paphies Australis), or some combination of these greater than 226 individuals per m2?
2. Did the sites have high diversity at a high taxonomic (order) level (e.g., amphipods, polychaetes, bivalves)? And if so, were there high numbers of large organisms, burrowing organisms, surface mobile bioturbators, tube builders or suspension feeders?
3. Were sites dominated by polychaetes? And if so, were they tube-builders, deposit feeders or large predators/scavengers?
4. Were the site dominated by bivalves? And if so, were they invasive, deposit feeders or suspension feeders?
5. If the sites were not dominated by either polychaetes or bivalves, were they dominated by large animals, surface bioturbators or sedentary epibenthic animals?
Northland Regional Council Estuary Monitoring Programme: Kaipara Harbour 2014 10
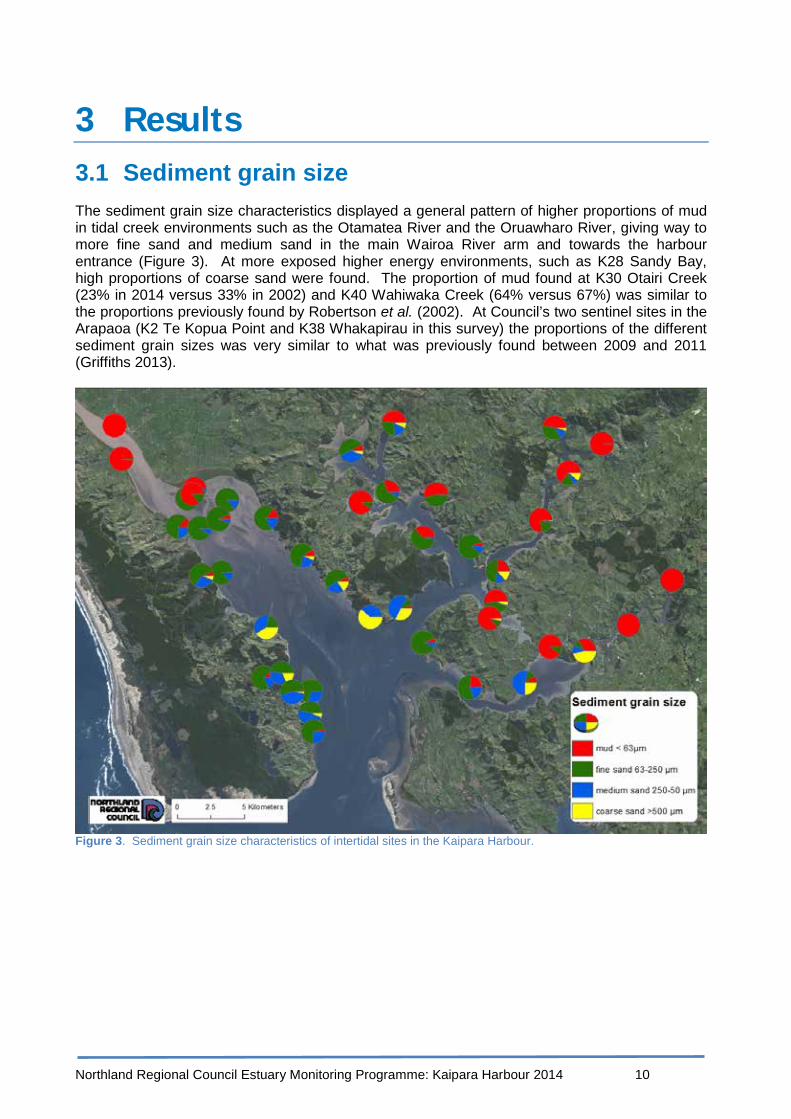
3 Results 3.1 Sediment grain size The sediment grain size characteristics displayed a general pattern of higher proportions of mud in tidal creek environments such as the Otamatea River and the Oruawharo River, giving way to more fine sand and medium sand in the main Wairoa River arm and towards the harbour entrance (Figure 3). At more exposed higher energy environments, such as K28 Sandy Bay, high proportions of coarse sand were found. The proportion of mud found at K30 Otairi Creek (23% in 2014 versus 33% in 2002) and K40 Wahiwaka Creek (64% versus 67%) was similar to the proportions previously found by Robertson et al. (2002). At Council’s two sentinel sites in the Arapaoa (K2 Te Kopua Point and K38 Whakapirau in this survey) the proportions of the different sediment grain sizes was very similar to what was previously found between 2009 and 2011 (Griffiths 2013).
Figure 3. Sediment grain size characteristics of intertidal sites in the Kaipara Harbour.

Northland Regional Council Estuary Monitoring Programme: Kaipara Harbour 2014 11
Figure 4. Firm sandy substrate at K38 Sandy Bay.
Figure 5. Soft mud at K41 Kaiwaka River.

Northland Regional Council Estuary Monitoring Programme: Kaipara Harbour 2014 12
3.2 Sediment TOC and nutrient concentrations 3.2.1 TOC
The highest concentrations of TOC were generally found in tidal creek environments in the upper reaches of the different arms of the harbour (Figure 6) with lower concentrations found in the main Wairoa River arm and towards the harbour entrance. The highest concentrations of TOC were found at K36 Matanginui (3.9%w/w), K10 Koareare Creek (3.8%w/w), K11 Topuni River (3.71%w/w) and K37 Ruawai (3.6%w/w). The lowest values were recorded at K28 Sandy Bay (0.2%w/w) and K19 Tauhara Creek (0.2%w/w). The ANZECC guidelines do not include trigger values for TOC in marine sediments and there are currently no nationally accepted guideline values. Using a classification system developed by Robertson and Stevens (2007), 16 sites were classified as ‘very good’, 15 sites were ‘low to moderately enriched’ and 13 sites were ‘enriched’ for TOC (Figure 6).
Figure 6. Total organic carbon (TOC %) concentrations in the Kaipara Harbour 2014.
Northland Regional Council Estuary Monitoring Programme: Kaipara Harbour 2014 13
3.2.2 Total nitrogen
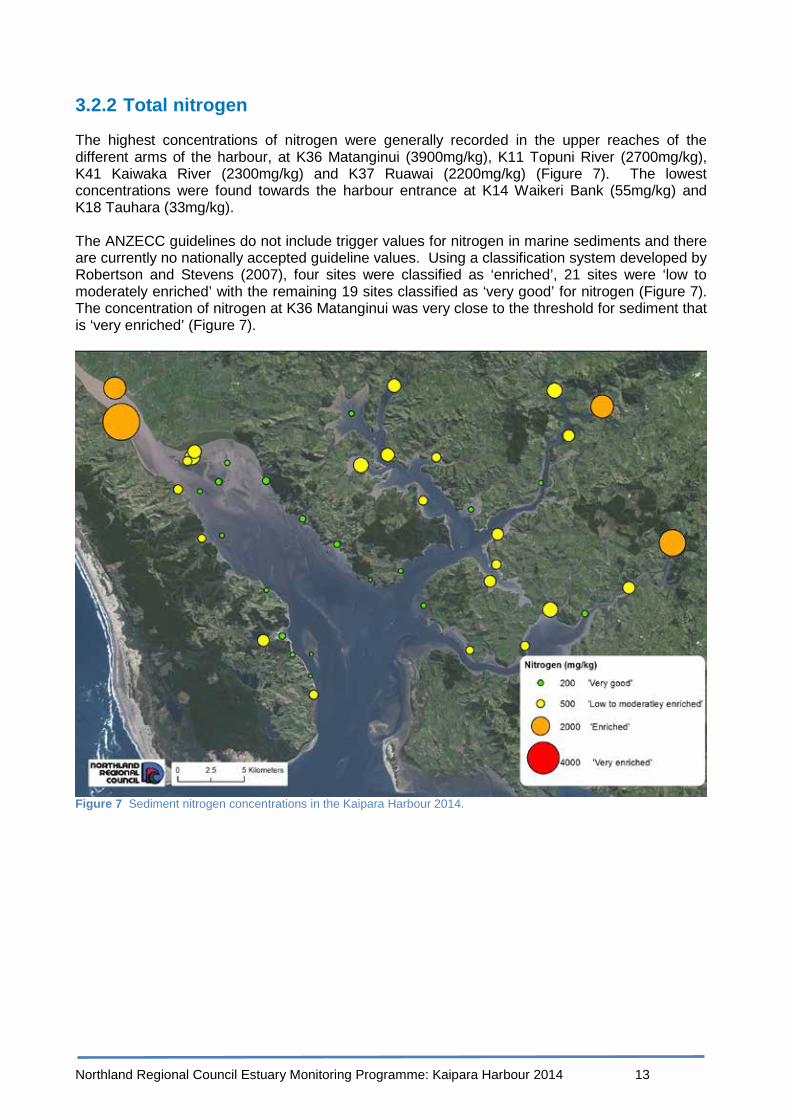
The highest concentrations of nitrogen were generally recorded in the upper reaches of the different arms of the harbour, at K36 Matanginui (3900mg/kg), K11 Topuni River (2700mg/kg), K41 Kaiwaka River (2300mg/kg) and K37 Ruawai (2200mg/kg) (Figure 7). The lowest concentrations were found towards the harbour entrance at K14 Waikeri Bank (55mg/kg) and K18 Tauhara (33mg/kg). The ANZECC guidelines do not include trigger values for nitrogen in marine sediments and there are currently no nationally accepted guideline values. Using a classification system developed by Robertson and Stevens (2007), four sites were classified as ‘enriched’, 21 sites were ‘low to moderately enriched’ with the remaining 19 sites classified as ‘very good’ for nitrogen (Figure 7). The concentration of nitrogen at K36 Matanginui was very close to the threshold for sediment that is ‘very enriched’ (Figure 7).
Figure 7 Sediment nitrogen concentrations in the Kaipara Harbour 2014.

Northland Regional Council Estuary Monitoring Programme: Kaipara Harbour 2014 14
3.2.3 Total phosphorus
The highest concentration of phosphorus was recorded at K11 Topuni River (700mg/kg) with high concentrations generally found in tidal creek environments in the upper reaches of the different arms of the harbour (Figure 8). One exception to this was the relatively high concentration recorded at K13 Te Kiakia Bay on the Tinopai peninsula in the main Wairoa arm of the harbour. The lowest concentrations were generally found along the Pouto peninsula in the main Wairoa arm of the harbour (Figure 8), with the lowest concentrations recorded at K18 Tauhara (27mg/kg) and K17 Waikeri Creek (41mg/kg). The ANZECC guidelines do not include trigger values for phosphorus in marine sediments and there are currently no nationally accepted guideline values but using a classification system developed by Robertson and Stevens (2007) 15 sites were classified as ‘very good’, 19 as ‘low to moderately enriched’ and 10 as ‘enriched’ for phosphorus (Figure 8).
Figure 8. Sediment phosphorus concentrations in the Kaipara Harbour 2014.

Northland Regional Council Estuary Monitoring Programme: Kaipara Harbour 2014 15
3.2.4 Comparison with previous nutrient concentrations in the Kaipara Harbour
Nutrient concentrations have previously been measured at four of the sites sampled in the current study. K38 Whakapirau and K2 Te Kopua Point were last surveyed by council in 2011 and K30 Otairi Creek and K40 Wahiwaka Creek were previously surveyed by Robertson et al. (2002). Nutrient concentrations in the current survey were generally lower than levels previously recorded at these four sites (Table 3). The exceptions to this were increases in total nitrogen and AFDW at K38 Whakapirau. There was also a small increase in nitrogen at K2 Te Kopua Point. Table 3. Concentrations of nutrients and AFDW at four sites previously surveyed. Previous survey results in brackets.
K38 Whakapirau K2 Te Kopua Point
K 30 Otairi Creek K40 Wahiwaka Creek
n 1 (5) 1 (5) 1 (10) 1 ( 10) AFDW 4.2 (3.2) 2.9 (4.2) 22 (4.5) 5.5 (5.9) Nitrogen 1200 (506) 620 (537) 1000 (1192) 930 (1942) Phosphorus 270 (334) 370 (372) 530 (572) 400 (537)
3.2.5 Comparison of nutrient concentrations in Northland estuaries
The mean nitrogen concentration in the northern Kaipara Harbour was higher than most values previously reported in sediment surveys of estuaries in Northland (Table 4). Higher mean nitrogen values were only found in the Bay of Islands and Hokianga Harbour. The nitrogen concentration recorded at K36 Matanginui, in the upper Wairoa arm, was also particularly high in comparison to other sites monitored by Council. In recent surveys conducted by Council higher concentrations of nitrogen have only been recorded at Limeburners Creek in Whāngārei Harbour (Griffiths 2013), Orira River in the Hokianga Harbour (Northland Regional Council 2013) and at WAT 8 in the Waitangi Estuary (Griffiths 2013). The mean phosphorus and TOC levels recorded in the northern Kaipara Harbour were towards the middle of the range of values reported at other estuaries surveyed recently by Council (Table 4). Table 4. Mean sediment nutrient concentrations in Northland estuaries with range presented in brackets.
Year Number of samples
Nitrogen (mg/kg)
Phosphorus (mg/kg)
TOC (%w/w)
Kaipara Harbour 2014 44 804 (33 – 3900) 313 (27 – 700) 1.53 (0.2 -3.9) Waitangi 2013 10 803 (220 – 2600) 647 (410 – 850) 2.6 (1.0 – 4.2) Pārengarenga North 2013 12 263 (62-1300) 102 (28-180) 0.92 (0.3 - 2.5) Pārengarenga South 2013 10 218 (25-500) 60 (18-200) 0.43 (0.1 – 1.0) Houhora 2013 6 688 (270 – 1100) 129 (52 – 220) 1.26 (0.6 - 1.9) Rangaunu 2013 10 318 (64-920) 122 (24 -360) 0.76 (0.2 -2.2) Taipā/Mangonui 2013 6 354 (59 – 990) 490 (280 – 710) 1.9 (1.2 – 2.5) Whangaroa 2013 7 800 (130 – 1600) 518 (390 – 710) 3.3 (1.3 - 6.0) Hokianga 2013 11 1102 (43-2700) 512 (54 -800) 3.26 (0.2 - 5.2) Bay of Islands 2012 16 914 (260 – 1600) 654 370 – 1000) 2.4 (1.0 – 4.8) Whāngārei 2012 42 691 (14 – 4900) 341 (50 – 1200) 1.5 (0.2 – 6.0)

Northland Regional Council Estuary Monitoring Programme: Kaipara Harbour 2014 16
3.3 Sediment metal concentrations 3.3.1 Cadmium
All of the cadmium concentrations were below the laboratory detection limit (<0.09mg/kg) and therefore both the ANZECC ISQG-Low effect trigger value of 1.5mg/kg and the threshold effect level of 0.68mg/kg developed by MacDonald et al. (1996) (Figure 9).
Figure 9. Sediment cadmium concentrations in the Kaipara Harbour, 2014.

Northland Regional Council Estuary Monitoring Programme: Kaipara Harbour 2014 17
3.3.2 Chromium
The highest concentrations of chromium were recorded in the Wairoa arm of the harbour at K36 Matanginui, (24mg/kg), K37 Ruawai (22mg/kg) and K38 Burgess Island (21mg/kg) (Figure 10). The lowest concentration was recorded at K28 Sandy Beach (0.73mg/kg). All of the chromium concentrations were below the ANZECC ISQG-Low effect trigger value of 80mg/kg and the threshold effect level of 52.3mg/kg developed by MacDonald et al. (1996) (Figure 10).
Figure 10. Sediment chromium concentrations in the Kaipara Harbour, 2014.

Northland Regional Council Estuary Monitoring Programme: Kaipara Harbour 2014 18
3.3.3 Copper
The highest concentration of copper was recorded at K34 Burgess Island Inner (45mg/kg), which was more than double the concentration at the next highest site K41 Kaiwaka River (21mg/kg). The copper concentrations at these two sites exceeded the threshold effect level of 18.7mg/kg developed by MacDonald et al. (1996) (Figure 11), but were below the ANZECC ISQG-Low effect trigger value of 65mg/kg. All of the other copper concentrations measured were below the threshold effect level. The lowest concentrations were recorded along the shoreline of the Pouto peninsula in the main Wairoa arm of the harbour and three sites along the peninsula had concentrations below the laboratory detection limit (<0.45mg/kg) (Figure 11).
Figure 11. Sediment copper concentrations in the Kaipara Harbour, 2014.

Northland Regional Council Estuary Monitoring Programme: Kaipara Harbour 2014 19
3.3.4 Nickel
The highest concentration of nickel was recorded at K34 Burgess Island Inner (26mg/kg), which was more than double the concentration at the next highest site and exceeded the ANZECC ISQG-Low effect trigger value of 21mg/kg. No other sites exceeded the ANZECC ISQG-Low effect trigger or the threshold effect level of 15.9mg/kg developed by MacDonald et al. (1996). The lowest concentrations were again found along the Pouto shoreline of the main Wairoa River arm of the harbour (Figure 12). One site (K17 Waikeri Creek) along the peninsula had a nickel concentration below the laboratory detection limit (<0.45mg/kg).
Figure 12. Sediment nickel concentrations in the Kaipara Harbour, 2014
Northland Regional Council Estuary Monitoring Programme: Kaipara Harbour 2014 20
3.3.5 Lead
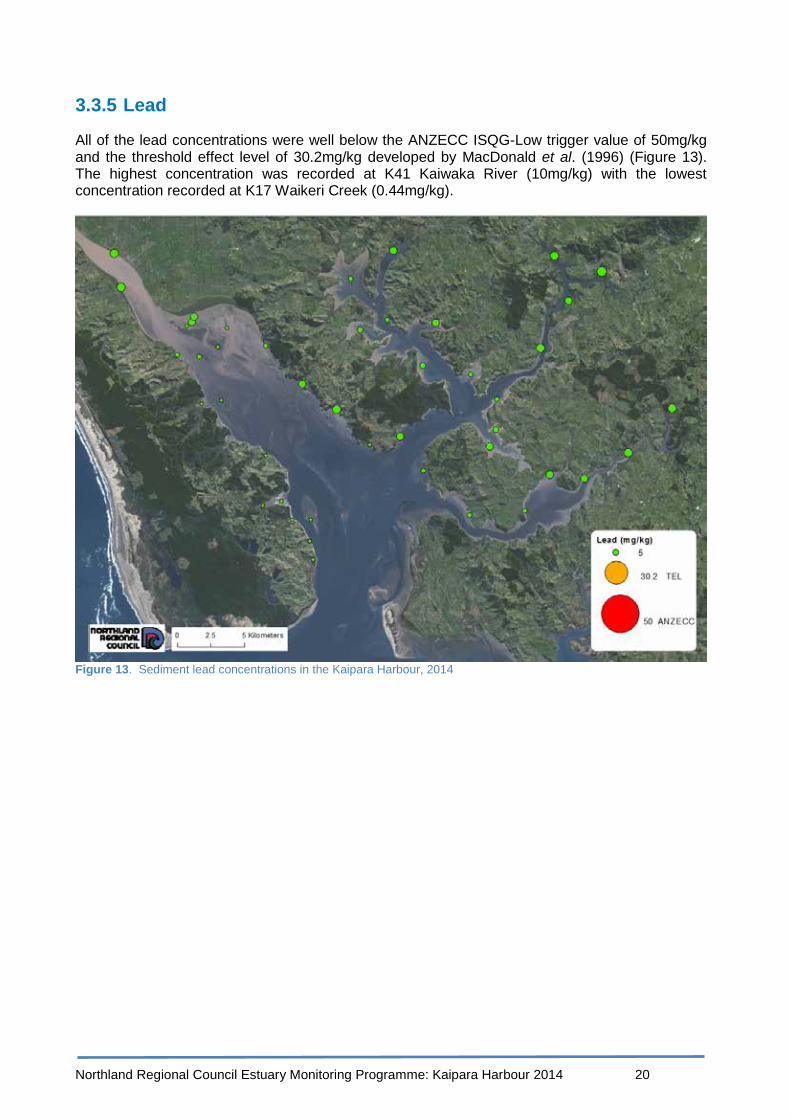
All of the lead concentrations were well below the ANZECC ISQG-Low trigger value of 50mg/kg and the threshold effect level of 30.2mg/kg developed by MacDonald et al. (1996) (Figure 13). The highest concentration was recorded at K41 Kaiwaka River (10mg/kg) with the lowest concentration recorded at K17 Waikeri Creek (0.44mg/kg).
Figure 13. Sediment lead concentrations in the Kaipara Harbour, 2014

Northland Regional Council Estuary Monitoring Programme: Kaipara Harbour 2014 21
3.3.6 Zinc
All of the zinc concentrations were well below the ANZECC ISQG-Low trigger value of 200mg/kg and the threshold effect level of 124mg/kg developed by MacDonald et al. (1996). The highest concentrations were generally found in upper estuarine or tidal creek locations with the highest concentration recorded at K36 Matanginui (62mg/kg) in the upper Wairoa arm. The lowest concentrations were recorded along the shoreline of the Pouto peninsula in the main Wairoa arm of the harbour and three sites along this peninsula (K16 Pareotaunga Point, K17 Waikeri Creek and K23 Kotiroreka Bay) had concentrations below the laboratory detection limit (<6.8 mg/kg) (Figure 11).
Figure 14. Sediment zinc concentrations in the Kaipara Harbour, 2014

Northland Regional Council Estuary Monitoring Programme: Kaipara Harbour 2014 22
3.3.7 Comparison with previous metal concentrations recorded in the Kaipara Harbour
Metal concentrations have previously been measured at four of the sites sampled in the current study. K38 Whakapirau and K2 Te Kopua Point were last surveyed by Council in 2011 and K30 Otairi Creek and K40 Wahiwaka Creek were previously surveyed by Robertson et al. (2002. Metal concentrations in the current study were all lower than levels previously recorded at these four sites (Table 5). Table 5. Concentrations of metals at four sites previously surveyed. Previous survey results in brackets.
K2 Te Kopua Point Bay
K38 Whakapirau K30 Otairi Creek K40 Wahiwaka Creek
n 1 (5) 1 (5) 1 (10) 1 (10) Mud 23.4 (49.6) Cadmium <0.09 (<0.09) <0.09 (<0.09) <0.09 (1.0) <0.09 (0.1) Chromium 9.7 (11.2) 6.7 (10.3) 4.5 (18.6) 6.7(22.4) Copper 6.6 (8.1) 5.6 (7.4) 6.3 (9.0) 9.2 (16.3) Nickel 5.8 (6.8) 4.7 (6.5) 6.3 (7.9) 5.8 (11.0) Lead 2.3 (5.6) 4.0 (5.0) 3.2 (14.8) 5.7 (10.4) Zinc 21 (36) 25 (37) 22 (43) 35 (62)
3.3.8 Comparison of metal concentrations in Northland estuaries
The mean metal concentrations recorded in this survey of the northern Kaipara Harbour were generally lower than those measured in recent sediment surveys conducted by Council in the Waitangi Estuary (2013), Bay of Islands and Whāngārei Harbour (both 2012) (Table 6). Table 6. Mean metal concentrations recorded in Northland estuaries with range in brackets.
Kaipara (2014)
Waitangi (2013)
Bay of Islands (2012)
Whāngārei (2012)
Number of samples 44 10 16 41 Cadmium NA (<0.09) NA (<0.09 – 0.13) NA (< 0.09 – 0.09) NA (<0.09 – 0.16) Chromium 9 (0.7 – 24) 13 (5 -17) 19 (8 – 42) 12 (2 – 57) Copper 7 (<0.45 – 45) 11 (4 – 17) 9 (2 – 17) 10 (<0.05 – 79) Nickel 6 (<0.45 – 26) 8 (5 – 10) Not recorded 6 (1 – 30) Lead 4 (0.4 – 10) 8 (4 – 10) 10 (4 – 17) 8 (0.5 – 51) Zinc 29 (<6.8 – 62) 56 (33 – 84) 49 (17 – 71) 44 (<7.5 – 160)

Northland Regional Council Estuary Monitoring Programme: Kaipara Harbour 2014 23
3.4 Ecology The intertidal habitats surveyed were reasonably varied, including sheltered muddy tidal creek environments, exposed sand flats, sand banks and exposed sandy beaches. One oyster reef (K35 Burgess Island Oyster reef) was also sampled. No shell banks, seagrass beds or stone/pebble shorelines were sampled.
3.4.1 Biodiversity
A total of 108 taxa were identified from the 44 sites. The total number of taxa varied from just two at K19 Tauhara Creek to 39 at K26 Frenchman’s Bay (Figure 15). With the exception of K18 Tauhara and K19 Tauhara Creek generally fewer taxa were found at sites in the upper reaches of the different arms of the harbour with more taxa found in the main Wairoa River arm of the harbour (Figure 15). Higher numbers of taxonomic groups were also generally found in the main Wairoa River arm of the harbour with fewer taxonomic groups found at sites in the Otamatea River, Arapaoa River and the Whakaki River (Figure 17). Again K18 Tauhara and K19 Tauhara Creek stood out with just two taxonomic groups represented at both of these sites. The total number of individuals at K18 Tauhara and K19 Tauhara Creek was also low with just 13 and seven individuals at these sites (Figure 16). The highest Shannon-Wiener diversity scores were generally recorded in the main Wairoa arm of the harbour although high scores were also found at K3O Otairi, K26 Frenchmans and K8 Oruawharo River. The lowest Shannon-Wiener diversity scores were generally found in tidal creek environments in the upper reaches of the different arms of the harbour.

Northland Regional Council Estuary Monitoring Programme: Kaipara Harbour 2014 24
Figure 15. The total number of taxa.
Figure 16. The total number of individuals.

Northland Regional Council Estuary Monitoring Programme: Kaipara Harbour 2014 25
Figure 17. Taxonomic groups.
Figure 18. Shannon-Wiener diversity.

Northland Regional Council Estuary Monitoring Programme: Kaipara Harbour 2014 26
3.4.2 Multivariate analysis of intertidal ecological data
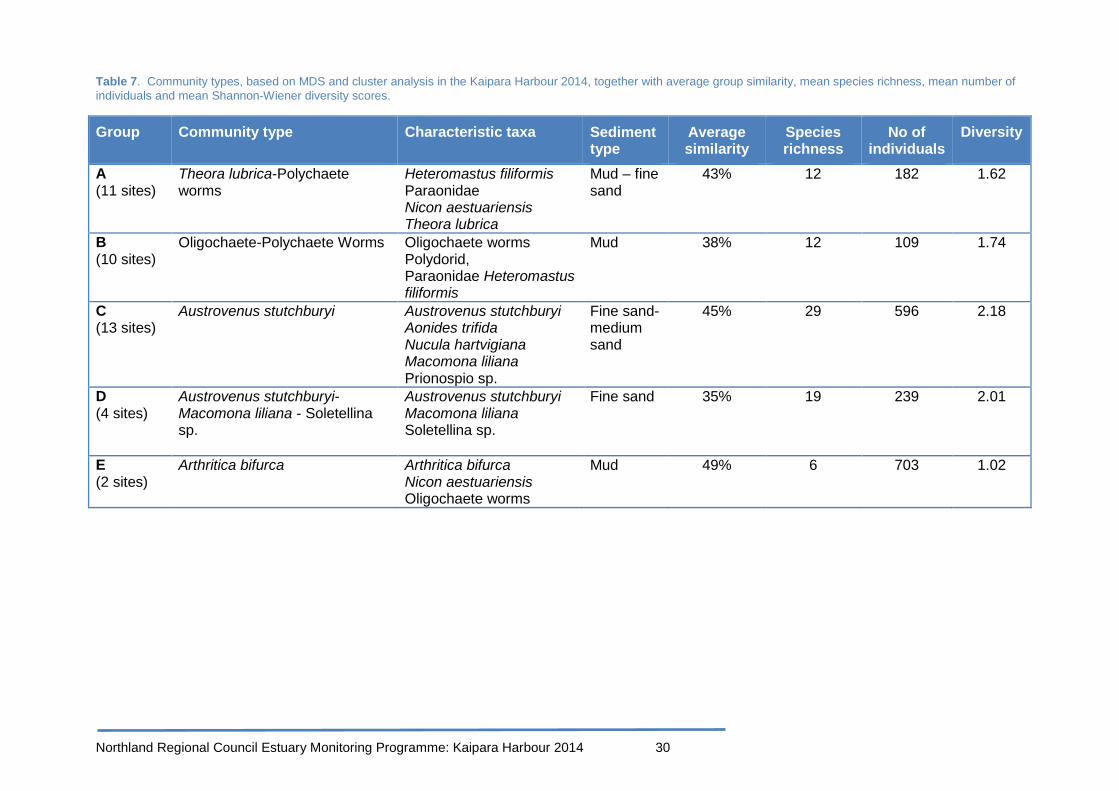
Cluster analysis and MDS ordination of the ecological data showed that the intertidal sites could be separated into four main groups with a fifth group containing just two sites (Figure 21 & 22). Four sites were not included in any of these five groups. The first group (Group A) included sites found on sheltered mud flats in the different estuarine arms of the harbour (Figure 23). Sites in Group A were characterised by the polychaete worms Heteromastus filiformis, Paraonidae and Nicon aestuariensis, and the invasive bivalve Theora lubrica (Table 7). The low abundance of oligochaete worms, large bivalves (such as cockles, pipis and wedge shells), gastropods and crustaceans was also a feature of sites in this group. The species richness, the number of individuals and the Shannon-Wiener diversity scores of sites in Group A were all lower than Groups C and D (Table 7). A second group (Group B) comprised sites found in the upper reaches of the different arms of the harbour, which had high proportions of mud. Sites in Group B were characterised by oligochaete worms and the polychaete worms Polydorid, Paraonidae and Heteromastus filiformis. The low abundance of large bivalves (cockles, pipis and wedge shells) and gastropods was also a feature of sites in this group. The species richness, the number of individuals and the Shannon-Wiener diversity scores of sites in Group B were all lower than Groups C and D (Table 7). A third group (Group C) included sites found on more sandy habitats in the main Wairoa arm of the harbour. These sites were dominated by the cockle Austrovenus stutchburyi and the polychaete worm Aonides trifida, with the nut shell Nucula hartvigiana, the wedge shell Macomona liliana and the polychaete Prionospio sp. also characteristic of these sites. Sites in Group C had high species richness, high numbers of individuals and high Shannon-Wiener diversity scores (Table 7). The fourth group (Group D) comprised four sites located on exposed sand flats and sand banks in the main Wairoa arm of the harbour. These sites were dominated by the bivalves Soletellina sp., the wedge shell Macomona liliana and the cockle Austrovenus stutchburyi. Sites in Group D also had high species richness, high numbers of individuals and higher Shannon-Wiener diversity scores (Table 7). A fifth group (Group E) comprised just two sites K10 Koareare Creek and K11 Topuni River located in the upper reaches of the Oruawharo River. These sites were both located on narrow mud flats close to fringing mangrove forest and field notes described the sediment at both sites as soft mud. Sediment grain size analysis found that both these sites consisted of 100% mud. These sites were characterised by the small bivalve Arthritica bifurca, the polychaete worm Nicon aestuariensis and oligochaete worms. All the groups identified from the cluster and MDS analyses had similarity of at least 35% and were more than 83% dissimilar to each other, with most more than 90% dissimilar. The lowest dissimilarity was found between Group A and Group B, and between Group C and Group D. Four sites were not included in these five groups: K18 Tauhara, K19 Tauhara Creek, K28 Sandy Beach, and K27 Moturoa Island. K18 Tauhara (Group F) is a steep sandy beach on the Pouto peninsula (Figure 19). Field notes described the sediment at this site as golden sand with sand ripples. Only 13 individuals belonging to just three taxa were found at this site: the polychaete worms Glyceridae and Prionospio aucklandica, and the amphipod Lysianassidae. K19 Tauhara Creek (Group G) was located in Tauhara Creek, a small sheltered estuary on the Pouto peninsula. Field notes described the sediment at this site as soft ‘spongy’ sand. Just

Northland Regional Council Estuary Monitoring Programme: Kaipara Harbour 2014 27
seven individuals belonging to two taxa were found at this site: the polychaete worm Scolecolepides benhami and the crab Brachyura sp.
Figure 19. K18 Tauhara. Figure 20. K28 Sandy Beach.
K28 Sandy Beach (Group H) was located on a relatively steep sandy beach on the south western tip of the Tinopai peninsula (Figure 20). Field notes described the sediment as firm sand. Eight taxa were found, with the isopod Natatolana pellucida numerically dominant. The pipi was also relatively abundant. K27 Moturoa Island (Group I) was located on expansive intertidal flats on the western shore of the Puketotara peninsula. Field notes described the sediment as firm mud. Only two cores were analysed at this site because one core sample was compromised. Nineteen taxa were identified in the two cores but most taxa were found in low numbers. Only four of the taxa were in both core samples. The most abundant taxon was the invasive Asian date mussel (Musculista senhousia) (273 individuals), but almost all individuals (272) were found in just one core.

Northland Regional Council Estuary Monitoring Programme: Kaipara Harbour 2014 28
Figure 21. Group average linkage cluster of Bray-Curtis similarities from square root transformed abundance data collected from Kaipara harbour 2014

Northland Regional Council Estuary Monitoring Programme: Kaipara Harbour 2014 29
Figure 22. Non-metric MDS ordination of Bray-Curtis similarities from square root transformed abundance data collected from the Kaipara Harbour in 2014. Sites closest together are more similar.
Figure 23. Ecological community groupings of intertidal sites based on cluster and MDS analysis of abundance data from the Kaipara Harbour in 2014
Northland Regional Council Estuary Monitoring Programme: Kaipara Harbour 2014 30
Table 7. Community types, based on MDS and cluster analysis in the Kaipara Harbour 2014, together with average group similarity, mean species richness, mean number of individuals and mean Shannon-Wiener diversity scores.
Group Community type Characteristic taxa Sediment type
Average similarity
Species richness
No of individuals
Diversity
A (11 sites)
Theora lubrica-Polychaete worms
Heteromastus filiformis Paraonidae Nicon aestuariensis Theora lubrica
Mud – fine sand
43% 12 182 1.62
B (10 sites)
Oligochaete-Polychaete Worms
Oligochaete worms Polydorid, Paraonidae Heteromastus filiformis
Mud 38% 12 109 1.74
C (13 sites)
Austrovenus stutchburyi
Austrovenus stutchburyi Aonides trifida Nucula hartvigiana Macomona liliana Prionospio sp.
Fine sand- medium sand
45% 29 596 2.18
D (4 sites)
Austrovenus stutchburyi-Macomona liliana - Soletellina sp.
Austrovenus stutchburyi Macomona liliana Soletellina sp.
Fine sand 35% 19 239 2.01
E (2 sites)
Arthritica bifurca
Arthritica bifurca Nicon aestuariensis Oligochaete worms
Mud 49% 6 703 1.02

Northland Regional Council Estuary Monitoring Programme: Kaipara Harbour 2014 31
A system of ecological classification rules developed by Hewitt and Funnell (2005), in their survey of benthic habitats of the southern Kaipara, was also used to identify ecological communities to allow for comparisons with their survey of the southern Kaipara. Using this classification system 13 community types were identified (Table 8 & Figure 24). Most sites belonged to just two community types: a Polychaete–Deposit feeder community type, and an Austrovenus community type. Sites belonging to the Polychaete-Deposit feeder community type were generally located on sheltered mud flats in the different arms of the harbour, while sites belonging to the Austrovenus community type tended to be located on more exposed sand flats (Figure 24). An Austrovenus/Macomona community and an Oligochaete community contained three sites each and a Surface bioturbators group contained two sites. The remaining eight communities types identified contained just one site each. The average similarities of the Polychaete–Deposit feeder and the Austrovenus community types were relatively low (27% and 32% respectively) (Table 8) and the dissimilarity between the community types tended to be lower than the dissimilarity between groups identified by cluster and MDS analysis. In particular low dissimilarity was found between: the different types of Bivalve communities; the Polychaete–Tube builders and High Diversity–Tube builders communities; and between the Bivalve–Deposit feeder and Surface Bioturbators communities.
Figure 24. Ecological community types in the Kaipara Harbour 2014, based on Hewitt and Funnell’s (2005) ecological classification rules

Northland Regional Council Estuary Monitoring Programme: Kaipara Harbour 2014 32
Table 8. Community types the Kaipara Harbour 2014, based on Hewitt and Funnell’s (2005) ecological classification rules, together with average group similarity, mean species richness, mean number of individuals and mean Shannon-Wiener diversity.
Community type Characteristic taxa Sediment type
Average similarity
Species richness
No of individuals
Diversity Bray Curtis
Polychaete – deposit feeder (16 sites)
Heteromastus filiformis Aricidea sp. Paraonidae Theora lubrica
Mud-fine sand 27% 13 157 1.75 52
Polychaete – deposit feeder (Impoverished) (2 sites)
No characteristic taxa (Low richness and abundance)
Fine sand-medium sand
0% 3 10 0.65 23
Polychaete – Tube builders (1 site)
Polydorid Paraonidae
Fine sand Less than 2 sites
13 295 1.56 46
Austrovenus (11 sites)
Austrovenus stutchburyi Aonides trifida
Fine sand-medium sand
32% 28 609 2.01 66
Austrovenus/Macomona (3 sites)
Austrovenus stutchburyi Aricidea sp. Macomona liliana
Fine sand 37% 26 295 2.48 63
Austrovenus/Paphies (1 site)
Aonides trifida Austrovenus stutchburyi Prionospio aucklandica
Coarse sand–medium sand
Less than 2 sites
27 845 2.35 68
Bivalve - Suspension feeders (1 site)
Soletellina sp. Macomona Liliana Austrovenus stutchburyi
Fine sand Less than 2 sites
13 126 1.85 57
Bivalve - Deposit feeders (1 site)
Arthritica bifurca Oligochaeta
Mud Less than 2 sites
7 522 1.02 70
Bivalve invasive (1 site)
Musculista senhousia Fine sand Less than 2 sites
17 298 0.49 1
Oligochaete (3 sites)
Oligochaeta Heteromastus filiformis
Mud 54% 10 72 1.46 29
Surface bioturbators (2 sites)
Potamopyrgus estuarinus Helice crassa
Mud 7% 7 481 1.42 32
Isopod (1 site)
Natatolana pellucida Paphies australis
Coarse sand-medium sand
Less than 2 sites
8 123 0.92 29
High diversity - Tube builders (1 site)
Polydorid Fine sand Less than 2 sites
20 162 2.12 44

Northland Regional Council Estuary Monitoring Programme: Kaipara Harbour 2014 33
3.4.3 Shellfish
Cockles
Cockles (Austrovenus stutchburyi) were found at 22 of the 44 sites sampled (Figure 25) with adult cockles (>16mm) found at all of these 22 sites. Cockles were mainly located at sites with firm sandy substrate in the Wairoa arm of the harbour and very few cockles were found at sites located in muddy tidal creek environments (Figure 25). No cockles were found at any of the seven sites in the Arapaoa River or in the upper reaches of the Otamatea River and Oruawharo River. The highest abundances were generally found along the shoreline of the Pouto peninsula in the Wairoa arm of the harbour, with the highest density found at K17 Waikeri Creek (4018m2). A very high density was also recorded at K26 Frenchmans Bay (3263m2), near the entrance of the Oruawharo River (Figure 25). Eleven sites had densities greater than 1000 per m2 with particularly high densities found at K16 Pareotaunga Point (2974m2), K15 Okaro Creek (2943m2), K23 Kotiroreka Bay (2924m2), K33 Subritzky Channel (2867m2) and K24 Tangitiki Bay (2509m2).
Figure 25. Density of cockles in cores collected in the Kaipara Harbour in 2014.

Northland Regional Council Estuary Monitoring Programme: Kaipara Harbour 2014 34
Pipi
Pipi (Paphies australis) were found at 14 sites but adult pipi (>30mm) were only found at seven of the 14 sites (K7, K16, K17, K23, K24, K28 and K29). Pipi were mostly found at sites with firm sandy substrate along the shoreline of the Tinopai and Pouto peninsulas in the Wairoa arm of the harbour (Figure 26). No pipi were found in the Arapaoa River or the Whakaki River and although pipi were found at K41 Kaiwaka River in the upper reaches of the Otamatea River and at K39 Hanerau Stream in the Oruawharo River, just one pipi was found at each of these sites and these were both juveniles (<6mm). The highest density was recorded at K29 Komiti Beach at Tinopai, (3565m2) with high densities also found at K17 Waikeri Creek (1019m2) and K23 Kotiroreka Bay (604m2).
Figure 26. Density of pipi in cores collected in the Kaipara Harbour in 2014.

Northland Regional Council Estuary Monitoring Programme: Kaipara Harbour 2014 35
Wedge shells
Wedge shells were at 20 sites with adults (>20mm) found at 13 of these sites. Wedge shells were mostly found on firm sandy substrate in the Wairoa arm of the harbour. The highest density was found at K33 Subritzky Channel (2867m2) (Figure 27). Lower densities were found at sites in Arapaoa River, Otamatea River and Oruawharo River.
Figure 27. Density of wedge shells in cores collected in the Kaipara Harbour in 2014.

Northland Regional Council Estuary Monitoring Programme: Kaipara Harbour 2014 36
3.4.4 Non-indigenous species
Three non-indigenous species were identified in this survey: Theora lubrica, the Asian date mussel (Musculista senhousia) and the pacific oyster (Crassostrea gigas).
Theora lubrica
The small invasive bivalve Theora lubrica was the most widespread non-indigenous species found and was identified at 18 of the 44 sites (Figure 28). The highest densities were found in the Arapaoa River at K3 Whakapirau Creek and K2 Te Kopua Point Bay and it was found at all seven sites in this arm of the harbour. High abundances were also found at both sites in the Whakaki River, which is opposite the Arapaoa River.
Figure 28. Density of Theora lubrica in cores collected in the Kaipara Harbour in 2014.

Northland Regional Council Estuary Monitoring Programme: Kaipara Harbour 2014 37
Asian date mussel
The Asian date mussel (Musculista senhousia) was identified from cores at just two of the sites (K27 Moturoa Island and K32 Kumuakiiti Point) (Figure 29) but ‘mats’ or ‘humps’ of Asian date mussels were observed at a number of locations throughout the northern harbour during the survey. At Moturoa Island very high densities were recorded although interestingly almost all of the individuals were collected from just one core (only two cores were analysed from this site). During the survey we also observed evidence that the ‘mats’ or ‘humps’ of Asian date mussels had modified the sediment characteristics of intertidal habitat. On Fifty Acre Bank, which is a large intertidal bank in the Wairoa arm of the harbour, we encountered a large mat of Asian date mussels, which appeared to have trapped fine sediment at the southern end of the bank (Figure 30). As we walked towards the centre of the bank, where we had planned to collect our sample, the sediment transitioned from very soft mud to firm sand (Figure 31).
Figure 29. Density of Asian date mussel in cores collected in the Kaipara Harbour in 2014.

Northland Regional Council Estuary Monitoring Programme: Kaipara Harbour 2014 38
Figure 30. Asian date mussels on Fifty Acre Bank. Figure 31. Firm sand in the centre of Fifty Acre Bank.
Pacific oyster
The other invasive taxa identified in the core samples was the pacific oyster (Crassostrea gigas) with three individuals recorded at Frenchman’s Bay (K26). In addition reefs of pacific oysters were observed throughout the harbour. On the Avril Flats at the northern end of the main Wairoa arm an extensive area of oyster reef was observed, which appears to have modified the surrounding intertidal flats. The oyster reefs appear to have created a barrier with the intertidal area behind the reefs comprising soft mud (Figure 31).
Figure 32. Map of Pacific oyster reef on the Avril flats.

Northland Regional Council Estuary Monitoring Programme: Kaipara Harbour 2014 39
3.5 Relating inter-tidal community structure and sediment properties A distance-based linear model (DISTLM) using the Bray-Curtis similarity matrix, and the log10 transformed sediment data similarity matrix, showed that all of the sediment properties, except coarse sand had a significant relationship to the intertidal ecological community structure (Table 9). The proportion of mud (17%) and TOC (16%) explained the highest amount of the variation in the ecological data. DISTLM conducted using a forward selection procedure showed that the combination of mud, medium sand, TOC, lead, chromium, zinc and phosphorus explained 39% of the variation in the community structure (Pseudo-F = 1.7728, P-value = 0.049). The p-values associated with the conditional test to add further sediment properties to the model were not significant and the variation explained by subsequent variables were relatively small. Table 9. DISTLM marginal tests for log10 sediment properties and abundance data from the Kaipara Harbour in 2014.
Sediment properties
Pseudo-F
P-value
Proportion of
variation explained
Mud 7.84 0.001 17 TOC 7.00 0.001 16 Lead 5.76 0.001 13 Medium sand 5.50 0.001 13 Nitrogen 5.17 0.001 12 Fine sand 4.95 0.001 12 Zinc 4.86 0.001 11 Phosphorus 4.36 0.001 10 Copper 3.44 0.001 8 Chromium 3.06 0.002 7 Nickel 2.96 0.002 7 Coarse sand 1.80 0.056 5

Northland Regional Council Estuary Monitoring Programme: Kaipara Harbour 2014 40
4 Discussion Council has implemented Estuary Monitoring Programmes in the Whāngārei Harbour, Kerikeri Inlet, Ruakaka Estuary, Whangaroa Harbour, and the Arapaoa River, in the Kaipara Harbour. In total 13 ‘sentinel’ sites are surveyed in these five estuaries. These programmes assess the health of representative ‘sentinel’ sites and provide baseline data, which can be used to track changes in the health of these sites over time. In order to provide more spatial information about the sediment quality and ecological status of the northern Kaipara Harbour, Council surveyed 44 intertidal sites throughout the northern Kaipara Harbour in 2014. This survey will provide baseline data to track changes in the health of the harbour over time and complement the existing data from the two sentinel sites in the Arapaoa River. The monitoring methods were adapted from the Estuary Monitoring Protocol (Robertson et al. 2002), and involved sampling the physical and chemical properties of the sediment, and the ecological communities of representative intertidal habitats.
4.1 Sediment grain size The sediment grain size characteristics displayed a general pattern of higher proportions of mud in tidal creek environments such as the Otamatea River and the Oruawharo River, giving way to more fine and medium sand in the main Wairoa arm and towards the harbour entrance. Tidal creeks are generally low energy depositional environments and tend to be more influenced by inputs of terrigenous sediment than marine sediment from the open coast. The proportions of mud at four sites previously surveyed by Council and Robertson et al. (2002) were similar to what has previously been found at these sites and the sediment characteristics observed in this survey are similar to patterns reported in the Otamatea River by Poynter (2014).
4.2 Sediment TOC and nutrient concentrations Using criteria developed by Robertson and Stevens (2007), 13 sites were classified as ‘enriched’ for TOC, ten sites were ‘enriched’ for phosphorus and four sites were ‘enriched’ for nitrogen. While nutrients are essential for all forms of life, nutrients that enter the environment from anthropogenic sources, such as fertiliser, stormwater and treated wastewater may exceed the needs of an ecosystem and have adverse effects on the health of the harbour. In an enriched environment the sediment may become oxygen depleted and animals may die or migrate from the affected area. Consequently the community may become less diverse as it is recolonised by a smaller number of opportunist species that are tolerant of low oxygen conditions. The mean nitrogen concentration in the northern Kaipara Harbour was higher than most values previously recorded in sediment surveys of estuaries in Northland, with higher mean nitrogen values only found in the Bay of Islands and Hokianga Harbour. The nitrogen concentration recorded at K36 Matanginui, in the upper Wairoa arm, was also particularly high in comparison to other sites surveyed recently by Council. Higher concentrations of nitrogen have only been recorded at Limeburners Creek in Whāngārei Harbour (Griffiths 2013), Orira River in the Hokianga Harbour (Northland Regional Council 2013) and at WAT 8 in the Waitangi Estuary (Griffiths 2013). The mean phosphorus and TOC levels recorded in the northern Kaipara Harbour were towards the middle of the range of values recorded at other estuaries surveyed recently by Council.

Northland Regional Council Estuary Monitoring Programme: Kaipara Harbour 2014 41
A similar spatial pattern was observed for levels of TOC, nitrogen and phosphorus, with the highest levels recorded at mud dominated sites in the upper reaches of the different arms of the harbour, with levels generally decreasing down each arm towards the entrance of the harbour. This pattern is consistent with these sites being located close to potential freshwater inputs of nutrients, in depositional tidal creek environments with higher proportions of mud. Sediment carbon and nutrients absorb onto mineral surfaces and tend to increase with decreasing sediment grain size. Potential sources of nutrients to the Kaipara Harbour include discharges from municipal wastewater treatment plants and milk processing plants, seepage from the wastewater networks and septic tanks, stormwater, runoff from agricultural land and discharges from farm dairy effluent systems. The concentrations of nutrients recorded at Council’s two sentinel sites (K38 Whakapirau and K2 Te Kopua Point Bay) and the two sites previously surveyed by Robertson et al. (2002) were generally lower than the concentrations previously recorded at these sites. The exceptions to this were increases in total nitrogen and TOC at K38 Whakapirau. There was also a small increase in nitrogen at K2 Te Kopua Point.
4.3 Sediment metals Heavy metals can have lethal and sub-lethal effects on benthic invertebrates. In a contaminated environment the species diversity and species richness may decrease as the community becomes dominated by a smaller number of more tolerant species, which are able to survive and reproduce in these conditions. The concentration of nickel at K34 Burgess Island Inner exceeded the Australian and New Zealand Guidelines for Fresh and Marine Water Quality (ANZECC) ISQG-Low effect trigger values (Australian New Zealand Environment Conservation Council 2000) and the concentration of copper at this site exceeded the threshold effect level developed by MacDonald et al. (1996). The relatively high concentrations of nickel and copper at this one site are surprising as there are no obvious sources of metal contaminants in the vicinity and two other sites located relatively close to this site did not have elevated metal concentrations. The concentration of copper at K41 Kaiwaka River also exceeded the threshold effect level. K41 Kaiwaka River is located in a sheltered tidal creek location. Potential sources of metal contaminants at this site include discharges from municipal waste water treatment plants, stormwater discharges and road runoff. At the other 42 sites all of the other metal concentrations were below (ANZECC) ISQG-Low effect trigger values (Australian New Zealand Environment Conservation Council 2000) and the threshold effect levels developed by MacDonald et al. (1996). This suggests that the concentrations of metals in the harbour are unlikely to be having an adverse effect on the ecology although work by Hewitt et al. (2009) has found community responses below these guideline values. Within the harbour the highest concentrations of metals were generally recorded towards the top of the Wairoa arm and in the upper reaches of the other arms of the harbour. These sites are generally depositional tidal creek environments where there were high proportions of mud. Heavy metal absorption tends to increase as sediment grain size decreases, which reflects the tendency for heavy metals to be preferentially absorbed on the large surface area of fine grained sediments rich in clay minerals (Abrahim et al. 2007). The lowest concentrations were generally recorded along the shoreline of the Pouto peninsula in the main Wairoa arm of the harbour. The concentrations of metals recorded at Council’s two sentinel sites (K38 Whakapirau and K2 Te Kopua Point Bay) and the two sites previously surveyed by Robertson et al. (2002) were lower than the concentrations previously recorded at these sites. The mean metal concentrations recorded in the Northern Kaipara Harbour were also generally lower than those reported in recent

Northland Regional Council Estuary Monitoring Programme: Kaipara Harbour 2014 42
sediment surveys conducted by Council in the Waitangi Estuary (2013), Bay of Islands and Whāngārei Harbour (both 2012).
4.4 Ecology The intertidal habitats surveyed were reasonably varied, including sheltered muddy tidal creek environments, sand flats, sand banks, and exposed sandy beaches. One sample was also collected from an area of oyster reef. Sites were located on the mid inter-tidal so no mangrove forests were sampled. No seagrass beds were encountered and we are not aware of any intertidal or subtidal seagrass beds in the northern Kaipara Harbour. Using cluster analysis and non-metric MDS ordination of the ecological data four main ecological community groups were identified. The first group (Group A) included sites found on sheltered mud flats in the different arms of the harbour and was characterised by polychaete worms, and the invasive bivalve Theora lubrica. A second group (Group B) comprised sites found in the upper reaches of the estuarine arms of the harbour with a high proportion of mud and was characterised by oligochaete and polychaete worms. A third group (Group C) included sites found on more sandy sites in the main Wairoa arm of the harbour. This group was characterised by the cockle Austrovenus stutchburyi, the polychaete worm Aonides trifida, and the wedge shell Macomona liliana. The fourth group (Group D) comprised four sites located on exposed sand flats and sand banks in the main Wairoa arm of the harbour. This group was characterised by the bivalves Soletellina sp., the wedge shell Macomona liliana and the cockle Austrovenus stutchburyi. Sites in Group A and Group B tended to have lower species richness, lower total numbers of individuals and lower Shannon-Wiener diversity scores than sites in Group C and Group D. In addition, although biomass was not measured in this survey it is likely that sites in Group C and D had much higher biomass than sites in Group A and Group B. This is likely because sites in Group A and B were characterised by small animals (marine worms) and generally had low abundances of large bodied animals (e.g. cockles, pipi and wedge shells), while sites in Groups C and D were characterised by high abundances of large bodied shellfish. The cluster analysis and MDS ordination also identified a fifth group (Group E) comprising just two sites, which were both located in the upper reaches of the Oruawharo River. A further four sites were in groups by themselves: K18 Tauhara, K19 Tauhara Creek K28 Sandy Beach, and K27 Moturoa Island. K18 Tauhara, K19 Tauhara Creek and K28 Sandy Beach all had low species richness and low abundances of animals. Only two cores were analysed from K27 Moturoa Island and the taxa found in these cores were quite different resulting in a very low within site similarity (Bray Curtis similarity). A system of ecological classification rules developed by Hewitt and Funnell (2005) in their survey of the southern Kaipara was also used to allow for comparisons with their work. Using this classification system 12 community types were identified, although most sites belonged to just two groups: a Polychaete – Deposit feeder community and an Austrovenus community. Sites belonging to the Polychaete-Deposit feeder community type were generally located on sheltered mud flats in the different arms of the harbour, while sites belonging to the Austrovenus community type tended to be located on more exposed sand flats. The average similarity of these community types was lower than the groups identified from the cluster and MDS analysis and the dissimilarity between the community types tended to be lower than the dissimilarity between groups identified by cluster and MDS analysis. The groups identified with MDS and cluster analysis therefore appear to have been better at identifying the ecological communities at the sites sampled in the northern Kaipara.

Northland Regional Council Estuary Monitoring Programme: Kaipara Harbour 2014 43
The ecological communities found at Council’s two sentinel sites were similar to what has been found in previous surveys of these sites between 2009 and 2011 (Griffiths 2013). Both of Council’s sentinel sites were within Group A, characterised by the invasive bivalve Theora lubrica and polychaete worms. At K30 Otairi Creek an almost identical set of taxa was found compared to Robertson et al. (2002) and high abundances of cockles Austrovenus stutchburyi were found in both surveys. However at K40 Wahiwaka Creek the community appeared to have changed somewhat since the survey by Robertson et al. (2002). Robertson et al. (2002) found that oligochaete worms, the polychaete worm Heteromastus filiformis and the cockle Austrovenus stutchburyi were the most abundant taxa but in this survey the polychaete worm Paraonidae was the most abundant taxa and no cockles at all were found.
4.5 Shellfish A number of dense shellfish beds were encountered in the current survey and the communities at a number of sites were characterised by large bodied shellfish species. Cockles (Austrovenus stutchburyi) were found at 22 sites with densities of over 1000 per m2 recorded at eleven sites. These densities were high compared to densities reported in a recent survey of recreational beds in Northland, Auckland and the Bay of Plenty Regions (Pawley 2011). Pawley reported cockle densities of between 146 and 1509 cockles per m2. Cockles were mainly found at firm sandy sites in the Wairoa arm of the harbour with very few cockles found at muddy tidal creek locations in the other arms of the harbour. Particularly high densities were found at K17 Waikeri Creek, K15 Okaro Creek, K16 Pareotaunga Point, K23 Kotiroreka Bay, K24 Tangitiki Bay, K26 Frenchmans Bay and K33 Subritzky Channel. Pipi were found at 14 sites, mostly located at firm sandy sites along the shoreline of the Tinopai and Pouto peninsulas in the Wairoa arm of the harbour with particularly high densities found at K29 Komiti Beach, at Tinopai, and K17 Waikeri Creek on the Pouto peninsula. Wedge shells were found at 20 sites mostly on firm sandy substrate in the Wairoa arm of the harbour with the highest density found at K33 Subritzky Channel.
4.6 Non-indigenous species Three non-indigenous bivalve species were identified in the current survey, including the pacific oyster (Crassostrea gigas), the Asian date mussel (Musculista senhousia) and a small bivalve Theora Lubrica. The small bivalve Theora lubrica was the most widespread invasive species found in this survey, being present at 18 sites. It was mainly found in muddy tidal creek locations with very few individuals found in the Wairoa arm of the harbour. The highest densities were found in the Arapaoa River and it was found at all seven sites in this arm of the harbour. Theora Lubrica, typically lives in muddy sediments from the low tide mark to 50m and thrives in highly disturbed and polluted environments (Hayward 1997) and in many localities is an indicator species for eutrophic and anoxic areas (Inglis et al. 2005). Theora Lubrica has previously been recorded in high densities at Council’s two sentinel sites in the Arapaoa River, between 2009 and 2011 (Griffiths 2013) and was found at all four sites in the Otamatea River surveyed by Poynter in 2014, with particularly high densities at the uppermost site (near to K42 Wairau River in this survey). Theora lubrica was not found at the three sites sampled in the Otamatea River by Robertson et al. (2002) and was not found at the two of these sites resampled in the current survey. The Asian date mussel Musculista senhousia was found at just two sites (K27 Moturoa Island and K32 Kumuakiiti Point) with very high densities recorded at K27 Moturoa Island although interestingly the majority of individuals were collected from just one core. The Asian date mussel has previously been found at Council’s two sentinel sites in the Arapaoa River although only one individual has been found at each site between 2009 and 2011. Inglis et al. (2010) also found the

Northland Regional Council Estuary Monitoring Programme: Kaipara Harbour 2014 44
Asian date mussel at nine sites in the northern Kaipara Harbour including sites in the Wairoa arm, Oruawharo River and Arapaoa River. In a recent subtidal beam trawl survey of the Kaipara Harbour large densities of Asian date mussels were found as bycatch, south of Pahi, in the Arapaoa River, at the entrance to the Wairoa River, in the funnel in the Otamatea River, and east of Hargreaves Basin (Morrison et al. 2014). In addition to the individuals identified from the core samples, large ‘mats’ of Asian date mussel were observed at a number of locations during the current survey and we have received anecdotal reports from local fishermen and oyster farmers that it is widespread throughout the northern harbour. We also observed evidence that the Asian date mussel had modified the sediment characteristics of intertidal habitat, with the mats appearing to trap fine sediment. The pacific oyster Crassostrea gigas was only found at one site but reefs of pacific oysters were observed throughout the harbour. We also observed modification of the intertidal habitat by oyster reefs, in particular on the Avril flats at the northern end of the main Wairoa arm of the harbour. An extensive area of oyster reef appears to have created a barrier, which appears to have acted as a sediment trap and/or a barrier from wave and wind action, resulting in a large area of soft mud behind the oyster reef.
4.7 Relating ecological and sediment data A distance-based linear model (DISTLM) showed that all the sediment properties, except coarse sand had significant relationships to the ecological community structure. When examined individually the proportion of mud and TOC explained the highest amount of the variation in the ecological data with these properties able to explain 17% and 16% of the variation in the ecological data respectively. DISTLM also showed that the combination of mud, medium sand, TOC, lead, chromium, zinc and phosphorus explained 39% of the variation in the community structure. Previous analysis of data collected from Council’s two sentinel sites in the Arapaoa River arm of the Kaipara Harbour also showed that the sediment properties were significantly related to the ecological data (Griffiths 2013). The significant relationship between these sediment properties and the ecological data indicates that the physical and chemical characteristics of the sediment have influenced the ecological communities found in the northern Kaipara.

Northland Regional Council Estuary Monitoring Programme: Kaipara Harbour 2014 45
5 Acknowledgements Thanks to Ricky Eyre, Marcus Schlesier, Sophia Clark, Craig Gardner and Ron Matich for their help with field work.
Northland Regional Council Estuary Monitoring Programme: Kaipara Harbour 2014 46
6 References Abrahim, G.M.S., Parker R.J. & Nichol S.L. (2007). Distribution and assessment of sediment toxicity in Tamaki estuary, Auckland, New Zealand. Environmental Geology 52: 1315-1323. Australian and New Zealand Environment and Conservation Council (2000). Australian and New Zealand Guidelines for Fresh and Marine Water Quality. ANZECC, Canberra. Boffa Miskell Ltd. (2000). Kiwi Dairy Maungaturoto Factory. Otamatea Discharge Ecological and Water Quality Report. Report prepared By: Boffa Miskell Ltd. For: Kiwi Dairy Ltd. July 2000. Clark, K.R. & Warwick, R.M. (1994). Similarity-based testing for community pattern: the 2-way layout with no replication. Marine Biology 118:167-176. Clark, K.R. & Warwick, R.M. (2001). Change in Marine communities: An Approach to statistical Analysis and Interpretation. PRIMER-E: Plymouth. Hayward, B. (1997). Introduced marine organisms in New Zealand and their impact in the Waitemata Harbour, Auckland. Tane 36: 197-223. Hewitt, J.E. & Funnell G.A. (2005). Benthic marine habitats and communities of the southern Kaipara. Prepared by NIWA for Auckland Regional Council. Auckland Regional Council Technical Publication 275. Hewitt, J.E., Anderson, M.J., Hickey, C., Kelly, S., Thrush, S.F. (2009). Enhancing the ecological significance of contamination guidelines through integration with community analysis. Environmental Science and Technology 43: 2118-2123.
Griffiths, R. (2012). Whāngārei Harbour Estuary Monitoring Programme 2012. Northland. Regional Council technical report.
Griffiths, R. (2013a). Arapaoa River Estuary Monitoring Programme 2009-2011. Northland Regional Council technical report.
Griffiths, R. (2013b). Waitangi Estuary Monitoring Programme 2013. Northland. Regional Council technical report.
Inglis G, Gust, N., Fitridge, I., Floerl, O., Woods, C., Hayden, B. and Fenwick, G. (2005). Whāngārei Marina Baseline survey for non-indigenous marine species. Biosecurity New Zealand Technical Paper No: 2005/15. Inglis G, Brink, A., Peacock, L., Middleton, C., Kospartov, M., Schimanski, K., Ahyong, S., Chang, H., Read, G., Burnett, J. & Cox, S. 2010. Kaipara Harbour & Marinas Baseline survey for non-indigenous marine species (Research Project ZB2005/19). Biosecurity New Zealand Technical Paper. MacDonald, D.D., Carr, R.S., Calder, F.D., Long, E.R. & Ingersoll, C.G. (1996). Development and evaluation of sediment quality guidelines for Florida coastal waters. Ecotoxicology 5:253-278. McArdle, B.H. & Anderson M.J. (2001). Fitting multivariate models to community data: a comment on distance based redundancy analysis. Ecology 82:290-297. Morrison, M.A., Lowe, M.L., Jones, E.G., Makey, L., Shankar, U., Usmar, N., Miller, A., Smith, M. & Middleton, C. (2014). Habitats of particular significance for fisheries management:

Northland Regional Council Estuary Monitoring Programme: Kaipara Harbour 2014 47
the Kaipara Harbour. New Zealand Aquatic Environment and Biodiversity Report No. 129. Ministry for Primary Industries. New Zealand Land Cover Database (2001). New Zealand Climate Change Office (Ministry of the Environment). Northland Regional Council (2013). Far North Harbours Water and Sediment Quality Investigation. Northland Regional Council technical report. Pawley, M.D.M. (2011). The distribution and abundance of pipis and cockles in the Northland, Auckland, and Bay of Plenty regions, 2010. New Zealand Fisheries Assessment Report 2011/24. Published by the Ministry of Fisheries, Wellington 2011. Poynter, M. (2014). Fonterra Maungaturoto Resource Consent CON2001042041 Ecological Monitoring April 2014. Report Prepared for: Fonterra Co-Operative Group Ltd. (Maungaturoto Plant). By: Poynter & Associates Environmental Ltd. Robertson, B.M., Gillespie, P.A., Asher, R.A., Frisk, S., Keeley, N.B., Hopkins, G.A., Thompson & S.J., Tuckey, B.J. (2002). Estuarine environmental; Assessment and Monitoring: A National Protocol. Part A. Development, Part b Appendices, and Part C. Application. Prepared for supporting Councils and the Ministry of Environment, Sustainable Management Fund Contract No. 5096. Part A. 93p. Part B. 159p. Part C. 40 p plus field sheets. Robertson, B. & Stevens, L. (2007). Waikawa Estuary 2007. Fine scale Monitoring and Historical sediment coring. Prepared for Environment Southland.

Northland Regional Council Estuary Monitoring Programme: Kaipara Harbour 2014 48
7 Appendices Appendix 1 Land Use in the northern Kaipara Harbour catchment
Land Classes in northern Kaipara Harbour catchment from Zealand Land Cover Database (2001). 1st Order Class
2nd Order Class
Area (Ha) Percentages
Artificial surfaces (<1%) Built-up Area 723 <1 Urban Parkland/ Open Space 203 <1 Surface Mine 133 <1 Transport Infrastructure 40 <1 Bare or lightly vegetated surfaces (<1%) Coastal Sand and Gravel 1239 <1 River and Lakeshore Gravel and
Rock 1 <1
Landslide 2 <1 Water bodies (1%) Lake and Pond 1070 <1 River 1470 <1 Cropland (1%) Short-rotation Cropland 2147 <1 Vineyard 1 <1 Orchard and Other Perennial Crops 1053 <1 Grassland (63%) High Producing Exotic Grassland 278670 62 Low Producing Grassland 5129 1 Herbaceous Freshwater Vegetation 1271 <1 Herbaceous Saline Vegetation 202 <1 Flaxland 40 <1 Scrub (4%) Fernland 8 <1 Gorse and Broom 1123 <1 Manuka and or Kanuka 12799 3 Broadleaved Indigenous
Hardwoods 5605 1
Mixed Exotic Shrubland 318 <1 <1 Forest (30%) Major Shelterbelts 130 <1 Afforestation 4701 1 Forest Harvested 3878 1 Pine Forest 57142 13 Other Exotic Forest 1649 <1 Deciduous Hardwoods 762 <1 Indigenous Forest 68411 15 Mangrove 363 <1
Total
450285 100

Northland Regional Council Estuary Monitoring Programme: Kaipara Harbour 2014 49
Appendix 2 Site co-ordinates (NZGD 2000 New Zealand Transverse Mercator)
Site Name x y K1 Hokorako Creek 1717545 5991892 K2 Te Kopua Point Bay 1713964 5992570 K3 Whakapirau Creek 1714948 5995801 K4 Kirikiri Inlet 1709301 5995221 K5 Paparoa Creek 1708581 5999093 K6 Pahi River 1711791 6001183 K7 Hargreaves Basin 1721596 5981671 K8 Oruawharo River 1726098 5984074 K9 Gittos Point 1723510 5984378 K10 Koareare Creek 1729394 5986023 K11 Topuni River 1732656 5989383 K12 Waitieke Creek 1704918 5991198 K13 Te Kiakia Bay 1707500 5989293 K14 Waikeri Bank 1705557 5981027 K15 Okaro Creek 1701979 5982067 K16 Pareotaunga Point 1703387 5982395 K17 Waikeri Creek 1704170 5980990 K18 Tauhara 1705500 5979399 K19 Tauhara Creek 1705744 5978003 K20 Clarks Bay 1695578 5993397 K21 Clarks Banks 1697215 5993266 K22 Fifty Acre Bank 1698850 5989941 K23 Kotiroreka Bay 1702193 5985837 K24 Tangitiki Bay 1697354 5989724 K25 Burgess Island Outer 1696276 5995524 K26 Frenchmans Bay 1717470 5981332 K27 Moturoa Island 1713998 5984683 K28 Sandy Beach 1710012 5986615 K29 Komiti Bay 1712267 5987267 K30 Otairi Creek 1719554 5990040 K31 Te Ruruku Bay 1702190 5994045 K32 Kumuakiiti Point 1699271 5995387 K33 Subritzky Channel 1698603 5993965 K34 Burgess Island Inner 1696819 5996241 K35 Burgess Island Oysters 1696644 5995830 K36 Matanginui 1691324 5998469 K37 Ruawai 1690824 6000992 K38 Whakapirau 1711309 5995997 K39 Hanerau Stream 1722797 5993878 K40 Wahiwaka Creek 1724884 5997422 K41 Kaiwaka River 1727399 5999618 K42 Wairau River 1723836 6000819 K43 Otara 1719444 5987766 K44 Stony Creek 1718979 5986505

Northland Regional Council Estuary Monitoring Programme: Kaipara Harbour 2014 50
Appendix 3 Field notes
Site Date Field notes K1 Hokorako Creek 18/03/2015 Flat mud (sandy mud) – quite sticky. First push on the core only
went in 2 inches. Needed to hammer the core in several times. K2 Te Kopua Point Bay
18/03/2015 Very soft mud. Surface flat with crab holes and the odd shell. Very easy to push core in. When sieving the sediment was noticeably more sticky (clay like sediment). The sediment stuck to the bucket and was very clumpy.
K3 Whakapirau Creek 18/03/2015 Surface flat, soft mud, crab holes. Very easy to push sediment core in.
K4 Kirikiri Inlet 18/03/2015 Surface flat, soft mud, crab holes. Shell has at the bottom of core. Site 10m away from a reasonable size oyster reef.
K5 Paparoa Creek 18/03/2015 Surface flat. Muddy sand, small crab holes no large ones. Semi hard to push core in.
K6 Pahi River 18/03/2015 Surface flat, crab holes – easy to push core in. K7 Hargreaves Basin 19/03/2015 Surface firm to walk on. Hard to push core in. It needed stomping
and multiple attempts. Surface is hard sediment with some mud. Shell hash and bivalves. Stones up to 40mm. Cockles, pipi, nut shell all on surface. Core comes out intact. In the core we found sand down to 10cm before hitting clay (sticky). The upper shore is shell hash and stones before a distinct shift to coarse sand and less shell hash waste deep.
K8 Oruawharo River 19/03/2015 Surface semi firm to walk on (sink 1.5cm). Core easy to push in. Surface gravel, coarse sand with a film of mud on the surface. A ‘cap’ of coarse material at 10cm -15cm in the core.
K9 Gittos Point 19/03/2015 Soft mud, surface flat. Easy to push core in. Lighter brown mud on surface. From 1-11cm darker mud, very liquidy.
K10 Koareare Creek 19/03/2015 Site 6m from mangroves. Very soft mud, surface flat, very small holes.
K11 Topuni River 19/03/2015 Soft mud not as easy to push core in as at K10. Surface flat. Mangrove seedlings on site. Site 4m to mangroves.
K12 Waitieke Creek 20/03/2015 Firm sand. All of the bay appeared similar. Easy to walk on, no crab holes. Zeacumantus lutulentus observed on the surface. No shell hash. Some sand ripples.
K13 Te Kiakia Bay 20/03/2015 Firm sand but softer than K12. Foot sank about 2 cm. Appearance similar to K12 but patches of silt on the surface in places. Small sand ripples. Some large shells on surface. Zeacumantus lutulentus and Diloma subrostrata on the surface.
K14 Waikeri Bank 20/03/2015 Firm golden sand. Steep sand ripples. A few crab holes widely dispersed. No shells on surface.
K15 Okaro Creek 20/03/2015 Firm sandy mud with large cockle shells. No crab holes. Upper Okaro Creek all firm sandy mud up from Point. Lots of stingrays.
K16 Pareotaunga Point
20/03/2015 Firm sand with lots of shells on the surface. All appeared to be firm sand in surrounding area. Lots of stingrays.
K17 Waikeri Creek 20/03/2015 Firm golden sand with ripples. Big sting ray holes. Ron Matich commented that there were strong swells along this coast.
K18 Tauhara 20/03/2015 Golden sand, nothing on surface. Sand ripples, short steep beach. K19 Tauhara Creek 20/03/2015 Soft pudgy sand, no crab holes, no shells, no ripples. K20 Clarks Bay 21/3/2014 Soft mud, surface flat with crab holes. No shell hash on surface but
in the cores we hit shell hash. Clarks Bay is very heterogeneous. At northern end of Bay we found firm sand and a cockle bed and two smallish raised Asian date mussel beds. As we walked south the sediment turned to soft mud although it was firmer again up the beach towards the shore. At the far southern end of the bay there was a large expanse of raised oyster beds with lots of mud on them. We also observed horse mussel shells at the northern end of

Northland Regional Council Estuary Monitoring Programme: Kaipara Harbour 2014 51
beach. K21 Clarks Banks 21/3/2014 At the northern end of the Bank where the samples were collected
the sediment comprised firm sand with ripples, with some shells on surface but no crab holes. We observed some small patches of silt on top of the surface in the troughs of the sand ripples. At the southern end of the bank the sediment comprised soft mud and there was a transition zone, approximately 50m wide, where it went from soft mud to the firm sand with ripples. Ron Matich said that 30 years ago the bank used to be all firm sand. He explained that now the southern end of the bank is protected from the incoming tide by a big bank of Asian date mussels, which has caused it to become muddier.
K22 Fifty Acre Bank 21/3/2014 Firm hard sand. At the southern end of the Bank, Ron Matich says it is very firm packed sand and that the bank is one big cockle bed although the eastern side of the bank has Asian date mussels on it around the low water mark. On the western side we observed lots of dead cockle shells and a smell of dead cockles. At the sampling site there were not many shells on the surface.
K23 Kotiroreka Bay 21/3/2014 Firm sand with lots of big cockles, pipi and wedge shells. At the sample site live cockles observed on the surface. The Bay was quite heterogeneous. At northern end a slightly raised triangular shaped area of golden sand was observed with ripples and not much shell hash. Lots of pipi and some cockles at low water mark.
Kelly’s Bay At the shoreline/low water mark we observed a raised firm sandy plateau with some shells with sand ripples. As we walked towards the shore we dropped into an area of more muddy sand with lots of shell hash and gastropods. No sample collected at this Bay. Ron Matich said that it is a large cockle bed like K23.
K24 Tangitiki Bay 21/3/2014 Medium soft mud. Ron Matich told us that the Bay is all very homogenous with some patches of softer mud. Mature mangroves surround the Creek.
K25 Burgess Island Outer
21/3/2014 Soft mud, very uneven terrain, lots of gullies and ruts.
K26 Frenchmans Bay 25/03/2015 Firm mud. Lots of cockle shells on the surface. Hard to push core in. At about 8-10cm down the core there we encountered very hard clay like sediment. This was not like anything was had seen before and it was very hard to retrieve the core.
K27 Moturoa Island 25/03/2015 Firm mud, easy to push core in. K28 Sandy Beach 25/03/2015 Firm sandy beach. K29 Komiti Bay 25/03/2015 Firm sand with lots of cockle and pipi shell hash on the surface. We
needed to hammer the core in and had to dig it out. K30 Otairi Creek 25/03/2015 Firm mud with lots of shell (cockle) hash on the surface. Smell of
rotting shellfish. K31 Te Ruruku Bay 3/4/2015 Layer of mud 15mm deep over firm muddy sand. No crab holes.
Zeacumantus lutulentus and Diloma subrostrata observed on the surface.
K32 Kumuakiiti Point 3/4/2015 Firm sand with ripples Zeacumantus lutulentus and cockles visible on the surface.
K33 Subritzky Channel
3/4/2015 Firm flat sand (sink approximately 5mm). Expansive sand flat. Barnacles observed on crabs.
K34 Burgess Island Inner
3/4/2015 Soft sloppy mud but not too bad to walk across. Lots of crab holes. A layer of shell was encountered approximately 10-15cm down the core.
K35 Burgess Island Oysters
3/4/2015 Oyster reef. Soft clay mud (very sticky cohesive mud). Lots of crab holes and surface uneven. When we sieved the core samples the sediment that washed away was bright orange and very terrestrial looking.
K36 Matanginui 3/4/2015 No comments made.

Northland Regional Council Estuary Monitoring Programme: Kaipara Harbour 2014 52
K37 Ruawai 3/4/2015 No comments made. K38 Whakapirau 4/4/2015 Soft mud, sink to shins, crab holes. K39 Hanerau Stream 4/4/2015 Soft mud, sink to shins, crab holes. K40 Wahiwaka Creek 4/4/2015 Most of the Bay was soft mud with crab holes but the sample site
was on a raised plateau which was soft mud on top of shell hash. Shell hash was found very close to the surface with only about 2cm of mud at the surface.
K41 Kaiwaka River 4/4/2015 No comments made. K42 Wairau River 4/4/2015 No comments made. K43 Otara 4/4/2015 Soft mud with crab holes. Shell hash encountered at 10-15cm
harder to push core in. K44 Stony Creek 4/4/2015 Soft mud with crab holes. Shell hash encountered at 15cm deep.
Easy to push core in.

Northland Regional Council Estuary Monitoring Programme: Kaipara Harbour 2014 53
Appendix 4 Sediment results
Site Name <63
(Mud)
63-250 (Fine sand)
250- 500 (medium
sand)
>500 (coarse sand)
K1 Hokorako Creek 6 84 10 0 K2 Te Kopua Point Bay 36 61 3 0 K3 Whakapirau Creek 54 44 2 0 K4 Kirikiri Inlet 90 9 0 0 K5 Paparoa Creek 9 48 38 5 K6 Pahi River 48 27 17 8 K7 Hargreaves Basin 10 11 55 24 K8 Oruawharo River 34 8 12 46 K9 Gittos Point 89 10 1 0 K10 Koareare Creek 99 1 0 0 K11 Topuni River 100 0 0 0 K12 Waitieke Creek 9 63 22 6 K13 Te Kiakia Bay 6 54 24 16 K14 Waikeri Bank 0 70 30 0 K15 Okaro Creek 10 72 17 0 K16 Pareotaunga Point 0 48 33 19 K17 Waikeri Creek 2 53 44 2 K18 Tauhara 0 46 48 6 K19 Tauhara Creek 3 71 26 0 K20 Clarks Bay 14 62 24 0 K21 Clarks Banks 0 91 9 0 K22 Fifty Acre Bank 1 86 13 0 K23 Kotiroreka Bay 1 21 37 41 K24 Tangitiki Bay 6 60 28 6 K25 Burgess Island Outer 6 87 7 0 K26 Frenchmans Bay 23 58 20 0 K27 Moturoa Island 6 87 7 0 K28 Sandy Beach 0 2 37 61 K29 Komiti Bay 4 12 53 31 K30 Otairi Creek 23 50 13 14 K31 Te Ruruku Bay 13 68 18 0 K32 Kumuakiiti Point 0 86 14 0 K33 Subritzky Channel 6 88 6 0 K34 Burgess Island Inner 67 30 3 0 K35 Burgess Island Oysters 85 14 0 0 K36 Matanginui 98 2 0 0 K37 Ruawai 100 0 0 0 K38 Whakapirau 30 62 8 0 K39 Hanerau Stream 77 19 3 1 K40 Wahiwaka Creek 64 18 7 11 K41 Kaiwaka River 98 2 0 0 K42 Wairau River 47 38 11 5 K43 Otara 53 40 3 5 K44 Stony Creek 86 9 0 4

Northland Regional Council Estuary Monitoring Programme: Kaipara Harbour 2014 54
Site Name AFDW TOC Nitrogen (mg/kg)
Phosphorus (mg/kg)
K1 Hokorako Creek 1.5 0.6 240 240 K2 Te Kopua Point Bay 2.9 1.2 620 370 K3 Whakapirau Creek 3.8 1.6 630 360 K4 Kirikiri Inlet 7.6 3.2 1400 240 K5 Paparoa Creek 1.6 0.6 250 160 K6 Pahi River 3.8 1.6 1200 360 K7 Hargreaves Basin 3.8 1.6 660 450 K8 Oruawharo River 3.3 1.3 350 500 K9 Gittos Point 6.4 2.7 1400 320 K10 Koareare Creek 9.0 3.8 1100 580 K11 Topuni River 8.8 3.7 2700 700 K12 Waitieke Creek 3.6 1.5 320 400 K13 Te Kiakia Bay 3.4 1.4 360 640 K14 Waikeri Bank 0.9 0.4 55 90 K15 Okaro Creek 3.6 1.5 930 140 K16 Pareotaunga Point 1.8 0.7 310 73 K17 Waikeri Creek 1.1 0.4 160 41 K18 Tauhara 0.9 0.4 33 27 K19 Tauhara Creek 0.6 0.2 690 86 K20 Clarks Bay 4.9 2.0 660 180 K21 Clarks Banks 1.4 0.6 190 220 K22 Fifty Acre Bank 1.2 0.5 160 170 K23 Kotiroreka Bay 1.3 0.5 180 45 K24 Tangitiki Bay 1.9 0.8 530 160 K25 Burgess Island Outer 3.2 1.3 640 200 K26 Frenchmans Bay 2.8 1.1 590 190 K27 Moturoa Island 1.6 0.6 290 290 K28 Sandy Beach 0.5 0.2 71 50 K29 Komiti Bay 1.1 0.4 200 160 K30 Otairi Creek 3.4 1.4 1000 530 K31 Te Ruruku Bay 2.5 1.0 430 220 K32 Kumuakiiti Point 0.9 0.4 210 160 K33 Subritzky Channel 1.3 0.5 350 240 K34 Burgess Island Inner 5.4 2.2 1200 430 K35 Burgess Island Oysters 6.6 2.7 1400 560 K36 Matanginui 9.3 3.9 3900 550 K37 Ruawai 8.5 3.6 2200 540 K38 Whakapirau 4.2 1.7 1200 270 K39 Hanerau Stream 3.9 1.6 170 410 K40 Wahiwaka Creek 5.5 2.3 930 400 K41 Kaiwaka River 7.6 3.2 2300 610 K42 Wairau River 6.3 2.6 1400 590 K43 Otara 4.2 1.7 770 490 K44 Stony Creek 5.2 2.1 1000 340

Northland Regional Council Estuary Monitoring Programme: Kaipara Harbour 2014 55
Site Name Cadmium (mg/kg)
Chromium (mg/kg)
Copper (mg/kg)
Nickel (mg/kg)
Lead (mg/kg)
Zinc (mg/kg)
K1 Hokorako Creek <0.09 5.7 2.2 3.2 2.3 21 K2 Te Kopua Point Bay <0.09 9.7 6.6 5.8 4.9 34 K3 Whakapirau Creek <0.09 8.9 8.9 6.1 5.2 33 K4 Kirikiri Inlet <0.09 8.0 7.2 5.1 4.6 26 K5 Paparoa Creek <0.09 3.3 2.6 2.5 2.3 15 K6 Pahi River <0.09 9.3 11.0 6.9 6.0 36 K7 Hargreaves Basin <0.09 5.6 6.2 5.3 3.7 24 K8 Oruawharo River <0.09 4.5 8.2 6.1 5.2 25 K9 Gittos Point <0.09 18.0 8.9 6.8 5.5 32 K10 Koareare Creek <0.09 16.0 14.0 9.7 7.8 48 K11 Topuni River <0.09 14.0 14.0 8.5 8.0 44 K12 Waitieke Creek <0.09 18.0 18.0 12.0 5.8 50 K13 Te Kiakia Bay <0.09 17.0 13.0 13.0 8.2 57 K14 Waikeri Bank <0.09 4.2 0.8 2.1 0.9 9.2 K15 Okaro Creek <0.09 4.0 1.0 1.6 1.3 13 K16 Pareotaunga Point <0.09 1.7 <0.45 0.8 0.5 <6.8 K17 Waikeri Creek <0.09 1.0 <0.45 <0.45 0.4 <6.8 K18 Tauhara <0.09 2.6 0.5 1.0 0.7 6.9 K19 Tauhara Creek <0.09 7.4 1.3 2.8 1.8 21 K20 Clarks Bay <0.09 6.4 3.5 3.6 2.2 19 K21 Clarks Banks <0.09 9.4 2.4 5.2 2.1 25 K22 Fifty Acre Bank <0.09 6.8 1.5 3.5 1.5 16 K23 Kotiroreka Bay <0.09 1.0 <0.44 0.5 0.6 <6.6 K24 Tangitiki Bay <0.09 4.3 1.3 2.2 1.3 13 K25 Burgess Island Outer <0.09 7.5 3.0 4.3 2.0 22 K26 Frenchmans Bay <0.09 6.8 3.4 3.3 2.7 16 K27 Moturoa Island <0.09 11.0 2.6 5.8 2.5 27 K28 Sandy Beach <0.09 0.7 1.2 0.7 1.7 9.4 K29 Komiti Bay <0.09 6.2 2.6 3.6 6.9 18 K30 Otairi Creek <0.09 4.5 6.3 6.3 3.2 22 K31 Te Ruruku Bay <0.09 11.0 3.8 7.0 2.7 28 K32 Kumuakiiti Point <0.09 6.0 1.3 3.3 1.3 16 K33 Subritzky Channel <0.09 9.9 2.1 5.5 2.0 25 K34 Burgess Island Inner <0.09 17.0 45.0 26.0 5.2 54 K35 Burgess Island Oysters <0.09 21.0 12.0 11.0 6.8 56 K36 Matanginui <0.09 24.0 15.0 13.0 7.5 62 K37 Ruawai <0.09 22.0 14.0 12.0 7.1 58 K38 Whakapirau <0.09 6.7 5.6 4.7 4.0 25 K39 Hanerau Stream <0.09 8.3 14.0 8.9 7.8 43 K40 Wahiwaka Creek <0.09 6.4 9.2 5.8 5.7 35 K41 Kaiwaka River <0.09 12.0 21.0 11.0 10.0 53 K42 Wairau River <0.09 8.0 16.0 8.6 8.1 48 K43 Otara <0.09 8.6 7.1 5.6 5.0 33 K44 Stony Creek <0.09 9.0 7.4 5.5 5.1 29

Northland Regional Council Estuary Monitoring Programme: Kaipara Harbour 2014 56
Appendix 5 Diversity indices Site Name Species
richness Number of individuals
Shannon diversity Bray-Curtis
K1 Hokorako Creek 15 72 1.98 40 K2 Te Kopua Point Bay 10 244 1.77 42 K3 Whakapirau Creek 9 218 1.37 70 K4 Kirikiri Inlet 16 138 1.96 39 K5 Paparoa Creek 19 195 1.93 68 K6 Pahi River 10 159 1.11 76 K7 Hargreaves Basin 23 809 1.08 70 K8 Oruawharo River 15 53 2.31 29 K9 Gittos Point 11 148 1.60 67 K10 Koareare Creek 7 522 1.02 70 K11 Topuni River 5 884 1.15 55 K12 Waitieke Creek 26 249 2.58 63 K13 Te Kiakia Bay 30 514 2.15 73 K14 Waikeri Bank 13 126 1.85 57 K15 Okaro Creek 32 384 2.21 69 K16 Pareotaunga Point 35 759 2.34 57 K17 Waikeri Creek 28 487 1.87 67 K18 Tauhara 3 13 0.90 45 K19 Tauhara Creek 2 7 0.41 0 K20 Clarks Bay 11 42 1.99 33 K21 Clarks Banks 17 147 2.05 61 K22 Fifty Acre Bank 30 343 2.36 66 K23 Kotiroreka Bay 27 845 2.35 68 K24 Tangitiki Bay 26 808 1.80 66 K25 Burgess Island Outer 13 295 1.56 46 K26 Frenchmans Bay 39 764 2.44 67 *K27 Moturoa Island 17 298 0.49 1.12 K28 Sandy Beach 8 123 0.92 29 K29 Komiti Bay 28 1278 1.71 69 K30 Otairi Creek 28 390 2.69 59 K31 Te Ruruku Bay 23 122 2.71 52 K32 Kumuakiiti Point 20 162 2.12 44 K33 Subritzky Channel 27 524 2.00 71 K34 Burgess Island Inner 16 54 2.37 40 *K35 Burgess Island Oysters 8 78 1.69 8.45 K36 Matanginui 9 53 1.51 30 K37 Ruawai 8 78 1.31 44 K38 Whakapirau 16 317 1.41 67 K39 Hanerau Stream 14 279 1.32 66 K40 Wahiwaka Creek 15 153 1.67 65 K41 Kaiwaka River 12 84 1.55 13 K42 Wairau River 8 106 1.43 18 K43 Otara 13 105 1.91 42 K44 Stony Creek 9 223 1.46 72
*only two cores were analysed from these sites

Northland Regional Council Estuary Monitoring Programme: Kaipara Harbour 2014 57
Appendix 6 Simper analysis
Mean abundance of taxa at sites in Group A and their contribution to ‘group’ similarity. Mean similarity = 43%.
Taxon
% contribution
towards similarity
% cumulative
contribution towards
similarity
Heteromastus filiformis 29 29 Aricidea sp. 17 46 Theora lubrica 16 62 Paraonidae 12 74 Nicon aestuariensis 7 81 Macrophthalmus hirtipes 6 87 Cossura consimilis 4 91
Mean abundance of taxa at sites in Group B and their contribution to ‘group’ similarity. Mean similarity = 38%.
Taxon
% contribution
towards similarity
% cumulative
contribution towards
similarity
Oligochaeta 30 30 Paraonidae 16 46 Heteromastus filiformis 13 59 Polydorid 9 68 Macrophthalmus hirtipes 5 73 Helice crassa 4 77 Amphipoda 3 80 Arthritica bifurca 3 83 Nicon aestuariensis 3 86 Aricidea sp. 2 89 Phoxocephalidae 2 91

Northland Regional Council Estuary Monitoring Programme: Kaipara Harbour 2014 58
Mean abundance of taxa at sites in Group C and their contribution to ‘group’ similarity. Mean similarity = 45%.
Taxon
% contribution
towards similarity
% cumulative
contribution towards
similarity
Austrovenus stutchburyi 20 20 Aonides trifida 12 32 Macomona liliana 8 40 Nucula hartvigiana 6 46 Prionospio aucklandica 6 53 Heteromastus filiformis 6 58 Aricidea sp. 3 62 Anthopleura aureoradiata 3 65 Zeacumantus subcarinatus 3 68 Paphies australis 3 71 Austrominius modestus 2 73 Prionospio sp. 2 75 Zeacumantus lutulentus 2 78 Diloma subrostrata 2 80 Notoacmea helmsi 2 82 Nemertea sp. 4 2 83 Amphipoda 2 85 Paraonidae 1 86 Arthritica bifurca 1 87 Macrophthalmus hirtipes 1 88 Nemertea sp. 1 1 89 Scolecolepides benhami 1 90
Mean abundance, of taxa at sites in Group D and their contribution to ‘group’ similarity. Average similarity = 35%.
Taxon
% contribution
towards similarity
% cumulative contribution
towards similarity
Soletellina sp. 22 22 Macomona liliana 16 39 Austrovenus stutchburyi 16 55 Magelona dakini 8 63 Polydorid 6 69 Aglaophamus sp. 3 73 Nemertea sp. 4 3 76 Austrominius modestus 3 79 Heteromastus filiformis 3 82 Waitangi brevirostris 3 85 Cumacea 3 87 Flabellifera (juvenile) 2 89 Amphipoda 2 91