Embed Size (px)
Citation preview

K2K : KEK-to-Kamioka Long
Baseline Neutrino Oscillation
Experiment Kenzo NAKAMURA
KEKFor the K2K Collaboration
Les Houches EuroConference on Neutrino Masses and Mixings
June 21, 2001Les Houches Physics Center, France

K2K Collaboration
Chonnum National Univ.
Donshin Univ.
Seoul National Univ.
ICRR, Univ. of Tokyo
KEK
Kobe Univ.
Kyoto Univ.
Niigata Univ.
Okayama Univ.
Osaka Univ.
Science Univ. of Tokyo
Tohoku Univ.
Boston Univ.
Univ. of California at Irvine
Univ. of Hawaii at Manoa
SUNY at Stony Brook
Univ. of Washington at Seattle
Warsaw Univ.

•Accelerator : 12 GeV proton synchrotron•Beam intensity : 61012 protons / pulse•Repetition : 1 pulse / 2.2 sec•Pulse width : 1.1 s (9 bunches)
•Horn-focused wide-band beam•Average neutrino energy : 1.3 GeV
•Near detector : 300 m from the target•Far detector (Super-Kamiokande) : 250 km from the target•Goal : 1020 protons on target
Water Cherenkov detector Total mass : 50 kton Inner mass : 32 kton Fiducial mass: 22.5 kton
K2K (KEK-to-Kamioka)

Pion Monitor
200m
Near Detector
Pion Monitor
MuonMonitor
• Horn current: 250 kA
• Production target: Al 66cm×3cmφ
Beam Line and Magnetic Horn

K2K Near Detector
Measure flux, spectrum, profile
Measure e contamination
Study interactions at 1 GeV
1 kton water Cherenkov detector
Same structure and systematics as SuperK
Common water target
Scintillating-Fiber tracker
Active area: 2.4 m 2.4 m 20 (x,y) layer
Water target
19 layers of 60-mm thick water
Lead-glass counter
Muon/Fe
12 layers of iron plates (total mass 1,000 tons interleaved with muon drift chambers

Reconstructed Neutrino Energy
Spectra with 1020 POT
l + n l + p
l-
p
( El , pl )
μμμN
μμNν θpEm
mEmE
cos
2/2
The neutrino energy is reconstructed by assuming quasi-elastic (QE) scattering.

Oscillated/Non-oscillated with
1020 POT
non QE Bkg
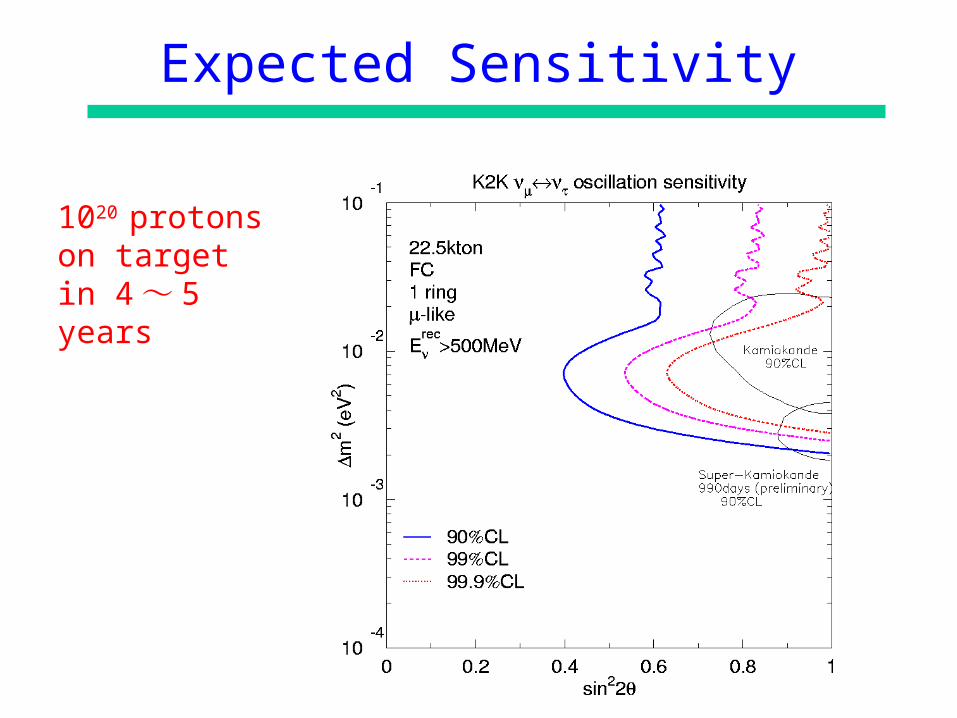
Expected Sensitivity
1020 protons on target in 4~ 5 years

Profile and Spectrum at the Near
Detector
R 100cmR 200cmR 300cm
E (GeV)R (cm)
MRD (Muon Range Detector)
MRD fiducial vol. for monitor-ing the rate.
Neutrino profile at 300 m
Neutrino spectrum averaged within a given R
Num
ber
of
neu
trin
os/
cm2/1
02
0
PO
T
Num
ber
of
neu
trin
os/
cm2/1
02
0
PO
T

Profile and Spectrum at the Far
Detector
Num
ber
of
neu
trin
os/
cm2/1
02
0
PO
T

Far/Near(R 300 cm) Flux
Ratio
It is vitally important to predict the far spectrum model-independently from the spectrum measured at the near site.
Measure momentum and angular distribution of pions, N(p, ).
Neutrino flux (E) at any distance using only decay kinematics.
E (GeV)

Pion Monitor
Pion monitor is a gas-Cherenkov counter which measures the pion p- distribution just after the magnetic horn.Sensitive to p >2 GeV (E > 1 GeV) to
avoid background from 12 GeV protons.
Predict far/near flux ratio above 1 GeV
Normally retracted from the beam line
Special low-intensity runs for measurement

Pion Monitor Results and
Fitting
p
w1w2 w3 w4 …..: :
: :

Pion Monitor: Unfolded
Result
- 5
- 4
- 3
- 2
- 1
0
1
2
3
4
5
2 3 4 5 6 7P i o n m o m e n t u m ( G e V / c )
Pio
n an
gle
(*10
mra
d)
beam axis
+
Relative Pion Population in p- plane

Spectra from Pion Monitor
Measurement

Flux Ratio from Pion Monitor
Measurement
Good agreement between the pion monitor results and the beam Monte Carlo above 1 GeV.
Thus, for the extrapolation of the event rate, MC calculation is used.
Systematic error estimated from pion monitor:
R(E)=SK(E)/FD(E)
%6%7
R

Muon Monitor
Sensitive to initially high energy (>5.5 GeV)
Spill-by-spill monitoring of Beam intensity
Targetting Horn stability
Profile Beam direction
Segmented ionization chamber

K2K Experiment: Schematic
1ktWater Cherenkov
MRD Lead Glass SciFi
Super-KamiokandeN
expectedSK N
observedSK
Far/near flux ratio
Nobserved1ktN
observedMuon/Fe NobservedSciFi
Consistency checkComparison This talk : Number of events Future : Spectrum
Near Detector Beam Monitors
Muon monitor
•Primary beam stability•Targetting
Pion monitor
•Pion kinematics
P -
Current Transformer
•Primary beam
intensity
Beam Monte Carlo
Uncertainties in the absolute flux normalization and cross section cancel out between 1kton and SK
Confirm above1 GeV
MRD•Rate stability•Directional stability•Spectrum stability

1 kton Event
H2O target (same as SK)
Same detection principle as SK
Rate normalization in calculating the epected number of nm events at the far site.
Fid. Mass: 25 ton Event selection:
Qtot>1000p.e. ~ 2events/100 spill

MRD Event
Neutrino int. in MRD iron plates (CC inclusive)
Large area coverage (8m)
profile (vertex dist.) Large mass (fid. Mass =
329 ton) high rate ( ~ 5/100spill)
Monitor neutrino direction intensity spectrum
1 0 0 c m
R u n 124 4 S p il l 20 799 T R G ID 1 9 9 6 2 2 17 4 8 5 6 0
N v tx 0
8mBeam

SciFi Event
Neutrino int. in SciFi H2O target (+Al 20%)
Pos. resolution ~1mm
well defined fid. vol. multitrack resolution
Fiducial mass = 5.9 ton
Event selection: matching SCIFI & MRD track
1 event/1000 spill Study neutrino
interaction, e.g. inelastic/elastic
Beam

Protons Delivered onto the
Target
H o rn 2 0 0 k ATa rg e t 2 c m
H o r n 2 5 0 k ATa r g e t3 c m
- m o n
- m o n
0
2
4
6
A p r 9 9 J u l9 9 O c t 9 9 J a n 0 0 A p r 0 0 J u n 0 0
Pro
ton
s/P
uls
e (
10
^12
)
D a t e
0
5
1 0
1 5
2 0
2 5
Acc
um
ula
ted
PO
T (
10
^18
)
Accumulated POT
Protons / pulse

Beam Direction
Arb
. un
it H o r iz o n ta l
x (c m )0 20 0 40 0-200-400
y (c m )0 20 0 40 0-200-400
Ve rt ic a l
0
20 00
40 00
60 00
80 00
Vertex distribution of MRD events (Nov99)
MRD MRD
Centered within sys. err. of 20cm (0.7mrad)
Fitted center x: 1±5cmy: - 10±4cm from SK dir.
(stat)
SK SK

Stability of the Profile Center
Measured with the Muon Range Detector
Stable to within 1 mrad Well within the
required 3 mrad- 1 0 0
- 8 0
- 6 0
- 4 0
- 2 0
0
2 0
4 0
6 0
8 0
1 0 0
prof
ile
cent
er x
i n t e g r a t e d d a y ( 1 d a t a p o i n t / 5 d a y s )
- 1 0 0
- 8 0
- 6 0
- 4 0
- 2 0
0
2 0
4 0
6 0
8 0
pro
file
cen
ter
y
i n t e g r a t e d d a y ( 1 d a t a p o i n t / 5 d a y s )
1mrad
1mrad
1mrad
1mrad
MRD
MRD

Stability of the Muon Profile
Center
1mrad
1mrad
Jun‘99
Jun‘00
Nov‘99
Jan‘00
Feb‘00
Mar‘00
May‘00
Spill-by-spill measurement with the muon monitor
Stable within 1 mrad

Stability of the MRD Event
Rate
Measured with the MRD
Good stability
Fe
even
ts/5
x1012
PO
T
~ 5.5events/100spillMRD
Horn 250kA
Target 3cm
Horn 200kA
Target 2cm

MRD MRD
Stability of Muon Energy and Angle
E (GeV) (deg)
Arb
itra
ry U
nit
s
Measured with MRD
Stable within statistical error

Expected Number of SK
Events
SKkt
ktSK R
NN
obsexp
dEEE
dEEE
M
MR
kt
SK
kt
SK
OH
OH
2
2
obsktN : observed events in 1kt
kt detection eff. of 1kt
SK : detection eff. of SK
kt
SKM
M fiducial mass ratio
(syst.) (stat.)2.08.37 5.38.3
exp SKN from 1 kton events
events SCIFI from 2.37 :
events MRD from 0.41:c.f.6.4
5.0-exp
0.66.6-
exp
SK
SK
N
N These results are consistent with each other.

Systematic Error
(syst.) (stat.)2.08.37 5.38.3
exp SKN
1kt (mainly V/V) %5
Near/Far Ratio %67
Total %910
SK(mainly V/V) %3
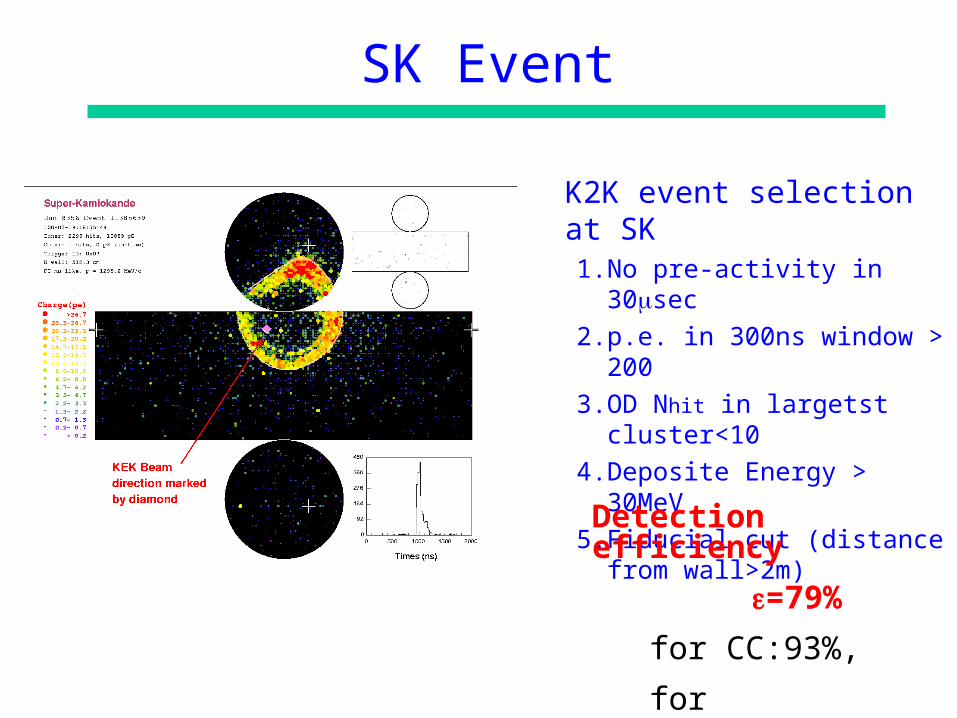
SK Event
K2K event selection at SK1. No pre-activity in 30sec
2. p.e. in 300ns window > 200
3. OD Nhit in largetst cluster<10
4. Deposite Energy > 30MeV
5. Fiducial cut (distance from wall>2m)
Detection efficiency
=79%
for CC:93%,
for NCinel:68%

SK Event Category
FC (Fully Contained; Light in ID only) Vertex inside the 22.5 kton fiducial volume Vertex outside the fiducial volumeOD contained ( Light in OD only)Crossing (Light in both ID and OD )
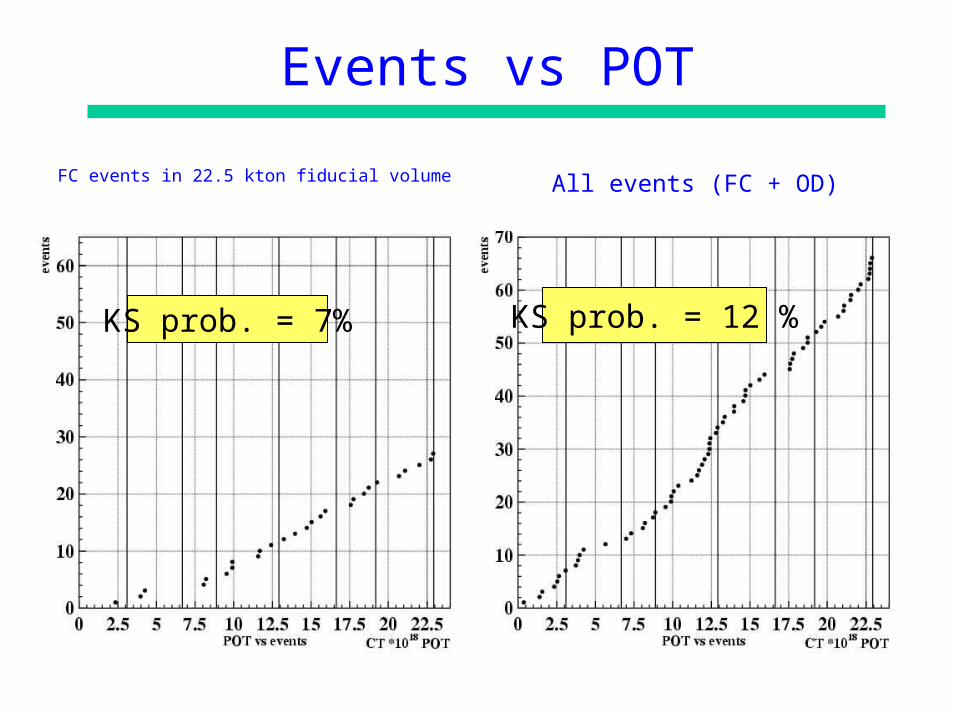
Events vs POT
FC events in 22.5 kton fiducial volume
KS prob. = 7% KS prob. = 12 %
All events (FC + OD)

Arrival Time Distribution
(s)
1
10
1 02
1 03
-500 -250 0 250 500
0
10
-5 0 5
5
No pre. act
> 200 p.e.
Exp’ed Atm BG<10-3 in 1.5s win.
28 observed.
Tspill TSK
sec3.1TOF2.0 SpillSK TTTTSpill, TSK: Abs. time of spill start, SK event measured with GPS
TOF: 0.83ms(Time of flight from KEK to Kamioka)

Observed vs Expected at SK

cos KEK Distribution
Preliminary
Data
MC w/o osc.
Need to estimate syst. err. in MC expect.
1-ring -like

Reconstructed Momentum
F. C . 1 - r i n g - l i k e M e V / c
0
2
4
6
8
1 0
0 1 0 0 0 2 0 0 0 3 0 0 0 4 0 0 0 5 0 0 0
PreliminaryDataMC w/o osc.
Need to estimate syst. err. in MC expect.

Reconstructed E
M e V / c
0
2
4
6
8
1 0
0 1 0 0 0 2 0 0 0 3 0 0 0 4 0 0 0 5 0 0 0
Fully contained 1-ring -like (22.5kt)
Preliminary
DataMC w/o osc.
Need to estimate syst. err. in MC expect.

Visible Energy
DataMC w/o osc.
Preliminary
need to estimate syst. err. in MC expect.
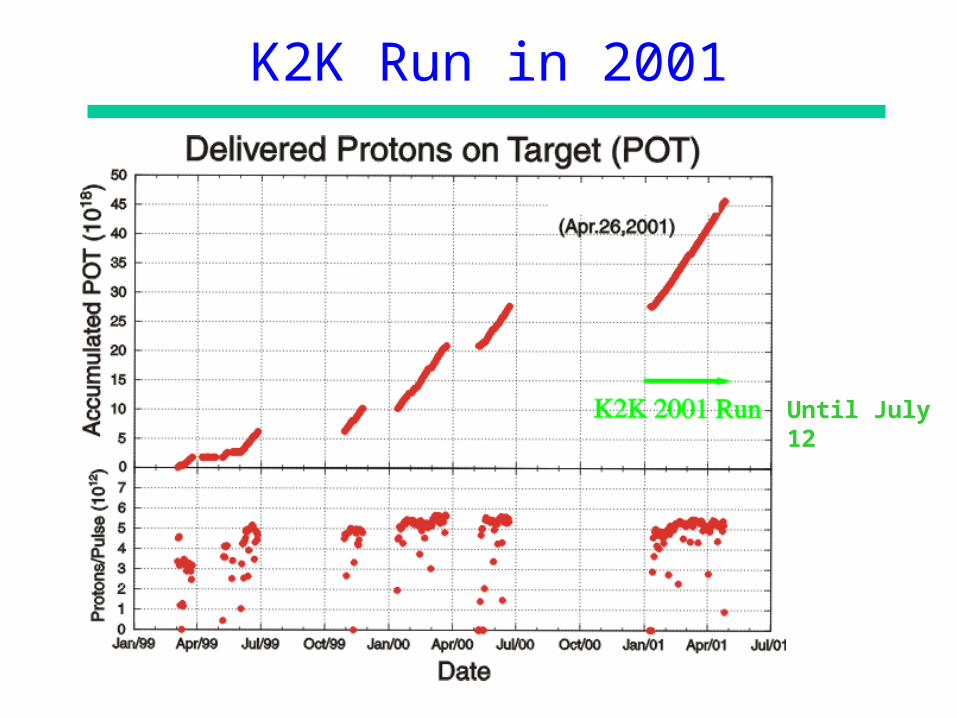
K2K Run in 2001
Until July 12

Conclusions
Methodology of a long-baseline neutrino experiment established.
Beam steering (direction)
Time synchronization between near site and far site
Monitoring of the neutrino beam at near site
Prediction of neutrino beam properties at far site from near site measurements
2.29 x 10¹⁹ POT accumulated from Jun ’99 to Jun ’00.
# of fully contained events in fiducial volume @ SK
Observed : 28
Expected : 37.8 +3.5-3.8 (w/o osc.)
Deficit of ~1GeV after 250km flight at 90% significance
Statistics doubled this summer

Future
Spectrum analysis
e appearance
Study of interactions at 1GeV region
Upgrade of the near detector in summer, 2003

Upgrade of the near detector

Upgrade of the Near Detector
(Segmented Liquid Scintillator with WLS Fiber Readout)
4m
2m
4m
Large Volume: 4×4×2m3
~30tonsFine segment: 20×20×20mm3
One cell is read-out to both X and Ydirections by X,Y fibers.
Large Light Yield:20~30 photo-electrons/cell for MIP
Particle ID: p/ : dE/dx / : range
#channels : ~ 40,000
cellstructure

Upgraded Near Detector
Liquid
Scintillator

Event Simulation

Neutrino Energy spectrum and the ratio
w/ and w/o oscillation
Uncertainty (now)Uncertainty (upgrade)
Spectrum ratio
2.6
JHF-to-SK Neutrino Project
http://neutrino.kek.jp/jhfnu/
Letter of Intent: hep-ex/0106019

Overview
~1GeV beamKamioka
JAERI(Tokaimura)
→ → xx disappearance ( m232 )~ 10-4 eV2, ( sin2223 )~ 0.01
→ → ee appearance sin2213 )~ 0.01 NC measurement → →s
~ 1 MW 50 GeV PS
( conventional beam)
Super-K: 50 ktonWater Cherenkov

JHK Accelerator Complex
JAERI@Tokai-mura(60km N.E. of KEK)
(Approved in Dec.2000)
0.00520.410.77Power(MW)
0.450.530.292Rate(Hz)
640330Int.(1012ppp)
1212050E(GeV)
K2KMINOSJHF
Construction2001 - 2006
Construction of neutrino beam lines is not yet approved.

Comparison of Three Beams
WBBLE2OA2°
Linear Log
OAB/WBB long HE tailPeak @ 800MeV~1GeVSharp peak for NBB/OABOAB produce very intense “NBB”
Target: Cu. 1cm, 30cm rodSK size: ±500m

Number of CC Events with
Various Beams
WBBWBB
LE1.5LE2LE3 OA3°
OA2°OA1°
WBB:5200 CC int./22.5kt/yrNBB: 620 CC int./22.5kt/yr (2GeV/c tune)OAB: 2200 CC int./22.5kt/yr (2degree)

MNS Matrix and Parameters
MNS mixing matrix
three mixing parameters
a cp violating phase
mass-squared differences
e
c12c13 s12c13 s13e
i
s12c23 c12s13s23ei c12c23 s12s13s23e
i c13s23
s12s23 c12 s13c23ei c12s23 s12 s13c23e
i c13c23
1
2
3
12, 13,23
m21
2 ,m32
2
12

DisappearanceDisappearance
1ring FC -like
Reconstructed E (MeV)Fit with 1-sin22 ・ sin2(1.27m2L/E)
Oscillation with m2=3×10⁻³
sin22=1.0
No oscillation
Non-QE
(linear)
(log)
m2=3×10⁻³
sin22=1.0
~3%
Ratio after BG subtraction

Precision of the Parameters
(sin22) ~ 0.01 in 5 years(m2) ~ <1×10⁻⁴ in 5 years
(sin22) (m2 )
NBB-3GeV, OAB-2degree, NBB-1.5GeV
0.01 1×10⁻⁴

e Appearance: Expected Signal
and Background
OAB2o 5year
Reconstruct E as Quasi-Elastic
interaction
Apply Energy Cut
0.4GeV< E <1.2GeV (OAB2o)

e Appearance: Sensitivities
In the SK allowed region1.510-3<m2<510-3
eV2:
sin22e ~ 0.005or sin2213 ~ 0.01

NC Measurement
NC/CC sensitive tos
NC Enriched Sample
sterileactiveNC PPN 1
# of NC events
logm2)
#0 + #e-like
3.2×10⁻³

JHF-to-SK Second Phase Hyper-Kamiokande: 1 Mton water Cherenkov detector JHF beam power upgrade: 4MW
200 statistics Goal of the 2nd phase
sin2213 sensitivity below 10-3 (if 13 not discovered in the 1st phase)
CP phase to 10 – 20 degrees (if the solution to the solar neutrino problem is MSW-LMA)
Proton decay (p K, e+0)
5JHF20SK 5 year

Hyper-Kamiokande: A Next-Generation Nucleon Decay Detector
at Kamioka
0.5 Mton
1 Mton: Total Length 400m (8 Compartments)

CP Violation

CP Sensitivity


![T2K ND280 Conceptual Design Report · induced neutrino oscillations by the recent results from the KamLAND experiment [7]. Most recently results from the K2K long-baseline neutrino](https://img.pdfslide.us/doc/110x75/5f705aa7147bc57aee7cc209/t2k-nd280-conceptual-design-induced-neutrino-oscillations-by-the-recent-results.jpg)