Embed Size (px)
Citation preview
December 2015
K22: Full Chain Process Flow Diagrams Technical: Full Chain
K22: Full Chain Process Flow Diagrams
Chapter Title Page
Executive Summary i
1 Introduction 1 1.1 Background _______________________________________________________________________ 1
2 Process Flow Diagrams 2
3 Glossary 24
Contents
The contents of this report draw on work partly funded under the European Union’s European Energy Programme for Recovery. The European Union is not responsible for any use that may be made of the information contained within this document.
K22: Full Chain Process Flow Diagrams
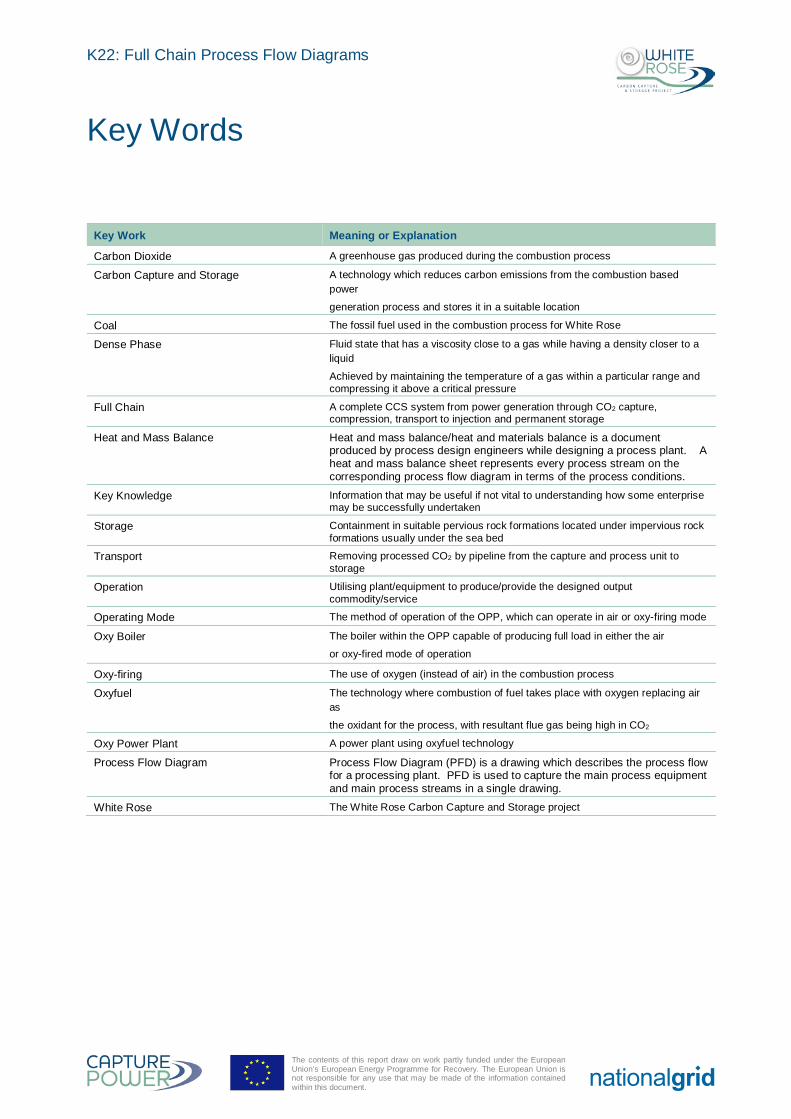
Key Work Meaning or Explanation
Carbon Dioxide A greenhouse gas produced during the combustion process
Carbon Capture and Storage A technology which reduces carbon emissions from the combustion based power generation process and stores it in a suitable location
Coal The fossil fuel used in the combustion process for White Rose
Dense Phase Fluid state that has a viscosity close to a gas while having a density closer to a liquid Achieved by maintaining the temperature of a gas within a particular range and compressing it above a critical pressure
Full Chain A complete CCS system from power generation through CO2 capture, compression, transport to injection and permanent storage
Heat and Mass Balance Heat and mass balance/heat and materials balance is a document produced by process design engineers while designing a process plant. A heat and mass balance sheet represents every process stream on the corresponding process flow diagram in terms of the process conditions.
Key Knowledge Information that may be useful if not vital to understanding how some enterprise may be successfully undertaken
Storage Containment in suitable pervious rock formations located under impervious rock formations usually under the sea bed
Transport Removing processed CO2 by pipeline from the capture and process unit to storage
Operation Utilising plant/equipment to produce/provide the designed output commodity/service
Operating Mode The method of operation of the OPP, which can operate in air or oxy-firing mode
Oxy Boiler
The boiler within the OPP capable of producing full load in either the air or oxy-fired mode of operation
Oxy-firing The use of oxygen (instead of air) in the combustion process
Oxyfuel
The technology where combustion of fuel takes place with oxygen replacing air as the oxidant for the process, with resultant flue gas being high in CO2
Oxy Power Plant A power plant using oxyfuel technology
Process Flow Diagram Process Flow Diagram (PFD) is a drawing which describes the process flow for a processing plant. PFD is used to capture the main process equipment and main process streams in a single drawing.
White Rose The White Rose Carbon Capture and Storage project
Key Words
The contents of this report draw on work partly funded under the European Union’s European Energy Programme for Recovery. The European Union is not responsible for any use that may be made of the information contained within this document.
K22: Full Chain Process Flow Diagrams
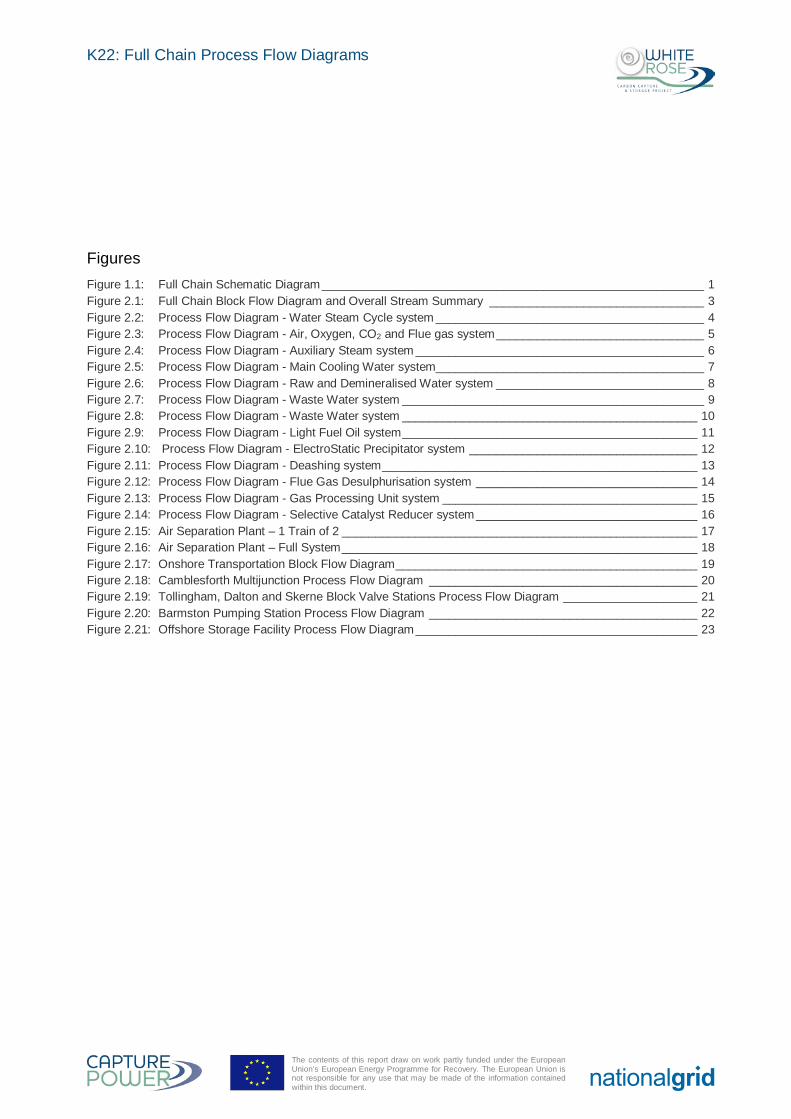
Figures Figure 1.1: Full Chain Schematic Diagram _________________________________________________________ 1 Figure 2.1: Full Chain Block Flow Diagram and Overall Stream Summary ________________________________ 3 Figure 2.2: Process Flow Diagram - Water Steam Cycle system ________________________________________ 4 Figure 2.3: Process Flow Diagram - Air, Oxygen, CO2 and Flue gas system _______________________________ 5 Figure 2.4: Process Flow Diagram - Auxiliary Steam system ___________________________________________ 6 Figure 2.5: Process Flow Diagram - Main Cooling Water system________________________________________ 7 Figure 2.6: Process Flow Diagram - Raw and Demineralised Water system _______________________________ 8 Figure 2.7: Process Flow Diagram - Waste Water system _____________________________________________ 9 Figure 2.8: Process Flow Diagram - Waste Water system ____________________________________________ 10 Figure 2.9: Process Flow Diagram - Light Fuel Oil system ____________________________________________ 11 Figure 2.10: Process Flow Diagram - ElectroStatic Precipitator system __________________________________ 12 Figure 2.11: Process Flow Diagram - Deashing system _______________________________________________ 13 Figure 2.12: Process Flow Diagram - Flue Gas Desulphurisation system _________________________________ 14 Figure 2.13: Process Flow Diagram - Gas Processing Unit system ______________________________________ 15 Figure 2.14: Process Flow Diagram - Selective Catalyst Reducer system _________________________________ 16 Figure 2.15: Air Separation Plant – 1 Train of 2 _____________________________________________________ 17 Figure 2.16: Air Separation Plant – Full System _____________________________________________________ 18 Figure 2.17: Onshore Transportation Block Flow Diagram _____________________________________________ 19 Figure 2.18: Camblesforth Multijunction Process Flow Diagram ________________________________________ 20 Figure 2.19: Tollingham, Dalton and Skerne Block Valve Stations Process Flow Diagram ____________________ 21 Figure 2.20: Barmston Pumping Station Process Flow Diagram ________________________________________ 22 Figure 2.21: Offshore Storage Facility Process Flow Diagram __________________________________________ 23
The contents of this report draw on work partly funded under the European Union’s European Energy Programme for Recovery. The European Union is not responsible for any use that may be made of the information contained within this document.
K22: Full Chain Process Flow Diagrams
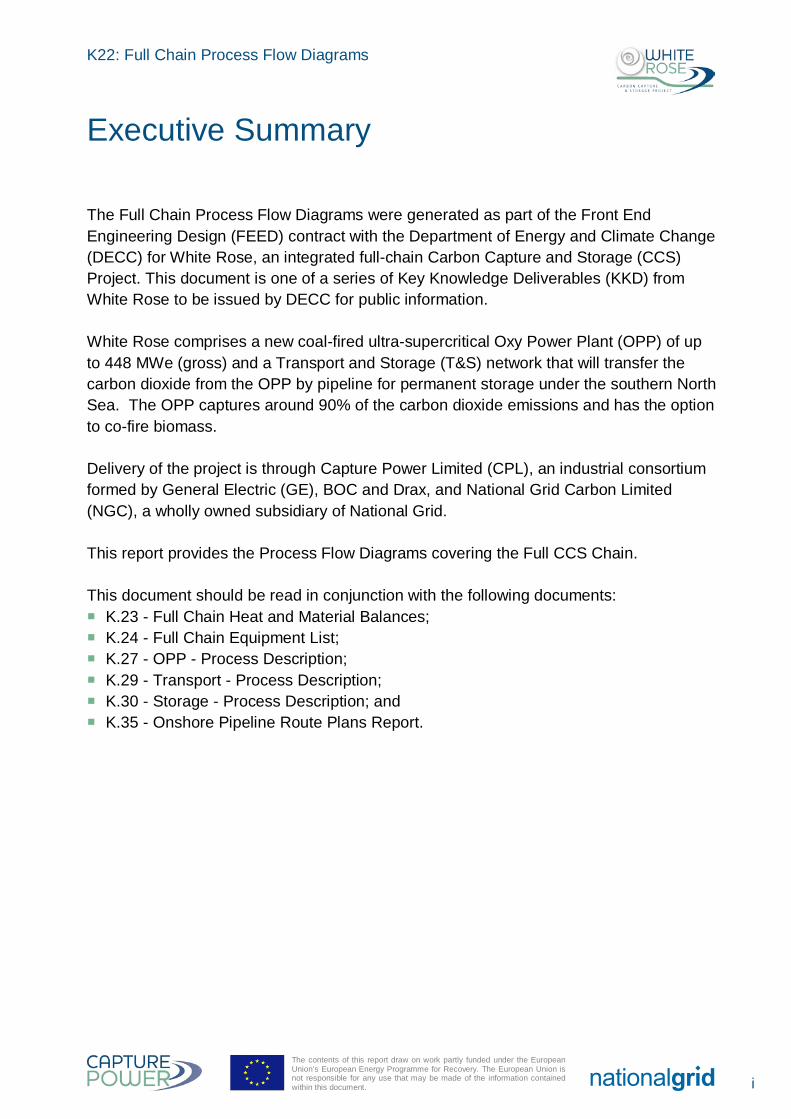
The Full Chain Process Flow Diagrams were generated as part of the Front End Engineering Design (FEED) contract with the Department of Energy and Climate Change (DECC) for White Rose, an integrated full-chain Carbon Capture and Storage (CCS) Project. This document is one of a series of Key Knowledge Deliverables (KKD) from White Rose to be issued by DECC for public information.
White Rose comprises a new coal-fired ultra-supercritical Oxy Power Plant (OPP) of up to 448 MWe (gross) and a Transport and Storage (T&S) network that will transfer the carbon dioxide from the OPP by pipeline for permanent storage under the southern North Sea. The OPP captures around 90% of the carbon dioxide emissions and has the option to co-fire biomass.
Delivery of the project is through Capture Power Limited (CPL), an industrial consortium formed by General Electric (GE), BOC and Drax, and National Grid Carbon Limited (NGC), a wholly owned subsidiary of National Grid.
This report provides the Process Flow Diagrams covering the Full CCS Chain.
This document should be read in conjunction with the following documents: K.23 - Full Chain Heat and Material Balances; K.24 - Full Chain Equipment List; K.27 - OPP - Process Description; K.29 - Transport - Process Description; K.30 - Storage - Process Description; and K.35 - Onshore Pipeline Route Plans Report.
Executive Summary
i
The contents of this report draw on work partly funded under the European Union’s European Energy Programme for Recovery. The European Union is not responsible for any use that may be made of the information contained within this document.
K22: Full Chain Process Flow Diagrams
1.1 Background
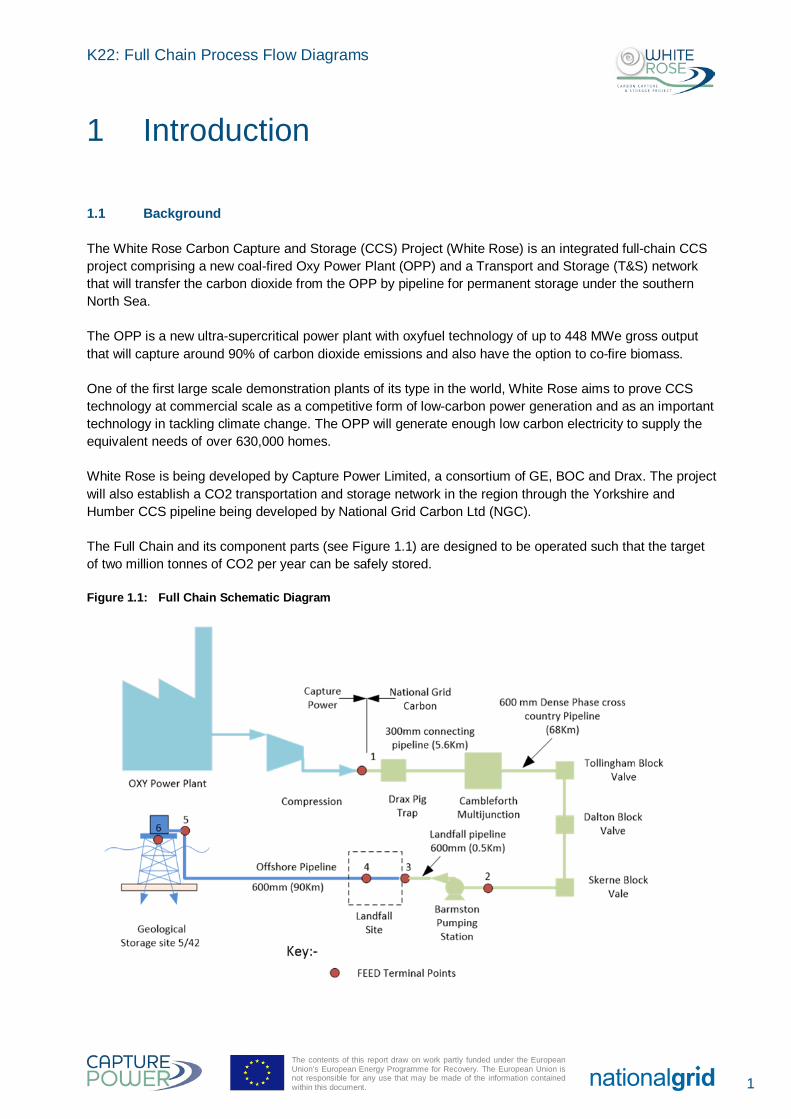
The White Rose Carbon Capture and Storage (CCS) Project (White Rose) is an integrated full-chain CCS project comprising a new coal-fired Oxy Power Plant (OPP) and a Transport and Storage (T&S) network that will transfer the carbon dioxide from the OPP by pipeline for permanent storage under the southern North Sea.
The OPP is a new ultra-supercritical power plant with oxyfuel technology of up to 448 MWe gross output that will capture around 90% of carbon dioxide emissions and also have the option to co-fire biomass.
One of the first large scale demonstration plants of its type in the world, White Rose aims to prove CCS technology at commercial scale as a competitive form of low-carbon power generation and as an important technology in tackling climate change. The OPP will generate enough low carbon electricity to supply the equivalent needs of over 630,000 homes.
White Rose is being developed by Capture Power Limited, a consortium of GE, BOC and Drax. The project will also establish a CO2 transportation and storage network in the region through the Yorkshire and Humber CCS pipeline being developed by National Grid Carbon Ltd (NGC).
The Full Chain and its component parts (see Figure 1.1) are designed to be operated such that the target of two million tonnes of CO2 per year can be safely stored.
Figure 1.1: Full Chain Schematic Diagram
1 Introduction
1
The contents of this report draw on work partly funded under the European Union’s European Energy Programme for Recovery. The European Union is not responsible for any use that may be made of the information contained within this document.

K22: Full Chain Process Flow Diagrams
2 Process Flow Diagrams
2
The contents of this report draw on work partly funded under the European Union’s European Energy Programme for Recovery. The European Union is not responsible for any use that may be made of the information contained within this document.
K22: Full Chain Process Flow Diagrams
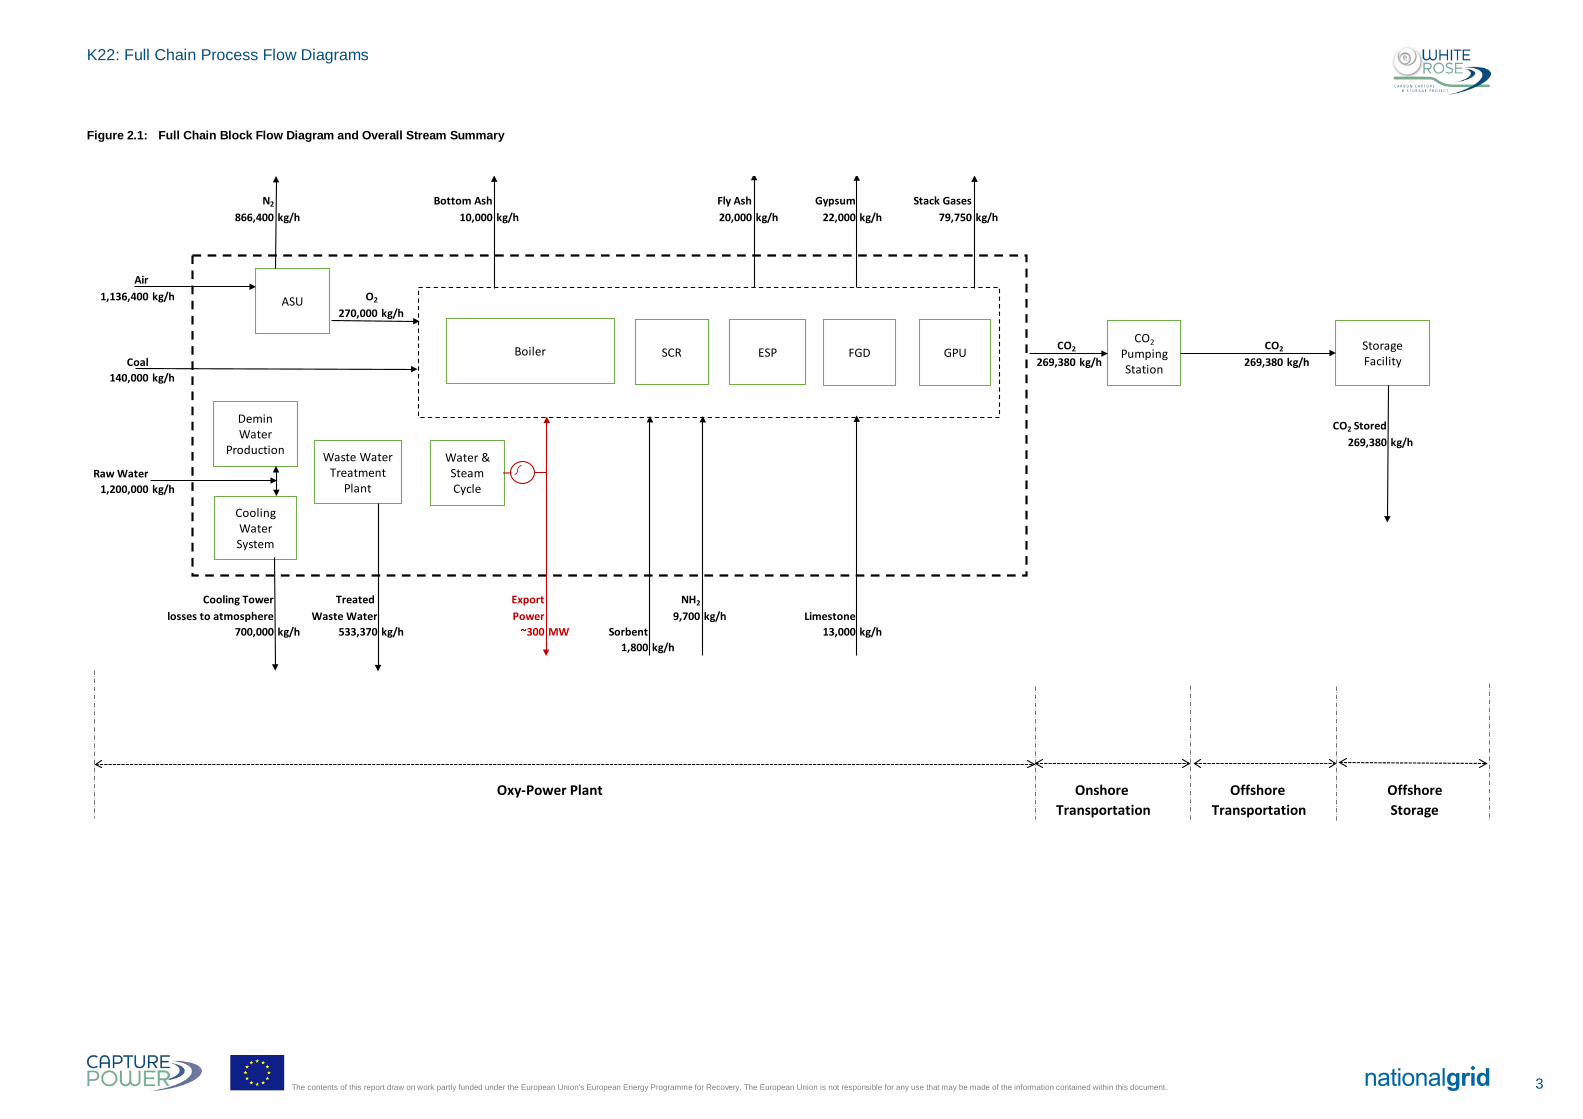
Figure 2.1: Full Chain Block Flow Diagram and Overall Stream Summary
N2 Bottom Ash Fly Ash Gypsum Stack Gases866,400 kg/h 10,000 kg/h 20,000 kg/h 22,000 kg/h 79,750 kg/h
Air1,136,400 kg/h O2
270,000 kg/h
CO2 CO2
Coal 269,380 kg/h 269,380 kg/h140,000 kg/h
CO2 Stored269,380 kg/h
Raw Water1,200,000 kg/h
Cooling Tower Treated Export NH2
losses to atmosphere Waste Water Power 9,700 kg/h Limestone700,000 kg/h 533,370 kg/h ~300 MW Sorbent 13,000 kg/h
1,800 kg/h
Oxy-Power Plant Onshore Offshore OffshoreTransportation Transportation Storage
Boiler SCR ESP GPUFGD
ASU
Demin Water
Production Waste Water Treatment
Plant
Cooling Water System
CO2Pumping Station
Storage Facility
Water & Steam Cycle
3 The contents of this report draw on work partly funded under the European Union’s European Energy Programme for Recovery. The European Union is not responsible for any use that may be made of the information contained within this document.
K22: Full Chain Process Flow Diagrams
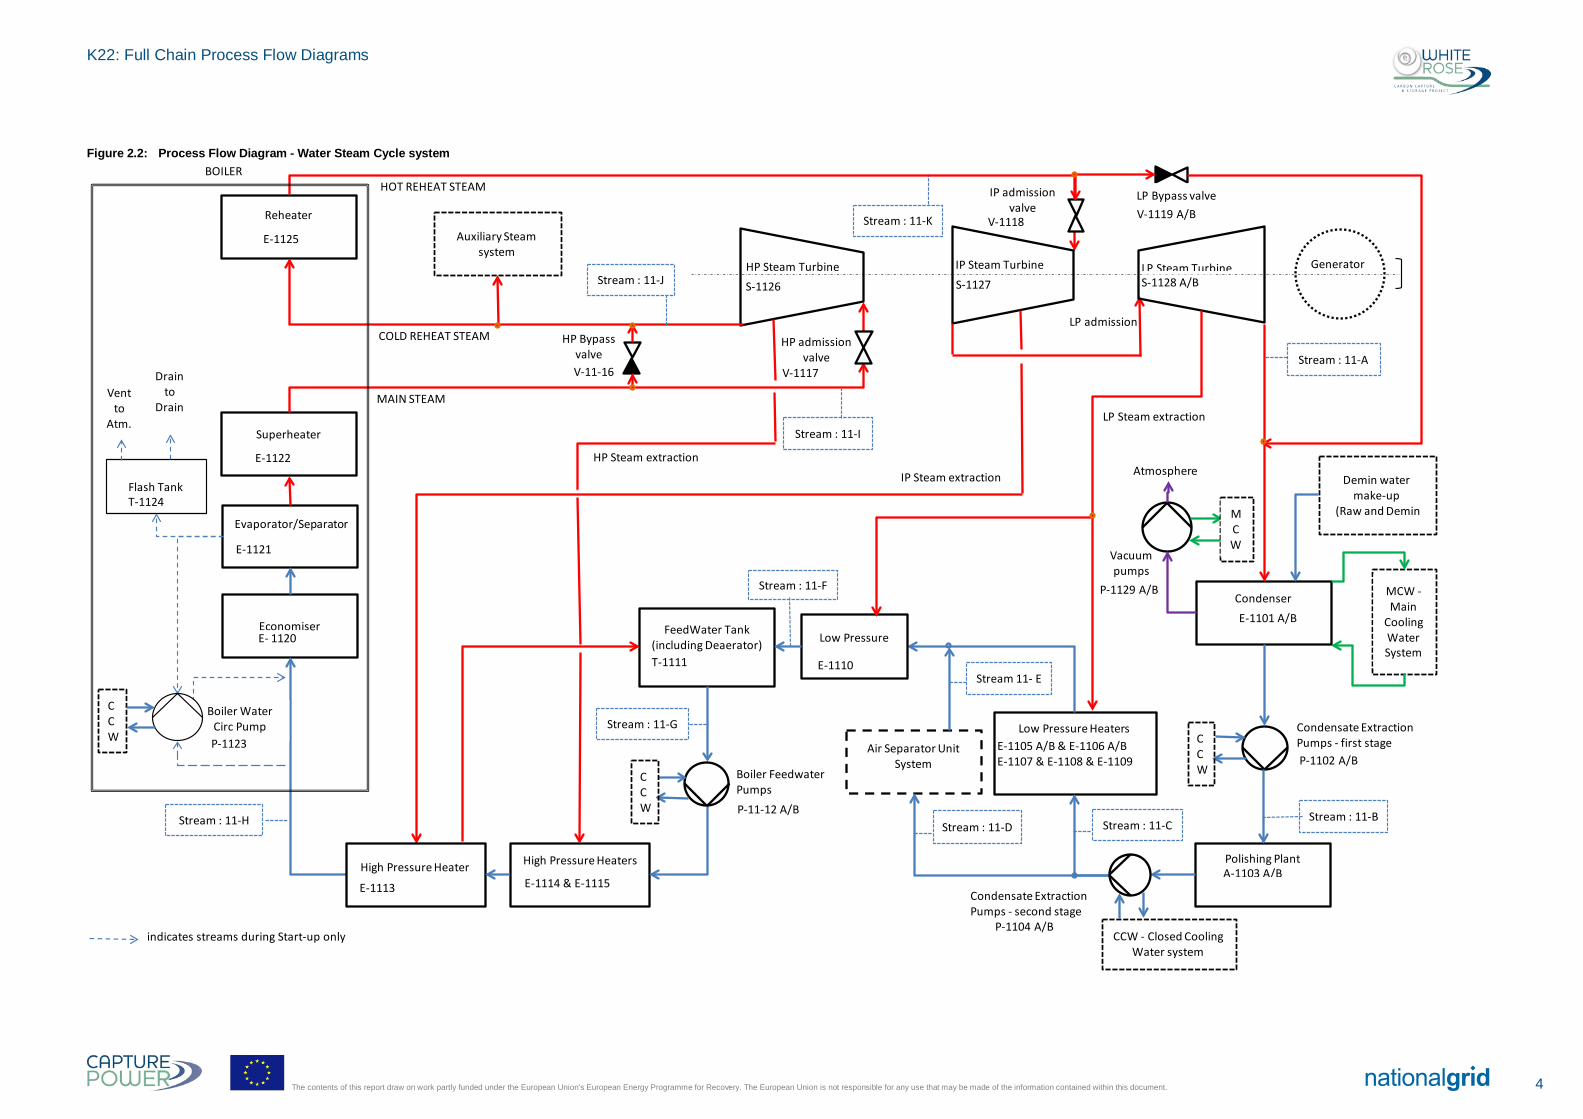
Figure 2.2: Process Flow Diagram - Water Steam Cycle system
BOILER
indicates streams during Start-up only
Stream : 11-K
HP admission valve
Condensate ExtractionPumps - second stage
Boiler FeedwaterPumps
HP Steam Turbine IP Steam Turbine LP Steam Turbine Generator
HP Bypass valve
LP Bypass valveIP admission valve
S-1126 S-1127
V-11-16
Vacuum pumps
S-1128 A/B
MAIN STEAM
COLD REHEAT STEAM
HOT REHEAT STEAM
LP admission
Atmosphere
EconomiserE- 1120
Evaporator/Separator
E-1121
Superheater
E-1122
Reheater
E-1125
High Pressure Heaters
E-1114 & E-1115
FeedWater Tank (including Deaerator)T-1111
Low Pressure Heaters E-1105 A/B & E-1106 A/BE-1107 & E-1108 & E-1109
Air Separator Unit System
Polishing PlantA-1103 A/B
P-1102 A/B
CondenserE-1101 A/B
P-1129 A/B
P-1104 A/B
P-11-12 A/B
Condensate ExtractionPumps - first stage
MCW -Main
Cooling Water System
V-1117
V-1118 V-1119 A/B
Stream : 11-A
Stream : 11-B
Stream 11- E
Stream : 11-D Stream : 11-C
Stream : 11-F
Stream : 11-H
Stream : 11-I
Stream : 11-G
Flash TankT-1124
Boiler Water Circ Pump
Vent to
Atm.
Drain to
Drain
P-1123
Stream : 11-J
HP Steam extraction
IP Steam extraction
LP Steam extraction
Low Pressure
E-1110
Auxiliary Steam system
High Pressure Heater
E-1113
MCW
CCW
CCW - Closed Cooling Water system
Demin water make-up
(Raw and Demin
CCW
CCW
4 The contents of this report draw on work partly funded under the European Union’s European Energy Programme for Recovery. The European Union is not responsible for any use that may be made of the information contained within this document.
K22: Full Chain Process Flow Diagrams
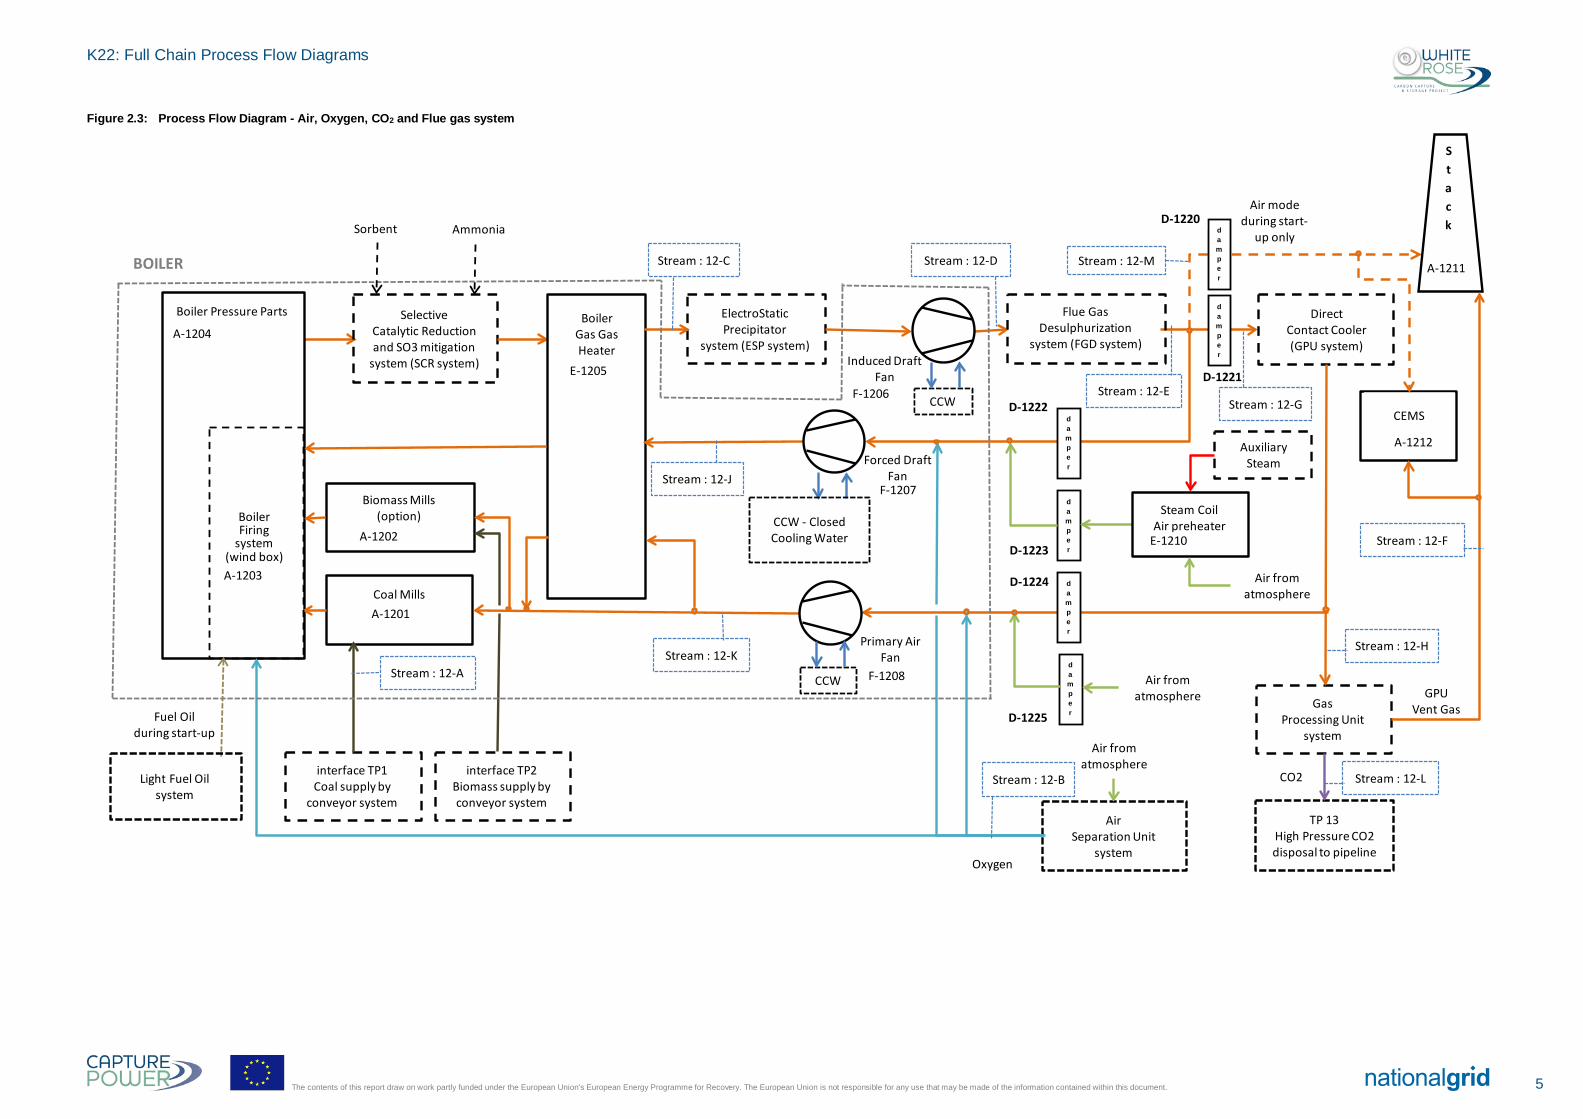
Figure 2.3: Process Flow Diagram - Air, Oxygen, CO2 and Flue gas system
Fuel Oil during start-up
Sorbent
BOILER
Ammonia
GPUVent Gas
Boiler Pressure Parts
A-1203
SelectiveCatalytic Reduction and SO3 mitigation
system (SCR system)
ElectroStatic Precipitator
system (ESP system)
Flue Gas Desulphurization
system (FGD system)
DirectContact Cooler (GPU system)
Stack
A-1211
GasProcessing Unit
system
TP 13High Pressure CO2 disposal to pipeline
Coal MillsA-1201
interface TP1Coal supply by
conveyor system
interface TP2Biomass supply by conveyor system
Boiler Gas GasHeater
E-1205
F-1207
Forced Draft Fan
Induced Draft Fan
F-1206
F-1208
Primary AirFan
damper
damper
damper
damper
Air from atmosphere
damper
Air from atmosphere
damper
AirSeparation Unit
system
Air from atmosphere
D-1223
D-1222
D-1221
D-1220
D-1225
D-1224
Steam CoilAir preheater
E-1210
BoilerFiring
system(wind box)
Oxygen
CO2
CEMS
A-1212
Stream : 12-K
Stream : 12-C Stream : 12-D
Stream : 12-H
Stream : 12-F
Stream : 12-B
Stream : 12-M
Stream : 12-E
Stream : 12-J
Stream : 12-G
Stream : 12-L
Biomass Mills(option)
A-1202
Light Fuel Oil system
A-1204
Auxiliary Steam
Air modeduring start-
up only
CCW
CCW
CCW - Closed Cooling Water
Stream : 12-A
5 The contents of this report draw on work partly funded under the European Union’s European Energy Programme for Recovery. The European Union is not responsible for any use that may be made of the information contained within this document.
K22: Full Chain Process Flow Diagrams
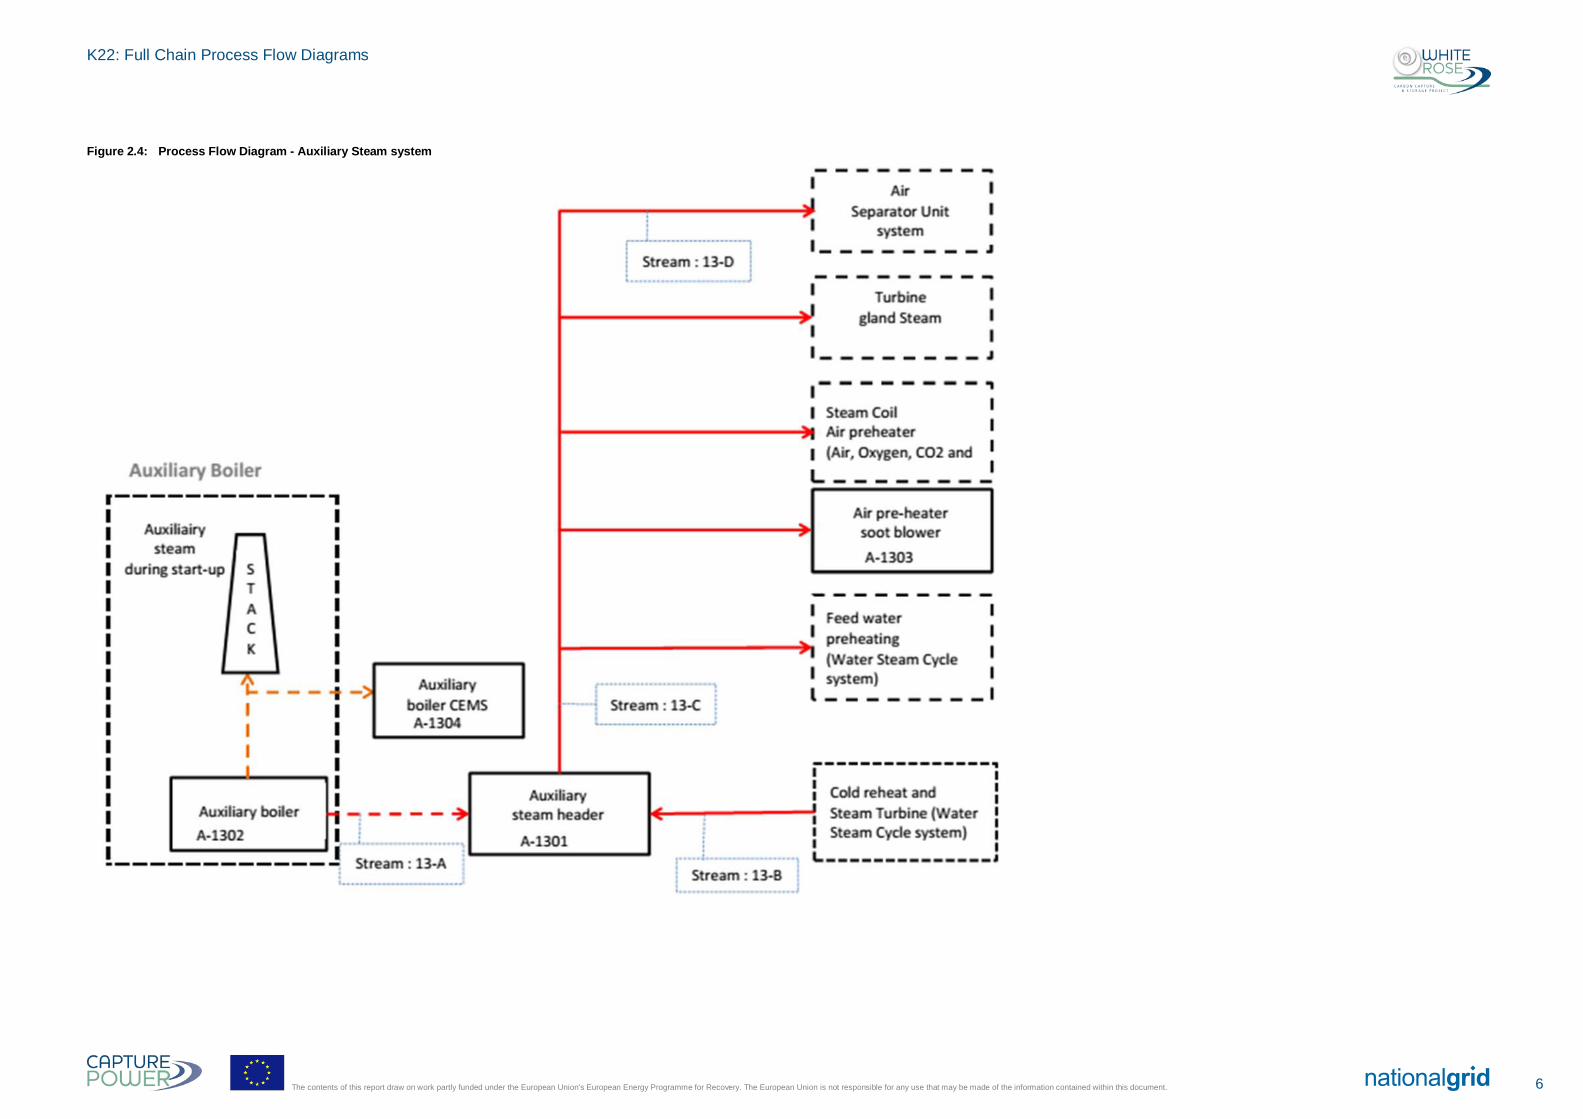
Figure 2.4: Process Flow Diagram - Auxiliary Steam system
6 The contents of this report draw on work partly funded under the European Union’s European Energy Programme for Recovery. The European Union is not responsible for any use that may be made of the information contained within this document.
K22: Full Chain Process Flow Diagrams
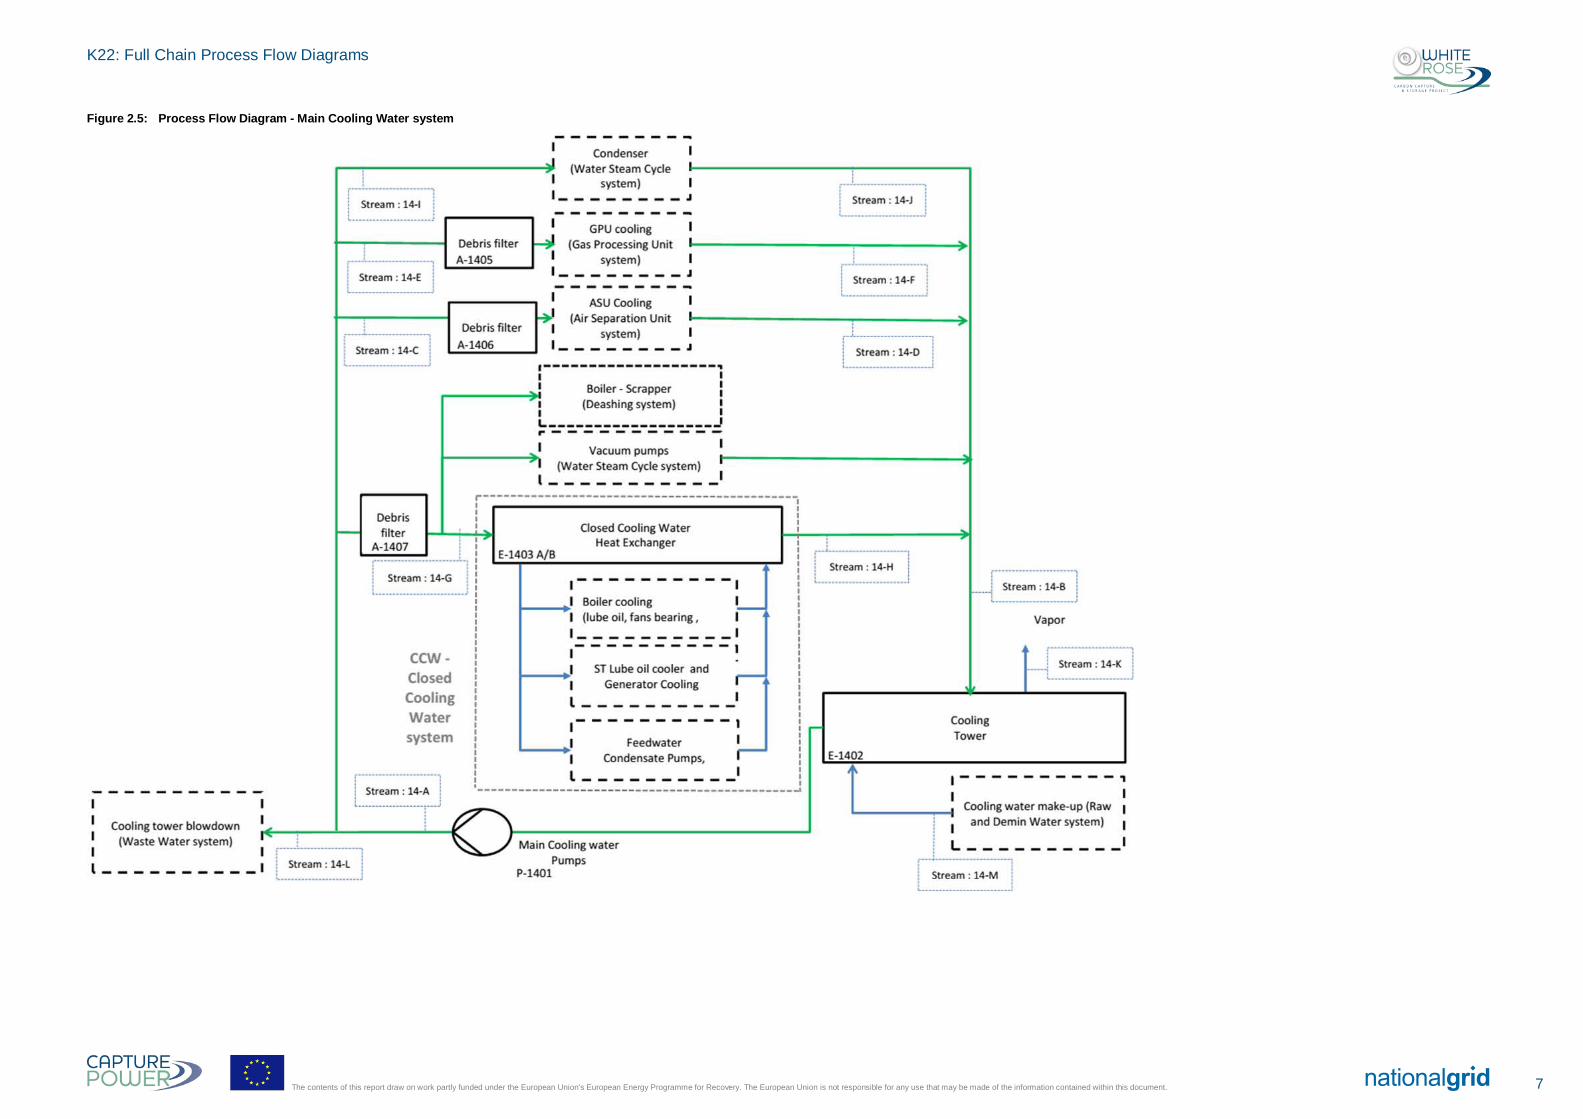
Figure 2.5: Process Flow Diagram - Main Cooling Water system
7 The contents of this report draw on work partly funded under the European Union’s European Energy Programme for Recovery. The European Union is not responsible for any use that may be made of the information contained within this document.
K22: Full Chain Process Flow Diagrams
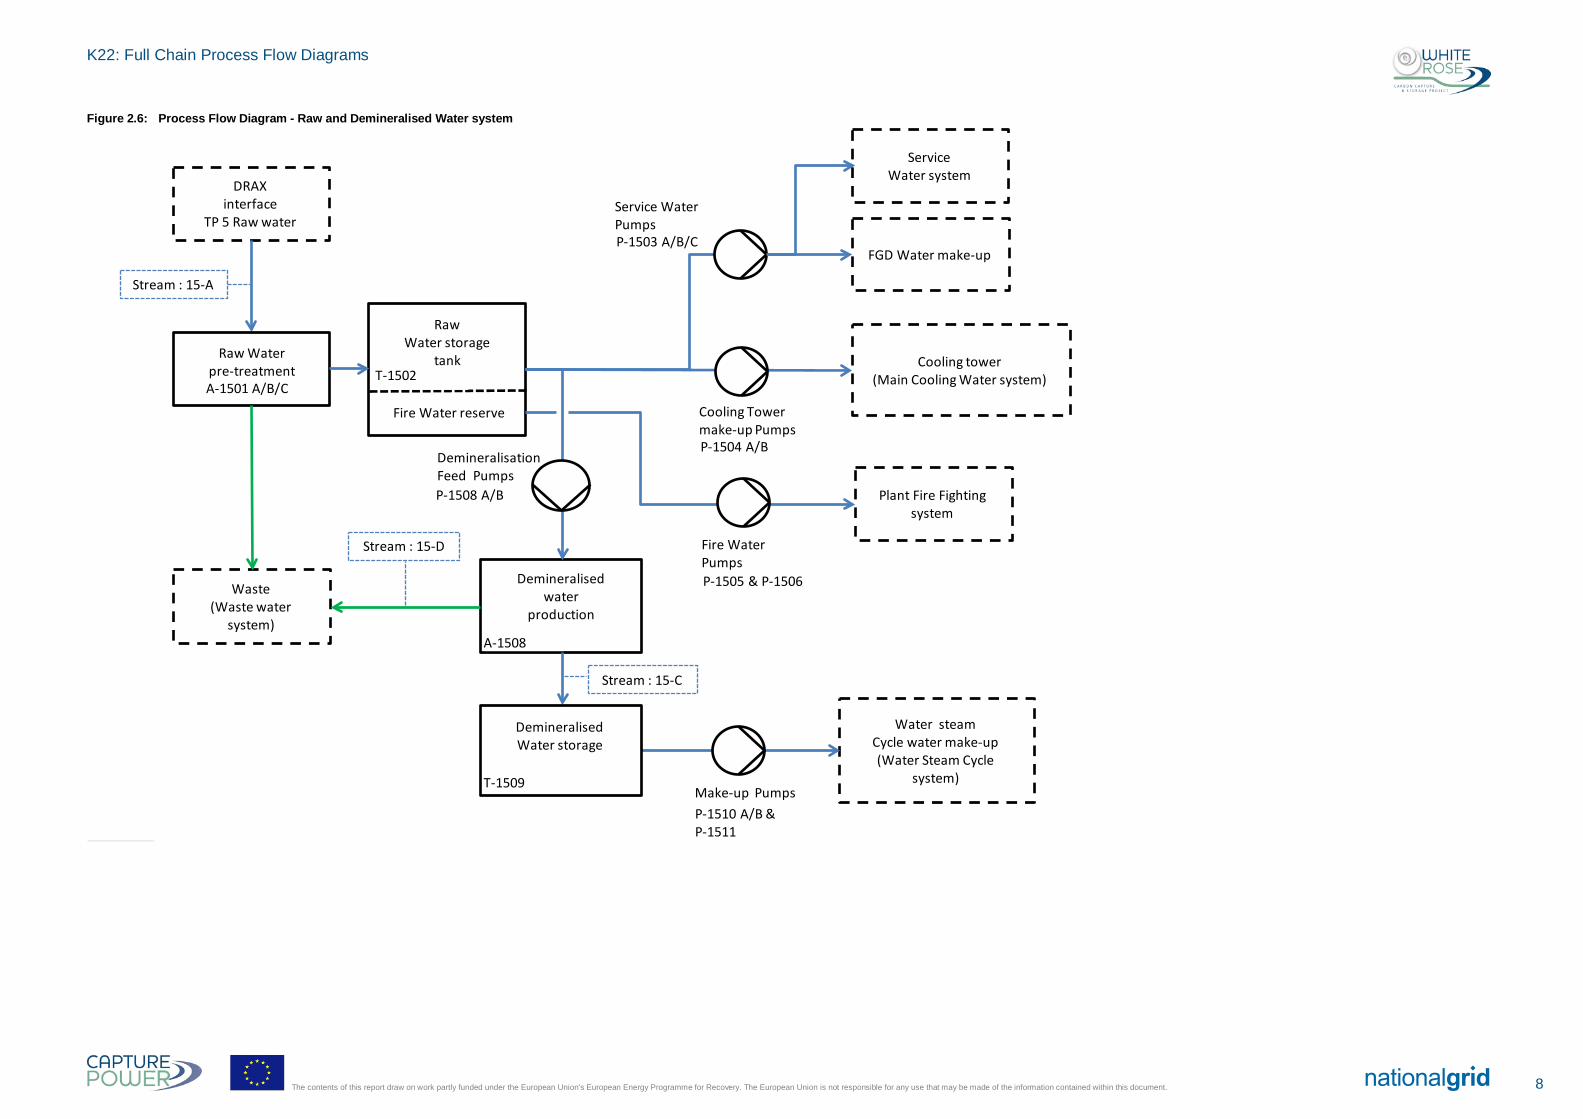
Figure 2.6: Process Flow Diagram - Raw and Demineralised Water system
Demineralisation Feed Pumps
Service Water Pumps
Demineralisedwater
production
DRAXinterface
TP 5 Raw water
Water steamCycle water make-up(Water Steam Cycle
system)
Raw Waterpre-treatment
RawWater storage
tank
DemineralisedWater storage
FGD Water make-up
Stream : 15-A
Stream : 15-C
Stream : 15-D
Fire Water reserve
Plant Fire Fighting system
P-1503 A/B/C
Cooling Tower make-up PumpsP-1504 A/B
Cooling tower(Main Cooling Water system)
Fire Water PumpsP-1505 & P-1506
P-1508 A/B
Waste(Waste water
system)
Make-up PumpsP-1510 A/B &P-1511
A-1501 A/B/CT-1502
A-1508
T-1509
ServiceWater system
8 The contents of this report draw on work partly funded under the European Union’s European Energy Programme for Recovery. The European Union is not responsible for any use that may be made of the information contained within this document.
K22: Full Chain Process Flow Diagrams
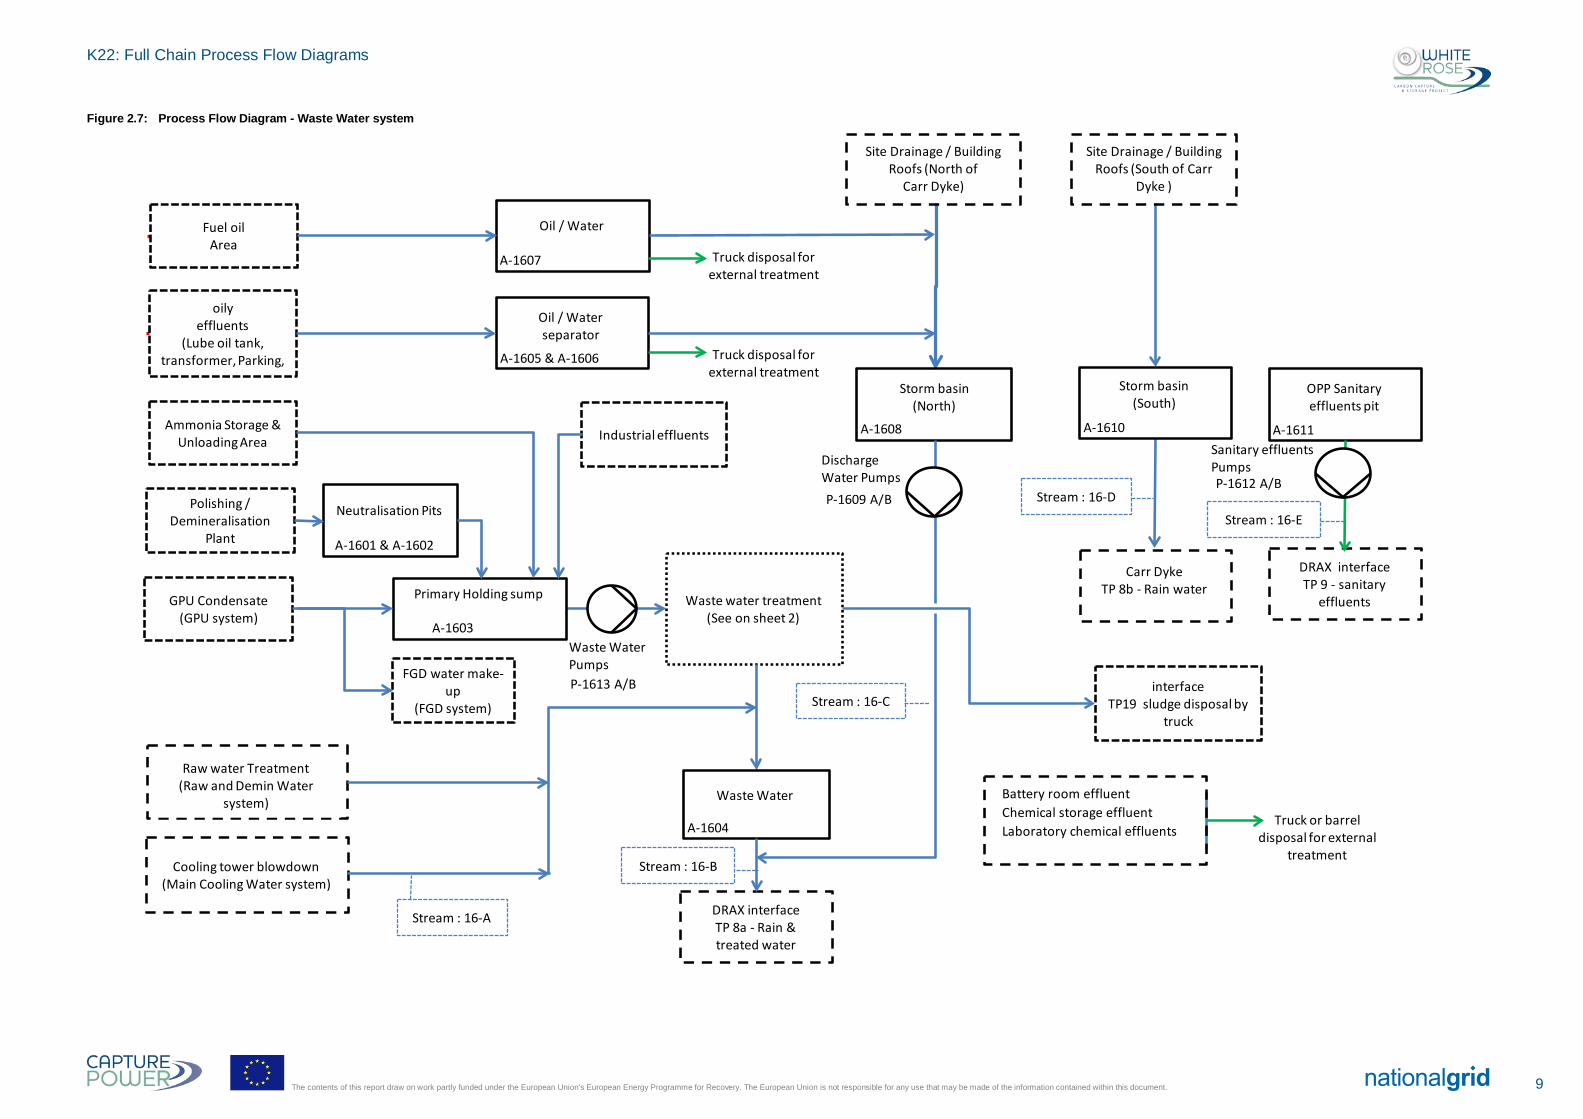
Figure 2.7: Process Flow Diagram - Waste Water system
Battery room effluentChemical storage effluentLaboratory chemical effluents
Storm basin(North)
Cooling tower blowdown(Main Cooling Water system)
Ammonia Storage & Unloading Area
Polishing / Demineralisation
Plant
oilyeffluents
(Lube oil tank, transformer, Parking,
Oil / Waterseparator
DRAX interfaceTP 8a - Rain & treated water
DRAX interfaceTP 9 - sanitary
effluents
Truck or barrel disposal for external
treatment
Neutralisation Pits
Waste water treatment(See on sheet 2)
Fuel oilArea
Oil / Water
interfaceTP19 sludge disposal by
truck
Stream : 16-B
Stream : 16-D
Stream : 16-E
Stream : 16-A
Carr DykeTP 8b - Rain water
Site Drainage / Building Roofs (North of
Carr Dyke)
Site Drainage / Building Roofs (South of Carr
Dyke )
Primary Holding sumpGPU Condensate(GPU system)
FGD water make-up
(FGD system)
Waste Water
Raw water Treatment(Raw and Demin Water
system)
Industrial effluents
A-1601 & A-1602
A-1603
A-1604
A-1605 & A-1606
A-1607 Truck disposal for external treatment
Truck disposal for external treatment
A-1608 A-1610
P-1609 A/B
Discharge Water Pumps
Sanitary effluents Pumps
OPP Sanitaryeffluents pit
Storm basin(South)
A-1611
P-1612 A/B
Waste Water PumpsP-1613 A/B
Stream : 16-C
9 The contents of this report draw on work partly funded under the European Union’s European Energy Programme for Recovery. The European Union is not responsible for any use that may be made of the information contained within this document.
K22: Full Chain Process Flow Diagrams
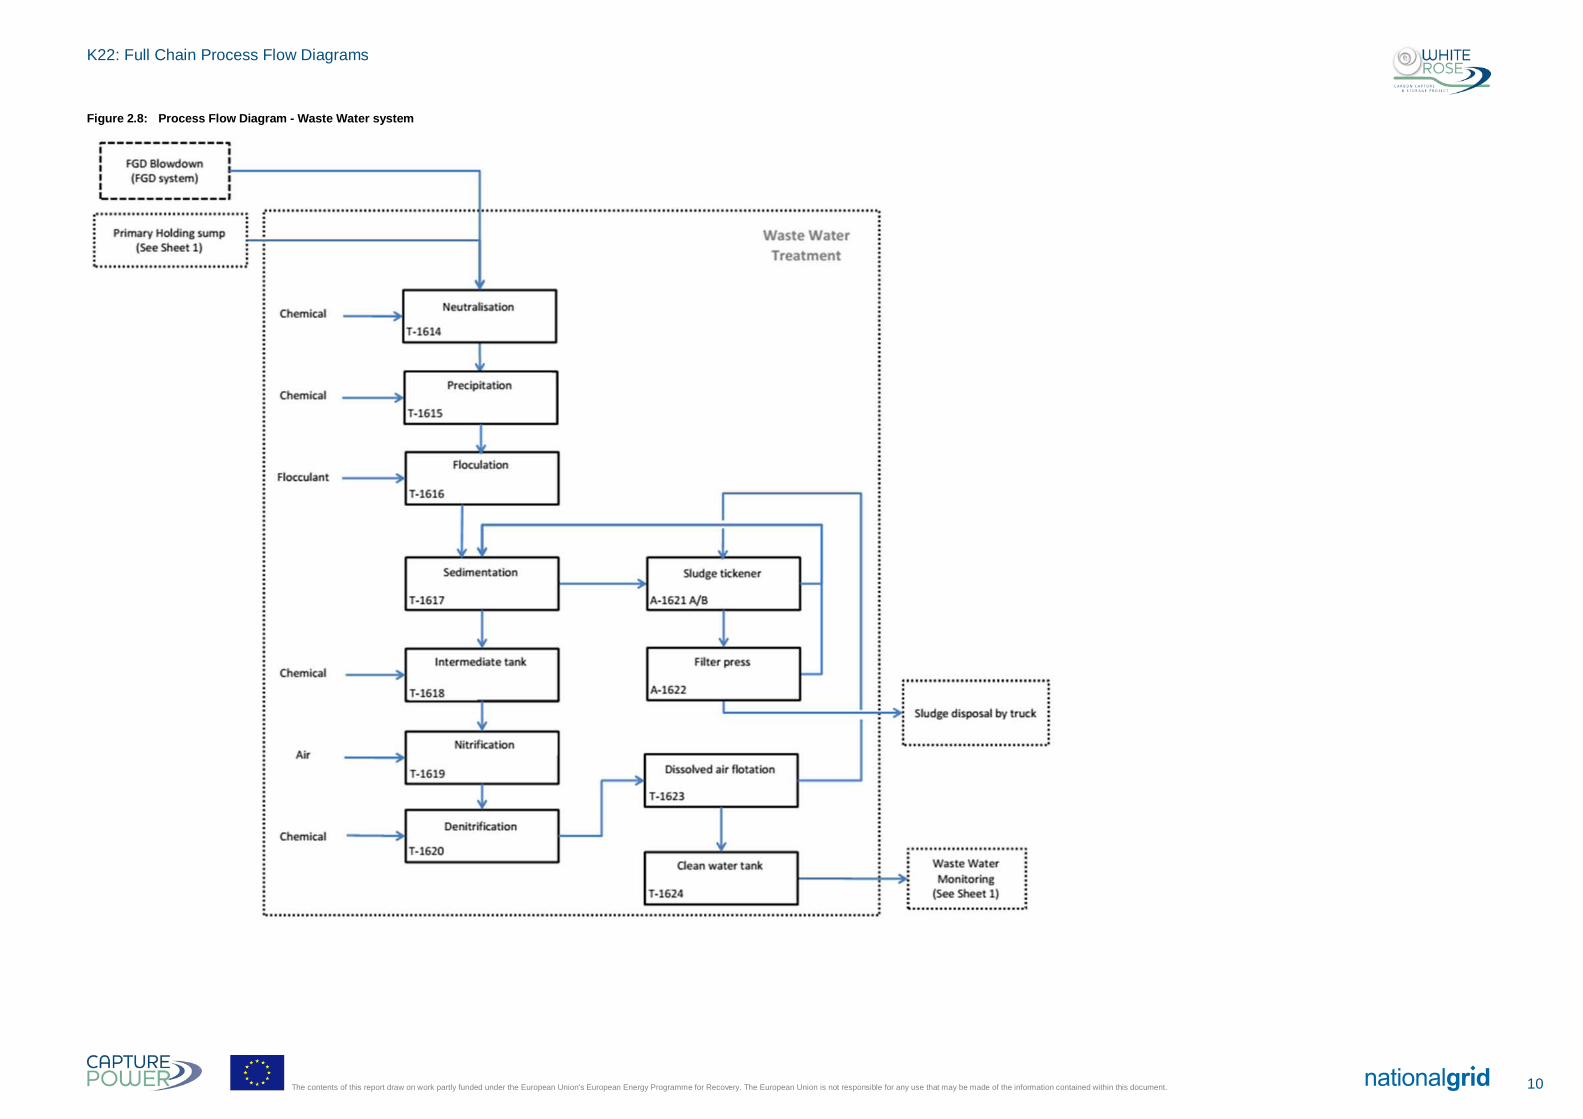
Figure 2.8: Process Flow Diagram - Waste Water system
10 The contents of this report draw on work partly funded under the European Union’s European Energy Programme for Recovery. The European Union is not responsible for any use that may be made of the information contained within this document.
K22: Full Chain Process Flow Diagrams
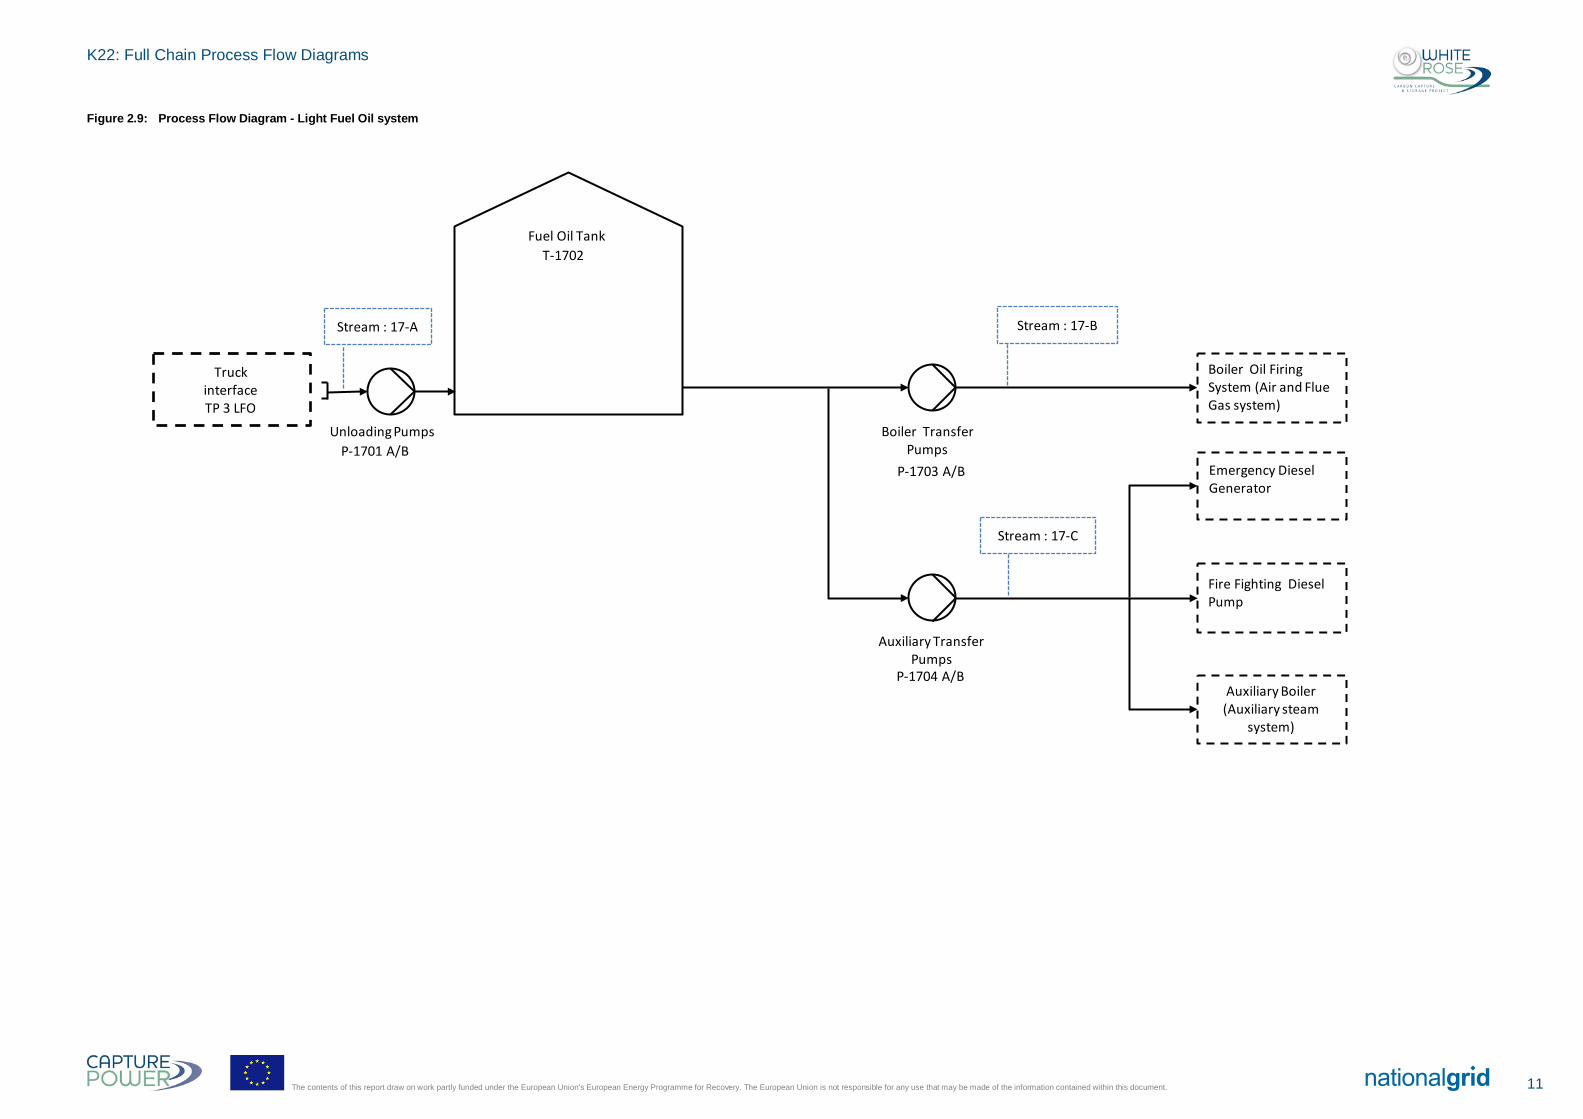
Figure 2.9: Process Flow Diagram - Light Fuel Oil system
Unloading Pumps
Fuel Oil Tank
Boiler Oil Firing System (Air and Flue Gas system)
Emergency Diesel Generator
Fire Fighting Diesel Pump
Auxiliary Boiler(Auxiliary steam
system)
Boiler Transfer Pumps
Auxiliary Transfer Pumps
TruckinterfaceTP 3 LFO
Stream : 17-BStream : 17-A
Stream : 17-C
P-1701 A/B
T-1702
P-1703 A/B
P-1704 A/B
11 The contents of this report draw on work partly funded under the European Union’s European Energy Programme for Recovery. The European Union is not responsible for any use that may be made of the information contained within this document.
K22: Full Chain Process Flow Diagrams
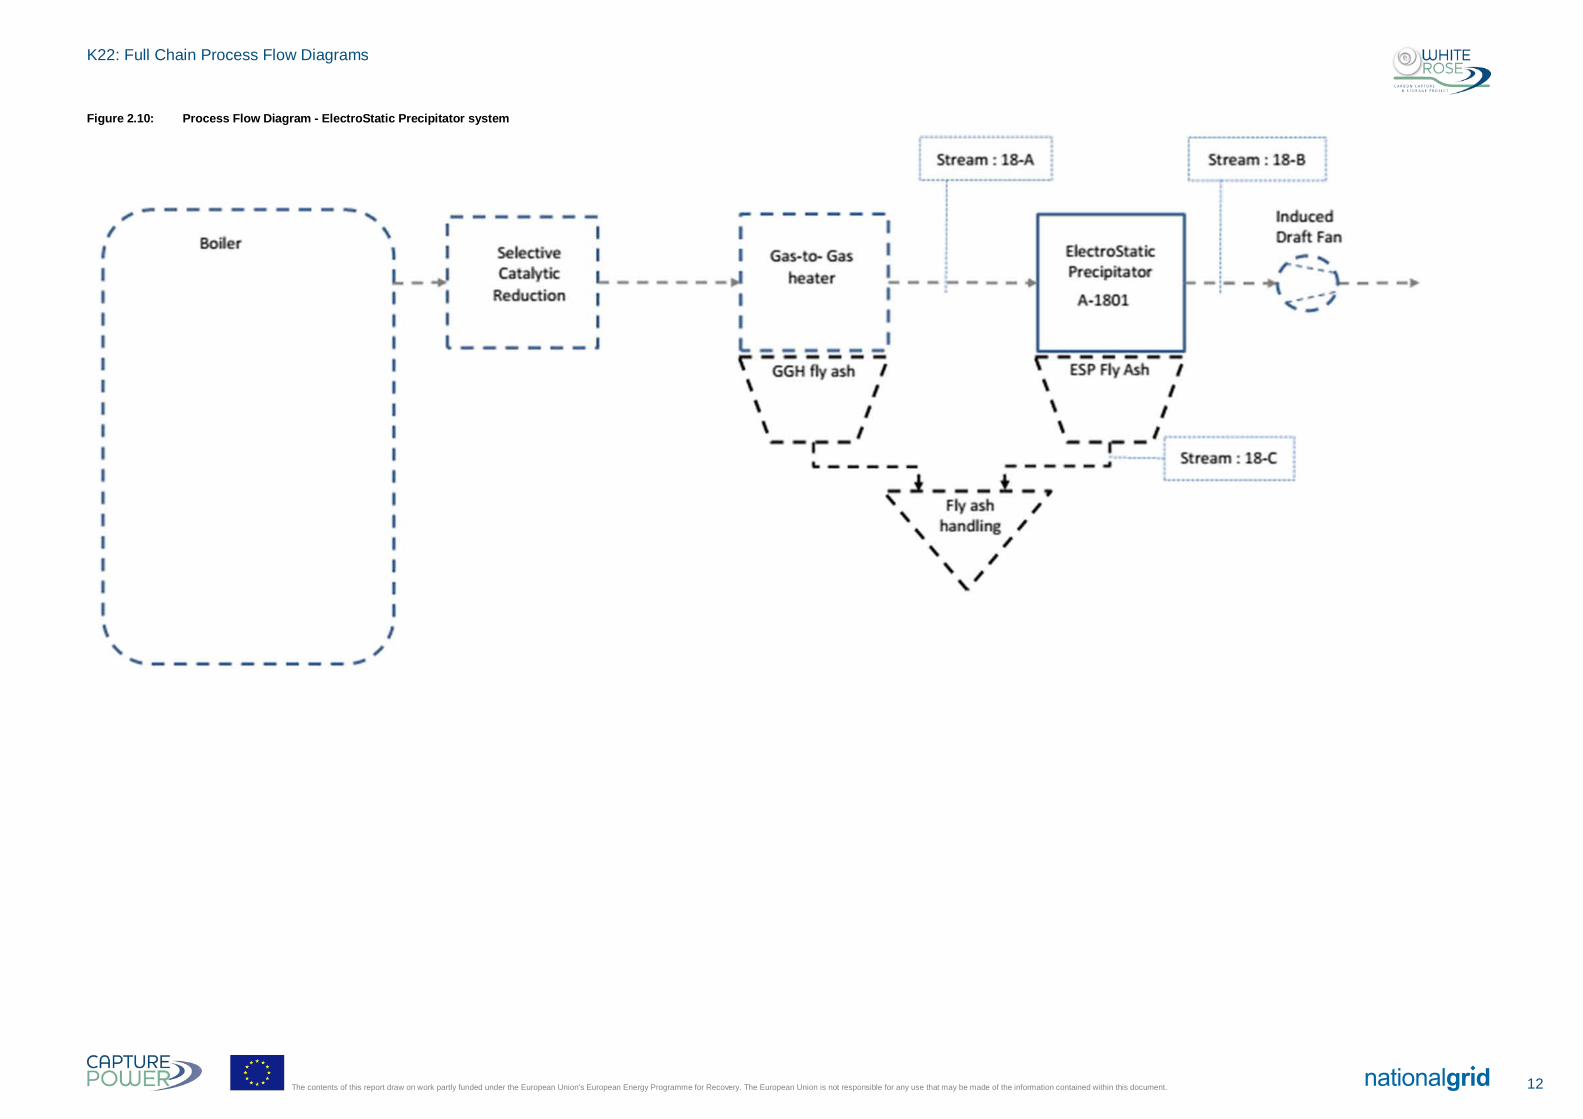
Figure 2.10: Process Flow Diagram - ElectroStatic Precipitator system
12 The contents of this report draw on work partly funded under the European Union’s European Energy Programme for Recovery. The European Union is not responsible for any use that may be made of the information contained within this document.
K22: Full Chain Process Flow Diagrams
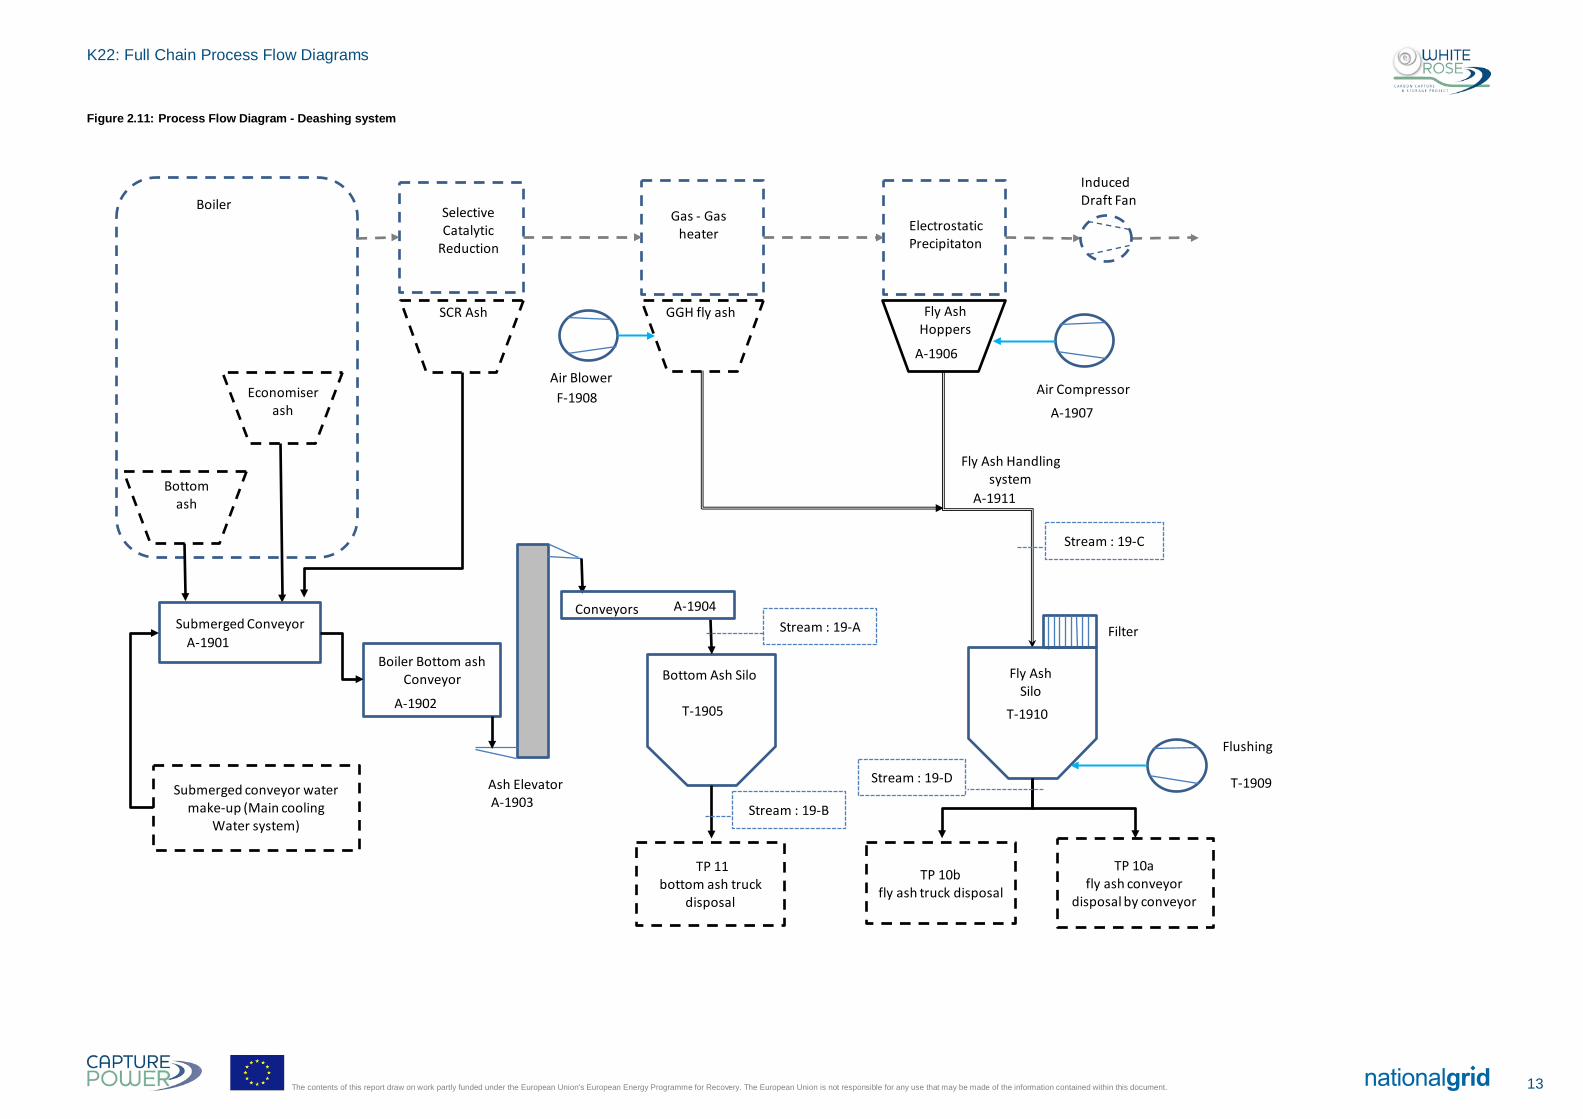
Figure 2.11: Process Flow Diagram - Deashing system
Boiler
Bottomash
Economiserash
SCR Ash
Selective Catalytic
Reduction
Gas - Gas heater Electrostatic
Precipitaton
Fly Ash Hoppers
Induced Draft Fan
Air Compressor
Filter
Fly AshSilo
Bottom Ash Silo
Flushing
Ash Elevator
Conveyors
GGH fly ash
TP 11bottom ash truck
disposal
TP 10bfly ash truck disposal
TP 10afly ash conveyor
disposal by conveyor
Air Blower
Stream : 19-C
Stream : 19-A
Stream : 19-B
Stream : 19-D
Submerged Conveyor
Submerged conveyor water make-up (Main cooling
Water system)
Boiler Bottom ash Conveyor
A-1901
A-1902
A-1903
A-1904
T-1905
A-1906
A-1907F-1908
T-1910
T-1909
Fly Ash Handling system
A-1911
13 The contents of this report draw on work partly funded under the European Union’s European Energy Programme for Recovery. The European Union is not responsible for any use that may be made of the information contained within this document.
K22: Full Chain Process Flow Diagrams
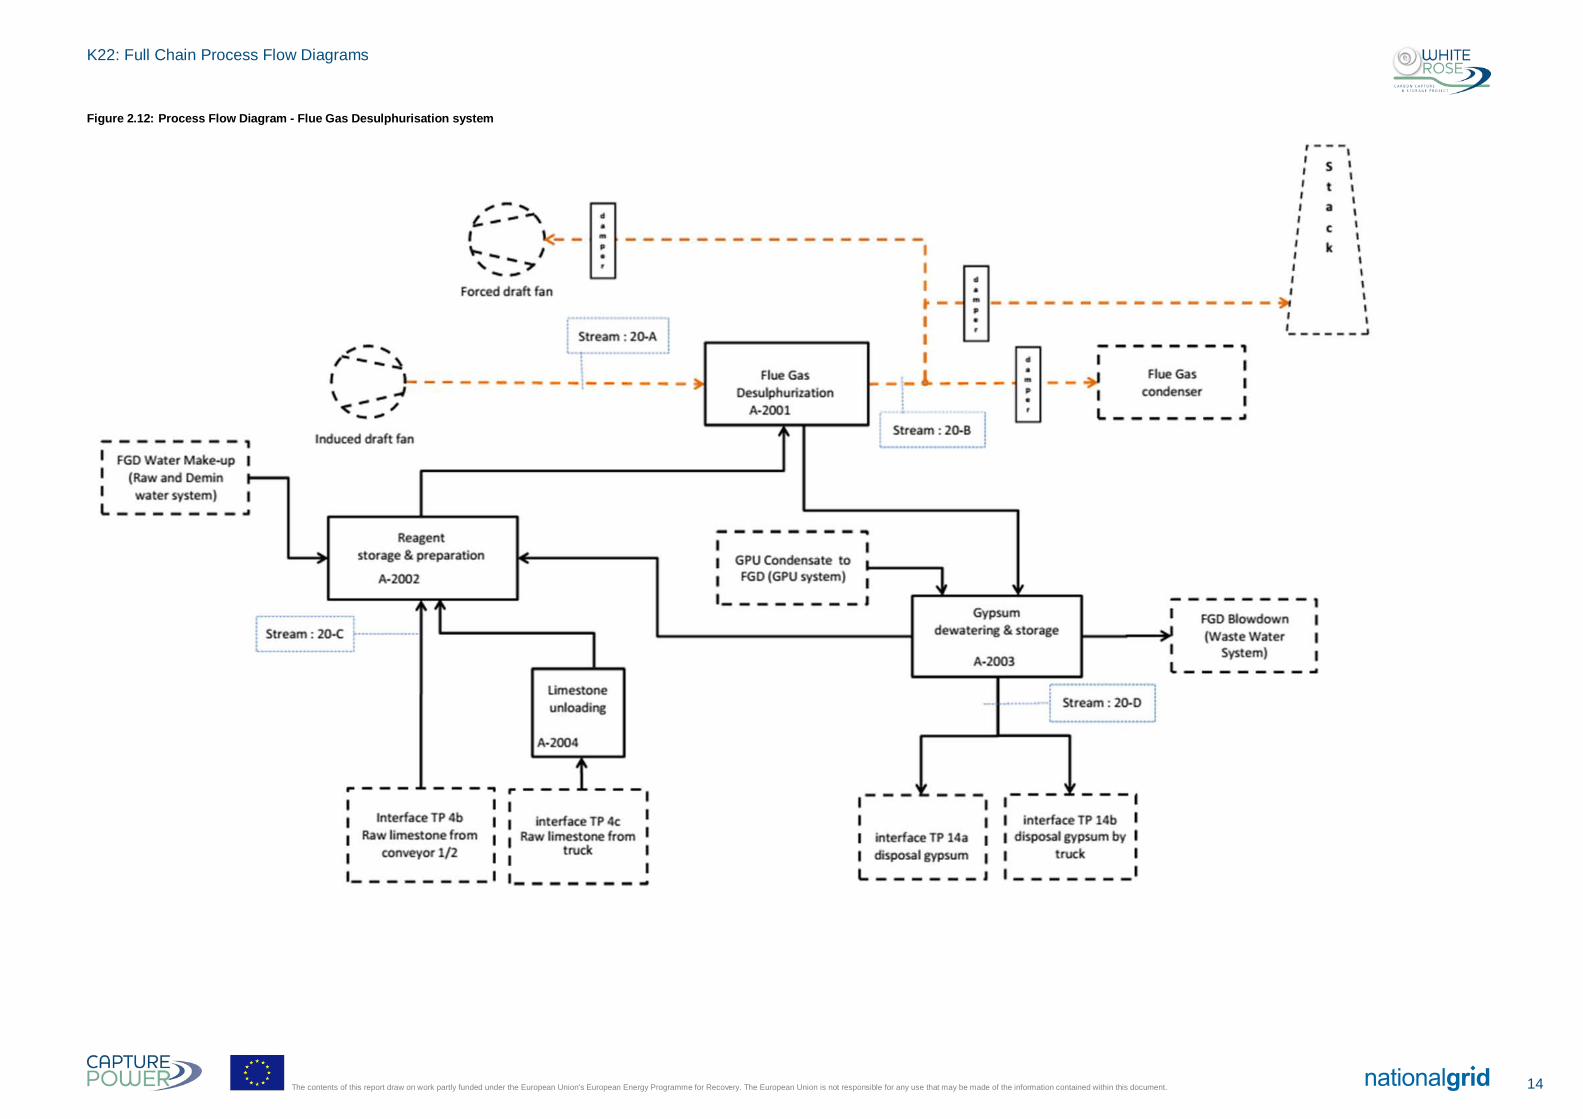
Figure 2.12: Process Flow Diagram - Flue Gas Desulphurisation system
14 The contents of this report draw on work partly funded under the European Union’s European Energy Programme for Recovery. The European Union is not responsible for any use that may be made of the information contained within this document.
K22: Full Chain Process Flow Diagrams
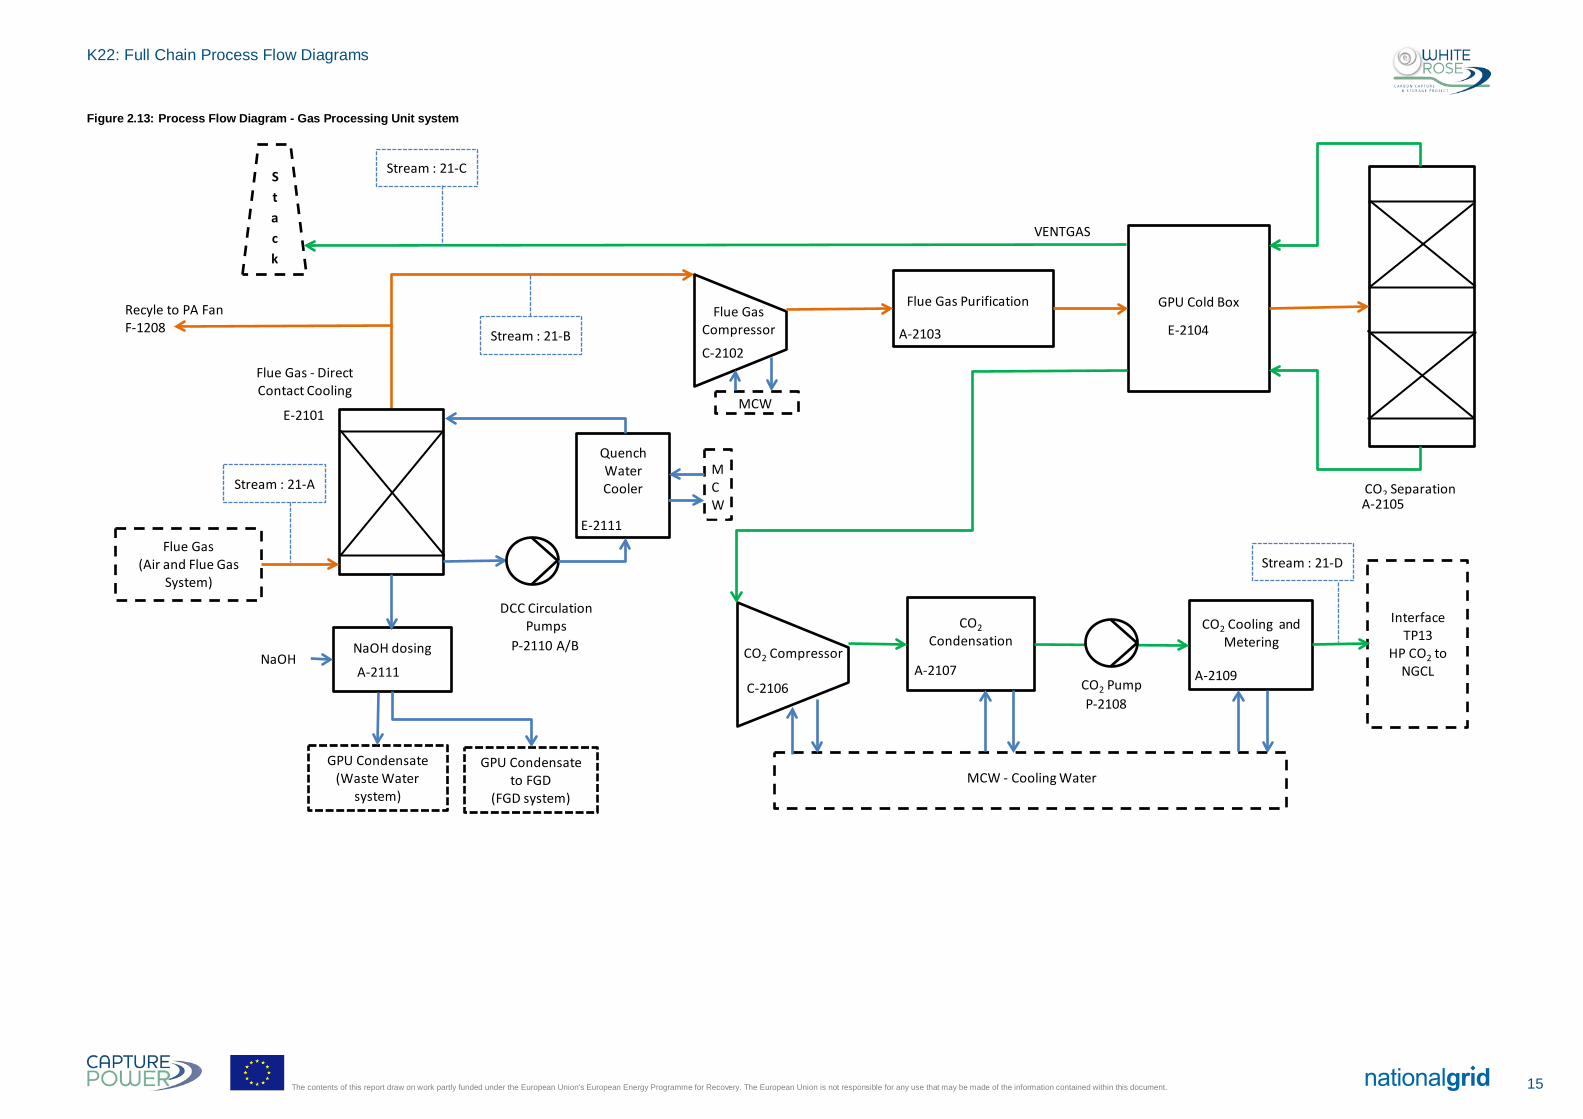
Figure 2.13: Process Flow Diagram - Gas Processing Unit system
C-2102
Flue Gas Compressor
Flue Gas Purification GPU Cold Box
E-2104
CO2 Cooling and Metering
A-2109
NaOH dosing
A-2111
E-2101
Flue Gas(Air and Flue Gas
System)
CO2Condensation
A-2107
GPU Condensate(Waste Water
system)
NaOH
Flue Gas - Direct Contact Cooling
MCW
C-2106
CO2 Compressor
MCW - Cooling Water
Stack
Interface TP13
HP CO2 to NGCL
CO2 SeparationA-2105
A-2103
CO2 PumpP-2108
VENTGAS
GPU Condensate to FGD
(FGD system)
QuenchWater Cooler
E-2111
DCC CirculationPumps
P-2110 A/B
MCW
Stream : 21-A
Stream : 21-B
Stream : 21-C
Stream : 21-D
Recyle to PA Fan F-1208
15 The contents of this report draw on work partly funded under the European Union’s European Energy Programme for Recovery. The European Union is not responsible for any use that may be made of the information contained within this document.
K22: Full Chain Process Flow Diagrams
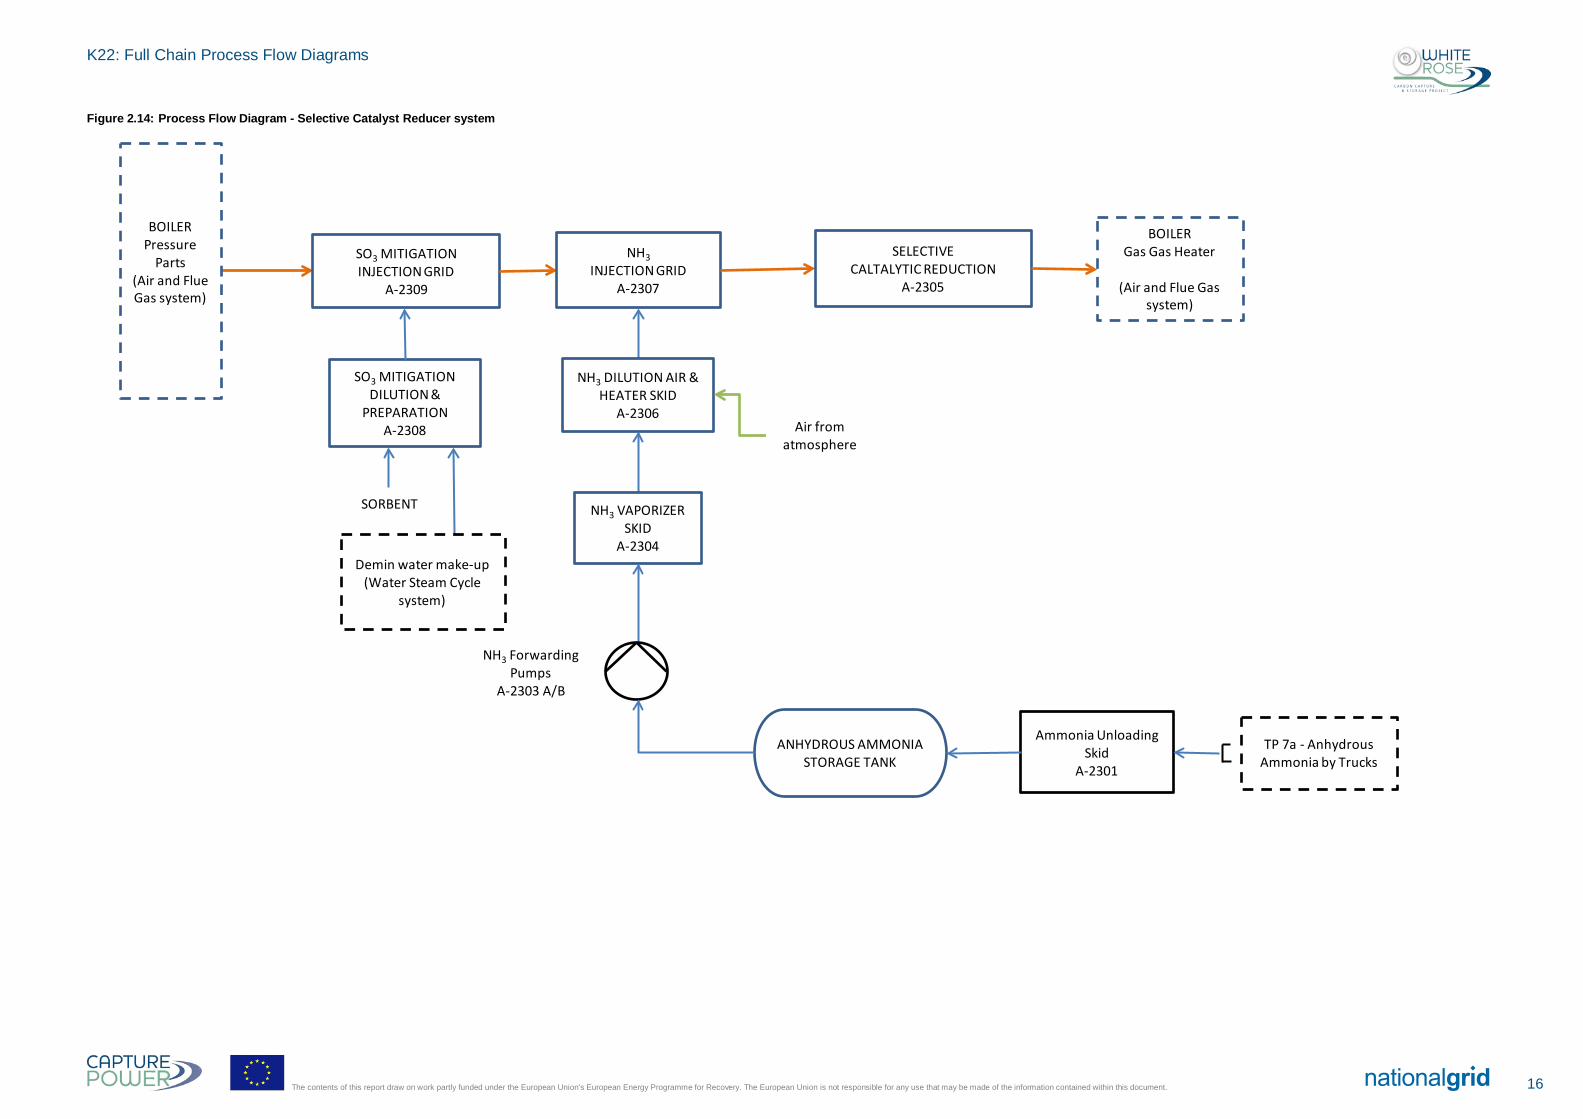
Figure 2.14: Process Flow Diagram - Selective Catalyst Reducer system
SORBENT
SO3 MITIGATION INJECTION GRID
A-2309
NH3INJECTION GRID
A-2307
SELECTIVE CALTALYTIC REDUCTION
A-2305
NH3 DILUTION AIR & HEATER SKID
A-2306
NH3 VAPORIZER SKID
A-2304
NH3 Forwarding Pumps
A-2303 A/B
Ammonia Unloading Skid
A-2301
ANHYDROUS AMMONIA STORAGE TANK
BOILERPressure
Parts(Air and Flue Gas system)
BOILERGas Gas Heater
(Air and Flue Gas system)
TP 7a - Anhydrous Ammonia by Trucks
Air from atmosphere
SO3 MITIGATION DILUTION &
PREPARATIONA-2308
Demin water make-up(Water Steam Cycle
system)
16 The contents of this report draw on work partly funded under the European Union’s European Energy Programme for Recovery. The European Union is not responsible for any use that may be made of the information contained within this document.
K22: Full Chain Process Flow Diagrams
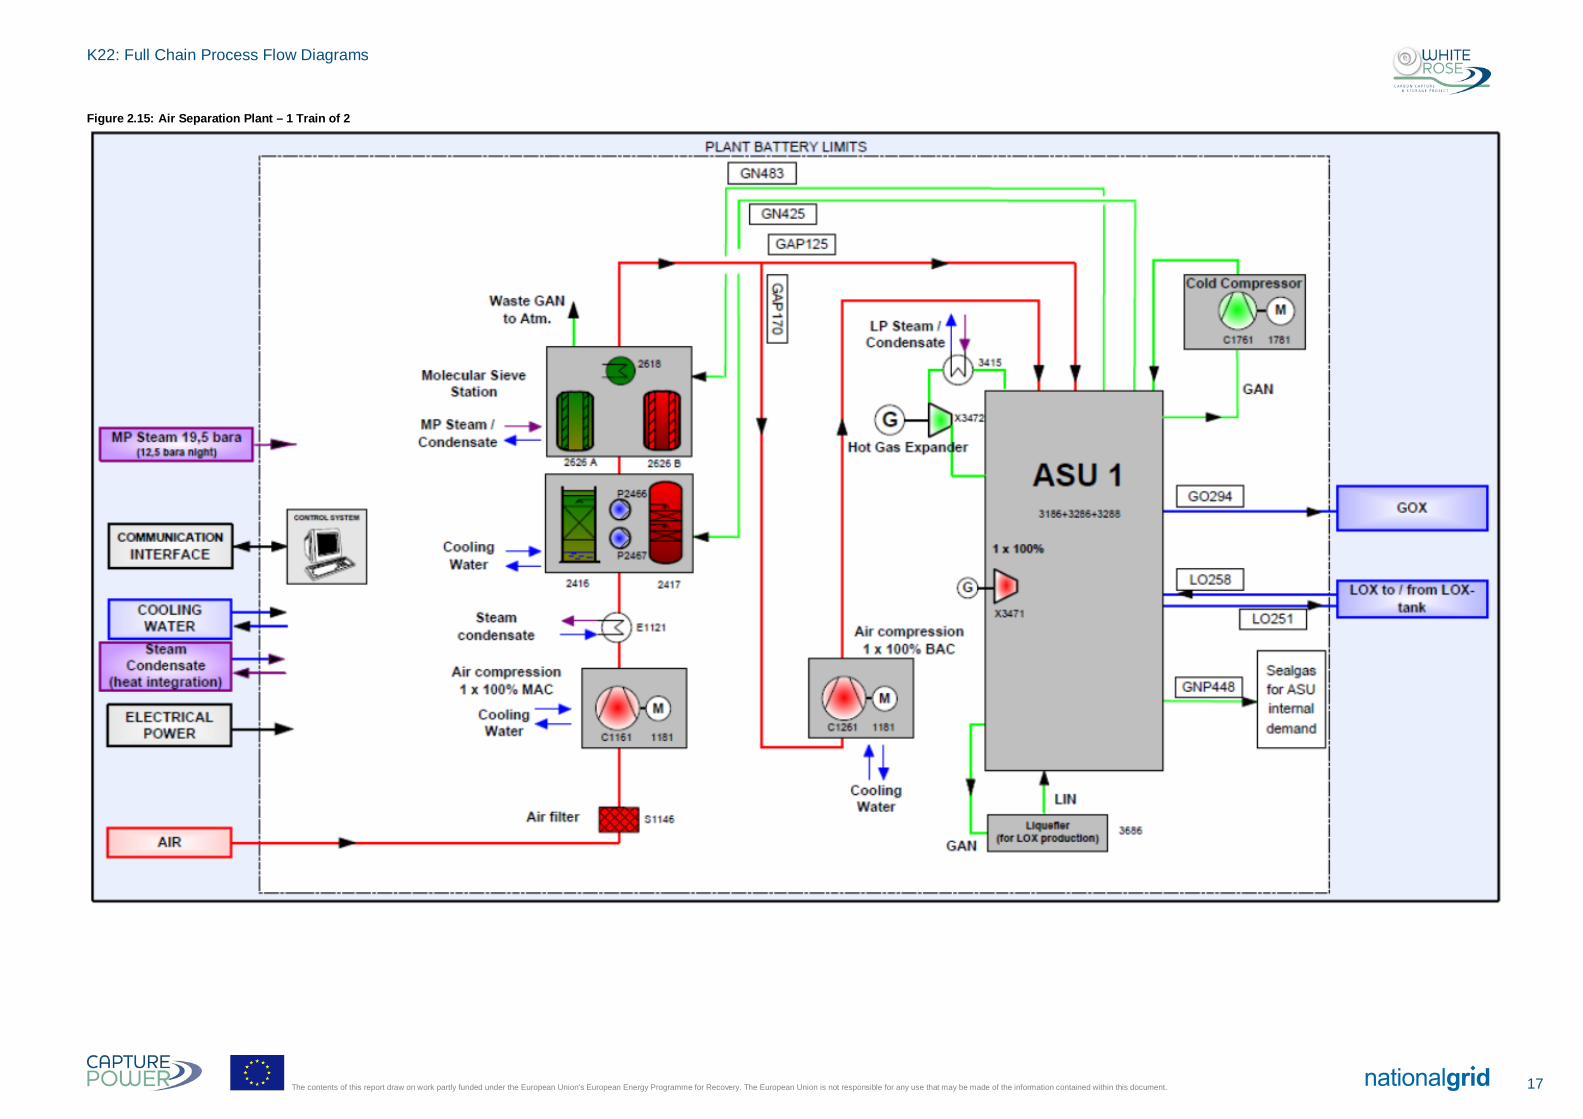
Figure 2.15: Air Separation Plant – 1 Train of 2
17 The contents of this report draw on work partly funded under the European Union’s European Energy Programme for Recovery. The European Union is not responsible for any use that may be made of the information contained within this document.
K22: Full Chain Process Flow Diagrams
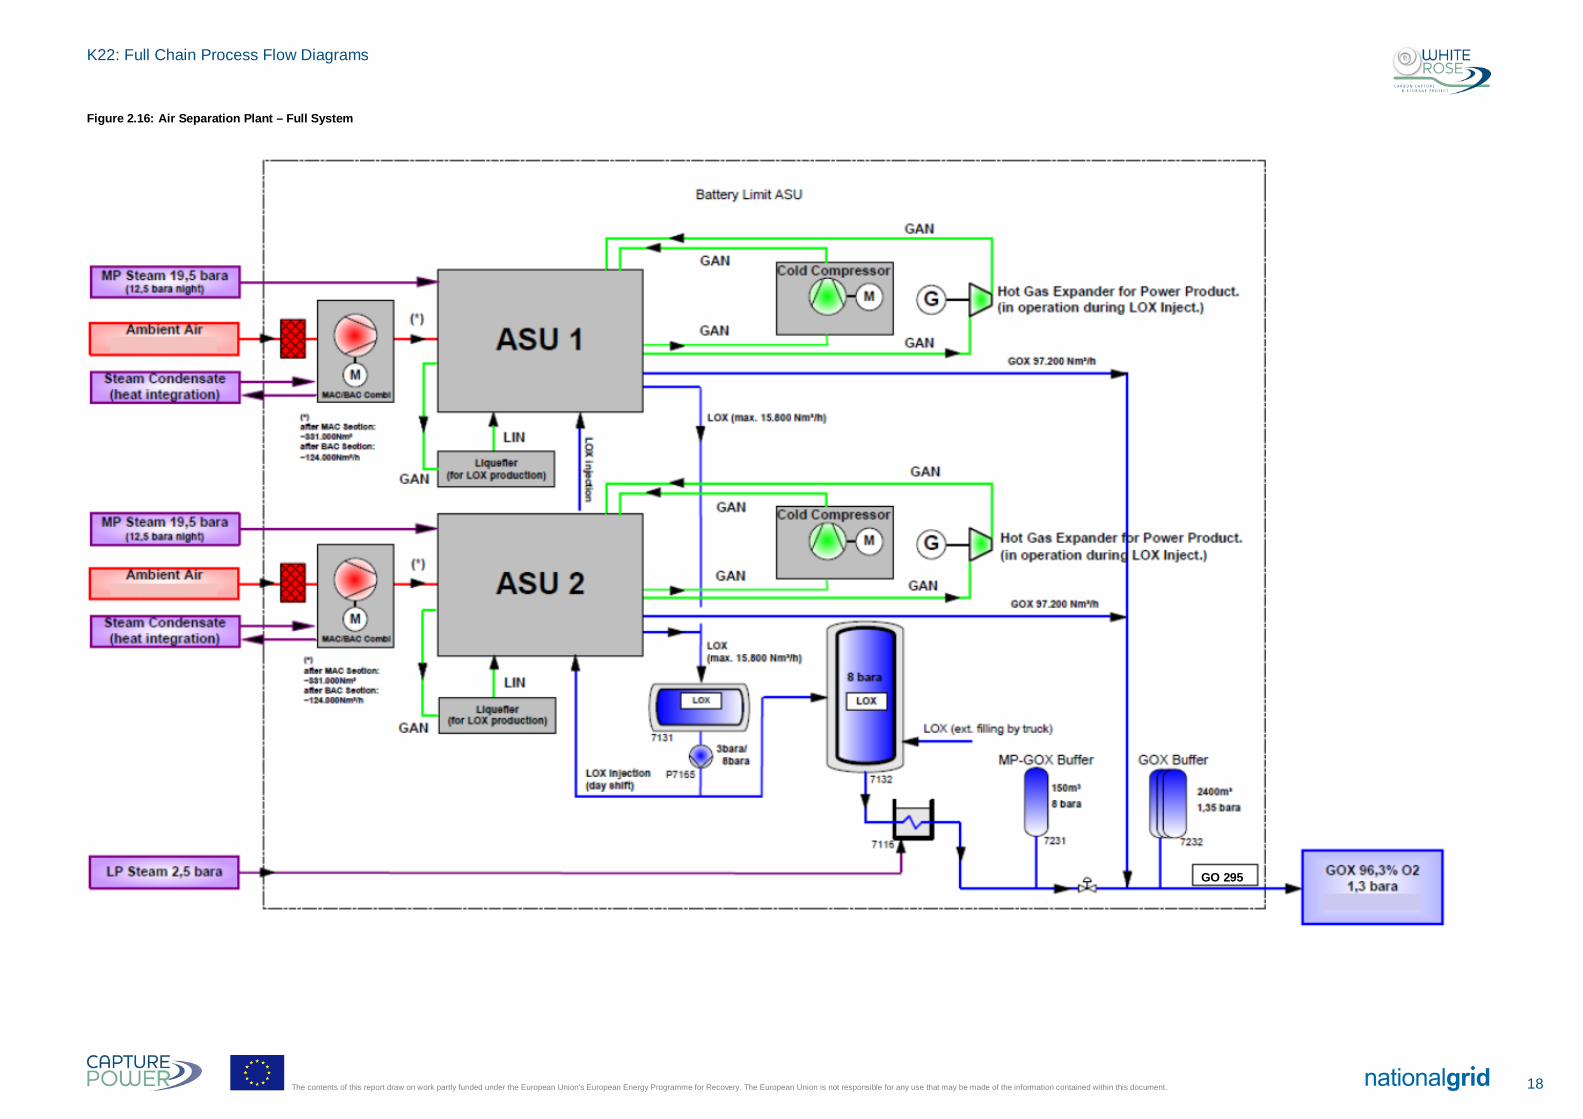
Figure 2.16: Air Separation Plant – Full System
GO 295
18 The contents of this report draw on work partly funded under the European Union’s European Energy Programme for Recovery. The European Union is not responsible for any use that may be made of the information contained within this document.
K22: Full Chain Process Flow Diagrams
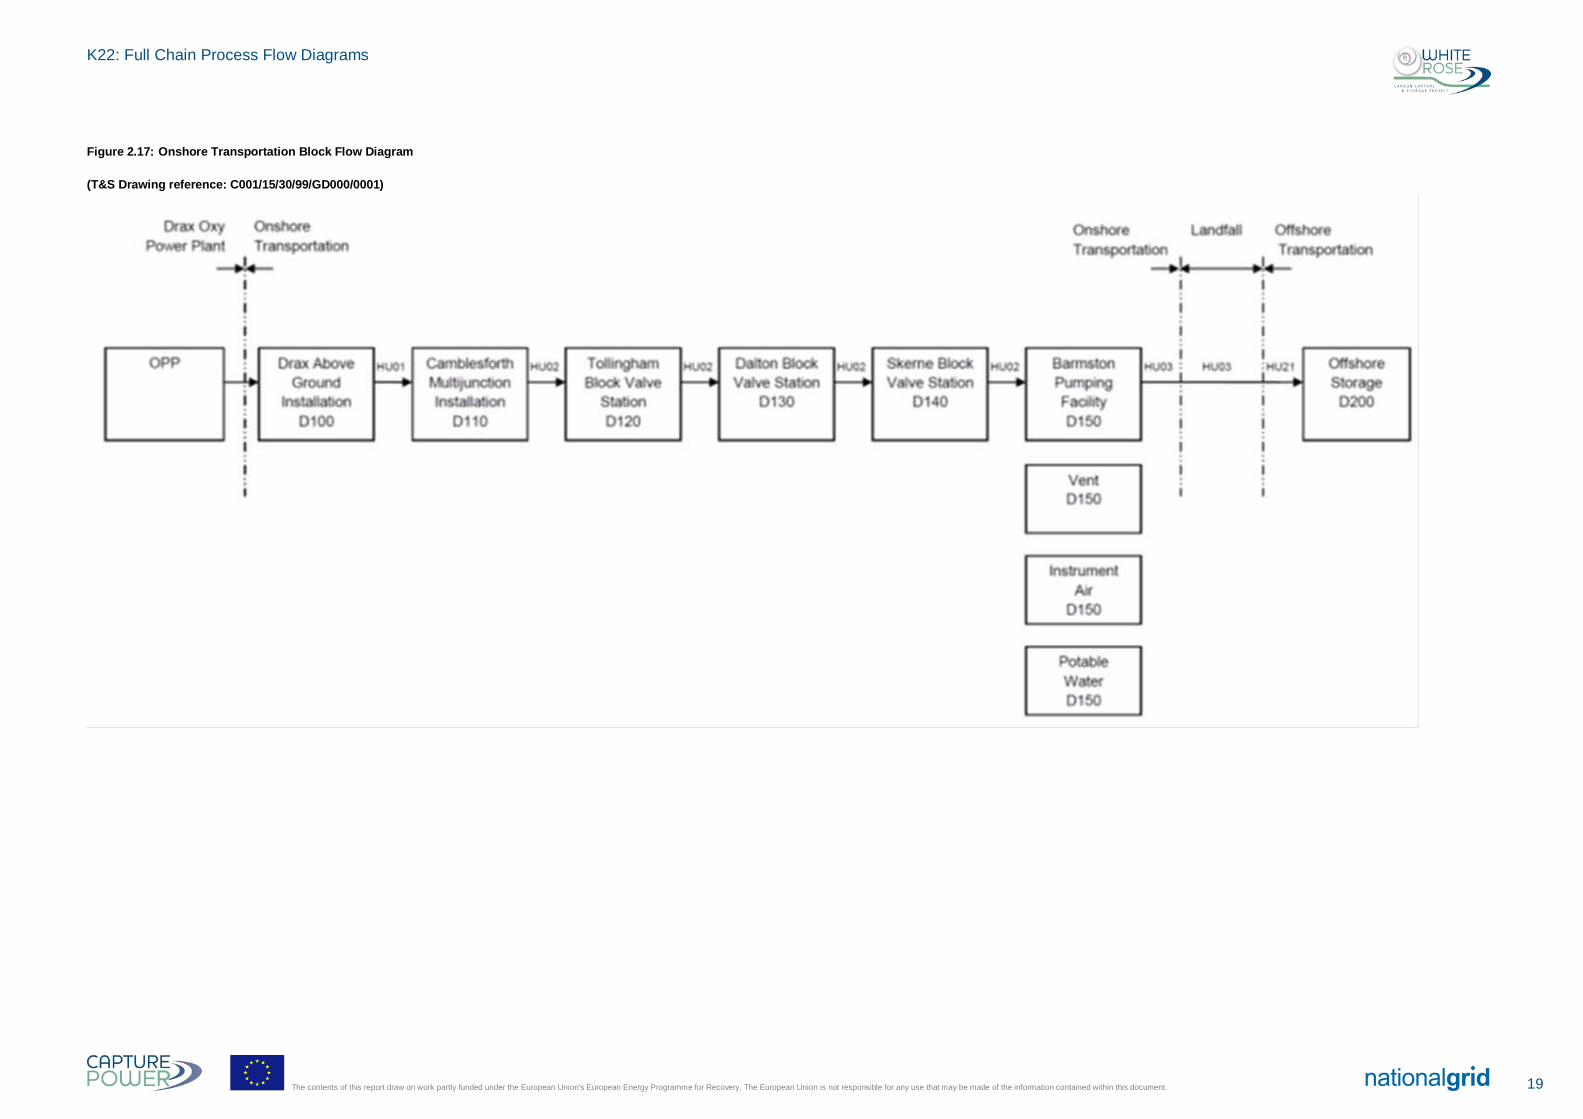
Figure 2.17: Onshore Transportation Block Flow Diagram
(T&S Drawing reference: C001/15/30/99/GD000/0001)
19 The contents of this report draw on work partly funded under the European Union’s European Energy Programme for Recovery. The European Union is not responsible for any use that may be made of the information contained within this document.
K22: Full Chain Process Flow Diagrams
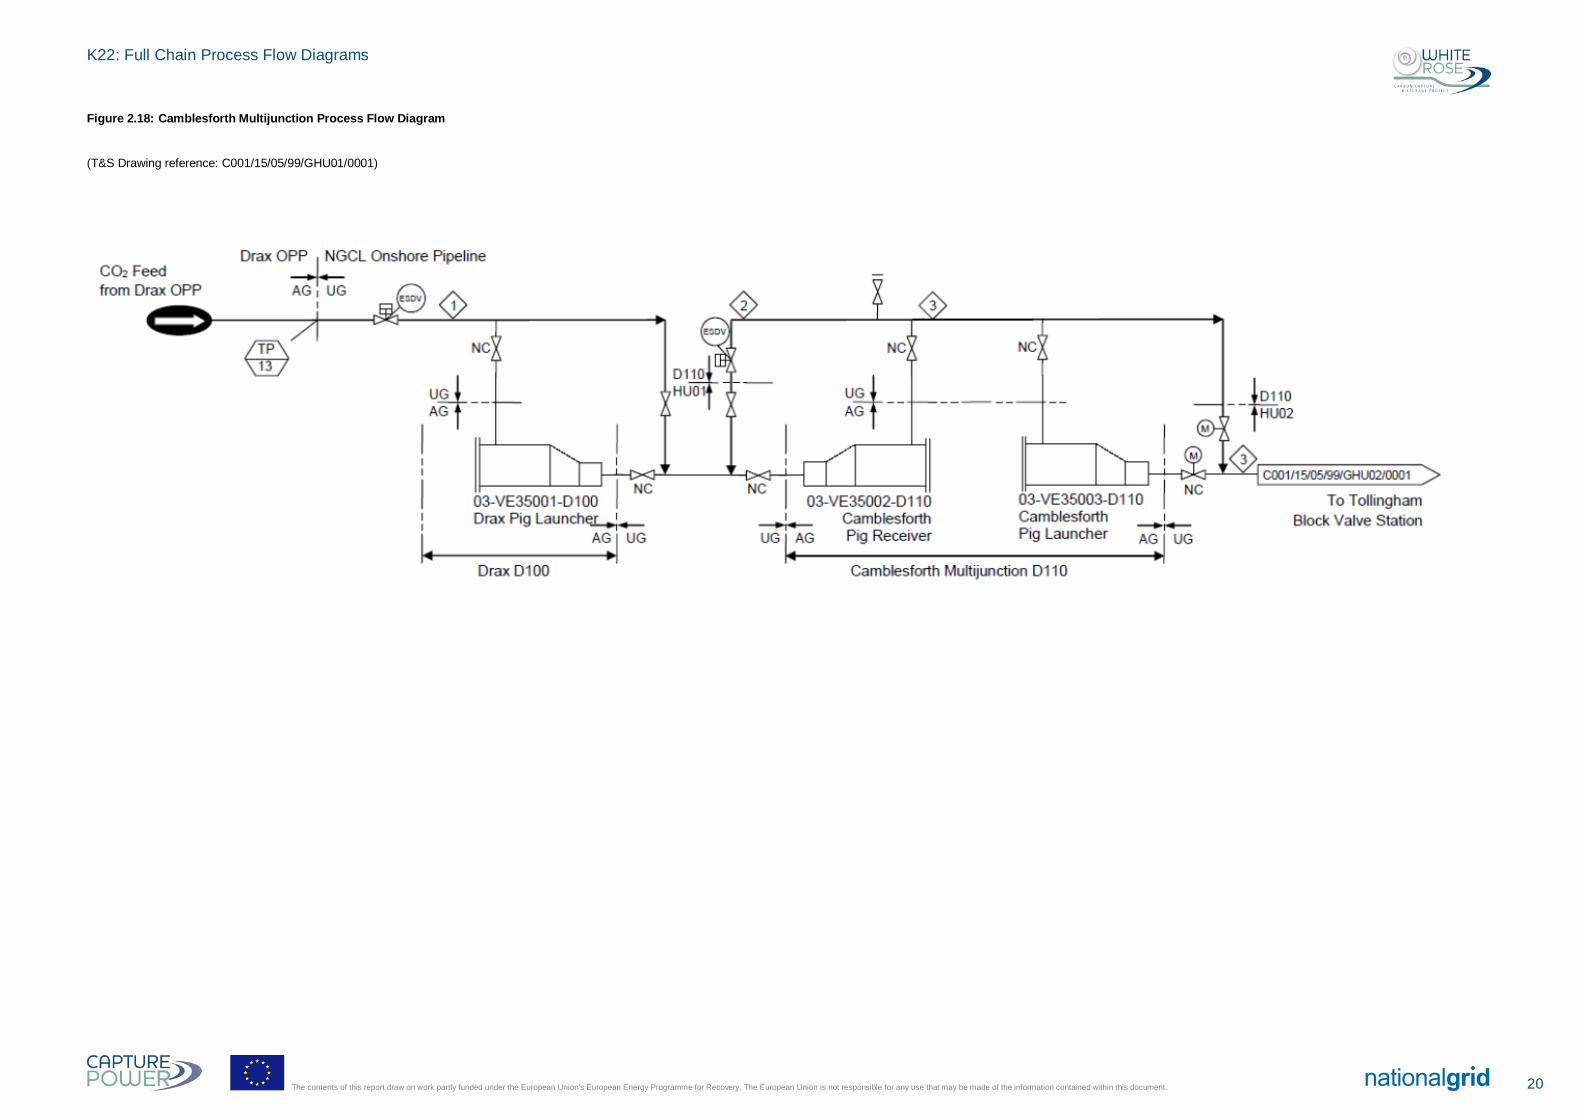
Figure 2.18: Camblesforth Multijunction Process Flow Diagram
(T&S Drawing reference: C001/15/05/99/GHU01/0001)
20 The contents of this report draw on work partly funded under the European Union’s European Energy Programme for Recovery. The European Union is not responsible for any use that may be made of the information contained within this document.
K22: Full Chain Process Flow Diagrams
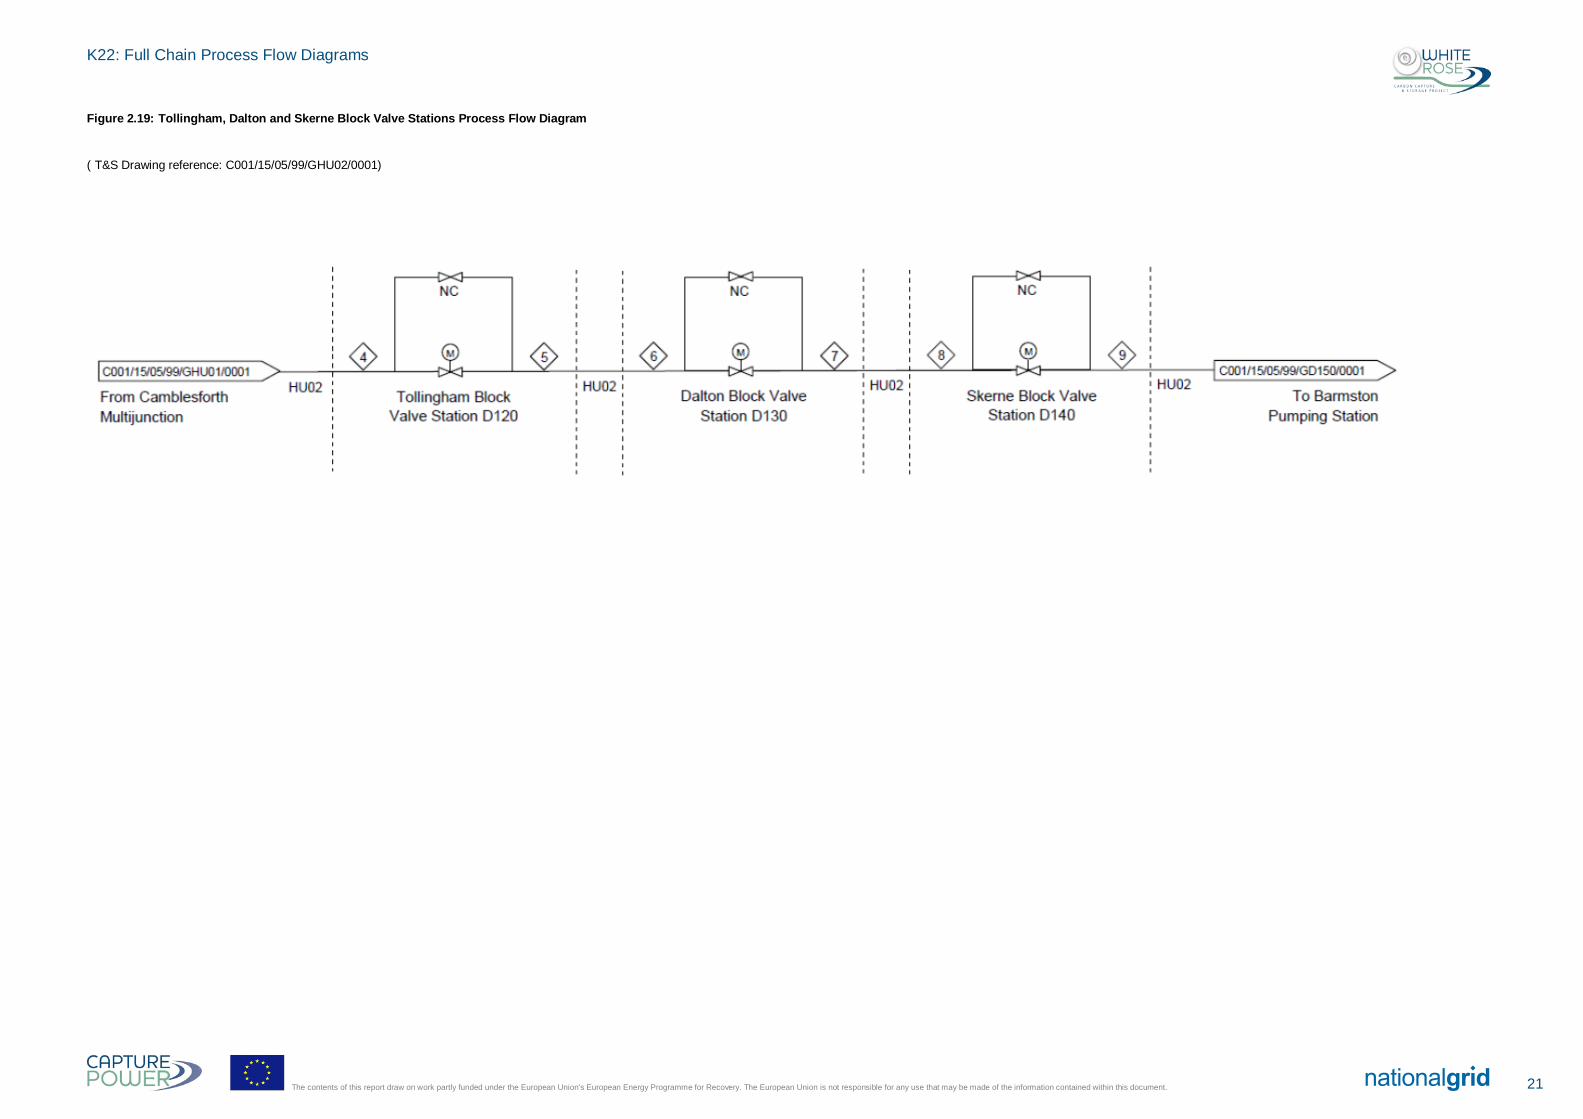
Figure 2.19: Tollingham, Dalton and Skerne Block Valve Stations Process Flow Diagram
( T&S Drawing reference: C001/15/05/99/GHU02/0001)
21 The contents of this report draw on work partly funded under the European Union’s European Energy Programme for Recovery. The European Union is not responsible for any use that may be made of the information contained within this document.
K22: Full Chain Process Flow Diagrams
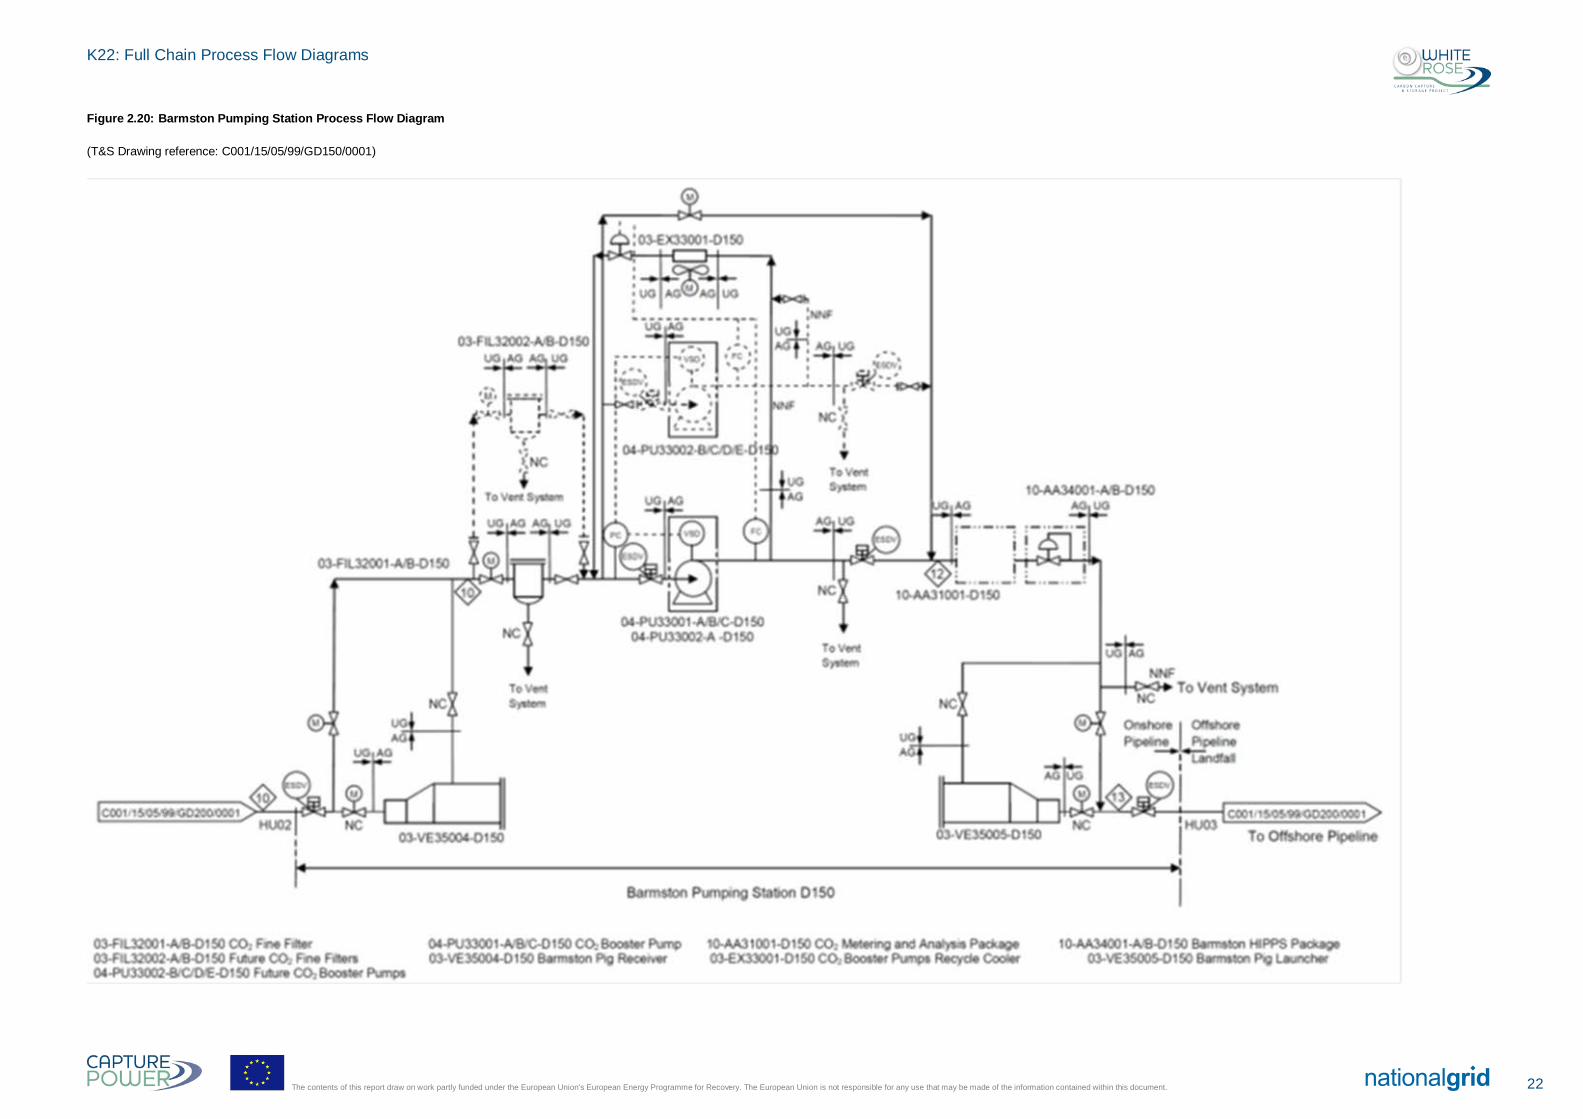
Figure 2.20: Barmston Pumping Station Process Flow Diagram
(T&S Drawing reference: C001/15/05/99/GD150/0001)
22 The contents of this report draw on work partly funded under the European Union’s European Energy Programme for Recovery. The European Union is not responsible for any use that may be made of the information contained within this document.
K22: Full Chain Process Flow Diagrams
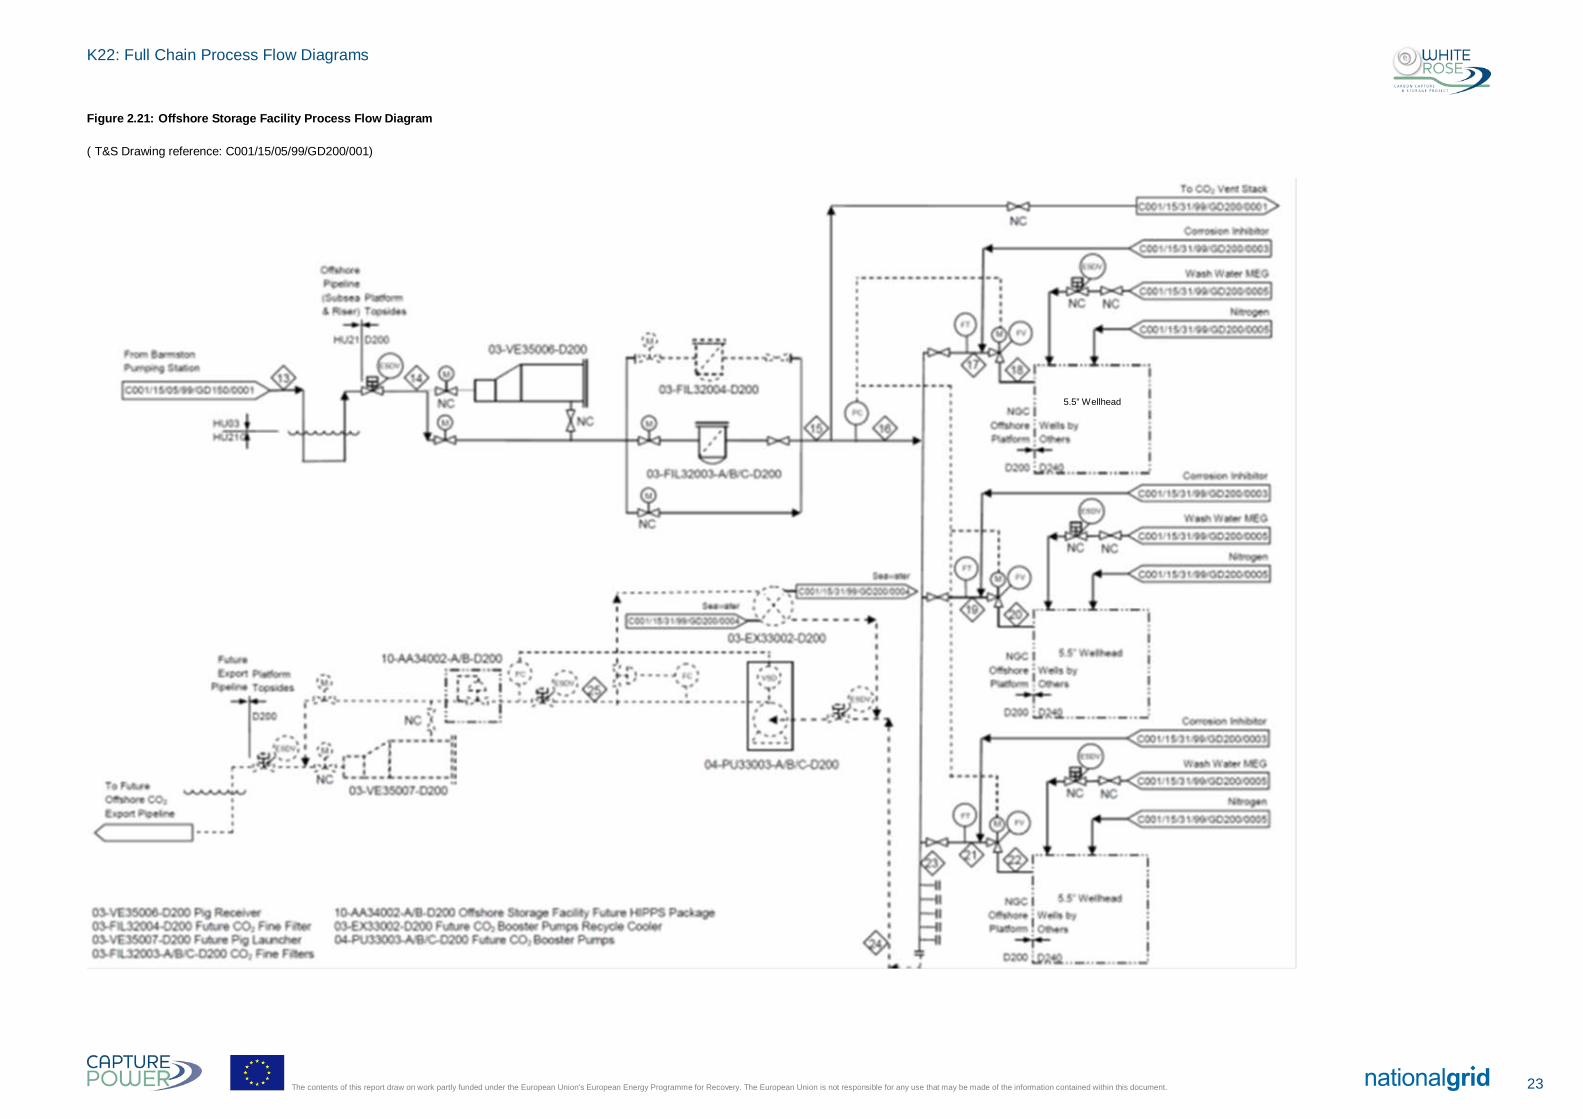
Figure 2.21: Offshore Storage Facility Process Flow Diagram
( T&S Drawing reference: C001/15/05/99/GD200/001)
5.5” Wellhead
23 The contents of this report draw on work partly funded under the European Union’s European Energy Programme for Recovery. The European Union is not responsible for any use that may be made of the information contained within this document.
K22: Full Chain Process Flow Diagrams
Abbreviations Meaning or Explanation
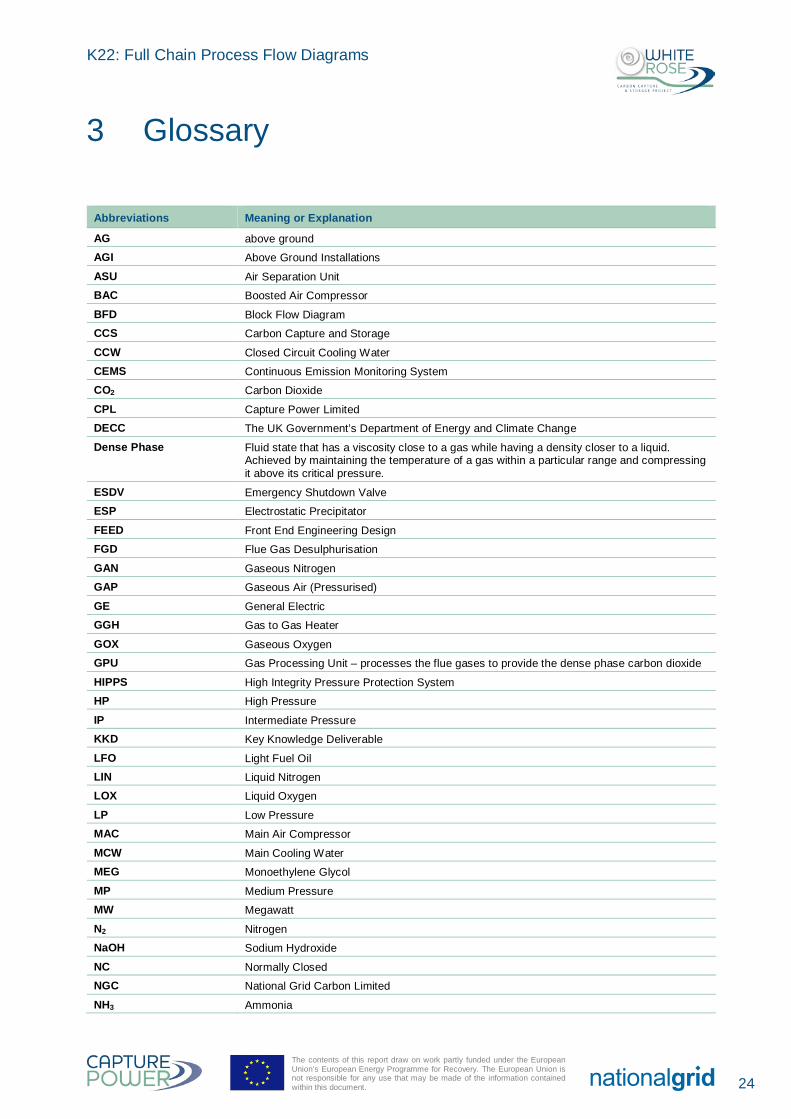
AG above ground AGI Above Ground Installations ASU Air Separation Unit BAC Boosted Air Compressor BFD Block Flow Diagram CCS Carbon Capture and Storage CCW Closed Circuit Cooling Water CEMS Continuous Emission Monitoring System CO2 Carbon Dioxide CPL Capture Power Limited DECC The UK Government’s Department of Energy and Climate Change Dense Phase Fluid state that has a viscosity close to a gas while having a density closer to a liquid.
Achieved by maintaining the temperature of a gas within a particular range and compressing it above its critical pressure.
ESDV Emergency Shutdown Valve ESP Electrostatic Precipitator FEED Front End Engineering Design FGD Flue Gas Desulphurisation GAN Gaseous Nitrogen GAP Gaseous Air (Pressurised) GE General Electric GGH Gas to Gas Heater GOX Gaseous Oxygen GPU Gas Processing Unit – processes the flue gases to provide the dense phase carbon dioxide HIPPS High Integrity Pressure Protection System HP High Pressure IP Intermediate Pressure KKD Key Knowledge Deliverable LFO Light Fuel Oil LIN Liquid Nitrogen LOX Liquid Oxygen LP Low Pressure MAC Main Air Compressor MCW Main Cooling Water MEG Monoethylene Glycol MP Medium Pressure MW Megawatt N2 Nitrogen NaOH Sodium Hydroxide NC Normally Closed NGC National Grid Carbon Limited NH3 Ammonia
3 Glossary
24
The contents of this report draw on work partly funded under the European Union’s European Energy Programme for Recovery. The European Union is not responsible for any use that may be made of the information contained within this document.
K22: Full Chain Process Flow Diagrams
Abbreviations Meaning or Explanation
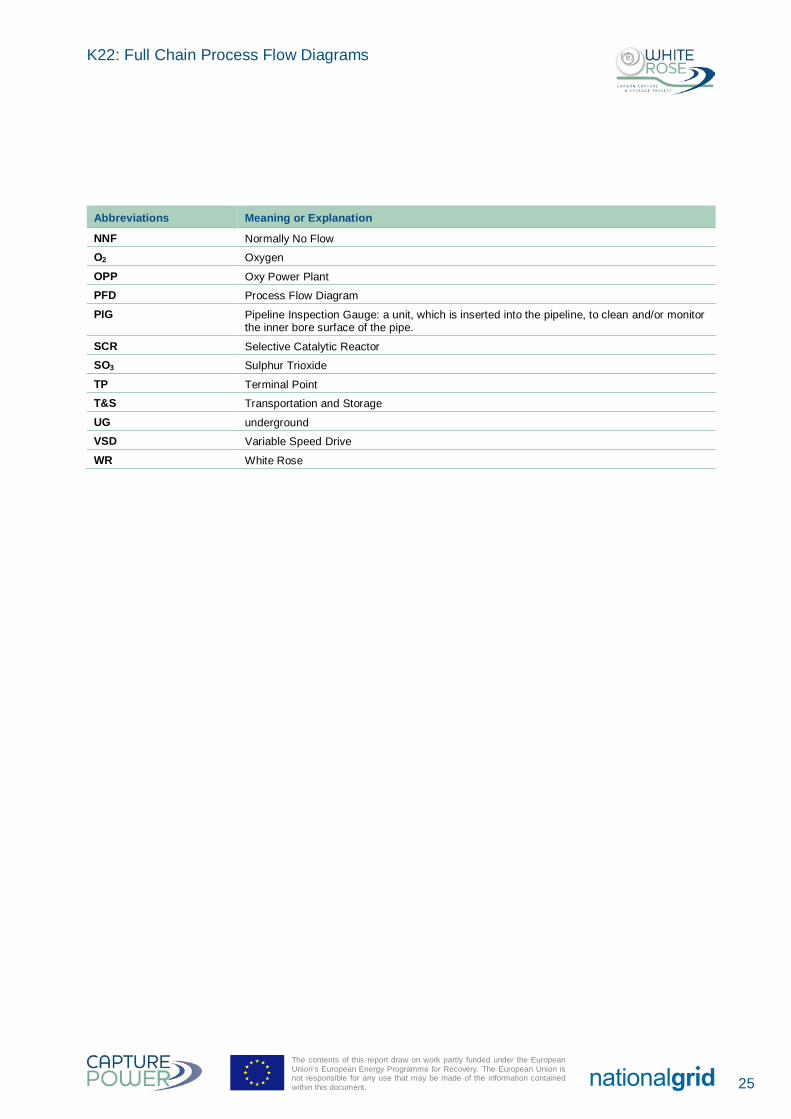
NNF Normally No Flow O2 Oxygen OPP Oxy Power Plant PFD Process Flow Diagram PIG Pipeline Inspection Gauge: a unit, which is inserted into the pipeline, to clean and/or monitor
the inner bore surface of the pipe. SCR Selective Catalytic Reactor SO3 Sulphur Trioxide TP Terminal Point T&S Transportation and Storage UG underground VSD Variable Speed Drive WR White Rose
25
The contents of this report draw on work partly funded under the European Union’s European Energy Programme for Recovery. The European Union is not responsible for any use that may be made of the information contained within this document.