Embed Size (px)
Citation preview

Downloaded from www.microbiologyresearch.org by
IP: 165.124.167.78
On: Mon, 30 Nov 2015 09:59:42
Methods
K-Pax2: Bayesian identification of cluster-defining aminoacid positions in large sequence datasets
Alberto Pessia,1 Yonatan Grad,2,3 Sarah Cobey,4 Juha Santeri Puranen5 and Jukka Corander1
1Department of Mathematics and Statistics, University of Helsinki, Finland
2Department of Immunology and Infectious Diseases, Harvard T.H. Chan School of Public Health, Boston, Massachusetts, USA
3Division of Infectious Diseases, Department of Medicine, Brigham and Women’s Hospital, Harvard Medical School, Boston,Massachusetts, USA
4Department of Ecology and Evolution, University of Chicago, Chicago, Illinois, USA
5Department of Biosciences, Abo Akademi University, Turku, Finland
Correspondence: Alberto Pessia ([email protected])
DOI: 10.1099/mgen.0.000025
The recent growth in publicly available sequence data has introduced new opportunities for studying microbial evolution and
spread. Because the pace of sequence accumulation tends to exceed the pace of experimental studies of protein function
and the roles of individual amino acids, statistical tools to identify meaningful patterns in protein diversity are essential. Large
sequence alignments from fast-evolving micro-organisms are particularly challenging to dissect using standard tools from
phylogenetics and multivariate statistics because biologically relevant functional signals are easily masked by neutral vari-
ation and noise. To meet this need, a novel computational method is introduced that is easily executed in parallel using a
cluster environment and can handle thousands of sequences with minimal subjective input from the user. The usefulness of
this kind of machine learning is demonstrated by applying it to nearly 5000 haemagglutinin sequences of influenza
A/H3N2.Antigenic and 3D structural mapping of the results show that the method can recover the major jumps in antigenic
phenotype that occurred between 1968 and 2013 and identify specific amino acids associated with these changes. The
method is expected to provide a useful tool to uncover patterns of protein evolution.
Keywords: data clustering; protein evolution; sequence analysis.
Abbreviation: HA, haemagglutinin.
Data statement: All supporting data, code and protocols have been provided within the article or through supplementary
data files.
Data Summary
1. Supplementary Text S1 has been deposited in figshare:10.6084/m9.figshare.1334296
2. Supplementary Tables S1–S3 have been deposited infigshare: 10.6084/m9.figshare.1334294
3. Supplementary Fig. S1 has been deposited in figshare:10.6084/m9.figshare.1334297
4. Supplementary Video S1 has been deposited in fig-share: 10.6084/m9.figshare.1334293
Introduction
The growth in microbial genome sequence data, driven bydecreasing sequencing costs and the integration of sequen-cing into routine clinical microbiology (Koser et al., 2012;Reuter et al., 2013), has begun to revolutionize our under-standing of microbial evolution and spread. However,the pace of sequence accumulation generally exceedsthe pace of experimental studies of protein function.Received 8 April 2015; Accepted 8 June 2015
G 2015 The Authors. Published by Society for General Microbiology 1

Downloaded from www.microbiologyresearch.org by
IP: 165.124.167.78
On: Mon, 30 Nov 2015 09:59:42
This relationship holds not only for recently emergedpathogens (Cotten et al., 2013; Gire et al., 2014), but alsofor intensively studied pathogens, such as influenza(Gong & Bloom, 2014; Worobey et al., 2014). Tools to ana-lyse such large datasets and provide targeted guidance ininferring phenotypically meaningful groups can thereforebe useful to identify amino acid sites and proteins thatplay critical roles in pathogen biology and evolution.These sites are potential targets for diagnostics, thera-peutics and vaccines.
Large sequence alignments are challenging to dissect usingstandard tools from phylogenetics and multivariate stat-istics. When the datasets comprise hundreds to thousandsof sequences, trees become increasingly crowded and iden-tifying meaningful information is difficult. In contrast,basic statistical procedures such as principal componentsanalysis, hierarchical clustering or k-means (Hastie et al.,2009) can provide a compressed view into the data withrelative ease. However, the use of such unfocused methodsfor extracting information is problematic when the biologi-cally relevant signals are masked by noise introduced dueto sequencing errors or functionally neutral variation.This is the situation for fast-evolving organisms wheremany changes rapidly accumulate across proteins butonly a subset of them actually show signs of selection.
Model-based statistical methods have a clear advantageover the generic approaches when the model is structuredto infer biologically relevant information. For microbialproteins one important question is which isolates or strainsconstitute phenotypically distinct groups, distinguished byspecific amino acids fixed by selection. It is also useful toknow which positions and amino acids are probablydirectly under selection. Statistically, these questions corre-spond to the task of simultaneously clustering a proteinsequence alignment in two ways, by the rows to identifythe relevant groups of strains and by the columns to ident-ify which amino acid positions define the clusters. As boththe number of groups and the relevant sequence positionsare often unknown, statistical inference is required. Baye-sian modelling is particularly well suited for such modelselection problems, as by specifying probabilistic priorinformation for the unknowns in the model, one can effi-ciently focus the search and avoid overfitting.
Previous studies (Aguas & Ferguson, 2013; Meroz et al.,2011) have partially solved the above-discussed problemby supervised machine learning techniques. Within thisrelated setting, genetic determinants are identified con-ditional on a known classification of the sequences.To our knowledge, no statistical machine learningmethod has yet addressed the problem of identifyingmost relevant sites and amino acids without knowing apriori how the sequences are grouped.
We introduce here a Bayesian method (K-Pax2) that canhandle thousands of sequences with minimal subjectiveinput from the user. Our approach is based on a two-way clustering model inspired by an earlier method
(K-Pax) for clustering single protein sequence alignmentsfrom distant homologues to identify substructure withina protein superfamily (Marttinen et al., 2006). Our currentmethod possesses two significant improvements over theoriginal K-Pax, one related to accuracy and the other tothe technical specifications of the priors and model.These changes permit the method to be used to study alarge number of closely related sequences as well as severalproteins simultaneously. A useful feature of our modeldefinition is that it enables an analytically obtainable Baye-sian score of model fitness. This feature permits the use ofparallel computation in model optimization, as the scoresare directly comparable from independent optimizationruns without approximation errors caused by, for example,Monte Carlo methods.
The haemagglutinin (HA) of influenza A/H3N2 possessesfeatures that make it an ideal test case to demonstratethe function and applicability of K-Pax2 to large align-ments. Thousands of A/H3N2 HA sequences are availablein public databases (Bao et al., 2008; Benson et al., 2005;Bogner et al., 2006; Squires et al., 2012). In addition, thedetailed structure and evolution of HA have been investi-gated by phylogenetic inference and direct experiments(Bedford et al., 2014; Bizebard et al., 1995; Fleury et al.,1999; Knossow et al., 2002; Koel et al., 2013; Smith et al.,2004; Suzuki, 2006; Wolf et al., 2006).
HA is a homotrimeric integral membrane protein on thesurface of the influenza virion and the primary target ofthe neutralizing immune response against influenza. HAbinds sialic acid receptors on the surface of cells and,once bound, promotes viral entry by fusion of the viralenvelope with the endosome membrane. The tertiary struc-ture of HA indicates that there are two main domains:a variable globular head (HA1) that contains the sialicacid binding sites and a conserved stalk region (HA2)involved in membrane fusion (Skehel & Wiley, 2000).
Since its introduction in 1968, the A/H3N2 HA has under-gone rapid evolution that is associated with short coalesc-ent times, a ladder-like phylogeny and regular antigenic
Impact Statement
Large sequence databases have introduced newopportunities to explore patterns of microbial evol-ution. This paper introduces the first fast model-based machine learning method targeted to identifygenomic positions that are likely to display non-synonymous variation due to selection pressure.The method is widely applicable to aid in generationof hypotheses for experimental work and to pinpointplausible candidates for further study and data acqui-sition. Results on influenza A/H3N2 highlight thepotential to significantly advance the process towardsunderstanding the mechanisms linked to the successof major pathogens.
A. Pessia and others
2 Microbial Genomics

Downloaded from www.microbiologyresearch.org by
IP: 165.124.167.78
On: Mon, 30 Nov 2015 09:59:42
change (Bedford et al., 2014; Fitch et al., 1991; Smith et al.,2004). The HA1 domain is the predominant site of influ-enza’s antigenic evolution. Mutations in exposed epitopesdemonstrate strong selective pressure to escape antibodies(Fitch et al., 1991; Suzuki, 2006), and tend to predominatealong the trunk of the phylogenetic tree. However, there isalso evidence of positive selection at CD4+ and CD8+T-cell epitopes (Suzuki, 2006) and for the addition of N-linked glycosylation sites (Suzuki, 2011). Here, we usethe K-Pax2 method to analyse thousands of influenza A/H3N2 HA sequences to evaluate the success of the algor-ithm in identifying amino acid positions known to playkey roles in the function of HA.
Theory and Implementation
A two-way clustering model for identifying groupsof viral strains under diversifying or directionalselection
Let S5(s1, . . . , sn) denote a multiple sequence alignment ofconcatenated amino acid sequences for the coding regionsextracted from n virus samples. Each alignment elementthus belongs to the alphabet A representing the set ofamino acids, including the gap symbol. The length of thealigned sequences is denoted by L. For the purpose of obtain-ing a model family and an inference algorithm that can effi-ciently capture signals of diversifying and directionalselection from S, we transform the multiple sequence align-ment into an n £ LjAj binary matrix, where each columncorresponds to an indicator variable of a particular elementinA being observed at position l. Prior to any inference, allcolumns with exclusively zero elements are removed fromthe analysis because they are uninformative for the statisticalmodel introduced here. The resulting binary matrix X isassumed to be of dimension n|m.
In a set notation, let N ¼ {1; . . . ; n} denote the collectionof integer labels for the n virus strains. LetW5{w1, . . . , wK} denote an assignment of the n strainsinto K mutually disjoint non-empty clusters, where wK
represents the set of labels of the units associated with clus-ter k. Formally, the K non-empty subsets w1, . . . ,wK definea partition of the sequences such that
k<wk ¼ N
and wk > wk9 ¼ {B}, ;k – k9. In our model formulationeach of the K clusters is assumed to correspond to agroup of strains that has evolved under diversifying ordirectional selection pressure and consequently prolifer-ated given the fitness improvements induced by non-synonymous changes that are of functional importance atthe protein level. The sequence locations of such changes,the number of groups K and the explicit assignment ofstrains into the groups are all unknown parameters ofour model to be inferred from the matrix X.
Non-synonymous changes in viral strains that are freefrom diversifying selection pressure will fluctuate in fre-quency in the population due to drift, but they are not
in general expected to be rapidly driven to fixation unlessthey are tightly linked to other sites that are under selec-tion. We assume that the non-synonymous mutationsthat do not induce fitness changes will occur at a constantrate throughout the population. This can be translated intothe statistical approximation that for the n sampled strains,functional neutrality corresponds to a fixed probability ofobserving a particular residue in a given sequence positionacross all the K clusters:
Pr{Xij ¼ 1ji [ wk} ¼ hj
for all i [ wk and for all k51, . . . , K. Thus, from the clus-tering perspective, any column j ( j51, . . . , m) in X is con-sidered as ‘noise’ if the above probability is constant acrossgroups. Conversely, we define a column j to represent aputative ‘selection signal’ if there are at least two groupsfor which the corresponding probability is different:
Pr {Xij ¼ 1ji [ wk} – Pr Xi9j ¼ 1ji9 [ wk9
� �for all i [ wk, and i9 [ wk9 and for some k ? k9. Such signalsare only putative, as random drift could still explain adifference in the residue composition between two clusters.In addition, more rigid probabilistic restrictions must beimposed on the model structure to ensure that the group-ing W and the identities of the selected sites become jointlyidentifiable and convey a biologically meaningful extrac-tion of information from the alignment S. Note that resi-dues that remain unchanged in the whole viruspopulation over long periods of time ostensibly due tostrict functional constraints on the protein structure arealso uninformative for the purpose of identification ofsequence clusters, as they correspond to fully conservedsites in the alignment S.
Under relatively strong selection pressure, non-synon-ymous changes that are associated with an increase in fit-ness should rapidly rise in frequency, leading to theformation of a novel group of strains. Similar to the neu-tral changes considered previously, this assumption can betranslated into a statistical approximation that implies thatwe expect for each cluster k at least a single column j to bepresent in X such that
Pr {Xij ¼ 1ji [ wk} < 1 ^ Pr Xi9j ¼ 1ji9 � wk
� �< 0 ð1Þ
These residues are defined as ‘characteristic’ for cluster kand represent significant signals of selection. In summary,a site–amino acid pair (column of X) can then be con-sidered either noise (h51), a weak signal (h52) or astrong signal (h53). It can be further classified as of noparticular status (r51) or characteristic (r52) for a cluster.Column classification can accordingly be encoded by a col-lection of binary variables zjhrk attaining value 1 if and onlyif column j ( j51, . . . ,m) has property h (h51, 2, 3) withstatus r (r51, 2) in cluster k (k51, . . ., K), and attainingvalue 0 otherwise. Let the array Z represent the collectionof binary variables zjhrk over all the index values. Thepair (W,Z) then contains all the main parameters of inter-
Identification of cluster-defining positions in protein sequences
http://mgen.sgmjournals.org 3

Downloaded from www.microbiologyresearch.org by
IP: 165.124.167.78
On: Mon, 30 Nov 2015 09:59:42
est in our model. However, its full probabilistic character-ization requires a set of additional nuisance parametersthat are defined below.
Likelihood function
Assuming conditional independence of the elements of Xgiven both the main and the nuisance parameters of themodel, we obtain the following expressions:
pðX jW ;ZÞ ¼YKk¼1
pðX kjwk;Z kÞ
where Xk is the binary data matrix associated with cluster kof size nk, and subsequently
pðX kjwk;Z kÞ ¼Ymj¼1
pðxkjjwk;Z jkÞ
where xkj is the binary vector for cluster k at column j,while Zjk is a 3 £ 2 binary matrix such that
h
Pr
Pzjhrk ¼ 1. Defining the columns as statistically inde-
pendent may be interpreted as a very strong assumption.However, note that their stochastic nature is alreadyaddressed through the prior distribution. Concern couldarise for phenomena such as hitchhiking, where sitescould be genetically linked and thus present at similar fre-quencies. Such cases can be easily addressed when post-processing the results from model optimization.
We define the (prior) predictive probability
pðxkj jwk;Z jkÞ ¼ð10
pðhjZ jkÞi[wk
Ygðxij jhÞdh ð2Þ
where gðxjhÞ is the Bernoulli distribution and pðhjZ jkÞ isthe conjugate Beta distribution for its parameter h, whichis explicitly conditioned on the property and status ofcolumn j in cluster k. All these Bernoulli parameters arenuisance parameters in the model, as their explicit valuesare not a target of inference. Hence, in accordance withstandard conventions in Bayesian statistics, they are inte-grated out from the likelihood to obtain the marginal pos-terior distribution for the parameters of interest. Note thataccording to this formulation sequences belonging to thesame cluster are not statistically independent, whereassequences belonging to different groups are. Forzjhrk ¼ 1, standard Bayesian calculation (Bernardo &Smith, 2000) shows that equation 2 is equal to the ratioof Beta functions
Bðajhrk þ ykj ; bjhrk þ nk 2 ykjÞBðajhrk; bjhrkÞ ð3Þ
where ajhrk and bjhrk are the hyperparameters of the Betadistribution and ykj ¼
i[wk
Pxij is the number of values
equal to unity observed in cluster k at column j.To simplify the notation, we denote the probability in
equation 2 as pjhrk . The likelihood function can now becompactly rewritten as
pðX jW ;ZÞ ¼Ymj¼1
Y3h¼1
Y2r¼1
YKk¼1
pzjhrkjhrk ð4Þ
Prior distributions
Let pðW ;ZÞ ¼ p Wð ÞpðZ jW Þ be the joint prior distributionfor the partition W and the column classification Z. Forcomputational simplicity, similar to Marttinen et al.(2006, 2009), we define the prior distribution for W asthe uniform distribution for which
pðW Þ / 1
There are alternative prior distributions for data partitionsthat directly penalize an increase in the number of clusters,such as a uniform distribution for the number of clusters Kused in the hierBAPS software (Cheng et al., 2013) or theDirichlet process prior (Jain & Neal, 2007; Neal, 2000).However, because we use a strongly informative prior dis-tribution for the parameters in Z, which penalizes spuriousclusters, the uniform prior onW does not lead to problemswith overestimation of K, as illustrated for a related clus-tering model by Marttinen et al. (2009).
To define the conditional prior distribution for Z, we followa hierarchical approach. Let c5(c1, c2, c3)
T denote ourprior probabilities for a column to represent noise, weaksignal or strong signal, respectively. Then, ch ¢ 0 and
h
Pch ¼ 1ðh ¼ 1; 2; 3Þ. Note that these properties are
column-specific and they are not affected by any particularpartition under consideration. Also, note that the array Zsatisfies
X2r¼1
zjhrk ¼ zjh:k ¼1; if j has property h
0; otherwise
(ð5Þ
from which we obtain
X2r¼1
XKk¼1
zjhrk ¼ zjh:: ¼K ; if j has property h
0; otherwise
(
and consequently zjh../K can be interpreted as an indicatorvariable, taking value 1 if and only if column j has theproperty h. Assuming the columns to be stochasticallyindependent from each other, motivated by the lack ofany prior information about their relationships, we startby writing
pðZ jW Þ ¼Ymj¼1
Y3h¼1
chpðZ jhjW Þ� � 1Kzjh:: ð6Þ
where Zjh is a 2 £ K binary matrix satisfying equation 5.The matrix Zjh is then modelled by K independent multi-
A. Pessia and others
4 Microbial Genomics

Downloaded from www.microbiologyresearch.org by
IP: 165.124.167.78
On: Mon, 30 Nov 2015 09:59:42
nomial distributions
pðZ jhjW Þ ¼YKk¼1
Y2r¼1
vzjhrkhr ð7Þ
where vhr is the prior probability of observing status rwhen a column has property h. Inserting equation 7 intoequation 6, we finally obtain
p W ; Z� �/Ym
j¼1
Y3h¼1
Y2r¼1
YKk¼1
c1K
hvhr
h izjhrk ð8Þ
where we used the equality zjh::zjhrk ¼ Kzjhrk .
Posterior inference
By multiplying the right-hand side of equation 4 andequation 8, we obtain the joint posterior distribution ofthe main parameters up to a normalizing constant
pðW ; Z jX Þ /Ymj¼1
Y3h¼1
Y2r¼1
YKk¼1
c1K
hvhrpjhrk
h izjhrkWe estimate the pair (W, Z) using the mode of the pos-terior distribution
W ; Z� � ¼
ðW ;ZÞargmaxpðW ; Z jX Þ
which is equivalently obtained by maximizing the logposterior while ignoring the constant term:
Xmj¼1
X3h¼1
X2r¼1
XKk¼1
zjhrk log c1K
hvhrpjhrk
� ð9Þ
Let W represent the set of all the possible partitions of Nand let ZW denote the set of all the possible classificationsof the columns (conditional on the underlying partition).The cardinality of the parameter space is easily determined,
as Wj j is equal to the Bell number Bn, whereasZWj j ¼ ð2þ 2K Þm. For a discrete posterior distributionover a space of such high cardinality and complex top-ology, it is unlikely that any standard Markov chainMonte Carlo approach would be able to efficiently explorethe distribution and estimate the mode using a reasonableamount of computational time. Therefore, we have devel-oped a greedy optimization algorithm for fitting the modelto a multiple sequence alignment. An advantage of the ana-lytical tractability of the model is that any two modelstructures can be compared using the difference in log pos-terior, and hence estimates from multiple independentparallel or sequential algorithm runs can be ranked in astraightforward manner. Similarly, posterior uncertaintyaround the mode estimate can be easily numerically sum-marized, for example using Bayes factors against neigh-bouring model configurations.
An explanation of how to obtain default values for theprior hyperparameters and a description of the greedyalgorithm can be found in Supplementary Text S1.
Data collection
Data collection followed a multi-stage approach. First,12 295 A/H3N2 HA protein sequences were downloadedfrom three different search engines: NCBI’s InfluenzaVirus Resource (Bao et al., 2008), GISAID EpiFlu Database(Bogner et al., 2006) and Influenza Research Database(Squires et al., 2012). Our search query consisted of full-length A/H3N2 HA proteins, collected from human hostsin any country, excluding laboratory strains and mixed sub-types. In the second stage, we scanned the data for duplicatesand low-quality reads and, after removing them from thecollection, we aligned the data using MUSCLE (Edgar,2004). After again removing duplicates, the dataset consistedof 4898 unique strains of 567 amino acids. The complete listof accession numbers is given in Table S1.
2010
2000
1990
1 2 3 4 5 6 7 8 9 101112131415161718192021222324252627282930
Cluster
313233343536373839404142434445464748495051525354555657
Year
1980
1970
Fig. 1. Temporal distribution of influenza A/H3N2 HA within each K-Pax2 cluster. Groups are sorted by sampling year of the earliest con-sensus sequence.
Identification of cluster-defining positions in protein sequences
http://mgen.sgmjournals.org 5
Downloaded from www.microbiologyresearch.org by
IP: 165.124.167.78
On: Mon, 30 Nov 2015 09:59:42
3-D mapping of characteristic amino acidchanges
The amino acid positions that correspond to characteristicamino acid changes were mapped to the crystal structure of
the influenza virus HA (PDB ID 1HA0). Structurally rel-evant mutations occurring between two consecutive clus-ters are shown as yellow spheres. The resulting sequenceof mapping images were rendered in PyMol and theimage sequence was then encoded into a video file usingMEncoder v.4.8.3 and the H.264 compression format.
Broad overview of K-Pax2 output
To obtain a reliable estimate of the model parameters, weran the optimization algorithm 100 times from differentstarting points and chose the solution with the highest pos-terior probability. The starting points were created by ran-domly modifying, through merging and splittingoperations, a common k-medoids partition (Hastie et al.,2009). The value for k was chosen according to the highestposterior probability score. This procedure generatedinitial partitions lying in a neighbourhood of the optimalsolution and allowed the algorithm to converge in lessthan 6 h (2.6 GHz processor with 2 GB RAM). The optimalmodel allocated the 4898 sequences into 57 differentgroups while simultaneously detecting 117 (out of 567possible) cluster-defining sites. As a comparison, theadjusted Rand index between our solution and the k-medoids partition with the same number of clusters is0.824. The two partitions are very similar and their discre-pancy is completely explained by a small rearrangement ofthe units. This result can be interpreted by noting thatKpax2 gives different weights to matrix columns, whereasstandard clustering techniques do not make any distinctionbetween noise and signal sites.
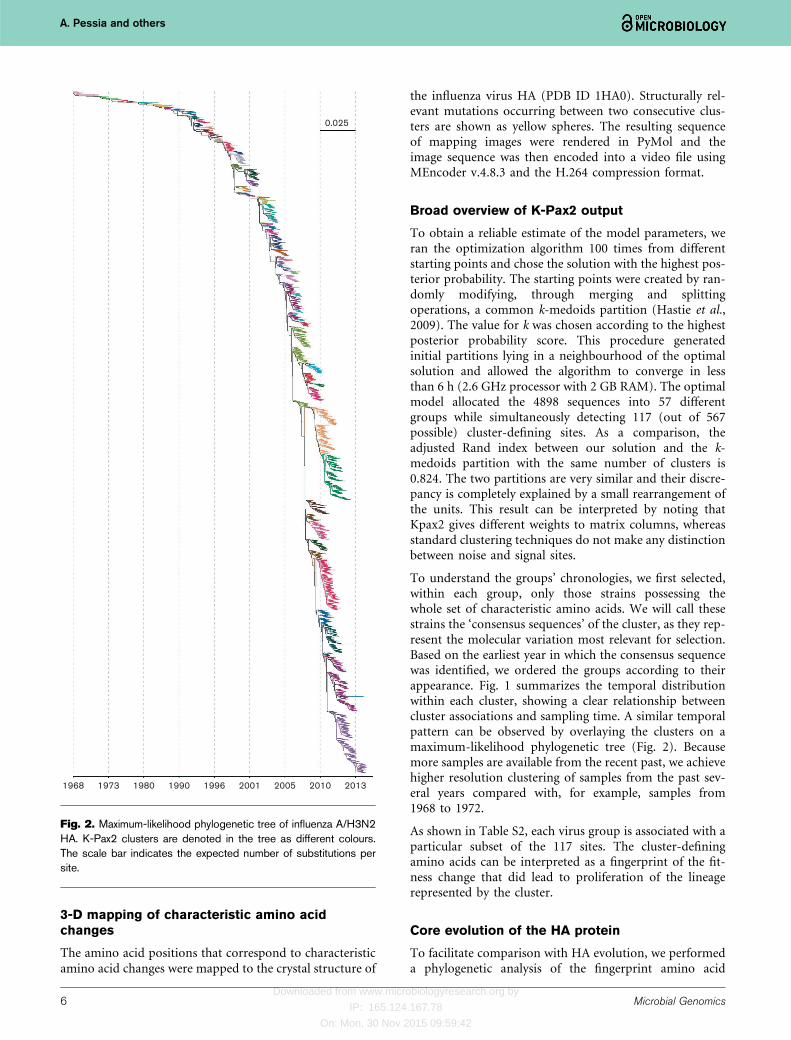
To understand the groups’ chronologies, we first selected,within each group, only those strains possessing thewhole set of characteristic amino acids. We will call thesestrains the ‘consensus sequences’ of the cluster, as they rep-resent the molecular variation most relevant for selection.Based on the earliest year in which the consensus sequencewas identified, we ordered the groups according to theirappearance. Fig. 1 summarizes the temporal distributionwithin each cluster, showing a clear relationship betweencluster associations and sampling time. A similar temporalpattern can be observed by overlaying the clusters on amaximum-likelihood phylogenetic tree (Fig. 2). Becausemore samples are available from the recent past, we achievehigher resolution clustering of samples from the past sev-eral years compared with, for example, samples from1968 to 1972.
As shown in Table S2, each virus group is associated with aparticular subset of the 117 sites. The cluster-definingamino acids can be interpreted as a fingerprint of the fit-ness change that did lead to proliferation of the lineagerepresented by the cluster.
Core evolution of the HA protein
To facilitate comparison with HA evolution, we performeda phylogenetic analysis of the fingerprint amino acid
1968 1973 1980 1990 1996 2001 2005 2010 2013
0.025
Fig. 2. Maximum-likelihood phylogenetic tree of influenza A/H3N2HA. K-Pax2 clusters are denoted in the tree as different colours.The scale bar indicates the expected number of substitutions persite.
A. Pessia and others
6 Microbial Genomics

Downloaded from www.microbiologyresearch.org by
IP: 165.124.167.78
On: Mon, 30 Nov 2015 09:59:42
change patterns discovered by the method. There can exist,in particular with densely sampled data from co-circulating groups of strains, multiple clusters of whichonly one successfully seeds the next cluster. Therefore, weidentified a parsimonious ‘core’ set of groups defined to
have the following characteristics. First, their age or timeof emergence is determined by the first sampling date oftheir consensus sequence (as previously defined). Second,a core cluster can have only a single ancestral core clusterbut potentially multiple descendant clusters, some of
A/beijing/1/1968
A/Bilthoven/21793/1972
A/Bilthoven/1761/1976
A/Texas/1/1977
0.02
9 10
13
1417 18 16 19
22
24 23 2125
26
3029 32 34
38
37
35
4041
44
4543
52
4851
495053
9: AParis/417/199110: A/England/260/199113: A/Netherlands/241/199314: A/New York/659/1994
17: A/New York/592/199618: A/New York/565/1996
16: A/Malaysia/10360/1996
19: A/Malaysia/10877/199621: A/Malaysia/12904/199722: A/Hong Kong/1179/1999
32: A/Hong Kong/CUHK33677/2004
47: A/Hong Kong/1775/201045: A/Algeria/G53/200944: A/Hawaii/15/200943: A/Philippines/2191/200941: A/Texas/91/200740: A/Wisconsin/03/200738: A/Madagascar/2699/200637: A/Hong Kong/CUHK65241/200635: A/Hong Kong/HKU69/200534: A/Malaysia/29930/2004
23: A/New South Wales/25/200024: A/Hong Kong/CUHK13048/2001
30: A/Denmark/107/200354: A/Cote d’lvoire/GR1542/201053: A/Peru/PER065/201052: A/Netherlands/034/201051: A/colombia/6722/201050: A/Wisconsin/23/2010
48: A/Florida/19/201049: A/Riyadh/01/2010
29: A/Queensland/40/200326: A/Queensland/19/200125: A/New York/273/2001
5447
A/Bangkok/1/1979
A/Memphis/33/1983
A/Memphis/5/1988A/Netherlands/620/1989
A/Stockholm/12/1992A/New york/772/1993
A/New york/609/1995
A/Malaysia/10675/1996A/Hong Kong/CUHK24749/2001
A/Hong Kong/CUHK53123/2002A/Denmark/116/2003
A/Christchurch/10/2004A/Missouri/NHRC0001/2005
A/LYON/1324/2006A/HaNoi/Q748/2007
A/Orebro/4/2009A/Peru/PER112/2010
A/Taiwan/879/2012
A/Victoria/692/2012
Fig. 3. Phylogeny of influenza A/H3N2 HA as a phylogeny of K-Pax2 clusters. Ancestors are defined as the minimum (average) geneticdistance groups, at least 1 year older. Each cluster is labelled by its earliest consensus sequence. Highlighted clusters connecting theviruses observed in 1968 to the most recent ones are the ‘core’ clusters. The scale bar indicates the expected number of substitutionsper site.
A/Beijing/1/1968
A/Bilthoven/21793/1972
A/Bilthoven/1761/1976
A/Texas/1/1977
A/Bangkok/1/1979
A/Memphis/33/1988
A/Memphis/5/1988
A/Netherlands/620/1989
A/Stockholm/12/1992
A/New York/772/1993
A/New York/609/1995
A/Malaysia/10675/1996
A/Hong Kong/CUHK24749/2001
0.02
A/Hong Kong/CUHK53123/2002
A/Denmark/116/2003
A/Christchurch/10/2004
A/Missiuri/NHRC0001/2005
A/LYON/1324/2006
A/HaNoi/Q748/2007
A/Orebro/4/2009
A/Peru/PER112/2010
A/Victoria/692/2012
A/Taiwan/879/2012
Fig. 4. Maximum-likelihood phylogenetic tree of influenza A/H3N2 HA, restricted to core cluster consensus sequences. The 23 strainsare the core clusters’ earliest consensus sequences. The scale bar indicates the expected number of substitutions per site.
Identification of cluster-defining positions in protein sequences
http://mgen.sgmjournals.org 7

Downloaded from www.microbiologyresearch.org by
IP: 165.124.167.78
On: Mon, 30 Nov 2015 09:59:42
which may not be core clusters themselves. Third, a core
cluster can descend only from an ancestral core cluster
that precedes it by at least 1 year. In addition, we assumed
that no recombination has occurred.
The above criteria led to the discovery of 23 core clusters
among the 57 clusters present in the K-Pax2 output.
We computed the genetic distance between clusters as
the average distance between their consensus sequences
using the corrected distance proposed by Tamura &
Kumar (2002) and the usual p-distance (Nei & Kumar,
2000). Both measures agreed. The tree in Fig. 3 was recon-
structed by choosing, for each group, the ancestor associ-
ated with the minimum distance. The core clusters can
be interpreted as the backbone clades of the A/H3N2 HA
phylogeny, connecting the viruses observed in 1968 to
the most recent ones. The classical ladder shape of the phy-
logenetic tree is conserved when only one consensus
sequence per core cluster is used (Fig. 4). These cluster
transitions closely resemble those reported by Smith et al.
(2004) based on a carefully curated set of sequences,
which represents less than 10 % of the data analysed
here. The evolutionary relationships among all the 57 clus-
ters are shown in Fig. S1.
Figure 5 shows how the characteristic sites of the core clus-
ters have evolved over time. This reflects the dominant role
of the B-cell epitopes in contrast to T-cell epitopes (Suzuki,
2006). To quantify the distribution of these changes over
time, we calculated unadjusted estimates of mutation
1968
B cell epitope A
B cell epitope C
B cell epitope E
B cell epitope B
B cell epitope D
Not B cell epitope
1972197619771979198319881989199219931995199620012002200320042005200620072009201020122012
122 124 126 130 131 132 133 135 137 138 140 142 143 144 145 146 150 152 168
44
57 59 62 63 67 75 78 80 81 82 83 86 87 88 91 92 94 109 260 261 262 265 1 4 7 10 13 16 19 22 25 28 31 34 37 40 43 55 60 65 69 72 76 84 90 97 101107112116123136148154169183195204211223232236243251255259267271281285289293301313317321325329
45 46 47 48 50 51 53 54 273 275 276 278 279 280 294 297 299 300 304 305 307 308 309 310 311 312 96 102 103 117 121 167 170 171 172 173 174 175 176 177 179 182 201 203 207 208 209 212 213 214 215 216 217 218 219 226 227 228 229 230 238 240 242 244 246 247 248
128 129 155 156 157 158 159 160 163 164 165 186 187 188 189 190 192 193 194 196 197 198
19681972197619771979198319881989199219931995199620012002200320042005200620072009201020122012
19681972197619771979198319881989199219931995199620012002200320042005200620072009201020122012
19681972197619771979198319881989199219931995199620012002200320042005200620072009201020122012
19681972197619771979198319881989199219931995199620012002200320042005200620072009201020122012
19681972197619771979198319881989199219931995199620012002200320042005200620072009201020122012
Fig. 5. HA1 chain characteristic sites and their changes across the 23 core clusters. Vertical grey bars indicate cases where the previouscharacteristic amino acid in the sequence position has not mutated to a new value. White in any position indicates that the amino acid is notdetermined as characteristic. All other colours correspond to specific amino acids. Abscissae indicate residues’ position along the HA protein.
A. Pessia and others
8 Microbial Genomics

Downloaded from www.microbiologyresearch.org by
IP: 165.124.167.78
On: Mon, 30 Nov 2015 09:59:42
rates in each epitope and elsewhere in HA1 (Table 1). Anti-
genic drift is thought to occur when an average of four
amino acid changes accumulates over time (Koel et al.,
2013). Many of the cluster transitions in Fig. 5 agree
with this definition, but some carry fewer substitutions,
which illustrates the usefulness of more flexible, statistical
Table 1. Unadjusted mutation rate estimates, as observed on the HA1 of influenza A/H3N2, by B cell epitope (BCE)
Rates have been estimated as y=ðltÞ, where y is the total number of amino acid changes, l is the length of the region and t is the time difference in
years between two clusters. Independence between sites and homogeneous rates per region are assumed.
Year A B C D E Not BCE HA1 global
1972 0.0263 0.0227 0.0093 0.0122 0.0114 0.0025 0.0076
1976 0.0395 0.0341 0.0185 0.0305 0.0227 0.0013 0.0121
1977 0.1053 0.1364 0.0741 0.122 0.0909 0.005 0.0455
1979 0.0526 0.0682 0 0.0244 0 0 0.0106
1983 0.0132 0.0114 0.0093 0.0183 0 0.0013 0.0053
1988 0.0105 0.0273 0 0 0.0091 0 0.003
1989 0.0526 0 0.037 0 0.0909 0 0.0121
1992 0.0175 0.0758 0.0123 0.0081 0.0152 0 0.0091
1993 0.0526 0 0 0.0244 0 0 0.0061
1995 0.0263 0.0227 0.037 0.0366 0 0 0.0106
1996 0.3684 0.1818 0.0741 0.0732 0.1364 0 0.0576
2001 0 0.0091 0.0074 0 0.0091 0.003 0.0036
2002 0.0526 0.0909 0 0 0.0455 0.005 0.0152
2003 0 0.0909 0 0.0244 0 0 0.0091
2004 0.0526 0 0 0.0244 0 0 0.0061
2005 0 0.0455 0.037 0 0 0.005 0.0091
2006 0.0526 0 0 0 0 0 0.003
2007 0 0 0 0.0244 0 0 0.003
2009 0 0.0455 0.0185 0.0122 0 0 0.0061
2010 0 0.0455 0.1111 0 0 0.0101 0.0182
2012(a)* 0.0263 0 0 0 0 0 0.0015
2012(b)* 0.0526 0.0227 0 0 0 0 0.0045
Global† 0.0311 0.0351 0.0152 0.0161 0.0145 0.0014 0.0092
*Mutations since 2010.
† It is unknown which of the two 2012 co-circulating groups will go extinct. The global rate has been computed by arbitrarily choosing cluster
2012(a).
4
2
1968
1972
1977
1983
1992
1989
1988
1995
1996
2002
2003
2004 2007
2006
2009
1993
1976
1979
0
-2
-4
0 10 20Antigenic dimention 1
Ant
igen
ic d
imen
tion
2
30 40
Fig. 6. Core clusters in antigenic space. Polygon shapes and sizes are dependent on the availability of inhibition assay data.
Identification of cluster-defining positions in protein sequences
http://mgen.sgmjournals.org 9

Downloaded from www.microbiologyresearch.org by
IP: 165.124.167.78
On: Mon, 30 Nov 2015 09:59:42
model-based rules to pinpoint potential targets for furtherattention and experimental work. The inferred changes arenot uniformly distributed over the five epitopes (chi-squared test, x2519.665, df54, Pv0.001); instead changesin epitopes B and A are over-represented (in decreasingorder), which matches well with current understandingof their relative functional importance (Koel et al., 2013).
Figure 6 shows how the core clusters relate to each other inantigenic space, based on haemagglutination inhibitionassays (Bedford et al., 2014). Many clusters are clearly dis-tinct from each other, supporting the conclusion that K-Pax2 successfully identifies meaningful phenotypes. Thepairs of clusters where an overlap occurs represent coreclusters that arise in succession in Fig. 4. This suggeststhat our method has high sensitivity to detect changesthat relate to early antigenic separation of strains, makingit potentially also useful for continuous semi-automatedscreening of novel antigenic types from sequenced strains.
While K-Pax2 can generate hypotheses about which aminoacids are under selection simply on the basis of sequencedata, the integration of K-Pax2 output and other datacan yield additional hypotheses. Video S1 displays thecharacteristic amino acid changes in core clustersmapped to the 3D structure of HA. The most comprehen-sive transition occurs in the 1996 group where changesoccurred in all five epitopes, shown as a pronouncedjump in antigenic space (Fig. 6). Interestingly, sequentialchanges in core characteristic sites rarely occur in closeproximity, even when within the same epitope. Thisraises the possibility that selection tends to favour alterna-tion across the protein surface, even within a singledomain. Such patterns are consistent with the idea thatHA evades immunity through sequential mutations thatenable escape from different subpopulations (Lindermanet al., 2014; Sato et al., 2004).
Conclusions
There is a widening gap between the number of exper-imentally validated evolutionary mechanisms and theabundance of sequence data. Hence, there is demand forcomputational tools that can aid in harvesting biologicallymeaningful signals from data to guide further research.
Using thousands of publicly available HA sequences fromA/H3N2 since 1968, we demonstrated that a Bayesianmodelling approach can identify patterns of sequence vari-ation that reflect known existing drivers of A/H3N2 evol-ution. These results suggest the power of K-Pax2 toextract evolutionary signals from microbial sequence col-lections and to provide a critically needed tool to guidestudies of protein function and evolution.
Despite the demonstrated ability of our method to success-fully explore sequence variation without imposing anexplicit dynamic evolutionary model, there are caveats tobe aware of. Like most statistical methods, the model-based clustering can be affected by sampling biases of var-ious kinds. Highly uneven sampling over space and time
will both reduce the power to detect novel variants andinflate the false positive rate of functionally critical residuechanges. Furthermore, certain evolutionary processes suchas episodic selection can create a pattern that resemblesthose implied by positive selection, and hence the inferredclusters may lack meaningful interpretation in phenotypespace. Furthermore, hitchhiking phenomena due to geneticlinkage may confound the identification of the causal var-iants as characteristic sites.
K-Pax2 has been implemented as an R package and is freelyavailable at http://www.helsinki.fi/bsg/software/kpax2/ andat https://github.com/alberto-p/kpax2.
Acknowledgements
We acknowledge the authors, and originating and submit-ting laboratories of the sequences from GISAID EpiFluDatabase on which this research is based (the list is detailedin Table S3). We thank Trevor Bedford for kindly provid-ing us with the data points used to create Fig. 6.
References
Aguas, R. & Ferguson, N. M. (2013). Feature selection methods foridentifying genetic determinants of host species in RNA viruses.PLOS Comput Biol 9, e1003254.
Bao, Y., Bolotov, P., Dernovoy, D., Kiryutin, B., Zaslavsky, L.,Tatusova, T., Ostell, J. & Lipman, D. (2008). The influenza virusresource at the National Center for Biotechnology Information.J Virol 82, 596–601.
Bedford, T., Suchard, M. A., Lemey, P., Dudas, G., Gregory, V., Hay,A. J., McCauley, J. W., Russell, C. A., Smith, D. J. & Rambaut, A.(2014). Integrating influenza antigenic dynamics with molecularevolution. eLife 3, e01914.
Benson, D. A., Karsch-Mizrachi, I., Lipman, D. J., Ostell, J. & Wheeler,D. L. (2005). GenBank. Nucleic Acids Res 33, D34–D38.
Bernardo, J. M. & Smith, A. F. M. (2000). Bayesian Theory. Chichester:Wiley.
Bizebard, T., Gigant, B., Rigolet, P., Rasmussen, B., Diat, O.,Bosecke, P., Wharton, S. A., Skehel, J. J. & Knossow, M. (1995).Structure of influenza virus haemagglutinin complexed with aneutralizing antibody. Nature 376, 92–94.
Bogner, P., Capua, I., Lipman, D. J., Cox, N. J. & other authors (2006).A global initiative on sharing avian flu data. Nature 442, 981–981.
Cheng, L., Connor, T. R., Siren, J., Aanensen, D. M. & Corander, J.(2013). Hierarchical and spatially explicit clustering of DNAsequences with BAPS software. Mol Biol Evol 30, 1224–1228.
Cotten, M., Watson, S. J., Kellam, P., Al-Rabeeah, A. A., Makhdoom,H. Q., Assiri, A., Al-Tawfiq, J. A., Alhakeem, R. F., Madani, H. & otherauthors (2013). Transmission and evolution of the Middle Eastrespiratory syndrome coronavirus in Saudi Arabia: a descriptivegenomic study. Lancet 382, 1993–2002.
Edgar, R. C. (2004). MUSCLE: multiple sequence alignment with highaccuracy and high throughput. Nucleic Acids Res 32, 1792–1797.
Fitch, W. M., Leiter, J. M., Li, X. Q. & Palese, P. (1991). PositiveDarwinian evolution in human influenza A viruses. Proc Natl AcadSci U S A 88, 4270–4274.
Fleury, D., Barrere, B., Bizebard, T., Daniels, R. S., Skehel, J. J. &Knossow, M. (1999). A complex of influenza hemagglutinin with a
A. Pessia and others
10 Microbial Genomics

Downloaded from www.microbiologyresearch.org by
IP: 165.124.167.78
On: Mon, 30 Nov 2015 09:59:42
neutralizing antibody that binds outside the virus receptor bindingsite. Nat Struct Biol 6, 530–534.
Gire, S. K., Goba, A., Andersen, K. G., Sealfon, R. S. G., Park, D. J.,Kanneh, L., Jalloh, S., Momoh, M., Fullah, M. & other authors(2014). Genomic surveillance elucidates Ebola virus origin andtransmission during the 2014 outbreak. Science 345, 1369–1372.
Gong, L. I. & Bloom, J. D. (2014). Epistatically interactingsubstitutions are enriched during adaptive protein evolution. PLoSGenet 10, e1004328.
Hastie, T., Tibshirani, R. & Friedman, J. (2009). The Elements ofStatistical Learning, 2nd edn. Berlin: Springer.
Jain, S. & Neal, R. M. (2007). Splitting and merging components of anonconjugate Dirichlet process mixture model. Bayesian Anal 2,445–472.
Knossow, M., Gaudier, M., Douglas, A., Barrere, B., Bizebard, T.,Barbey, C., Gigant, B. & Skehel, J. J. (2002). Mechanism ofneutralization of influenza virus infectivity by antibodies. Virology302, 294–298.
Koel, B. F., Burke, D. F., Bestebroer, T. M., van der Vliet, S., Zondag,G. C. M., Vervaet, G., Skepner, E., Lewis, N. S., Spronken, M. I. J. &other authors (2013). Substitutions near the receptor binding sitedetermine major antigenic change during influenza virus evolution.Science 342, 976–979.
Koser, C. U., Ellington, M. J., Cartwright, E. J. P., Gillespie, S. H.,Brown, N. M., Farrington, M., Holden, M. T. G., Dougan, G.,Bentley, S. D. & other authors (2012). Routine use of microbialwhole genome sequencing in diagnostic and public healthmicrobiology. PLoS Pathog 8, e1002824.
Linderman, S. L., Chambers, B. S., Zost, S. J., Parkhouse, K., Li, Y.,Herrmann, C., Ellebedy, A. H., Carter, D. M., Andrews, S. F. &other authors (2014). Potential antigenic explanation for atypicalH1N1 infections among middle-aged adults during the 2013–2014influenza season. Proc Natl Acad Sci U S A 111, 15798–15803.
Marttinen, P., Corander, J., Toronen, P. & Holm, L. (2006). Bayesiansearch of functionally divergent protein subgroups and theirfunction specific residues. Bioinformatics 22, 2466–2474.
Marttinen, P., Myllykangas, S. & Corander, J. (2009). Bayesianclustering and feature selection for cancer tissue samples. BMCBioinformatics 10, 90.
Meroz, D., Yoon, S.-W., Ducatez, M. F., Fabrizio, T. P., Webby, R. J.,Hertz, T. & Ben-Tal, N. (2011). Putative amino acid determinantsof the emergence of the 2009 influenza A (H1N1) virus in thehuman population. Proc Natl Acad Sci U S A 108, 13522–13527.
Neal, R. M. (2000). Markov chain sampling methods for Dirichletprocess mixture models. J Comput Graph Stat 9, 249–265.
Nei, M. & Kumar, S. (2000). Molecular Evolution and Phylogenetics.Oxford: Oxford University Press.
Reuter, S., Ellington, M. J., Cartwright, E. J. P., Koser, C. U., Torok,M. E., Gouliouris, T., Harris, S. R., Brown, N. M., Holden, M. T. G. &
other authors (2013). Rapid bacterial whole-genome sequencing to
enhance diagnostic and public health microbiology. JAMA Intern
Med 173, 1397–1404.
Sato, K., Morishita, T., Nobusawa, E., Tonegawa, K., Sakae, K.,
Nakajima, S. & Nakajima, K. (2004). Amino-acid change on the
antigenic region B1 of H3 haemagglutinin may be a trigger for the
emergence of drift strain of influenza A virus. Epidemiol Infect 132,
399–406.
Skehel, J. J. & Wiley, D. C. (2000). Receptor binding and membrane
fusion in virus entry: the influenza hemagglutinin. Annu Rev
Biochem 69, 531–569.
Smith, D. J., Lapedes, A. S., de Jong, J. C., Bestebroer, T. M.,
Rimmelzwaan, G. F., Osterhaus, A. D. M. E. & Fouchier, R. A. M.
(2004). Mapping the antigenic and genetic evolution of influenza
virus. Science 305, 371–376.
Squires, R. B., Noronha, J., Hunt, V., Garcıa-Sastre, A., Macken, C.,
Baumgarth, N., Suarez, D., Pickett, B. E., Zhang, Y. & other
authors (2012). Influenza research database: an integrated
bioinformatics resource for influenza research and surveillance.
Influenza Other Respi Viruses 6, 404–416.
Suzuki, Y. (2006). Natural selection on the influenza virus genome.
Mol Biol Evol 23, 1902–1911.
Suzuki, Y. (2011). Positive selection for gains of N-linked
glycosylation sites in hemagglutinin during evolution of H3N2
human influenza A virus. Genes Genet Syst 86, 287–294.
Tamura, K. & Kumar, S. (2002). Evolutionary distance estimation
under heterogeneous substitution pattern among lineages. Mol Biol
Evol 19, 1727–1736.
Wolf, Y. I., Viboud, C., Holmes, E. C., Koonin, E. V. & Lipman, D. J.
(2006). Long intervals of stasis punctuated by bursts of positive
selection in the seasonal evolution of influenza A virus. Biol Direct
1, 34.
Worobey, M., Han, G.-Z. & Rambaut, A. (2014). A synchronized global
sweep of the internal genes of modern avian influenza virus. Nature
508, 254–257.
Data Bibliography
1. Pessia, A., Grad, Y., Cobey, S., Puranen, J. S. & Corander,
J. Figshare. http://dx.doi.org/10.6084/m9.figshare.1334296 (2015)
2. Pessia, A., Grad, Y., Cobey, S., Puranen, J. S. & Corander,
J. Figshare. http://dx.doi.org/10.6084/m9.figshare.1334294 (2015)
3. Pessia, A., Grad, Y., Cobey, S., Puranen, J. S. & Corander,
J. Figshare. http://dx.doi.org/10.6084/m9.figshare.1334297 (2015)
4. Pessia, A., Grad, Y., Cobey, S., Puranen, J. S. & Corander,
J. Figshare. http://dx.doi.org/10.6084/m9.figshare.1334293 (2015)
Identification of cluster-defining positions in protein sequences
http://mgen.sgmjournals.org 11


![[re]defining age - LeadingAge New Jersey](https://img.pdfslide.us/doc/110x75/5868e06a1a28ab5e1d8b8feb/redening-age-leadingage-new-jersey.jpg)