Embed Size (px)
Citation preview
KKKeeeyyy LLLaaarrrgggooo WWWaaasssttteeewwwaaattteeerrr TTTrrreeeaaatttmmmeeennnttt DDDiiissstttrrriiicccttt CCCOOOMMMPPPRRREEEHHHEEENNNSSSIIIVVVEEE AAANNNNNNUUUAAALLL FFFIIINNNAAANNNCCCIIIAAALLL RRREEEPPPOOORRRTTT
SSSEEEPPPTTTEEEMMMBBBEEERRR 333000,,, 222000111888
Key Largo Wastewater Treatment DistrictComprehensive Annual Financial Report
For the Fiscal Year ended September 30, 2018
Table of Contents
I. INTRODUCTORY SECTION
Letter of Transmittal............................................................................................................................i – iiOrganization Chart..................................................................................................................................iiiList of Principal Officials .........................................................................................................................iv
II. FINANCIAL SECTION
Independent Auditor’s Report.............................................................................................................. 1-2Management’s Discussion and Analysis ............................................................................................. 3-7
Basic Financial Statements:Statement of Net Position ................................................................................................................ 8Statement of Revenues, Expenses andChanges in Net Position................................................................................................................. 9
Statement of Cash Flows ............................................................................................................... 10Notes to Financial Statements ..................................................................................................11-19
Required Supplementary Information: Schedule of Changes in Net OPEB Liability and Related Ratios ................................................... 20
Supplementary Information (Other Schedule):Schedule of Revenues and Expenses (Budgetary Basis) –Budget and Actual........................................................................................................................ 21
III. STATISTICAL SECTION
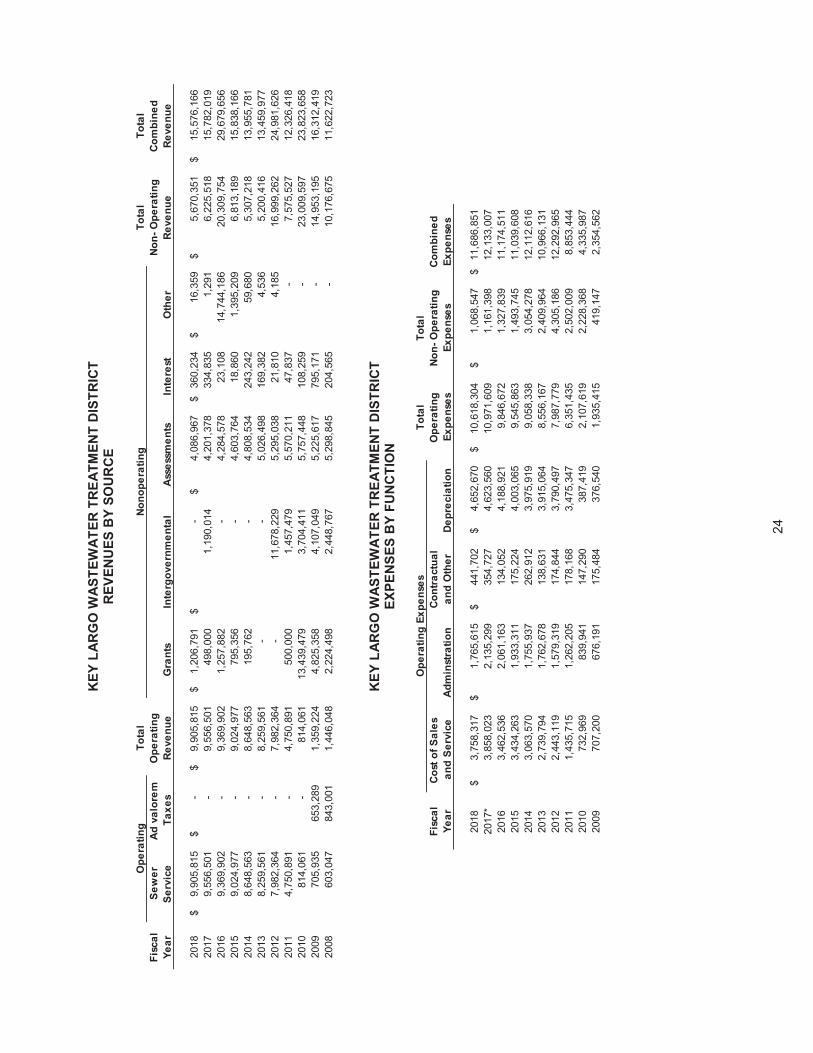
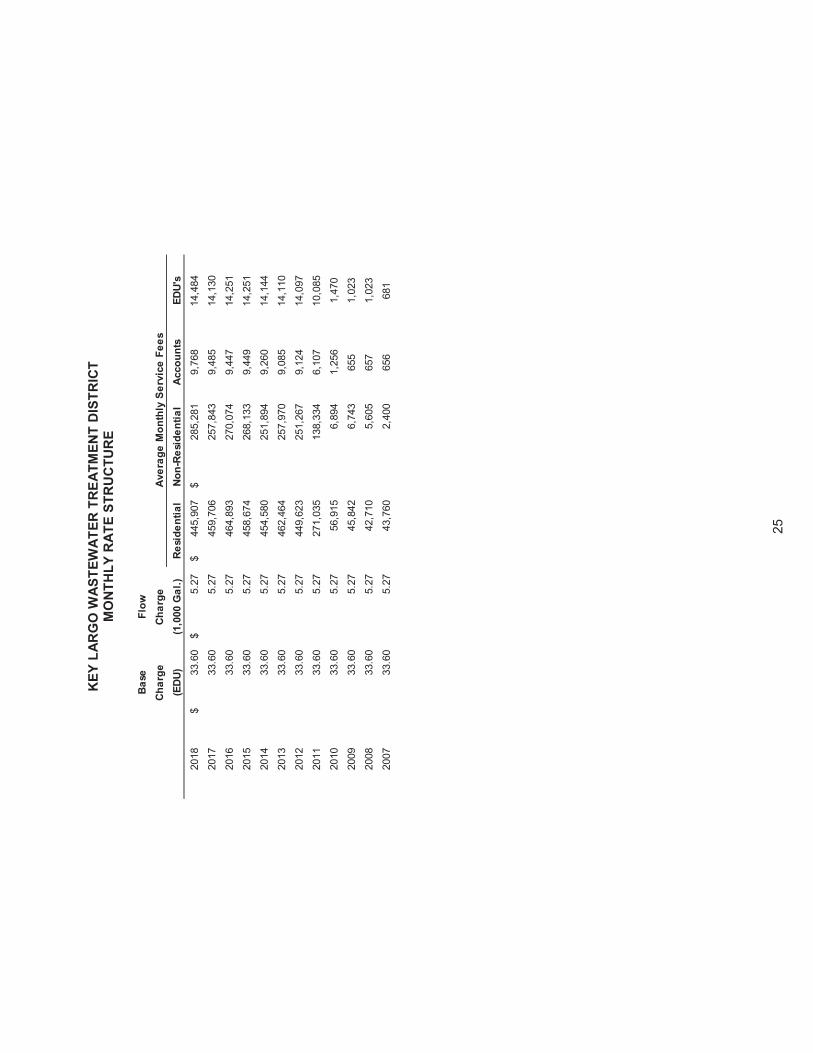
Net Position by Component.................................................................................................................. 22Change in Net Position......................................................................................................................... 23Revenues by Source ............................................................................................................................ 24Expenses by Function .......................................................................................................................... 24Monthly Rate Structure......................................................................................................................... 25System Development Charge Structure............................................................................................... 26Ratio of Outstanding Debt .................................................................................................................... 27Demographic and Economic Statistics ................................................................................................. 28District Employees by Function ............................................................................................................ 28Operating Indicators ............................................................................................................................. 29Miscellaneous Statistical Information ................................................................................................... 30
IV. OTHER REPORTS (COMPLIANCE SECTION)
Independent Auditor’s Report on Internal Control over Financial Reporting and on Compliance and Other Matters Based on an Audit of Financial Statements Performed in AccordanceWith Government Auditing Standards .......................................................................................... 31-32
Independent Auditor’s Report on Compliance for Each Major Program and on Internal ControlOver Compliance Required by the Uniform Guidance...................................................................33-34
Schedule of Expenditures of Federal Awards ...................................................................................... 35
Notes to Schedule of Expenditures of Federal Awards........................................................................ 36
Schedule of Findings and Questioned Costs ....................................................................................... 37
Key Largo Wastewater Treatment DistrictComprehensive Annual Financial Report
For the Fiscal Year ended September 30, 2018
Table of Contents (Continued)
IV. OTHER REPORTS (COMPLIANCE SECTION) (Continued)
Independent Auditor’s Report on Compliance with the Requirements of Section 218.415, Florida Statutes, Required by Rule 10.556(10) of the Auditor General of the State of Florida ...................... 38
Management Letter Pursuant to the Rules of the Auditor General for the State of Florida.............39-40
i
ii
iii
iv
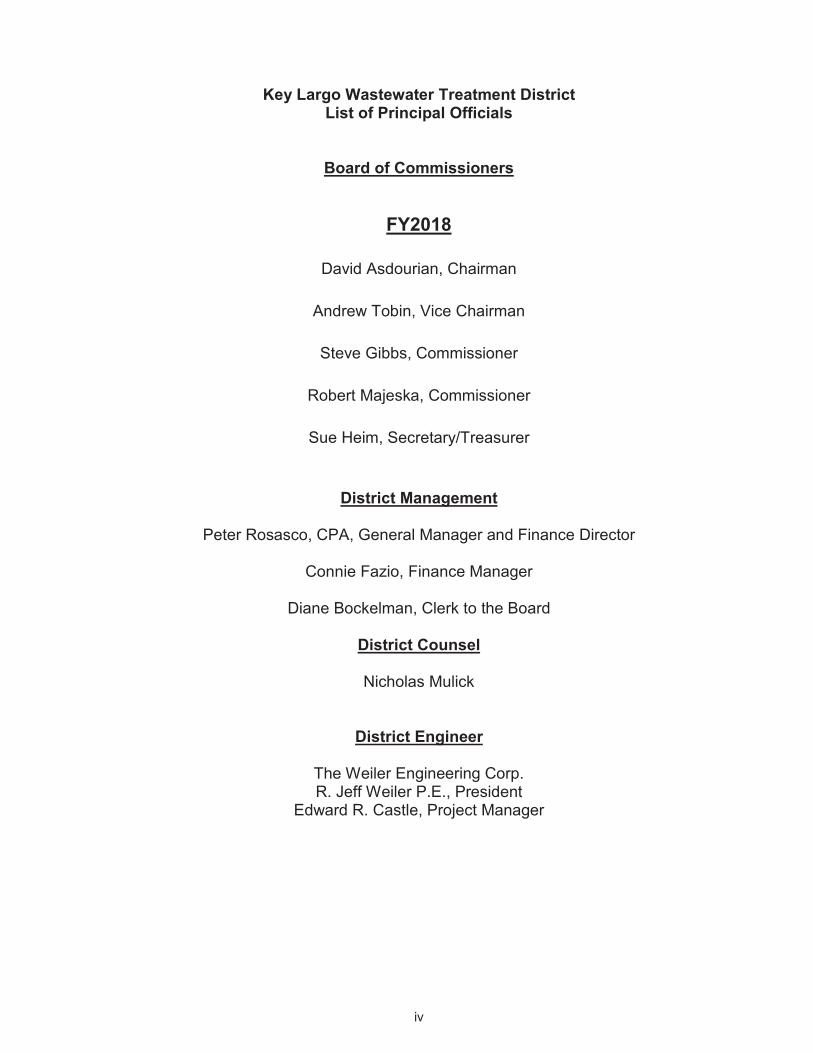
Key Largo Wastewater Treatment DistrictList of Principal Officials
Board of Commissioners
FY2018
David Asdourian, Chairman
Andrew Tobin, Vice Chairman
Steve Gibbs, Commissioner
Robert Majeska, Commissioner
Sue Heim, Secretary/Treasurer
District Management
Peter Rosasco, CPA, General Manager and Finance Director
Connie Fazio, Finance Manager
Diane Bockelman, Clerk to the Board
District Counsel
Nicholas Mulick
District Engineer
The Weiler Engineering Corp.R. Jeff Weiler P.E., President
Edward R. Castle, Project Manager

THIS PAGE INTENTIONALLY LEFT BLANK

Financial Section
Boca Raton, Florida 33431(561) 994- -4728Fax (561) 994-5823www.graucpa.com
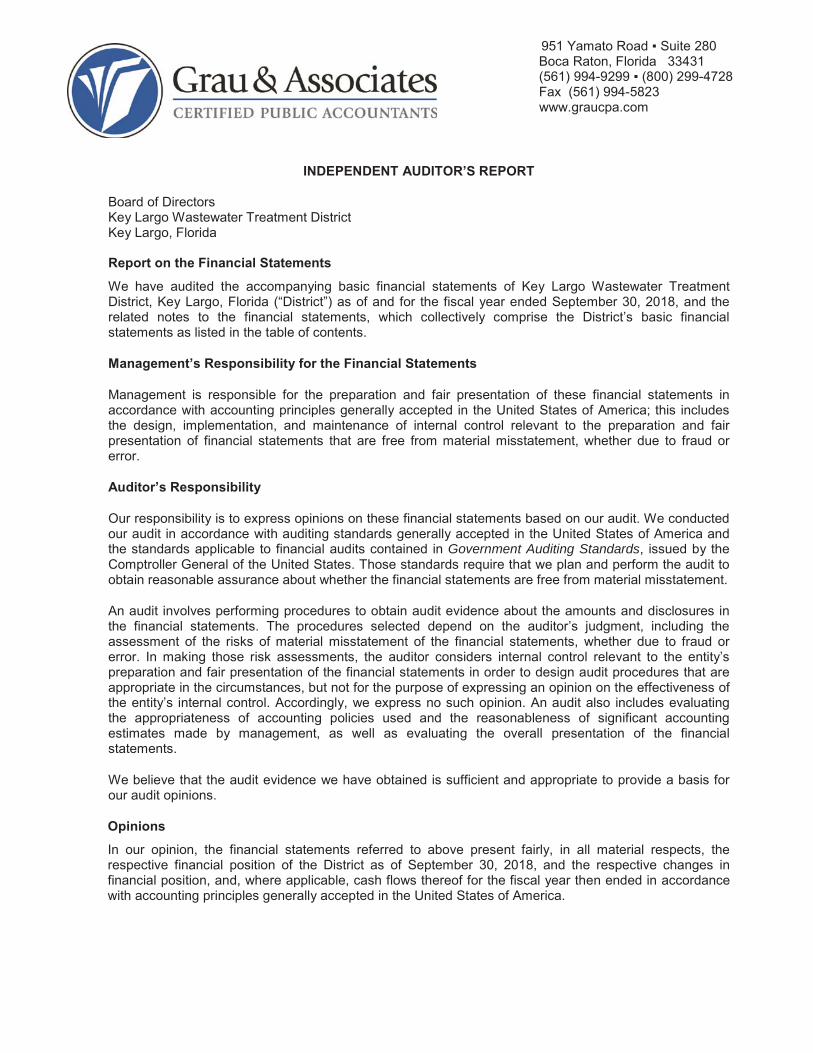
INDEPENDENT AUDITOR’S REPORT
Board of DirectorsKey Largo Wastewater Treatment DistrictKey Largo, Florida
Report on the Financial StatementsWe have audited the accompanying basic financial statements of Key Largo Wastewater Treatment District, Key Largo, Florida (“District”) as of and for the fiscal year ended September 30, 2018, and the related notes to the financial statements, which collectively comprise the District’s basic financial statements as listed in the table of contents.
Management’s Responsibility for the Financial Statements
Management is responsible for the preparation and fair presentation of these financial statements in accordance with accounting principles generally accepted in the United States of America; this includes the design, implementation, and maintenance of internal control relevant to the preparation and fair presentation of financial statements that are free from material misstatement, whether due to fraud or error.
Auditor’s Responsibility
Our responsibility is to express opinions on these financial statements based on our audit. We conducted our audit in accordance with auditing standards generally accepted in the United States of America and the standards applicable to financial audits contained in Government Auditing Standards, issued by the Comptroller General of the United States. Those standards require that we plan and perform the audit to obtain reasonable assurance about whether the financial statements are free from material misstatement.
An audit involves performing procedures to obtain audit evidence about the amounts and disclosures in the financial statements. The procedures selected depend on the auditor’s judgment, including the assessment of the risks of material misstatement of the financial statements, whether due to fraud or error. In making those risk assessments, the auditor considers internal control relevant to the entity’s preparation and fair presentation of the financial statements in order to design audit procedures that are appropriate in the circumstances, but not for the purpose of expressing an opinion on the effectiveness of the entity’s internal control. Accordingly, we express no such opinion. An audit also includes evaluating the appropriateness of accounting policies used and the reasonableness of significant accounting estimates made by management, as well as evaluating the overall presentation of the financial statements.
We believe that the audit evidence we have obtained is sufficient and appropriate to provide a basis for our audit opinions.
OpinionsIn our opinion, the financial statements referred to above present fairly, in all material respects, the respective financial position of the District as of September 30, 2018, and the respective changes in financial position, and, where applicable, cash flows thereof for the fiscal year then ended in accordance with accounting principles generally accepted in the United States of America.

2
Other Matters
Required Supplementary Information
Accounting principles generally accepted in the United States of America require that the management’s discussion and analysis and other required supplementary information be presented to supplement the basic financial statements. Such information, although not a part of the basic financial statements, is required by the Governmental Accounting Standards Board, who considers it to be an essential part of financial reporting for placing the basic financial statements in an appropriate operational, economic, or historical context. We have applied certain limited procedures to the required supplementary information in accordance with auditing standards generally accepted in the United States of America, which consisted of inquiries of management about the methods of preparing the information and comparing the information for consistency with management’s responses to our inquiries, the basic financial statements, and other knowledge we obtained during our audit of the basic financial statements. We do not express an opinion or provide any assurance on the information because the limited procedures do not provide us with sufficient evidence to express an opinion or provide any assurance.
Other Information
Our audit was conducted for the purpose of forming opinions on the financial statements that collectivelycomprise the District’s financial statements as a whole. The introductory section, statistical section, and budgetary information are presented for purposes of additional analysis and are not a required part of thebasic financial statements. The introductory, statistical sections and budgetary information have not been subjected to the auditing procedures applied in the audit of the basic financial statements and, accordingly, we do not express an opinion or provide any assurance on it.
Other Reporting Required by Government Auditing Standards
In accordance with Government Auditing Standards, we have also issued our report dated April 5, 2019,on our consideration of the District’s internal control over financial reporting and on our tests of itscompliance with certain provisions of laws, regulations, contracts, grant agreements and other matters. The purpose of that report is to describe the scope of our testing of internal control over financial reporting and compliance and the results of that testing, and not to provide an opinion on the effectiveness of the District’s internal control over financial reporting or on compliance. That report is an integral part of an audit performed in accordance with Government Auditing Standards in considering the District’s internal control over financial reporting and compliance.
Report on Other Legal and Regulatory Requirements
We have also issued our report dated April 5, 2019, on our consideration of the District’s compliance withthe requirements of Section 218.415, Florida Statutes, as required by Rule 10.556(10) of the Auditor General of the State of Florida. The purpose of that report is to provide an opinion based on our examination conducted in accordance with attestation standards established by the American Institute of Certified Public Accountants.
April 5, 2019
THIS PAGE INTENTIONALLY LEFT BLANK
Management’s Discussion and Analysis
3
KEY LARGO WASTEWATER TREATMENT DISTRICTMANAGEMENT’S DISCUSSION AND ANALYSIS
On behalf of the Key Largo Wastewater Treatment District, Key Largo, Florida (District), management presents this narrative overview and analysis of financial activities of the District to readers of the District's financial statements for the fiscal year ended September 30, 2018. We are including this discussion and analysis in order to provide the reader with a better understanding of the District's overall financial position. This narrative should be considered in conjunction with the additional information contained in the introductory transmittal letter and the District's financial statements which follow in this section.
Overview of Operations
The District was formed as a special district with the election of inaugural commissioners on November 5,2002, as provided in Chapter 2002-337, Florida Statutes. The District's mission includes the introduction and operation of advanced wastewater treatment and disposal infrastructure to serve all residents andcommercial operations on the unincorporated island of Key Largo.
From FY2003 through FY2011, The District focused on its role as a new public utility and constructing a single regional treatment facility and vacuum collection system to the KLWTD service area. Originally, thewastewater treatment plant's capacity was 0.183mgd (million gallons per day) and was increased to2.3mgd in FY2011 to ultimately serve the area with a single regional treatment facility. Installation of thetransmission main and vacuum collection systems took place in all service areas.
The District created a policy of levying special assessments on all parcels to be benefited by theconstruction. The assessments on the benefiting property owners were intended to recover a portion of the cost of the improvements. Each parcel owner had the choice to pay the assessment in full or as a non-ad valorem tax over a 20 year period.
In FY2012 the District entered into an interlocal agreement with the lslamorada Village of Islands to treat its wastewater and sell treatment plant capacity space of 1.104 million gallons of average daily flow. InFY2014 the District began receiving flows from lslamorada for treatment.
From FY2015 through FY2016, the treatment plant capacity was upgraded to 3.45mgd to accommodate the additional flows from lslamorada. The system consistently meets Advanced Wastewater TreatmentStandards (AWT).
A grinder pump project commenced during FY2012 and was substantially completed in FY2016. The grinder pump project provides centralized sewer service to properties where it was cost prohibitive toprovide a vacuum based collection system.
A chemical feed system upgrade project and the blower upgrade project were completed in FY2017.
During FY2018, the District began a capital upgrades project that included a process water system project, a headworks bypass piping project, a bridge to SBR #3 and filter booster pump upgrade. In addition, a solar arrays project commenced in FY2018, which included solar panels over the disinfection basin and on the roof of the operations building. The solar panel project will decrease the District's electricity and chemical expenses, while utilizing sustainable energy.

4
The District’s Single Enterprise Fund
The District uses proprietary fund accounting to record and report its results of operation as a single enterprise fund. This method of accounting is used when an entity charges customers for the services it provides.
Basic Financial Statements
The basic financial statements are designed to provide readers with a broad overview of the District’s finances, in a manner similar to a private-sector business.
The statement of net position presents information on all the District’s assets and liabilities, with the difference between the two reported as net position. Over time, increases or decreases in net position may serve as a useful indicator of whether the financial position of the District is improving or deteriorating.
The statement of revenues, expenses and changes in net position presents information showing how the District’s net position changed during the most recent fiscal year. All changes in net position are reported as soon as the underlying event giving rise to the change occurs, regardless of the timing of related cash flows. Thus, revenues and expenses are reported in this statement for some items that will result in cash flows in future fiscal periods (e.g., earned but unused vacation leave).
District’s Net Position
Total assets of the District at September 30, 2018, were $180,573,478 and total liabilities amounted to$61,232,861. Total net position of the District was $119,310,272. For the prior year, total assets of theDistrict at September 30, 2017, were $185,296,136 and total liabilities amounted to $69,874,813 and totalnet position of the District was $115,421,323.
Total current assets of $17,554,233 at September 30, 2018 consisted of $1,034,061 in amounts due to the District from other government agencies and unrestricted cash and cash equivalents of $11,552,632.Restricted current assets included cash and cash equivalents of $4,939,225, restricted for debt service and reserves for future repairs and replacements. For the prior year, total current assets of $14,415,939 at September 30, 2017 consisted of $1,158,375 in amounts due to the District from other governmentagencies. The District had unrestricted cash and cash equivalents of $9,312,730 and restricted cash andcash equivalents of $3,871,968. These funds were restricted for debt service and reserves for future repairs and replacements.
Total noncurrent assets at September 30, 2018 of $163,019,245 consisted essentially of $12,935,238 inamounts due from other governments, $58,295 in prepaid expense and other assets, $25,326,249 inassessments levied but not received, $124,699,463 in land, equipment, and infrastructure net ofaccumulated depreciation owned by the District. In the prior year, total noncurrent assets at September30, 2017 of $170,880,197 consisted essentially of $59,095 in prepaid expenses and other assets,$28,507,957 in assessments levied but not received, and $128,695,777 in land, equipment, construction in progress, and infrastructure net of accumulated depreciation owned by the District.
5
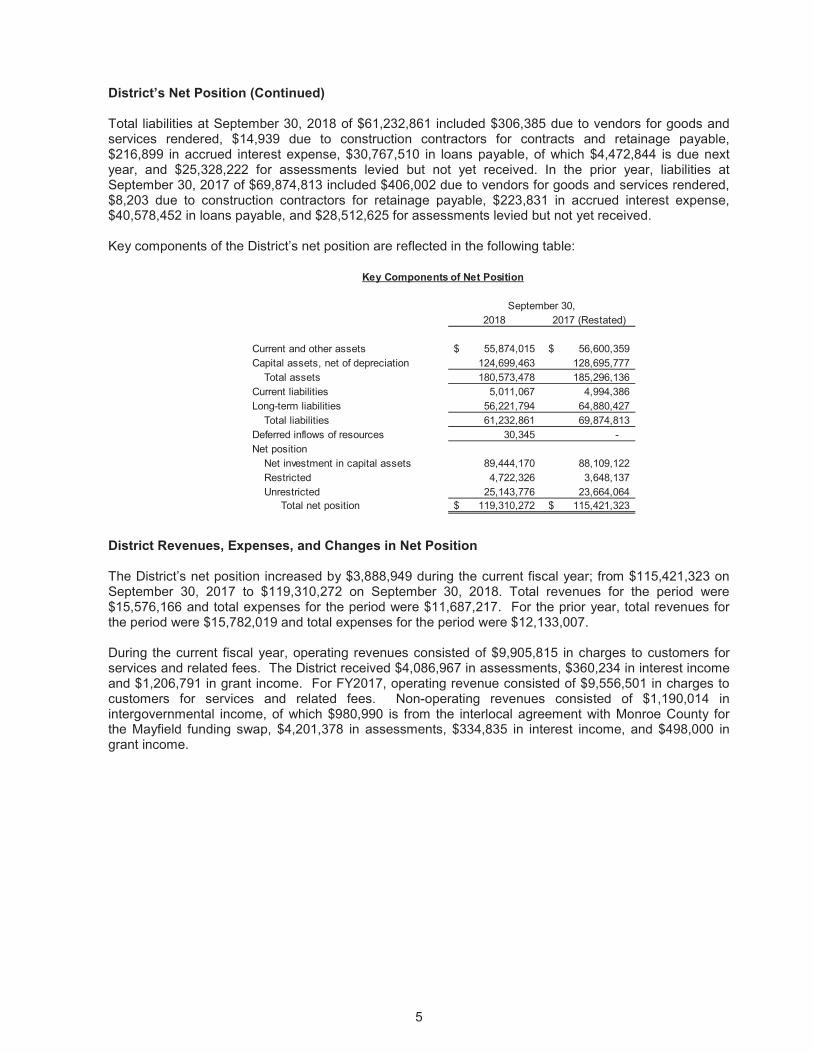
District’s Net Position (Continued)
Total liabilities at September 30, 2018 of $61,232,861 included $306,385 due to vendors for goods and services rendered, $14,939 due to construction contractors for contracts and retainage payable, $216,899 in accrued interest expense, $30,767,510 in loans payable, of which $4,472,844 is due next year, and $25,328,222 for assessments levied but not yet received. In the prior year, liabilities at September 30, 2017 of $69,874,813 included $406,002 due to vendors for goods and services rendered, $8,203 due to construction contractors for retainage payable, $223,831 in accrued interest expense, $40,578,452 in loans payable, and $28,512,625 for assessments levied but not yet received.
Key components of the District’s net position are reflected in the following table:
2018 2017 (Restated)
Current and other assets 55,874,015$ 56,600,359$Capital assets, net of depreciation 124,699,463 128,695,777
Total assets 180,573,478 185,296,136Current liabilities 5,011,067 4,994,386Long-term liabilities 56,221,794 64,880,427
Total liabilities 61,232,861 69,874,813Deferred inflows of resources 30,345 -Net position
Net investment in capital assets 89,444,170 88,109,122Restricted 4,722,326 3,648,137Unrestricted 25,143,776 23,664,064
Total net position 119,310,272$ 115,421,323$
Key Components of Net Position
September 30,
District Revenues, Expenses, and Changes in Net Position
The District’s net position increased by $3,888,949 during the current fiscal year; from $115,421,323 on September 30, 2017 to $119,310,272 on September 30, 2018. Total revenues for the period were $15,576,166 and total expenses for the period were $11,687,217. For the prior year, total revenues for the period were $15,782,019 and total expenses for the period were $12,133,007.
During the current fiscal year, operating revenues consisted of $9,905,815 in charges to customers for services and related fees. The District received $4,086,967 in assessments, $360,234 in interest income and $1,206,791 in grant income. For FY2017, operating revenue consisted of $9,556,501 in charges to customers for services and related fees. Non-operating revenues consisted of $1,190,014 in intergovernmental income, of which $980,990 is from the interlocal agreement with Monroe County for the Mayfield funding swap, $4,201,378 in assessments, $334,835 in interest income, and $498,000 ingrant income.
6
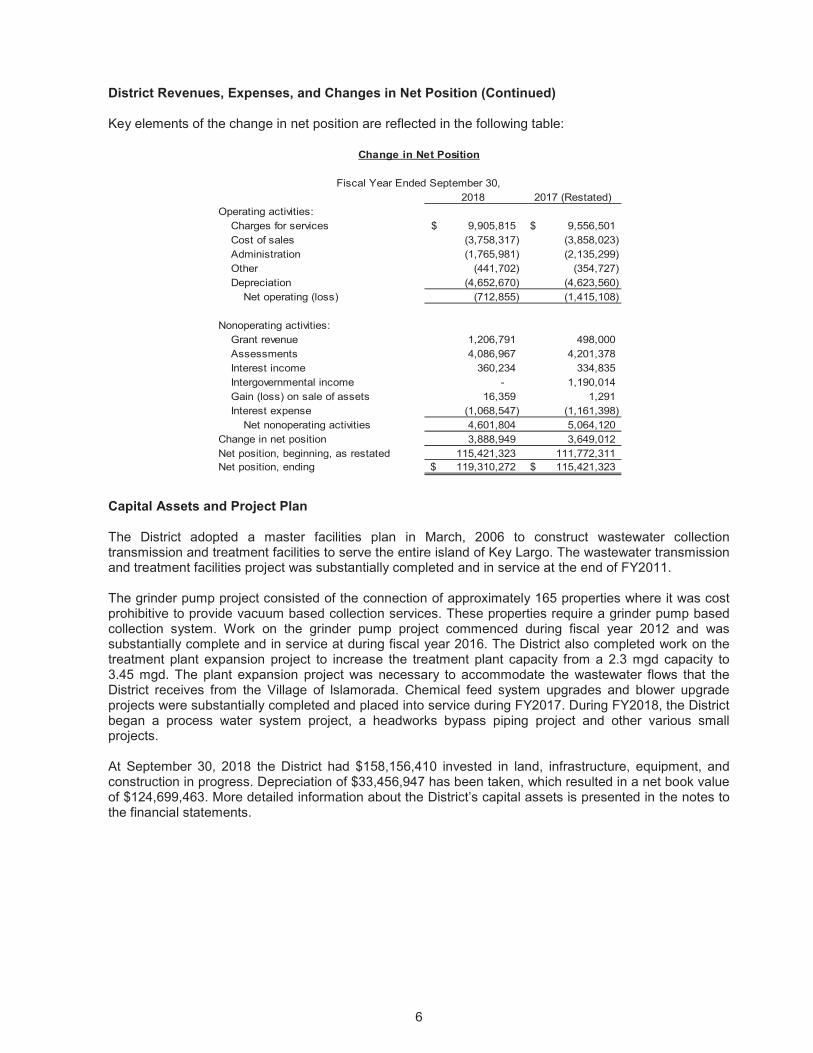
District Revenues, Expenses, and Changes in Net Position (Continued)
Key elements of the change in net position are reflected in the following table:
2018 2017 (Restated)Operating activities:
Charges for services 9,905,815$ 9,556,501$Cost of sales (3,758,317) (3,858,023)Administration (1,765,981) (2,135,299)Other (441,702) (354,727)Depreciation (4,652,670) (4,623,560)
Net operating (loss) (712,855) (1,415,108)
Nonoperating activities:Grant revenue 1,206,791 498,000Assessments 4,086,967 4,201,378Interest income 360,234 334,835Intergovernmental income - 1,190,014Gain (loss) on sale of assets 16,359 1,291Interest expense (1,068,547) (1,161,398)
Net nonoperating activities 4,601,804 5,064,120Change in net position 3,888,949 3,649,012Net position, beginning, as restated 115,421,323 111,772,311Net position, ending 119,310,272$ 115,421,323$
Change in Net Position
Fiscal Year Ended September 30,
Capital Assets and Project Plan
The District adopted a master facilities plan in March, 2006 to construct wastewater collection transmission and treatment facilities to serve the entire island of Key Largo. The wastewater transmission and treatment facilities project was substantially completed and in service at the end of FY2011.
The grinder pump project consisted of the connection of approximately 165 properties where it was costprohibitive to provide vacuum based collection services. These properties require a grinder pump basedcollection system. Work on the grinder pump project commenced during fiscal year 2012 and wassubstantially complete and in service at during fiscal year 2016. The District also completed work on thetreatment plant expansion project to increase the treatment plant capacity from a 2.3 mgd capacity to 3.45 mgd. The plant expansion project was necessary to accommodate the wastewater flows that the District receives from the Village of lslamorada. Chemical feed system upgrades and blower upgrade projects were substantially completed and placed into service during FY2017. During FY2018, the District began a process water system project, a headworks bypass piping project and other various small projects.
At September 30, 2018 the District had $158,156,410 invested in land, infrastructure, equipment, andconstruction in progress. Depreciation of $33,456,947 has been taken, which resulted in a net book valueof $124,699,463. More detailed information about the District’s capital assets is presented in the notes to the financial statements.
7
Capital Debt
The District's capital debt decreased by $5,338,098 during the current fiscal year, due to an advanced debt payment of $1,000,000 to the BB&T revenue bonds and the regularly scheduled annual debt servicepayments. More detailed information about the District's capital debt is presented in the notes to thefinancial statements.
Economic Factors and Next Year’s Budget
The unemployment rate for Monroe Country was 2.6% at December 2018, the lowest in the State, which is a decrease from a rate of 3.4% in December 2017. The rate compares favorably to the state's averageunemployment rate of 3.3%.
Assessed property values in the District's service area increased in 2018; however, the District has notaxing authority, and no District revenue is derived from or dependent upon ad-valorem taxation. Therefore, this increase in property value should have no significant effect on the current or future financial performance.
During FY2019, the District is planning on continuing a process water system project, a headworks bypass piping project, solar arrays and fire suppression projects.
Contacting the District’s Financial Management
This financial report is designed to provide our citizens, landowners, taxpayers, customers, and creditors with a general overview of the District’s finances and to demonstrate the District’s accountability for the financial resources it manages and the stewardship of the facilities it maintains. If you have questions about this report or need additional financial information, contact the Key Largo Wastewater Treatment District’s Finance Department at 103355 Overseas Highway, Key Largo, Florida, 33037.

Basic Financial Statements
8
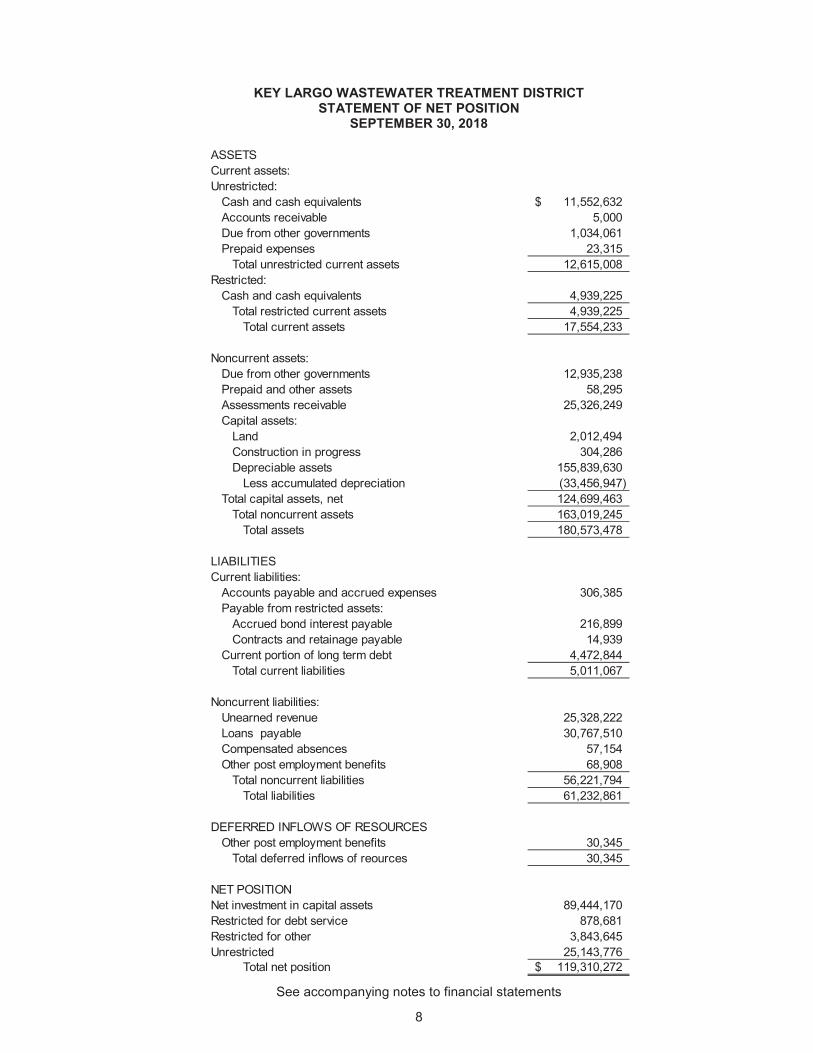
KEY LARGO WASTEWATER TREATMENT DISTRICTSTATEMENT OF NET POSITION
SEPTEMBER 30, 2018
ASSETSCurrent assets:Unrestricted:
Cash and cash equivalents 11,552,632$Accounts receivable 5,000Due from other governments 1,034,061Prepaid expenses 23,315
Total unrestricted current assets 12,615,008Restricted:
Cash and cash equivalents 4,939,225Total restricted current assets 4,939,225
Total current assets 17,554,233
Noncurrent assets:Due from other governments 12,935,238Prepaid and other assets 58,295Assessments receivable 25,326,249Capital assets:
Land 2,012,494Construction in progress 304,286Depreciable assets 155,839,630
Less accumulated depreciation (33,456,947)Total capital assets, net 124,699,463
Total noncurrent assets 163,019,245Total assets 180,573,478
LIABILITIESCurrent liabilities:
Accounts payable and accrued expenses 306,385Payable from restricted assets:
Accrued bond interest payable 216,899Contracts and retainage payable 14,939
Current portion of long term debt 4,472,844Total current liabilities 5,011,067
Noncurrent liabilities:Unearned revenue 25,328,222Loans payable 30,767,510Compensated absences 57,154Other post employment benefits 68,908
Total noncurrent liabilities 56,221,794Total liabilities 61,232,861
DEFERRED INFLOWS OF RESOURCESOther post employment benefits 30,345
Total deferred inflows of reources 30,345
NET POSITIONNet investment in capital assets 89,444,170Restricted for debt service 878,681Restricted for other 3,843,645Unrestricted 25,143,776
Total net position 119,310,272$
See accompanying notes to financial statements
9
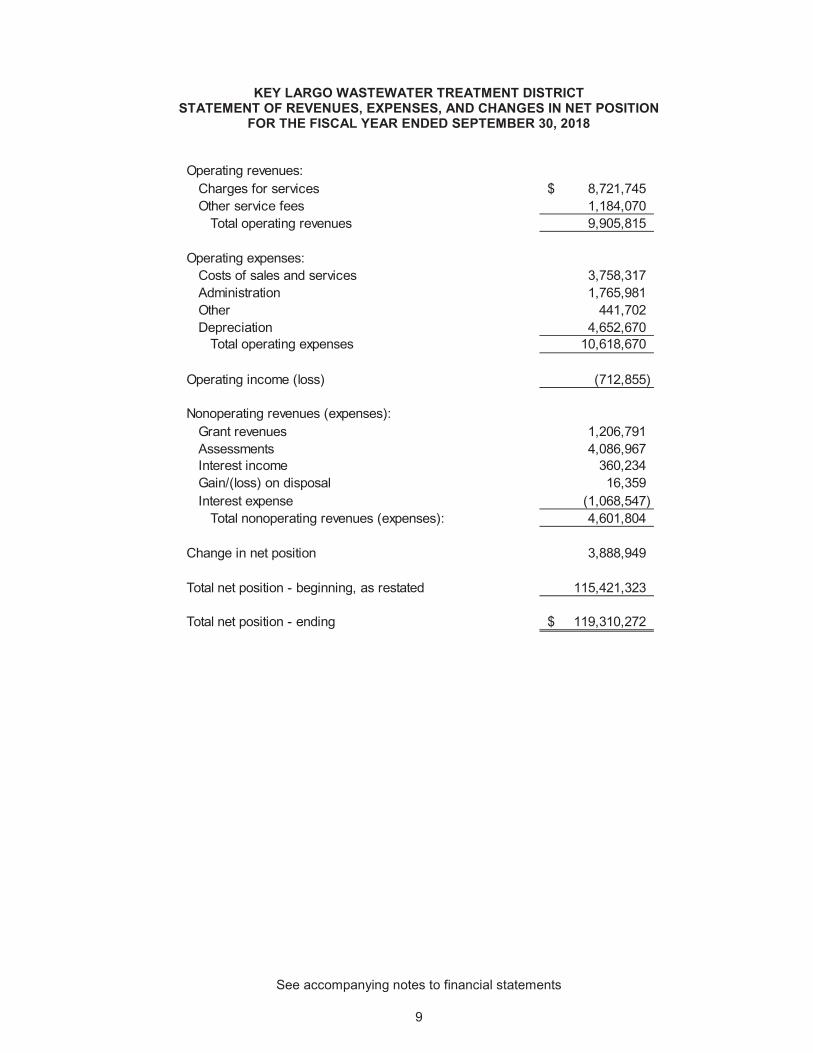
KEY LARGO WASTEWATER TREATMENT DISTRICTSTATEMENT OF REVENUES, EXPENSES, AND CHANGES IN NET POSITION
FOR THE FISCAL YEAR ENDED SEPTEMBER 30, 2018
Operating revenues:Charges for services 8,721,745$Other service fees 1,184,070
Total operating revenues 9,905,815
Operating expenses:Costs of sales and services 3,758,317Administration 1,765,981Other 441,702Depreciation 4,652,670
Total operating expenses 10,618,670
Operating income (loss) (712,855)
Nonoperating revenues (expenses):Grant revenues 1,206,791Assessments 4,086,967Interest income 360,234Gain/(loss) on disposal 16,359Interest expense (1,068,547)
Total nonoperating revenues (expenses): 4,601,804
Change in net position 3,888,949
Total net position - beginning, as restated 115,421,323
Total net position - ending 119,310,272$
See accompanying notes to financial statements
10
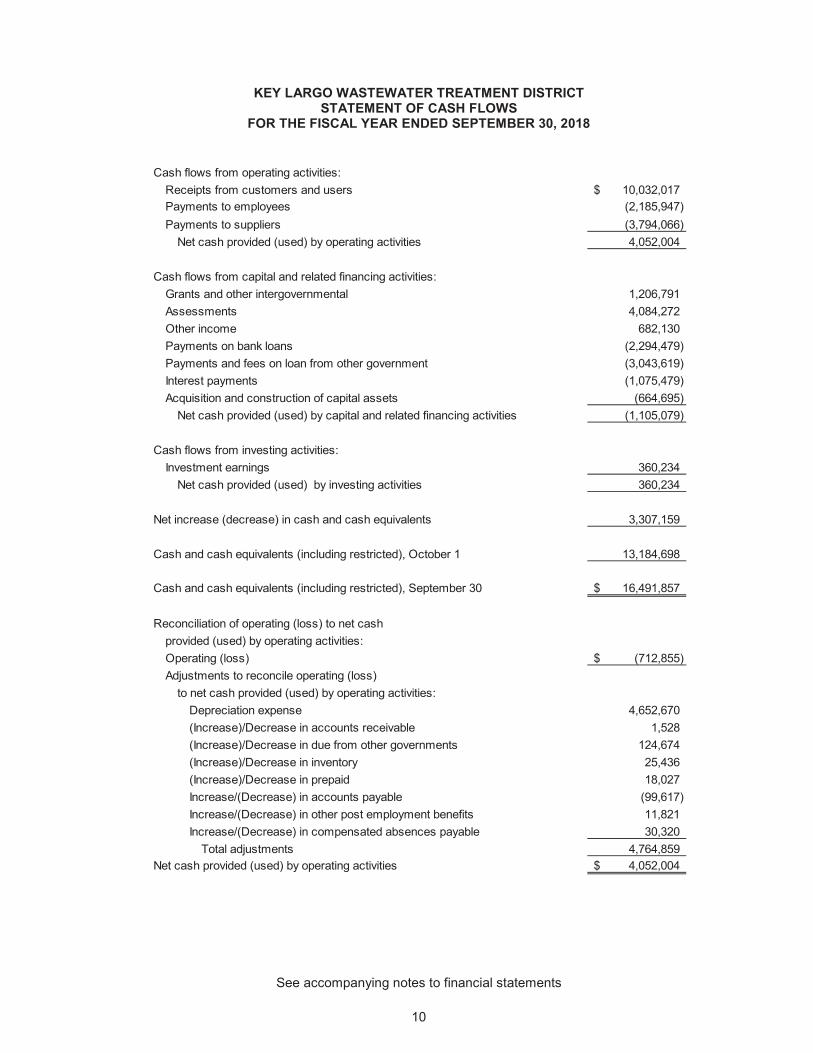
KEY LARGO WASTEWATER TREATMENT DISTRICTSTATEMENT OF CASH FLOWS
FOR THE FISCAL YEAR ENDED SEPTEMBER 30, 2018
Cash flows from operating activities:Receipts from customers and users 10,032,017$Payments to employees (2,185,947)Payments to suppliers (3,794,066)
Net cash provided (used) by operating activities 4,052,004
Cash flows from capital and related financing activities:Grants and other intergovernmental 1,206,791Assessments 4,084,272Other income 682,130Payments on bank loans (2,294,479)Payments and fees on loan from other government (3,043,619)Interest payments (1,075,479)Acquisition and construction of capital assets (664,695)
Net cash provided (used) by capital and related financing activities (1,105,079)
Cash flows from investing activities:Investment earnings 360,234
Net cash provided (used) by investing activities 360,234
Net increase (decrease) in cash and cash equivalents 3,307,159
Cash and cash equivalents (including restricted), October 1 13,184,698
Cash and cash equivalents (including restricted), September 30 16,491,857$
Reconciliation of operating (loss) to net cashprovided (used) by operating activities:Operating (loss) (712,855)$Adjustments to reconcile operating (loss)
to net cash provided (used) by operating activities:Depreciation expense 4,652,670(Increase)/Decrease in accounts receivable 1,528(Increase)/Decrease in due from other governments 124,674(Increase)/Decrease in inventory 25,436(Increase)/Decrease in prepaid 18,027Increase/(Decrease) in accounts payable (99,617)Increase/(Decrease) in other post employment benefits 11,821Increase/(Decrease) in compensated absences payable 30,320
Total adjustments 4,764,859Net cash provided (used) by operating activities 4,052,004$
See accompanying notes to financial statements
11
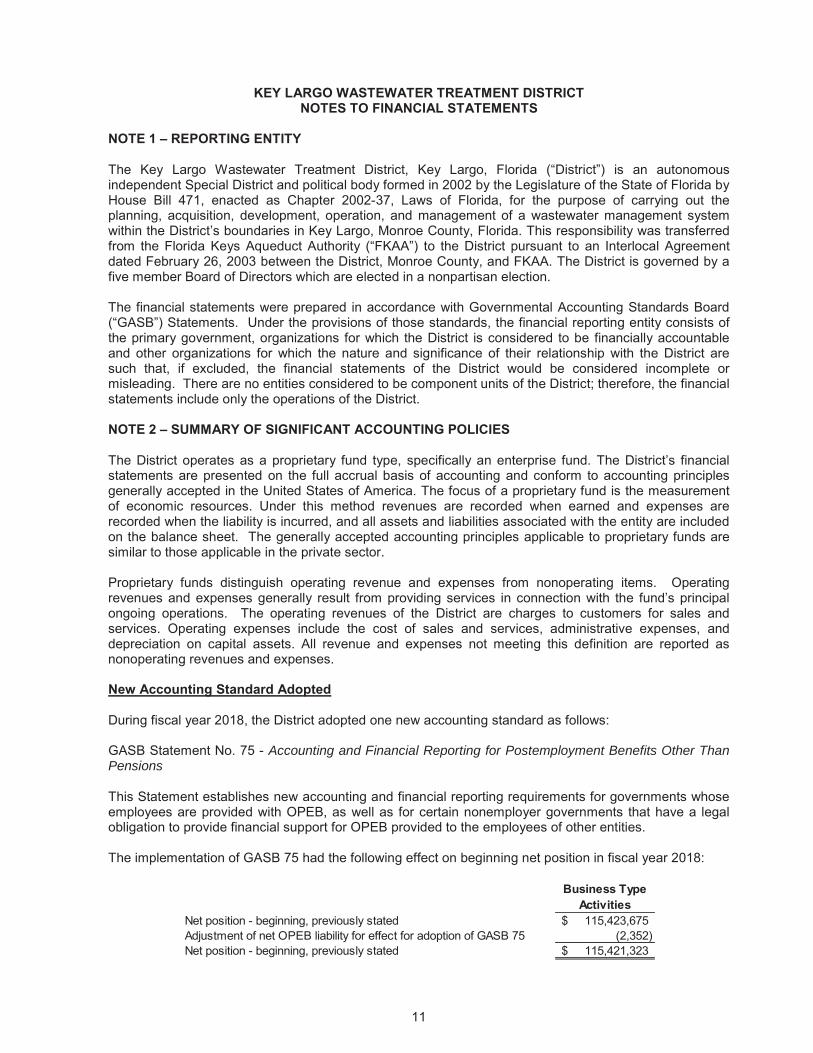
KEY LARGO WASTEWATER TREATMENT DISTRICTNOTES TO FINANCIAL STATEMENTS
NOTE 1 – REPORTING ENTITY
The Key Largo Wastewater Treatment District, Key Largo, Florida (“District”) is an autonomous independent Special District and political body formed in 2002 by the Legislature of the State of Florida by House Bill 471, enacted as Chapter 2002-37, Laws of Florida, for the purpose of carrying out the planning, acquisition, development, operation, and management of a wastewater management system within the District’s boundaries in Key Largo, Monroe County, Florida. This responsibility was transferred from the Florida Keys Aqueduct Authority (“FKAA”) to the District pursuant to an Interlocal Agreement dated February 26, 2003 between the District, Monroe County, and FKAA. The District is governed by a five member Board of Directors which are elected in a nonpartisan election.
The financial statements were prepared in accordance with Governmental Accounting Standards Board (“GASB”) Statements. Under the provisions of those standards, the financial reporting entity consists of the primary government, organizations for which the District is considered to be financially accountable and other organizations for which the nature and significance of their relationship with the District are such that, if excluded, the financial statements of the District would be considered incomplete or misleading. There are no entities considered to be component units of the District; therefore, the financial statements include only the operations of the District.
NOTE 2 – SUMMARY OF SIGNIFICANT ACCOUNTING POLICIES
The District operates as a proprietary fund type, specifically an enterprise fund. The District’s financial statements are presented on the full accrual basis of accounting and conform to accounting principles generally accepted in the United States of America. The focus of a proprietary fund is the measurement of economic resources. Under this method revenues are recorded when earned and expenses are recorded when the liability is incurred, and all assets and liabilities associated with the entity are included on the balance sheet. The generally accepted accounting principles applicable to proprietary funds aresimilar to those applicable in the private sector.
Proprietary funds distinguish operating revenue and expenses from nonoperating items. Operating revenues and expenses generally result from providing services in connection with the fund’s principal ongoing operations. The operating revenues of the District are charges to customers for sales and services. Operating expenses include the cost of sales and services, administrative expenses, anddepreciation on capital assets. All revenue and expenses not meeting this definition are reported as nonoperating revenues and expenses.
New Accounting Standard Adopted
During fiscal year 2018, the District adopted one new accounting standard as follows:
GASB Statement No. 75 - Accounting and Financial Reporting for Postemployment Benefits Other Than Pensions
This Statement establishes new accounting and financial reporting requirements for governments whose employees are provided with OPEB, as well as for certain nonemployer governments that have a legal obligation to provide financial support for OPEB provided to the employees of other entities.
The implementation of GASB 75 had the following effect on beginning net position in fiscal year 2018:
Business Type Activities
Net position - beginning, previously stated 115,423,675$Adjustment of net OPEB liability for effect for adoption of GASB 75 (2,352)Net position - beginning, previously stated 115,421,323$

12
NOTE 2 – SUMMARY OF SIGNIFICANT ACCOUNTING POLICIES (Continued)
Deposits and Investments – The District’s cash and cash equivalents are considered to be cash on hand and demand deposits (interest and non-interest bearing).
The District has elected to proceed under the Alternative Investment Guidelines as set forth in Section 218.415 (17) Florida Statutes. The District may invest any surplus public funds in the following:
a) The Local Government Surplus Trust Funds, or any intergovernmental investment pool authorized pursuant to the Florida Interlocal Cooperation Act;
b) Securities and Exchange Commission registered money market funds with the highest credit quality rating from a nationally recognized rating agency;
c) Interest bearing time deposits or savings accounts in qualified public depositories;d) Direct obligations of the U.S. Treasury.
Securities listed in paragraph c and d shall be invested to provide sufficient liquidity to pay obligations as they come due.
The District records all interest revenue related to investment activities in the respective funds. Investments are measured at amortized cost or reported at fair value as required by generally accepted accounting principles.
Prepaids – Certain payments to vendors reflect costs applicable to future accounting periods and are recorded as prepaid items.
Restricted Assets – Restricted assets represent cash and other assets whose use is restricted by legal requirements, amounts set aside to meet sinking fund requirements and reserves for future repairs and replacements.
Capital Assets – Capital assets include property, plant, equipment and the wastewater collection system. The District maintains a $750 threshold and estimated useful life of more than one year for additions to equipment. The remainder of capital assets with a value in excess of $5,000 and an estimated useful life of in excess of two years are capitalized. Capital assets are recorded at historicalcost. Donated capital assets are recorded at estimated fair value at the date of donation.
Interest incurred during the construction phase of capital assets is included as part of the capitalized value of the assets constructed.
The cost of normal maintenance and repairs that do not add to the value of the asset or materially extend assets lives are not capitalized but expensed as incurred. Major outlays for capital assets and improvements are capitalized as projects are constructed.
Property, plant and equipment of the District are depreciated using the straight-line method over the following estimated useful lives:
Assets Years
Equipment – field and plant equipment 7-10Equipment – vehicles 5Infrastructure and building 30-40
The District’s wastewater system was completed in sections. Depreciation begins when the section is completed and placed in service.
Long-term Obligations – The long-term debt of the District is reported as a liability in the statement of net position.
13
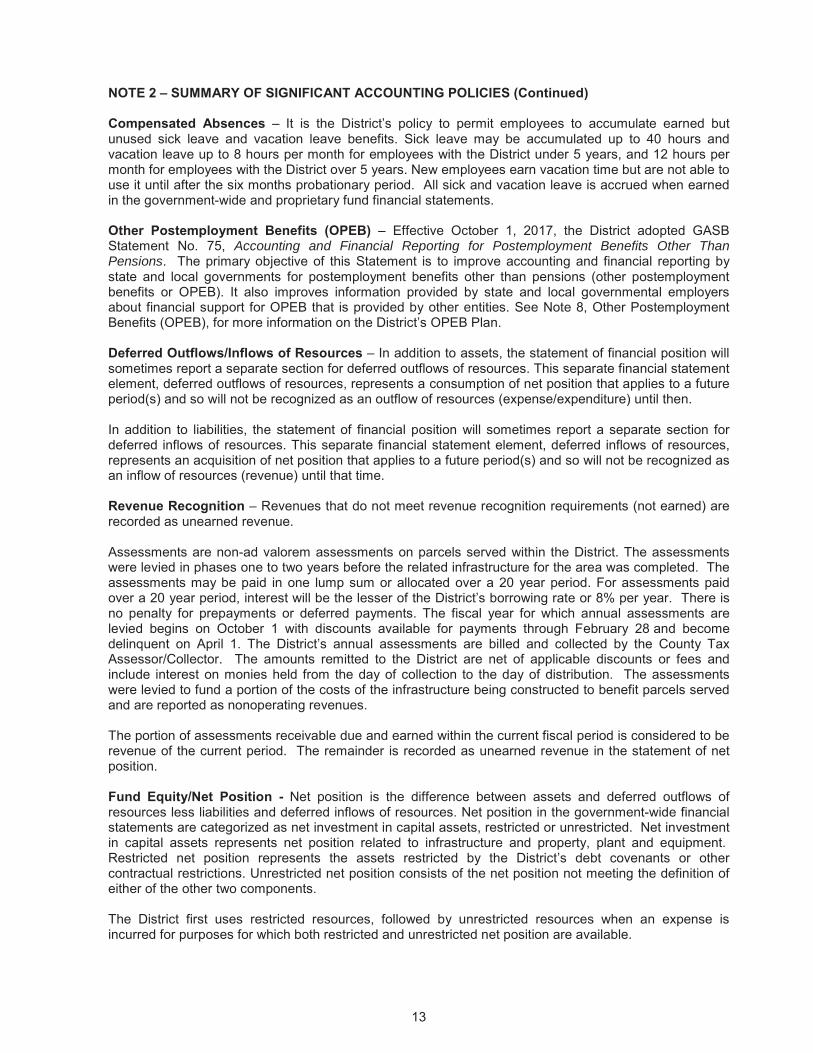
NOTE 2 – SUMMARY OF SIGNIFICANT ACCOUNTING POLICIES (Continued)
Compensated Absences – It is the District’s policy to permit employees to accumulate earned but unused sick leave and vacation leave benefits. Sick leave may be accumulated up to 40 hours and vacation leave up to 8 hours per month for employees with the District under 5 years, and 12 hours per month for employees with the District over 5 years. New employees earn vacation time but are not able to use it until after the six months probationary period. All sick and vacation leave is accrued when earned in the government-wide and proprietary fund financial statements.
Other Postemployment Benefits (OPEB) – Effective October 1, 2017, the District adopted GASB Statement No. 75, Accounting and Financial Reporting for Postemployment Benefits Other Than Pensions. The primary objective of this Statement is to improve accounting and financial reporting by state and local governments for postemployment benefits other than pensions (other postemployment benefits or OPEB). It also improves information provided by state and local governmental employers about financial support for OPEB that is provided by other entities. See Note 8, Other Postemployment Benefits (OPEB), for more information on the District’s OPEB Plan.
Deferred Outflows/Inflows of Resources – In addition to assets, the statement of financial position will sometimes report a separate section for deferred outflows of resources. This separate financial statement element, deferred outflows of resources, represents a consumption of net position that applies to a future period(s) and so will not be recognized as an outflow of resources (expense/expenditure) until then.
In addition to liabilities, the statement of financial position will sometimes report a separate section for deferred inflows of resources. This separate financial statement element, deferred inflows of resources, represents an acquisition of net position that applies to a future period(s) and so will not be recognized as an inflow of resources (revenue) until that time.
Revenue Recognition – Revenues that do not meet revenue recognition requirements (not earned) arerecorded as unearned revenue.
Assessments are non-ad valorem assessments on parcels served within the District. The assessments were levied in phases one to two years before the related infrastructure for the area was completed. The assessments may be paid in one lump sum or allocated over a 20 year period. For assessments paid over a 20 year period, interest will be the lesser of the District’s borrowing rate or 8% per year. There is no penalty for prepayments or deferred payments. The fiscal year for which annual assessments are levied begins on October 1 with discounts available for payments through February 28 and become delinquent on April 1. The District’s annual assessments are billed and collected by the County Tax Assessor/Collector. The amounts remitted to the District are net of applicable discounts or fees and include interest on monies held from the day of collection to the day of distribution. The assessments were levied to fund a portion of the costs of the infrastructure being constructed to benefit parcels servedand are reported as nonoperating revenues.
The portion of assessments receivable due and earned within the current fiscal period is considered to be revenue of the current period. The remainder is recorded as unearned revenue in the statement of net position.
Fund Equity/Net Position - Net position is the difference between assets and deferred outflows of resources less liabilities and deferred inflows of resources. Net position in the government-wide financial statements are categorized as net investment in capital assets, restricted or unrestricted. Net investment in capital assets represents net position related to infrastructure and property, plant and equipment.Restricted net position represents the assets restricted by the District’s debt covenants or other contractual restrictions. Unrestricted net position consists of the net position not meeting the definition of either of the other two components.
The District first uses restricted resources, followed by unrestricted resources when an expense is incurred for purposes for which both restricted and unrestricted net position are available.
14
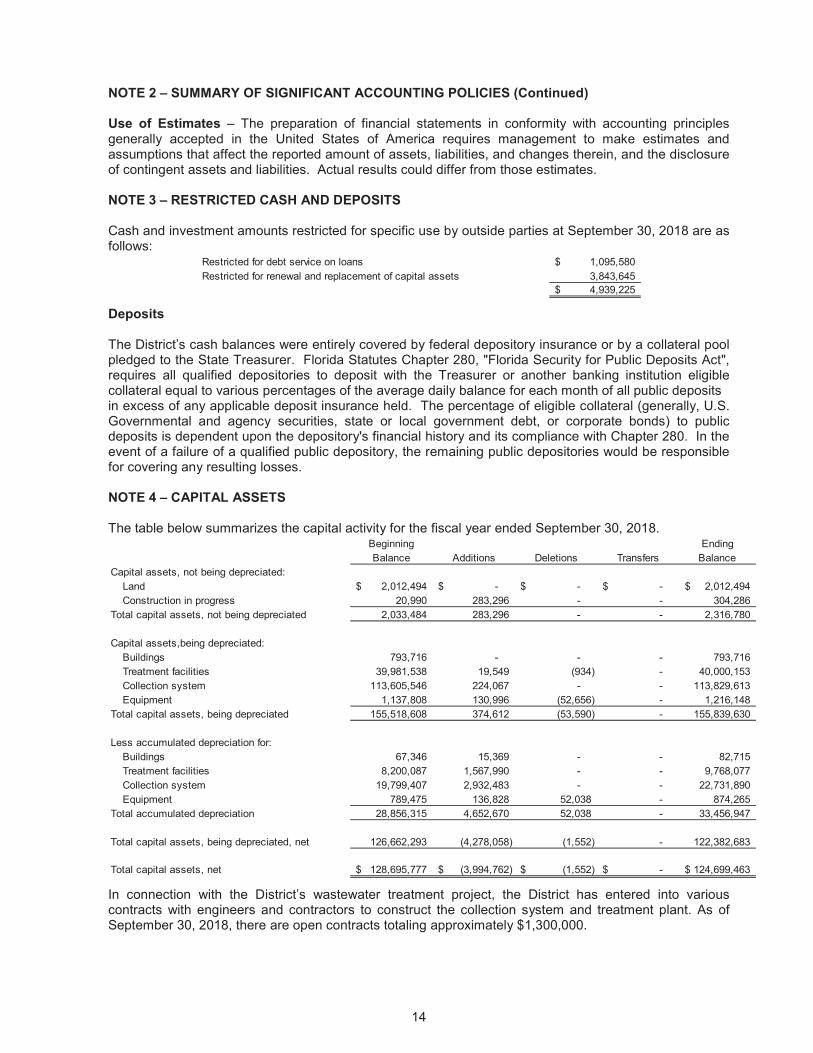
NOTE 2 – SUMMARY OF SIGNIFICANT ACCOUNTING POLICIES (Continued)
Use of Estimates – The preparation of financial statements in conformity with accounting principles generally accepted in the United States of America requires management to make estimates and assumptions that affect the reported amount of assets, liabilities, and changes therein, and the disclosure of contingent assets and liabilities. Actual results could differ from those estimates.
NOTE 3 – RESTRICTED CASH AND DEPOSITS
Cash and investment amounts restricted for specific use by outside parties at September 30, 2018 are as follows:
Restricted for debt service on loans 1,095,580$Restricted for renewal and replacement of capital assets 3,843,645
4,939,225$
Deposits
The District’s cash balances were entirely covered by federal depository insurance or by a collateral pool pledged to the State Treasurer. Florida Statutes Chapter 280, "Florida Security for Public Deposits Act", requires all qualified depositories to deposit with the Treasurer or another banking institution eligible collateral equal to various percentages of the average daily balance for each month of all public deposits in excess of any applicable deposit insurance held. The percentage of eligible collateral (generally, U.S. Governmental and agency securities, state or local government debt, or corporate bonds) to public deposits is dependent upon the depository's financial history and its compliance with Chapter 280. In the event of a failure of a qualified public depository, the remaining public depositories would be responsible for covering any resulting losses.
NOTE 4 – CAPITAL ASSETS
The table below summarizes the capital activity for the fiscal year ended September 30, 2018.Beginning EndingBalance Additions Deletions Transfers Balance
Capital assets, not being depreciated:Land 2,012,494$ -$ -$ -$ 2,012,494$Construction in progress 20,990 283,296 - - 304,286
Total capital assets, not being depreciated 2,033,484 283,296 - - 2,316,780
Capital assets,being depreciated:Buildings 793,716 - - - 793,716Treatment facilities 39,981,538 19,549 (934) - 40,000,153Collection system 113,605,546 224,067 - - 113,829,613Equipment 1,137,808 130,996 (52,656) - 1,216,148
Total capital assets, being depreciated 155,518,608 374,612 (53,590) - 155,839,630
Less accumulated depreciation for:Buildings 67,346 15,369 - - 82,715Treatment facilities 8,200,087 1,567,990 - - 9,768,077Collection system 19,799,407 2,932,483 - - 22,731,890Equipment 789,475 136,828 52,038 - 874,265
Total accumulated depreciation 28,856,315 4,652,670 52,038 - 33,456,947
Total capital assets, being depreciated, net 126,662,293 (4,278,058) (1,552) - 122,382,683
Total capital assets, net 128,695,777$ (3,994,762)$ (1,552)$ -$ 124,699,463$
In connection with the District’s wastewater treatment project, the District has entered into various contracts with engineers and contractors to construct the collection system and treatment plant. As of September 30, 2018, there are open contracts totaling approximately $1,300,000.

15
NOTE 4 – CAPITAL ASSETS (Continued)
For the year ended September 30, 2018, no interest costs relating to construction were capitalized. The interest costs incurred and charged to expense was $1,068,547 for the year ended September 30, 2018.
NOTE 5 – INTERLOCAL AGREEMENTS
On May 22, 2012, the District entered into an interlocal agreement with Islamorada Village of Islands(“Islamorada”) for wastewater services. Under the terms of the agreement, the District will provide wastewater treatment and disposal services to Islamorada for a period of 30 years. The fee charged to Islamorada is $4.65 per thousand gallons and adjusted in accordance with true-up provisions in the agreement. Wastewater treatment and disposal services commenced during June, 2014. Total revenue earned relating to wastewater services provided to Islamorada during the year ended September 30, 2018 totaled $1,086,320. Furthermore, Islamorada purchased capacity from the District and also agreed to pay for its proportionate share of plant capacity upgrades that the District constructed. The District charged Islamorada $10,176,000 for the purchase of capacity.
Florida Keys Water Quality Improvement ProgramOn October 31, 2014, the District entered into an interlocal agreement with the City of Marathon (“City”), Florida, and the Village of Islamorada (“Village”), Florida, to reallocate future grant revenue related to the United States Army Corps of Engineers’ Florida Keys Water Quality Improvement Program (“FKWQIP”). The original FKWQIP agreement authorized grant reimbursements to the District, City, and Village in a total amount of $100,000,000. Under the agreement, the District is eligible to receive $29,560,000 in grant reimbursements, of which it had received $17,653,470 as of September 30, 2017. During the current fiscal year the District received $998,000 of funding which increased the total amount received to $18,651,470.
Monroe County Interlocal AgreementOn March 11, 2015, the District was awarded a $17,000,000 grant from the State of Florida Department of Environmental Protection to be applied toward the construction of the wastewater system improvements. During the fiscal year 2016 the District executed an interlocal agreement with Monroe County whereby the grant was assigned to Monroe County in exchange for the amount being repaid overa 10 year period with zero interest. The agreement also stipulated that during the first three years of the assignment, Monroe County would be obligated to repay a maximum of $1,000,000 per year. Furthermore, since the note is being repaid over 9 more years, the District discounted the remaining $16,000,000 due from Monroe County over 9 years (7 years remaining at 9/30/18) using a 2.04% discount rate to arrive at a discounted receivable balance of $11,954,248. This amount is included as due from other governments.
Under the ILA agreement any other additional grant funds received by the District are eligible to be part of this exchange. The Florida Keys Environmental Stewardship Act was passed by the Florida State Legislature and signed into law in 2016. The Florida Keys received $5,000,000 in 2016 from the Stewardship Act. The District was allocated $1,250,000 of the $5,000,000 allocation from the State of Florida Department of Environmental Protection for water quality improvement projects. The District Board, on October 18, 2016, approved exchanging the $1,250,000 allocation with Monroe County. The note is being repaid over 12 years, therefore, the District discounted the $1,250,000 due from Monroe County over 12 years (11 years remaining at 9/30/18) using a 2.04% discount rate to arrive at a discounted receivable balance of $980,990, which is included as due from other governments on the balance sheet.

16
NOTE 6 – LONG-TERM DEBT
State Revolving Fund LoansAs of September 30, 2018, the District has entered into four revolving loan agreements with the State of Florida Department of Environmental Protection Clean Water State Revolving Fund Loan program to finance its wastewater utility capital projects. Under the terms of the loan agreements pledged revenues shall be the gross revenues, together with system development charges, and annual wastewater assessments, derived yearly from the operation of the sewer system after payment of operating and maintenance expenses and any yearly payment obligation of any senior debt obligations. Each loan shall be repaid in 40 semiannual payments. Through September 30, 2018 the District has borrowed a total of $57,818,739 under these agreements, including capitalized interest. As of September 30, 2018,repayments have begun on all loan agreements and WW464020 and WW464030 were paid off. The breakdown as of September 30, 2018 of the total amounts authorized, the fixed weighted average interest rate, the estimated semi-annual payment amount and the amounts drawn to date on each loan is as follows:
Total Loan Total ObligationSRF Loan Authorized Interest Semi-Annual September 30,
Agreement Amount Rate Payment Amount 2018
WW46401P 22,670,199$ 2.41% - 2.68% 779,480$ 14,839,282$WW464010 32,077,094 2.49% - 2.92% 1,059,290 7,409,123WW464020 891,422 2.56% - -WW464030 2,180,024 2.68% - - Total 57,818,739$ 1,838,770$ 22,248,405$
Series 2013 and 2014On December 19, 2013, the District issued $10,000,000 of Utility Revenue Refunding Bond Series 2013 due October 15, 2027, with an initial interest rate of 2.70%. On January 6, 2014, the District issued $10,000,000 of Utility Revenue Refunding Bond Series 2014 due October 15, 2027, with an initial interest rate of 2.70%. The Bonds were issued to refund a portion of the District’s outstanding Utility Revenue Bond Series 2010 (the “Refunded Bonds”), and pay certain costs associated with the issuance of the Bonds. Interest and principal is to be paid quarterly on each October 15, January 15, April 15 and July 15. The Bonds interest rate can be adjusted in the event of a change in the corporate tax rate which occurred during the current fiscal year and, as a result, the interest rate has been adjusted to 3.28%.
The financing documents allow for the prepayment of the principal balance in whole on a scheduled payment date with a 1% prepayment premium. Extraordinary prepayments are also allowed in part once a year, on a payment date, specifically from grant and loan proceeds with no prepayment premium. This occurred during the current fiscal year as the District collected the Monroe County Interlocal Agreement revenue and prepaid $500,000 of the Series 2013 and $500,000 of the Series 2014 Bonds.
The District shall establish and collect fees and charges for the product services and facilities of its system to provide in each fiscal year net revenues, pledged system development charges, wastewater connection fees and any other special assessment proceeds, equal to at least 110% of the annual debt service becoming due in such fiscal year. The District is in compliance with those requirements of the Bonds at September 30, 2018.
Long-term debt transactionsChanges in long-term liability activity for the fiscal year ended September 30, 2018 were as follows:
Balance Additions Payments Balance One YearState Revolving Loan WW46401P 15,991,517$ -$ 1,152,235$ 14,839,282$ 1,182,261$State Revolving Loan WW464010 9,300,507 - 1,891,384 7,409,123 1,940,381Series 2013 Bonds 7,642,636 - 1,147,192 6,495,444 675,051Series 2014 Bonds 7,643,792 - 1,147,287 6,496,505 675,151Compensated absences 58,068 115,004 115,918 57,154 -Total long term debt 40,636,520$ 115,004$ 5,454,016$ 35,297,508$ 4,472,844$
17
NOTE 6 – LONG-TERM DEBT (Continued)
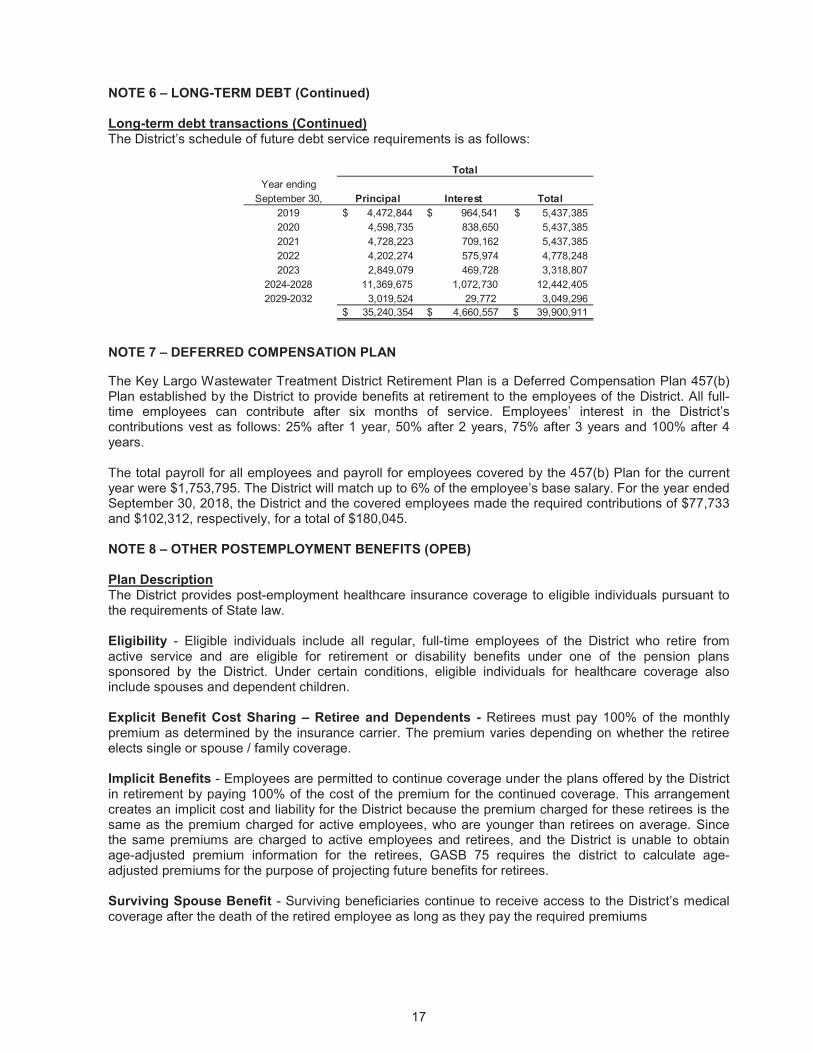
Long-term debt transactions (Continued)The District’s schedule of future debt service requirements is as follows:
Year endingSeptember 30, Principal Interest Total
2019 $ 4,472,844 $ 964,541 5,437,385$2020 4,598,735 838,650 5,437,3852021 4,728,223 709,162 5,437,3852022 4,202,274 575,974 4,778,2482023 2,849,079 469,728 3,318,807
2024-2028 11,369,675 1,072,730 12,442,4052029-2032 3,019,524 29,772 3,049,296
35,240,354$ 4,660,557$ 39,900,911$
Total
NOTE 7 – DEFERRED COMPENSATION PLAN
The Key Largo Wastewater Treatment District Retirement Plan is a Deferred Compensation Plan 457(b)Plan established by the District to provide benefits at retirement to the employees of the District. All full-time employees can contribute after six months of service. Employees’ interest in the District’s contributions vest as follows: 25% after 1 year, 50% after 2 years, 75% after 3 years and 100% after 4 years.
The total payroll for all employees and payroll for employees covered by the 457(b) Plan for the current year were $1,753,795. The District will match up to 6% of the employee’s base salary. For the year ended September 30, 2018, the District and the covered employees made the required contributions of $77,733and $102,312, respectively, for a total of $180,045.
NOTE 8 – OTHER POSTEMPLOYMENT BENEFITS (OPEB)
Plan DescriptionThe District provides post-employment healthcare insurance coverage to eligible individuals pursuant to the requirements of State law.
Eligibility - Eligible individuals include all regular, full-time employees of the District who retire from active service and are eligible for retirement or disability benefits under one of the pension plans sponsored by the District. Under certain conditions, eligible individuals for healthcare coverage also include spouses and dependent children.
Explicit Benefit Cost Sharing – Retiree and Dependents - Retirees must pay 100% of the monthly premium as determined by the insurance carrier. The premium varies depending on whether the retiree elects single or spouse / family coverage.
Implicit Benefits - Employees are permitted to continue coverage under the plans offered by the District in retirement by paying 100% of the cost of the premium for the continued coverage. This arrangement creates an implicit cost and liability for the District because the premium charged for these retirees is the same as the premium charged for active employees, who are younger than retirees on average. Since the same premiums are charged to active employees and retirees, and the District is unable to obtain age-adjusted premium information for the retirees, GASB 75 requires the district to calculate age-adjusted premiums for the purpose of projecting future benefits for retirees.
Surviving Spouse Benefit - Surviving beneficiaries continue to receive access to the District’s medical coverage after the death of the retired employee as long as they pay the required premiums
18
NOTE 8 – OTHER POSTEMPLOYMENT BENEFITS (OPEB) (Continued)
Plan Description (Continued)Disability Retirement Benefits - There are two types of disability retirement available to employees of the District: (1) in-line-of-duty disability retirement and (2) regular disability retirement. To qualify for either type of disability retirement, members must be totally and permanently disabled to the extent that they are unable to work in any job for any employer. In-line-of-duty disability benefits are available to members on their first day of employment. To be eligible for regular disability retirement, members must complete eight years of creditable service with the District.
Post Employment Benefits - Currently, 0 retired employees receive health benefits from the District.Future retirees will contribute 100% for coverage.
The District recognizes the cost of providing health insurance annually as expenses in the Statement of Revenues, Expenses and Changes in Net Position as costs are incurred. For the year ended September 30, 2018, the District recognized $0 for its share of insurance premiums for currently enrolled retirees.
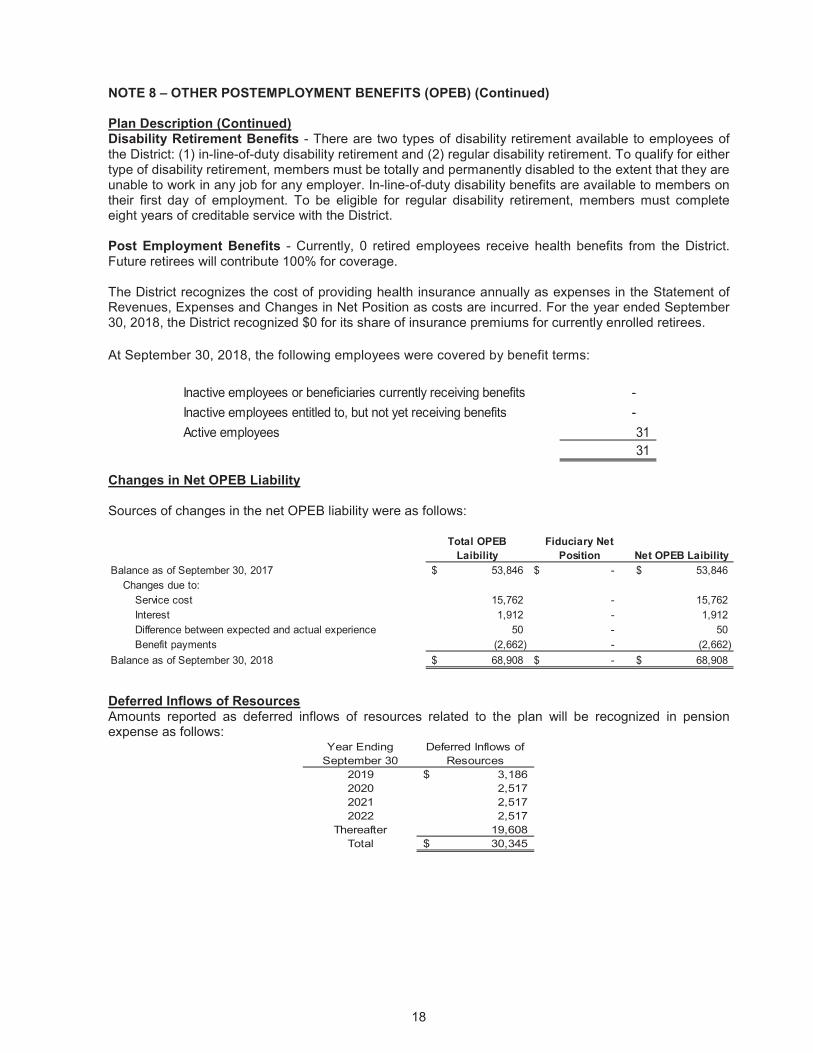
At September 30, 2018, the following employees were covered by benefit terms:
Inactive employees or beneficiaries currently receiving benefits -Inactive employees entitled to, but not yet receiving benefits -Active employees 31
31
Changes in Net OPEB Liability
Sources of changes in the net OPEB liability were as follows:
Total OPEB Laibility
Fiduciary Net Position Net OPEB Laibility
Balance as of September 30, 2017 53,846$ -$ 53,846$Changes due to:
Service cost 15,762 - 15,762Interest 1,912 - 1,912Difference between expected and actual experience 50 - 50Benefit payments (2,662) - (2,662)
Balance as of September 30, 2018 68,908$ -$ 68,908$
Deferred Inflows of ResourcesAmounts reported as deferred inflows of resources related to the plan will be recognized in pension expense as follows:
Year Ending September 30
Deferred Inflows of Resources
2019 3,186$2020 2,5172021 2,5172022 2,517
Thereafter 19,608Total 30,345$
19
NOTE 8 – OTHER POSTEMPLOYMENT BENEFITS (OPEB) (Continued)
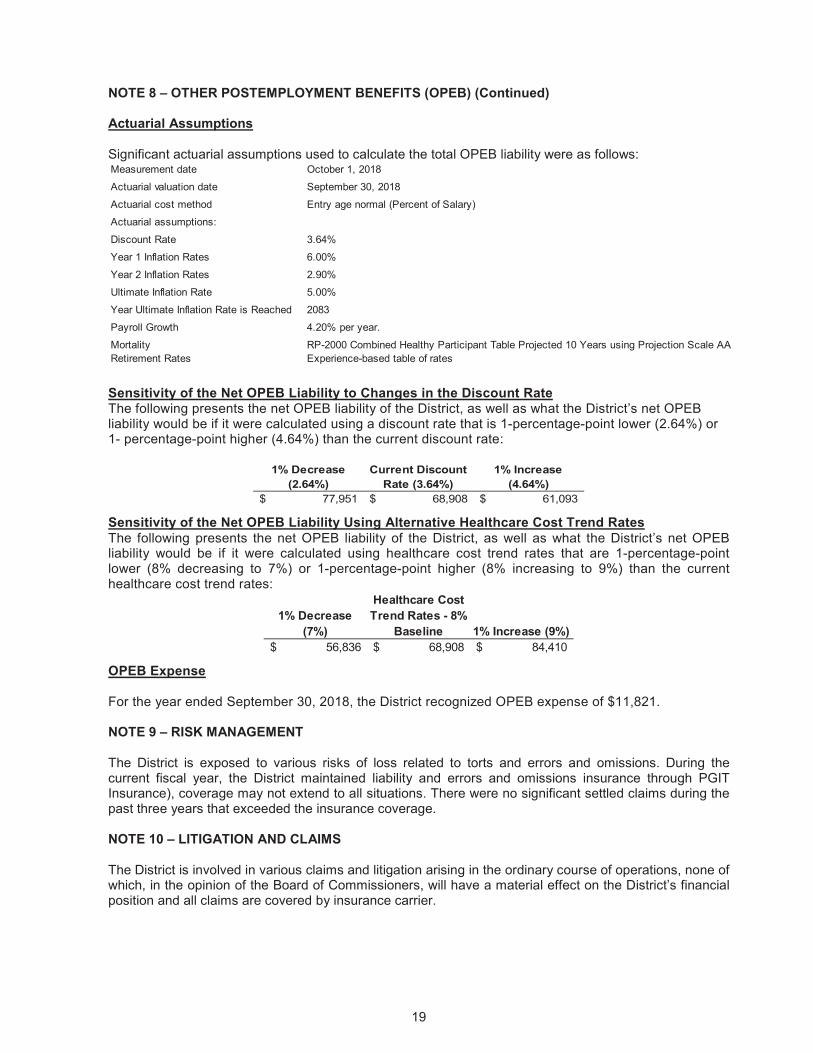
Actuarial Assumptions
Significant actuarial assumptions used to calculate the total OPEB liability were as follows:Measurement date October 1, 2018Actuarial valuation date September 30, 2018Actuarial cost method Entry age normal (Percent of Salary)Actuarial assumptions:Discount Rate 3.64%Year 1 Inflation Rates 6.00%Year 2 Inflation Rates 2.90%Ultimate Inflation Rate 5.00%Year Ultimate Inflation Rate is Reached 2083Payroll Growth 4.20% per year.Mortality RP-2000 Combined Healthy Participant Table Projected 10 Years using Projection Scale AARetirement Rates Experience-based table of rates
Sensitivity of the Net OPEB Liability to Changes in the Discount Rate The following presents the net OPEB liability of the District, as well as what the District’s net OPEB liability would be if it were calculated using a discount rate that is 1-percentage-point lower (2.64%) or 1- percentage-point higher (4.64%) than the current discount rate:
1% Decrease (2.64%)
Current Discount Rate (3.64%)
1% Increase (4.64%)
77,951$ 68,908$ 61,093$
Sensitivity of the Net OPEB Liability Using Alternative Healthcare Cost Trend RatesThe following presents the net OPEB liability of the District, as well as what the District’s net OPEB liability would be if it were calculated using healthcare cost trend rates that are 1-percentage-point lower (8% decreasing to 7%) or 1-percentage-point higher (8% increasing to 9%) than the current healthcare cost trend rates:
1% Decrease (7%)
Healthcare Cost Trend Rates - 8%
Baseline 1% Increase (9%)56,836$ 68,908$ 84,410$
OPEB Expense
For the year ended September 30, 2018, the District recognized OPEB expense of $11,821.
NOTE 9 – RISK MANAGEMENT
The District is exposed to various risks of loss related to torts and errors and omissions. During the current fiscal year, the District maintained liability and errors and omissions insurance through PGITInsurance), coverage may not extend to all situations. There were no significant settled claims during the past three years that exceeded the insurance coverage.
NOTE 10 – LITIGATION AND CLAIMS
The District is involved in various claims and litigation arising in the ordinary course of operations, none of which, in the opinion of the Board of Commissioners, will have a material effect on the District’s financial position and all claims are covered by insurance carrier.

THIS PAGE INTENTIONALLY LEFT BLANK

Required Supplementary Information
20
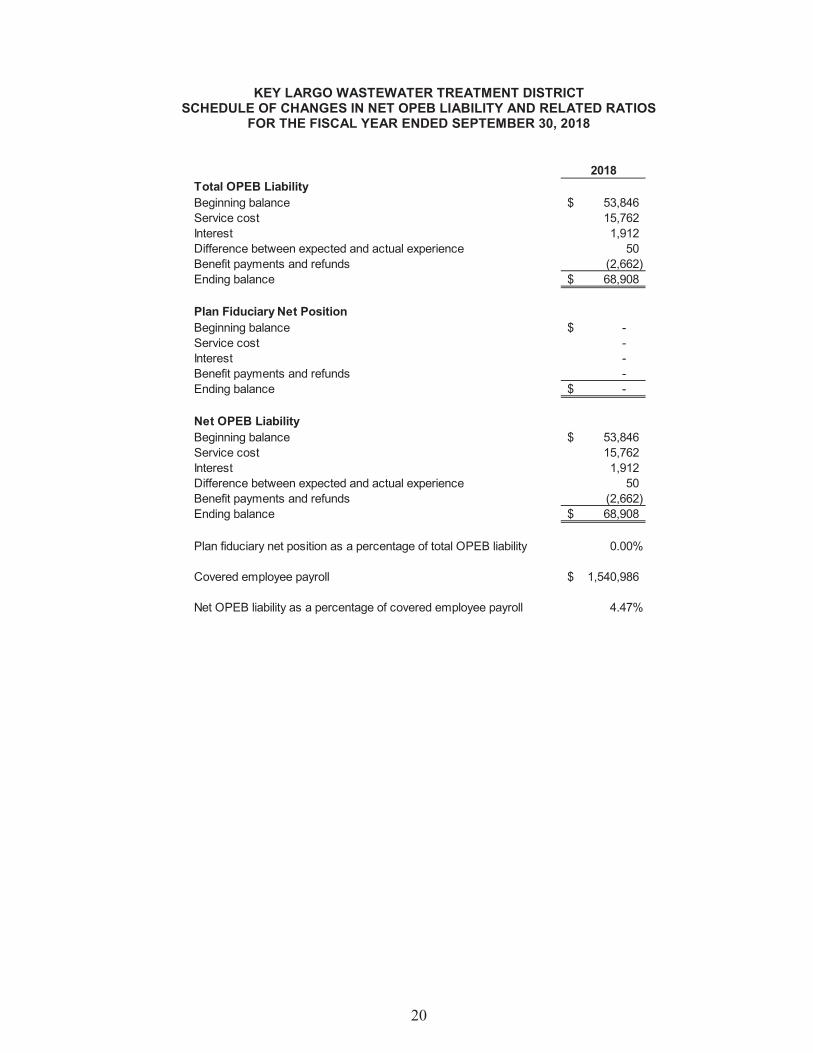
KEY LARGO WASTEWATER TREATMENT DISTRICTSCHEDULE OF CHANGES IN NET OPEB LIABILITY AND RELATED RATIOS
FOR THE FISCAL YEAR ENDED SEPTEMBER 30, 2018
2018Total OPEB LiabilityBeginning balance 53,846$Service cost 15,762Interest 1,912Difference between expected and actual experience 50Benefit payments and refunds (2,662)Ending balance 68,908$
Plan Fiduciary Net PositionBeginning balance -$Service cost -Interest -Benefit payments and refunds -Ending balance -$
Net OPEB LiabilityBeginning balance 53,846$Service cost 15,762Interest 1,912Difference between expected and actual experience 50Benefit payments and refunds (2,662)Ending balance 68,908$
Plan fiduciary net position as a percentage of total OPEB liability 0.00%
Covered employee payroll 1,540,986$
Net OPEB liability as a percentage of covered employee payroll 4.47%

Supplementary Information
21
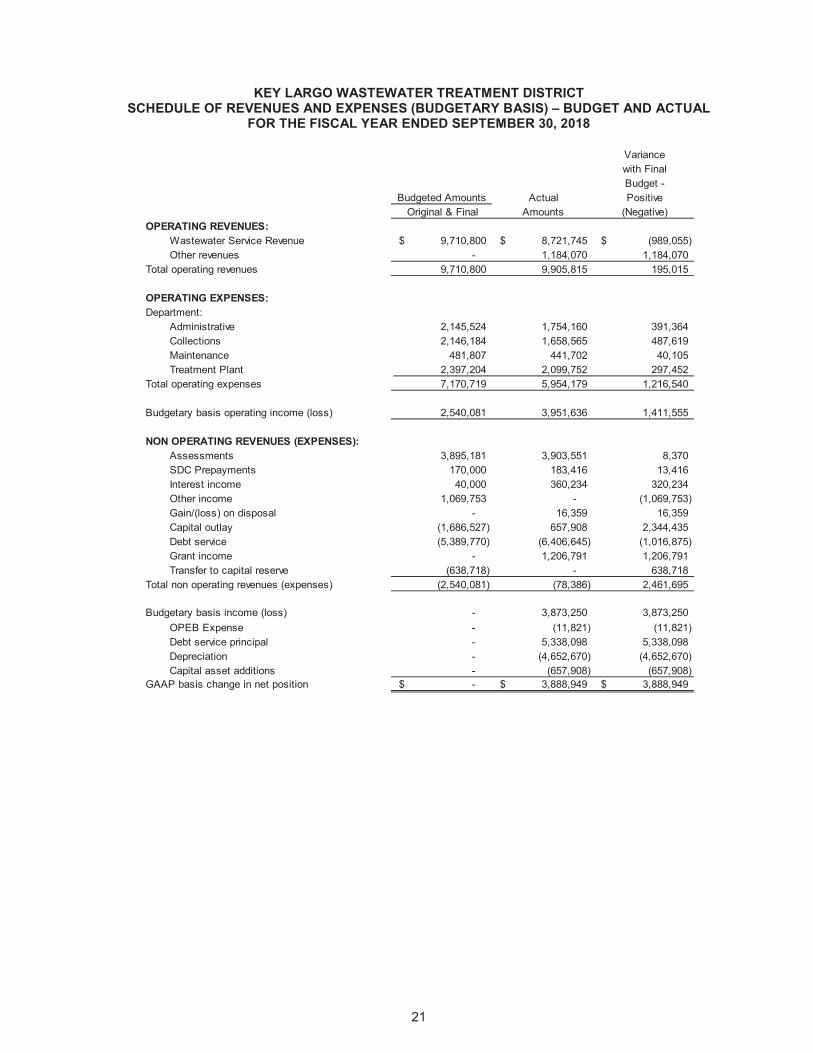
KEY LARGO WASTEWATER TREATMENT DISTRICTSCHEDULE OF REVENUES AND EXPENSES (BUDGETARY BASIS) – BUDGET AND ACTUAL
FOR THE FISCAL YEAR ENDED SEPTEMBER 30, 2018
Variancewith Final Budget -
Actual Positive Original & Final Amounts (Negative)
OPERATING REVENUES:Wastewater Service Revenue 9,710,800$ 8,721,745$ (989,055)$Other revenues - 1,184,070 1,184,070
Total operating revenues 9,710,800 9,905,815 195,015
OPERATING EXPENSES:Department:
Administrative 2,145,524 1,754,160 391,364Collections 2,146,184 1,658,565 487,619Maintenance 481,807 441,702 40,105Treatment Plant 2,397,204 2,099,752 297,452
Total operating expenses 7,170,719 5,954,179 1,216,540
Budgetary basis operating income (loss) 2,540,081 3,951,636 1,411,555
NON OPERATING REVENUES (EXPENSES):Assessments 3,895,181 3,903,551 8,370SDC Prepayments 170,000 183,416 13,416Interest income 40,000 360,234 320,234Other income 1,069,753 - (1,069,753)Gain/(loss) on disposal - 16,359 16,359Capital outlay (1,686,527) 657,908 2,344,435Debt service (5,389,770) (6,406,645) (1,016,875)Grant income - 1,206,791 1,206,791Transfer to capital reserve (638,718) - 638,718
Total non operating revenues (expenses) (2,540,081) (78,386) 2,461,695
Budgetary basis income (loss) - 3,873,250 3,873,250OPEB Expense - (11,821) (11,821)Debt service principal - 5,338,098 5,338,098Depreciation - (4,652,670) (4,652,670)Capital asset additions - (657,908) (657,908)
GAAP basis change in net position -$ 3,888,949$ 3,888,949$
Budgeted Amounts
Statistical SectionThis part of the District’s comprehensive annual financial report represents information as a context for understanding what the information in the accompanying financial statements and notes to the basic financial statements says about the District’s overall financial health.
Financial Trends:These schedules contain trend information to help the reader understand how the District’s financial performance and well-being have changed over time.
Revenue Capacity:These schedules contain information to help readers assess the factors affecting the District’s ability to generate revenues.
Debt Capacity:These schedules present information to help the reader assess the affordability of the District’s current levels of outstanding debt and the District’s ability to incur additional debt in the future.
Demographic and Economic Information:These schedules offer demographic and economic indications to help the reader understand the environment within which the District’s financial activities take place and to help make comparisons over time with other agencies.
Operating Information:These schedules contain information about the District’s operations and resources to help the reader understand how the District’s financial information relates to the services the District provides and the activities it performs.
Sources: Unless otherwise indicated, information in these schedules is derived from the comprehensive annual financial reports for the respective years.
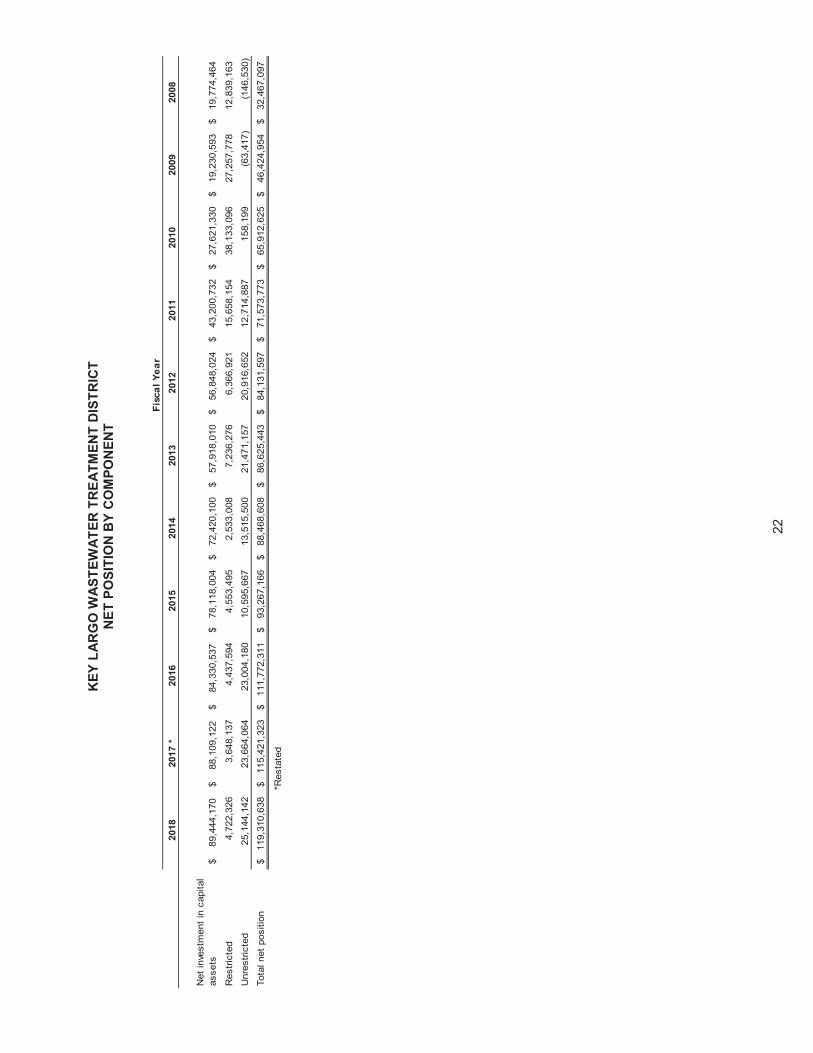
22
KEY
LAR
GO
WAS
TEW
ATER
TR
EATM
ENT
DIS
TRIC
TN
ET P
OSI
TIO
NB
Y C
OM
PON
ENT
2018
2017
*20
1620
1520
1420
1320
1220
1120
1020
0920
08
Net
inve
stm
ent i
n ca
pita
l as
sets
$
89,
444,
170
$
88,
109,
122
$
84,
330,
537
$
78,1
18,0
04
$
72,4
20,1
00
$
57,9
18,0
10
$
56,8
48,0
24
$
43,2
00,7
32
$
27,6
21,3
30
$
19,2
30,5
93
$
19,7
74,4
64
Res
trict
ed4,
722,
326
3,64
8,13
74,
437,
594
4,55
3,49
52,
533,
008
7,23
6,27
66,
366,
921
15,6
58,1
5438
,133
,096
27,2
57,7
7812
,839
,163
Unr
estri
cted
25,1
44,1
4223
,664
,064
23,0
04,1
8010
,595
,667
13,5
15,5
0021
,471
,157
20,9
16,6
5212
,714
,887
158,
199
(63,
417)
(146
,530
)To
tal n
et p
ositi
on11
9,31
0,63
8$
115,
421,
323
$11
1,77
2,31
1$
93,2
67,1
66$
88,4
68,6
08$
86,6
25,4
43$
84,1
31,5
97$
71,5
73,7
73$
65,9
12,6
25$
46,4
24,9
54$
32,4
67,0
97$
*Res
tate
d
Fisc
al Y
ear
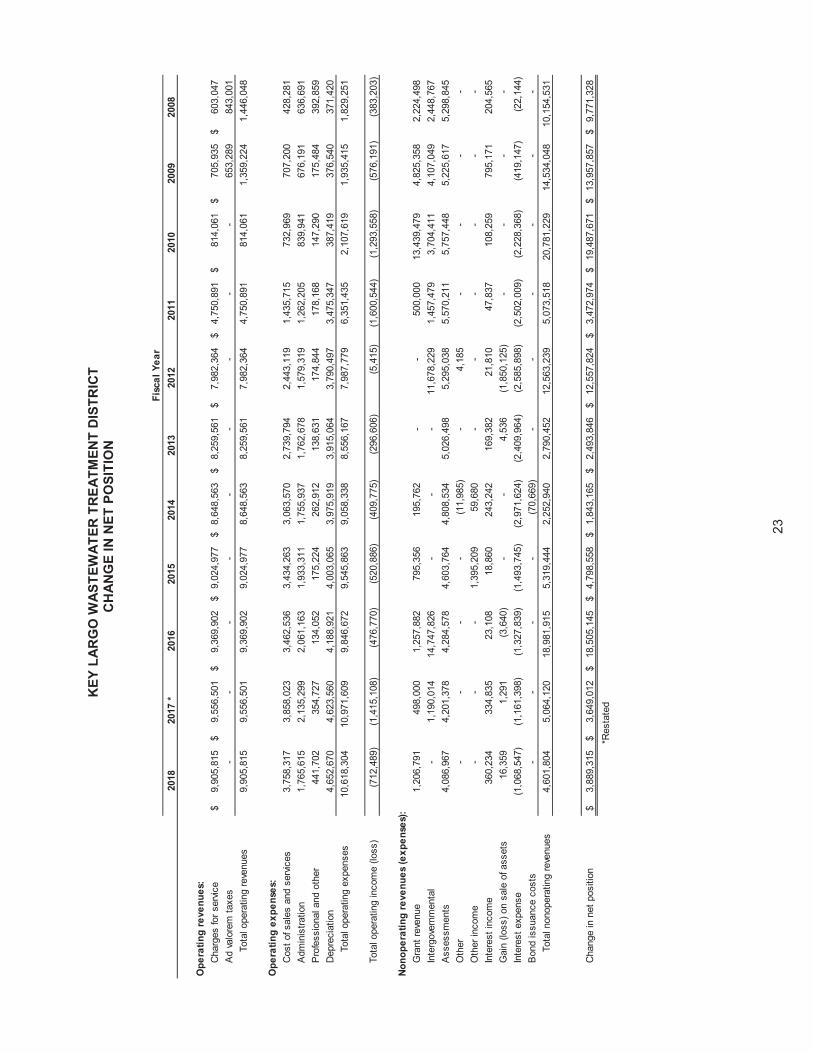
23
KEY
LAR
GO
WAS
TEW
ATER
TR
EATM
ENT
DIS
TRIC
TC
HAN
GE
IN N
ET P
OSI
TIO
N
2018
2017
*20
1620
1520
1420
1320
1220
1120
1020
0920
08
Ope
ratin
g re
venu
es:
Char
ges
for s
ervic
e9,
905,
815
$9,
556,
501
$9,
369,
902
$9,
024,
977
$8,
648,
563
$8,
259,
561
$7,
982,
364
$4,
750,
891
$81
4,06
1$
705,
935
$60
3,04
7$
Ad va
lore
m ta
xes
--
--
--
--
-65
3,28
984
3,00
1To
tal o
pera
ting
reve
nues
9,90
5,81
59,
556,
501
9,36
9,90
29,
024,
977
8,64
8,56
38,
259,
561
7,98
2,36
44,
750,
891
814,
061
1,35
9,22
41,
446,
048
Ope
ratin
g ex
pens
es:
Cost
of s
ales
and
ser
vices
3,75
8,31
73,
858,
023
3,46
2,53
63,
434,
263
3,06
3,57
02,
739,
794
2,44
3,11
91,
435,
715
732,
969
707,
200
428,
281
Adm
inis
tratio
n1,
765,
615
2,13
5,29
92,
061,
163
1,93
3,31
11,
755,
937
1,76
2,67
81,
579,
319
1,26
2,20
583
9,94
167
6,19
163
6,69
1Pr
ofes
sion
al a
nd o
ther
44
1,70
235
4,72
713
4,05
217
5,22
426
2,91
213
8,63
117
4,84
417
8,16
814
7,29
017
5,48
439
2,85
9De
prec
iatio
n4,
652,
670
4,62
3,56
04,
188,
921
4,00
3,06
53,
975,
919
3,91
5,06
43,
790,
497
3,47
5,34
738
7,41
937
6,54
037
1,42
0To
tal o
pera
ting
expe
nses
10,6
18,3
0410
,971
,609
9,84
6,67
29,
545,
863
9,05
8,33
88,
556,
167
7,98
7,77
96,
351,
435
2,10
7,61
91,
935,
415
1,82
9,25
1
Tota
l ope
ratin
g in
com
e (lo
ss)
(712
,489
)(1
,415
,108
)(4
76,7
70)
(520
,886
)(4
09,7
75)
(296
,606
)(5
,415
)(1
,600
,544
)(1
,293
,558
)(5
76,1
91)
(383
,203
)
Nono
pera
ting
reve
nues
(exp
ense
s):
Gra
nt re
venu
e1,
206,
791
498,
000
1,25
7,88
279
5,35
619
5,76
2-
-50
0,00
013
,439
,479
4,82
5,35
82,
224,
498
Inte
rgov
ernm
enta
l-
1,19
0,01
414
,747
,826
--
-11
,678
,229
1,45
7,47
93,
704,
411
4,10
7,04
92,
448,
767
Asse
ssm
ents
4,08
6,96
74,
201,
378
4,28
4,57
84,
603,
764
4,80
8,53
45,
026,
498
5,29
5,03
85,
570,
211
5,75
7,44
85,
225,
617
5,29
8,84
5O
ther
--
--
(11,
985)
-4,
185
--
--
Oth
er in
com
e-
--
1,39
5,20
959
,680
--
--
--
Inte
rest
inco
me
360,
234
334,
835
23,1
0818
,860
243,
242
169,
382
21,8
1047
,837
108,
259
795,
171
204,
565
Gai
n (lo
ss) o
n sa
le o
f ass
ets
16,3
591,
291
(3,6
40)
--
4,53
6(1
,850
,125
)-
--
-In
tere
st e
xpen
se(1
,068
,547
)(1
,161
,398
)(1
,327
,839
)(1
,493
,745
)(2
,971
,624
)(2
,409
,964
)(2
,585
,898
)(2
,502
,009
)(2
,228
,368
)(4
19,1
47)
(22,
144)
Bond
issu
ance
cos
ts-
--
-(7
0,66
9)-
--
--
-To
tal n
onop
erat
ing
reve
nues
4,60
1,80
45,
064,
120
18,9
81,9
155,
319,
444
2,25
2,94
02,
790,
452
12,5
63,2
395,
073,
518
20,7
81,2
2914
,534
,048
10,1
54,5
31
Chan
ge in
net
pos
ition
3,88
9,31
5$
3,64
9,01
2$
18,5
05,1
45$
4,79
8,55
8$
1,84
3,16
5$
2,49
3,84
6$
12,5
57,8
24$
3,47
2,97
4$
19,4
87,6
71$
13,9
57,8
57$
9,77
1,32
8$
*Res
tate
d
Fisc
al Y
ear
24
KEY
LAR
GO
WAS
TEW
ATER
TR
EATM
ENT
DIS
TRIC
TR
EVEN
UES
BY
SOU
RC
E
Tota
lTo
tal
Tota
lFi
scal
Sew
erO
pera
ting
Non-
Ope
ratin
gCo
mbi
ned
Year
Serv
ice
Reve
nue
Gra
nts
Inte
rest
Oth
erRe
venu
eRe
venu
e
2018
9,90
5,81
5$
-$
9,90
5,81
5$
1,20
6,79
1$
-$
4,08
6,96
7$
360,
234
$16
,359
$5,
670,
351
$15
,576
,166
$20
179,
556,
501
-9,
556,
501
498,
000
1,19
0,01
44,
201,
378
334,
835
1,29
16,
225,
518
15,7
82,0
1920
169,
369,
902
-9,
369,
902
1,25
7,88
2-
4,28
4,57
823
,108
14,7
44,1
8620
,309
,754
29,6
79,6
5620
159,
024,
977
-9,
024,
977
795,
356
-4,
603,
764
18,8
601,
395,
209
6,81
3,18
915
,838
,166
2014
8,64
8,56
3-
8,64
8,56
319
5,76
2-
4,80
8,53
424
3,24
259
,680
5,30
7,21
813
,955
,781
2013
8,25
9,56
1-
8,25
9,56
1-
-5,
026,
498
169,
382
4,53
65,
200,
416
13,4
59,9
7720
127,
982,
364
-7,
982,
364
-11
,678
,229
5,29
5,03
821
,810
4,18
516
,999
,262
24,9
81,6
2620
114,
750,
891
-4,
750,
891
500,
000
1,45
7,47
95,
570,
211
47,8
37-
7,57
5,52
712
,326
,418
2010
814,
061
-81
4,06
113
,439
,479
3,70
4,41
15,
757,
448
108,
259
-23
,009
,597
23,8
23,6
5820
0970
5,93
565
3,28
91,
359,
224
4,82
5,35
84,
107,
049
5,22
5,61
779
5,17
1-
14,9
53,1
9516
,312
,419
2008
603,
047
843,
001
1,44
6,04
82,
224,
498
2,44
8,76
75,
298,
845
204,
565
-10
,176
,675
11,6
22,7
23
Nono
pera
ting
Inte
rgov
ernm
enta
lAd
val
orem
Ta
xes
Asse
ssm
ents
Ope
ratin
g
KEY
LAR
GO
WAS
TEW
ATER
TR
EATM
ENT
DIS
TRIC
TEX
PEN
SES
BY
FUN
CTI
ON
Tota
lTo
tal
Fisc
alCo
st o
f Sal
esCo
ntra
ctua
lO
pera
ting
Non-
Ope
ratin
gCo
mbi
ned
Year
and
Ser
vice
Adm
inst
ratio
nan
d O
ther
Depr
ecia
tion
Expe
nses
Expe
nses
Expe
nses
2018
3,75
8,31
7$
1,76
5,61
5$
441,
702
$4,
652,
670
$10
,618
,304
$1,
068,
547
$11
,686
,851
$20
17*
3,85
8,02
32,
135,
299
354,
727
4,62
3,56
010
,971
,609
1,16
1,39
812
,133
,007
2016
3,46
2,53
62,
061,
163
134,
052
4,18
8,92
19,
846,
672
1,32
7,83
911
,174
,511
2015
3,43
4,26
31,
933,
311
175,
224
4,00
3,06
59,
545,
863
1,49
3,74
511
,039
,608
2014
3,06
3,57
01,
755,
937
262,
912
3,97
5,91
99,
058,
338
3,05
4,27
812
,112
,616
2013
2,73
9,79
41,
762,
678
138,
631
3,91
5,06
48,
556,
167
2,40
9,96
410
,966
,131
2012
2,44
3,11
91,
579,
319
174,
844
3,79
0,49
77,
987,
779
4,30
5,18
612
,292
,965
2011
1,43
5,71
51,
262,
205
178,
168
3,47
5,34
76,
351,
435
2,50
2,00
98,
853,
444
2010
732,
969
839,
941
147,
290
387,
419
2,10
7,61
92,
228,
368
4,33
5,98
720
0970
7,20
067
6,19
117
5,48
437
6,54
01,
935,
415
419,
147
2,35
4,56
2
Ope
ratin
g Ex
pens
es
25
KEY
LAR
GO
WAS
TEW
ATER
TR
EATM
ENT
DIS
TRIC
TM
ONT
HLY
RAT
E ST
RU
CTU
RE
Base
Flow
Char
geCh
arge
(EDU
)(1
,000
Gal
.)Re
side
ntia
lNo
n-Re
side
ntia
lAc
coun
tsED
U's
2018
33.6
0$
5.27
$44
5,90
7$
285,
281
$9,
768
14,4
8420
1733
.60
5.27
459,
706
257,
843
9,48
514
,130
2016
33.6
05.
2746
4,89
327
0,07
49,
447
14,2
5120
1533
.60
5.27
458,
674
268,
133
9,44
914
,251
2014
33.6
05.
2745
4,58
025
1,89
49,
260
14,1
4420
1333
.60
5.27
462,
464
257,
970
9,08
514
,110
2012
33.6
05.
2744
9,62
325
1,26
79,
124
14,0
9720
1133
.60
5.27
271,
035
138,
334
6,10
710
,085
2010
33.6
05.
2756
,915
6,89
41,
256
1,47
020
0933
.60
5.27
45,8
426,
743
655
1,02
320
0833
.60
5.27
42,7
105,
605
657
1,02
320
0733
.60
5.27
43,7
602,
400
656
681
Aver
age
Mon
thly
Ser
vice
Fee
s
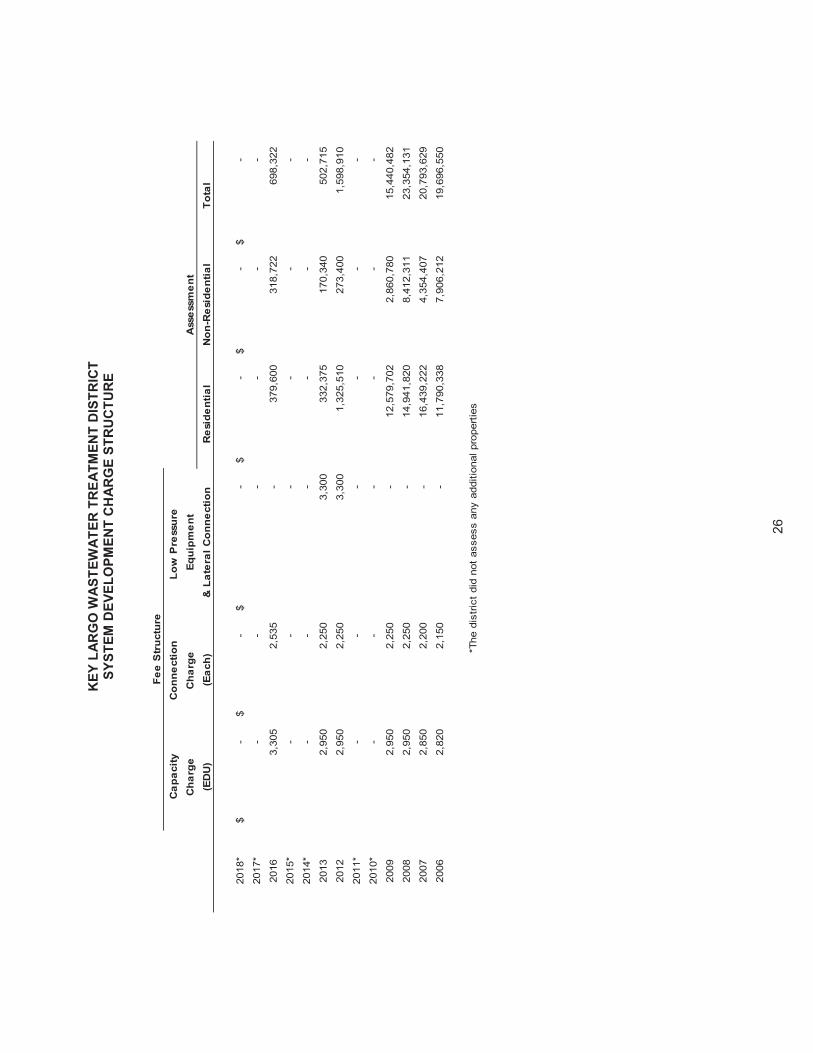
26
KEY
LAR
GO
WAS
TEW
ATER
TR
EATM
ENT
DIS
TRIC
TSY
STEM
DEV
ELO
PMEN
T C
HAR
GE
STR
UC
TUR
E
Cap
acity
Con
nect
ion
Low
Pre
ssur
e C
harg
eC
harg
eEq
uipm
ent
(ED
U)
(Eac
h)&
Lat
eral
Con
nect
ion
Res
iden
tial
Non
-Res
iden
tial
Tota
l
2018
*-
$-
$-
$-
$-
$-
$20
17*
--
--
--
2016
3,30
52,
535
-37
9,60
031
8,72
269
8,32
220
15*
--
--
--
2014
*-
--
--
-20
132,
950
2,25
03,
300
332,
375
170,
340
502,
715
2012
2,95
02,
250
3,30
01,
325,
510
273,
400
1,59
8,91
020
11*
--
--
--
2010
*-
--
--
-20
092,
950
2,25
0-
12,5
79,7
022,
860,
780
15,4
40,4
8220
082,
950
2,25
0-
14,9
41,8
208,
412,
311
23,3
54,1
3120
072,
850
2,20
0-
16,4
39,2
224,
354,
407
20,7
93,6
2920
062,
820
2,15
0-
11,7
90,3
387,
906,
212
19,6
96,5
50
*The
dis
trict
did
not
ass
ess
any
addi
tiona
l pro
perti
es
Ass
essm
ent
Fee
Str
uctu
re
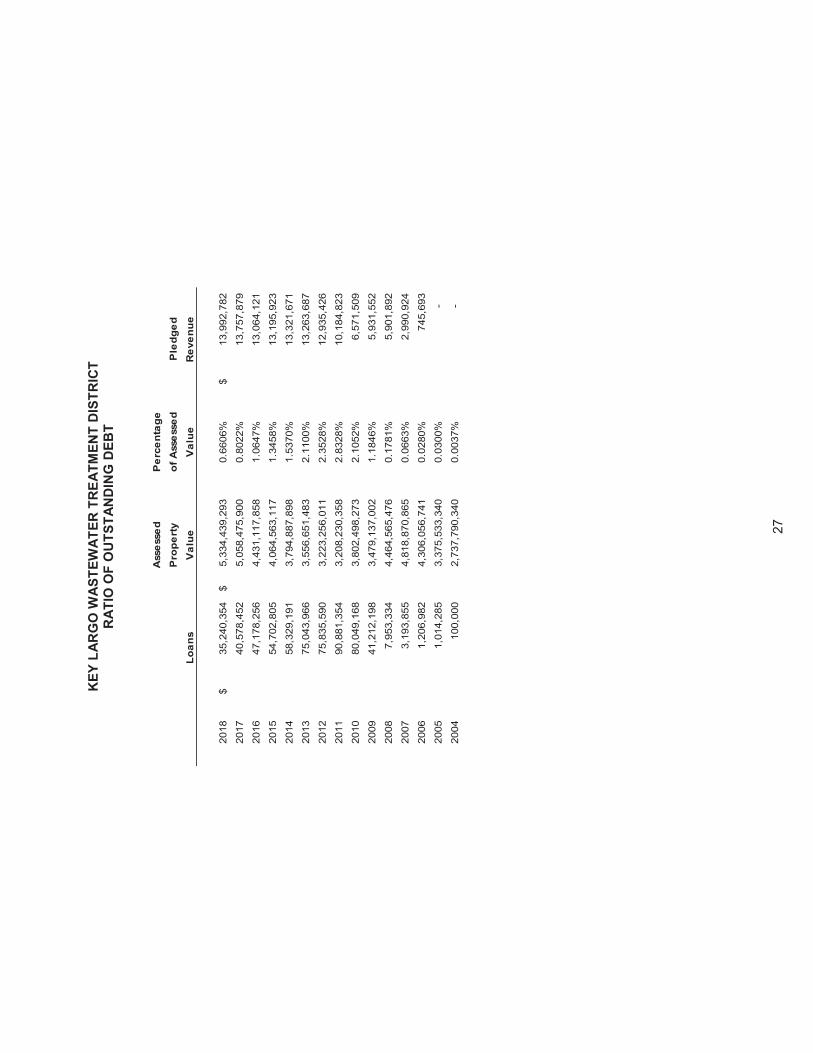
27
KEY
LAR
GO
WAS
TEW
ATER
TR
EATM
ENT
DIS
TRIC
TR
ATIO
OF
OU
TSTA
ND
ING
DEB
T
Ass
esse
dP
erce
ntag
eP
rope
rty
of A
sses
sed
Ple
dged
Loan
sV
alue
Val
ueR
even
ue
2018
35,2
40,3
54$
5,33
4,43
9,29
3$
0.66
06%
13,9
92,7
82$
2017
40,5
78,4
525,
058,
475,
900
0.80
22%
13,7
57,8
7920
1647
,178
,256
4,43
1,11
7,85
81.
0647
%13
,064
,121
2015
54,7
02,8
054,
064,
563,
117
1.34
58%
13,1
95,9
2320
1458
,329
,191
3,79
4,88
7,89
81.
5370
%13
,321
,671
2013
75,0
43,9
663,
556,
651,
483
2.11
00%
13,2
63,6
8720
1275
,835
,590
3,22
3,25
6,01
12.
3528
%12
,935
,426
2011
90,8
81,3
543,
208,
230,
358
2.83
28%
10,1
84,8
2320
1080
,049
,168
3,80
2,49
8,27
32.
1052
%6,
571,
509
2009
41,2
12,1
983,
479,
137,
002
1.18
46%
5,93
1,55
220
087,
953,
334
4,46
4,56
5,47
60.
1781
%5,
901,
892
2007
3,19
3,85
54,
818,
870,
865
0.06
63%
2,99
0,92
420
061,
206,
982
4,30
6,05
6,74
10.
0280
%74
5,69
320
051,
014,
285
3,37
5,53
3,34
00.
0300
%-
2004
100,
000
2,73
7,79
0,34
00.
0037
%-
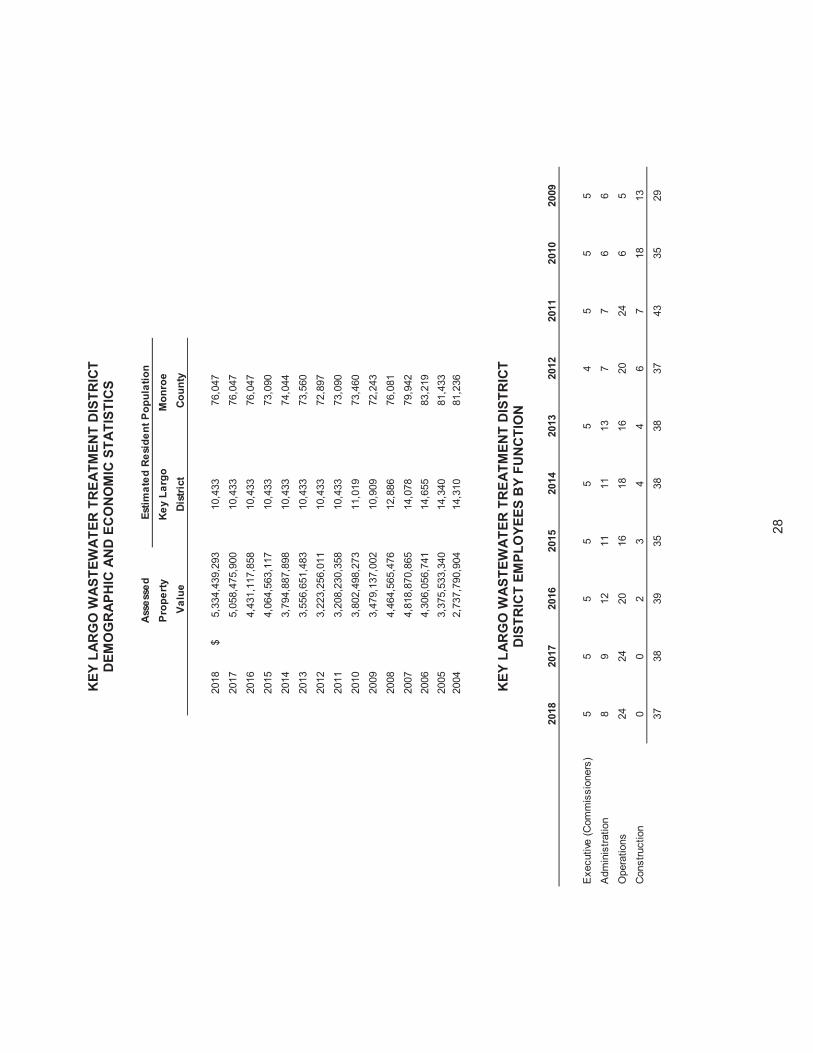
28
KEY
LAR
GO
WAS
TEW
ATER
TR
EATM
ENT
DIS
TRIC
TD
EMO
GR
APH
IC A
ND
EC
ON
OM
IC S
TATI
STIC
S
Asse
ssed
Pr
oper
ty
Key
Larg
oM
onro
e Va
lue
Dist
rict
Coun
ty
2018
5,33
4,43
9,29
3$
10,4
3376
,047
2017
5,05
8,47
5,90
010
,433
76,0
4720
164,
431,
117,
858
10,4
3376
,047
2015
4,06
4,56
3,11
710
,433
73,0
9020
143,
794,
887,
898
10,4
3374
,044
2013
3,55
6,65
1,48
310
,433
73,5
6020
123,
223,
256,
011
10,4
3372
,897
2011
3,20
8,23
0,35
810
,433
73,0
9020
103,
802,
498,
273
11,0
1973
,460
2009
3,47
9,13
7,00
210
,909
72,2
4320
084,
464,
565,
476
12,8
8676
,081
2007
4,81
8,87
0,86
514
,078
79,9
4220
064,
306,
056,
741
14,6
5583
,219
2005
3,37
5,53
3,34
014
,340
81,4
3320
042,
737,
790,
904
14,3
1081
,236
Estim
ated
Res
iden
t Pop
ulat
ion
KEY
LAR
GO
WAS
TEW
ATER
TR
EATM
ENT
DIS
TRIC
TD
ISTR
ICT
EMPL
OYE
ES B
Y FU
NC
TIO
N
2018
2017
2016
2015
2014
2013
2012
2011
2010
2009
Exe
cutiv
e (C
omm
issi
oner
s)5
55
55
54
55
5A
dmin
istra
tion
89
1211
1113
77
66
Ope
ratio
ns24
2420
1618
1620
246
5C
onst
ruct
ion
00
23
44
67
1813
3738
3935
3838
3743
3529
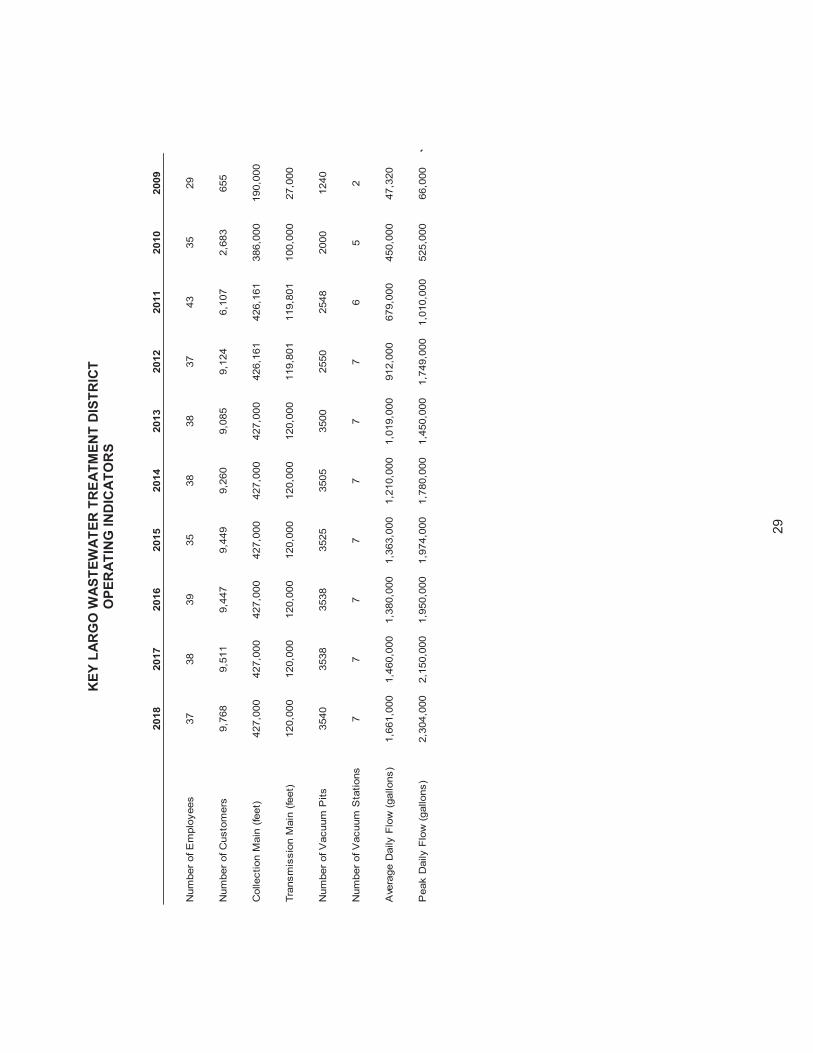
29
KEY
LAR
GO
WAS
TEW
ATER
TR
EATM
ENT
DIS
TRIC
TO
PER
ATIN
G IN
DIC
ATO
RS
2018
2017
2016
2015
2014
2013
2012
2011
2010
2009
Num
ber o
f Em
ploy
ees
3738
3935
3838
3743
3529
Num
ber o
f Cus
tom
ers
9,76
89,
511
9,44
79,
449
9,26
09,
085
9,12
46,
107
2,68
365
5
Col
lect
ion
Mai
n (fe
et)
427,
000
427,
000
427,
000
427,
000
427,
000
427,
000
426,
161
426,
161
386,
000
190,
000
Tran
smis
sion
Mai
n (fe
et)
120,
000
120,
000
120,
000
120,
000
120,
000
120,
000
119,
801
119,
801
100,
000
27,0
00
Num
ber o
f Vac
uum
Pits
3540
3538
3538
3525
3505
3500
2550
2548
2000
1240
Num
ber o
f Vac
uum
Sta
tions
77
77
77
76
52
Ave
rage
Dai
ly F
low
(gal
lons
)1,
661,
000
1,46
0,00
01,
380,
000
1,36
3,00
01,
210,
000
1,01
9,00
091
2,00
067
9,00
045
0,00
047
,320
Pea
k D
aily
Flo
w (g
allo
ns)
2,30
4,00
02,
150,
000
1,95
0,00
01,
974,
000
1,78
0,00
01,
450,
000
1,74
9,00
01,
010,
000
525,
000
66,0
00`
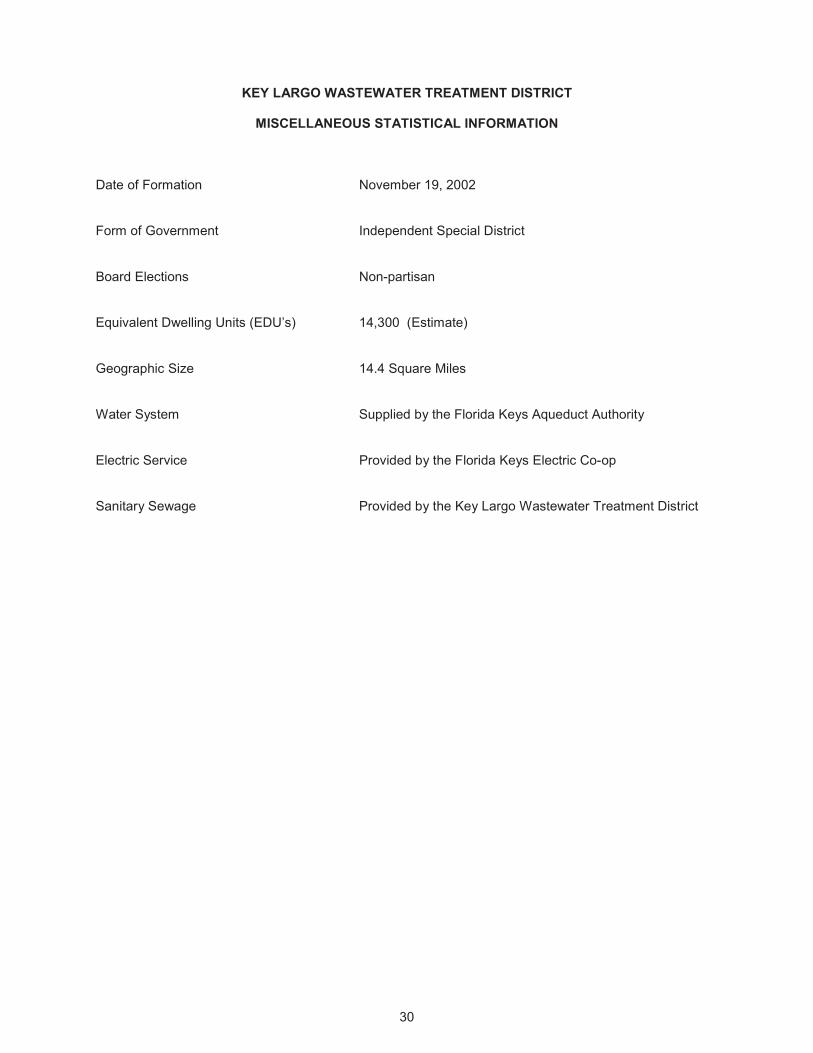
30
KEY LARGO WASTEWATER TREATMENT DISTRICT
MISCELLANEOUS STATISTICAL INFORMATION
Date of Formation November 19, 2002
Form of Government Independent Special District
Board Elections Non-partisan
Equivalent Dwelling Units (EDU’s) 14,300 (Estimate)
Geographic Size 14.4 Square Miles
Water System Supplied by the Florida Keys Aqueduct Authority
Electric Service Provided by the Florida Keys Electric Co-op
Sanitary Sewage Provided by the Key Largo Wastewater Treatment District
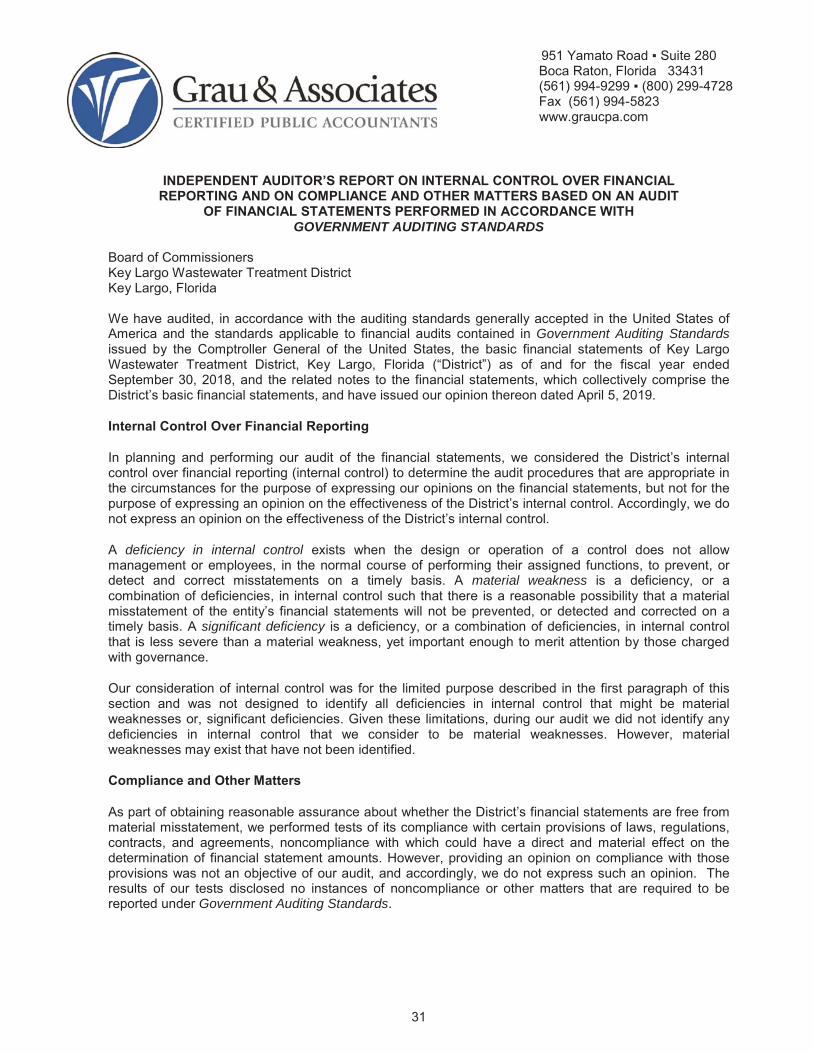
Boca Raton, Florida 33431(561) 994- -4728Fax (561) 994-5823www.graucpa.com
31
INDEPENDENT AUDITOR’S REPORT ON INTERNAL CONTROL OVER FINANCIAL REPORTING AND ON COMPLIANCE AND OTHER MATTERS BASED ON AN AUDIT
OF FINANCIAL STATEMENTS PERFORMED IN ACCORDANCE WITH GOVERNMENT AUDITING STANDARDS
Board of CommissionersKey Largo Wastewater Treatment DistrictKey Largo, Florida
We have audited, in accordance with the auditing standards generally accepted in the United States of America and the standards applicable to financial audits contained in Government Auditing Standardsissued by the Comptroller General of the United States, the basic financial statements of Key Largo Wastewater Treatment District, Key Largo, Florida (“District”) as of and for the fiscal year ended September 30, 2018, and the related notes to the financial statements, which collectively comprise the District’s basic financial statements, and have issued our opinion thereon dated April 5, 2019.
Internal Control Over Financial Reporting
In planning and performing our audit of the financial statements, we considered the District’s internal control over financial reporting (internal control) to determine the audit procedures that are appropriate in the circumstances for the purpose of expressing our opinions on the financial statements, but not for the purpose of expressing an opinion on the effectiveness of the District’s internal control. Accordingly, we do not express an opinion on the effectiveness of the District’s internal control.
A deficiency in internal control exists when the design or operation of a control does not allow management or employees, in the normal course of performing their assigned functions, to prevent, or detect and correct misstatements on a timely basis. A material weakness is a deficiency, or a combination of deficiencies, in internal control such that there is a reasonable possibility that a material misstatement of the entity’s financial statements will not be prevented, or detected and corrected on a timely basis. A significant deficiency is a deficiency, or a combination of deficiencies, in internal control that is less severe than a material weakness, yet important enough to merit attention by those charged with governance.
Our consideration of internal control was for the limited purpose described in the first paragraph of this section and was not designed to identify all deficiencies in internal control that might be material weaknesses or, significant deficiencies. Given these limitations, during our audit we did not identify any deficiencies in internal control that we consider to be material weaknesses. However, material weaknesses may exist that have not been identified.
Compliance and Other Matters
As part of obtaining reasonable assurance about whether the District’s financial statements are free frommaterial misstatement, we performed tests of its compliance with certain provisions of laws, regulations, contracts, and agreements, noncompliance with which could have a direct and material effect on the determination of financial statement amounts. However, providing an opinion on compliance with those provisions was not an objective of our audit, and accordingly, we do not express such an opinion. The results of our tests disclosed no instances of noncompliance or other matters that are required to be reported under Government Auditing Standards.
32
Purpose of this Report
The purpose of this report is solely to describe the scope of our testing of internal control and compliance and the results of that testing, and not to provide an opinion on the effectiveness of the entity’s internal control or on compliance. This report is an integral part of an audit performed in accordance with Government Auditing Standards in considering the entity’s internal control and compliance. Accordingly, this communication is not suitable for any other purpose.
April 5, 2019
951 YamBoca Raton, Florida 33431(561) 994- -4728Fax (561) 994-5823www.graucpa.com
33
INDEPENDENT AUDITOR’S REPORT ON COMPLIANCE FOR EACH MAJOR PROGRAMAND ON INTERNAL CONTROL OVER COMPLIANCE REQUIRED BY THE UNIFORM GUIDANCE
Board of CommissionersKey Largo Wastewater Treatment DistrictKey Largo, Florida
Report on Compliance for Each Major Federal Program
We have audited Key Largo Wastewater Treatment District, Key Largo, Florida (the “District”) compliance with the types of compliance requirements described in the OMB Compliance Supplement that couldhave a direct and material effect on each of the District’s major federal programs for the fiscal year ended September 30, 2018. The District’s major federal programs are identified in the summary of auditor’s results section of the accompanying schedule of findings and questioned costs.
Management’s Responsibility
Management is responsible for compliance with the requirements of laws, regulations, contracts, and grants applicable to its federal programs.
Auditor’s Responsibility
Our responsibility is to express an opinion on compliance for each of the District’s major federal programs based on our audit of the types of compliance requirements referred to above. We conducted our audit of compliance in accordance with auditing standards generally accepted in the United States of America; the standards applicable to financial audits contained in Government Auditing Standards, issued by the Comptroller General of the United States; and the audit requirements of Title 2 U.S. Code of Federal Regulations Part 200, Uniform Administrative Requirements, Cost Principles, and Audit Requirements for Federal Awards (Uniform Guidance). Those standards and the Uniform Guidance require that we plan and perform the audit to obtain reasonable assurance about whether noncompliance with the types of compliance requirements referred to above that could have a direct and material effect on a major federal program occurred. An audit includes examining, on a test basis, evidence about the District’s compliance with those requirements and performing such other procedures as we considered necessary in the circumstances.
We believe that our audit provides a reasonable basis for our opinion on compliance for each major federal program. However, our audit does not provide a legal determination of the District’s compliance.
Opinion on Each Major Federal Program
In our opinion, the District complied, in all material respects, with the types of compliance requirements referred to above that could have a direct and material effect on each of its major federal programs for the fiscal year ended September 30, 2018.
Report on Internal Control Over Compliance
Management of the District is responsible for establishing and maintaining effective internal control over compliance with the types of compliance requirements referred to above. In planning and performing our audit of compliance, we considered the District’s internal control over compliance with the types of requirements that could have a direct and material effect on each major federal program to determine the auditing procedures that are appropriate in the circumstances for the purpose of expressing an opinion on compliance for each major federal program and to test and report on internal control over compliance in accordance with the Uniform Guidance, but not for the purpose of expressing an opinion on the effectiveness of internal control over compliance. Accordingly, we do not express an opinion on the effectiveness of the District’s internal control over compliance.
34
A deficiency in internal control over compliance exists when the design or operation of a control over compliance does not allow management or employees, in the normal course of performing their assigned functions, to prevent, or detect and correct, noncompliance with a type of compliance requirement of afederal program on a timely basis. A material weakness in internal control over compliance is a deficiency, or combination of deficiencies, in internal control over compliance, such that there is a reasonable possibility that material noncompliance with a type of compliance requirement of a federal program will not be prevented, or detected and corrected, on a timely basis. A significant deficiency in internal control over compliance is a deficiency, or a combination of deficiencies, in internal control over compliance with a type of compliance requirement of a federal program that is less severe than a material weakness in internal control over compliance, yet important enough to merit attention by those charged with governance.
Our consideration of internal control over compliance was for the limited purpose described in the first paragraph of this section and was not designed to identify all deficiencies in internal control over compliance that might be material weaknesses or significant deficiencies. We did not identify any deficiencies in internal control over compliance that we consider to be material weaknesses. However, material weaknesses may exist that have not been identified.
Other Matters
Other Information
We have audited the basic financial statements of the Key Largo Wastewater Treatment District as of and for the year ended September 30, 2018 and have issued our report dated April 5, 2019. Our audit was conducted for the purpose of forming an opinion on the financial statements as a whole. Theaccompanying schedule of expenditures of federal awards, as required by the Uniform Guidance, Audits of States, Local Governments, and Non-Profit Organizations, is presented for purposes of additional analysis and is not a required part of the financial statements. Such information is the responsibility of management and was derived from and relates directly to the underlying accounting and other records used to prepare the financial statements. The information has been subjected to the auditing procedures applied in the audit of the financial statements and certain additional procedures, including comparing and reconciling such information directly to the underlying accounting and other records used to prepare the financial statements or to the financial statements themselves, and other additional procedures in accordance with auditing standards generally accepted in the United States of America. In our opinion, the information is fairly stated, in all material respects, in relation to the financial statements as a whole.
The purpose of this report on internal control over compliance is solely to describe the scope of our testing of internal control over compliance and the results of that testing based on the requirements of the Uniform Guidance. Accordingly, this report is not suitable for any other purpose.
April 5, 2019
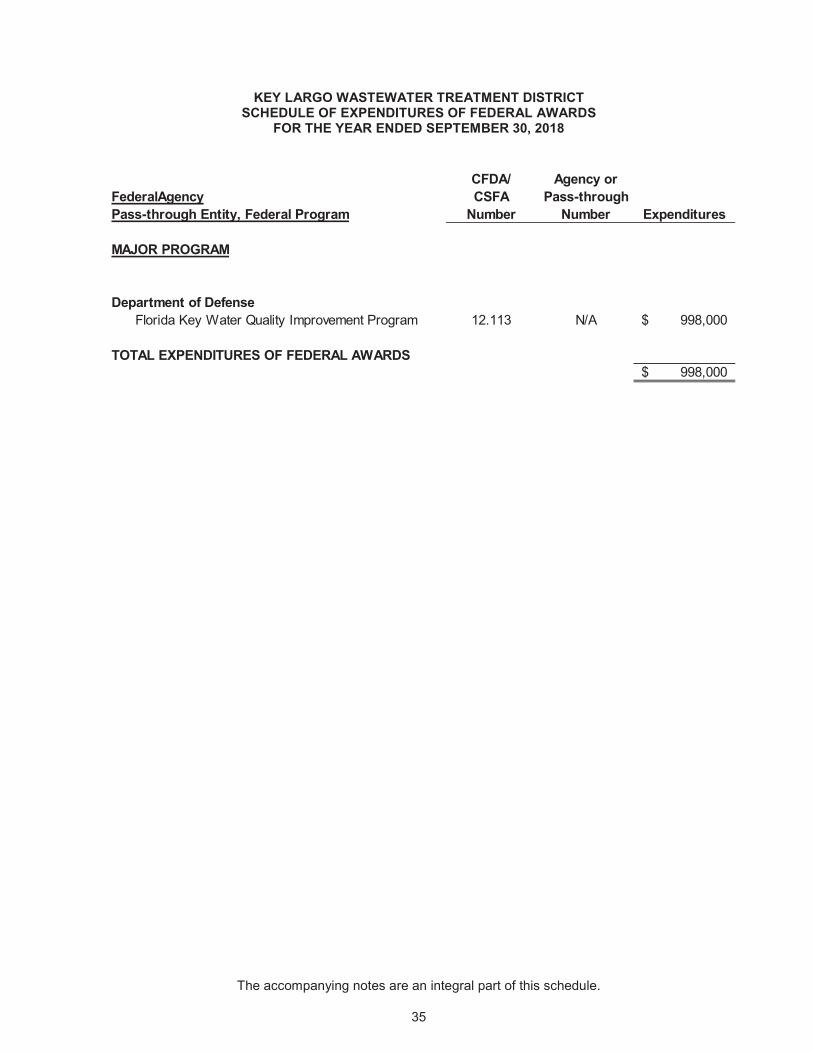
35
KEY LARGO WASTEWATER TREATMENT DISTRICTSCHEDULE OF EXPENDITURES OF FEDERAL AWARDS
FOR THE YEAR ENDED SEPTEMBER 30, 2018
CFDA/ Agency orCSFA Pass-through
Number Number Expenditures
MAJOR PROGRAM
Department of DefenseFlorida Key Water Quality Improvement Program 12.113 N/A 998,000$
TOTAL EXPENDITURES OF FEDERAL AWARDS998,000$
FederalAgencyPass-through Entity, Federal Program
The accompanying notes are an integral part of this schedule.
36
KEY LARGO WASTEWATER TREATMENT DISTRICTNOTES TO SCHEDULE OF EXPENDITURES OF FEDERAL AWARDS
FOR THE YEAR ENDED SEPTEMBER 30, 2018
NOTE A – BASIS OF PRESENTATION
The accompanying schedule of expenditures of federal awards includes the federal grant activity of Key Largo Wastewater Treatment District, Key Largo, Florida (the “District”) under the program of the federal government listed below for the fiscal year ended September 30, 2018. The information in this schedule is presented in accordance with the requirements of Title 2 U.S. Code of Federal Regulations (CFR) Part 200, Uniform Administrative Requirements, Cost Principles, and Audit Requirements for Federal Awards. Because the schedule presents only a selected portion of the operations of the District, it is not intended to and does not present the financial position, changes in net assets, cash flows or functional expenses of the District.
The major program tested ensured coverage of at least 20 percent of federally granted funds. Actual coverage is 100 percent of total cash and noncash Federal award program expenditures.
Major Federal Award Programs DescriptionPublic Assistance Grants
FY2018 Expenditures998,000$
NOTE B – SUMMARY OF SIGNIFICANT ACCOUNTING POLICIES
Expenditures reported on the schedule are reported on the accrual basis of accounting. Such expenditures are recognized following the cost principles contained in Title 2 U.S. Code of Federal Regulations (CFR) Part 200, Uniform Administrative Requirements, Cost Principles, and Audit Requirement for Federal Awards wherein certain types of expenditures are not allowable or are limited as to reimbursement. Additionally, the District did not elect to use the 10 percent de minimis indirect cost rate.
Pass-through entity identifying numbers are presented where available.
NOTE C – FINDINGS OF NONCOMPLIANCE
There were no findings of noncompliance identified in connection with the 2018 Federal Single Audit.
37
KEY LARGO WASTEWATER TREATMENT DISTRICTSCHEDULE OF FINDINGS AND QUESTIONED COSTS
FOR THE YEAR ENDED SEPTEMBER 30, 2018
A. SUMMARY OF AUDIT RESULTS
1. The auditor’s report expresses an unmodified opinion on the financial statements of Key Largo Wastewater Treatment District, Key Largo, Florida (the “District”).
2. No significant deficiencies or material weaknesses relating to the audit of the financial statements are reported in the independent auditor’s report on internal control over financial reporting and on compliance and other matters based on an audit of financial statements performed in accordance with Government Auditing Standards.
3. No instances of noncompliance material to the financial statements of the District were disclosed during the audit.
4. No significant deficiencies or material weaknesses relating to the audit of the major federal award programs are reported in the independent auditor’s report on compliance for each major program and on internal control over compliance required by the Uniform Guidance.
5. The independent auditor’s report on compliance for the major federal award program for the District expresses an unmodified opinion.
6. There were no audit findings relative to the major federal awards tested for the District.
7. The programs tested as a major program:
Program CFDA #
Public Assistance Grants 12.113
8. The dollar threshold used to distinguish between Type A and Type B programs was $750,000.
9. The District was not determined to be a low-risk auditee.
B. CURRENT YEAR FINDINGS AND RECOMMENDATION – FINANCIAL STATEMENT AUDIT
None
C. PRIOR YEAR FINDINGS
None
D. FINDINGS AND QUESTIONED COSTS - MAJOR FEDERAL AWARDS
None
E. OTHER ISSUES
No summary schedule of prior audit findings and corrective action plan is required because there were no prior audit findings related to federal award programs.

Boca Raton, Florida 33431(561) 994- -4728Fax (561) 994-5823www.graucpa.com
38
INDEPENDENT AUDITOR’S REPORT ON COMPLIANCE WITH THE REQUIREMENTS OF SECTION 218.415, FLORIDA STATUTES, REQUIRED BY RULE 10.556(10) OF THE AUDITOR GENERAL OF THE STATE OF FLORIDA
Board of CommissionersKey Largo Wastewater Treatment DistrictKey Largo, Florida
We have examined Key Largo Wastewater Treatment District, Key Largo, Florida’s (“District”) compliance with the requirements of Section 218.415, Florida Statutes, in accordance with Rule 10.556(10) of the Auditor General of the State of Florida during the fiscal year ended September 30, 2018. Management is responsible for District’s compliance with those requirements. Our responsibility is to express an opinion on District’s compliance based on our examination.
Our examination was conducted in accordance with attestation standards established by the American Institute of Certified Public Accountants. Those standards require that we plan and perform the examination to obtain reasonable assurance about whether the District complied, in all material respects, with the specified requirements referenced in Section 218.415, Florida Statutes. An examination involves performing procedures to obtain evidence about whether the District complied with the specified requirements. The nature, timing, and extent of the procedures selected depend on our judgment, including an assessment of the risks of material noncompliance, whether due to fraud or error. We believe that the evidence we obtained is sufficient and appropriate to provide a reasonable basis for our opinion. Our examination does not provide a legal determination on the District’s compliance with specified requirements.
In our opinion, the District complied, in all material respects, with the aforementioned requirements for the fiscal year ended September 30, 2018.
This report is intended solely for the information and use of the Legislative Auditing Committee, members of the Florida Senate and the Florida House of Representatives, the Florida Auditor General, management, and the Board of Commissioners of Key Largo Wastewater Treatment District, Key Largo,Florida and is not intended to be and should not be used by anyone other than these specified parties.
April 5, 2019
Boca Raton, Florida 33431(561) 994- -4728Fax (561) 994-5823www.graucpa.com
39
MANAGEMENT LETTER PURSUANT TO THE RULES OFTHE AUDITOR GENERAL FOR THE STATE OF FLORIDA
Board of DirectorsKey Largo Wastewater Treatment DistrictKey Largo, Florida
Report on the Financial Statements
We have audited the accompanying basic financial statements of Key Largo Wastewater TreatmentDistrict, Key Largo, Florida ("District") as of and for the fiscal year ended September 30, 2018, and have issued our report thereon dated April 5, 2019.
Auditor’s Responsibility
We conducted our audit in accordance with auditing standards generally accepted in the United States of America; the standards applicable to financial audits contained in Government Auditing Standards, issued by the Comptroller General of the United States; and Chapter 10.550, Rules of the Florida Auditor General.
Other Reporting Requirements
We have issued our Independent Auditor’s Report on Internal Control over Financial Reporting and on Compliance and Other Matters Based on an Audit of the Financial Statements Performed in Accordance with Government Auditing Standards; and Independent Auditor’s Report on an examination conducted in accordance with AICPA Professional Standards, AT-C Section 315, regarding compliance requirements in accordance with Chapter 10.550, Rules of the Auditor General. Disclosures in those reports, which are dated April 5, 2019, should be considered in conjunction with this management letter.
Purpose of this Letter
The purpose of this letter is to comment on those matters required by Chapter 10.550 of the Rules of the Auditor General for the State of Florida. Accordingly, in connection with our audit of the financial statements of the District, as described in the first paragraph, we report the following:
I. Current year findings and recommendations.II. Status of prior year findings and recommendations.III. Compliance with the Provisions of the Auditor General of the State of Florida.
Our management letter is intended solely for the information and use of the Legislative Auditing Committee, members of the Florida Senate and the Florida House of Representatives, the Florida Auditor General, Federal and other granting agencies, as applicable, management, and the Board of Commissioners of Key Largo Wastewater Treatment District, Key Largo, Florida and is not intended to be and should not be used by anyone other than these specified parties.
We wish to thank Key Largo Wastewater Treatment District, Key Largo, Florida and the personnel associated with it, for the opportunity to be of service to them in this endeavor as well as future engagements, and the courtesies extended to us.
April 5, 2019
40
REPORT TO MANAGEMENT
I. CURRENT YEAR FINDINGS AND RECOMMENDATIONS
None
II. PRIOR YEAR FINDINGS AND RECOMMENDATIONS
None
III. COMPLIANCE WITH THE PROVISIONS OF THE AUDITOR GENERAL OF THE STATE OF FLORIDA
Unless otherwise required to be reported in the auditor’s report on compliance and internal controls, the management letter shall include, but not be limited to the following:
1. A statement as to whether or not corrective actions have been taken to address findings and recommendations made in the preceding annual financial audit report.
There were no significant findings and recommendations made in the preceding annual financial audit report for the fiscal year ended September 30, 2017.
2. Any recommendations to improve the local governmental entity's financial management.
There were no such matters discovered by, or that came to the attention of, the auditor, to be reported for the fiscal year ended September 30, 2018.
3. Noncompliance with provisions of contracts or grant agreements, or abuse, that have occurred, or are likely to have occurred, that have an effect on the financial statements that is less than material but which warrants the attention of those charged with governance.
There were no such matters discovered by, or that came to the attention of, the auditor, to be reported, for the fiscal year ended September 30, 2018.
4. The name or official title and legal authority of the District are disclosed in the notes to the financial statements.
5. The District has not met one or more of the financial emergency conditions described in Section 218.503(1), Florida Statutes.
6. We applied financial condition assessment procedures and no deteriorating financial conditions were noted as of September 30, 2018. It is management’s responsibility to monitor financial condition, and our financial condition assessment was based in part on representations made by management and the review of financial information provided by same.