Embed Size (px)
Citation preview
Related Party Transactions (RPTs): A Second Source for Earnings Management –
Evidence from Chinese IPOs
Peng Cheng∗ and Jean Chen
University of Surrey (UK)
Abstract
This study examines earnings management behaviors of Chinese IPO firms (Initial Public Offerings) in the pre-IPO period. We argue that Chinese IPO firms may engage in two approaches to manipulate pre-IPO reported earnings: one is to manipulate discretionary accruals, and the other is to structure artificial operating RPTs (non-loan Related Party Transactions) with controlling shareholders to boost sales and/or profits. Besides some evidence of accrual-based earnings management in the pre-IPO period, we find that some IPO firms structure a large percentage of operating RPTs with controlling shareholders in the pre-IPO year, which is positively associated with the operating performance of IPO firms. In the post-IPO period, controlling shareholders discontinue these RPT-based earnings management practices, so that the positive relation between operating performance of IPO firms and the size of operating RPTs disappears. We further find that long-run IPO stock performance is significantly associated with the decline in operating RPTs from before to after the IPO (at 5% level). Keywords: Operating RPTs, Accruals, Earnings management, IPOs JEL: M4, G39
∗ School of Management, University of Surrey, Guildford, Surrey, United Kingdom, GU2 7XH; Tel: 0044 (0)1483 683102; Fax: 0044 (0)1483 689511; Email: [email protected]

1. Introduction
Prior research has identified that companies use accrual-based earnings management around the
equity offerings, including initial offerings (Teoh et al., 1998a; DuCharme et al., 2001; Li et al.,
2006; Lee and Masulis, 2006) and seasonal offerings (Teoh et al., 1998b; Zhou and Elder, 2004),
to boost equity sales and/or raise offering price. Although empirical research on pre-IPO accruals
management has been largely conducted on the US firms, world-wide evidence including China
H-share market (Aharony et al., 2000), South Korea (Yoon and Miller, 2002), Holland
(Roosenboom et al., 2003) and Taiwan (Jaggi et al., 2006) consistently supports this argument.
Research (Teoh et al., 1998a; Roosenboom et al., 2003) has also revealed that pre-IPO accruals
management is linked with poor stock performance in the post-IPO period, which has been
widely identified by global evidence including the US (Ritter, 1991; Loughran and Ritter, 1995),
the UK (Levis, 1993), Germany (Ljungqvist, 1997), Japan (Cai and Wei, 1997) and China (Chan
et al., 2004). Long-term stock underperformance may indicate a possible informational
inefficiency in capital allocation, or the existence of trading opportunities that produce superior
abnormal returns in stock markets.
Most prior studies use discretionary accruals as the proxy for earnings management, primarily
because accruals component is more likely to be manipulated by managers than cash flow
component (Beneish, 2001). However, as Healy and Wahlen (1999) point out, earnings
management may occur when managers structure transactions to alter financial reports. For
example, Bartov (1993) has presented US evidence that managers manipulate reported earnings
1
through the timing of income recognition from disposal of long-lived assets and investments, so
called as ‘transaction-based earnings management’. We further argue that firms may structure
transactions with their related parties for earnings management purposes. A recent well-known
case is that Coca-Cola once uses the influential relationship with its bottlers, in which Coca-Cola
has large ownership and board seats, to charge a higher price for the concentrate sold to bottlers
and boost its profits (McKay, 2002). Furthermore, firms may artificially structure transactions
with controlling shareholders in a way that allows resources to be transferred, or profits to be
shifted between the two parties (Cheung et al., 2006). However, empirical study on earnings
management through related party transactions (RPTs) is limited.
We extend the extant pre-IPO earnings management literature by providing empirical evidence
on RPTs as a source for earnings management in the pre-IPO period, and then investigate how
the market responds to this pre-IPO RPT-based earnings management in the aftermarket period.
Specifically, the study focuses on the Chinese market because RPTs between controlling
shareholders and listed firms are frequently structured in developing markets, like China1. RPTs
are widely used in China, primarily because Chinese listed firms have a close economic
relationship with their state-owned controlling shareholders. Most listed firms originate from one
or a few profitable business units of their parent State-Owned Enterprises (SOEs). When those
units were carved out for public listing, they do not normally have their independent distribution
network and supply chains, so that they have to purchase raw materials and/or sell finished
1 However, in many developed markets, RPTs are strictly constrained by the laws and regulations: for example, US Sarbanes-Oxley Act (2002) prohibits personal loans to executives and non-executive board members subsequent to a series of corporate scandals, like Adelphia.
2
products through their controlling shareholders. In other cases, listed firms sell semi-finished
products to their controlling shareholders, and controlling shareholders then further process these
semi-finished products into finished products. So, in this study, we examine both accrual-based
and RPT-based earnings management in the pre-IPO period by investigating Chinese A-share
IPO data. We believe that pre-IPO firms are likely to engage in earnings management through
either accruals management or RPTs with their controlling shareholders.
The remainder of the paper is organized as follows: Section 2 presents the literature review.
Section 3 introduces research design. Section 4 describes the data and discusses the findings.
Section 5 comes to the conclusion.
2. Literature Review and Hypothesis Development
2.1. Accruals Management
Earnings management is a natural and pervasive corporate phenomenon under the current market
regulation and condition (Leuz et al., 2003). Adjustments of discretionary accruals are believed
to be the first way to manipulate reported earnings, since the nature of accrual-based accounting
gives managers a great deal of discretions in determining the actual earnings a firm reports in any
given period.
Global evidence has shown that IPO firms are likely to manipulate discretionary accruals to
boost pre-IPO reported earnings, since IPO firms have incentives to engage in income-increasing
activities to ensure that the issues are fully subscribed and are priced sufficiently high to garner
3

adequate proceeds (Li et al., 2006). Teoh et al. (1998a) and DuCharme et al. (2001) examine US
IPOs and present evidence that discretionary accruals are high before the IPO relative to those of
non-issuers. Higher pre-IPO discretionary accruals increase a firm’s initial value and its IPO
proceeds (DuCharme et al., 2001), but decrease stock performance in the subsequent years (Teoh
et al., 1998a). Li et al. (2006) further argue that US IPO firms associated with aggressive pre-IPO
accruals management are more likely to be de-listed because of their poor post-IPO stock
performance. Roosenboom et al. (2003) find Dutch issuers raise their reported earnings in the
pre-IPO period by manipulating discretionary accruals, and unwind the accruals subsequent to
the IPO. However, Dutch IPOs tend to spread the unwinding process over a longer period, since
managers reduce provisions for impairment in an attempt to mitigate the negative effect of the
inevitable reversal of current accruals on reported net income. Jaggi et al. (2006) find that
Taiwanese IPO firms tend to release more optimistic earnings forecasts than conservative
forecasts, and those IPOs disclosing optimistic earnings forecasts engage in more accruals
manipulation to meet the forecast error threshold.
This is also likely to be the case in China, since good historical operating performance increases
the possibility of a firm being selected for an IPO in Chinese markets. According to Chinese
Company Law (ed. 1993, CH. 3. 152), a candidate IPO company should have 3-year operating
records with measurable earnings for 3 consecutive years prior to the IPO. Empirically, Aharony
et al. (2000) provide an initial study of pre-IPO accruals management on Chinese B-share2 firms
2 A-share market is the main market for domestic investors; however, B-share market is designed for overseas investors, and B-share stocks are traded in foreign currencies, either US Dollars or Hong Kong Dollars.
4
and analyze two specific accruals components including annual change in accounting receivables
and inventories. They find that accounts receivables of IPOs firms are abnormally high in the
pre-IPO period, and low in the post-IPO period, showing that Chinese B-share IPOs may engage
in accruals management by accelerating credit sales prior to the IPO. However, it should be
recognized that Aharony et al. (2000) do not use any aggregate accruals models to separate
discretionary accruals from non-discretionary accruals, but examine some specific accruals items.
This methodology is rarely used for a multi-industry sample, even though it may be valid for
some special industries, such as banking (Scholes et al., 1990) or property and casualty insurance
(Petroni, 1992), which needs the knowledge of institutional arrangements to characterize the
likely discretionary behavior of specific accruals. Wang (2005) further argues that this
methodology may not be useful to detect accruals management for IPO firms, because the
movement from before to after the IPO in one single specific accrual item does not necessarily
mean that managers manipulate the aggregate accruals component to inflate reported earnings.
So, in this sense, accruals component of Chinese firms should be re-examined by using some
widely-adopted aggregate accruals models.
Therefore, we hypothesize that Chinese IPOs artificially inflate earnings by adjusting
discretionary accruals in the pre-IPO period to boost their IPO sales. However, this abnormally
high discretionary cannot be sustainable in the long run. Once an IPO is completed, discretionary
accruals are likely to be reversed in the subsequent years. If the stock market can not see through
this accruals manipulation, the share price will be negatively affected in the aftermarket period.
5
We test the following hypotheses:
H1a: IPO firms show positive discretionary accruals in the pre-IPO period relative to industry
peers; but show negative discretionary accruals in the post-IPO period.
H1b: IPO firms with high positive discretionary accruals in the pre-IPO period are likely to
report poor post-IPO stock performance in the long run.
2.2. Related Party Transactions and Earnings Management
However, reported earnings may be manipulated either through accruals management or through
the abusive use of RPTs between controlling shareholder and its listed firms. According to IAS, a
related party transaction is ‘a transfer of resources, services, or obligations between related
parties, regardless of whether a price is charged’ (International Accounting Standards, IAS 24.9).
RPTs among group members can be cost-effective for both sides, because they help reduce
transaction costs and enhance the enforcement of property rights and contracts (Coase, 1937).
However, McCahery and Vermeulen (2005) argue that operating RPTs may not be undertaken at
market prices and can be influenced by the relationship between the two sides. If operating RPTs
are structured at a price other than the market price, then the profits would be immediately
shifted between group members, but the consolidated earnings remain generally unaffected
(Thomas et al., 2004).
RPT-based earnings management is different from accrual-based earnings management: Firstly,
firms engage in accrual-based earnings management by borrowing from either the past or the
6
future, but the total earnings over the long run could not be manipulated. However, RPT-based
earnings management occurs between two related parties by injecting valuable assets and/or
shifting profits from one party to the other. The earnings of one party’s entity over the long run
may be inflated, but the consolidated earnings remain generally unaffected. Secondly,
accrual-based approach manipulates the accruals component of reported earnings only, leaving
the cashflow component of reported earnings unchanged. However, RPT-based approach can
affect either the accruals component or the cashflows component of reported earnings. For
example, when a firm artificially structures a trade relationship with its related party by credit
sales, the firm’s cashflow performance will not be affected by this accruals manipulation.
However, if the firm’s related party makes cash payment for the transaction, both its earnings
performance and cashflow performance will be inflated as a result.
Rigorous academic research in prior literature that describes the extent of RPTs in companies or
investigates their underlying nature is rare (Gorden et al., 2004). There is one published paper by
Thomas et al. (2004) which studies Japanese firms, who issue both parent and consolidated
financial statements, and has identified that parent earnings can be managed using transactions
with affiliates. The findings show earnings management behaviors for parent and consolidated
earnings around three earnings thresholds: avoiding losses, avoiding earnings declines and
avoiding negative forecast errors.
There are two unpublished working papers examining RPTs in China. Liu and Lu (2004)
conjecture earnings management in Chinese listed companies may be mainly induced by the
7
controlling owners’ RPT transactions, due to concentrated ownership and weak corporate
governance. Jian and Wong (2004) provide evidence of 131 Chinese listed firms in the raw
materials sector that group-controlled listed firms report abnormally high levels of related party
sales to their controlling shareholders, when they have incentives to inflate earnings to avoid
being de-listed or prior to rights issues. Once the group-controlled listed firms have generated
significant free cash flows, they may divert resources back to the group through providing other
member firms generous trade credits. However, both papers have not researched RPT-based
earning management for IPO firms.
So, we hypothesize that, in the pre-IPO period, IPO firms may structure operating RPTs with
controlling shareholders, such as artificially selling products and goods to controlling
shareholders to boost their sales, or selling products and goods at a higher-than-market price
and/or purchasing raw materials at a lower-than-market price to improve their profit margins.
Profits are thus shifted from controlling shareholders to pre-IPO firms. If public investors fail to
see through this earnings management practice, they may pay a higher price to buy the shares,
and the offering price may be pushed higher. Controlling shareholders could benefit from the
pre-IPO RPT-based earnings management: for example, they may receive more IPO proceeds,
due to an inflated IPO price, which will be under the control of controlling shareholders in the
aftermarket period. Controlling shareholders may also sell the overvalued shares to reap the
profits in return for profits and/or resources transferred into the IPO firms in the pre-IPO period3.
However, in the post-IPO period, those artificial transactions will discontinue, since controlling
3 One may argue that, in Chinese A-share market, the shares held by controlling shareholders cannot be traded publicly on the stock exchanges. However, this proportion of shares is still privately tradable, since controlling shareholders are allowed to sell
8
shareholders lose interest in maintaining those artificial practices. So, the magnitude of RPTs is
likely to decline in the post-IPO period in comparison to the pre-IPO level, and the relation
between operating RPTs and operating performance of IPO firms is likely to disappear in the
post-IPO period.
Due to the promulgation of Chinese Accounting Standards in 1998 (Disclosure of Related Party
Relationships and Transactions, CMOF, 1998), Chinese listed firms have been required to
disclose any RPTs in their annual reports, including the nature and the amount of the transactions
since 1998. The disclosed RPTs between controlling shareholders and listed firms may be
categorized into two by their economic substance: operating RPTs and loan RPTs. According to
our sample, operating RPTs and loan RPTs amount to 85% and 15% of total RPTs respectively
during the entire investigation period. Operating RPTs consist of trade relationship (trades of raw
materials, products and services) and sales of non-monetary assets, leases, franchises, and
administrative overheads and so on. Loan RPTs may include cash loans and loans guarantees.
Loan RPTs are less likely to be part of RPT-based earnings management practices, and they will
not impact reported operating performance of IPO firms, unless the size of the loans is
considerably large. In this sense, the following empirical study will focus on operating RPTs, and
hereafter, the RPTs refers to operating RPTs only.
We set our hypotheses on operating RPT-based earnings management as follows.
these shares off exchanges by seeking a prospective buyer themselves.
9
H2a: The pre-IPO operating RPTs are positively associated with firms’ artificially high
operating performance, but the relationship between post-IPO operating RPTs and post-IPO
performance fades in the post-IPO period.
Then, we further argue that investors are unlikely to see through this pre-IPO RPT-based
earnings management. For example, IPO firms may manipulate the RPTs by charging controlling
shareholders at a higher-than market price for the products sold so as to boost sales and revenues.
If an active market price is not available, investors can not observe the fair value of these
transactions and see through these overcharging practices. When IPO firms aggressively oversell
products to controlling shareholders, financial statements of IPO firms will not show these
overselling practices. Financial statements of controlling shareholders’ entities may reveal some
signs of these overselling practices, e.g. an abnormally high level of inventories is reported.
However, controlling shareholders do not need to disclose their financial statements in China,
and investors can hardly see through these artificial overselling practices.
Since investors are unable to fully recognize this RPT-based earnings management, they may
consider these manipulative practices to be ‘genuine’, thus, pay a higher price for the IPO.
However, if controlling shareholders fail to continue these artificial RPTs in the post-IPO period,
the operating performance of IPO firms may be negatively affected so that the long-run stock
performance may also decline as a result. Thus, we hypothesize that the change in operating
RPTs would have a positive effect on the long-run stock performance of IPO firms.
10
H2b: The decline in RPTs from pre-IPO to post-IPO period is positively associated with the
poor long-run stock performance of an IPO firm.
3. Research Design
3.1. Performance Measurement
We use ROA (EBITDA divided by lagged (-1) total assets) and CFO (Net cashflow from
operation divided by lagged (-1) total assets) to measure IPO firm’s operating performance,
because they have been widely employed in prior literature to evaluate the efficiency of profit
generation. In order to control for industry shocks, we apply industry adjustment for the IPO
firms’ operating performance by deducting the median contemporaneous ROA (or CFO) figures
of the matching firms in the same 2-digit industry group (Mikkelson et al., 1997). We segregate
the sample firms into 13 industry groups (1-digit, group A-M), by using the CSRC’s Standard
Industry Classification (SIC, 2001), which is the only official system to classify Chinese listed
firms (Table 1, Panel A). We further break the group C (manufacturing sector) into 9 sub-groups
(2-digit, C1-C8), because the group C includes 62% of the sample firms. The matching listed
firms are those in the same industrial classification and are listed prior to the sample IPO firms.
[Insert Table 1 here]
We adopt benchmark-adjusted BAHRs (Buy and Hold Returns) and CARs (Cumulative
Abnormal Returns) as the indicators of the aftermarket abnormal stock performance of Chinese
IPOs. Prior literature uses both of the two measures to identify long-term abnormal stock
11
performance, but neither of them is always preferred (Gompers and Lerner, 2003). The
benchmark-adjusted BAHRs and CARs for an IPO firm i in the event year t are:
∏∏==
+−+=t
ssm
t
ssiti RRBAHR
1,
1,, )1()1(
∑=
−=t
ssmsiti RRCAR
1,,, )(
where represents the raw stock return of stock i in the event year Y (s) (s = 1, 2, 3, 4), and
is the contemporaneous benchmark return in the event year Y (s) (s = 1, 2, 3, 4). The
aftermarket period includes the following 4 years where years include successive
252-trading-day periods relative to the IPO date. Thus, the event year 1 consists of event days
2-252, and the event year 2 consists of event days 253-504. For those IPOs that are de-listed
before their 4-year anniversary, we truncate the aftermarket period and end the 4-year return with
its last listing. In addition, the BAHRs and CARs are both inclusive of dividends and other
distributions.
siR ,
smR ,
We use matching firms for a benchmark. The matching firms include those already-listed firms
in the same 2-digit industry classification (Ritter, 1991), primarily because we perform industry
adjustment for IPO long-run operating performance by matching firms; therefore, we should also
make the same adjustment for IPO long-run stock performance. Thus, the benchmark return used
in this study is the median contemporaneous stock return of a group of matched listed firms
within 2-digit SIC code.
12
3.2. Measurement of Discretionary Accruals
The majority of empirical research decomposes total accruals into discretionary accruals and
non-discretionary accruals and employs aggregate discretionary accruals regression models, such
as Jones (1991) model (Li et al., 2006), modified Jones model (Teoh et al., 1998a; DuCharme et
al., 2001; Roosenboom et al., 2003; Lee and Masulis, 2006; Jaggi et al., 2006), and
performance-matched modified Jones model (Li et al., 2006). We use the modified Jones model
to examine the discretionary accruals of Chinese IPOs, because Dechow et al. (1995) argue that
the modified Jones (1991) model is the most statistically powerful model for detecting accruals
management, and it is the most widely used model in accruals management literature.
The modified Jones model computes discretionary accruals as follows:
Discretionary accruals = Net income – Operating cash flow – Non-discretionary accruals
Nondiscretionary variables are expected accruals and the discretionary variables are the residuals.
Expected accruals for an IPO firm i in a given year t are estimated by a cross-sectional regression
of that year of total accruals on the change in sales using an estimation sample of all listed firms
in the same industry subcategories. Specifically, for each year t in the test period, run the
following cross-sectional regression:
tjtj
tj
tj
tjtj
tjtj
tj
TAPPE
TATRSALES
TATATAC
,1,
,2
1,
,,1
1,0
1,
, 1 εααα +⎟⎟⎠
⎞⎜⎜⎝
⎛+⎟
⎟⎠
⎞⎜⎜⎝
⎛ Δ−Δ+⎟
⎟⎠
⎞⎜⎜⎝
⎛=
−−−−
Where is the total accruals for IPO firm’s peers j at year t; tjTAC , SALESΔ is the year-to-year
change in sales revenues; is the change in trade receivables; PPE is the gross level of TRΔ
13
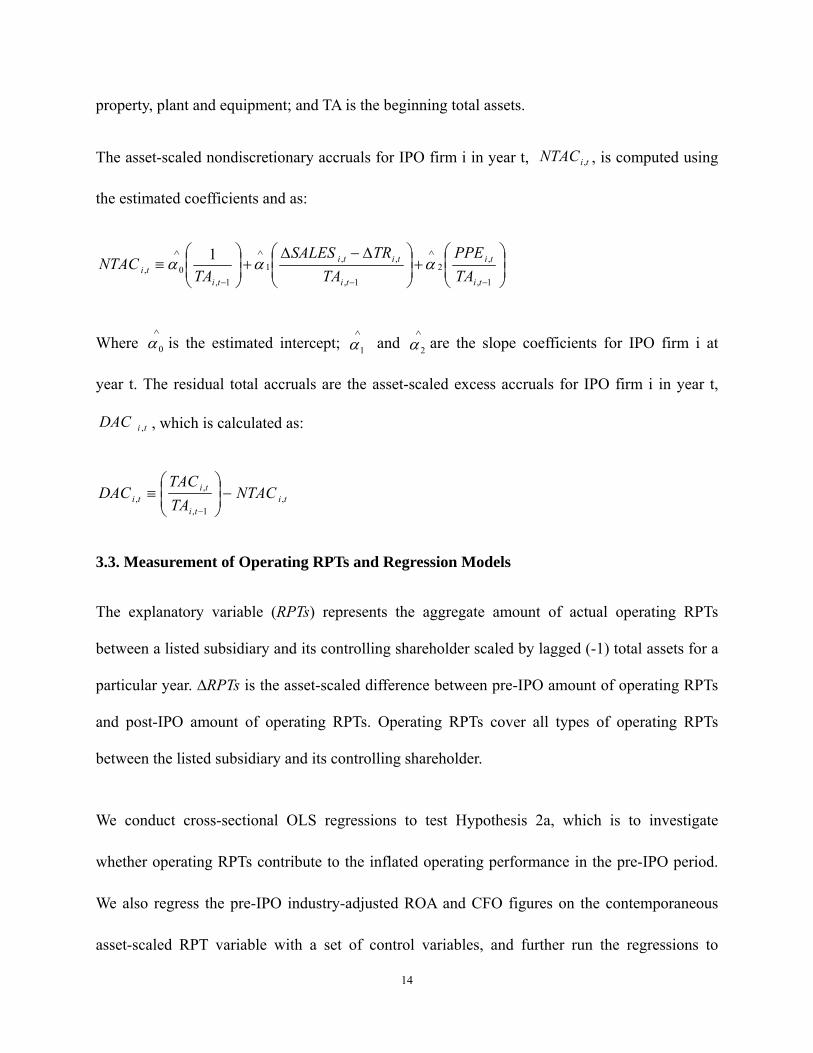
property, plant and equipment; and TA is the beginning total assets.
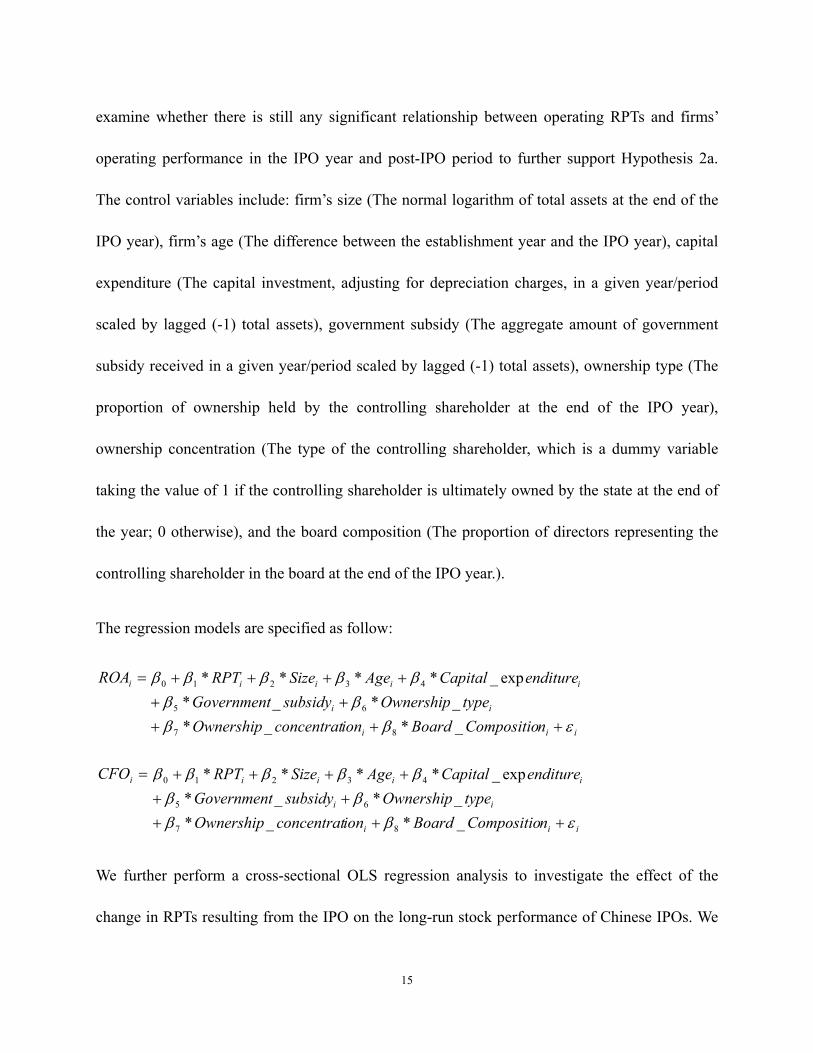
The asset-scaled nondiscretionary accruals for IPO firm i in year t, , is computed using
the estimated coefficients and as:
tiNTAC ,
⎟⎟⎠
⎞⎜⎜⎝
⎛+⎟
⎟⎠
⎞⎜⎜⎝
⎛ Δ−Δ+⎟
⎟⎠
⎞⎜⎜⎝
⎛≡
−
∧
−
∧
−
∧
1,
,2
1,
,,1
1,0,
1
ti
ti
ti
titi
titi TA
PPETA
TRSALESTA
NTAC ααα
Where is the estimated intercept; and are the slope coefficients for IPO firm i at
year t. The residual total accruals are the asset-scaled excess accruals for IPO firm i in year t,
, which is calculated as:
∧
0α∧
1α∧
2α
tiDAC ,
titi
titi NTAC
TATAC
DAC ,1,
,, −⎟
⎟⎠
⎞⎜⎜⎝
⎛≡
−
3.3. Measurement of Operating RPTs and Regression Models
The explanatory variable (RPTs) represents the aggregate amount of actual operating RPTs
between a listed subsidiary and its controlling shareholder scaled by lagged (-1) total assets for a
particular year. ∆RPTs is the asset-scaled difference between pre-IPO amount of operating RPTs
and post-IPO amount of operating RPTs. Operating RPTs cover all types of operating RPTs
between the listed subsidiary and its controlling shareholder.
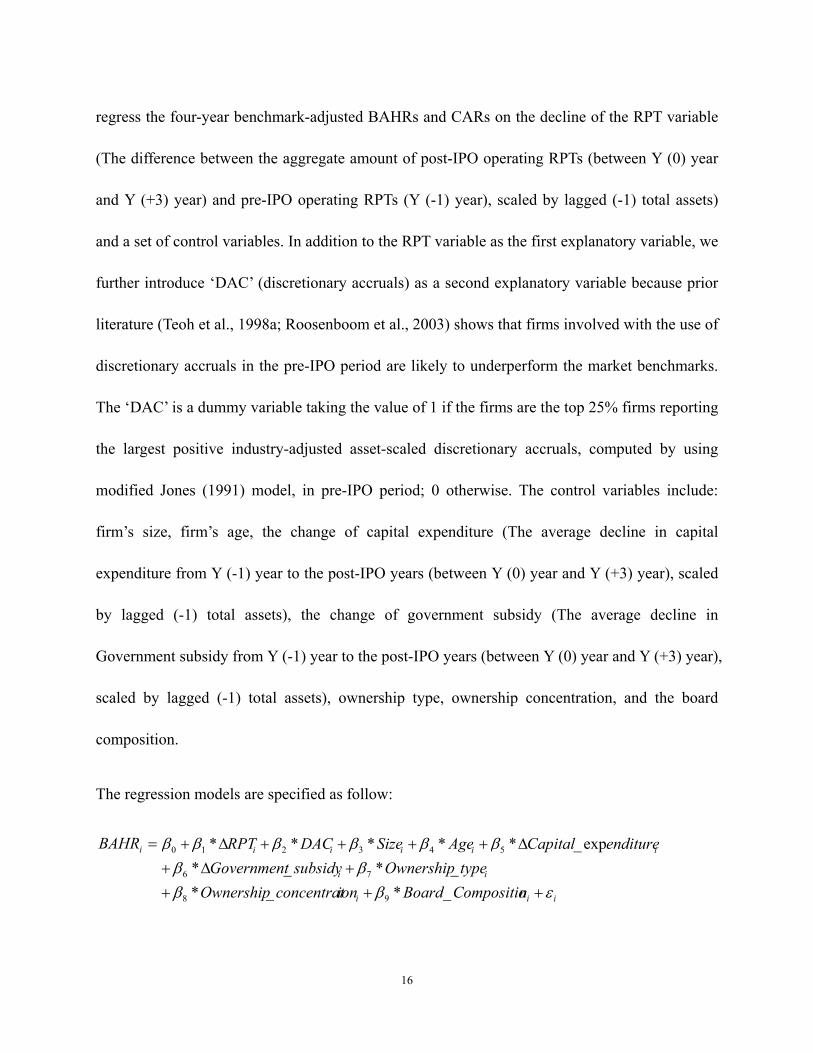
We conduct cross-sectional OLS regressions to test Hypothesis 2a, which is to investigate
whether operating RPTs contribute to the inflated operating performance in the pre-IPO period.
We also regress the pre-IPO industry-adjusted ROA and CFO figures on the contemporaneous
asset-scaled RPT variable with a set of control variables, and further run the regressions to
14
examine whether there is still any significant relationship between operating RPTs and firms’
operating performance in the IPO year and post-IPO period to further support Hypothesis 2a.
The control variables include: firm’s size (The normal logarithm of total assets at the end of the
IPO year), firm’s age (The difference between the establishment year and the IPO year), capital
expenditure (The capital investment, adjusting for depreciation charges, in a given year/period
scaled by lagged (-1) total assets), government subsidy (The aggregate amount of government
subsidy received in a given year/period scaled by lagged (-1) total assets), ownership type (The
proportion of ownership held by the controlling shareholder at the end of the IPO year),
ownership concentration (The type of the controlling shareholder, which is a dummy variable
taking the value of 1 if the controlling shareholder is ultimately owned by the state at the end of
the year; 0 otherwise), and the board composition (The proportion of directors representing the
controlling shareholder in the board at the end of the IPO year.).
The regression models are specified as follow:
=iROA
iii
ii
iiii
nCompositioBoardionconcentratOwnershiptypeOwnershipsubsidyGovernment
enditureCapitalAgeSizeRPT
εββββ
βββββ
+++++
++++
_*_*_*_*
exp_****
87
65
43210
=iCFO
iii
ii
iiii
nCompositioBoardionconcentratOwnershiptypeOwnershipsubsidyGovernment
enditureCapitalAgeSizeRPT
εββββ
βββββ
+++++
++++
_*_*_*_*
exp_****
87
65
43210
We further perform a cross-sectional OLS regression analysis to investigate the effect of the
change in RPTs resulting from the IPO on the long-run stock performance of Chinese IPOs. We
15
regress the four-year benchmark-adjusted BAHRs and CARs on the decline of the RPT variable
(The difference between the aggregate amount of post-IPO operating RPTs (between Y (0) year
and Y (+3) year) and pre-IPO operating RPTs (Y (-1) year), scaled by lagged (-1) total assets)
and a set of control variables. In addition to the RPT variable as the first explanatory variable, we
further introduce ‘DAC’ (discretionary accruals) as a second explanatory variable because prior
literature (Teoh et al., 1998a; Roosenboom et al., 2003) shows that firms involved with the use of
discretionary accruals in the pre-IPO period are likely to underperform the market benchmarks.
The ‘DAC’ is a dummy variable taking the value of 1 if the firms are the top 25% firms reporting
the largest positive industry-adjusted asset-scaled discretionary accruals, computed by using
modified Jones (1991) model, in pre-IPO period; 0 otherwise. The control variables include:
firm’s size, firm’s age, the change of capital expenditure (The average decline in capital
expenditure from Y (-1) year to the post-IPO years (between Y (0) year and Y (+3) year), scaled
by lagged (-1) total assets), the change of government subsidy (The average decline in
Government subsidy from Y (-1) year to the post-IPO years (between Y (0) year and Y (+3) year),
scaled by lagged (-1) total assets), ownership type, ownership concentration, and the board
composition.
The regression models are specified as follow:
=iBAHR
iii
ii
iiiii
nCompositioBoardionconcentratOwnershiptypeOwnershipsubsidyGovernment
enditureCapitalAgeSizeDACRPT
εββββ
ββββββ
++++Δ+
Δ++++Δ+
_*_*_*_*
exp_*****
98
76
543210
16
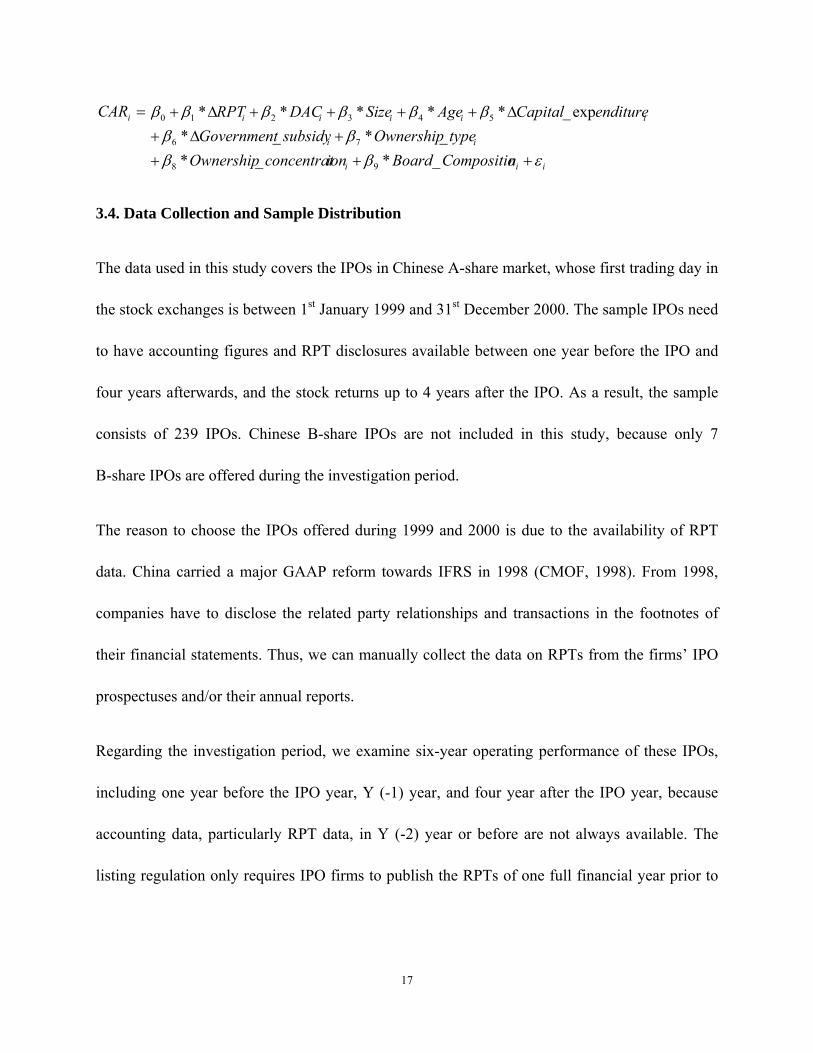
=iCAR
iii
ii
iiiii
nCompositioBoardionconcentratOwnershiptypeOwnershipsubsidyGovernment
enditureCapitalAgeSizeDACRPT
εββββ
ββββββ
++++Δ+
Δ++++Δ+
_*_*_*_*
exp_*****
98
76
543210
3.4. Data Collection and Sample Distribution
The data used in this study covers the IPOs in Chinese A-share market, whose first trading day in
the stock exchanges is between 1st January 1999 and 31st December 2000. The sample IPOs need
to have accounting figures and RPT disclosures available between one year before the IPO and
four years afterwards, and the stock returns up to 4 years after the IPO. As a result, the sample
consists of 239 IPOs. Chinese B-share IPOs are not included in this study, because only 7
B-share IPOs are offered during the investigation period.
The reason to choose the IPOs offered during 1999 and 2000 is due to the availability of RPT
data. China carried a major GAAP reform towards IFRS in 1998 (CMOF, 1998). From 1998,
companies have to disclose the related party relationships and transactions in the footnotes of
their financial statements. Thus, we can manually collect the data on RPTs from the firms’ IPO
prospectuses and/or their annual reports.
Regarding the investigation period, we examine six-year operating performance of these IPOs,
including one year before the IPO year, Y (-1) year, and four year after the IPO year, because
accounting data, particularly RPT data, in Y (-2) year or before are not always available. The
listing regulation only requires IPO firms to publish the RPTs of one full financial year prior to
17
the IPO. We collect the data on operating performance from the Shenzhen Securities Info Co.
Ltd and stock performance from the Great Wise Info Co. Ltd.
Table 1 describes the sample distribution by industry sectors (Panel A) and the sample
descriptive statistics in comparison to the contemporaneous figures of the whole market, in terms
of sales, total assets, EBITDA, ROA and operating cashflow on assets. The magnitudes of these
statistics of the sample firms are similar to those of the whole market by means of operation
scales and profitability. For example, the mean sale of the sample firms is RMB¥1.44 billion and
the median value is RMB¥0.70 billion, while the corresponding figures for the market are
RBM¥1.90 billion and RBM¥0.62 billion respectively. Further, mean tests and median tests (not
reported here) show that the differences of the two groups are not statistically significant at any
effective level. Therefore, the sample is representative for the population.
[Insert Table 1 here]
4. Empirical Results
4.1. Long-term IPO Operating Performance
We, first of all, examine the IPO firms’ long-term operating performance after industry
adjustment from before to after the IPO. In this way, the results can show any abnormal
operating performance of IPO firms relative to industry peers, in the pre-IPO and post-IPO
period. Panel A and Panel B of Table 2 show the industry-adjusted earnings performance (ROA)
and the industry-adjusted cashflow performance (CFO) from one year before the IPO to 4 years
18

after the IPO respectively. In terms of both ROA and CFO, Chinese IPO firms report much better
operating performance in the pre-IPO period than their industry peers. However, this abnormal
operating outperformance disappears after the IPOs are successfully listed.
[Insert Table 2 here]
For the ROA (Panel A), IPO firms significantly outperform their industry peers in the pre-IPO
year by 12.71% (t-statistics=10.39) in mean value and 10.18% (z-statistics=8.43) in median
value. IPO firms continue to outperform in the IPO year, but this earnings outperformance
decreases to 7.06% (mean value, t-statistic=4.76) and 3.40% (median value, z-statistic=6.20)
respectively. The ROA outperformance of the IPO firms fades away in the post-IPO period, and
it seems that ROA performance of IPO firms is likely to be lower than the industry level,
however both mean and median values do not have statistical significance. Panel B shows the
similar trend for CFO performance of the IPO firms: IPO firms significantly outperform their
industry peers in the pre-IPO year by 6.74% (t-statistics=2.79) in mean value and 2.54%
(z-statistics=3.81) in median value; However, this CFO outperformance disappear in the IPO
year and thereafter. As discussed earlier, cashflow performance is not affected by managers’
accruals management practices, so Panel B may imply that IPO firms is likely to engage in some
manipulative schemes other than accruals management to manage their reported operating
performance.
Prior literature all shows Chinese A-share IPOs experience a sharp deterioration in operating
performance from pre-IPO level to post-IPO level (Wang et al., 2001; Chen and Shih, 2004;
19
Wang, 2005). But the drawback of the pervious findings lies in that they do not adjust IPO firms’
operating performance by industry level. We provide more rigorous evidence to show that the
pre-IPO operating performance may have been artificially inflated relative to industry level. The
IPO operating performance declines from before to after the IPO, because IPO firms abnormally
outperform their industry peers in the pre-IPO period, but the operating outperformance is not
sustainable in the post-IPO period. We conjecture that the pre-IPO operating performance may
have been significantly inflated, and these manipulative earnings management practices
discontinue in the post-IPO period.
4.2. Accrual-Based Earnings Management
4.2.1. Discretionary Accruals around the IPO
Table 3 presents asset-scaled discretionary accruals (DAC), net of the median contemporaneous
figure of the same 2-digit publicly traded firms. Both the mean value and the median value of
DAC in one year prior to the IPO are positive (0.079 and 0.075 respectively) with high statistical
significance (t statistic=5.03 and z statistic=5.96 respectively). It indicates that managers may
artificially manipulate discretionary accruals upwards to inflate reported earnings in the pre-IPO
year.
[Take in Table 3 here]
The high positive DAC for the IPO firms does not disappear immediately in the IPO year and the
first year (+1) after the IPO, and both the mean and the median DAC are positive and statistically
significant. However, mean and median DAC figures turn to be negative from the year (+2) after
20
the IPO, and the negative median DAC figures for the year (+3) and (+4) after the IPO show a
10% statistical significance. Overall, our findings support Hypothesis 1a. Table 3 confirms that
IPO firms artificially manipulate discretionary accruals upwards to inflate reported earnings in
the pre-IPO year. It also shows that there is a clear decline in discretionary accruals in the
post-IPO period, relative to the pre-IPO level, which could lead to a decline in reported earnings
from before to after the IPO.
Table 3 also shows that IPOs are likely to unwind discretionary accruals from the year (+2) after
the IPO, however the evidence of unwinding is not strongly significant: although median values
of negative DAC in the Y (+3) year and the Y (+4) year are significant, mean values are not
statistically significant at any effective level. It indicates that Chinese IPO firms do not
considerably unwind the discretionary accruals immediately after the IPOs.
The delay in unwinding discretionary accruals is interesting, and we argue that Chinese
managers are reluctant to unwind discretionary accruals immediately after the IPO. It is likely
that managers tend to spread the reversal of discretionary accruals over a longer post-IPO period
in order to avoid any negative impact of the unwinding. In fact, prior literature (Roosenboom et
al., 2003) has already shown that Dutch IPO firms slow down the accruals unwinding process
and reduce provisions for impairment so as to mitigate the negative effects of the inevitable
unwinding of the accruals on reported earnings. An immediate reversal of discretionary accruals
will negatively affect reported earnings of IPO firms substantially and may result in public
complaint and market regulator’s fraud investigation. In a case of China, due to low quality of
external auditors, weak corporate governance and small institutional ownership, which is too
small to be an effective monitoring mechanism, Chinese firms are more likely to carry impaired
assets on their balance sheets for a long time, and fail to unwind the accruals in a timely manner.
21
4.2.2. Stock Market Reaction to Discretionary Accruals
We further investigate stock market reaction to accrual-based earnings management before the
IPO. The IPO firms are grouped into four quartile portfolios by the degree of pre-IPO DAC.
[Take in Table 4 here]
Panel A shows the mean values of benchmark-adjusted BAHRs in four pre-IPO DAC portfolios.
The fourth quartile portfolio (Q4) that reports the largest positive DAC in the pre-IPO year
underperforms their industry peers in the stock market by more than 15% over 2 years or longer
after the IPO; however, the other three quartile portfolios (Q1, Q2, Q3) that report smaller
positive DAC or negative DAC in pre-IPO year do not seem to substantially underperform their
industry peers. Panel B further confirms the finding by using the benchmark-adjusted CARs.
Table 4 presents evidence that IPO firms that report the largest positive DAC in the pre-IPO
period perform poorly in the stock market in comparison to industry peers. So, our findings
support Hypothesis 1b.
4.3. RPT-base Earnings Management
4.3.1. Sample RPT Statistics
We break down the sample operating RPTs into five line items, including trade relationship, sale
of non-monetary asset, administrative overheads paid by listed subsidiaries to controlling
shareholders for obtaining services and private resources, franchising and royalty, and lease.
Table 5 reports the asset-scaled mean and median values for the total and each of the line-item
RPTs.
22
[Take in Table 5 here]
The total amount of operating RPTs is significantly large from pre-IPO year to post-IPO years (at
1% significance level). The mean value shows 20.87% in the Y (-1) year, reaches 24.27% in the
IPO year, but declines to 15.60% in the Y (+1) year, and then remains stable in the following
post-IPO years. The median value shows that the magnitude of operating RPTs is very relatively
stable from before to after the IPO at a range between 4.35% and 6.40%, except for the IPO year
(6.90%). Of the 5 line-item operating RPTs, trade relationship shows the most active transactions
between controlling shareholders and their IPO subsidiaries, which accounts for 90% of the total
operating RPTs (a 1% statistical significance throughout). The percentage in the pre-IPO year is
19.49% and 2.85% (mean and median) respectively, rises to 21.48% and 6.05% respectively in
the IPO year, significantly declines to 13.86% and 4.05% respectively in the first year after the
IPO, and then stays stable during two to four post-IPO years.
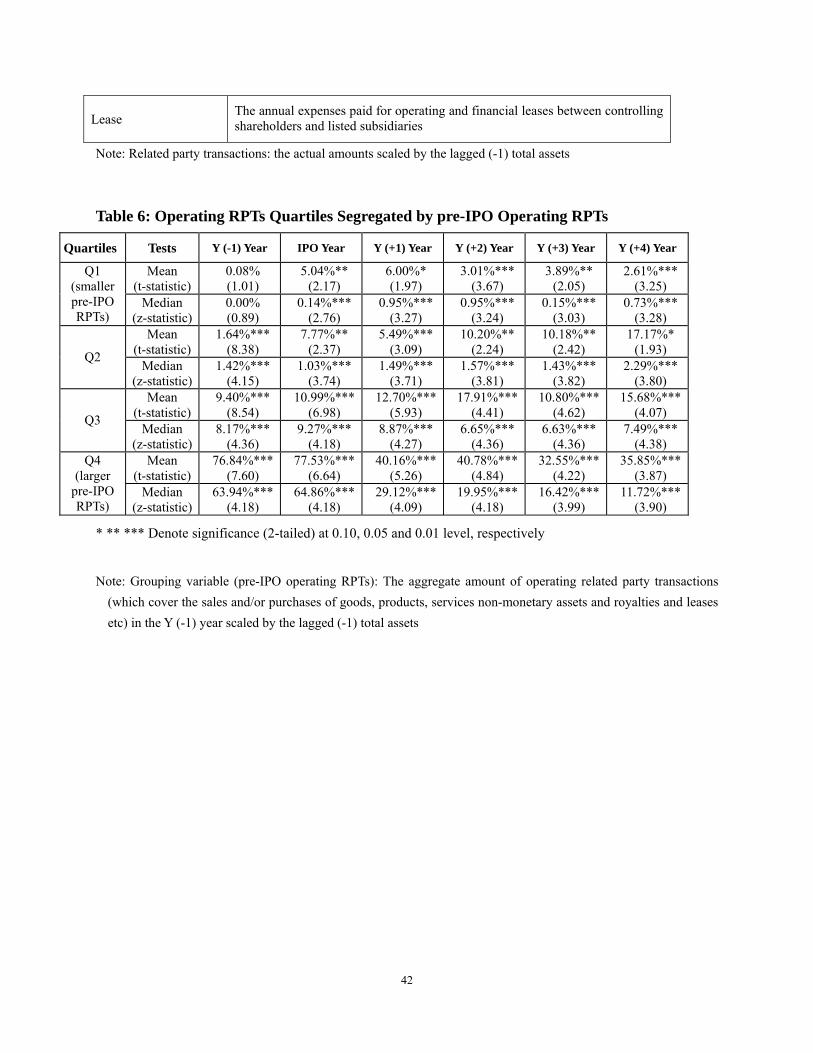
We then segregate our sample IPOs into 4 quartile portfolios by the level of aggregate operating
RPTs in the pre-IPO year scaled by lagged (-1) total assets. Table 6 presents mean and median
values of the four portfolios. The first three quartile portfolios (Q1, Q2 and Q3), reporting
relatively small operating RPTs in the pre-IPO period, remain to report a small amount of
operating RPTs in the post-IPO period. The median values of the three portfolios show 0.00%,
1.42% and 8.17% (z-statistic = 0.89, 4.15 and 4.36) respectively in the pre-IPO year, and
corresponding figures in the post-IPO period do not seem to be significantly different: for
example, 0.95%, 1.49% and 8.87% (z-statistic = 3.27, 3.71 and 4.27) respectively in the Y (+1)
23
year and remain stable afterwards. The fourth quartile portfolio (Q4) reports much larger
operating RPTs (median value 63.94%, z statistic = 4.18) in the pre-IPO period than the other
three quartile portfolios (Q1, Q2 and Q3); however, interestingly, it shows a clear decline from
the pre-IPO year to the post-IPO years: for example, the median value of RPTs decreases to
29.12% (z statistic = 4.09) in the Y (+1) year and further goes down to 11.72% (z statistic = 3.90)
in the Y (+4) year. This finding shows that those controlling shareholders who structure a large
percentage of operating RPTs with their IPO subsidiaries in the pre-IPO period significantly
reduce those operating RPTs in the post-IPO period.
[Take in Table 6 here]
4.4. RPTs and Earnings Performance
Overall, operating RPT statistics show that some IPO firms (Q4 portfolio firms) use an
abnormally large percentage of operating RPTs in the pre-IPO period, and significantly reduce
those RPTs in the post-IPO years. So, it is interesting to find out whether the use of abnormally
large RPTs in the pre-IPO period is abused and artificially conducted. Then, in table 7, we also
segregate sample firms into four quartile portfolios, and Q1 and Q4 represent IPO firms
reporting the smallest and the largest operating RPTs in the pre-IPO year respectively. Table 7
presents mean and median values of industry-adjusted ROA and CFO figures of IPO firms from
before to after the IPO. If Q4 portfolio firms abuse the use of operating RPTs in the pre-IPO
period, their reported operating performance may be artificially manipulated upwards in the
pre-IPO period; and then suffer a quicker decline from before to after the IPO.
24
[Take in Table 7 here]
Table 7 is supportive of this expectation. In Y (-1) year, mean and median value of
industry-adjusted ROA for portfolio Q1 are the lowest among the four portfolios (7.16%, t
statistic = 5.76; 7.68%, z statistic = 4.01 respectively), however, portfolio Q4 reports the largest
(20.31%, t statistic = 5.86; 14.93%, z statistic = 4.18). It indicates that IPO firms with larger
pre-IPO operating RPTs are likely to report better earnings performance in the pre-IPO period.
Furthermore, there is a significant decline in earnings performance from before to after the IPO
for all of the four quartile portfolios, but IPO firms with larger pre-IPO operating RPTs are likely
to report a larger decline in earnings performance from before to after the IPO. Table 7 also
presents mean and median values of industry-adjusted CFO figures of the four quartile portfolios
before and after the IPO. Portfolio Q4 with the largest pre-IPO operating RPTs reports the
abnormally highest cashflow performance in Y (-1) year (17.79%, t statistic = 1.88; 7.33%, z
statistic = 1.74) among the four different quartile portfolios; while the remaining three portfolios
(Q1, Q2, Q3) report relatively lower cashflow performance (3.43%, 3.72% and 3.87%
respectively in mean values; 2.24%, 2.43% and 2.34% respectively in median values).
Furthermore, it seems that IPO firms with largest pre-IPO operating RPTs report the largest
decline in cashflow performance from the pre-IPO period to the post-IPO period.
Table 7 confirms the conjecture that pre-IPO operating performance may have been artificially
exaggerated through pre-IPO operating RPTs, primarily because IPO firms with larger operating
RPTs in the pre-IPO period are likely to report better operating performance in the pre-IPO
period; and consequently those IPO firms are likely to suffer a quicker decline in operating
performance from before to after the IPO.
25
Then, we perform cross-sectional OLS cross-sectional regressions to investigate whether
reported operating performance of Chinese IPOs in the pre-IPO period is artificially exaggerated
through pre-IPO operating RPTs. First of all, table 8 presents inter-correlation test results
(Pearson’s) between independent variables. It shows that the correlations between operating
RPTs, ownership variables (ownership type and concentration) and board composition are
strongly significant (at 5% level), implying that IPO firms with high concentrated ownership
structure and board composition are likely to conduct more operating RPTs with their controlling
shareholders.
[Take in Table 8 here]
The high correlations of these variables may give rise to a concern of multicollinearity between
some control variables and explanatory variable (operating RPTs). However, multicollinearity
between control variables with explanatory variable is not a research problem, even though the
control variables will have a strong effect on the explanatory variables. We could simply remove
the three ownership and governance variables from our regressions, but omitting a variable in the
regression may substantially bias the true value of estimated parameters, and the error term is
inflated. Although such regressions ignore the contemporaneous correlations among variables,
and can lead to biased standard errors (but not biased coefficient estimates), this specification
provides regression coefficients that allow an easy interpretation of the economic significance.
Prior literature has adopted a similar version of regression when examines IPO performance and
earnings performance (Ritter, 1991; Teoh et al., 1998).
26
[Take in Table 9 here]
So, we firstly regress ROA on operating RPTs and a set of control variables, and table 9a
presents the regression results of the three models for the pre-IPO period, the IPO year and the
post-IPO period respectively. The R2 of the three models are 17.7%, 19.9% and 40.6%
respectively (F statistics = 2.19, 2.61 and 3.68 respectively). It indicates the fitness of the models
are robust and the explanatory power of the models is strong. The coefficients for RPT variable
(operating RPTs) in the models for the pre-IPO year and the IPO year are positive (0.078 and
0.078 respectively) and statistically significant a 5% and 10% level respectively, indicating that
operating RPTs positively relates to ROA performance in pre-IPO and the IPO years. However,
the estimated coefficient decreases to 0.036 without statistical significance in the post-IPO
period, showing that the relation between operating RPTs and earnings performance (ROA)
fades in the post-IPO period.
Table 9b further provides regression results, when CFO is regressed on operating RPTs and a set
of control variables. The three models explain 18.0%, 8.4% and 31.4% ( 2R ) of the variation of
the dependent variable respectively (F statistic = 2.42, 1.02 and 5.05 respectively). The estimated
coefficient of variable ‘Operating RPTs’ in the first model is found to be positive (0.103, t
statistic = 2.30) at 5% significance level, indicating that operating RPTs significantly contributes
to the IPO cashflow performance in pre-IPO year. However, the positive relationship between
operating RPTs and cashflow performance turns out to be statistically insignificant in the
27
post-IPO period, since the estimated coefficient is 0.023 (t statistic = 0.93) in the third
regression.
In addition, the regression results show a mixed message for control variables. The estimated
coefficients for the control variables Size, Age and Government subsidy do not show a value
with a strong statistical significance (5% level) in the pre-IPO year, or the IPO year or the
post-IPO period. But, the coefficients for the variable Capital expenditure show a positive 0.573
and 0.512 respectively with a 1% significance level in the post-IPO period. It demonstrates that
there is a strong association between post-IPO operating performance and contemporaneous
capital expenditures. The estimated coefficients for the control variables ownership type,
ownership concentration and board composition do not show a significant value for the six
regressions. Due to the multicollinearity concern between control variables and explanatory
variable, it is not possible to assess the relative importance of the three control variables in
explaining the variance of the dependent variable compared to another. We further re-run the
three regressions by removing the three control variables from the models, and the same results
(not reported in here) are obtained.
Table 9 provides evidence that pre-IPO operating performance, in terms of reported earnings and
cashflow, is highly related to operating RPTs with controlling shareholders. But, this positive
relationship fades away, after the firms are listed. We argue that controlling shareholders abuse
the use of operating RPTs so as to artificially manipulate operating performance of their IPO
subsidiaries in the pre-IPO period; however, in the post-IPO period, controlling shareholders
28
discontinue those RPT-based manipulative practices. Therefore, the findings confirm Hypothesis
2a.
4.5. Operating RPTs, DAC and Stock Returns
We further perform cross-sectional regression to investigate the market response to the decline of
operating RPTs (∆RPTs) from the pre-IPO to post-IPO period. First of all, table 10 presents a
correlation matrix (Pearson’s) between explanatory variables and control variables. It shows that
the two explanatory variables (∆RPTs and DAC) are not significantly correlated (-0.020). In
other words, IPO firms engaging accruals management to boost pre-IPO reported operating
performance do not report a large percentage of operating RPTs in the pre-IPO year. This result
implies that there is no significant relation between pre-IPO accruals management and pre-IPO
RPT-based earnings management, and IPO firms do not use the two earnings management
schemes simultaneously in the pre-IPO period.
[Take in Table 10 here]
Table 10 further gives rise to a concern of multicollinearity between some control variables and
explanatory variable (∆RPTs) significant at 5% level. However, we keep the three control
variables (ownership type, ownership concentration and board composition) in the models, since
this specification provides regression coefficients that allow an easy interpretation of the
economic significance (Teoh et al., 1998a).
Then, we regress the stock performance indictors, benchmark-adjusted stock returns (BAHRs
and CARs), on ∆RPTs and pre-IPO DAC and a set of control variables. Table 11 presents the two
sets of regression results. The R2 for the two models are 21.5% and 23.2% respectively, and F
29
statistics are 2.68 and 2.96 respectively, showing that two regression models are reasonably
specified. The coefficient for ∆RPTs in BAHRs model is positive (0.185) and significant (at 5%
level), indicating that there is a positive relationship between the decline in RPTs from before to
after the IPO and long-run abnormal stock returns. The coefficient for pre-IPO DAC in BAHRs
model is negative (-0.244) and significant (at 5% level), and the result is consistent with the
finding in table 4 that IPO stocks involved with high positive DAC in the pre-IPO period are
likely to perform poorly in the long run in the stock market. Furthermore, the results of CARs
model are consistent with the results of BAHRs model. The coefficient for the decline of RPTs is
0.269 with a 1% significance level, and the coefficient for pre-IPO DAC is -0.296 with a 5%
significance level. In addition, the estimated coefficients for control variables have not shown
any statistical significance, so that no positive conclusion may be drawn from the estimated
results.
[Take in Table 11 here]
Table 11 shows that there is a relation between long-run abnormal stock performance and the
decline in operating RPTs from before to after the IPO. The larger the reduction of operating
RPTs, the worse the post-IPO stock returns in the long run. This finding shows that the
discontinuation of RPT-based earnings management in the post-IPO period may negatively affect
aftermarket stock returns in the long run. Once the RPT-based earnings management practices
are discontinued in the post-IPO period, the post-IPO operating performance could be negatively
affected and fall behind market expectation. So, as a result, those IPO stocks may perform badly
in the long run.
30

5. Conclusion
Main Findings
This study examines the effects of operating related party transactions (RPTs) between IPO firms
and their controlling shareholders on the pre- and/or post-IPO performance. We find that Chinese
IPOs significantly outperform their industry peers in terms of operating performance (ROA and
CFO) in the pre-IPO period, but the abnormal outperformance relative to the industry disappears
in the post-IPO period. We argue that the operating performance deterioration is because pre-IPO
operating performance may be artificially inflated. There are two ways for IPO firms to
manipulate reported earnings in the pre-IPO period: one is to manipulate discretionary accruals,
and the other is to abuse the use of operating RPTs with controlling shareholders to boost sales
and/or profits.
We find evidence that IPO firms report abnormally high discretionary accruals in Y (-1) year and
Y (0) year; however, from Y (+3) year onwards, it seems that IPO firms begin to slowly unwind
the accruals. The change in discretionary accruals from the pre-IPO period to the post-IPO period
would have a significant effect on long-term reported earnings performance of IPO firms. In
addition, we find that IPO firms reporting large positive discretionary accruals in the pre-IPO
period are likely to underperform their industry peers in stock market and/or underperform the
remaining IPO firms.
31
Importantly, we further argue that the operating performance of IPO firms in the pre-IPO period
may be inflated through operating RPTs. Controlling shareholders structure a large percentage of
operating RPTs with IPO firms in the pre-IPO period, which is positively associated with the
operating performance of IPO firms. In the post-IPO period, controlling shareholders discontinue
these RPT-based earnings management practices, so that the positive relation between operating
performance of IPO firms and the size of operating RPTs fades away. Furthermore, we find that
aftermarket abnormal stock performance is positively associated with the decline in operating
RPTs from before to after the IPO (at 5% significance level), and the decline in operating RPTs
is highly likely to lead the stocks to underperform their industry peers. The finding implies that
Chinese investors can not fully see through this pre-IPO RPT-based earnings management, and
may be overoptimistic about IPO’s prospective profitability, and the stocks involved with
pre-IPO RPT-based earnings management are likely to perform poorly in the aftermarket period.
Contribution and Implications
The main contribution of this research is to extend prior earnings management literature by
investigating another source of earnings management scheme, i.e. RPT-based earnings
management. It establishes a new theoretical framework to examine IPO operating performance
combining both accrual-based earnings management and RPT-based earnings management, and
further provides empirical evidence for the theoretical argument by using IPO data in China. This
research shows that investors can not fully see through both accruals management nor RPT-based
earnings management, and IPO stocks involved with pre-IPO earnings management (both
accrual-based and RPT-based) are likely to perform poorly in the aftermarket period.
32
This research has important implication for investors willing to participate in IPO markets.
Before making the investment decisions, investors may need to be cautious about the operating
RPTs disclosed on IPO prospectuses, which may be associated with RPT-based manipulative
practices. This research also calls for further development of listing regulations, particularly
those to improve information transparency and financial disclosure quality, so as to protect
public investors. Market regulators may need to do more to constrain the pre-IPO earnings
management and file more investigation cases against RPT-based manipulative practices.
Limitation and Further Research
In this research, we argue that reported earnings may be manipulated through discretionary
accruals adjustments or artificial operating RPTs with controlling shareholders. However,
technically, it is difficult to precisely separate the effect of accruals management and RPT-based
earnings management on reported earnings, because RPT-based approach may have an effect on
either discretionary accruals component, non-discretionary accruals component or cashflow
component of reported earnings. There are some overlaps between the two earnings management
techniques: for example, a firm may artificially structure sales relationship with its controlling
shareholder by accelerating credit sales without paying for the products and services in cash. In
this case, the firm engages in a RPT-based earnings management practice, which is also regarded
as an accrual-based earnings management practice as well. The inability of separating the effect
of accruals management and RPT-based earnings management on reported earnings may weaken
the effectiveness of our conclusions, and we would like to leave it for any further research.
33
References:
Aharony, J., Lee, C.W.J., and Wong, T.J., 2000, Financial Packaging of IPO Firms in China, Journal of Accounting Research 38, 103–126.
Bartov, E., 1993, The Timing of Asset Sales and Earnings Manipulations, The Accounting Review 68, 840 - 855.
Beneish, M.D., 2001, Earnings Management: A Perspective, Managerial Finance 27, 3–17.
Cai, J., and Wei. K., 1997, The investment and operating performance of Japanese IPO, Pacific-Basin Finance Journal 5, 389-417.
Chan, K., Wang J.B., and Wei, K.C., 2004, Underpricing and Long-term Performance of IPOs in China, Journal of Corporate Finance 10, 409-430.
Chen, C., and Shih, H., 2004, Initial Public Offering and Corporate Governance in China’s Transitional Economy, NBER-EAST Asia Seminar on Economics 12, University of Chicago Press, ISBN: 0-226-38679-1.
Cheung, Y., Rau, P.R., and Stouraitis, A., 2006, Tunneling, Propping and Expropriation Evidence from Connected Party Transactions in Hong Kong, Journal of Financial Economics 82, 343-386.
CMOF, 1998, Accounting System for Joint Stock Limited Companies: Accounting and Financial Statements, File: CK [1998] No.7.
Coase, R. H., 1937, The Firm, The Market and The Law, University of Chicago Press. ISBN: 0226111016.
CSRC, 2001, Standard Industrial Classification for Listed Companies, 4th April 2001.
CSRC, 2005, Opinions on Improving the Quality of Listed Firms, Chinese version may be available at: http://news.xinhuanet.com/stock/2005-11/02/content_3716989_2.htm .
Dechow, P., R. Sloan, and Sweeney, A., 1995, Detecting Earnings Management, Accounting Review 70, 193–225.
DuCharme, L., Malatesta, P., and Sefcik, S., 2001, Earnings Management: IPO Valuation and Subsequent Performance, Journal of Accounting, Auditing and Finance 16, 369–396.
Feeney, T., 2002, Bail Set For Adelphia Execs, July 24 2002, may be available on CBS News online: http://www.cbsnews.com/stories/2002/09/23/national/main522992.shtml
Gompers, P., and Lerner, J., 2003, The Really Long-run Performance of Initial Public Offerings: the Pre-Nasdaq Evidence, Journal of Finance 58, 1355–1392.
Gordon, E., Henry, E., and Palia, D., 2004, Related Party Transactions: Associations with Corporate Governance and Firm Value, may be available at: http://ssrn.com/author=382711 .
Healy, P.M., and Wahlen, J.M., 1999, A Review of The Earnings Management Literature and Its Implication for Standard Setting, Accounting Horizons 13, 365–383.
34
HKEx, 2004, Institutional Investors in Mainland China, English version may be available at: http://www.hkex.com.hk/research/r-papers/IIMC.pdf ).
International Accounting Standards (IAS 24), Related Party Disclosures, may be available at Deloitte IAS Plus: http://www.iasplus.com/standard/standard.htm
Jaggi, B., Chin, C., Lin, H., and Lee, P., 2006, Earnings Forecasts Disclosure Regulation and Earnings Management by Taiwan IPO Firms, Review of Quantitative Finance & Accounting 26, 275–299.
Jian, M., and Wong, T.J., 2004, Earnings Management and Tunneling through Related Party Transactions: Evidence from Chinese Corporate Groups, Hong Kong University of Science and Technology working paper.
Jones, J.J., 1991, Earnings Management During Important Relief Investigation, Journal of Accounting Research 29, 193–228.
Lee, G., and Masulis, R. W., 2006, Do Underwriters Or Venture Capitalists Restrain Earnings Management By IPO Issuers?, may be available at SSRN: http://ssrn.com/abstract=891757
Leuz, C., Nanda, D., and Wysocki, P., 2003, Earnings Management and Investor Protection: an International Comparison, Journal of Financial Economics 69, 505-527.
Levis, M., 1993, The Long-run Performance of Initial Public Offerings: The UK Experience 1980-1988, Financial Management 22, 28-41.
Li, J., Zhang, L., and Zhou, J., 2006, Earnings Management and Delisting Risk of Initial Public Offerings, may be available at SSRN: http://ssrn.com/abstract=641021
Liu, Q., and Lu, Z., 2004, Earnings Management to Tunnel: Evidence from Chinese Listed Firms, University of Hong Kong working paper.
Ljungqvist, A., 1997, Pricing Initial Public Offerings: Further Evidence from Germany, European Economic Review 41, 1309-1320.
Loughran, T., and Ritter, J. R., 1995, The New Issues Puzzles, Journal of Finance 50, 23–51.
McCahery J.A., Vermeulen, E.P., 2005, Corporate Governance Crises and Related Party Transactions: A Post-Parmalat Agenda, Amsterdam Centre for Corporate Finance Working Paper.
McKay, B., 2002, Coca-Cola: Real Thing Can be Hard to Measure, Wall Street Journal, 23rd Jan. 2002.
Mikkelson, W. H., Partch, M. M., and Shah, K., 1997, Ownership and Operating Performance of Companies That Go Public, Journal of Financial Economics 44, 281–307.
Ritter, J. R., 1991, The Long-run Performance of Initial Public Offerings, Journal of Finance 46, 3–27.
Roosenboom, P., Goot, T., and Gerard, M., 2003, Earnings Management and Initial Public Offerings: Evidence From the Netherlands, International Journal of Accounting 38, 243–266.
35
Teoh, S. H., Welch, I., and Wong, T. J., 1998a, Earnings Management and the Long-run Market Performance of Initial Public Offerings, Journal of Finance 53, 1935–1974.
Teoh, S. H., Welch, I., and Wong, T. J., 1998b, Earnings Management and the Post-Issue Underperformance In Seasoned Equity Offerings, Journal of Financial Economics 50, 63–99.
Thomas, W., Herrmann, D., and Inoue, T., 2004, Earnings Management through Affiliated Transactions, Journal of International Accounting Research 3 (2), 1–25.
Wang, C., 2005, Ownership and Operating Performance of Chinese IPOs, Journal of Banking & Finance 29, 1835–1856.
Wang, X., Xu, L. C., and Zhu, T., 2001, Is Public Listing a Way Out for State-Owned Enterprises? The Case of China, City University of Hong Kong working paper.
Yoon, S.S., and Miller, G., 2002, Earnings Management of Seasoned Equity Offering Firms in Korea, International Journal of Accounting 37, 57–78.
Zhou, J., and Elder, R. J., 2004, Audit Quality and Earnings Management by Seasoned Equity Offering Firms, Asia-Pacific Journal of Accounting and Economics 11, 95–120.
36
Table 1: Data Description Panel A: Sample vs Population by industry
SIC (2001) Sample Whole Market4
A Agriculture, forestry, & fishing 10 30 B Mining 5 20 C Manufacturing 153 742 - C0 Foods and beverages (14) (58) - C1 Textiles, suits and leathers (16) (56) - C2 Wood products and furniture (1) (2) - C3 Papers, stationery, sporting, musical instruments (4) (24) - C4 Petroleum refining, chemicals, and allied products (27) (136) - C5 Electronic, electric components and home appliances (5) (39) - C6 Mineral products and metal products (27) (117) - C7 Equipments and machineries (35) (194) - C8 Drugs and Biologic products (24) (82) D Water, electricity, and gas 9 52 E Construction 4 25 F Transport & public utilities 13 55 G Information technology 12 79 H Wholesale and retail trade 10 96 I Finance and insurance 2 10 J Real estate 1 45 K Service 12 41 L Publishing, media, and allied services 1 11 M Miscellaneous products and services 7 81
TOTAL 239 1287 Source: Standard Industry Classification of China (2001) promulgated by the CSRC Panel B: Sample Statistics vs Population Statistics (unit: RMB billion)
Mean Median Min Max
Sample 1.44 0.70 0.03 15.63 Sales
Market 1.90 0.62 0.00 417.19
Sample 5.19 1.50 0.43 279.30 Total assets
Market 4.94 1.34 0.02 503.89
Sample 0.21 0.09 -0.22 1.95 EBITDA
Market 0.27 0.08 -1.07 63.01
Sample 7.27% 6.84% -13% 30% Return on Assets (%) Market 8.52% 7.12% -68% 205%
Sample 6.89% 5.47% -15% 88% Cashflow from operations (%) Market 5.37% 4.84% -90% 268%
Note: Return on assets: EBITDA scaled by lagged (-1) total assets Cashflow from operations: net cash inflow from operations scaled by lagged (-1) total assets 4 Ending at year 2003
37
Table 2: Industry-adjusted Operating Performance around the IPO Panel A: ROA
Y (-1) Year IPO Year Y (+1) Year Y (+2) Year Y (+3) Year Y (+4) Year
Mean (t-statistic)
12.71%*** (10.39)
7.06%*** (4.76)
0.09% (0.11)
0.10% (0.13)
-0.44% (-0.72)
-0.65% (-0.91)
Median (z-statistic)
10.18%*** (8.43)
3.40%*** (6.20)
-0.79% (0.87)
-0.07% (0.45)
-0.82% (1.07)
-1.08% (1.43)
Maximum 80.40% 119.00% 43.02% 20.74% 17.26% 21.91%
Minimum -8.30% -9.10% -18.01% -24.95% -18.73% -20.82%
Standard Deviation 0.121 0.146 0.076 0.071 0.060 0.070
* ** *** Denote significance (2-tailed) at 0.10, 0.05 and 0.01 level, respectively Note: ROA (Return of Assets): EBITDA divided by the lagged (-1) total assets less the median contemporaneous
ROA figures of the same 2-digit publicly traded firms
Panel B: CFO
Y (-1) Year IPO Year Y (+1) Year Y (+2) Year Y (+3) Year Y (+4) Year
Mean (t-statistic)
6.74%*** (2.79)
-0.41% (-0.17)
1.72% (1.45)
2.55%** (2.08)
-0.28% (-0.35)
-0.70% (-0.78)
Median (z-statistic)
2.54%*** (3.81)
-2.26% (1.37)
1.09%* (1.70)
1.12%* (1.70)
0.13% (0.03)
-0.91% (0.53)
Maximum 179.36% 176.52% 59.23% 83.99% 24.13% 22.10%
Minimum -29.26% -42.59% -45.60% -19.33% -24.73% -28.25%
Standard Deviation 0.23 0.23 0.12 0.14 0.07 0.08
* ** *** Denote significance (2-tailed) at 0.10, 0.05 and 0.01 level, respectively Note: CFO (Cash flow from operations): net cash flows from operations divided by the lagged (-1) total assets less
the median contemporaneous CFO figures of the same 2-digit publicly traded firms
38
Table 3: Industry-adjusted asset-scaled discretionary accruals (DAC)
Y (-1) Year IPO Year Y (+1) Year Y (+2) Year Y (+3) Year Y (+4) Year
Mean (t-statistic)
0.079*** (5.03)
0.102*** (7.76)
0.016* (1.76)
-0.007 (-0.84)
-0.013 (-1.53)
-0.008 (-1.04)
Median (z-statistic)
0.075*** (5.96)
0.090*** (6.60)
0.020 (1.61)
0.000 (0.13)
-0.015* (2.09)
-0.010* (1.79)
Maximum 0.660 0.520 0.460 0.190 0.260 0.280
Minimum -0.530 -0.190 -0.230 -0.250 -0.270 -0.320
Standard Deviation 0.155 0.130 0.093 0.083 0.085 0.096
* ** *** Denote significance (2-tailed) at 0.10, 0.05 and 0.01 level, respectively Note: DAC: Assets-scaled discretionary accruals, which is computed by using the modified Jones (1991) model, less
the median contemporaneous figure of the same 2-digit publicly traded firms
39
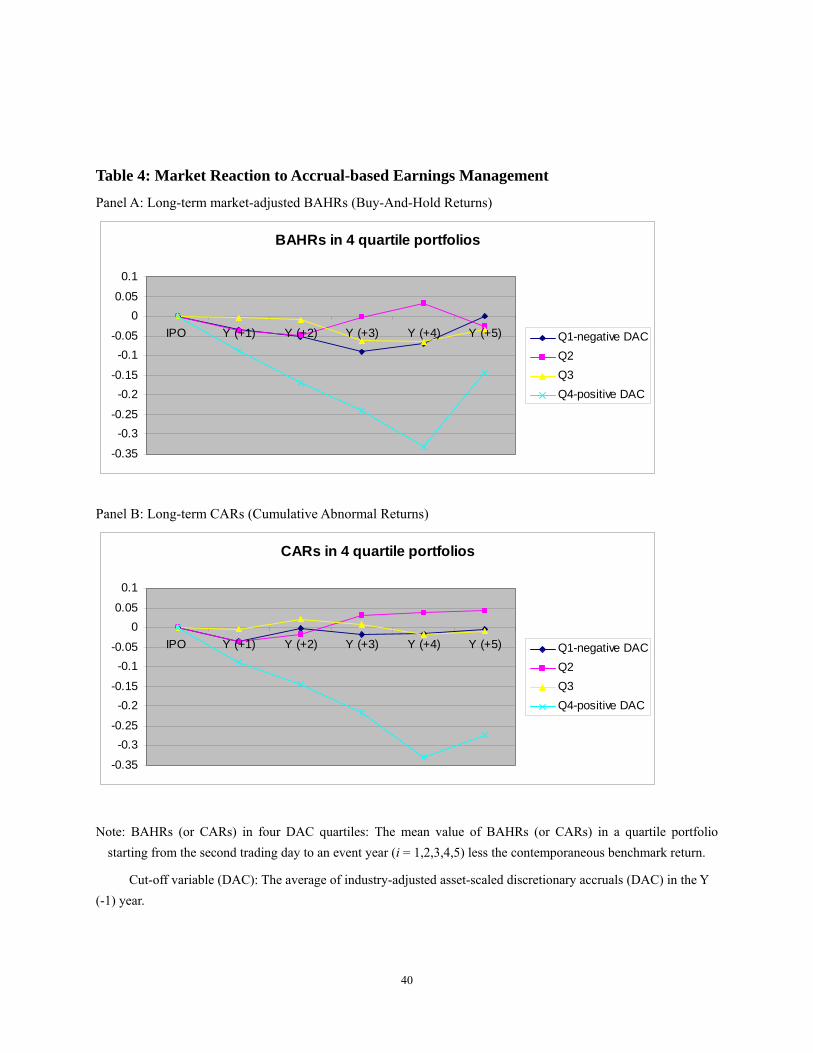
Table 4: Market Reaction to Accrual-based Earnings Management
Panel A: Long-term market-adjusted BAHRs (Buy-And-Hold Returns)
BAHRs in 4 quartile portfolios
-0.35
-0.3-0.25
-0.2-0.15
-0.1-0.05
00.05
0.1
IPO Y (+1) Y (+2) Y (+3) Y (+4) Y (+5) Q1-negative DACQ2Q3Q4-positive DAC
Panel B: Long-term CARs (Cumulative Abnormal Returns)
CARs in 4 quartile portfolios
-0.35
-0.3-0.25
-0.2-0.15
-0.1-0.05
00.05
0.1
IPO Y (+1) Y (+2) Y (+3) Y (+4) Y (+5) Q1-negative DACQ2Q3Q4-positive DAC
Note: BAHRs (or CARs) in four DAC quartiles: The mean value of BAHRs (or CARs) in a quartile portfolio starting from the second trading day to an event year (i = 1,2,3,4,5) less the contemporaneous benchmark return.
Cut-off variable (DAC): The average of industry-adjusted asset-scaled discretionary accruals (DAC) in the Y (-1) year.
40
Table 5: Operating Related Party Transactions before and after the IPO
Panel A: Mean Values
Y (-1) Year IPO Year Y (+1) Year Y (+2) Year Y (+3) Year Y (+4) Year
Trade relationship (t-statistic)
19.49%*** (5.21)
21.48%*** (5.54)
13.86%*** (5.58)
15.27%*** (5.58)
12.78%*** (5.35)
14.94%*** (4.46)
Non monetary asset (t-statistic)
0.70% (1.50)
2.01%** (2.25)
1.54%*** (3.73)
1.76%*** (2.84)
0.82%*** (3.33)
2.10%*** (3.21)
Administrative service (t-statistic)
0.65%*** (4.39)
0.46%*** (5.00)
0.27%*** (5.46)
0.50%*** (3.51)
0.33%*** (2.82)
0.38%*** (3.00)
Royalty (t-statistic)
0.02% (1.00)
0.02% (1.00)
0.00% (1.00)
0.00% (1.00)
0.06% (1.00)
0.02% (1.00)
Lease (t-statistic)
0.00% (1.00)
0.00% (1.00)
0.01% (1.48)
0.01%** (2.38)
0.00%** (2.30)
0.00%** (1.92)
Total 20.87%*** (5.29)
24.27%*** (5.81)
15.60%*** (6.28)
17.51%*** (6.13)
13.98%*** (5.70)
17.46%*** (5.05)
* ** *** Denote significance (2-tailed) at 0.10, 0.05 and 0.01 level, respectively
Panel B: Median Values
Y (-1) Year IPO Year Y (+1) Year Y (+2) Year Y (+3) Year Y (+4) Year
Trade relationship (z-statistic)
2.85%*** (6.84)
6.05%*** (7.37)
4.05%*** (7.62)
3.45%*** (7.67)
2.75%*** (7.42)
2.57%*** (7.43)
Non monetary asset (z-statistic)
0.00%* (1.88)
0.00%*** (2.88)
0.00%*** (4.44)
0.00%*** (3.90)
0.00%*** (3.70)
0.00%*** (4.92)
Administrative service(z-statistic)
0.10%*** (6.15)
0.10%*** (6.21)
0.05%*** (6.03)
0.10%*** (6.22)
0.03%*** (5.85)
0.02%*** (5.85)
Royalty (z-statistic)
0.00% (0.89)
0.00% (0.89)
0.00% (0.00)
0.00% (0.00)
0.00% (0.89)
0.00% (0.89)
Lease (z-statistic)
0.00% (0.00)
0.00% (0.00)
0.00% (1.33)
0.00%** (2.30)
0.00%** (2.29)
0.00%** (2.10)
Total 4.35%*** (7.76)
6.90%*** (7.91)
6.40%*** (8.00)
5.65%*** (8.19)
4.90%*** (7.95)
4.90%*** (8.00)
* ** *** Denote significance (2-tailed) at 0.10, 0.05 and 0.01 level, respectively Variables definition
Trade relationship The sales and/or purchases of goods, products, and services between controlling shareholders and their listed subsidiaries
Non monetary asset The sales and/or acquisitions of non-monetary assets between controlling shareholders and their listed subsidiaries, such as tangible and intangible assets
Administrative service Expenses paid from controlling shareholders (or listed subsidiaries) to listed subsidiaries (or controlling shareholders) for obtaining administrative services and the use of private resources
Royalty The annual expenses paid for the use of patents, permits and Franchises between controlling shareholders and listed subsidiaries
41
Lease The annual expenses paid for operating and financial leases between controlling shareholders and listed subsidiaries
Note: Related party transactions: the actual amounts scaled by the lagged (-1) total assets
Table 6: Operating RPTs Quartiles Segregated by pre-IPO Operating RPTs
Quartiles Tests Y (-1) Year IPO Year Y (+1) Year Y (+2) Year Y (+3) Year Y (+4) Year
Mean (t-statistic)
0.08% (1.01)
5.04%** (2.17)
6.00%* (1.97)
3.01%*** (3.67)
3.89%** (2.05)
2.61%*** (3.25)
Q1 (smaller pre-IPO RPTs)
Median (z-statistic)
0.00% (0.89)
0.14%*** (2.76)
0.95%*** (3.27)
0.95%*** (3.24)
0.15%*** (3.03)
0.73%*** (3.28)
Mean (t-statistic)
1.64%*** (8.38)
7.77%** (2.37)
5.49%*** (3.09)
10.20%** (2.24)
10.18%** (2.42)
17.17%* (1.93) Q2 Median
(z-statistic) 1.42%***
(4.15) 1.03%***
(3.74) 1.49%***
(3.71) 1.57%***
(3.81) 1.43%***
(3.82) 2.29%***
(3.80) Mean
(t-statistic) 9.40%***
(8.54) 10.99%***
(6.98) 12.70%***
(5.93) 17.91%***
(4.41) 10.80%***
(4.62) 15.68%***
(4.07) Q3 Median (z-statistic)
8.17%*** (4.36)
9.27%*** (4.18)
8.87%*** (4.27)
6.65%*** (4.36)
6.63%*** (4.36)
7.49%*** (4.38)
Mean (t-statistic)
76.84%*** (7.60)
77.53%*** (6.64)
40.16%*** (5.26)
40.78%*** (4.84)
32.55%*** (4.22)
35.85%*** (3.87)
Q4 (larger
pre-IPO RPTs)
Median (z-statistic)
63.94%*** (4.18)
64.86%*** (4.18)
29.12%*** (4.09)
19.95%*** (4.18)
16.42%*** (3.99)
11.72%*** (3.90)
* ** *** Denote significance (2-tailed) at 0.10, 0.05 and 0.01 level, respectively
Note: Grouping variable (pre-IPO operating RPTs): The aggregate amount of operating related party transactions (which cover the sales and/or purchases of goods, products, services non-monetary assets and royalties and leases etc) in the Y (-1) year scaled by the lagged (-1) total assets
42
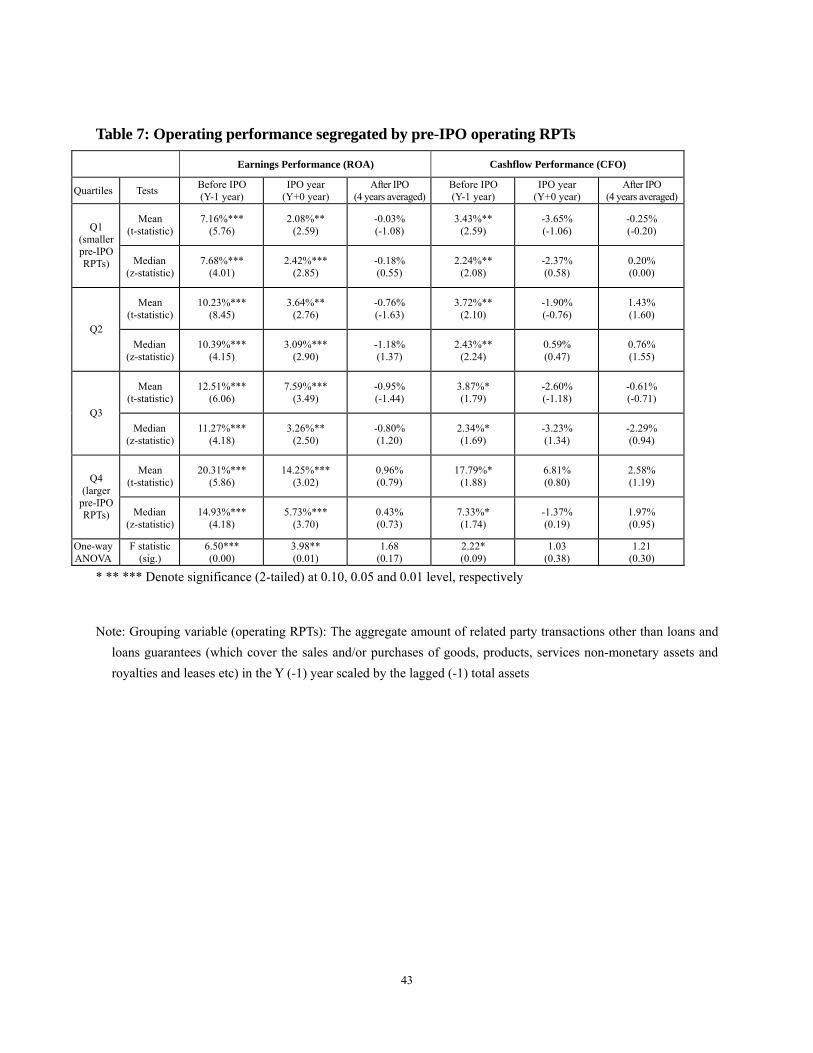
Table 7: Operating performance segregated by pre-IPO operating RPTs
Earnings Performance (ROA) Cashflow Performance (CFO)
Quartiles Tests Before IPO (Y-1 year)
IPO year (Y+0 year)
After IPO (4 years averaged)
Before IPO (Y-1 year)
IPO year (Y+0 year)
After IPO (4 years averaged)
Mean (t-statistic)
7.16%*** (5.76)
2.08%** (2.59)
-0.03% (-1.08)
3.43%** (2.59)
-3.65% (-1.06)
-0.25% (-0.20) Q1
(smaller pre-IPO RPTs) Median
(z-statistic) 7.68%***
(4.01) 2.42%***
(2.85) -0.18% (0.55)
2.24%** (2.08)
-2.37% (0.58)
0.20% (0.00)
Mean (t-statistic)
10.23%*** (8.45)
3.64%** (2.76)
-0.76% (-1.63)
3.72%** (2.10)
-1.90% (-0.76)
1.43% (1.60)
Q2 Median
(z-statistic) 10.39%***
(4.15) 3.09%***
(2.90) -1.18% (1.37)
2.43%** (2.24)
0.59% (0.47)
0.76% (1.55)
Mean (t-statistic)
12.51%*** (6.06)
7.59%*** (3.49)
-0.95% (-1.44)
3.87%* (1.79)
-2.60% (-1.18)
-0.61% (-0.71)
Q3 Median
(z-statistic) 11.27%***
(4.18) 3.26%**
(2.50) -0.80% (1.20)
2.34%* (1.69)
-3.23% (1.34)
-2.29% (0.94)
Mean (t-statistic)
20.31%*** (5.86)
14.25%*** (3.02)
0.96% (0.79)
17.79%* (1.88)
6.81% (0.80)
2.58% (1.19) Q4
(larger pre-IPO RPTs) Median
(z-statistic) 14.93%***
(4.18) 5.73%***
(3.70) 0.43% (0.73)
7.33%* (1.74)
-1.37% (0.19)
1.97% (0.95)
One-way ANOVA
F statistic (sig.)
6.50*** (0.00)
3.98** (0.01)
1.68 (0.17)
2.22* (0.09)
1.03 (0.38)
1.21 (0.30)
* ** *** Denote significance (2-tailed) at 0.10, 0.05 and 0.01 level, respectively
Note: Grouping variable (operating RPTs): The aggregate amount of related party transactions other than loans and loans guarantees (which cover the sales and/or purchases of goods, products, services non-monetary assets and royalties and leases etc) in the Y (-1) year scaled by the lagged (-1) total assets
43
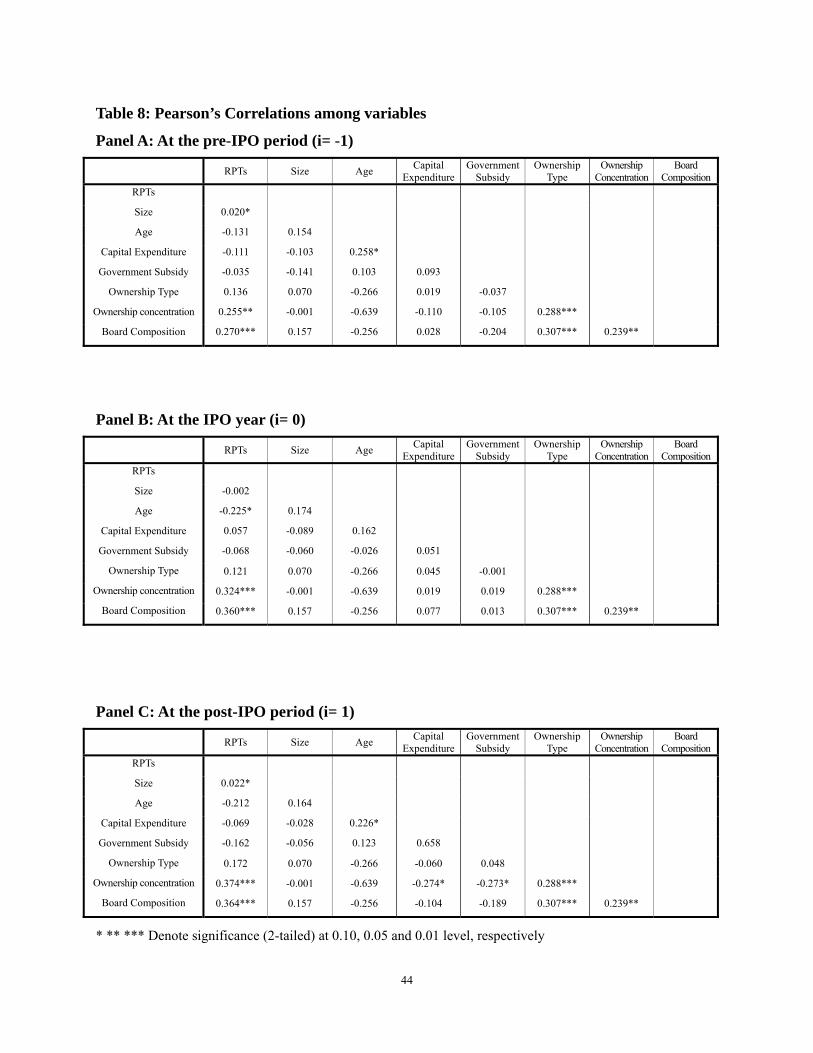
Table 8: Pearson’s Correlations among variables
Panel A: At the pre-IPO period (i= -1)
RPTs Size Age Capital Expenditure
Government Subsidy
Ownership Type
Ownership Concentration
Board Composition
RPTs
Size 0.020*
Age -0.131 0.154
Capital Expenditure -0.111 -0.103 0.258*
Government Subsidy -0.035 -0.141 0.103 0.093
Ownership Type 0.136 0.070 -0.266 0.019 -0.037
Ownership concentration 0.255** -0.001 -0.639 -0.110 -0.105 0.288***
Board Composition 0.270*** 0.157 -0.256 0.028 -0.204 0.307*** 0.239**
Panel B: At the IPO year (i= 0)
RPTs Size Age Capital Expenditure
Government Subsidy
Ownership Type
Ownership Concentration
Board Composition
RPTs
Size -0.002
Age -0.225* 0.174
Capital Expenditure 0.057 -0.089 0.162
Government Subsidy -0.068 -0.060 -0.026 0.051
Ownership Type 0.121 0.070 -0.266 0.045 -0.001
Ownership concentration 0.324*** -0.001 -0.639 0.019 0.019 0.288***
Board Composition 0.360*** 0.157 -0.256 0.077 0.013 0.307*** 0.239**
Panel C: At the post-IPO period (i= 1)
RPTs Size Age Capital Expenditure
Government Subsidy
Ownership Type
Ownership Concentration
Board Composition
RPTs
Size 0.022*
Age -0.212 0.164
Capital Expenditure -0.069 -0.028 0.226*
Government Subsidy -0.162 -0.056 0.123 0.658
Ownership Type 0.172 0.070 -0.266 -0.060 0.048
Ownership concentration 0.374*** -0.001 -0.639 -0.274* -0.273* 0.288***
Board Composition 0.364*** 0.157 -0.256 -0.104 -0.189 0.307*** 0.239**
* ** *** Denote significance (2-tailed) at 0.10, 0.05 and 0.01 level, respectively
44
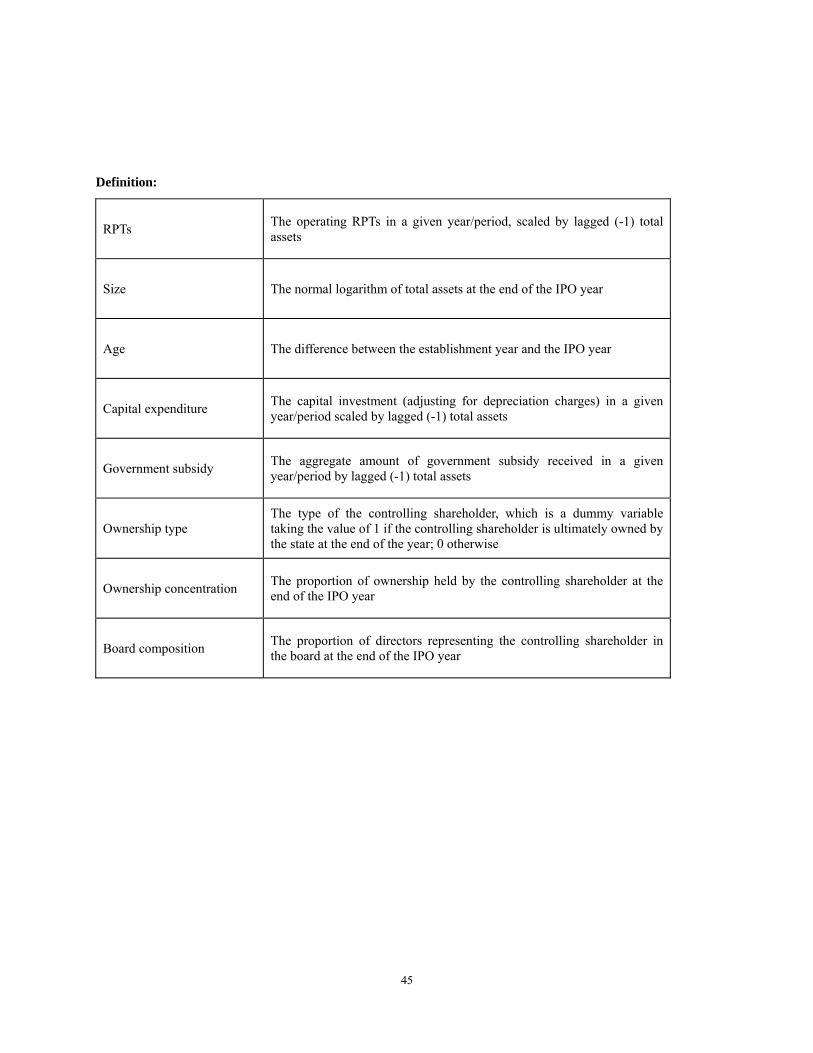
Definition:
RPTs The operating RPTs in a given year/period, scaled by lagged (-1) total assets
Size The normal logarithm of total assets at the end of the IPO year
Age The difference between the establishment year and the IPO year
Capital expenditure The capital investment (adjusting for depreciation charges) in a given year/period scaled by lagged (-1) total assets
Government subsidy The aggregate amount of government subsidy received in a given year/period by lagged (-1) total assets
Ownership type The type of the controlling shareholder, which is a dummy variable taking the value of 1 if the controlling shareholder is ultimately owned by the state at the end of the year; 0 otherwise
Ownership concentration The proportion of ownership held by the controlling shareholder at the end of the IPO year
Board composition The proportion of directors representing the controlling shareholder in the board at the end of the IPO year
45
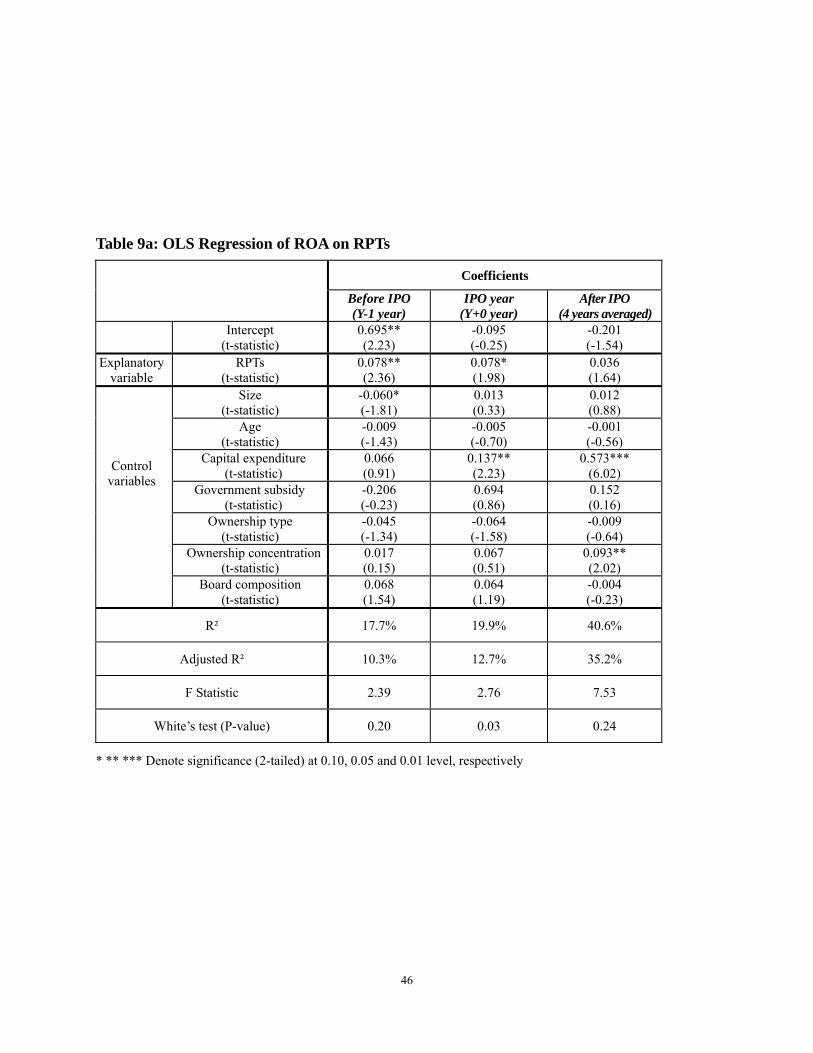
Table 9a: OLS Regression of ROA on RPTs
Coefficients
Before IPO (Y-1 year)
IPO year (Y+0 year)
After IPO (4 years averaged)
Intercept (t-statistic)
0.695** (2.23)
-0.095 (-0.25)
-0.201 (-1.54)
Explanatory variable
RPTs (t-statistic)
0.078** (2.36)
0.078* (1.98)
0.036 (1.64)
Size (t-statistic)
-0.060* (-1.81)
0.013 (0.33)
0.012 (0.88)
Age (t-statistic)
-0.009 (-1.43)
-0.005 (-0.70)
-0.001 (-0.56)
Capital expenditure (t-statistic)
0.066 (0.91)
0.137** (2.23)
0.573*** (6.02)
Government subsidy (t-statistic)
-0.206 (-0.23)
0.694 (0.86)
0.152 (0.16)
Ownership type (t-statistic)
-0.045 (-1.34)
-0.064 (-1.58)
-0.009 (-0.64)
Ownership concentration (t-statistic)
0.017 (0.15)
0.067 (0.51)
0.093** (2.02)
Control variables
Board composition (t-statistic)
0.068 (1.54)
0.064 (1.19)
-0.004 (-0.23)
R² 17.7% 19.9% 40.6%
Adjusted R² 10.3% 12.7% 35.2%
F Statistic 2.39 2.76 7.53
White’s test (P-value) 0.20 0.03 0.24
* ** *** Denote significance (2-tailed) at 0.10, 0.05 and 0.01 level, respectively
46
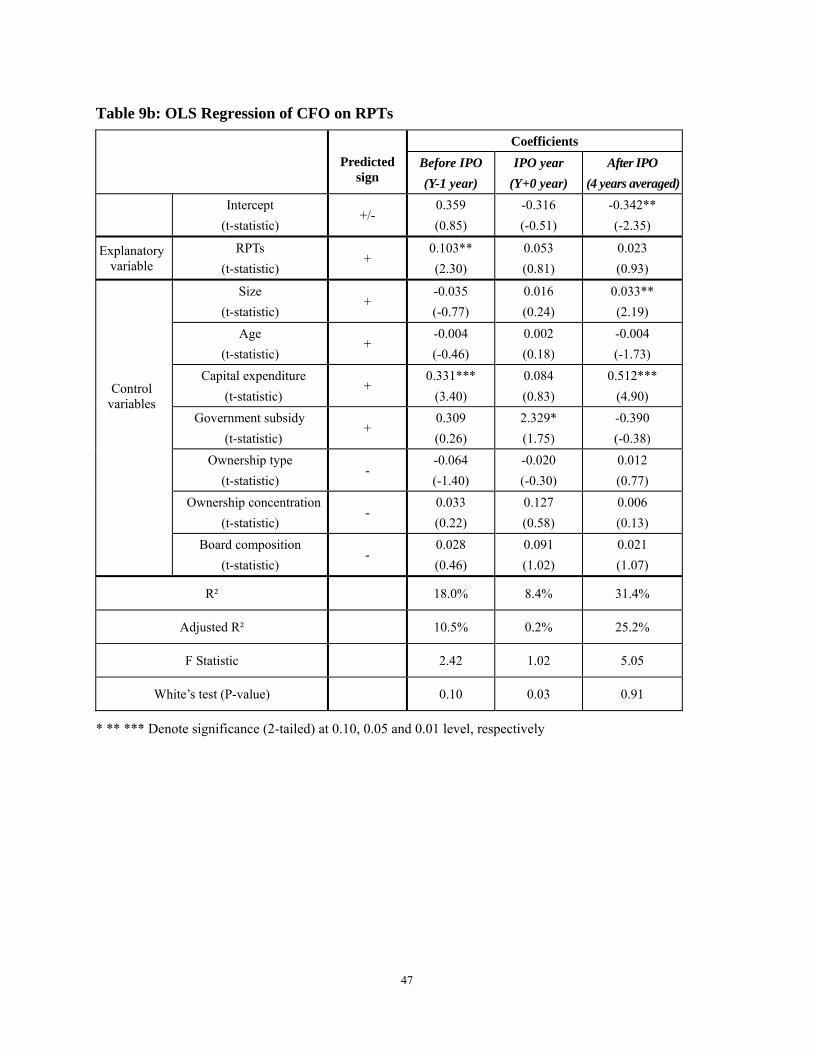
Table 9b: OLS Regression of CFO on RPTs
Coefficients Predicted
sign Before IPO (Y-1 year)
IPO year (Y+0 year)
After IPO (4 years averaged)
Intercept (t-statistic)
+/- 0.359 (0.85)
-0.316 (-0.51)
-0.342** (-2.35)
Explanatory variable
RPTs (t-statistic)
+ 0.103** (2.30)
0.053 (0.81)
0.023 (0.93)
Size (t-statistic)
+ -0.035 (-0.77)
0.016 (0.24)
0.033** (2.19)
Age (t-statistic)
+ -0.004 (-0.46)
0.002 (0.18)
-0.004 (-1.73)
Capital expenditure (t-statistic)
+ 0.331***
(3.40) 0.084 (0.83)
0.512*** (4.90)
Government subsidy (t-statistic)
+ 0.309 (0.26)
2.329* (1.75)
-0.390 (-0.38)
Ownership type (t-statistic)
- -0.064 (-1.40)
-0.020 (-0.30)
0.012 (0.77)
Ownership concentration (t-statistic)
- 0.033 (0.22)
0.127 (0.58)
0.006 (0.13)
Control variables
Board composition (t-statistic)
- 0.028 (0.46)
0.091 (1.02)
0.021 (1.07)
R² 18.0% 8.4% 31.4%
Adjusted R² 10.5% 0.2% 25.2%
F Statistic 2.42 1.02 5.05
White’s test (P-value) 0.10 0.03 0.91
* ** *** Denote significance (2-tailed) at 0.10, 0.05 and 0.01 level, respectively
47
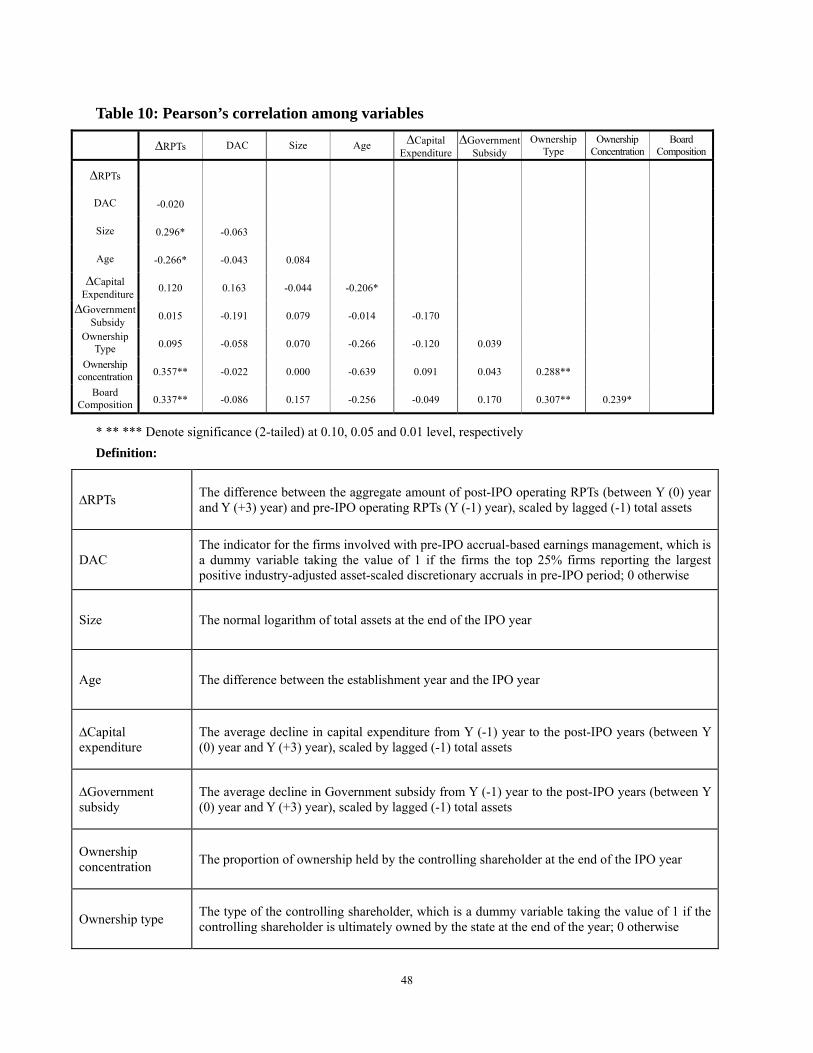
Table 10: Pearson’s correlation among variables
∆RPTs DAC Size Age ∆Capital Expenditure
∆Government Subsidy
Ownership Type
Ownership Concentration
Board Composition
∆RPTs
DAC -0.020
Size 0.296* -0.063
Age -0.266* -0.043 0.084
∆Capital Expenditure 0.120 0.163 -0.044 -0.206*
∆Government Subsidy 0.015 -0.191 0.079 -0.014 -0.170
Ownership Type 0.095 -0.058 0.070 -0.266 -0.120 0.039
Ownership concentration 0.357** -0.022 0.000 -0.639 0.091 0.043 0.288**
Board Composition 0.337** -0.086 0.157 -0.256 -0.049 0.170 0.307** 0.239*
* ** *** Denote significance (2-tailed) at 0.10, 0.05 and 0.01 level, respectively Definition:
∆RPTs The difference between the aggregate amount of post-IPO operating RPTs (between Y (0) year and Y (+3) year) and pre-IPO operating RPTs (Y (-1) year), scaled by lagged (-1) total assets
DAC The indicator for the firms involved with pre-IPO accrual-based earnings management, which is a dummy variable taking the value of 1 if the firms the top 25% firms reporting the largest positive industry-adjusted asset-scaled discretionary accruals in pre-IPO period; 0 otherwise
Size The normal logarithm of total assets at the end of the IPO year
Age The difference between the establishment year and the IPO year
∆Capital expenditure
The average decline in capital expenditure from Y (-1) year to the post-IPO years (between Y (0) year and Y (+3) year), scaled by lagged (-1) total assets
∆Government subsidy
The average decline in Government subsidy from Y (-1) year to the post-IPO years (between Y (0) year and Y (+3) year), scaled by lagged (-1) total assets
Ownership concentration The proportion of ownership held by the controlling shareholder at the end of the IPO year
Ownership type The type of the controlling shareholder, which is a dummy variable taking the value of 1 if the controlling shareholder is ultimately owned by the state at the end of the year; 0 otherwise
48
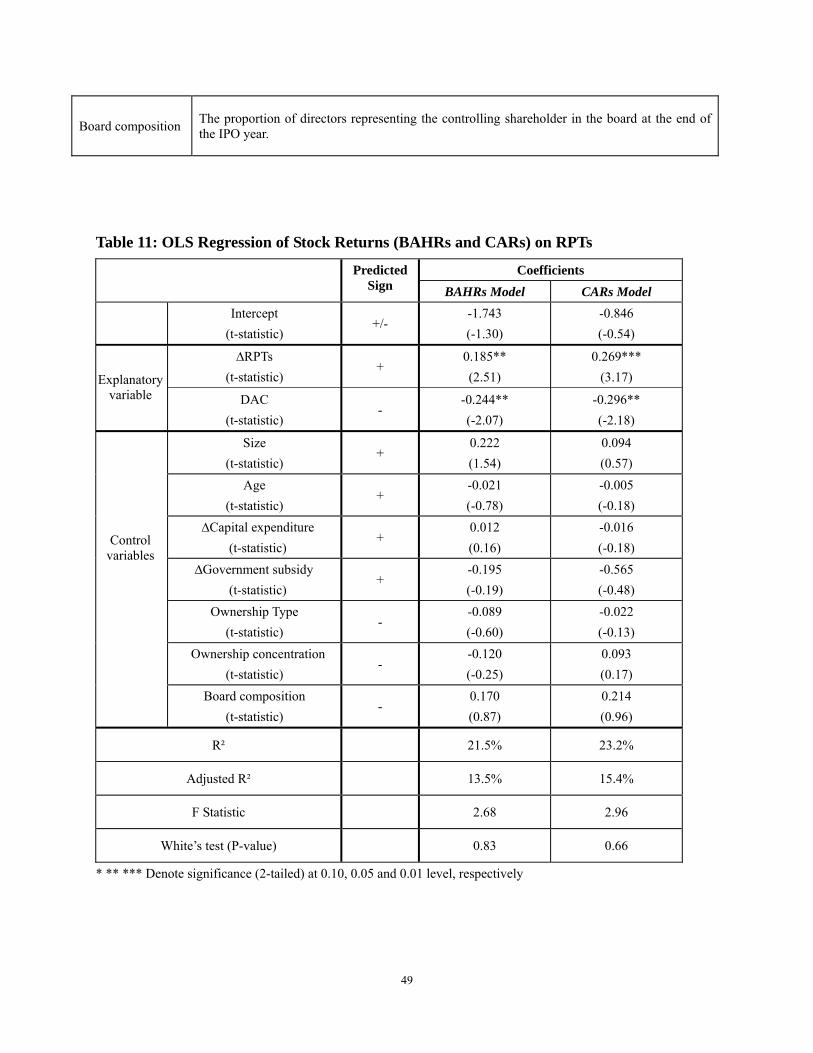
Board composition The proportion of directors representing the controlling shareholder in the board at the end of the IPO year.
Table 11: OLS Regression of Stock Returns (BAHRs and CARs) on RPTs
Coefficients Predicted Sign BAHRs Model CARs Model
Intercept (t-statistic)
+/- -1.743 (-1.30)
-0.846 (-0.54)
∆RPTs (t-statistic)
+ 0.185** (2.51)
0.269*** (3.17) Explanatory
variable DAC (t-statistic)
- -0.244** (-2.07)
-0.296** (-2.18)
Size (t-statistic)
+ 0.222 (1.54)
0.094 (0.57)
Age (t-statistic)
+ -0.021 (-0.78)
-0.005 (-0.18)
∆Capital expenditure (t-statistic)
+ 0.012 (0.16)
-0.016 (-0.18)
∆Government subsidy (t-statistic)
+ -0.195 (-0.19)
-0.565 (-0.48)
Ownership Type (t-statistic)
- -0.089 (-0.60)
-0.022 (-0.13)
Ownership concentration (t-statistic)
- -0.120 (-0.25)
0.093 (0.17)
Control variables
Board composition (t-statistic)
- 0.170 (0.87)
0.214 (0.96)
R² 21.5% 23.2%
Adjusted R² 13.5% 15.4%
F Statistic 2.68 2.96
White’s test (P-value) 0.83 0.66
* ** *** Denote significance (2-tailed) at 0.10, 0.05 and 0.01 level, respectively
49


![Related Party Transactions [Luputi]](https://img.pdfslide.us/doc/110x75/61afa9d10717f755d17168e3/related-party-transactions-luputi.jpg)