Embed Size (px)
Citation preview
Technical Report NREL/TP-540-42681 March 2009
Fuel Savings from Hybrid Electric Vehicles K. Bennion and M. Thornton
National Renewable Energy Laboratory 1617 Cole Boulevard, Golden, Colorado 80401-3393 303-275-3000 • www.nrel.gov
NREL is a national laboratory of the U.S. Department of Energy Office of Energy Efficiency and Renewable Energy Operated by the Alliance for Sustainable Energy, LLC
Contract No. DE-AC36-08-GO28308
Technical Report NREL/TP-540-42681 March 2009
Fuel Savings from Hybrid Electric Vehicles K. Bennion and M. Thornton
Prepared under Task No. FC08.2000
NOTICE
This report was prepared as an account of work sponsored by an agency of the United States government. Neither the United States government nor any agency thereof, nor any of their employees, makes any warranty, express or implied, or assumes any legal liability or responsibility for the accuracy, completeness, or usefulness of any information, apparatus, product, or process disclosed, or represents that its use would not infringe privately owned rights. Reference herein to any specific commercial product, process, or service by trade name, trademark, manufacturer, or otherwise does not necessarily constitute or imply its endorsement, recommendation, or favoring by the United States government or any agency thereof. The views and opinions of authors expressed herein do not necessarily state or reflect those of the United States government or any agency thereof.
Available electronically at http://www.osti.gov/bridge
Available for a processing fee to U.S. Department of Energy and its contractors, in paper, from:
U.S. Department of Energy Office of Scientific and Technical Information P.O. Box 62 Oak Ridge, TN 37831-0062 phone: 865.576.8401 fax: 865.576.5728 email: mailto:[email protected]
Available for sale to the public, in paper, from: U.S. Department of Commerce National Technical Information Service 5285 Port Royal Road Springfield, VA 22161 phone: 800.553.6847 fax: 703.605.6900 email: [email protected] online ordering: http://www.ntis.gov/ordering.htm
Printed on paper containing at least 50% wastepaper, including 20% postconsumer waste

iii
Acknowledgments
The authors would like to acknowledge the programmatic support of the Vehicle Technologies Program in the U.S. Department of Energy’s Office of Energy Efficiency and Renewable Energy.
iv
Executive Summary
Along with the rapid rise of gasoline prices since 2002 has come a renewed interest in energy costs and energy security. Of particular concern is the impact on the transportation sector and light-duty vehicles (LDVs). The dependence of LDVs on petroleum contributes to personal and national economic concerns, and the nation’s dependence on oil imports impacts our trade imbalance and energy security. For these reasons, it is essential to reduce petroleum use in LDVs.
Hybrid electric vehicles (HEVs) have the potential to reduce both petroleum usage and greenhouse gas emissions in the United States. For this reason, many individuals, corporations, and government groups have shown considerable interest in these vehicles since they were first introduced into the U.S. market in 1999. Quantifying their fuel-savings benefit places the impacts of HEVs in a context that allows them to be compared with other technologies proposed for reducing our reliance on oil imports in the transportation sector.
This type of analysis also provides a framework for comparing the benefits of alternative technologies in terms of incentives. Although a few earlier studies have included an evaluation of fuel savings from HEVs, the analysis described in this report provides the cumulative historical benefit of these vehicles in terms of their fuel savings.
The analysis described here is based on estimated fuel savings from new HEV sales, annual vehicle stocks or fleets, and cumulative totals. The results show that, since they first entered the U.S. market, HEVs have saved nearly 385 million gallons, or over 9 million barrels, of fuel. Although these fuel savings are small in comparison to the total amount of fuel consumed in the United States by light-duty vehicles (8.86 million barrels per day), the savings will increase as additional HEVs penetrate the market, adding annually to the baseline of fuel savings from existing HEVs.
The results of this analysis indicate that, although HEVs are relatively new to the U.S. market, they could significantly reduce the amount of oil imported for use in light-duty vehicles. However, to increase the fuel reduction impact of LDVs, individuals must reverse past trends and switch from larger vehicles to smaller, more fuel efficient vehicles, including HEVs. For individuals who require the functionality of large cars, minivans, sport utility vehicles, and light-duty trucks, the availability of HEV models could provide significant fuel use reductions.
While interest in HEVs is growing, work on the next technology breakthrough is needed not only to improve vehicle efficiency but also to enable energy diversification for vehicle transportation. By improving vehicle efficiency and enabling energy diversification, the nation could achieve significant reductions in fuel use for transportation. However, achieving this goal will require immediate action.
v
Table of Contents
1.0 Introduction ........................................................................................................................... 1 1.1 Background ....................................................................................................................... 1 1.2 Objective ........................................................................................................................... 4 1.3 Approach ........................................................................................................................... 4
2.0 Technical Discussion ............................................................................................................ 5
2.1 Hybrid Electric Vehicle Fuel Savings .............................................................................. 5 2.2 Fuel Reduction Impact ...................................................................................................... 7
3.0 Conclusions ......................................................................................................................... 11 References ................................................................................................................................. 12 Appendix A. Annual HEV Sales Data ...................................................................................... 16 Appendix B. Comparison Vehicles and Fuel Economy ........................................................... 18 Appendix C. Vehicle Fleet Calculation .................................................................................... 20 Appendix D. Annual Fuel Savings from New Sales ................................................................. 21 Appendix E. Annual Fuel Savings from Vehicle Fleet ............................................................ 22 Appendix F. Cumulative Fuel Savings by Year ....................................................................... 23
vi
List of Figures
Figure 1. Regular unleaded gasoline average retail price, 1976-8/2008 .................................... 1
Figure 2. U.S. petroleum overview, 1949-2007 ......................................................................... 2
Figure 3. Value of crude oil imports, 1973-2007 ....................................................................... 2
Figure 4. 2007 petroleum consumption by sector ....................................................................... 3
Figure 5. 2006 transportation petroleum use by type ................................................................. 3
Figure 6. Sales-weighted fuel savings – new HEV sales ............................................................ 6
Figure 7. Fleet-weighted fuel savings – annual HEV fleet ......................................................... 6
Figure 8. Fleet-weighted cumulative fuel savings ...................................................................... 7
Figure 9. Average annual fuel savings per vehicle ..................................................................... 8
Figure 10. Future HEV sales trends ............................................................................................ 8
Figure 11. Future HEV fleet estimate ......................................................................................... 9
Figure 12. Fleet annual fuel savings as percentage of U.S. LDV fleet ..................................... 10
Figure 13. Fuel consumption vs. fuel economy ........................................................................ 11
Figure 14. Transportation petroleum use trends ....................................................................... 11
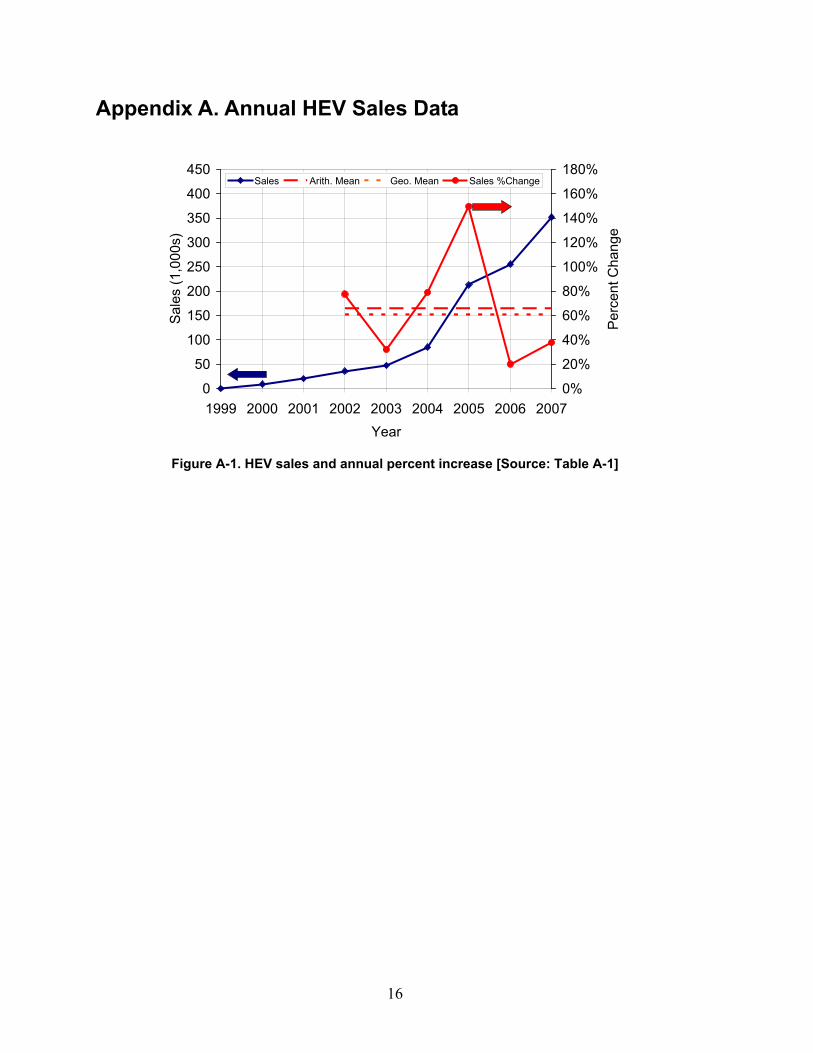
Figure A-1. HEV sales and annual percent increase [Source: Table A-1] ............................... 16
List of Tables
Table 1. Example of Fuel Consumption vs. Fuel Economy Improvements ............................. 11
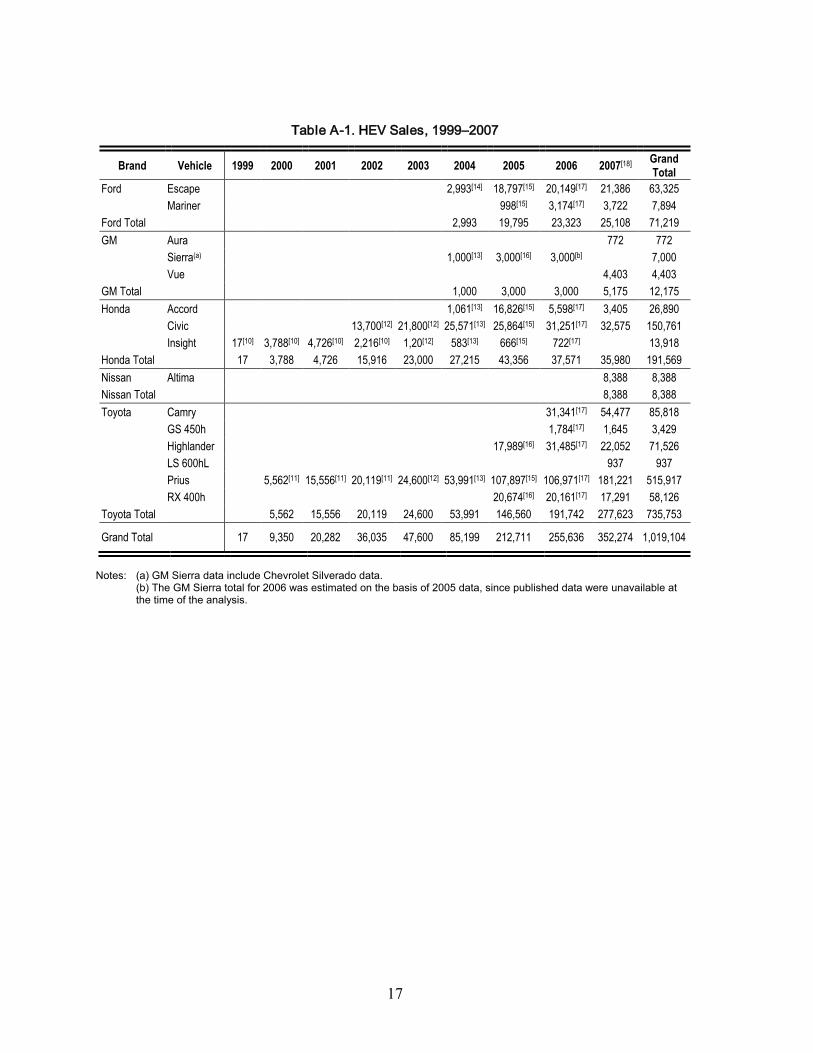
Table A-1. HEV Sales, 1999–2007........................................................................................... 17
Table B-1. Comparison Vehicles and Fuel Economy Estimates .............................................. 18
Table B-2. Fuel Economy or Fuel Consumption Benefit ......................................................... 19
Table C-1. HEV Vehicle Stock ................................................................................................. 20
Table D-1. Fuel Savings from New HEV Sales (thousands of gallons) ................................... 21
Table E-1. Annual HEV Vehicle Stock Fuel Savings (thousands of gallons) .......................... 22
Table F-1. Cumulative HEV Fuel Savings (thousands of gallons) ........................................... 23
1
1.0 Introduction
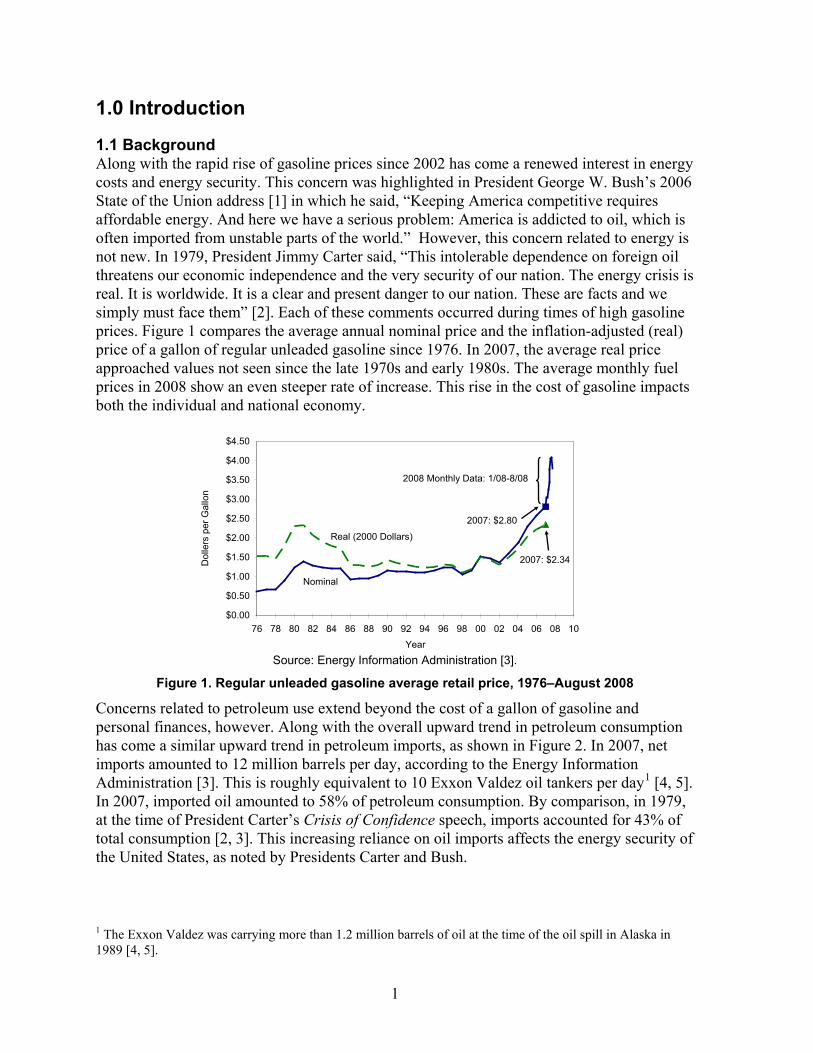
1.1 Background Along with the rapid rise of gasoline prices since 2002 has come a renewed interest in energy costs and energy security. This concern was highlighted in President George W. Bush’s 2006 State of the Union address [1] in which he said, “Keeping America competitive requires affordable energy. And here we have a serious problem: America is addicted to oil, which is often imported from unstable parts of the world.” However, this concern related to energy is not new. In 1979, President Jimmy Carter said, “This intolerable dependence on foreign oil threatens our economic independence and the very security of our nation. The energy crisis is real. It is worldwide. It is a clear and present danger to our nation. These are facts and we simply must face them” [2]. Each of these comments occurred during times of high gasoline prices. Figure 1 compares the average annual nominal price and the inflation-adjusted (real) price of a gallon of regular unleaded gasoline since 1976. In 2007, the average real price approached values not seen since the late 1970s and early 1980s. The average monthly fuel prices in 2008 show an even steeper rate of increase. This rise in the cost of gasoline impacts both the individual and national economy.
2007: $2.34
2007: $2.80
$0.00
$0.50
$1.00
$1.50
$2.00
$2.50
$3.00
$3.50
$4.00
$4.50
76 78 80 82 84 86 88 90 92 94 96 98 00 02 04 06 08 10Year
Dol
lers
per
Gal
lon
Nominal
Real (2000 Dollars)
2008 Monthly Data: 1/08-8/08
Source: Energy Information Administration [3].
Figure 1. Regular unleaded gasoline average retail price, 1976–August 2008
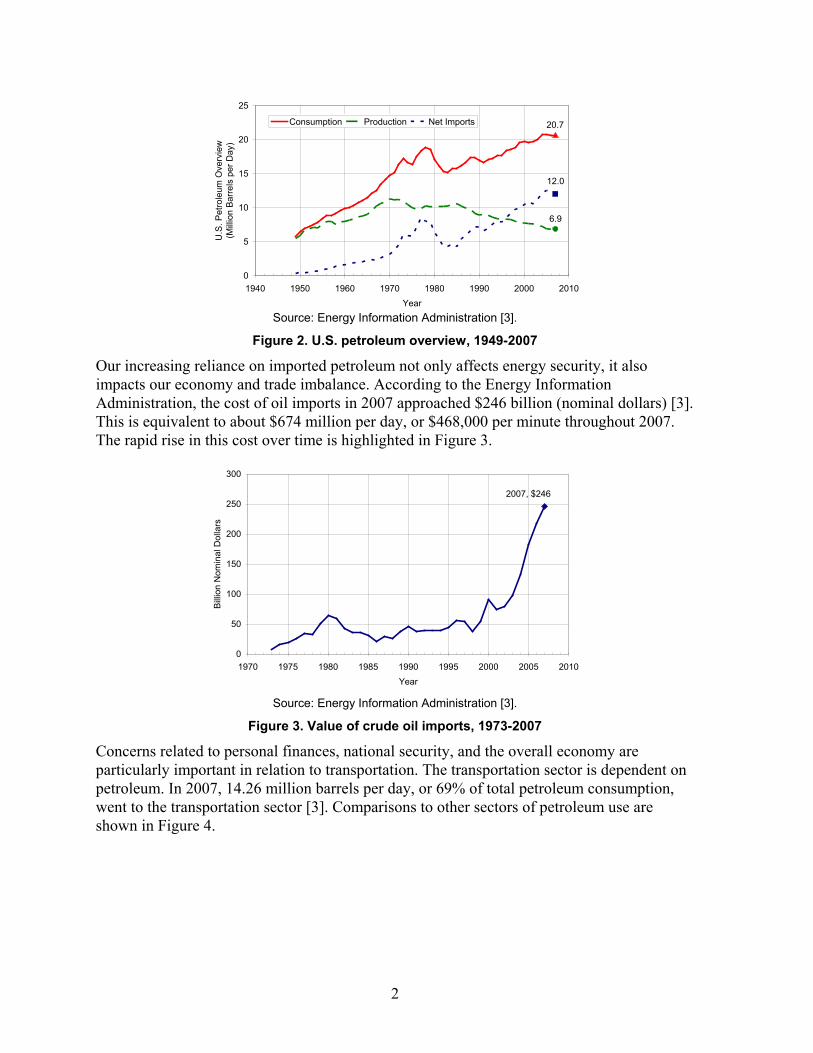
Concerns related to petroleum use extend beyond the cost of a gallon of gasoline and personal finances, however. Along with the overall upward trend in petroleum consumption has come a similar upward trend in petroleum imports, as shown in Figure 2. In 2007, net imports amounted to 12 million barrels per day, according to the Energy Information Administration [3]. This is roughly equivalent to 10 Exxon Valdez oil tankers per day1
1 The Exxon Valdez was carrying more than 1.2 million barrels of oil at the time of the oil spill in Alaska in 1989 [4, 5].
[4, 5]. In 2007, imported oil amounted to 58% of petroleum consumption. By comparison, in 1979, at the time of President Carter’s Crisis of Confidence speech, imports accounted for 43% of total consumption [2, 3]. This increasing reliance on oil imports affects the energy security of the United States, as noted by Presidents Carter and Bush.
2
20.7
6.9
12.0
0
5
10
15
20
25
1940 1950 1960 1970 1980 1990 2000 2010Year
U.S
. Pet
role
um O
verv
iew
(M
illio
n B
arre
ls p
er D
ay)
Consumption Production Net Imports
Source: Energy Information Administration [3].
Figure 2. U.S. petroleum overview, 1949-2007
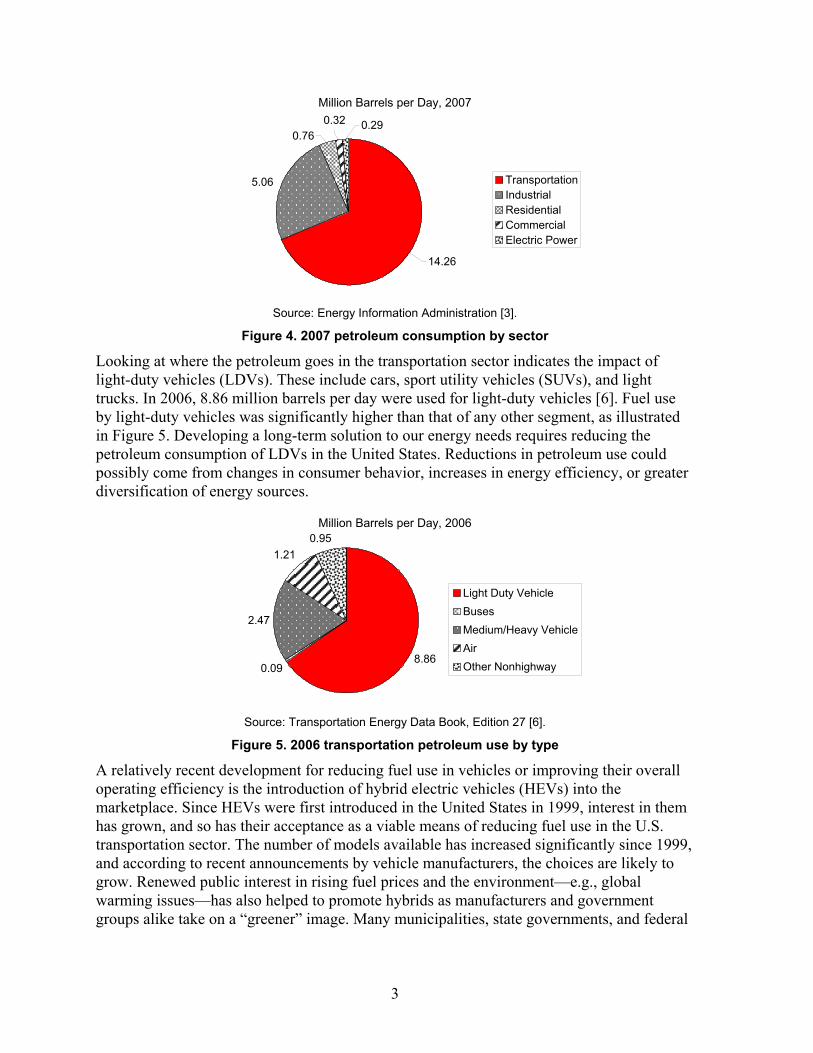
Our increasing reliance on imported petroleum not only affects energy security, it also impacts our economy and trade imbalance. According to the Energy Information Administration, the cost of oil imports in 2007 approached $246 billion (nominal dollars) [3]. This is equivalent to about $674 million per day, or $468,000 per minute throughout 2007. The rapid rise in this cost over time is highlighted in Figure 3.
2007, $246
0
50
100
150
200
250
300
1970 1975 1980 1985 1990 1995 2000 2005 2010Year
Bill
ion
Nom
inal
Dol
lars
Source: Energy Information Administration [3].
Figure 3. Value of crude oil imports, 1973-2007
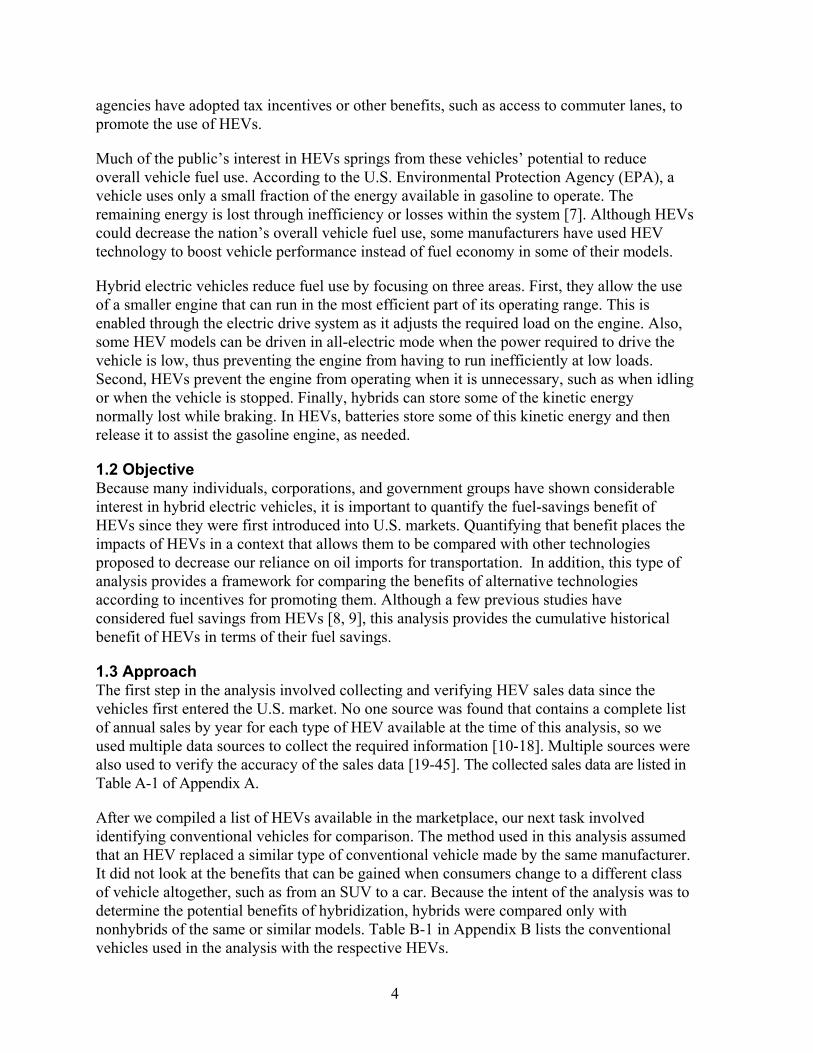
Concerns related to personal finances, national security, and the overall economy are particularly important in relation to transportation. The transportation sector is dependent on petroleum. In 2007, 14.26 million barrels per day, or 69% of total petroleum consumption, went to the transportation sector [3]. Comparisons to other sectors of petroleum use are shown in Figure 4.
3
Million Barrels per Day, 2007
0.760.29
14.26
5.06
0.32
TransportationIndustrialResidentialCommercialElectric Power
Source: Energy Information Administration [3].
Figure 4. 2007 petroleum consumption by sector
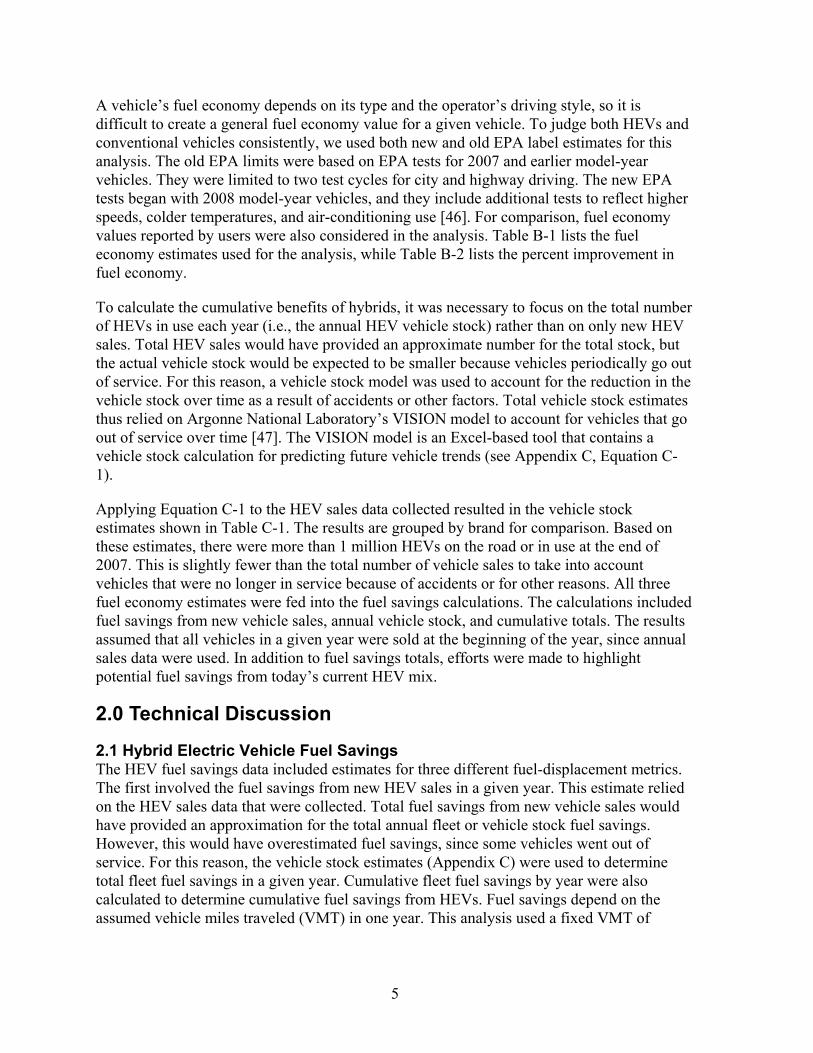
Looking at where the petroleum goes in the transportation sector indicates the impact of light-duty vehicles (LDVs). These include cars, sport utility vehicles (SUVs), and light trucks. In 2006, 8.86 million barrels per day were used for light-duty vehicles [6]. Fuel use by light-duty vehicles was significantly higher than that of any other segment, as illustrated in Figure 5. Developing a long-term solution to our energy needs requires reducing the petroleum consumption of LDVs in the United States. Reductions in petroleum use could possibly come from changes in consumer behavior, increases in energy efficiency, or greater diversification of energy sources.
Million Barrels per Day, 2006
0.09
2.47
1.210.95
8.86
Light Duty VehicleBusesMedium/Heavy VehicleAirOther Nonhighway
Source: Transportation Energy Data Book, Edition 27 [6].
Figure 5. 2006 transportation petroleum use by type
A relatively recent development for reducing fuel use in vehicles or improving their overall operating efficiency is the introduction of hybrid electric vehicles (HEVs) into the marketplace. Since HEVs were first introduced in the United States in 1999, interest in them has grown, and so has their acceptance as a viable means of reducing fuel use in the U.S. transportation sector. The number of models available has increased significantly since 1999, and according to recent announcements by vehicle manufacturers, the choices are likely to grow. Renewed public interest in rising fuel prices and the environment—e.g., global warming issues—has also helped to promote hybrids as manufacturers and government groups alike take on a “greener” image. Many municipalities, state governments, and federal
4
agencies have adopted tax incentives or other benefits, such as access to commuter lanes, to promote the use of HEVs.
Much of the public’s interest in HEVs springs from these vehicles’ potential to reduce overall vehicle fuel use. According to the U.S. Environmental Protection Agency (EPA), a vehicle uses only a small fraction of the energy available in gasoline to operate. The remaining energy is lost through inefficiency or losses within the system [7]. Although HEVs could decrease the nation’s overall vehicle fuel use, some manufacturers have used HEV technology to boost vehicle performance instead of fuel economy in some of their models.
Hybrid electric vehicles reduce fuel use by focusing on three areas. First, they allow the use of a smaller engine that can run in the most efficient part of its operating range. This is enabled through the electric drive system as it adjusts the required load on the engine. Also, some HEV models can be driven in all-electric mode when the power required to drive the vehicle is low, thus preventing the engine from having to run inefficiently at low loads. Second, HEVs prevent the engine from operating when it is unnecessary, such as when idling or when the vehicle is stopped. Finally, hybrids can store some of the kinetic energy normally lost while braking. In HEVs, batteries store some of this kinetic energy and then release it to assist the gasoline engine, as needed.
1.2 Objective Because many individuals, corporations, and government groups have shown considerable interest in hybrid electric vehicles, it is important to quantify the fuel-savings benefit of HEVs since they were first introduced into U.S. markets. Quantifying that benefit places the impacts of HEVs in a context that allows them to be compared with other technologies proposed to decrease our reliance on oil imports for transportation. In addition, this type of analysis provides a framework for comparing the benefits of alternative technologies according to incentives for promoting them. Although a few previous studies have considered fuel savings from HEVs [8, 9], this analysis provides the cumulative historical benefit of HEVs in terms of their fuel savings.
1.3 Approach The first step in the analysis involved collecting and verifying HEV sales data since the vehicles first entered the U.S. market. No one source was found that contains a complete list of annual sales by year for each type of HEV available at the time of this analysis, so we used multiple data sources to collect the required information [10-18]. Multiple sources were also used to verify the accuracy of the sales data [19-45]. The collected sales data are listed in Table A-1 of Appendix A.
After we compiled a list of HEVs available in the marketplace, our next task involved identifying conventional vehicles for comparison. The method used in this analysis assumed that an HEV replaced a similar type of conventional vehicle made by the same manufacturer. It did not look at the benefits that can be gained when consumers change to a different class of vehicle altogether, such as from an SUV to a car. Because the intent of the analysis was to determine the potential benefits of hybridization, hybrids were compared only with nonhybrids of the same or similar models. Table B-1 in Appendix B lists the conventional vehicles used in the analysis with the respective HEVs.
5
A vehicle’s fuel economy depends on its type and the operator’s driving style, so it is difficult to create a general fuel economy value for a given vehicle. To judge both HEVs and conventional vehicles consistently, we used both new and old EPA label estimates for this analysis. The old EPA limits were based on EPA tests for 2007 and earlier model-year vehicles. They were limited to two test cycles for city and highway driving. The new EPA tests began with 2008 model-year vehicles, and they include additional tests to reflect higher speeds, colder temperatures, and air-conditioning use [46]. For comparison, fuel economy values reported by users were also considered in the analysis. Table B-1 lists the fuel economy estimates used for the analysis, while Table B-2 lists the percent improvement in fuel economy.
To calculate the cumulative benefits of hybrids, it was necessary to focus on the total number of HEVs in use each year (i.e., the annual HEV vehicle stock) rather than on only new HEV sales. Total HEV sales would have provided an approximate number for the total stock, but the actual vehicle stock would be expected to be smaller because vehicles periodically go out of service. For this reason, a vehicle stock model was used to account for the reduction in the vehicle stock over time as a result of accidents or other factors. Total vehicle stock estimates thus relied on Argonne National Laboratory’s VISION model to account for vehicles that go out of service over time [47]. The VISION model is an Excel-based tool that contains a vehicle stock calculation for predicting future vehicle trends (see Appendix C, Equation C-1).
Applying Equation C-1 to the HEV sales data collected resulted in the vehicle stock estimates shown in Table C-1. The results are grouped by brand for comparison. Based on these estimates, there were more than 1 million HEVs on the road or in use at the end of 2007. This is slightly fewer than the total number of vehicle sales to take into account vehicles that were no longer in service because of accidents or for other reasons. All three fuel economy estimates were fed into the fuel savings calculations. The calculations included fuel savings from new vehicle sales, annual vehicle stock, and cumulative totals. The results assumed that all vehicles in a given year were sold at the beginning of the year, since annual sales data were used. In addition to fuel savings totals, efforts were made to highlight potential fuel savings from today’s current HEV mix.
2.0 Technical Discussion
2.1 Hybrid Electric Vehicle Fuel Savings The HEV fuel savings data included estimates for three different fuel-displacement metrics. The first involved the fuel savings from new HEV sales in a given year. This estimate relied on the HEV sales data that were collected. Total fuel savings from new vehicle sales would have provided an approximation for the total annual fleet or vehicle stock fuel savings. However, this would have overestimated fuel savings, since some vehicles went out of service. For this reason, the vehicle stock estimates (Appendix C) were used to determine total fleet fuel savings in a given year. Cumulative fleet fuel savings by year were also calculated to determine cumulative fuel savings from HEVs. Fuel savings depend on the assumed vehicle miles traveled (VMT) in one year. This analysis used a fixed VMT of
6
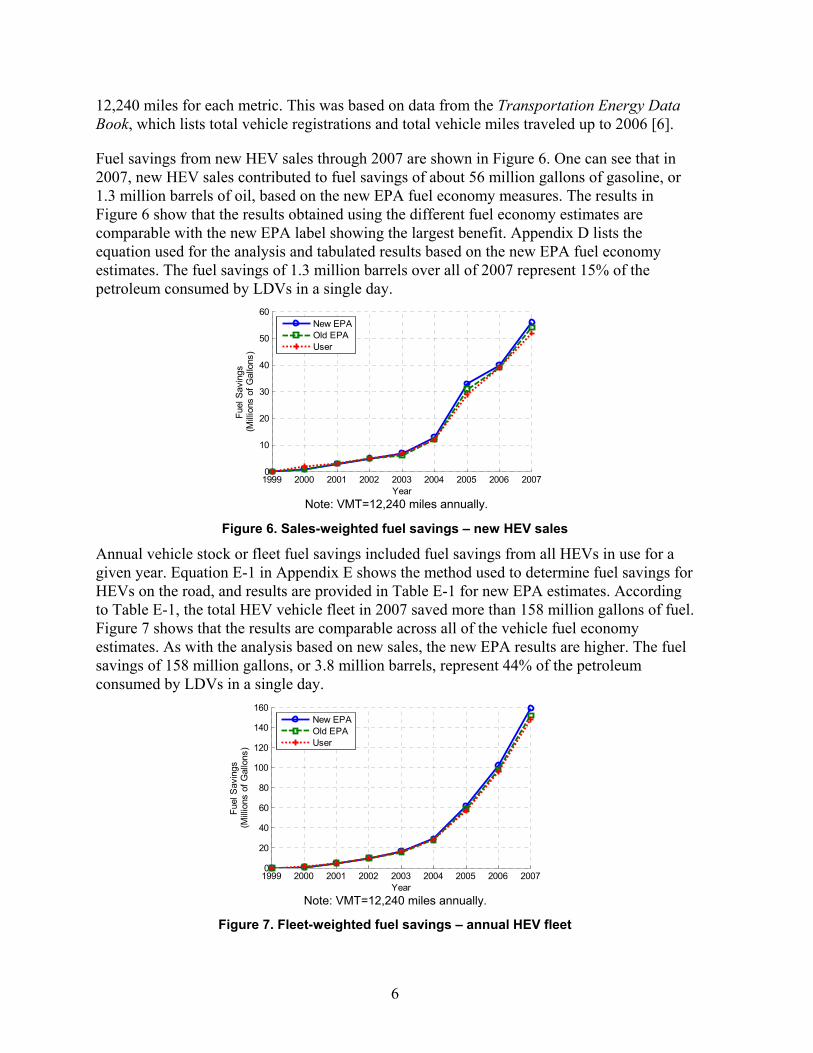
12,240 miles for each metric. This was based on data from the Transportation Energy Data Book, which lists total vehicle registrations and total vehicle miles traveled up to 2006 [6].
Fuel savings from new HEV sales through 2007 are shown in Figure 6. One can see that in 2007, new HEV sales contributed to fuel savings of about 56 million gallons of gasoline, or 1.3 million barrels of oil, based on the new EPA fuel economy measures. The results in Figure 6 show that the results obtained using the different fuel economy estimates are comparable with the new EPA label showing the largest benefit. Appendix D lists the equation used for the analysis and tabulated results based on the new EPA fuel economy estimates. The fuel savings of 1.3 million barrels over all of 2007 represent 15% of the petroleum consumed by LDVs in a single day.
Figure 6. Sales-weighted fuel savings – new HEV sales
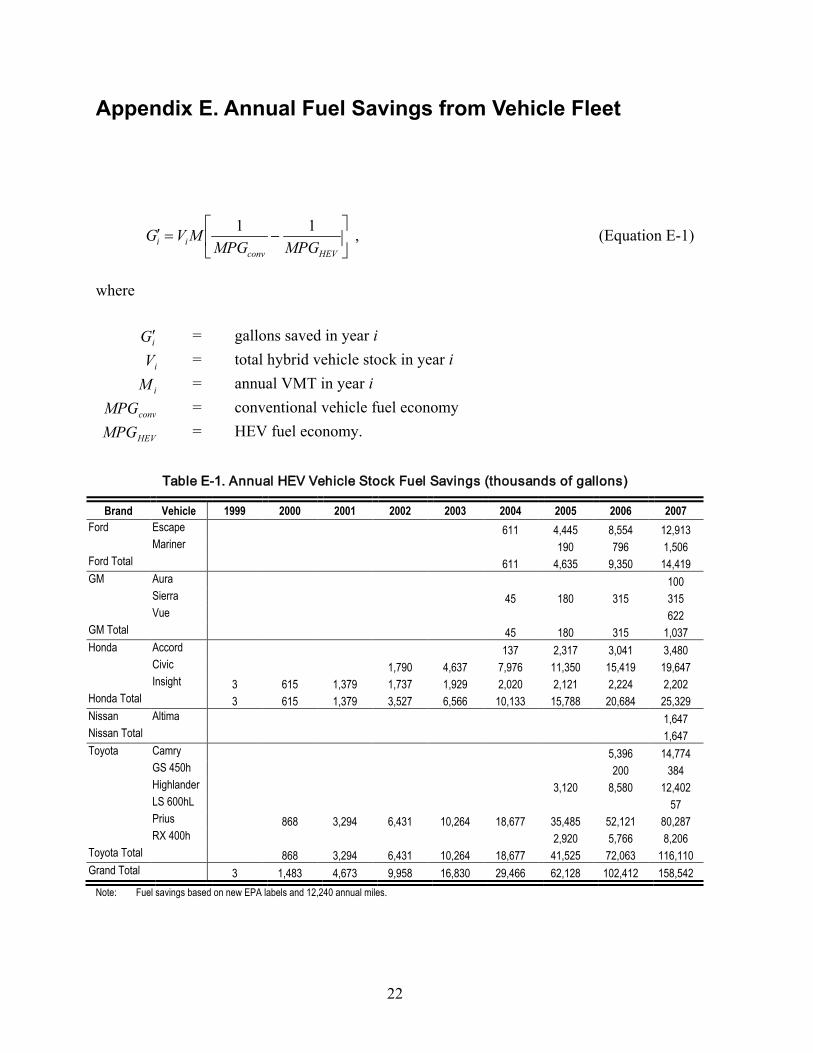
Annual vehicle stock or fleet fuel savings included fuel savings from all HEVs in use for a given year. Equation E-1 in Appendix E shows the method used to determine fuel savings for HEVs on the road, and results are provided in Table E-1 for new EPA estimates. According to Table E-1, the total HEV vehicle fleet in 2007 saved more than 158 million gallons of fuel. Figure 7 shows that the results are comparable across all of the vehicle fuel economy estimates. As with the analysis based on new sales, the new EPA results are higher. The fuel savings of 158 million gallons, or 3.8 million barrels, represent 44% of the petroleum consumed by LDVs in a single day.
Figure 7. Fleet-weighted fuel savings – annual HEV fleet
1999 2000 2001 2002 2003 2004 2005 2006 20070
10
20
30
40
50
60
Year
Fue
l Sav
ings
(Mill
ions
of
Gal
lons
)
New EPAOld EPAUser
Note: VMT=12,240 miles annually.
1999 2000 2001 2002 2003 2004 2005 2006 20070
20
40
60
80
100
120
140
160
Year
Fue
l Sav
ings
(Mill
ions
of
Gal
lons
)
New EPAOld EPAUser
Note: VMT=12,240 miles annually.
7
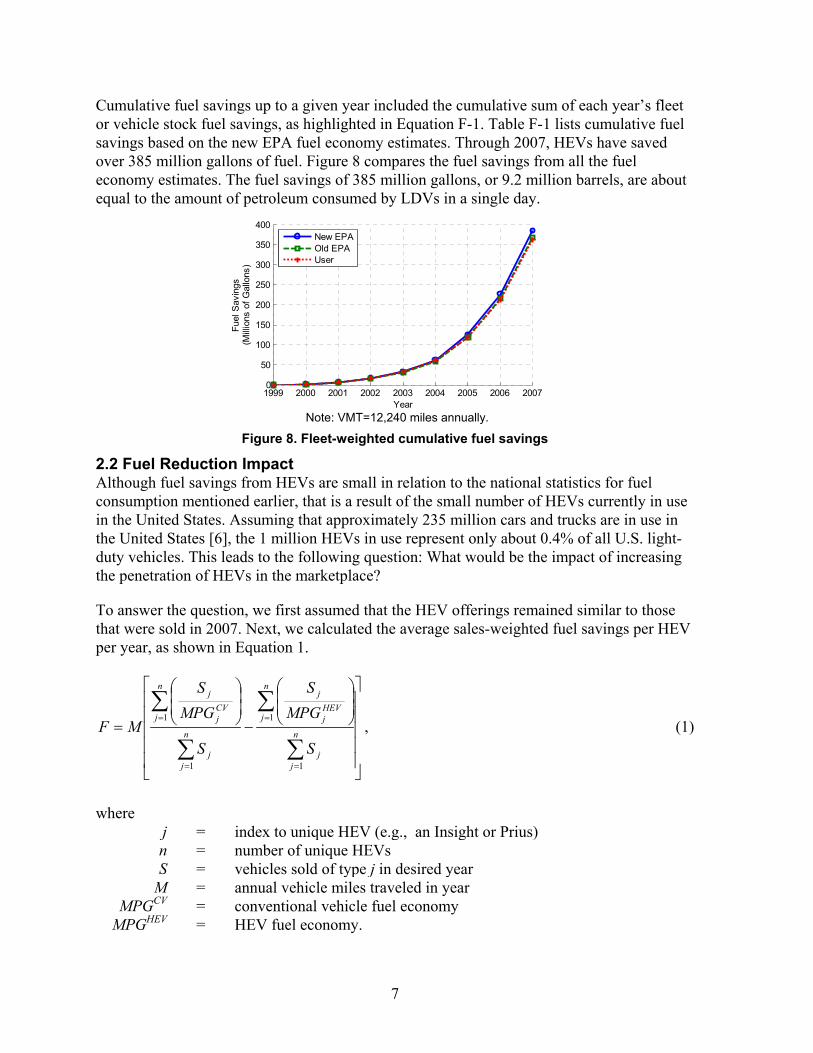
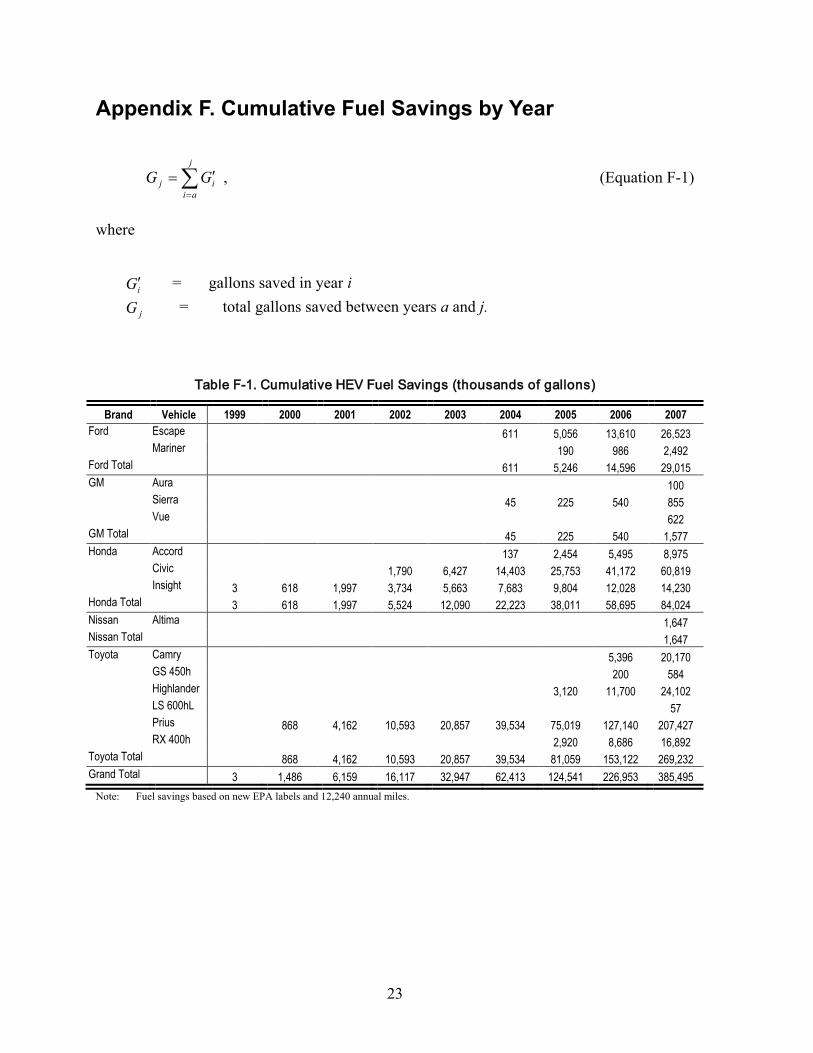
Cumulative fuel savings up to a given year included the cumulative sum of each year’s fleet or vehicle stock fuel savings, as highlighted in Equation F-1. Table F-1 lists cumulative fuel savings based on the new EPA fuel economy estimates. Through 2007, HEVs have saved over 385 million gallons of fuel. Figure 8 compares the fuel savings from all the fuel economy estimates. The fuel savings of 385 million gallons, or 9.2 million barrels, are about equal to the amount of petroleum consumed by LDVs in a single day.
Figure 8. Fleet-weighted cumulative fuel savings
2.2 Fuel Reduction Impact Although fuel savings from HEVs are small in relation to the national statistics for fuel consumption mentioned earlier, that is a result of the small number of HEVs currently in use in the United States. Assuming that approximately 235 million cars and trucks are in use in the United States [6], the 1 million HEVs in use represent only about 0.4% of all U.S. light-duty vehicles. This leads to the following question: What would be the impact of increasing the penetration of HEVs in the marketplace?
To answer the question, we first assumed that the HEV offerings remained similar to those that were sold in 2007. Next, we calculated the average sales-weighted fuel savings per HEV per year, as shown in Equation 1.
−
=
∑
∑
∑
∑
=
=
=
=
n
jj
n
jHEVj
j
n
jj
n
jCVj
j
S
MPGS
S
MPGS
MF
1
1
1
1, (1)
where
j = index to unique HEV (e.g., an Insight or Prius) n = number of unique HEVs S = vehicles sold of type j in desired year
M = annual vehicle miles traveled in year MPGCV = conventional vehicle fuel economy
MPGHEV = HEV fuel economy.
1999 2000 2001 2002 2003 2004 2005 2006 20070
50
100
150
200
250
300
350
400
Year
Fue
l Sav
ings
(Mill
ions
of
Gal
lons
)
New EPAOld EPAUser
Note: VMT=12,240 miles annually.
8
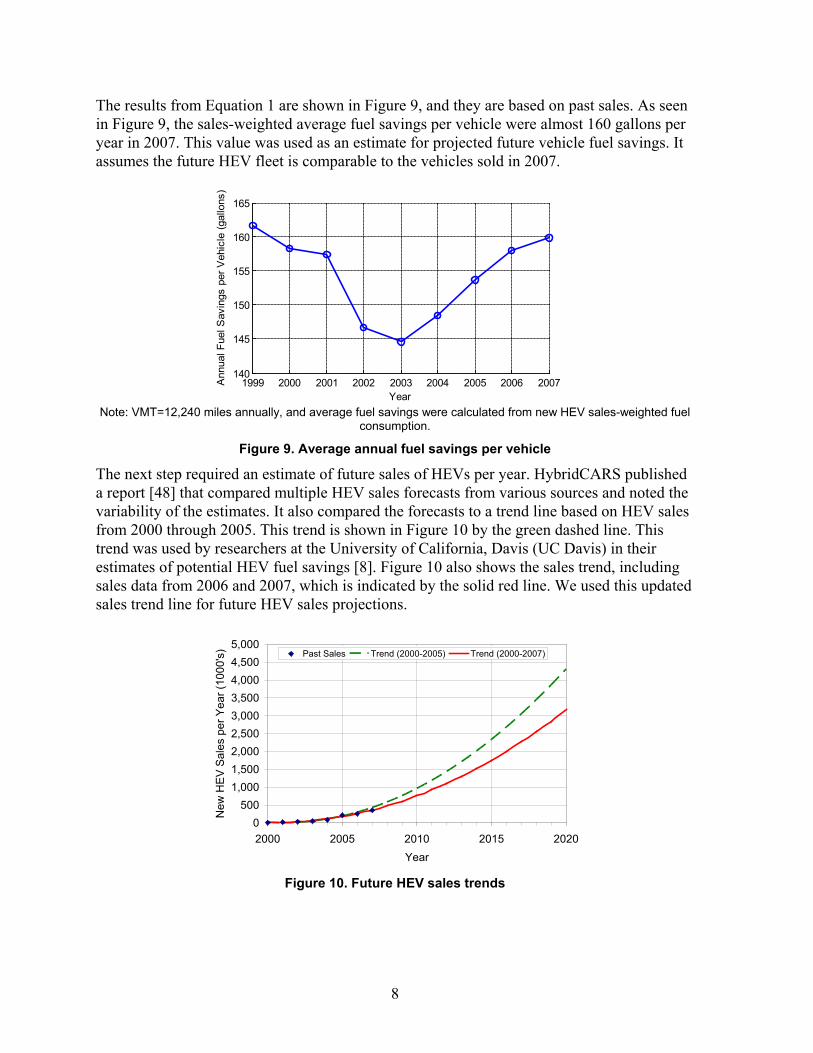
The results from Equation 1 are shown in Figure 9, and they are based on past sales. As seen in Figure 9, the sales-weighted average fuel savings per vehicle were almost 160 gallons per year in 2007. This value was used as an estimate for projected future vehicle fuel savings. It assumes the future HEV fleet is comparable to the vehicles sold in 2007.
1999 2000 2001 2002 2003 2004 2005 2006 2007140
145
150
155
160
165
Year
Ann
ual F
uel S
avin
gs p
er V
ehic
le (g
allo
ns)
Note: VMT=12,240 miles annually, and average fuel savings were calculated from new HEV sales-weighted fuel
consumption.
Figure 9. Average annual fuel savings per vehicle
The next step required an estimate of future sales of HEVs per year. HybridCARS published a report [48] that compared multiple HEV sales forecasts from various sources and noted the variability of the estimates. It also compared the forecasts to a trend line based on HEV sales from 2000 through 2005. This trend is shown in Figure 10 by the green dashed line. This trend was used by researchers at the University of California, Davis (UC Davis) in their estimates of potential HEV fuel savings [8]. Figure 10 also shows the sales trend, including sales data from 2006 and 2007, which is indicated by the solid red line. We used this updated sales trend line for future HEV sales projections.
0500
1,0001,5002,0002,5003,0003,5004,0004,5005,000
2000 2005 2010 2015 2020Year
New
HEV
Sal
es p
er Y
ear (
1000
's) Past Sales Trend (2000-2005) Trend (2000-2007)
Figure 10. Future HEV sales trends
9
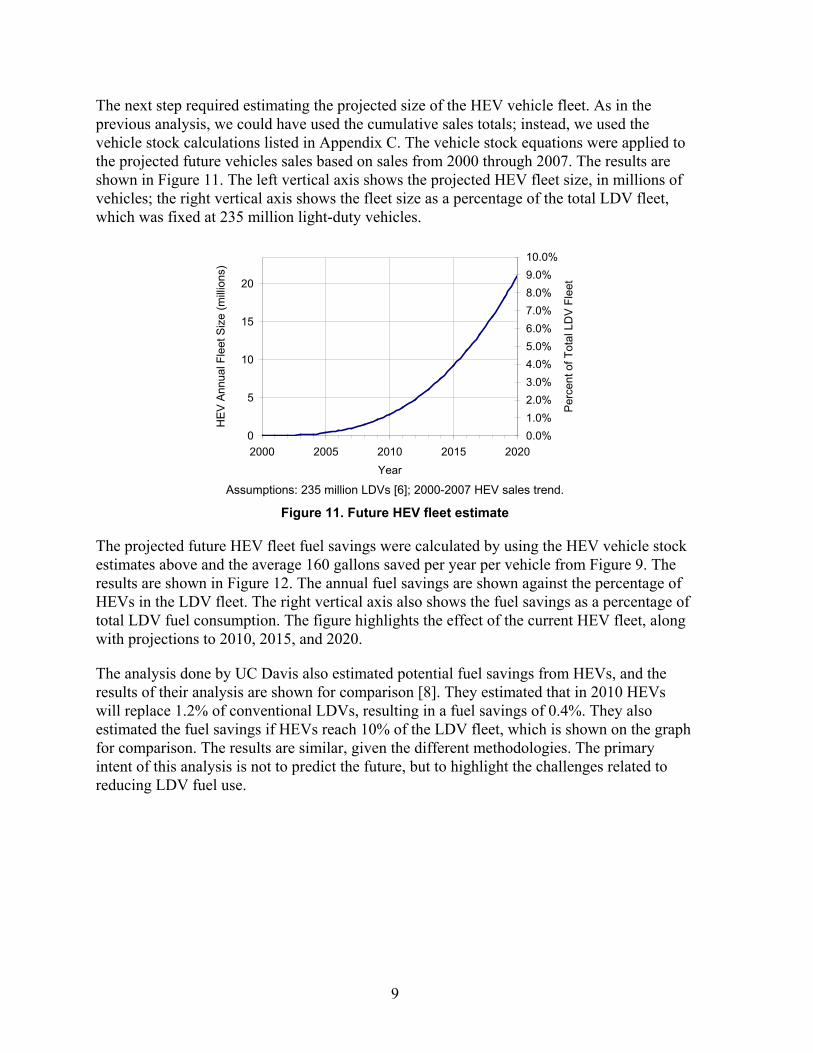
The next step required estimating the projected size of the HEV vehicle fleet. As in the previous analysis, we could have used the cumulative sales totals; instead, we used the vehicle stock calculations listed in Appendix C. The vehicle stock equations were applied to the projected future vehicles sales based on sales from 2000 through 2007. The results are shown in Figure 11. The left vertical axis shows the projected HEV fleet size, in millions of vehicles; the right vertical axis shows the fleet size as a percentage of the total LDV fleet, which was fixed at 235 million light-duty vehicles.
0
5
10
15
20
2000 2005 2010 2015 2020Year
HEV
Ann
ual F
leet
Siz
e (m
illion
s)
0.0%1.0%2.0%3.0%4.0%5.0%6.0%7.0%8.0%9.0%10.0%
Perc
ent o
f Tot
al L
DV
Flee
t
Assumptions: 235 million LDVs [6]; 2000-2007 HEV sales trend.
Figure 11. Future HEV fleet estimate
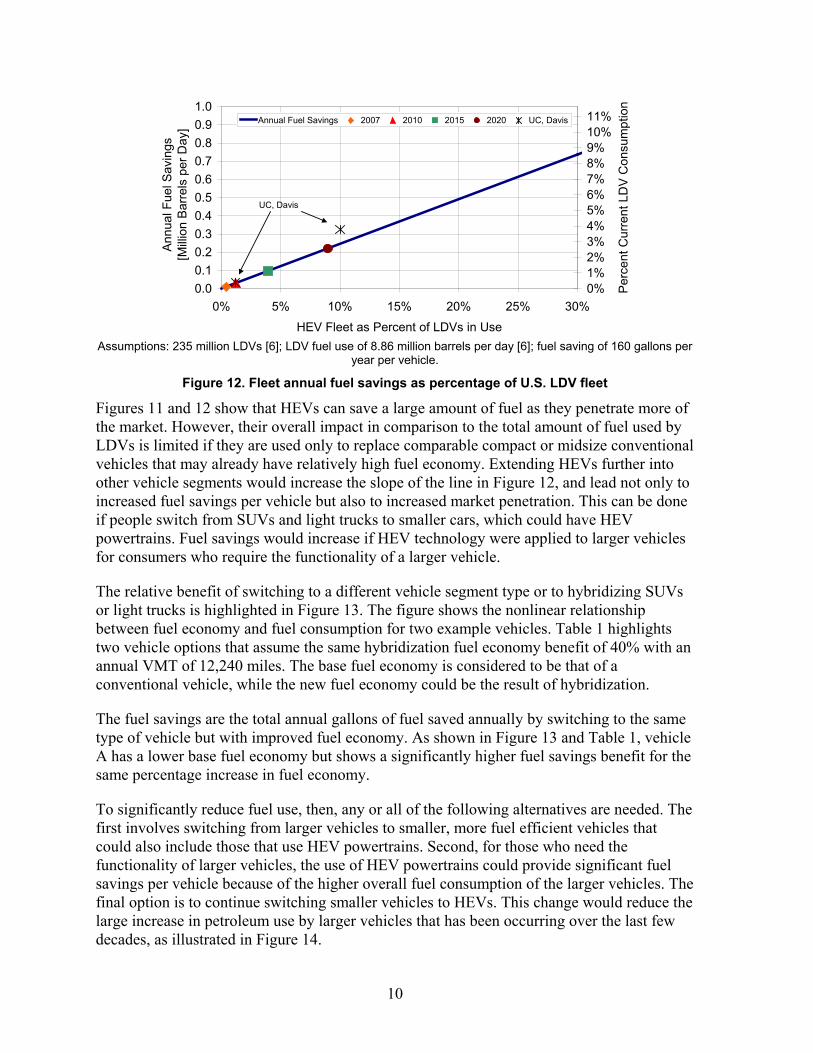
The projected future HEV fleet fuel savings were calculated by using the HEV vehicle stock estimates above and the average 160 gallons saved per year per vehicle from Figure 9. The results are shown in Figure 12. The annual fuel savings are shown against the percentage of HEVs in the LDV fleet. The right vertical axis also shows the fuel savings as a percentage of total LDV fuel consumption. The figure highlights the effect of the current HEV fleet, along with projections to 2010, 2015, and 2020.
The analysis done by UC Davis also estimated potential fuel savings from HEVs, and the results of their analysis are shown for comparison [8]. They estimated that in 2010 HEVs will replace 1.2% of conventional LDVs, resulting in a fuel savings of 0.4%. They also estimated the fuel savings if HEVs reach 10% of the LDV fleet, which is shown on the graph for comparison. The results are similar, given the different methodologies. The primary intent of this analysis is not to predict the future, but to highlight the challenges related to reducing LDV fuel use.
10
UC, Davis
0.00.10.20.30.40.50.60.70.80.91.0
0% 5% 10% 15% 20% 25% 30%
HEV Fleet as Percent of LDVs in Use
Ann
ual F
uel S
avin
gs
[Mill
ion
Bar
rels
per
Day
]
0%1%2%3%4%5%6%7%8%9%10%11%
Per
cent
Cur
rent
LD
V C
onsu
mpt
ion
Annual Fuel Savings 2007 2010 2015 2020 UC, Davis
Assumptions: 235 million LDVs [6]; LDV fuel use of 8.86 million barrels per day [6]; fuel saving of 160 gallons per
year per vehicle.
Figure 12. Fleet annual fuel savings as percentage of U.S. LDV fleet
Figures 11 and 12 show that HEVs can save a large amount of fuel as they penetrate more of the market. However, their overall impact in comparison to the total amount of fuel used by LDVs is limited if they are used only to replace comparable compact or midsize conventional vehicles that may already have relatively high fuel economy. Extending HEVs further into other vehicle segments would increase the slope of the line in Figure 12, and lead not only to increased fuel savings per vehicle but also to increased market penetration. This can be done if people switch from SUVs and light trucks to smaller cars, which could have HEV powertrains. Fuel savings would increase if HEV technology were applied to larger vehicles for consumers who require the functionality of a larger vehicle.
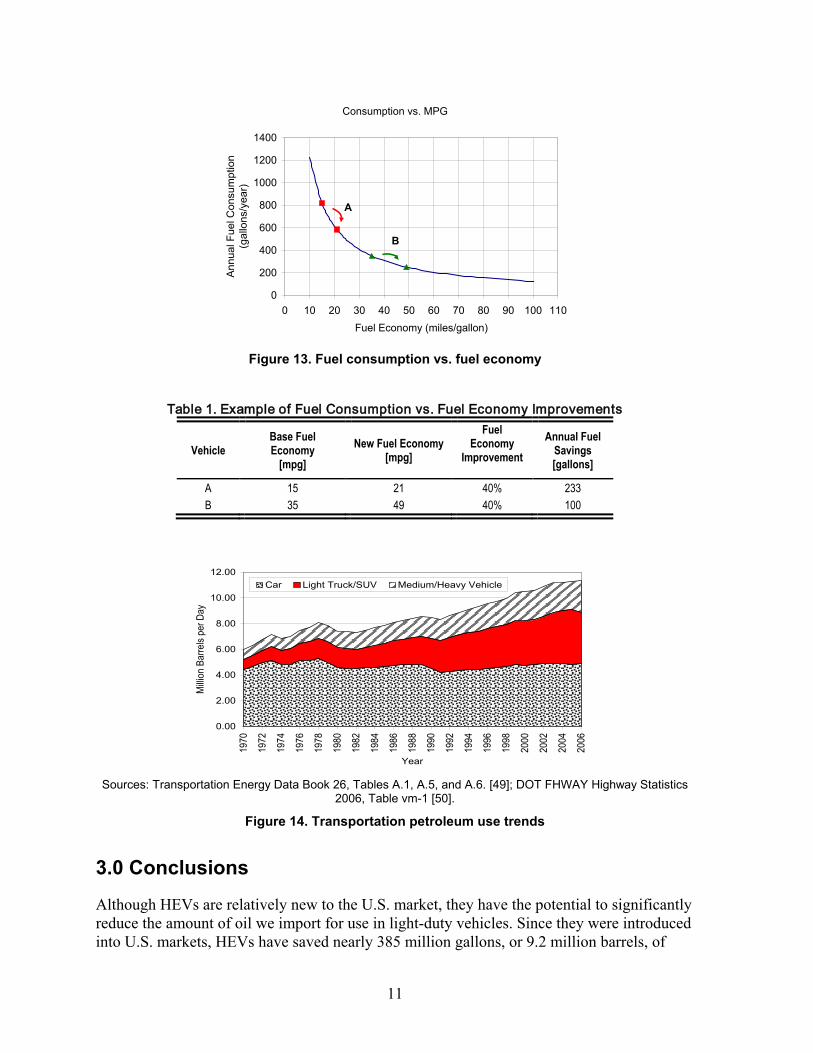
The relative benefit of switching to a different vehicle segment type or to hybridizing SUVs or light trucks is highlighted in Figure 13. The figure shows the nonlinear relationship between fuel economy and fuel consumption for two example vehicles. Table 1 highlights two vehicle options that assume the same hybridization fuel economy benefit of 40% with an annual VMT of 12,240 miles. The base fuel economy is considered to be that of a conventional vehicle, while the new fuel economy could be the result of hybridization.
The fuel savings are the total annual gallons of fuel saved annually by switching to the same type of vehicle but with improved fuel economy. As shown in Figure 13 and Table 1, vehicle A has a lower base fuel economy but shows a significantly higher fuel savings benefit for the same percentage increase in fuel economy.
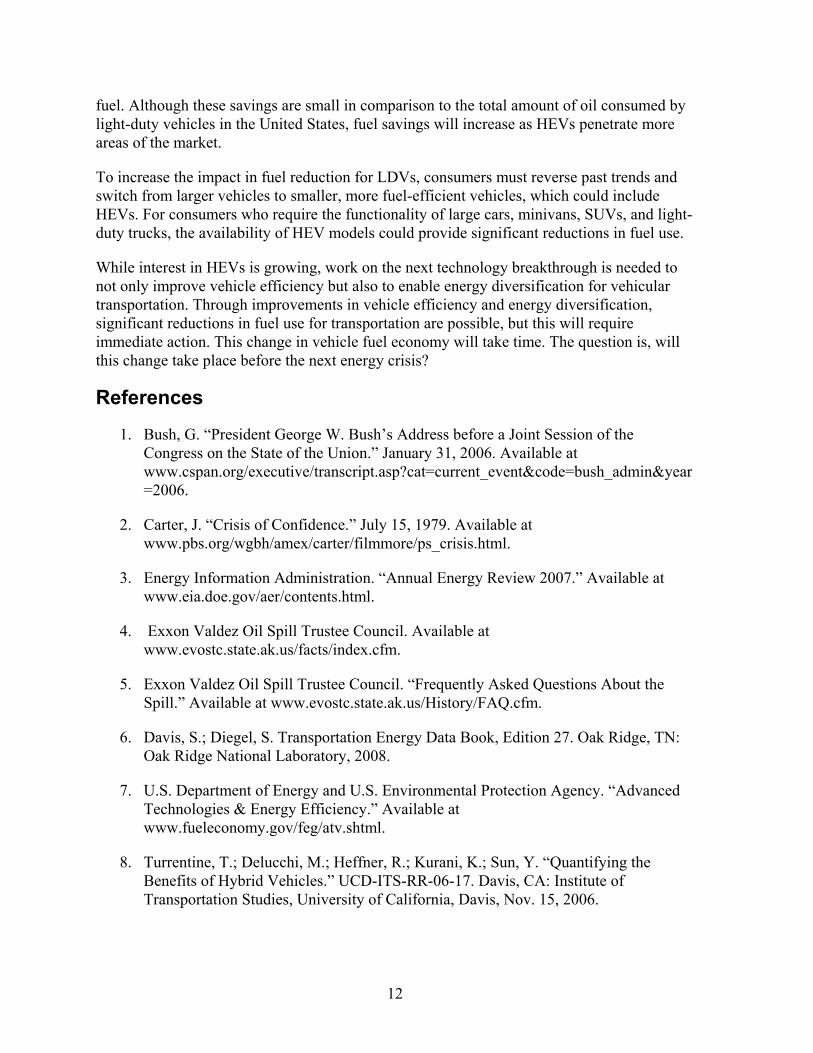
To significantly reduce fuel use, then, any or all of the following alternatives are needed. The first involves switching from larger vehicles to smaller, more fuel efficient vehicles that could also include those that use HEV powertrains. Second, for those who need the functionality of larger vehicles, the use of HEV powertrains could provide significant fuel savings per vehicle because of the higher overall fuel consumption of the larger vehicles. The final option is to continue switching smaller vehicles to HEVs. This change would reduce the large increase in petroleum use by larger vehicles that has been occurring over the last few decades, as illustrated in Figure 14.
11
0.00
2.00
4.00
6.00
8.00
10.00
12.00
1970
1972
1974
1976
1978
1980
1982
1984
1986
1988
1990
1992
1994
1996
1998
2000
2002
2004
2006
Year
Milli
on B
arre
ls pe
r Day
Car Light Truck/SUV Medium/Heavy Vehicle
1
Consumption vs. MPG
0
200
400
600
800
1000
1200
1400
0 10 20 30 40 50 60 70 80 90 100 110Fuel Economy (miles/gallon)
Ann
ual F
uel C
onsu
mpt
ion
(gal
lons
/yea
r)
A
B
Figure 13. Fuel consumption vs. fuel economy
Table 1. Example of Fuel Consumption vs. Fuel Economy Improvements
Vehicle Base Fuel Economy
[mpg] New Fuel Economy
[mpg]
Fuel Economy
Improvement
Annual Fuel Savings [gallons]
A 15 21 40% 233 B 35 49 40% 100
Sources: Transportation Energy Data Book 26, Tables A.1, A.5, and A.6. [49]; DOT FHWAY Highway Statistics
2006, Table vm-1 [50].
Figure 14. Transportation petroleum use trends
3.0 Conclusions
Although HEVs are relatively new to the U.S. market, they have the potential to significantly reduce the amount of oil we import for use in light-duty vehicles. Since they were introduced into U.S. markets, HEVs have saved nearly 385 million gallons, or 9.2 million barrels, of
12
fuel. Although these savings are small in comparison to the total amount of oil consumed by light-duty vehicles in the United States, fuel savings will increase as HEVs penetrate more areas of the market.
To increase the impact in fuel reduction for LDVs, consumers must reverse past trends and switch from larger vehicles to smaller, more fuel-efficient vehicles, which could include HEVs. For consumers who require the functionality of large cars, minivans, SUVs, and light-duty trucks, the availability of HEV models could provide significant reductions in fuel use.
While interest in HEVs is growing, work on the next technology breakthrough is needed to not only improve vehicle efficiency but also to enable energy diversification for vehicular transportation. Through improvements in vehicle efficiency and energy diversification, significant reductions in fuel use for transportation are possible, but this will require immediate action. This change in vehicle fuel economy will take time. The question is, will this change take place before the next energy crisis?
References
1. Bush, G. “President George W. Bush’s Address before a Joint Session of the Congress on the State of the Union.” January 31, 2006. Available at www.cspan.org/executive/transcript.asp?cat=current_event&code=bush_admin&year=2006.
2. Carter, J. “Crisis of Confidence.” July 15, 1979. Available at www.pbs.org/wgbh/amex/carter/filmmore/ps_crisis.html.
3. Energy Information Administration. “Annual Energy Review 2007.” Available at www.eia.doe.gov/aer/contents.html.
4. Exxon Valdez Oil Spill Trustee Council. Available at www.evostc.state.ak.us/facts/index.cfm.
5. Exxon Valdez Oil Spill Trustee Council. “Frequently Asked Questions About the Spill.” Available at www.evostc.state.ak.us/History/FAQ.cfm.
6. Davis, S.; Diegel, S. Transportation Energy Data Book, Edition 27. Oak Ridge, TN: Oak Ridge National Laboratory, 2008.
7. U.S. Department of Energy and U.S. Environmental Protection Agency. “Advanced Technologies & Energy Efficiency.” Available at www.fueleconomy.gov/feg/atv.shtml.
8. Turrentine, T.; Delucchi, M.; Heffner, R.; Kurani, K.; Sun, Y. “Quantifying the Benefits of Hybrid Vehicles.” UCD-ITS-RR-06-17. Davis, CA: Institute of Transportation Studies, University of California, Davis, Nov. 15, 2006.
13
9. Johnson, C.; Bergeron, P. Fuel Use Metrics. Golden, CO: National Renewable Energy Laboratory, Sept. 2006.
10. InsightCentral.net. “Sales Statistics.” Available at www.insightcentral.net/KB/sales.html.
11. ToyoLand. “Toyota Prius Chronological History.” Available at www.toyoland.com/prius/chronology.html.
12. U.S. Department of Energy. “Historical U.S. Hybrid Sales.” Available at www.eere.energy.gov/vehiclesandfuels/facts/2007_fcvt_fotw462.html.
13. Energy Futures, Inc. Hybrid Vehicles, Vol. 7, No. 6; Dec. 2005.
14. Green Car Congress. “U.S. Hybrid Sales Crest 10,000 in December.” Available at www.greencarcongress.com/2005/01/us_hybrid_sales.html.
15. Electric Drive Transportation Association (EDTA). “Hybrid Vehicle Sales Information and Tax Credits.” Available at www.electricdrive.org/index.php?tg=articles&idx=Print&topics=7&article=692.
16. Energy Futures, Inc. Hybrid Vehicles, Vol. 9, No. 1; Feb. 2007.
17. HybridCARS. Available at www.hybridcars.com/market-dashboard/dec06-us-sales.html.
18. U.S. Department of Energy, Alternative Fuels & Advanced Vehicles Data Center. “HEV Sales by Model.” May 28, 2008. Available at http://afdc.energy.gov/afdc/data/vehicles.html.
19. Green Car Congress. “Hybrid Sales 1H04: Some Surprises.” July 1, 2004. Available at www.greencarcongress.com/2004/07/hybrid_sales_1h.html.
20. Green Car Congress. “August Hybrid Sales: Some Decline.” Sept. 3, 2004. Available at www.greencarcongress.com/2004/09/august_hybrid_s.html.
21. Green Car Congress. “October 04 U.S. Hybrid Sales.” Nov. 3, 2004. Available at www.greencarcongress.com/2004/11/october_04_us_h.html.
22. Green Car Congress. “Toyota’s Hybrid Sales Total 280,000+.” Nov. 1, 2004. Available at www.greencarcongress.com/2004/11/toyotarsquos_hy.html.
23. Green Car Congress. “US Hybrid Sales Crest 10,000 in December.” Jan. 4, 2005. Available at www.greencarcongress.com/2005/01/us_hybrid_sales.html.
24. Green Car Congress. “Hybrids Up 81% in 2004; California Leads Nation with 30%.” Apr. 25, 2005. Available at www.greencarcongress.com/2005/04/hybrids_up_81_i.html.
14
25. Green Car Congress. “February US Hybrid Sales Second-Strongest Ever.” Mar. 1, 2005. Available at www.greencarcongress.com/2005/03/february_us_hyb.html.
26. Green Car Congress. “US Hybrid Sales Rocket Upward in March.” Apr. 1, 2005. Available at www.greencarcongress.com/2005/04/us_hybrid_sales.html.
27. Green Car Congress. “April Hybrid Sales in US More than Triple from Year Before, Almost Reach 21,000.” May. 3, 2005. Available at www.greencarcongress.com/2005/05/april_hybrid_sa.html.
28. Green Car Congress. “US Hybrid Sales in May Up 2.3x from 2004; Sales Pace Drops from April 05.” June 1, 2005. Available at www.greencarcongress.com/2005/06/us_hybrid_sales.html.
29. Green Car Congress. “Hybrid Sales Increase in June from May; Highlander Off to Strong Start.” July 1, 2005. Available at www.greencarcongress.com/2005/07/hybrid_sales_in.html.
30. Green Car Congress. “US Hybrid Sales Hit All-Time Monthly High in August.” Sept. 1, 2005. Available at www.greencarcongress.com/2005/09/us_hybrid_sales.html.
31. Green Car Congress. “Hybrid Sales in US Top 205,000 in 2005.” Jan. 4, 2006. Available at www.greencarcongress.com/2006/01/hybrid_sales_in.html.
32. Green Car Congress. “January 2006 US Hybrid Sales Almost Double from Prior Year.” Feb. 23, 2006. Available at www.greencarcongress.com/2006/02/january_2006_us.html.
33. Green Car Congress. “February 2006 US Hybrid Sales Up 44% from Prior Year; Prius Down 7.5%.” Mar. 7, 2006. Available at www.greencarcongress.com/2006/03/february_2006_u.html.
34. Green Car Congress. “Hybrid Sales in US Climbed 7.5% in March.” Apr. 5, 2006. Available at www.greencarcongress.com/2006/04/hybrid_sales_in.html.
35. Green Car Congress. “US Hybrid Sales in April Back Over 21,000; Second Highest Month Yet (updated).” May 2, 2006. Available at www.greencarcongress.com/2006/05/us_hybrid_sales.html.
36. Green Car Congress. “Ford’s US Hybrid Sales More than Double in April.” May 2, 2006. Available at www.greencarcongress.com/2006/05/fords_us_hybrid.html.
37. Green Car Congress. “Sales of Hybrids in US Hit New Peak in May.” June 1, 2006. Available at www.greencarcongress.com/2006/06/sales_of_hybrid.html.
38. Green Car Congress. “US Sales of Hybrids Stay Strong in June 2006, Up 20% from 2005.” July 3, 2006. Available at www.greencarcongress.com/2006/07/us_sales_of_hyb.html.
15
39. Green Car Congress. “Prius Passes 500,000 Sales Mark Worldwide.” June 7, 2006. Available at www.greencarcongress.com/2006/06/prius_passes_50.html.
40. Green Car Congress. “US Sales of Hybrids Top 25,000 Units in July for a New High.” Aug. 4, 2006. Available at www.greencarcongress.com/2006/08/us_sales_of_hyb.html.
41. Green Car Congress. “US Sales of Hybrids Hit New High in August: 26,189 Units, 1.8% of LDV Market.” Sept. 6, 2006. Available at www.greencarcongress.com/2006/09/us_sales_of_hyb.html.
42. Green Car Congress. “US Sales of Hybrids Drop in September. Oct. 4, 2006. Available at www.greencarcongress.com/2006/10/us_sales_of_hyb.html.
43. Green Car Congress. “US Sales of Hybrids in October Up 11% Year-on-Year.” Nov. 3, 2006. Available at www.greencarcongress.com/2006/11/us_sales_of_hyb.html.
44. Green Car Congress. “US Sales of Hybrids in November Up 13.8% Year-on-Year.” Dec. 6, 2006. Available at www.greencarcongress.com/2006/12/us_sales_of_hyb.html.
45. Green Car Congress. “Sales of Hybrids in the US Up 24% in December; Up 22% in 2006 (corrected).” Jan. 4, 2007. Available at www.greencarcongress.com/2007/01/sales_of_hybrid.html.
46. U.S. Department of Energy and U.S. Environmental Protection Agency. “New MPG Ratings.” Available at www.fueleconomy.gov/feg/ratings2008.shtml.
47. Argonne National Laboratory. VISION 2006 AEO Model. Argonne, IL: Argonne National Laboratory. Available at www.transportation.anl.gov/software/VISION/index.html.
48. HybridCARS. “Hybrid Market Forecasts.” Available at www.hybridcars.com/hybrid-drivers/hybrid-market-forecasts.html.
49. Davis, S.; Diegel, S. Transportation Energy Data Book, Edition 26. Oak Ridge, TN: Oak Ridge National Laboratory, 2007.
50. U.S. Department of Transportation Federal Highway Administration, “Highway Statistics 2006.” Available at www.fhwa.dot.gov/policy/ohim/hs06/htm/vm1.htm.
16
Appendix A. Annual HEV Sales Data
0
50
100
150
200
250
300
350
400
450
1999 2000 2001 2002 2003 2004 2005 2006 2007Year
Sale
s (1
,000
s)
0%
20%
40%
60%
80%
100%
120%
140%
160%
180%
Perc
ent C
hang
e
Sales Arith. Mean Geo. Mean Sales %Change
Figure A-1. HEV sales and annual percent increase [Source: Table A-1]
17
Table A-1. HEV Sales, 1999–2007
Brand Vehicle 1999 2000 2001 2002 2003 2004 2005 2006 2007[18] Grand Total
Ford Escape 2,993[14] 18,797[15] 20,149[17] 21,386 63,325 Mariner 998[15] 3,174[17] 3,722 7,894 Ford Total 2,993 19,795 23,323 25,108 71,219 GM Aura 772 772 Sierra(a) 1,000[13] 3,000[16] 3,000[b] 7,000 Vue 4,403 4,403 GM Total 1,000 3,000 3,000 5,175 12,175 Honda Accord 1,061[13] 16,826[15] 5,598[17] 3,405 26,890 Civic 13,700[12] 21,800[12] 25,571[13] 25,864[15] 31,251[17] 32,575 150,761 Insight 17[10] 3,788[10] 4,726[10] 2,216[10] 1,20[12] 583[13] 666[15] 722[17] 13,918 Honda Total 17 3,788 4,726 15,916 23,000 27,215 43,356 37,571 35,980 191,569 Nissan Altima 8,388 8,388 Nissan Total 8,388 8,388 Toyota Camry 31,341[17] 54,477 85,818 GS 450h 1,784[17] 1,645 3,429 Highlander 17,989[16] 31,485[17] 22,052 71,526 LS 600hL 937 937 Prius 5,562[11] 15,556[11] 20,119[11] 24,600[12] 53,991[13] 107,897[15] 106,971[17] 181,221 515,917 RX 400h 20,674[16] 20,161[17] 17,291 58,126 Toyota Total 5,562 15,556 20,119 24,600 53,991 146,560 191,742 277,623 735,753
Grand Total 17 9,350 20,282 36,035 47,600 85,199 212,711 255,636 352,274 1,019,104
Notes: (a) GM Sierra data include Chevrolet Silverado data.
(b) The GM Sierra total for 2006 was estimated on the basis of 2005 data, since published data were unavailable at the time of the analysis.
18
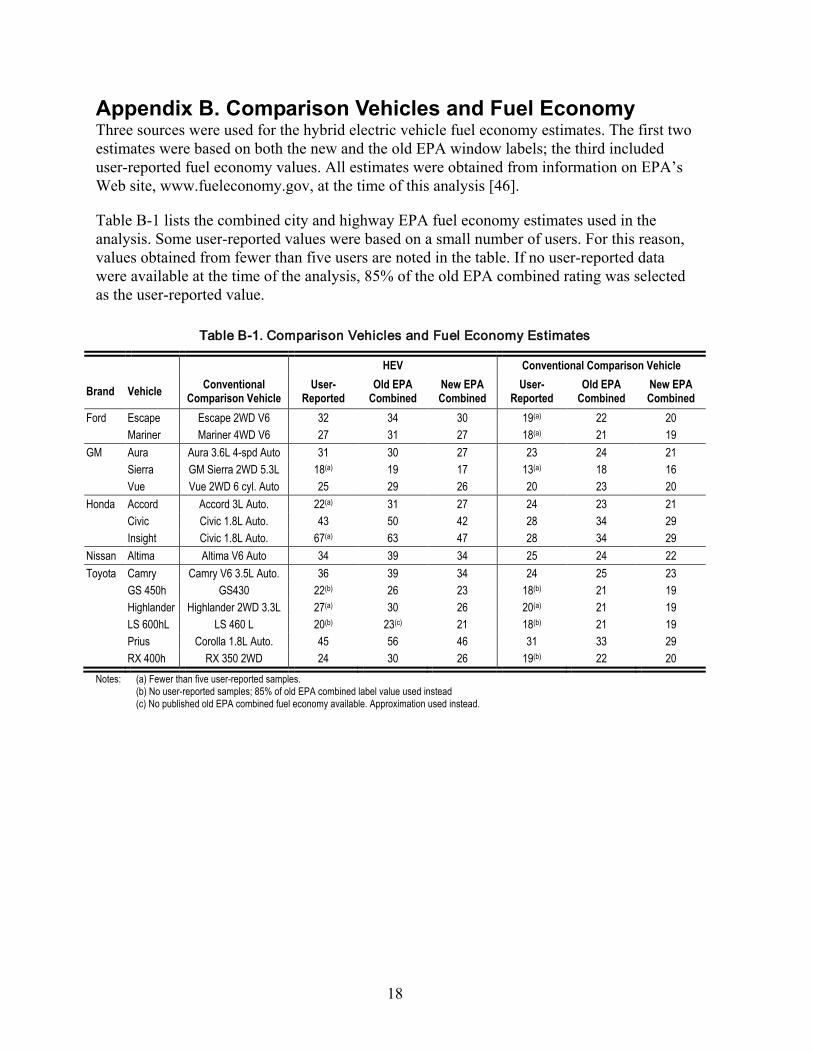
Appendix B. Comparison Vehicles and Fuel Economy Three sources were used for the hybrid electric vehicle fuel economy estimates. The first two estimates were based on both the new and the old EPA window labels; the third included user-reported fuel economy values. All estimates were obtained from information on EPA’s Web site, www.fueleconomy.gov, at the time of this analysis [46].
Table B-1 lists the combined city and highway EPA fuel economy estimates used in the analysis. Some user-reported values were based on a small number of users. For this reason, values obtained from fewer than five users are noted in the table. If no user-reported data were available at the time of the analysis, 85% of the old EPA combined rating was selected as the user-reported value.
Table B-1. Comparison Vehicles and Fuel Economy Estimates
HEV Conventional Comparison Vehicle
Brand Vehicle Conventional Comparison Vehicle
User-Reported
Old EPA Combined
New EPA Combined
User-Reported
Old EPA Combined
New EPA Combined
Ford Escape Escape 2WD V6 32 34 30 19(a) 22 20 Mariner Mariner 4WD V6 27 31 27 18(a) 21 19 GM Aura Aura 3.6L 4-spd Auto 31 30 27 23 24 21 Sierra GM Sierra 2WD 5.3L 18(a) 19 17 13(a) 18 16 Vue Vue 2WD 6 cyl. Auto 25 29 26 20 23 20 Honda Accord Accord 3L Auto. 22(a) 31 27 24 23 21 Civic Civic 1.8L Auto. 43 50 42 28 34 29 Insight Civic 1.8L Auto. 67(a) 63 47 28 34 29 Nissan Altima Altima V6 Auto 34 39 34 25 24 22 Toyota Camry Camry V6 3.5L Auto. 36 39 34 24 25 23 GS 450h GS430 22(b) 26 23 18(b) 21 19 Highlander Highlander 2WD 3.3L 27(a) 30 26 20(a) 21 19 LS 600hL LS 460 L 20(b) 23(c) 21 18(b) 21 19 Prius Corolla 1.8L Auto. 45 56 46 31 33 29 RX 400h RX 350 2WD 24 30 26 19(b) 22 20
Notes: (a) Fewer than five user-reported samples. (b) No user-reported samples; 85% of old EPA combined label value used instead (c) No published old EPA combined fuel economy available. Approximation used instead.
19
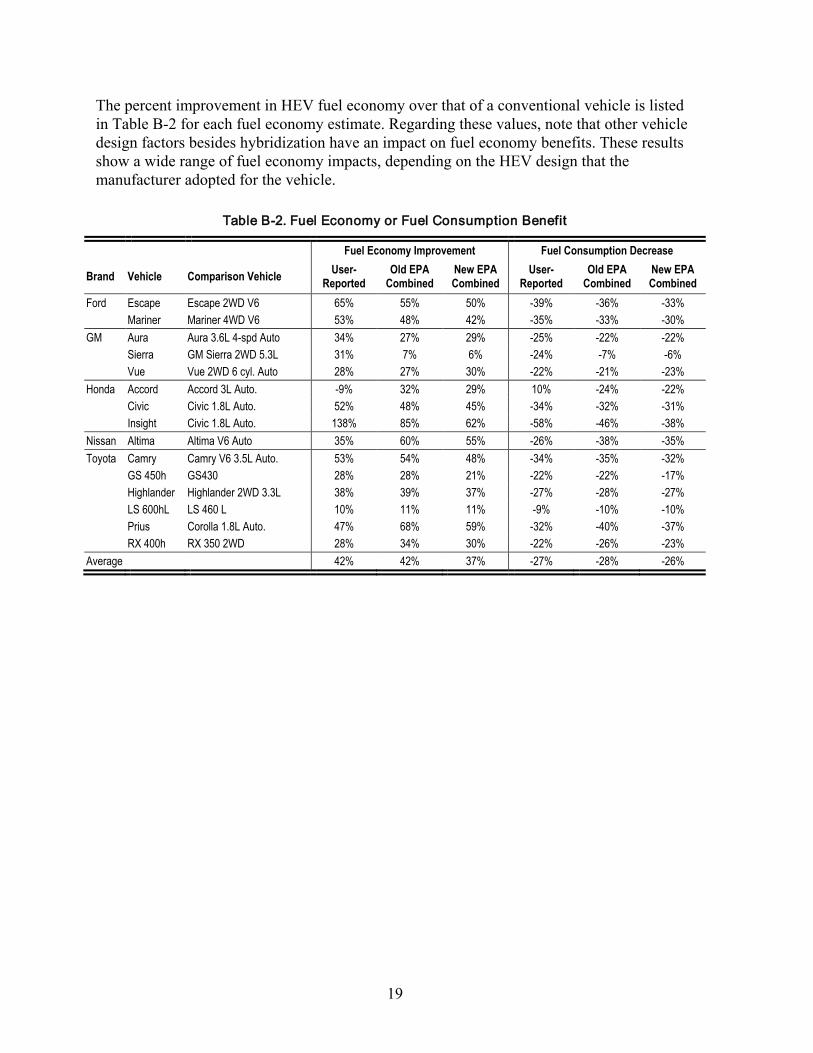
The percent improvement in HEV fuel economy over that of a conventional vehicle is listed in Table B-2 for each fuel economy estimate. Regarding these values, note that other vehicle design factors besides hybridization have an impact on fuel economy benefits. These results show a wide range of fuel economy impacts, depending on the HEV design that the manufacturer adopted for the vehicle.
Table B-2. Fuel Economy or Fuel Consumption Benefit
Fuel Economy Improvement Fuel Consumption Decrease
Brand Vehicle Comparison Vehicle User-Reported
Old EPA Combined
New EPA Combined
User-Reported
Old EPA Combined
New EPA Combined
Ford Escape Escape 2WD V6 65% 55% 50% -39% -36% -33% Mariner Mariner 4WD V6 53% 48% 42% -35% -33% -30% GM Aura Aura 3.6L 4-spd Auto 34% 27% 29% -25% -22% -22% Sierra GM Sierra 2WD 5.3L 31% 7% 6% -24% -7% -6% Vue Vue 2WD 6 cyl. Auto 28% 27% 30% -22% -21% -23% Honda Accord Accord 3L Auto. -9% 32% 29% 10% -24% -22% Civic Civic 1.8L Auto. 52% 48% 45% -34% -32% -31% Insight Civic 1.8L Auto. 138% 85% 62% -58% -46% -38% Nissan Altima Altima V6 Auto 35% 60% 55% -26% -38% -35% Toyota Camry Camry V6 3.5L Auto. 53% 54% 48% -34% -35% -32% GS 450h GS430 28% 28% 21% -22% -22% -17% Highlander Highlander 2WD 3.3L 38% 39% 37% -27% -28% -27% LS 600hL LS 460 L 10% 11% 11% -9% -10% -10% Prius Corolla 1.8L Auto. 47% 68% 59% -32% -40% -37% RX 400h RX 350 2WD 28% 34% 30% -22% -26% -23% Average 42% 42% 37% -27% -28% -26%
20
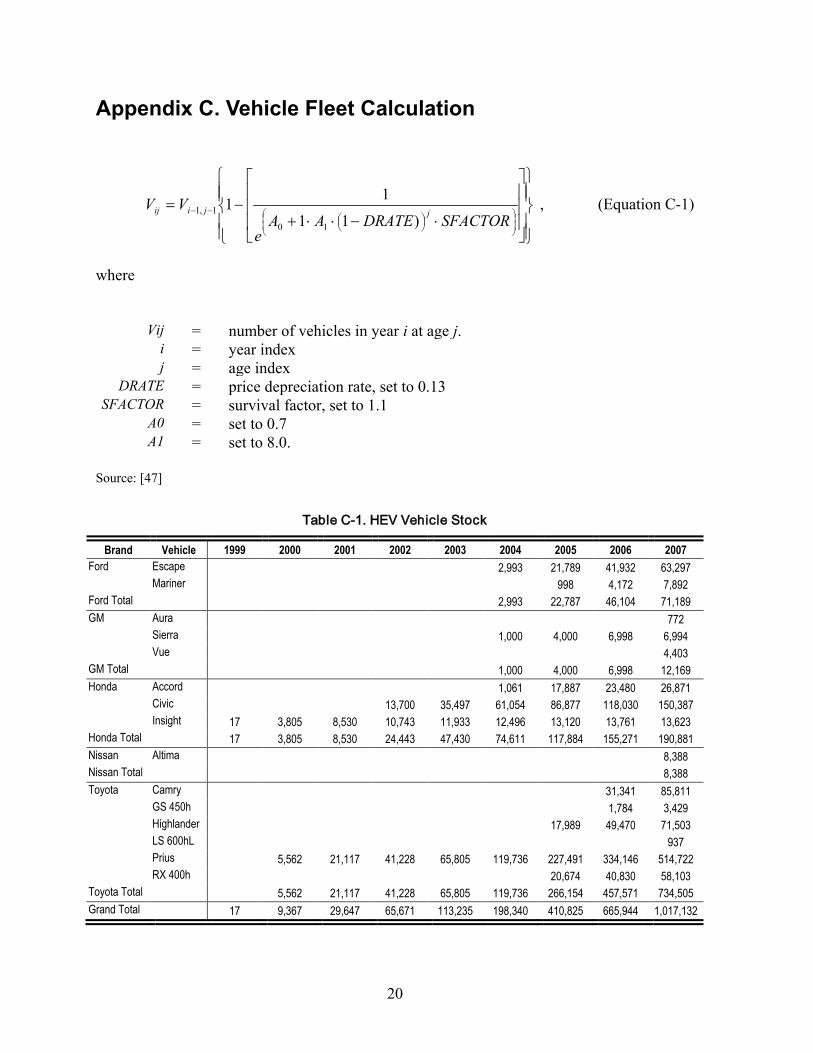
Appendix C. Vehicle Fleet Calculation
⋅−⋅⋅+−=
−−SFACTORDRATEAA
e
VVjjiij
)11
1110
1,1 , (Equation C-1)
where
Vij = number of vehicles in year i at age j. i = year index j = age index
DRATE = price depreciation rate, set to 0.13 SFACTOR = survival factor, set to 1.1
A0 = set to 0.7 A1 = set to 8.0.
Source: [47]
Table C-1. HEV Vehicle Stock
Brand Vehicle 1999 2000 2001 2002 2003 2004 2005 2006 2007 Ford Escape 2,993 21,789 41,932 63,297 Mariner 998 4,172 7,892 Ford Total 2,993 22,787 46,104 71,189 GM Aura 772 Sierra 1,000 4,000 6,998 6,994 Vue 4,403 GM Total 1,000 4,000 6,998 12,169 Honda Accord 1,061 17,887 23,480 26,871 Civic 13,700 35,497 61,054 86,877 118,030 150,387 Insight 17 3,805 8,530 10,743 11,933 12,496 13,120 13,761 13,623 Honda Total 17 3,805 8,530 24,443 47,430 74,611 117,884 155,271 190,881 Nissan Altima 8,388 Nissan Total 8,388 Toyota Camry 31,341 85,811 GS 450h 1,784 3,429 Highlander 17,989 49,470 71,503 LS 600hL 937 Prius 5,562 21,117 41,228 65,805 119,736 227,491 334,146 514,722 RX 400h 20,674 40,830 58,103 Toyota Total 5,562 21,117 41,228 65,805 119,736 266,154 457,571 734,505 Grand Total 17 9,367 29,647 65,671 113,235 198,340 410,825 665,944 1,017,132
21
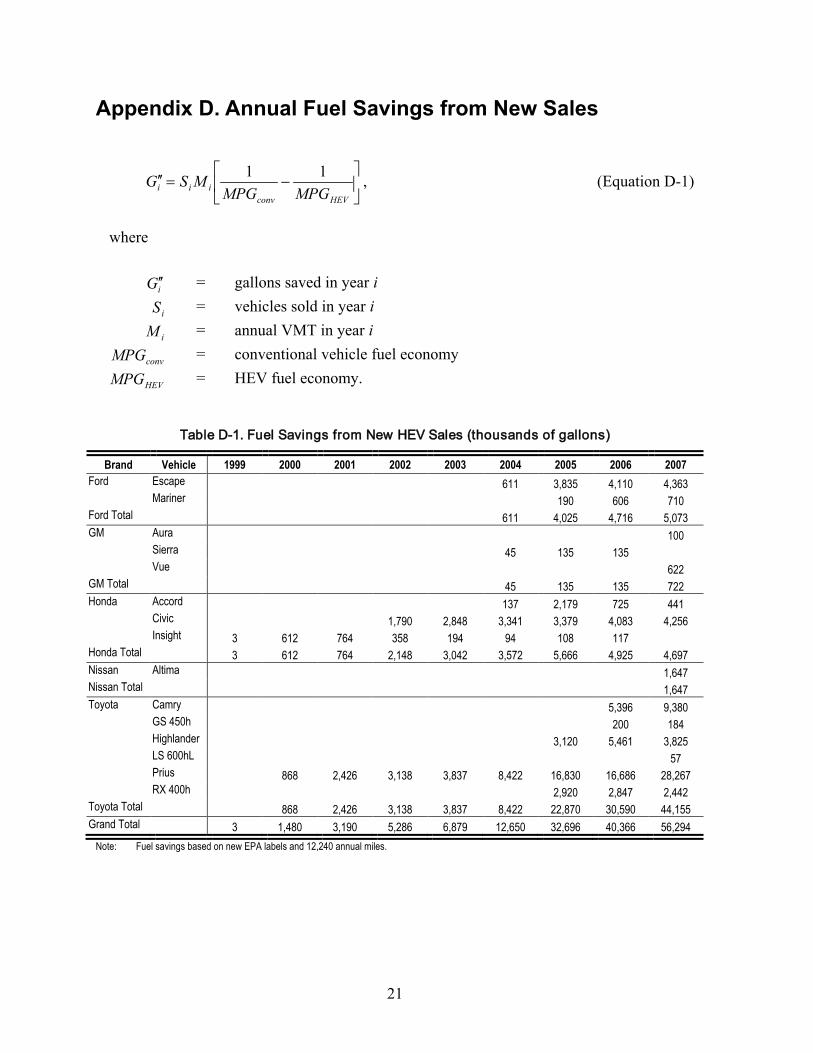
Appendix D. Annual Fuel Savings from New Sales
−=′′
HEVconviii MPGMPG
MSG 11 , (Equation D-1)
where
iG ′′ = gallons saved in year i
iS = vehicles sold in year i
iM = annual VMT in year i
convMPG = conventional vehicle fuel economy HEVMPG = HEV fuel economy.
Table D-1. Fuel Savings from New HEV Sales (thousands of gallons)
Brand Vehicle 1999 2000 2001 2002 2003 2004 2005 2006 2007 Ford Escape 611 3,835 4,110 4,363 Mariner 190 606 710 Ford Total 611 4,025 4,716 5,073 GM Aura 100 Sierra 45 135 135 Vue 622 GM Total 45 135 135 722 Honda Accord 137 2,179 725 441 Civic 1,790 2,848 3,341 3,379 4,083 4,256 Insight 3 612 764 358 194 94 108 117 Honda Total 3 612 764 2,148 3,042 3,572 5,666 4,925 4,697 Nissan Altima 1,647 Nissan Total 1,647 Toyota Camry 5,396 9,380 GS 450h 200 184 Highlander 3,120 5,461 3,825 LS 600hL 57 Prius 868 2,426 3,138 3,837 8,422 16,830 16,686 28,267 RX 400h 2,920 2,847 2,442 Toyota Total 868 2,426 3,138 3,837 8,422 22,870 30,590 44,155 Grand Total 3 1,480 3,190 5,286 6,879 12,650 32,696 40,366 56,294
Note: Fuel savings based on new EPA labels and 12,240 annual miles.
22
Appendix E. Annual Fuel Savings from Vehicle Fleet
−=′
HEVconvii MPGMPGMVG 11 , (Equation E-1)
where
iG′ = gallons saved in year i
iV = total hybrid vehicle stock in year i
iM = annual VMT in year i
convMPG = conventional vehicle fuel economy HEVMPG = HEV fuel economy.
Table E-1. Annual HEV Vehicle Stock Fuel Savings (thousands of gallons)
Brand Vehicle 1999 2000 2001 2002 2003 2004 2005 2006 2007 Ford Escape 611 4,445 8,554 12,913 Mariner 190 796 1,506 Ford Total 611 4,635 9,350 14,419 GM Aura 100 Sierra 45 180 315 315 Vue 622 GM Total 45 180 315 1,037 Honda Accord 137 2,317 3,041 3,480 Civic 1,790 4,637 7,976 11,350 15,419 19,647 Insight 3 615 1,379 1,737 1,929 2,020 2,121 2,224 2,202 Honda Total 3 615 1,379 3,527 6,566 10,133 15,788 20,684 25,329 Nissan Altima 1,647 Nissan Total 1,647 Toyota Camry 5,396 14,774 GS 450h 200 384 Highlander 3,120 8,580 12,402 LS 600hL 57 Prius 868 3,294 6,431 10,264 18,677 35,485 52,121 80,287 RX 400h 2,920 5,766 8,206 Toyota Total 868 3,294 6,431 10,264 18,677 41,525 72,063 116,110 Grand Total 3 1,483 4,673 9,958 16,830 29,466 62,128 102,412 158,542
Note: Fuel savings based on new EPA labels and 12,240 annual miles.
23
Appendix F. Cumulative Fuel Savings by Year
∑=
′=j
aiij GG , (Equation F-1)
where
iG′ = gallons saved in year i
jG = total gallons saved between years a and j.
Table F-1. Cumulative HEV Fuel Savings (thousands of gallons)
Brand Vehicle 1999 2000 2001 2002 2003 2004 2005 2006 2007 Ford Escape 611 5,056 13,610 26,523 Mariner 190 986 2,492 Ford Total 611 5,246 14,596 29,015 GM Aura 100 Sierra 45 225 540 855 Vue 622 GM Total 45 225 540 1,577 Honda Accord 137 2,454 5,495 8,975 Civic 1,790 6,427 14,403 25,753 41,172 60,819 Insight 3 618 1,997 3,734 5,663 7,683 9,804 12,028 14,230 Honda Total 3 618 1,997 5,524 12,090 22,223 38,011 58,695 84,024 Nissan Altima 1,647 Nissan Total 1,647 Toyota Camry 5,396 20,170 GS 450h 200 584 Highlander 3,120 11,700 24,102 LS 600hL 57 Prius 868 4,162 10,593 20,857 39,534 75,019 127,140 207,427 RX 400h 2,920 8,686 16,892 Toyota Total 868 4,162 10,593 20,857 39,534 81,059 153,122 269,232 Grand Total 3 1,486 6,159 16,117 32,947 62,413 124,541 226,953 385,495
Note: Fuel savings based on new EPA labels and 12,240 annual miles.
F1147-E(10/2008)
REPORT DOCUMENTATION PAGE Form Approved OMB No. 0704-0188
The public reporting burden for this collection of information is estimated to average 1 hour per response, including the time for reviewing instructions, searching existing data sources, gathering and maintaining the data needed, and completing and reviewing the collection of information. Send comments regarding this burden estimate or any other aspect of this collection of information, including suggestions for reducing the burden, to Department of Defense, Executive Services and Communications Directorate (0704-0188). Respondents should be aware that notwithstanding any other provision of law, no person shall be subject to any penalty for failing to comply with a collection of information if it does not display a currently valid OMB control number. PLEASE DO NOT RETURN YOUR FORM TO THE ABOVE ORGANIZATION. 1. REPORT DATE (DD-MM-YYYY)
March 2009 2. REPORT TYPE
Technical Report 3. DATES COVERED (From - To)
4. TITLE AND SUBTITLE
Fuel Savings from Hybrid Electric Vehicles 5a. CONTRACT NUMBER
DE-AC36-08-GO28308
5b. GRANT NUMBER
5c. PROGRAM ELEMENT NUMBER
6. AUTHOR(S) K. Bennion and M. Thornton
5d. PROJECT NUMBER NREL/TP-540-42681
5e. TASK NUMBER FC08.2000
5f. WORK UNIT NUMBER
7. PERFORMING ORGANIZATION NAME(S) AND ADDRESS(ES) National Renewable Energy Laboratory 1617 Cole Blvd. Golden, CO 80401-3393
8. PERFORMING ORGANIZATION REPORT NUMBER NREL/TP-540-42681
9. SPONSORING/MONITORING AGENCY NAME(S) AND ADDRESS(ES)
10. SPONSOR/MONITOR'S ACRONYM(S) NREL
11. SPONSORING/MONITORING AGENCY REPORT NUMBER
12. DISTRIBUTION AVAILABILITY STATEMENT National Technical Information Service U.S. Department of Commerce 5285 Port Royal Road Springfield, VA 22161
13. SUPPLEMENTARY NOTES
14. ABSTRACT (Maximum 200 Words) Since they were introduced in the United States in 1999, hybrid electric vehicles (HEVs) have saved nearly 230 million gallons (5.5 million barrels) of fuel. The National Renewable Energy Laboratory (NREL) calculated the fuel savings resulting from using HEVs by comparing their fuel use with that of similar conventional vehicles, which closely matched the hybrid as to size, weight, performance, and vehicle manufacturer. NREL estimated the total HEVs in use for a given year (vehicle stock) using available sales data and Argonne National Laboratory’s VISION model. Though fuel savings are small in relation to the total amount used in light-duty U.S. vehicles, this is a big step forward in reducing imported fuel for U.S. transportation needs and improving vehicle efficiency. Hybrid electric vehicles represent a small but growing group of vehicles in the United States. Applying hybrid technology to large cars, minivans, sport utility vehicles, and light-duty trucks will help to increase fuel savings from HEVs.
15. SUBJECT TERMS fuel economy; fuel savings; hybrid vehicles; hybrid electric vehicles; hybrid electric vehicle sales; HEVs
16. SECURITY CLASSIFICATION OF: 17. LIMITATION OF ABSTRACT
UL
18. NUMBER OF PAGES
19a. NAME OF RESPONSIBLE PERSON a. REPORT
Unclassified b. ABSTRACT Unclassified
c. THIS PAGE Unclassified 19b. TELEPHONE NUMBER (Include area code)
Standard Form 298 (Rev. 8/98) Prescribed by ANSI Std. Z39.18