Embed Size (px)
Citation preview

Justin Huntington
Assistant Research Professor, DRI
Partners and Collaborators:
Charles Morton, DRI
Rick Allen, U of Idaho
Adam Sullivan, Nevada Division of Water Res.
Forest Melton, NASA Ames, CSUMB
Mark Spears and David Eckhardt, Reclamation
Tony Morse, Spatial Analysis Group

What is the majority
of water being used
for in the West?
West Wide ~80-85%
is used for
Agriculture

Western States are dry
Western States are growing fast
Most urbanized states in the nation (most of states’
population living in cities… i.e. Las Vegas)
Low PPT + High Growth Rates in Urban Areas = Water
Transfers from Agriculture and Natural Groundwater
Discharge Areas to Urban Areas

Big need to estimate potential consumptive use.
Example:
Question: How much water is needed to grow a healthy crop?
Big need to estimate actual historical agricultural
consumptive use. Example:
Question: How much water can actually be realized over the long term
for a potential water transfer if crops are fallowed?

Potential Consumptive Use • ET that occurs under optimal conditions
• Assumes crop is well watered
• Derived from reference ET
• Traditional ETr * Kc approach
• Crop types and planting and harvest dates need specified
• Primary use is for irrigation design, scheduling, water rights, and
water transfers
Actual Consumptive Use • ET that actually occurs
• Can be very different from the potential consumptive use due to water
limitations, stress, management, etc.
• Primary use is for water budget estimation, modeling, water rights,
water transfers, and compliance

In Nevada, the limit of irrigation water right
allowed for transfer to a new use is the mean
annual “Net Irrigation Water Requirement”
AKA “Potential Net Consumptive Use”
NIWR = ETact – (PPT – RO – Dp)
Irrigation water rights (and past transfers to
municipal) range from 3ft – 5ft (North – South)
New Penman-Monteith based NIWR
estimates range from 1.6ft – 6.1ft
Provides water right holders information on
irrigation requirements, and water rights
potentially available for transfer
This approach assumes perfect crops and
water supply, requires estimates of planting
and harvest dates using thermal units or
static dates, and crop types and acreages
must be known to compute volumes (not so
with remote sensing)
Huntington and Allen, 2010

Remote sensing using Landsat is likely the only way to estimate the “actual
consumptive use” at field scales over large areas
Recent Landsat Science News Clip (April 12, 2010) - Landsat can be an Impartial
Arbitrator in Water Conflict Issues – Article highlights Nevada Governor Brian
Sandoval’s thoughts, and DRI’s work in Nevada and California
“Access to accurate ET maps produced using a widely accepted approach allows
water resource managers to assess water use on a field by field basis in an objective
way where everyone is treated equally.”
“With equality of data for everyone, disputes over data or lack of data are reduced,
which is a big change in how water conflicts have been dealt with in the past.”

Vegetation Indices • Relies on reflected light of near infrared and red
wavelengths • Plants reflect near infrared light and absorb red light
NDVI = (NIR – Red) / (NIR + Red)
Energy Balance • Largely relies on thermal infrared
• Basic premise - Evaporation consumes heat
thereby cooling the surface

Transform NDVI into
fraction of cover, and
from fraction of
cover to crop
coefficient (Kc)
ET is computed as
ET = ETref * Kc
Approach has
several advantages
over others, and
some disadvantages
Courtesy of Forrest Melton, NASA Ames

Calculates ET as a “residual’ of the energy balance METRIC - Mapping Evapotranspiration at high Resolution using Internalized
Calibration (Allen et al., 2007)
SEBAL – Surface Energy Balance Algorithm for Land (Bastiaanssen, et al., 1998) METRIC won Harvard’s Best Innovations in American Government Award in 2009
EB approach is supported by the Western States Water Council and Western Governors
Association
ET = R - G - H n
R n
G (heat to ground)
H (heat to air) ET The energy
balance
includes all
major sources
(Rn) and
consumers (ET,
G, H) of energy
Basic Truth:
Evaporation
Consumes
Energy
(radiation from sun and sky)

Agriculture cooler due to “evaporative cooling” – energy consuming!
Surface Temperature (Deserts ~ 125oF – Agriculture ~80oF)
Carson Valley,
CA / NV
8/15/2009
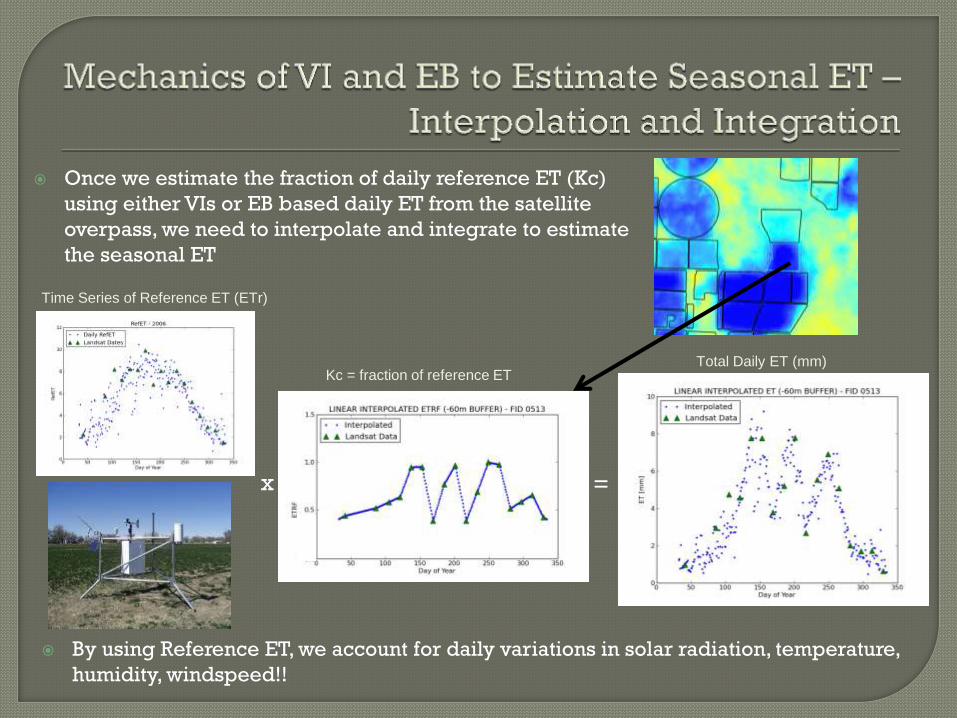
By using Reference ET, we account for daily variations in solar radiation, temperature,
humidity, windspeed!!
Time Series of Reference ET (ETr)
x =
Once we estimate the fraction of daily reference ET (Kc)
using either VIs or EB based daily ET from the satellite
overpass, we need to interpolate and integrate to estimate
the seasonal ET
Kc = fraction of reference ET Total Daily ET (mm)

Pros: We can ‘see’ impacts on ET caused by:
evaporation from bare soil short and long term water shortage disease crop variety cropping dates salinity management
Combines strengths of EB with accuracy of ground based reference ET calculations which “anchors” the energy balance surface and provides “reality” and accuracy to the product
Cons: Is fairly time consuming Takes a human to control Is currently not a fully automated process

EB “sees” evaporation from soil and marsh areas where as reflectance data does not
EB “sees” stress where NDVI has a hard time with acute stress
Energy balance gives us “actual” ET from many
different land uses
Mason Valley CA / NV, 7/25/2008
False Color Infrared Evapotranspiration (mm/d)

Pros:
Relatively accurate over a season and over large areas
Rapid processing Easy automation Can be easily calibrated
Cons: Can not directly see bare soil
evaporation or mixed open water riparian ET
Does not perform well seeing short term water stress
Difficulties estimating ET in riparian areas due to stomatal control reducing ET (Glenn, Nagler, et al.)
Is currently not a fully automated process

“basal” Kc
“mean” Kc
0.0
0.2
0.4
0.6
0.8
1.0
Cro
p C
oe
ffici
en
t (E
TrF
)
0.0 0.2 0.4 0.6 0.8 1.0
NDVI
3 J une 19 June 21 July
717 Potato Fields,
2000
“basal” Kc
“mean” Kc
Wet fields (wet soil at partial cover)
Courtesy of
Rick Allen,
U of Idaho

0
0.2
0.4
0.6
0.8
1
1.2
0 0.2 0.4 0.6 0.8 1
NDVI as
K cr
Alfalfa Beans Beet Corn Potato-S Potato-L Sgrain Wgrain
K cr = 1.17 NDVI as + 0.05 R 2 = 0.94
Kc
Well Watered Crops in Magic Valley, ID
X = NDVI Y = EB derived Kc
averaged over all field types for all images dates for 2000
Scatter among fields
collapses and NDVI EB derived Kc relationship not too bad
Courtesy of
Rick Allen,
U of Idaho

Courtesy of Forrest Melton, NASA Ames, CSUMB
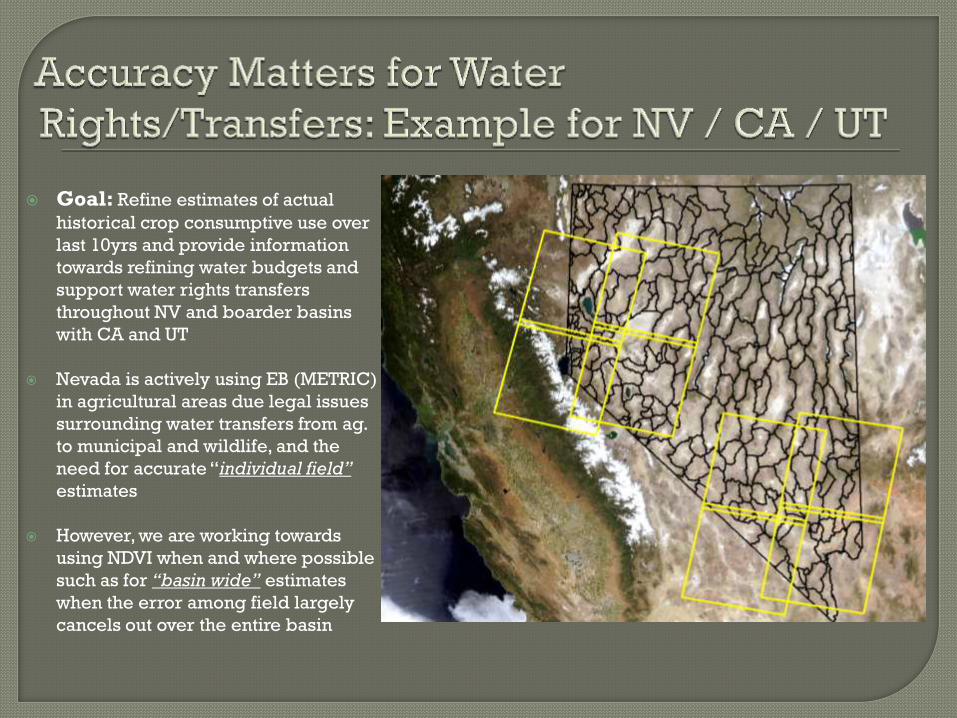
Goal: Refine estimates of actual
historical crop consumptive use over
last 10yrs and provide information
towards refining water budgets and
support water rights transfers
throughout NV and boarder basins
with CA and UT
Nevada is actively using EB (METRIC)
in agricultural areas due legal issues
surrounding water transfers from ag.
to municipal and wildlife, and the
need for accurate “individual field”
estimates
However, we are working towards
using NDVI when and where possible
such as for “basin wide” estimates
when the error among field largely
cancels out over the entire basin

Nevada water law allows for
existing water rights to be
transferred to a new location
and/or use
Example: Export groundwater
irrigation water rights out of a
basin and use it for municipal
purposes in a basin needing
the water
~$10K per ac-ft ~$70,000 per ac-ft in 2007
One 125 acre center pivot @ 4ac-ft/acre
= $5,000,000 !! per center pivot = 35,000,000 !! per center pivot

A VI / EB combination
approach would be attractive
for the Colorado River basin
for estimating tributary
basin scale ET in an
automated fashion and in
near real time
Proposition:
Derive a NDVI Kc relationship
from EB
Apply the NDVI Kc relationship
in an automated mode
Recalibrate the relationship
every couple of years due to
changes in crop varieties and
management
Apply EB when individual field
scale estimates are needed for
water rights transfers / legal and
compliance issues
Wyo
Colo Utah
NM AZ
Overlays of Landsat path and rows over the upper Colorado River Basin
24 total path / rows
100 x 100 miles per path / row
Courtesy of Rick
Allen, U of Idaho

ET based on Landsat 30 m ET based on MODIS 250 m
Bell Rapids Irrigation District, Idaho, 2002
Regardless of VI or EB
Field Scale (30-100m) is a Must!
Courtesy of Rick Allen, U of Idaho

Automatic Landsat cloud detection (ACCA & FMASK) is not all that accurate… misses thin clouds and other types… masks must be manually digitized and eventually gap filled using like pixels or other image dates
Regardless of VI or EB
Cloud Mitigation is a Must!
Clouds
Clouded areas removed
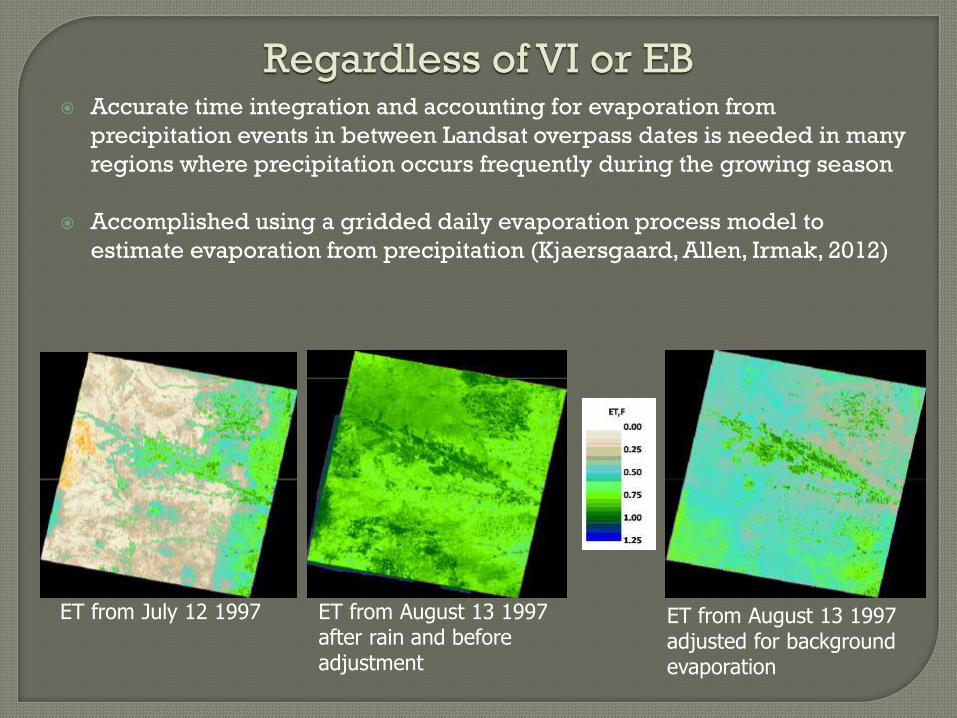
Regardless of VI or EB Accurate time integration and accounting for evaporation from
precipitation events in between Landsat overpass dates is needed in many
regions where precipitation occurs frequently during the growing season
Accomplished using a gridded daily evaporation process model to
estimate evaporation from precipitation (Kjaersgaard, Allen, Irmak, 2012)
ET from August 13 1997 after rain and before adjustment
ET from August 13 1997 adjusted for background evaporation
ET from July 12 1997

Accurate reference ET is a must for
time integration of daily ET maps
DRI and U of Idaho have recently
developed semi-automated
algorithms and tools to QAQC
We have just completed QAQC
compiled accurate reference ET
for all agricultural stations that
exist in and around the Colorado
River Basin (CRB)!
Currently using QAQC’d data to
estimate potential consumptive use
using the Penman-Monteith across
the CRB (and Western States,
funded through Reclamation)
Aim to utilize these QAQC’d data
for remote sensing purposes in the
CRB in the near future
Regardless of VI or EB
Accurate Ag.Weather Data is a Must!

Regardless of VI or EB
Accurate Ag.Weather Data is a Must!
Example of QAQC process of Solar Radiation at UC Davis CIMIS station • Base adjustments on ratios between theoretical clear sky solar radiation and top percentiles of measured
data

Regardless of VI or EB
Accurate Ag. Weather Data is a Must!
Example of QAQC process of Max. Daily RH% at UC Davis CIMIS station
• Base adjustments on ratios between theoretical clear sky solar radiation and top percentiles of measured
data M
ax D
aily
RH
%
Ma
x D
aily
RH
%
Before Correction – Sensor Drift
After Correction – No Sensor Drift

DRI recently coded
METRIC in Python (open
source open platform
software)
Enhanced productivity,
reduced cost, and reduced
time required to estimate
ET
Working with NASA Ames
(Forrest Melton) to
implement and test a
automated version of
METRIC Python for the
Central Valley
• Funded through
Nevada EPSCoR NASA
Space Grant
for i in range(6):
u*(u, z, zom, psi_z3)
rah(z, psi, u*, ex_res)
l(dt, u*, Ts, rah)
psi_z3(l, z3)
psi_z2(l, z2)
psi_z1(l, z1)
if stable(): break
Traditional sensible heat flux METRIC model in Erdas
Clipped Python version of
METRIC sensible heat flux
model


Daily error is not bad when considering the error in measured daily ET is ~ +/- 20%
Whiskers on X = +/- 12% USGS estimated uncertainty in measured ET, Y = +/- 95%
confidence interval of 100 automated estimates of ET using different input parameters
Over a season the error in daily estimates largely cancels out

Which way are the pivots
moving?…pretty cool!
Evaporation!!

Several major recent evidentiary exchanges and subsequent water right rulings
in Nevada that impact water resources of the CRB have heavily relied on Landsat
derived ET from phreatophytes
Why? - The need to prove the hydrographic basins Perennial Yield
Nevada Water Law - “Perennial yield is the maximum amount of groundwater
that can be salvaged each year over the long term without depleting the
groundwater reservoir. The perennial yield cannot be more than the natural
recharge of the groundwater reservoir and is usually limited to the maximum
amount of natural discharge” (i.e. groundwater mining is not allowed)
Capturing the natural groundwater discharge and putting this water to
beneficial use is the basis for groundwater appropriation in many Western
States

In many Great Basin hydrographic areas,
recharge is largely naturally discharged by
via ET by phreatophyte vegetation which tap
the shallow aquifer
• Common phreatophytes are
greasewood, salt grass, sagebrush,
cotton woods, willows
Easier to estimate groundwater ET than
groundwater recharge, so for decades,
groundwater ET from phreatophyte areas
has been used to help define perennial yield

Relating annual ET to remotely sensed vegetation indices is advantageous
• Approach: Upscale point measurements of annual ET to the total discharge area using peak
seasonal VIs
Compiled data from 26 flux towers for a total of 40 site years
Developed empirical function using EVI and 40 flux station years of ET data(26 flux sites multiple
years)

Computed Landsat derived EVI
from pixels around ET sites
Developed function that is
normalized (ET*) to transfer from
one basin to another by accounting
for ETo and PPT
Computed 90% confidence and
prediction intervals to assess
uncertainty
The Nevada State Engineers Office
is actively utilizing this approach to
independently asses expert
evidence and provide alternative
estimates that are bounded by
measurements, and that have a
measure of uncertainty
PPTETo
PPTETaET
*
Beamer et al., (2012)

Landsat scale resolution (30-60m) is critical for
these types of applications, as many basins and
phreatophyte areas are small and highly
variable Beamer et al., (2012)

Field scale (30-60m) resolution ET mapping is, and will become, more
and more critical for water accounting as supplies decline and demands
increase
The use of Landsat for computing EB and VI derived ET separately, and in
combination, provide robust solutions now for water and ecological
management needs
Things to invest in to improve accuracy and reduce cost:
Automation of EB and VI based ET estimates, improved time integration,
cloud, and gap filling
Representative weather station data for computing reference ET (not
nearly enough quality weather station data to use, however people
demand estimates of ET that are accurate!)
Gridded reference ET and potential consumptive use estimates at < 1Km
resolution to provide consistent estimates across all Western States
Buoy weather station network for estimating open water evaporation
Landsat 9

Stampede Reservoir, CA, Truckee River Basin

Further development and application of VIs and EB, traditional ET
approaches, and future instillation and maintenance of weather stations,
will provide the ability to estimate historical actual and potential
consumptive use using “the best available science”
• refine basin water budgets
• hydrologic and ecological modeling
• water rights transfers and compliance
• pumpage/crop/water use inventories
• water leasing agreements
• negotiation and hopefully not litigation
Water Rights Polygons Seasonal ET

Questions?
Contact Information
775-673-7670
Many thanks to:
Nevada Division of Water Resources
USGS
Reclamation
NASA Ames
Cal. State University, Monterey Bay
Truckee River Operating Agreement Staff
University of Idaho
Spatial Analysis Group
Landsat Water Mapping Inc.
Winnemucca Lake (Truckee River Basin)