Embed Size (px)
Citation preview
7/29/2019 NDVI Case Study
http://slidepdf.com/reader/full/ndvi-case-study 1/17
1
Monitoring Agricultural Biomass Using NDVI Time Series
Principal Investigator: Dorit Gross
Food and Agriculture Organization of the United Nations (FAO)
Rome, 2005
1 Introduction
In early 2000 the worst floods in nearly half a century ravaged parts of southern Africa, while
several countries within the Nile basin were seriously affected by prolonged droughts. During
the spring of 2000 regions of East Africa and the Great Lakes faced severe food shortages as a
result of low rainfall and drought conditions, civil conflicts and below-average harvest in the
preceding 1999/2000 season. Below normal amounts of rainfall were forecasted for parts of
East Africa and a greater critical food security situation was expected (FAO, 2001).
The following study was designed to monitor the development of vegetation biomass
for different areas in the Nile basin during the 2000 growing season. Time series of
Normalized Difference Vegetation Index (NDVI) images were used for the study, as NDVI
images have been proven to be a powerful tool to monitor biomass growth during the last
dekad (Minamiguchi, 2005). NDVI, which can be directly calculated from satellite data, is
related to vegetation canopy characteristics such as biomass and percentage of vegetation
cover and is representative of plant photosynthetic efficiency, and fluctuations due to changes
in meteorological and environmental parameters. NDVI images allow agricultural managers
to analyse vegetation conditions for all season from NDVI/vegetation maps, NDVI curves and
figures that anticipate major variations in productivity and potential harvest (Biard and
Lepoutre). In addition, low resolution sensors, like NOAA’s AVHRR and Spot’s Vegetation
instrument, provide NDVI images on a dekadal basis and allow an up-to-date assessment of
the current growing condititions.
Numerous techniques have been developed to analyse NDVI data and this study, willuse NDVI difference images and NDVI time series charts to assess the growing conditions in
2000. While difference images show the spatial distribution of plant growth anomalies, NDVI
time series charts help to understand the development of vegetation on a long-term basis.
7/29/2019 NDVI Case Study
http://slidepdf.com/reader/full/ndvi-case-study 2/17
2
2 Study areas
Agriculture plays an integrated role in
most areas of the Nile basin. Monitoring
the annual growing cycle using EarthObservation (EO) data allows the
detection of erratic vegetation anomalies
between years but also the detection of
possible trends in biomass change.
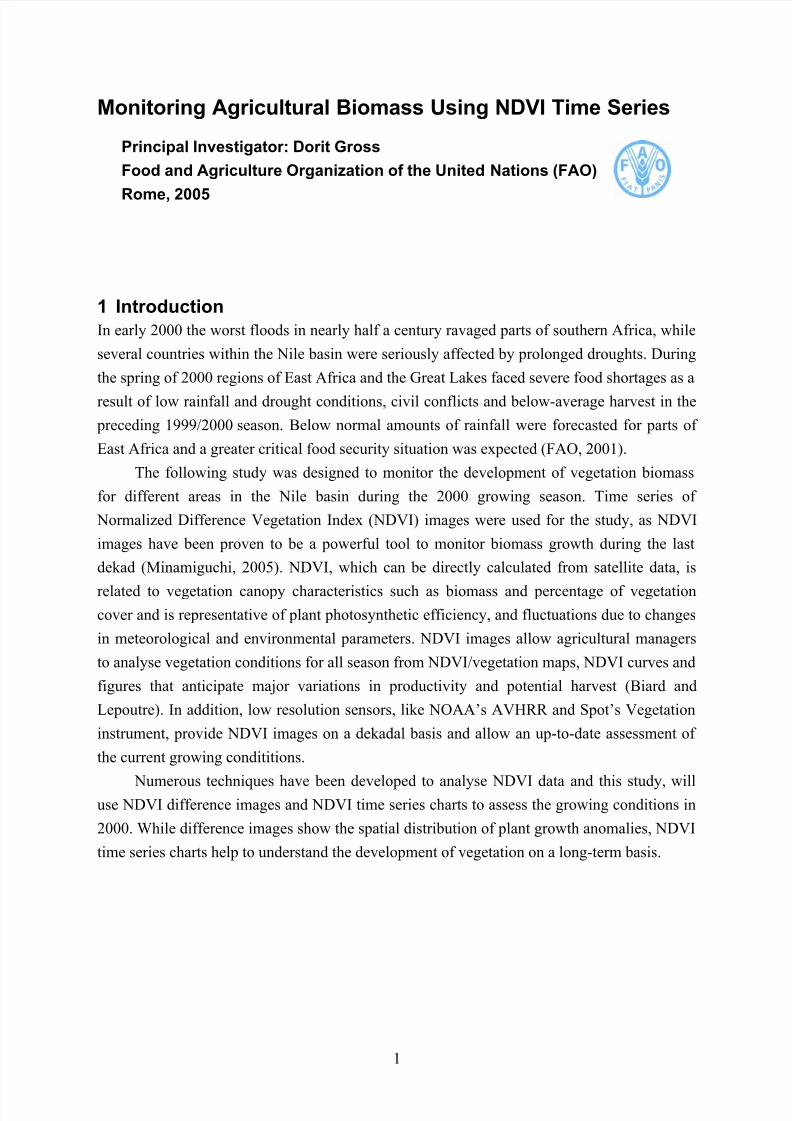
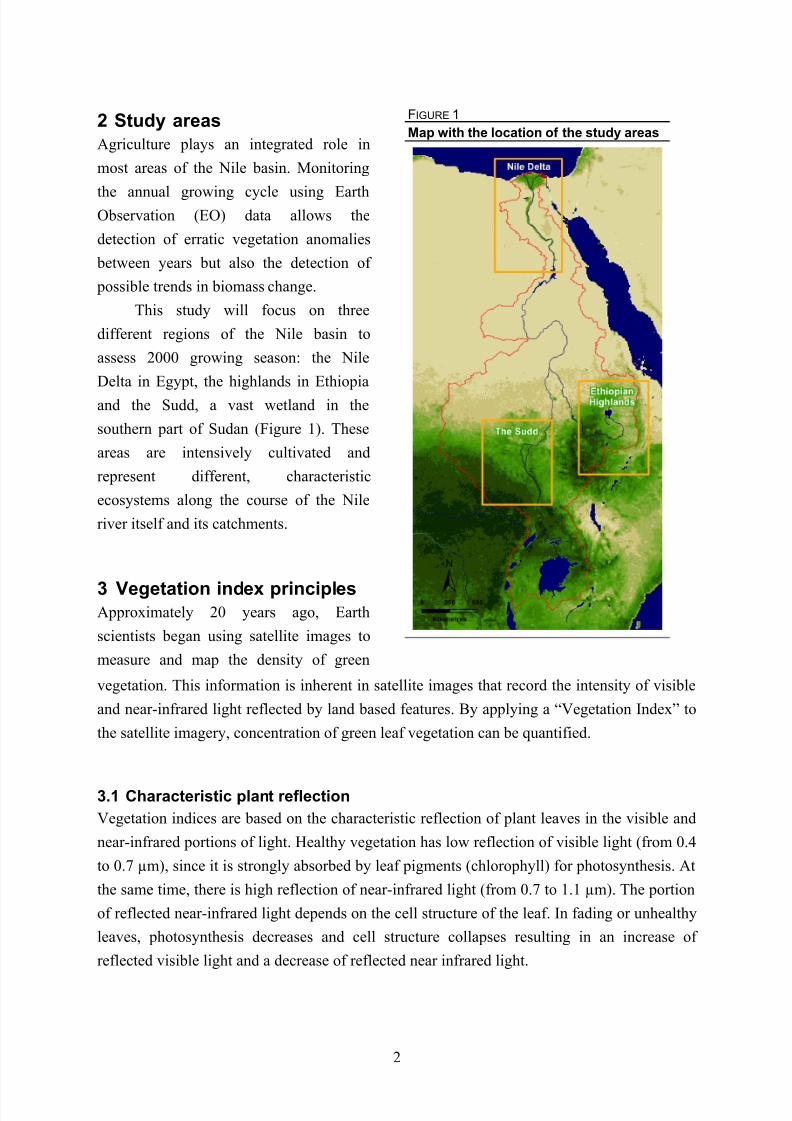
This study will focus on three
different regions of the Nile basin to
assess 2000 growing season: the Nile
Delta in Egypt, the highlands in Ethiopia
and the Sudd, a vast wetland in the
southern part of Sudan (Figure 1). These
areas are intensively cultivated and
represent different, characteristic
ecosystems along the course of the Nile
river itself and its catchments.
3 Vegetation index principlesApproximately 20 years ago, Earth
scientists began using satellite images to
measure and map the density of green
FIGURE 1
Map with the location of the study areas
vegetation. This information is inherent in satellite images that record the intensity of visible
and near-infrared light reflected by land based features. By applying a “Vegetation Index” to
the satellite imagery, concentration of green leaf vegetation can be quantified.
3.1 Characteristic plant reflection
Vegetation indices are based on the characteristic reflection of plant leaves in the visible and
near-infrared portions of light. Healthy vegetation has low reflection of visible light (from 0.4
to 0.7 µm), since it is strongly absorbed by leaf pigments (chlorophyll) for photosynthesis. At
the same time, there is high reflection of near-infrared light (from 0.7 to 1.1 µm). The portion
of reflected near-infrared light depends on the cell structure of the leaf. In fading or unhealthy
leaves, photosynthesis decreases and cell structure collapses resulting in an increase of
reflected visible light and a decrease of reflected near infrared light.

7/29/2019 NDVI Case Study
http://slidepdf.com/reader/full/ndvi-case-study 3/17
3
3.2 Calculating NDVI
NDVI images are obtained by calculating the ratio between
the visible (VIS) and near-infrared (NIR) bands of the
satellite image. This emphasizes the characteristics and thedifferent statuses of plant vigor and density even further.
Mathematically written, the equation is as follows:
VIS NIR
VIS NIR NDVI
+
−=
NDVI values are always in between –1 and +1, where
higher values represent more vigorous and healthy
vegetation. Very low values (0.1 and lower) correspond to
barren areas of rock, sand and snow. Moderate values (0.2
to 0.3) indicate shrub and grassland, while temperate and
tropical rainforests are represented by high NDVI values
(0.6 to 0.8).
4 Method
While NDVI difference images show the spatial distribution
of plant growth anomalies, the NDVI time series charts help
to understand the development of vegetation on a long-term
basis. The basic concepts of both techniques are introduced
in the following section.
4.1 NDVI difference images
NDVI difference images easily track changes in the amount
of biomass for a particular period relative to the historical
average or a previous year (Minamiguchi, 2005). Thus thetechnique highlights areas with comparatively reduced or
increased plant growth.
The NDVI difference image ( NDVI diff ) between two
time periods is calculated by subtracting the NDVI image of
the earlier time period ( NDVI 1) from the time period of
interest ( NDVI 2):
NDVI diff = NDVI 2 – NDVI 1
FIGURE 2
NDVI image received fromthe Spot Vegetation
instrument. The NDVIimage has been color coded. Bare land isshown in ocher and theintensity of green tonesincreases as more vigor the vegetation cover is.

7/29/2019 NDVI Case Study
http://slidepdf.com/reader/full/ndvi-case-study 4/17
4
Often average images are favored to monitor vegetation anomalies because these
images normalize annual variations in plant growth. Thus, average images represent the
expected growing cycle. The comparison between the year of interest and the historical
average allows for the identification of actual anomalies rather than erratic changes between
two single years.
4.2 NDVI time series charts
While NDVI difference images monitor the spatial distribution of vegetation anomalies for a
selected time period, NDVI time series charts are an efficient means to monitor vegetation
biomass in a defined area (zone) over a longer period of time (Minamiguchi, 2005). This
approach extracts zonal NDVI average values from each image from the time series and
visualizes these values as a chart. This annual graph can be compared to an average trend
calculated from a historical archive. Vegetation anomalies can be detected and evaluated
whether they are of erratic kind or whether are aligned in a trend of long-term change.
The zones, for which average NDVI values are calculated, can represent crop areas,
administrative units or areas with similar spatial and temporal characteristics (Minamiguchi,
2005; Snijders et al., 2002). Following the last approach, the Food and Agriculture
Organization (FAO) recently classified an extensive archive of Global Area Coverage (GAC)
NDVI images to create homogenous zones for the whole African continent. The analysis
resulted in the generation of approximately 400 zones with homogenous spatial variability
and temporal development. In addition, these zones are country based and they are aligned to
geographic features (Snijders et al., 2002). In the present study, the calculation of NDVI
average values is based on these African zones.
5 Dataset
For this study, monthly NDVI images and monthly average images were selected to monitor
the agricultural biomass in the Nile basin. These selected images consisted of Global Area
Coverage (GAC) NDVI images acquired by the AVHRR sensor with a spatial resolution of
7.6km, onboard the NOAA satellite.
The Food and Agriculture Organization of the United Nations (FAO) holds an extensive
archive of GAC NDVI images. Since 1982, new images are added to the archive every 10
days. Monthly NDVI images, representing the maximum NDVI value per pixel measured
during the month, are frequently computed from incoming dekadal images. In addition,
dekadal and monthly average images are generated at regular intervals from the archive. Such
a database is a valuable source of information for an immediate and up-to-date assessment of
vegetation development, and also for the long-term monitoring of possible biomass changes.
7/29/2019 NDVI Case Study
http://slidepdf.com/reader/full/ndvi-case-study 5/17
5
6 Results
Based on the GAC archive, NDVI difference images and NDVI time series charts were
generated for three different regions in the Nile basin. Difference images were calculated for
the ‘seeding’, ‘peak’ and ‘harvest’ season. In addition, NDVI charts were generated to assess
vegetation anomalies during the 2000 growing season in context with the long-term
development of biomass in the area.
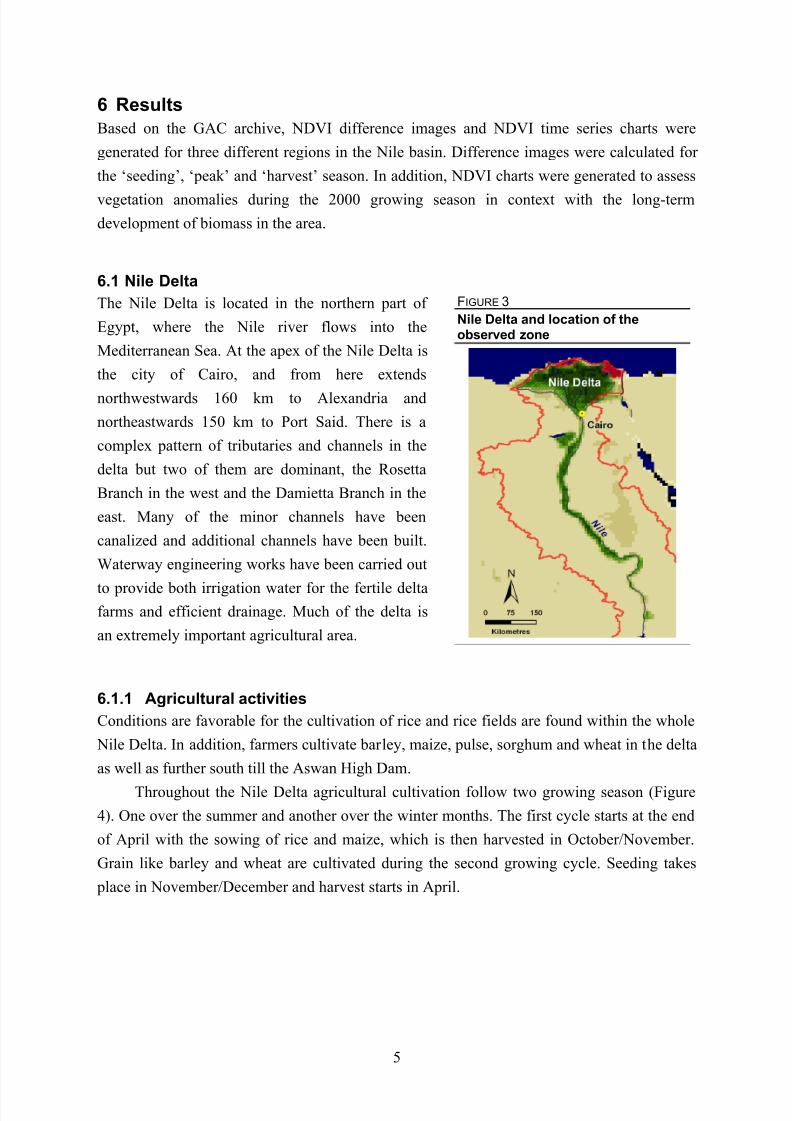
6.1 Nile Delta
The Nile Delta is located in the northern part of
Egypt, where the Nile river flows into the
Mediterranean Sea. At the apex of the Nile Delta is
the city of Cairo, and from here extends
northwestwards 160 km to Alexandria and
northeastwards 150 km to Port Said. There is a
complex pattern of tributaries and channels in the
delta but two of them are dominant, the Rosetta
Branch in the west and the Damietta Branch in the
east. Many of the minor channels have been
canalized and additional channels have been built.
Waterway engineering works have been carried out
to provide both irrigation water for the fertile deltafarms and efficient drainage. Much of the delta is
an extremely important agricultural area.
FIGURE 3
Nile Delta and location of theobserved zone
6.1.1 Agricultural activities
Conditions are favorable for the cultivation of rice and rice fields are found within the whole
Nile Delta. In addition, farmers cultivate barley, maize, pulse, sorghum and wheat in the delta
as well as further south till the Aswan High Dam.
Throughout the Nile Delta agricultural cultivation follow two growing season (Figure
4). One over the summer and another over the winter months. The first cycle starts at the end
of April with the sowing of rice and maize, which is then harvested in October/November.
Grain like barley and wheat are cultivated during the second growing cycle. Seeding takes
place in November/December and harvest starts in April.

7/29/2019 NDVI Case Study
http://slidepdf.com/reader/full/ndvi-case-study 6/17
6
FIGURE 4
Crop calendar of Egypt (source: GIEWS Workstation)
6.1.2 NDVI difference images NDVI difference images were calculated for the summer growing season (Figure 5).
During the sowing season in May, visual comparison of the NDVI images shows little
difference in vegetation vigor between the year 2000 and the long-term average (Figure 5,
sowing season). However the NDVI difference image depicts a slight to severe decrease of
vegetation for large parts of the Nile delta. On average the calculated NDVI value was 0.03
below normal, which corresponds to approximately 9% less vegetation vigor for the entire
delta. Due to favorable rains, a slight recovery in vegetation growth and vegetation vigor can
be seen during the peak season. (Figure 5, peak season). Lack of subsequent rainfall duringthe harvest season, diminished the growing conditions as can be seen in the NDVI difference
image (Figure 5, harvest season). By October 2000 there was circa 10% less vegetation vigor
in the whole Nile delta than in a normal year.
Attention should be given to this region in respect to possible yield loss. Field
observation and/or validations by local experts are essential to assess the gravity of the
situation. This is also necessary because NDVI images do not distinguish between agricultural
and natural vegetation.

7/29/2019 NDVI Case Study
http://slidepdf.com/reader/full/ndvi-case-study 7/17
7
FIGURE 5
NDVI difference images for the Nile Delta evaluating the growing season in 2000
Average Year 2000 Difference
S o w i n g S e a s o n
P e a k S e a s o n
H a r v e s t S e a s o n

7/29/2019 NDVI Case Study
http://slidepdf.com/reader/full/ndvi-case-study 8/17
8
6.2 NDVI time series chart
The NDVI time series chart clearly illustrate the two annual growing seasons in the Nile
Delta. It also indicates that the vegetation period is longer and with a denser plant cover
during the winter period then in the summer.
FIGURE 6
NDVI time series charts for the Nile Delta (1993-2004)
The NDVI difference images depicted already a reduced amount of vegetation for the
beginning of the 2000 summer season. The NDVI chart show the same picture and in the
month May the NDVI lays 0.3 values below the average. The graph illustrates that in the
following two months vegetation evolves normally in the delta. Still, lack of rainfall results in
lower than average NDVI values during the peak season in August and vegetation vigor doesnot recover till harvest. By October the NDVI value is 0.3 below the expected value, which
corresponds to approximately 10% loss of vegetation vigor for the whole Nile Delta
compared to a normal year.
In general the vegetation growth cycles of the last 10 years follow a normal vegetation
pattern, but the graphs also indicate slight shifts between the two growing seasons.
Apparently, vegetation emerges and declines earlier than in previous years. In addition, there
is also a tendency of a decreasing amount of biomass during the vegetation breaks in May and
October (1993 and 1998-2004).

7/29/2019 NDVI Case Study
http://slidepdf.com/reader/full/ndvi-case-study 9/17
9
6.3 Ethiopian Highlands
The Ethiopian highlands are located in the
northwestern part of Ethiopia. The
topography encompasses high and ruggedmountains as well as the flat-topped plateaus
around Lake Tana.
Rainfall in Ethiopia is highly erratic,
and most rain falls with very high intensity,
extreme spatial distribution and temporal
variability. For this reason there is a very high
risk of annual droughts and inter-seasonal dry
spells in Ethiopia.
FIGURE 7
Ethiopian Highlands and location of theobserved zone
6.3.1 Agricultural activities
The Ethiopian highlands are intensively used for agriculture. The cultivation of crops like
barley, wheat, sweet potato, millet and teff is widespread and there are fields of sorghum and
maize along the highland border areas.
In western Ethiopia we find a single growing period and one rainy season. It is known
as the Meher season (Figure 8). The planting season begins in early February and continues
till August, where most crops are sown in May. In September vegetation is fully developed
and harvest season lasts from the beginning of October till the end of January.
FIGURE 8
Crop calendar of Ethiopia (source: GIEWS Workstation)

7/29/2019 NDVI Case Study
http://slidepdf.com/reader/full/ndvi-case-study 10/17
10
6.3.2 NDVI difference images
The Ethiopian highland growing cycle from May till December is depicted in Figure 9. As
illustrated by the crop calendar (Figure 8) sowing of most main crops starts in the month of
May. In September vegetation growth reaches its peak and harvest season last from October
till January.
FIGURE 9
NDVI difference images for the Ethiopian Highlands evaluating the growing season in 2000
Average Year 2000 Difference
S o w i n g
S e a s o n
P e a k S
e a s o n
H a r v e s t S e a s o n
In 2000 the growing season of the Ethiopian highlands starts with a distinct difference
between the west and east highlands (Figure 9, sowing season). Higher than normal amount of
vegetation biomass can be seen in the western and central regions, while lack of rainfall has
led to unfavourable growing conditions in the eastern regions.

7/29/2019 NDVI Case Study
http://slidepdf.com/reader/full/ndvi-case-study 11/17
11
The situation of vegetation growth in the plateau region changes drastically in the peak
season. Previously well developed vegetation vigor in the western regions suffer from low
rainfall, which is visible in the difference image. Contrary to the western part, the situation in
the east is much improved with normal vegetation growth.
Vegetation growth recovers fully in December and the difference image also indicates a
higher-than normal amount of biomass throughout the plateau.
6.4 NDVI time series charts
NDVI time series charts (Figure 10) clearly show the single vegetation cycle throughout the
Ethiopian highlands. In a normal growing period, the amount of vegetation biomass is very
low (average NDVI 0.23 in February/March) but vegetation emerges slowly but gradually
during the subsequent months. Peak season is short (average NDVI 0.45 in September) and
vegetation vigor declines steadily afterwards.
FIGURE 10
NDVI time series chart for the Ethiopian Highlands (1993-2004)
There are no extreme vegetation anomalies evident from the NDVI graph for the 2000
growing season (Figure 10). NDVI values are below average during the growth peak in
September. However, the graph shows a longer prolonged vegetation period with higher than
normal NDVI values during the harvest season from October till December.
The vegetation anomalies of the seeding and peak season, which were visible from the
NDVI difference images, are not clearly depicted by the NDVI chart. Because the graph
visualizes the regional NDVI average for each time step, different states of vegetation vigor
within the region are leveled out during the calculation of the average. It emphasizes that
information gained from NDVI difference images and NDVI charts are complementary.
While difference images draw a better picture of the spatial distribution of vegetation
anomalies for selected time periods, NDVI charts are favourable for the continous monitoring
of vegetation vigor.
The graph shows that the growing cycle in the Ethiopian Highlands is frequentlyaffected by erratic, short-term changes. The year 1994, for example, was an extreamly

7/29/2019 NDVI Case Study
http://slidepdf.com/reader/full/ndvi-case-study 12/17
12
favorable year with circa 12% increased vegetation vigor in the month October. Instead,
unfavourable growing conditions resulted in a severe loss of vegetation vigor in the preceded
year as well as two years later. In general, the annual graph shows that there is the tendency of
a late start of the growing season. This is especially well visible for the years 2002 and 2003.
6.5 The Sudd
The Sudd is a vast swamp in southern
Sudan. Its size is variable, but during the
wet season it might be over 130,000 km²
in area. The swamp is fed by three main
waterways; the Bahr el-Jebel, the Bahr el-
Ghazal, and the Bahr el-Zaraf, which are
all headwaters of the Nile. Thick aquatic
vegetation (sudd) disperses the river water
into numerous channels. About half of the
water is lost through evapotranspiration
and absorption before leaving the Sudd.
FIGURE 11
The Sudd and location of the observedzone
6.5.1 Agricultural activities
Due to the extensively flooded area, the Sudd is favorable for the cultivation of rice. Beside
millet and maize it is particularly rice that is grown in the region.
Sudan has mainly one growing season that is slightly shifted between the north and the
south of the country (Figure 12). In the Sudd, the crop growing season lasts from April till
September. The vegetation cycle begins 2 months later in the North. The major limiting factor
in Sudan is not the agricultural potential, but the short duration of the rainy season and the
erratic distribution of rainfall during the growing period.
FIGURE 12
Crop calendar of Ethiopia (source: GIEWS Workstation)

7/29/2019 NDVI Case Study
http://slidepdf.com/reader/full/ndvi-case-study 13/17
13
6.5.2 NDVI difference images
Three critical times of the growing season were selected representing the seeding, the peak
and the harvest period. For each period the NDVI image, the average image and the difference
image between the two were calculated. Areas with higher-than normal vegetation vigor are
depicted in green colors, while areas with lower-than normal conditions are shown in red. Thedifference images show a distinguished growing situation for different parts in the Sub-Sahel
region (Figure 13).
FIGURE 13
NDVI difference images for the Sudd evaluating the growing season in 2000
Average Year 2000 Difference
S o w i n g S e a s o n
P e a k S e
a s o n
H a r v e s t S e a s o n
Southern Sudan seeding starts at the beginning of April and vegetation biomass is well
developed during this period (Figure 13, sowing season). The amount of healthy vegetation is
approximately 9% higher than in a normal year. However, while there are favorable growing
conditions in the Sudd the southeastern regions show a low vegetation response.
The growing conditions change drastically at peak season in July. The region suffers
from inadequate rainfalls and reduced water supply by the Nile waters. Consequently plant

7/29/2019 NDVI Case Study
http://slidepdf.com/reader/full/ndvi-case-study 14/17
14
growth was reduced and there is a decreased amount of biomass (ca. 9%) in comparison to a
normal year (Figure 13, peak season).
Negligible improvement is noticeable during the harvest season in September. The
entire region suffered from low water supply. The decrease of healthy vegetation amounted to
circa 6% at the time of harvest. The orange colors in the difference image might indicate a
loss of crop yield for the Sudd in 2000. Final field observations are necessary to assess the
extent of affected crops.
6.6 NDVI time series charts
The NDVI chart of the Sudd shows the development of NDVI values from March 1993 until
March 2004. The single, annual growing cycle begins and ends in March, when plant cover is
less developed. Vegetation emerges gradually during the following months and is fully
developed in August and September.
The Sudd gives an example where the peak of the crop growing cycle (July) does not
correspond to the general vegetation peak in August/September. The reason lies in the
different growing cycles between crop and natural vegetation. The Sudd is a vast swamp area
with a dense cover of aquatic plants. Because the NDVI graph cannot distinguish between
different vegetation types, the longer growing cycle of the natural vegetation superimposes
the shorter crop growing cycle in the NDVI chart. Therefore, while the natural vegetation is
developed fully the crop harvest season has started already (September).
FIGURE 14
NDVI time series chart for the Sudd (1993-2004)
As the difference images have shown the 2000 growing season started with favorable
conditions. In April 2000 the NDVI lays 0.03 values above the average, which corresponds to
circa 9% more vegetation vigor in the Sudd than in a normal year. The situation stays
favorable till mid May, but then a lack of rainfall causes a stagnation of plant growth. The
NDVI graph shows well that vegetation evolves hardly in the Sudd during June and July
(NDVI values 0.42 and 0.43 respectively). It means that during the crop peak season the
7/29/2019 NDVI Case Study
http://slidepdf.com/reader/full/ndvi-case-study 15/17
15
amount of vegetation vigor is circa 9% below the expected value. Vegetation is emerging till
the harvest in September, which is shown in an increase of the NDVI graph, but it cannot
recover fully, and there is approximately 6% less biomass in the Sudd during the harvest
season.
In the long-term perspective the NDVI time series shows a relative stable cycle of
growing seasons between the years 1993 and 2004. But the graph illustrates as well the
immediate effect of rainfall on the amount and vigor of vegetation. The years 1993, 2000 and
2002 show a lower than normal vegetation index for most parts of the growing season. The
lack of rains in these years caused a drop in the amount of healthy biomass. Instead there had
been good rainfalls in the growing season 2003/2004 leading to favorable growing conditions
in the region.
7 Conclusions
In this study we analysed GAC NDVI time series imagery from the NOAA satellite to
monitor the development of biomass in the Nile basin for the year 2000. Therefore, two
complementary techniques were applied. With the help of NDVI difference images,
calculated between a long-term average NDVI and the year of interest, the spatial distribution
of vegetation anomalies could be detected and vulnerable areas highlighted. Attention has to
be given to cultivated areas with low vegetation response in respect to possible food shortages
after harvest.
Instead, NDVI time series charts provide insight into the long-term development of
biomass in a selected region. It is a valuable tool to visualise the current growing cycle in the
context to preceding years and to define whether the current vegetation anomaly is of erratic
kind or whether a trend of vegetation vigor change can be detected over the years.
For the generation of the NDVI graphs the selection of the zones, for which statistics
are calculated, play an important role. When the terrain or the landscape within one zone is
very heterogeneous, say with part desert and part forest covered mountain, the extracted
average value makes little sense. The high value of the mountains is leveled out by the low
values of the desert. Important changes in for example the desert will not be discovered whenlooking at the statistical trend, because the forest part has such a big impact on the extracted
average. This effect often happens when extracting zones based on political boundaries.
It is important to note that NDVI images do not distinguish neither between different
vegetation types nor between cultivated and natural vegetation. NDVI images help identify
vulnerable areas. In addition, knowledge of the crop calendar and location of growing areas
for the different crop types can help analyse the images and trace vegetation that might be
affected by a loss of vegetation vigor. However, it is essential to validate findings from the
images by field observations or local expert knowledge to assess the gravity of vegetation losson cultivated land.

7/29/2019 NDVI Case Study
http://slidepdf.com/reader/full/ndvi-case-study 16/17
16
Glossary
Cold Cloud Duration (CCD) images are a means to estimate precipitation, and high cold
cloud duration over an area indicates the likelihood that significant rainfall has occurred. The
CCD data are used to trace the evolution of the rainy season on a 10-day and cumulative basis
from the start of the season through harvest. Dekadal and monthly CCD images for Africa are
processed at FAO from data of the European METEOSAT instrument.
Global Area Coverage (GAC) NDVI images are produced from data collected by the
Advanced Very High Resolution Radiometers (AVHRR) sensor onboard of the NOAA
satellite. The GAC NDVI images have a spatial resolution of 7.6 km and are provided to
GIEWS every 10 days. FAO’s archive of GAC NDVI images dates back to 1982.
Global Information and Early Warning System on Food and Agriculture (GIEWS): In
the working environment of the Food and Agriculture Organization (FAO) of the United
Nations, satellite images are an integrated part of the Global Information and Early Warning
System on Food and Agriculture (GIEWS). Since its inception in 1975, GIEWS has provided
policy makers and policy analysts with the most up-to date and accurate information available
on all aspects of food supply and demand. The GIEWS warns of any imminent food crises
and shortages, droughts and hunger at individual country or sub-regional level. Timely
interventions can then be planned by relief agencies and donor organizations, and suffering inthe affected countries avoided.
GIEWS makes use of low resolution satellite images to survey the current risk of
drought and food insecurity all over the world. This effort is supported by analysing
Normalized Difference Vegetation Index (NDVI) images, to assess the vegetation canopy, as
well as by analysing Cold Cloud Duration (CCD) images, to assess the likelihood of rainfall.
The CCD and NDVI imagery have been proven to be useful for early warning and for drought
and crop monitoring over large arid and semi-arid areas. Information extracted from these
images is used to corroborate field reports, and to substitute agro-meteorological informationnormally used to estimate crop yields. The images further provided a cost-effective and
efficient solution for monitoring the current seasons. It allows GIEWS’s crop assessment
mission teams to effectively identify areas suffering from low rainfall and drought, and to
timely schedule their field missions accordingly.
Since 1998, FAO has been acquiring the NDVI data derived from the SPOT VEGETATION
(VGT) instrument every 10 days. The VGT imagery has a spatial resolution of 1 km. It is
therefore more suitable for national and regional monitoring of major seasonal variations in
vegetation patterns.

7/29/2019 NDVI Case Study
http://slidepdf.com/reader/full/ndvi-case-study 17/17
17
Reference
Biard, F., D. Lepoutre: On Line Vegetation Condition Monitoring in Europe: Agri-Quest®.
A Tool That Helps Users Build Information and Value from Remote Sensing.
GEOSYS. S.A. Toulouse, France. (available at http://www.efita.net/apps/accesbase/ bindocload.asp?d=5544&t=0&identjobj=0i5ZNM6f&uid=57305290&sid=57305290&i
dk=1).
FAO (2000a): Food supply situation and crop prospects in Sub-Saharan Africa. Global
Information and early warning system on food and agriculture. Food and Agriculture
Organization of the United Nations (FAO), Rome. April 2000, no. 1. (also available at
http://www.fao.org/giews)
FAO (2000b): Food supply situation and crop prospects in Sub-Saharan Africa. Global
Information and early warning system on food and agriculture. Food and Agriculture
Organization of the United Nations (FAO), Rome. April 2000, no. 2. (also available at
http://www.fao.org/giews)
FAO (2000c): Food supply situation and crop prospects in Sub-Saharan Africa. Global
Information and early warning system on food and agriculture. Food and Agriculture
Organization of the United Nations (FAO), Rome. April 2000, no. 3. (also available at
http://www.fao.org/giews).
FAO: Gateway to national information on land, water and plant nutrition, Egyt, Nile Delta.(available at http://www.fao.org/ag/agl/swlwpnr/reports/y_nf/egypt/e_ndelta.htm)
GIEWS Workstation: http://www.fao.org/giews/workstation.
Minamiguchi, N. (2005): The Application of Geospatial and Disaster Information for Food
Insecurity and Agricultural Drought Monitoring and Assessment by the FAO GIEWS
and Asia FIVIMS. Prepared for: Workshop on Reducing Food Insecurity Associated
with Natural Disasters in Asia and the Pacific. Bangkok, Thailand, 27-28 January 2005.
Food and Agriculture Organization of the United Nations (FAO), FAO Regional Office
for Asia and the Pacific, Bangkok, Thailand.
Snijders, F., R. Giaccio, J. Ticheler & Y. Nicolarea (2002): Bringing Africa to the Desktop:
The ARTEMIS Charting Applet. Sustainable Development Department (SD), Food and
Agriculture Organization of the United Nations (FAO), Rome. (available at
http://www.fao.org/sd/dim_en2/2001/2002/aca-article/aca_p3.htm).
Snijders, F., R. Giaccio, J. Ticheler & Y. Nicolarea (2003): Twenty one years of satellite
derived vegetation index and rainfall-related data for Africa. Sustainable Development
Department (SD), Food and Agriculture Organization of the United Nations (FAO),
Rome. (available at http://www.fao.org/sd/2003/ACA21/t21_yr_p1.htm).