Embed Size (px)
Citation preview


TRADITIONAL VALUES AND THEIR ADAPTATION IN SOCIAL HOUSING DESIGN: TOWARDS A NEW TYPOLOGY AND ESTABLISHMENT OF ‘AIR HOUSE’ STANDARD IN MALAYSIAMohd Firrdhaus B. Mohd Sahabuddin
SUSTAINABLE PROCUREMENT IN CONSTRUCTION – THE WAY FORWARD FOR MALAYSIAMuhamad Rosdi B. Senam
DEVELOPMENT OF DESIGN GUIDELINE FOR RURAL LOW VOLUME ROADS IN MALAYSIAIr. Abdul Mutalif B. Abdul Hameed & Sufiyan B. Zakaria
PERFORMANCE OF VARIOUS PIEZOMETERS IN SOFT MARINE CLAY IN KANDANG, MELAKAIr. Edayu Bt. Saleh @ Aman
ANALYSIS OF THE PERFORMANCE AND IMPACT OF THE RURAL ELECTRIFICATION USING SOLAR HYBRID SYSTEM FOR RURAL SCHOOLS IN SABAH, MALAYSIA – CASE STUDYAbdul Muhaimin B. Mahmud
STRUCTURAL ASSESSMENT AND STRENGTHENING OF A CRACKED BRIDGE PIERIr. Dr. Lim Char Ching & C.S. Koo
DO WE NEED CRUMB RUBBER ASPHALT?Mohd Hizam B. Harun & Roziawati Bt. Razali
MALAYSIA’S NATIONAL SLOPE MASTER PLAN – FROM THEORY TO PRACTICEDr. Che Hassandi B. Abdullah
VALUE PROBLEM SOLVING AT DESIGN STAGE OF PUBLIC CONSTRUCTION PROJECTS IN MALAYSIARohanis Bt. Abd Ghani & Zawidatul Asma Bt. Ghazali
PROJECT MANAGEMENT : LEBUHRAYA PANTAI TIMUR FASA 2 - A CASE STUDYIr. Hurolaine Bt. Che Ab Aziz
KANDUNGANPERUTUSAN KETUA PENGARAH KERJA RAYA
KATA-KATA ALUAN TIMBALAN KETUA PENGARAH KERJA RAYA (SEKTOR PENGURUSAN)
DARI MEJA PENGARAH CAWANGAN PENGURUSAN KORPORAT
VISI DAN MISI
SIDANG REDAKSI
2
3
4
5
6
7
21
29
36
45
51
58
71
92
100
1

2
PERUTUSANKETUA PENGARAH KERJA RAYA
Assalamualaikum Warahmatullahi Wabarakatuh & Salam Sejahtera
Syukur Alhamdulillah dipanjatkan kepada Illahi kerana dengan izinNya, Jurnal JKR yang pertama dapat diterbitkan. Tahniah dan syabas saya ucapkan kepada Cawangan Pengurusan Korporat yang telah berjaya mengumpulkan kertas kerja yang telah dihasilkan oleh warga JKR untuk dijilidkan dalam terbitan Jurnal JKR yang pertama ini.
Sebagai agensi teknikal utama kerajaan, JKR seharusnya menjadi peneraju kepada agenda pembangunan Negara khususnya dalam menyedia dan menyiapkan projek infrastruktur dan prasarana untuk kegunaan rakyat yang merupakan pemangkin utama dalam pembangunan sosio ekonomi Negara.
Dalam menongkah arus kehendak pelanggan dan kemajuan teknologi yang semakin pesat, warga JKR perlu lebih kompeten mengurus tanggungjawab yang telah diamanahkan oleh Kerajaan. Pelbagai rintangan dan kesukaran boleh ditangani dalam merealisasikan impian Kerajaan untuk menjadikan Malaysia sebagai Negara yang maju sekiranya warga JKR telah menyiapkan diri dengan ilmu yang mantap.
Saya menyeru agar warga JKR khususnya berusaha untuk meningkatkan ilmu pengetahuan agar mampu menaikkan mutu kualiti kerja dan meningkatkan daya saing dalam diri masing-masing. Melalui penyelidikan, JKR mampu menjadi agensi yang terulung dan berdaya saing di Malaysia. Penyelidikan yang berterusan bagi menerokai bidang-bidang baru boleh memberi impak yang positif kepada pembangunan JKR dan seterusnya negara Malaysia.
Justeru itu, saya berharap agar penerbitan Jurnal JKR ini akan menjadi perintis kepada lain-lain terbitan berbentuk perkongsian ilmu, dan seterusnya menjadi teras kepada warga JKR untuk meningkatkan ilmu pengetahuan agar dapat menyediakan diri menghadapi cabaran yang mendatang. Saya turut berharap agar penerbitan Jurnal JKR dapat diteruskan bagi memupuk budaya cintakan ilmu dan pembelajaran berterusan.
DATO’ SERI IR. HJ. MOHD NOOR B. YAACOBKetua Pengarah Kerja Raya

3
KATA-KATA ALUANTIMBALAN KETUA PENGARAH KERJA RAYA (SEKTOR PENGURUSAN)
Assalamualaikum Warahmatullahi Wabarakatuh & Salam Sejahtera
Syukur Alhamdullilah dengan limpah kurnia rahmat daripada-Nya, Jurnal JKR edisi pertama berjaya diterbitkan. Jurnal ini merupakan kompilasi kertas kerja warga Jabatan Kerja Raya dari pelbagai bidang yang telah diiktiraf di peringkat nasional dan antarabangsa. Objektif utama penerbitan Jurnal ini adalah untuk dijadikan salah satu platform maklumat bagi menyebarkan hasil penyelidikan yang telah dilaksanakan oleh warga Jabatan Kerja Raya.
Sebagai agensi yang memberi perkhidmatan profesional dalam pengurusan dan penyelenggaraan aset kerajaan serta perundingan teknikal, Jabatan perlu mengamalkan amalan terbaik dan menjalankan penyelidikan yang berterusan selaras dengan visi JKR untuk membentuk agensi yang memberi perkhidmatan bertaraf dunia dalam pembangunan infrastruktur negara berteraskan modal insan yang kreatif dan inovatif.
Sehubungan itu, diharapkan Jurnal ini dapat memberi ruang kepada warga Jabatan Kerja Raya untuk berkongsi hasil kertas kerja mereka serta menggalakkan percambahan minda di kalangan warga Jabatan Kerja Raya agar dapat menggerakkan transformasi dalam penyampaian perkhidmatan kepada rakyat dengan lebih efisyen dan efektif. Inisiatif ini mampu memberi impak yang berkesan kepada warga Jabatan Kerja Raya untuk menjadi insan yang berilmu dan berdayasaing.
Penerbitan Jurnal JKR ini juga dapat memberi idea dan dorongan kepada warga Jabatan Kerja Raya untuk menambah nilai hasil penyelidikan sediada agar ianya lebih berkualiti, berinovasi dan selari dengan perkembangan teknologi terkini. Usaha ini selaras dengan matlamat Jabatan Kerja Raya untuk memperkukuh kedudukan sebagai sebuah agensi teknikal yang berpengaruh dan terbesar di Malaysia.
Akhir kata, mari kita sama-sama memantapkan pengetahuan dengan menjadikan Jurnal JKR ini sebagai salah satu bahan rujukan dalam melaksanakan tugas yang dipertanggungjawabkan. Segala hasil penyelidikan yang diterbitkan dalam Jurnal ini boleh dijadikan sebagai batu pengukur kepada kebanggaan dan kejayaan Jabatan Kerja Raya akan datang. Setinggi-tinggi tahniah saya ucapkan kepada semua penyumbang kertas kerja yang terpilih untuk penerbitan Jurnal JKR pertama ini serta pihak yang telah memberikan komitmen dalam penerbitan Jurnal ini.
Sekian, terima kasih.
DATO’ IR. HJ. ANNIES B. MD. ARIFFTimbalan Ketua Pengarah Kerja Raya (Sektor Pengurusan)
33

4
DARI MEJAPENGARAH CAWANGAN PENGURUSAN KORPORAT
Bismillahirrahmanirrahim.
Assalamualaikum Warahmatullahi Wabarakatuh dan Salam Sejahtera.
Terlebih dahulu saya ingin mengambil kesempatan ini untuk mengucapkan terima kasih kepada Sidang Redaksi Jurnal JKR kerana memberi peluang kepada saya untuk menyampaikan sepatah dua kata dalam penerbitan sulung Jurnal JKR.
Jabatan Kerja Raya sebagai sebuah institusi kejuruteraan terulung di Malaysia amat menggalakkan aktiviti penyelidikan dan penulisan akademik sebagai usaha mencapai visi menjadi sebuah pusat kecemerlangan dalam bidang kejuruteraan. Jurnal JKR adalah merupakan satu saluran untuk warga Jabatan Kerja Raya menyebarkan idea, pengalaman dan penemuan mereka untuk dikongsi bersama warga Jabatan Kerja Raya yang lain, agensi pelanggan, industri serta institusi pendidikan dan penyelidikan kejuruteraan yang lain.
Edisi sulung Jurnal JKR kali ini memuatkan sepuluh kertas kerja yang telah dihasilkan oleh warga Jabatan kerja Raya, kebanyakannya telah dibentang dalam pelbagai persidangan peringkat kebangsaan dan antarabangsa. Salah satu kertas kerja pada peringkat sarjana pula telah mendapat anugerah Andrew Grand Award semasa penyediaan tesis bagi melengkapkan MSc. in Advance Sustainable Design di University of Edinburgh. Kejayaan sedemikian adalah sangat menggalakkan dan merupakan petanda bahawa budaya penyelidikan yang ingin dipupuk dalam kalangan warga Jabatan Kerja Raya semakin membuahkan hasil. Syabas dan tahniah.
Akhir sekali, saya ingin mengucapkan terima kasih kepada penyumbang-penyumbang kertas kerja dan syabas kepada Sidang Redaksi Jurnal JKR dan semua pihak yang terlibat dalam penghasilan jurnal ini. Saya berharap jurnal ini akan memberi manfaat kepada para pembaca dan menjadi sumber motivasi untuk bakal pengkaji dan penulis artikel ilmiah pada masa akan datang.
Sekian, terima kasih.
IR. MOHD AMINUDIN B. MD AMINPengarah Cawangan Pengurusan Korporat

VISIKami akan Menjadi Pemberi Perkhidmatan Bertaraf Dunia Dan Pusat Kecemerlangan Dalam Bidang Pengurusan Aset, Pengurusan Projek Dan Kejuruteraan Untuk Pembangunan Infrastruktur Negara Berteraskan Modal Insan Yang Kreatif Dan Inovatif Serta Teknologi Terkini.
MISIMisi JKR ialah untuk menyumbang kepada pembangunan negara dengan:1. Membantu pelanggan kami merealisasikan maklumat dasar
dan menyampaikan perkhidmatan melalui kerjasama sebagai rakan kongsi strategik.
2. Mempiawai proses dan sistem kita untuk memberikan hasil perkhidmatan yang konsisten.
3. Menyediakan perkhidmatan pengurusan aset dan projek yang efektif dan inovatif.
4. Mengukuhkan kompetensi kejuruteraan sedia ada.5. Membangunkan modal insan dan kompetensi baru.6. Mengutamakan integriti dalam memberikan perkhidmatan.7. Membina hubungan harmoni dengan masyarakat.8. Memelihara alam sekitar dalam penyampaian perkhidmatan.
5
KETUA PENGARANG : Ir. Zulakmal b. Hj. Sufian
PENGARANG : Ir. Hurolaine bt. Che Ab Aziz
En. Azwan Ezzany b. Azmi
Pn. Khadijah bt. Mohd Sarkawi
En. Mohd Fazril b. Mohamed Ramlee
SIDANG REDAKSI
6

7
TRADITIONAL VALUES AND THEIR
ADAPTATION IN SOCIAL HOUSING DESIGN:
Towards A New Typology And Establishment Of ‘Air House’
Standard In Malaysia
MOHD FIRRDHAUS B. MOHD SAHABUDDINPenolong Pengarah (Arkitek)
Cawangan Arkitek
B.Arch (Hons), Universiti Teknologi Malaysia
MSc Advanced Sustainable Design, University of Edinburgh, United Kingdom
ABSTRACT
Large migration from rural areas to urban areas like Kuala Lumpur has led to some implications for
economic, social and cultural development. This high population has placed enormous demand on the existing housing stocks, especially for low-income groups. However, some issues arise, one of which is overheated indoor air temperature. This problem contributes to the high-energy usage that forces huge sums of money to be spent on cooling the house by using mechanical equipment. Therefore, this study focuses on thermal comfort in social housing, and incorporates traditional values into its design to achieve a certain measurement of natural ventilation in a house. From the study, the carbon emission and energy consumption for an air-conditioned house is 67%, 66% higher than a naturally ventilated house. Therefore, this research has come up with a new typology design, which has a large exposed wall area and full-length openings on the opposite walls to increase cross ventilation. At the end of this research, the measurement of thermal comfort for a naturally ventilated building called ‘Air House’ has been identified.
Keywords : Vernacular Architecture; Traditional Malay House; Air House; Sustainable Design; Social Housing; Malaysia.
INTRODUCTION
Malaysia is located in Southeast Asia and is one of the fastest developing countries in the world. United Nations calculations have projected a dramatic urban future for this region (Salih 1982). The patterns of
urbanization in Southeast Asia’s top cities are expected to increase rapidly.
Kuala Lumpur, as a capital city of a developing nation, plays a significant role in the urbanization and development of the country. The city’s population grew from about 0.32 million in 1957 to almost 1.62 million in 2006 (Mohit, et al., 2010). Based on this situation, Malaysia was expected to require about 709,400 new housing units between 2006 and 2010 (UN-HABITAT, 2011). The other problem that has arisen is the increasing number of squatters and slum areas. Social housing schemes such as People’s Housing Project (PHP) have been one of the approaches undertaken by the government to solve this problem. However, the issue of thermal comfort and space design in social housing is always a hot topic as it is not compatible with the living patterns of Malaysian society.
The low-income population that occupy the majority of social houses cannot afford to install and maintain an air-conditioning system in their homes. The system leads towards environmental pollution and energy waste. Therefore, one of the precedent studies is the traditional Malay house that has touted the advantages of maintaining the internal comfort level by natural and passive approaches.
The aims of this research are to seek the appropriate design methods in social housing that can achieve the right thermal comfort by using passive approaches. Thermal comfort is very important, not only for enhancing the quality of indoor living, but also because it can help to reduce carbon emission and

8
energy consumption. At present, the thermal comfort conditions have been set up for indoor space designed with an air-conditioning system. Therefore, this research tries to find the best description of thermal comfort conditions for a naturally ventilated space that suits Malaysia’s environment and comfort zone.
MALAYSIAN VERNACULAR ARCHITECTURE AND ITS RELATIONSHIP TO CLIMATE
Vernacular Architecture of Traditional Malay House
The construction elements in Malay vernacular architecture are light timber-framed structures, forming elevated floors, sloping long roofs with large overhangs, louvered windows, timber or woven bamboo walls and screenings (on the upper walls). In terms of spatial elements, the basic spaces of the serambi, rumah ibu and dapur are the most common in a traditional Malay house (Figure 1). Although these houses have variations, elements such as spatial, functional and physical could be determined as the most common among them (Ismail & Ahmad, 2006).
The traditional Malay house can be divided into front and back sections, which are centred around the rumah ibu (the core house) and the dapur (kitchen) respectively (Yuan, 1987: 34). The serambi, in any event, will be at the front, followed by the rumah ibu and dapur. This arrangement is similar in all Malay houses and closely reflects the social interaction in Malay communities. Table 1 shows the common uses and privacy levels of interior spaces in a traditional Malay house.
The serambi is the smallest space among the other spaces. In some cases of the twelve-column house, this space usually accommodates a quarter of the house, and the floor level will always be lower than the rumah ibu floor level. The form of the serambi is usually rectangle and in some cases is an extraordinarily long narrow space (Chen, et al., 2008).
Figure 1 : The internal layout of Andak Endah House, 1920 (Source: Author)
Elements Activities Privacy Level
Serambi / Anjung(Veranda / Porch)
Male entrance, relaxing, child monitoring, greet and treat space for guests
Public space
Rumah Ibu(The main/core of the house)
Meeting, praying, reading / reciting, sleeping (at night)
Semi private and private space
Selang / Pelantar Female entrance, chitchatting
Semi private space
Dapur(The kitchen of the house)
Cooking, preparing foods, dining, washing
Private space
Kolong(Space underneath the house)
Storing, working, repairing, drying clothes
Public space
Table 1 : The uses and privacy levels of spaces in a typical traditional Malay house (Source: Author)

9
This area can be constructed with or without perimeter walls; however, it tends to look like a semi-outdoor space with numerous daylighting from the openings. Figure 2 shows the location of serambi space in two examples of Malay houses. The serambi in the house of Andak Endah has no walls, while the other serambi in the house of Tan Mas Mohar is built with walls.
The importance of the serambi is to serve as the first greeting space for guests after entering the house (Yuan, 1987). In a traditional Malay kampong, houses are built in random positions but can be seen from the distance. The serambi in this case will be the place for social interaction within the neighbourhood, and for parents to monitor their children playing in the yard.
The rumah ibu is the core space of the Malay house. This has the largest area, highest floor level and highest roof level (Yuan, 1987: 37). In respect of the needs and privacy of family members, bedrooms are provided, but the number is flexible and depends on family size (Figure 2). Lighting in this space is reduced to provide coolness. (Yuan, 1987).
The rumah ibu is usually used for official events and a place for treating well-known guests or close relatives. Official ceremonies relating to customs are also carried out here. These include engagement, marriage and wedding ceremony. On normal days, this space will be for relaxing, reading, mingling with other family members, and for use as a sleeping area at night (Chen, et al., 2008).
Figure 2 : House of Datuk Baginda Tan Mas Mohar (1850) and Andak Endah (1920) (Source: KALAM, 1986 & 1996)

10
The kitchen, or dapur, is always situated at the back of the house (Yuan, 1987: 38). The functions of this space are for cooking, washing and eating. The basic layout of a Malay house will include a dapur within the rumah ibu, but in some cases the dapur will be connected with a pelantar, a roofless platform, or a selang. This, on the other hand, is an enclosed space that serves as a walkway and used as a second entrance for females during a ceremony (Figure 2). Although the dapur is the last space in the house, it holds the prestigious function of family gatherings where dining takes place together with other family members. Therefore, the dapur has a large space, which is considered the second largest in a Malay house.
Adapting to the Climate
The uniqueness of a Malay house is that it is built on stilts. This approach in many ways has several benefits from a thermal, functional and safety point of view. The raised floor, which is built higher than the ground, can catch winds of a higher velocity (Yuan, 1987: 71), and the
use of timber planks for the floor, which have gaps between them, can bring the air to the inner space. Hanafi (1994) suggests that moist ground requires more sunlight to dry, and a raised floor is one of the solutions. The wet climate does not just make the ground damp but can also cause floods. Therefore, stilt heights vary between Malay houses located in the northern and southern regions.
Several research findings about stilt heights in traditional Malay houses have proved those in the northern region have more height than those in the southern region (Figure 3). The underneath space allocated by the raised floor can provide shelter for the livestock, working space, and a clothes-drying area during rainy seasons.
A traditional Malay house allows ventilation by having many full-length windows and doors at body level (Yuan, 1987: 76). Hassan and Ramli (2010) conclude that the large number of windows and openings aided by ornamentation at the perimeter walls can contribute to the cross ventilation process
(Figure 3). However, further analysis by the same authors (2010) reveals that large openings on Malay house walls create high air intakes outside to reduce the performance of the stack effect.
Roof space in a traditional Malay house is properly ventilated by the provision of ventilation joints and panels in the roof construction (Yuan, 1987: 75). As one of the indigenous materials, the attap roof used in Malay houses has a low thermal capacity. This material does not retain heat and cools immediately. Another climatic responsive design of a double-slope roof is its gable ends. Having various motive designs, this component also has ventilation panels which allow air to flow into the roof space and cool the house (Yuan, 1987:111).
From the two examples in Figure 3, the roof overhangs in the Andak Endah house range from 1000mm to 1500mm, and the Datuk Baginda Tan Mas Mohar house has overhangs ranging from 1400mm to 1600mm. Large overhangs and the low exposed vertical areas
Figure 3 : The difference of stilt height and roof angle in traditional Malay houses at northern and southern region of Malaysia (Source: Author)

11
Figure 4 : Layout plan of a PHP unit (2000)(Source: Redraw by the author from Goh & Ahmad, 2011)
(windows and walls) in a traditional Malay house provide good protection against driving rain, good shading, and allow the windows to be left open most of the time for ventilation (Yuan, 1987). Meanwhile, the roof angle for both cases ranges from 300 to 600. The steep roof angle is used to quickly drain off any rain falling onto the roof surface before it seeps through the layers of thatching (Lee, 2003:251).
Architectural And Construction Issues of People’s Housing Project (PHP) Schemes
Malaysia is one of the developing countries experiencing a highly rapid urban growth. This situation has led to large migration from rural to urban areas, and resulted in the existence of slums and squatter areas. Social housing such as the People’s Housing Project Scheme (PHP) is one of the initiatives by the government to solve this problem. The National Housing Department of Malaysia (JPN) has a standardized social housing design in Malaysia to ensure that the basic requirements of providing adequate accommodation for low-income families are achieved. Figure 4 shows the design of a unit of PHP 2000. The size for the unit is 130 square feet
per person (JPN, 2006) or 650 square feet in total (60.38 square metres). This figure is for an average family member of 5 persons per unit (Goh & Ahmad, 2011). As the demand is very high, hundreds of thousands of PHP schemes have been built since 1998. However, the PHP design has received a lot of criticism for its insufficient space size and location.
Amongst the architectural issues reflected from the PHP design is the lack of a storage area. Therefore, the majority of residents placed their goods in front of their house; this affects the efficiency of a corridor as a safety route. The main door unit located abutting the corridor without any recess reduces the opportunity of neighbourhood interaction. Meanwhile, the small size and deep location of the kitchen and yard restricts its functions. The orientation of unit layout that has a minimum external wall area minimizes openings and air movement. The internal layout of the PHP 2000 that has complicated partitions reduces cross ventilation. Furthermore, openings such as aluminium casement windows without top louvers does not allow air movement to enter the indoor space.

12
On the other hand, the insufficient location of the bathroom and bedroom doors reduces the privacy level of residents. In the PHP design, the toilet and bathroom areas are separated, meaning a restriction in air and people movement in these spaces.
Furthermore, heavyweight materials with a high heat storage capacity are not suitable to a warm-humid climate like Malaysia. These materials take a considerable time to heat, then once heated take a long time to cool down again (Saini, 1970). Thus, lightweight materials that have a low heat storage capacity should be observed and replaced by conventional materials. In conjunction with that, prefabricated construction methods could be implemented in PHP 2000 to make it flexible in terms of internal space layout.
Materially, brick wall and post and beam concrete are the most common construction methods for social housing in Malaysia, largely due to these materials being cheap and easily available. Brick construction has a low u-value of 1.96 wm2 0C, though it has an eight-hour time lag, which has an adverse effect on the internal environment, especially at night (Hanafi, 1994).
Saini (1970) suggested that in a warm-humid region, heavyweight construction is at a disadvantage since the cooling process at night is so slow that the indoor temperature is kept too high for a comfortable sleep. Therefore, materials with a high heat storage capacity, such as brick, concrete and stone, have no advantage in Malaysia’s climate.
In addition, the residents of PHP flats agreed that the adjustable louvered windows are better for air movement compared with aluminium casement windows (Goh & Ahmad, 2011).
Recently, the shortage of construction labour means prefabricated panels and frames have been used widely. In 1988 the Malaysian Government began efforts to persuade the construction industry in Malaysia to engage with a more systematic approach, such as an Industrialized Building System (IBS), in building construction (Abd. Rahman & Omar, 2006). Besides the aims to reduce the dependency on foreign labour, an IBS construction method can also contribute
to reducing construction periods and pollution of the environment.
CASE STUDIES ANALYSIS
Case Studies Background
Three case studies have been selected, two of which are traditional Malay houses, and the other a social house from the People’s Housing Project Scheme (PHP 2000). The Malay houses selected are the house of Datuk Baginda Tan Mas Mohar and the house of Andak Endah. The houses are located in two different areas; the house of Datuk Baginda Tan Mas Mohar in the Negeri Sembilan state (southern region) and the house of Andak Endah in Perak state (northern region).
The house of Datuk Baginda Tan Mas Mohar, built in 1850, and the house of Andak Endah, built in 1920, have been chosen as typology houses and represent two different forms. The house of Datuk Baginda Tan Mas Mohar has a basic twelve-column structure, while Andak Endah has an expanded twelve-column structure. Social housing in Malaysia has been standardized, so using the People’s Housing Project (PHP) as the third case study is quite reasonable.
Table 2 shows the total external wall area and its opening areas percentage. The Datuk Baginda Tan Mas Mohar house has 16.5% opening areas and the house of Andak Endah has 17.9% opening areas. Meanwhile, PHP 2000 has only 8.9% opening areas. The size and location of opening areas are two key factors that can allow air to enter the building sufficiently. The two cases of Malay houses have larger opening areas compared to PHP 2000.
Simulation’s Design Settings
The selection of the 6.4 version of the Integrated Environmental Solutions Software (also known as (IES <VE>) is due to its suitability towards the aims of the study, which is to simulate air temperature, relative humidity and air flow rate. For natural ventilation, MacroFlo, integrated into the IES simulation, is used to simulate airflow driven by wind pressure and buoyancy forces through elements such as windows, doors and openings. The simulation of MacroFlo runs from within Apache, which also simulates the indoor

13
air temperature and relative humidity based on the ASHRAE design weather database. Meanwhile, MicroFlo uses a Computational Fluid Dynamic (CFD) to measure fluid flow and heat transfer processes around building spaces, which include the effects of climate (IES, 2012).
In this study, the simulation’s location database is Kuala Lumpur/Subang weather with the latitude 30 12’ North and longitude 1010 55’ East. The sea level height is 8 metres with the mean dry-bulb temperature 36.4 and wet-bulb temperature 16.1 0C. No HVAC system is applied, while east-west orientation is used in all simulation models. The openings of all samples assigned as window/door side hung with opening angle is 900, and opening hours range from 08:00 am to 10:00 pm. All the external walls are categorized as exposed walls without any obstacles.
According to Saini (1970), air temperature, relative humidity and air movement are the elements of climate which affect the comfort and well-being of the people. These factors also have complex inter-relationships between them, and, to a degree, each affects the other. Therefore, in this study, these three elements will be measured in detail, as well as carbon emission and energy consumption.
Table 3 shows the building materials assigned to both Malay houses and PHP 2000 in IES. The right building materials are crucial to achieve accurate readings in simulation. However, several regional materials such as an attap roof (a thatched roof made from palm leaves), a bamboo thatched wall, and a gap-timber-floor are not available in the IES material database. Therefore, the closest materials shown in Table 3 were chosen.
Table 2 : Total external wall areas and opening areas in all case studies (Source: Author)
Building’s Name Simulation’s Location
Total Ext. Wall Areas (M2)
Ext. Opening Areas (M2)
Percentage (%)
House of Tan Mas Mohar
K. Lumpur/Subang 485.9 80.0 16.5
House of Andak Endah K. Lumpur/Subang 259.0 46.4 17.9
A Unit of PHP 2000 K. Lumpur/Subang 117.4 10.5 8.9
Table 3 : Building materials for Malay houses and PHP assigned in IES
Construction Elements
Traditional Malay Houses
U-Value (W/m2k)
People’s Housing Project (2000)
U-Value (W/m2k)
Roof Sloping Roof-Domestic
3.3775 Flat Roof (2002 Regs) 0.2497
Ceiling Timber-Joist Internal Ceiling
1.2585 100mm Reinforced-Concrete Ceiling
3.6842
External Wall Timber Frame Wall 0.4493 Brick/Block Wall 0.4396
Internal Partition Frame Partition With 1 In. Wood
1.1630 115 mm Single-Leaf Brick (Plastered Both Sides)
1.9709
Ground Floor Un-Insulated Suspended Timber Floor
0.6278 ASHRAE Slab-on-grade Floor 0.1979
Door Wooden Door 2.1944 Timber Flush-Panel Hollow- Core Door (Normally Hung)
2.3256

14
Simulation’s Results
From the simulation’s analysis, it can be deduced that the air temperatures in PHP 2000 and Malay houses show no significant difference within each other. The mean air temperatures obtained are within the comfort levels of 25.0 to 28.0 0C. However the relative humidity results are higher than their suggested level of 30% to 60%. Even though the relative humidity is high, there is only a small change in the air temperature. A change from 25 to 75% of relative humidity is predicted to move the temperature by only 10C (Fisk, 1981).
The crucial finding obtained from the simulation is the air movement. Air movement in this scenario is very important because it can encourage heat loss through the evaporation process. Low air movement does little to generate a body’s heat loss. Furthermore, Fisk (1981) suggested that air movement of about 150.0 l/s (0.15 m/s) or greater tends to increase air temperature and a body’s heat loss. In conclusion, a traditional Malay house that has high air ventilation movement in and out has the better shelter and can provide more comfort to the human body than PHP 2000.
Table 4 shows the comparison of carbon emission and energy consumption for two different PHP 2000s. One unit uses an air conditioning system, the other is fully naturally ventilated. Both carbon emission and energy consumption for the PHP 2000 with an air conditioning system are higher than the PHP 2000 that uses natural ventilation. The carbon emission and energy consumption for the air-conditioned house is 67% and 66% higher than the naturally-ventilated house.
The huge gaps here show that it is worth encouraging people to use natural ventilation methods rather than an air conditioning system. Malay houses, for instance, can best describe the concept of a naturally ventilated house. Therefore, some elements, such as the size of openings and their placement, can be forwarded to a detailed level.
TOWARDS A NEW TYPOLOGY OF SOCIAL HOUSING DESIGN AND THE ESTABLISHMENT OF ‘AIR HOUSE’ STANDARD IN MALAYSIA
Theoretical Model of A New Social Housing
A theoretical model (TM) has been developed as an initiator towards sustainable social housing in Malaysia. The model design is a reflection of the design issues found in PHP 2000 that were discussed before. The issues of space sizes, internal circulation, cross ventilation and numbers of openings in PHP 2000 have been taken into consideration. PHP 2000 and TM have the same overall area of 650 square feet, which is equivalent to 60.38 square metres (JPN, 2006).
Several architectural improvements have been implemented in the TM design, which involve the external and internal design forms. In TM the living/dining area is smaller than in PHP 2000 to allow foyer space in front of the main entrance. This space has a similar position to the serambi in a Malay house to promote interaction between neighbourhoods. The other improvement in TM is a larger yard space than in PHP 2000. This is because in PHP 2000, the yard design is too small and located too far from the exposed area, which leads to insufficient space for a clothes-drying area. On the other hand, the separation of the toilet and bathroom in PHP 2000 means the toilet size becomes too small and uncomfortable. In TM, both facilities are located in the same space; thus it creates better movement of the occupant and air.
Because the humidity is high, air movement is crucial to help perspiration to evaporate (Bureau of Meteorology, 2012). Hence, TM has been designed with windows opposite each other, a narrow floor plan and ventilation openings such as top and bottom louvers to allow air movement. The complicated wall
Table 4 : Comparison of carbon emission and energy consumption of PHP units
Variables PHB 2000 (With Air Conditioning System)
PHB 2000 (Natural Vertilation)
Carbon Emission KgCO2/Year
18308 5967
Energy Consumption MWh/Year
20.1952 6.8413

15
arrangements in PHP 2000 reduce the cross ventilation that flows from the front to rear façade. In TM, cross ventilation is achieved with a parallel arrangement of windows as well as the placement of high louvers on the internal walls, as shown in Figure 5. Furthermore, overhangs are placed on top of the windows to provide protection
Figure 5 : Comparison of PHP 2000 and theoretical model (TM) layout plan(Source: Author)
Figure 6 : Placement of openings in theoretical model (TM) (Source: Author)
from sunlight and rainfall. The width of the overhang is 600mm.
Window design in a traditional Malay house is divided into three operable sections, which are top, middle and bottom. As shown in Figure 6, TM has 3.5 metre-high walls, and its external walls are divided into three sections. The
sections are top louvers, windows and bottom louvers. In a Malay house design, some openings on the gable ends are placed to allow air movement. Thus, in TM, the same concept is translated through the placement of internal and external high louvers.

16
In a hot-humid climate, a lightweight structure performs better as it cools down rapidly (Saini, 1970: 25). Furthermore, ‘materials with heat-storage capacity such as bricks and concrete have little benefit’ (Bureau of Meteorology, 2012). Therefore, a few changes on construction methods and building materials have been implemented for the theoretical model (Table 5).
In TM, lightweight materials such as a gypsum board with insulation is used for the external wall. Meanwhile, for the internal wall, plasterboard with insulation is the replacement for the conventional single brick wall. In a hot-humid climate, a thin insulation is preferable to bulk insulation, which is not desirable because it prevents the house cooling down at night (Bureau of Meteorology, 2012).
In conclusion, the TM design that has been applied with architectural and construction improvements has now become one of the new typologies for social housing in Malaysia. Therefore, the changes applied in TM should be tested and analyzed in IES <VE> software to assess their suitability. All the settings and simulation variables mentioned before will be used in order to provide a fair comparison.
Results and Findings
The main findings from the results are:a) The mean air temperature in Malay houses and
TM ranges from 25.20C to 27.20C. This range can be considered the best air temperature in a naturally ventilated building in Malaysia.
b) The minimum relative humidity in Malay houses and TM ranges from 30% to 60%. This range is achievable and therefore can be considered the preferred humidity range in a naturally ventilated building.
c) The mean internal ventilation in Malay houses and TM cases (except the dapur and serambi) ranges from 0.15 to 0.4 m/s (150.0 to 400.0 l/s). Meanwhile, the external ventilation in Malay houses and TM (except the dapur) ranges from 0.30 to 1.45 m/s (300.0 to 1450.0 l/s). Thus, the preferred range of air ventilation in a naturally ventilated building is 0.30 to 1.50 m/s.
d) The external opening area in a Malay house is 15% to 20%, while in TM, the opening areas on the walls facing outside (open space) is 25% and the wall facing inside (corridor) is about 50%. These percentages could be the best configuration of opening percentage in a naturally ventilated building.
Table 5 : The building materials applied in PHP and theoretical model
ConstructionElements
People’s Housing Project (PHP 2000)
U-Value (W/m2k)
Theoretical Model U-Value (W/m2k)
Roof Flat Roof (2002 Regs) 0.2497 Flat Roof (2002 Regs) 0.2497
Ceiling 100mm Reinforced-Concrete Ceiling
3.6842 100mm Reinforced-Concrete Ceiling
3.6842
External Wall Brick / Block Wall 0.4396 Gypsum Board Frame Wall with 4 In. Insulation
0.1358
Internal Partition
115mm Single-Leaf Brick 1.9709 13mm Plasterboard Wall with Insulation
0.7594
Ground Floor ASHRAE Slab-on-grade Floor
0.1979 ASHRAE Slab-on-grade Floor
0.1979
Door Timber Flush Door 2.3256 Wooden Door 2.1944

17
e) The best carbon emission for a naturally ventilated building is 2571 kgC02/year, and the energy consumption should not be more than 5.1963 MWh/year.
The findings listed above are the initial parameters than can be used as the first Air House standard in Malaysia.
‘Air House’ Standard for Naturally Ventilated Building in Malaysia
Based on all the results defined in Malay houses and theoretical models, the proposed Air House design standard is listed in Table 6. The air temperature ranges from 250C to 270C. The relative humidity for ‘Air House’ is 30% to 60%. Meanwhile, the air movement is between 0.30 to 1.50 m/s. The total energy consumption for Air
House standard is less than 5.0 MWh/year and less than 2500 kgC02/year for carbon emission.
Table 7 shows the design parameters for a naturally ventilated building in Malaysia. 15% to 25% of an opening area is recommended for an external wall that faces an open space, while for a wall covered by shade or facing another block, 25% to 50% of an opening area is recommended. As higher altitude provides higher velocity, the units located on the eleventh floor and above should have a smaller opening area than units on the first to tenth floors. Furthermore, to promote air movement and cross ventilation, the four components of opening in Air House that should be implemented are bottom louvers, windows, top louvers and high louvers. The proportionate rule of these openings is 2x : 2x : 1x : 1x relatively, as shown in Figure 7.
Table 6 : The initial design conditions of ‘Air House’ for naturally ventilated building
Recommended Air Temperature 25°C - 27°C 77.0°F - 80.6°F
Recommended Design Relative Humidity 30% - 60%
Recommended Air Movement 0.30 m/s - 1.50 m/s 300.01/s - 1500.01/s
Total Energy Consumption (per year) Less than 5.0 MWh/year
Total Carbon Emission (per year) Less than 2500 kgC02/ year
Proportion of Opening Components (Bottom Louvers: Windows: Top Louvers: High Louvers)
2x: 2x: 1x: 1x
Opening Areas for Walls Facing Outside (1st to 10th Floor) 15% - 25% (from total external wall area)
Opening Areas for Walls Facing Inside (1st to 10th Floor) 25% to 50% (from total external wall area)
Opening Areas for Walls Facing Outside (11th floor and above) 10% - 20% (from total external wall area)
Opening Areas for Walls Facing Inside (11th floor and above) 20% - 45% (from total external wall area)
Proportion of Plan Unit Layout (Parallel Wall: Perpendicular Wall)
1.5x: 1x
Minimum Overhang 0.6 meter
Breaks between Units 2.0 meters
Recommended Materials Prefabricated, Lighweight and Low Thermal Mass
Table 7 : ‘Air House’ design parameters for natural ventilated buildings in Malaysia
18
Moreover, the unit plan layout should be in proportion of 1.5x for walls parallel to the corridor, and 1x for walls perpendicular to the corridor (Figure 7). To provide shade from sun radiation and rainfall, the minimum overhang recommended is 0.6 metres, while to promote better air circulation around the building, breaks between units are recommended. In terms of material selection, Air House standard uses prefabricated, lightweight and low thermal mass materials for the walls, floor and roof components.
Conclusions and Recommendations
As a conclusion, there are some design issues discovered in traditional Malay houses and social housing. According to research, materials that are used in Malay houses are more practical and reliable for releasing heat readily, compared to high thermal capacity materials such as bricks and concrete in social housing. These high thermal materials store heat and cause uncomfortably high temperatures at night.
In a traditional Malay house, full-length openings are located at body level, while in modern housing the openings are smaller and only concentrate on the upper part of the body. Therefore, the cross ventilation process often fails in modern housing. Overhangs are important in opening components because they can provide shade for the walls from sun radiation, glare and rainfall. This key element is always neglected in modern housing.
For religious reasons, the orientation of a traditional Malay house normally faces Mecca or an east-to-west direction. This orientation, by coincidence, can reduce the external wall that faces direct sunlight. However, in modern housing, this orientation is not emphasized for profit motives. Moreover, the internal space arrangement in a traditional Malay house uses a front-to-back order where the serambi is the first area, followed by the rumah ibu and dapur. This arrangement preserves the privacy level of a Malay family and contributes to neighbourhood enhancement.
The results of the analysis of Malay houses and People’s Housing Project (PHP 2000) show that the performance of air temperature and relative humidity in both cases were not significantly different. However, for internal and external air ventilation, the traditional Malay
houses recorded 1450.3 l/s (1.45m/s) compared to just only 31.7 l/s (0.03m/s) for PHP 2000. The massive amount of air ventilation in Malay houses contributes to a better performance of the house thermally and economically.
The theoretical model has been developed and tested. The model has been improved according to the architectural and construction issues found in an actual PHP 2000. One of the major improvements is the proportionate rule of layout unit. Instead of a long and narrow layout, the theoretical model has a longer and wider layout where the external wall area is longer than PHP 2000; this promotes massive airflow in, out and across the house through the opening components.
Using the results obtained from the analyses, a standard called Air House has been defined. This standard is totally focused on natural ventilation strategies, in which air is designed to flow across the house compound. Meanwhile, in ‘Passivhaus’, the design is more about airtightness and isolation of heat within the house compound. The establishment of ‘Air House’ could perhaps be a new beginning for Malaysian architecture and its tropical region.
The hot temperature and high humidity climate in Malaysia encourages the use of an air conditioning system as the primary option to cool the house. Nowadays, this is the standard practice in Malaysia. An effort should be made to rectify this situation. The theoretical model that has been developed proves that there is a possible way to achieve the right thermal comfort by using passive methods in social housing. Therefore, this study answers the problem posed at the beginning of the study.
Upon completion of the study, it can be deduced that there is a huge gap between the traditional approach and modern housing. One of the reasons for this situation is the inappropriate regulations and standards being used in Malaysia. Therefore, some improvements and revisions should be made in order to meet the current challenges, as some of the regulations are not compatible with Malaysia’s climate and culture.
In clauses 32, 33, 34 and 35 of Uniform Building By-Law (UBBL) Part III (space, light and ventilation), open spaces must be provided in residential building compounds.

19
However, the categories listed are only related to buildings abutting a street, a back lane and a detached building; there is no category relating to linked units abutting a corridor in a multi-story building. According to the research findings, a common space in front of the main entrance is an important element in building a good, responsible society. Therefore, in theoretical model (TM), foyer space is provided to serve as interaction space as well as storage area. Thus, an improvement that can be compatible with local culture and the basic needs of the people should be made.
Clause 39 (1) states that residential buildings shall be provided with natural lighting and natural ventilation. The openings area is not less than 10% of floor area. For an example that follows the minimum requirement, a living/dining area in TM that has 19.6 square metres will have an area of window opening of less than 2.0 square meters. Based on the research findings, this percentage is too small for an opening to allow air movement. As TM has been proven to provide good air movement, clause 39 (1) should be revised to a new and more suitable percentage of opening area that is compatible with Malaysia’s climate.
In order to achieve thermal comfort through air movement, a large opening at the external and internal wall should be made. Therefore, 15% to 20% of external openings are required on an external wall for achieving suitable amount of air movement. Moreover, an opening at a high level of wall should be placed to allow ventilation and air change processes.
The window openings are suggested to be placed at body level range and must be 15% to 20% of a room’s external wall. For internal partitions, fixed louvers could be placed on the top part of the partition to allow air transfer from room to room.
Moreover, in clause 42 (2), the minimum kitchen area in UBBL is 4.5 square metres and the minimum width is 1.5 metres. This measurement is still small and leads to insufficient space area. Therefore, the kitchen area should be revised to be at least 8.0 square metres and 2.0 metres minimum in width.
Finally, in clause 44 (1), the minimum height of a living room is 2.5 metres, while a kitchen is 2.25 metres. These
heights are considered low and less efficient to promote air movement; thus, the minimum of 3.5 metres, as in TM’s design, should be used in this clause.
The Air House concept that focuses on natural ventilation in residential buildings has proven it can reduce 86% of carbon emission and 74.3% of energy consumption compared to standard practice. The Air House concept has brought sustainable design in Malaysia to a new level of achievement; therefore, it should be explored and expanded in greater detail in the future.
Thermal comfort is one of the basic needs. However, in urban areas, thermal comfort becomes more crucial as houses are constructed in multi-level format with compact design. The concept of Air House could perhaps provide a new dimension in the design of comfortable and sustainable housing in the future.
ACKNOWLEDGEMENT
I would like to thank the various people and organisations whose help have made this research possible. First of all, my supervisor, Cristina Gonzalez Longo, for her helpful guidance, valuable comments and close supervision throughout the research process.
The Center of Built in the Malay World (KALAM), Universiti Teknologi Malaysia (UTM) and KALAM’s director, YM Dr. Raja Nafida Raja Shahminan, for her support and the contribution of study materials. Art and Architecture Library, University of Edinburgh and Ms. Rowena Godfrey for her great hospitality, contribution of books and space throughout the writing process.
My classmates, who shared their information, experiences and views throughout the Masters program. Not forgetting my wife, daughter and son for their patience, support and encouragement in my work and effort.
Finally, this research was conducted in the University of Edinburgh which also has been awarded the Andrew Grant Award for the best dissertation for MSc. Advanced Sustainable Design in year 2012.

20
REFERENCES
[1) Abd. Rahman, A.B. & Omar, W., 2006. Issues and Challenges in the Implementation of Industrialised Building Systems in Malaysia. In Proceedings of the 6th Asia-Pacific Structural Engineering and Construction Conference (ASPEC 2006). Kuala Lumpur, Malaysia.
[2] Bureau of Meteorology, Design Tips For the Hot Humid Climate. Australian Government. Available at: http://www.bom.gov.au/climate/environ/ housedesign/HSWW_d.shtml [Accessed July 24, 2012].
[3] Center of Built in the Malay World (KALAM), 1996. Rumah Andak Endah (1920).
[4] Center of Built in the Malay World (KALAM), 1986. Rumah Datuk Baginda Tan Mas Mohar (1850).
[5] Chen, Y.-R., Ariffin, S.I. & Wang, M.-H., 2008. The Typological Rule System of Malay Houses in Peninsular Malaysia. Journal of Asian Architecture and Building Engineering, (254).
[6] Fisk, D., 1981. Comfort and Energy Consumption. In The Architecture of Energy. New York: Longman Inc.
[7] Goh, A.T. & Ahmad, Y., 2011. Public Low-Cost Housing in Malaysia: Case Studies on PPR Low-Cost Flats in Kuala Lumpur. Journal of Design and the Built Environment, Vol. 8.
[8] Hanafi, Z., 1994. Housing Design in Relation to Environmetal Comfort - A Comparison of the Traditional Malay House and Modern Housing. Building Research and Information, Volume 22.
[9] Hassan, A.S. & Ramli, M., 2010. Natural Ventilation of Indoor Air Temperature: A Case Study of the Traditional Malay House in Penang. Science Publications.
[10] Ismail, Z. & Ahmad, A.S., 2006. Modularity Concept in Traditional Malay House (TMH) in Malaysia. In International Conference on Construction Industry. Universitas Bung Hatta, Indonesia.
[11] KALAM, 2012. Center for the Study of Built Environment in the Malay World (KALAM). KALAM UTM: Pusat Kajian Alam Bina Dunia Melayu. Available at: http://utmkalam.wordpress.com/author/utmkalam/ [Accessed June 19, 2012].
[12] Lee, H.Y., 2003. The Kampong House: Evolutionary History of Peninsular Malaysia’s Vernacular Houseform. In Asia’s Old Dwellings: Tradition, Resilience and Change. United States: Oxford University Press Inc., pp. 235-257.
[13] Mohit, M.A., Ibrahim, M. & Rashid, Y.R., 2010. Assessment of Residential Satisfactionin Newly Designed Public Low-Cost Housing in Kuala Lumpur, Malaysia. Habitat International, (34), pp.18-27.
[14] National Housing Department, 2006. JPN Standard Plan 2000.
[15] Saini, B.S., 1970. Architecture in Tropical Australia, Great Britain: Melbourne University Press.
[16] Salih, K., 1982. Urban Dilemmas in Southeast Asia. Singapore Journal of Tropical Geography, Volume 3 (Issue 2).
[17] United Nations Human Settlements Programme (UN-HABITAT), 2011. Affordable Land and Housing in Asia, Nairobi, Kenya: UNON, Publishing Services Section.
[18] Yuan, L.J., 1987. The Malay House: Rediscovering Malaysia’s Indigenous Shelter System, Pulau Pinang, Malaysia: Institut Masyarakat.
* This paper has been accepted for publication in the International Journal of Architectural Research
21
SUSTAINABLE PROCUREMENT IN CONSTRUCTION –
THE WAY FORWARD FOR MALAYSIA
MUHAMAD ROSDI B. SENAM Penolong Pengarah Kanan (Ukur Bahan)
Calon PhD, Universiti Islam Antarabangsa Malaysia
BSc (Hons) (QS), University of Liverpool, United Kingdom
M.Eng Internationales Project Management,HFT Stuttgart, Germany
RAPIAH BT. MOHD ZAINIFaculty of Management,
Multimedia University
21
ABSTRACT
The words ‘Sustainability’ and ‘Sustainable Development’ have gained outstanding popularity and thus received high acceptance and fast recognition worldwide since its emergence more or less in the 1990’s. As people awareness increases due to education, training, campaign, the rapid IT developments, and other environmental and social factors such as climate change, unpredictable natural disasters, population growth and depleting of natural resources and fossil fuels, a lot of efforts have been put in place by governments, public sectors and private bodies across all nations and boundaries, in strong support of this policy. Sustainable Procurement is part of this global move of going towards the direction of sustainable development that dictates the landscape of our future particularly the construction industry. Malaysia is among the developing countries that is on the right path moving to the direction of sustainable development. It is very much so as
procurement plays a major role in the overall construction and thus is a major contributor to the sustainable world as a whole. Sustainable procurement is a procurement strategy for the future that brings numerous benefits encompassing three main pillars; economical, social and environmental elements. The general perception that applying sustainable concept and buying sustainable products, goods and services would increase costs and the current practice of favouring the cheapest price tender rather than looking at tender that would bring benefits on the whole life costs, are among the main issues that have to be realigned and extensively overcome in order to path the way for the success of sustainable procurement. This paper highlights the general concepts of sustainable procurement, its key elements and processes, main benefits and also looking at the challenges and the way forward.
Keywords : Sustainable Procurement, Benefits, Process, Construction, Challenges
INTRODUCTION
Construction sector has always been an important component of the overall economy for many countries. For example, it is one of the main pillars supporting the Malaysian economy as a whole. To the Government of Malaysia, construction projects is often used as a mechanism for streamlining the country’s infrastructure, distributing the economic wealth, developing the middle class entrepreneurs contractors, upgrading the social well being and also as an effective method of increasing public spending to stimulate the growth of the economy. All these are implemented through the continous funding of public projects. It is often understood that when public projects are being implemented, the private counterparts in the construction industry are benefitting too.
Construction Industry Development Board Malaysia (CIDB) statistics have recorded that more than RM 312 billion worth of projects has been awarded

22
to contractors between January 2007 until Disember 2010 alone. This was undeniably a huge sum of money. Government projects is worth RM 127 billion or is made of 41.0% from overall projects value which is a significant portion. This statistics also indicate the large magnitude of the construction industry in Malaysia.
Given such huge value of construction projects, it generates great impact economically, socially and environmentally engaging multiple layers upstream and downstream all along the supply chain. Construction industry spends huge sum of money, consumes numerous materials and products and produces lots of waste.
Therefore, it is very significant and infuential indeed and it is a prominent player in promoting sustainability and sustainable development. Definitely, it has a lot of potentials for sustainable procurement.
Looking at the world map today with regards to sustainability, lots of initiatives have taken place and already in progress. In the UK, for instance, the government has introduced in 2005 UK Sustainable Development Strategy aiming to become a leader within the EU in sustainable development through its procurement of buildings, goods and services. The strategy among others established business-led Sustainable Procurement Task Force to bring about a step-change in public sector that by 2009, the UK is recognised as amongst leaders in sustainable procurement across EU member states (‘Securing the Future’: March 2005, DEFRA, UK).
As for Malaysia, although it seems we are still behind in comparison to most developed nations, quite a number of steps have been initiated in recent years towards ‘greening’ the nation and promoting sustainable development. In April 2009, the Ministry of Energy, Green Technology and Water was formed and the National Green Technology Policies was launched to champion sustainable development. Subsequently, in a more significant move, at the 2009 United Nations (UN) Climate Change Conference in Copenhagen, Denmark, Malaysia bravely pledged to reduce carbon emission up to 40 per cent by the year 2020. This shows that Malaysia is putting a serious business on sustainability.
Apart from that, more recently Malaysia has progressed further in this regard towards coming up with legislation governing sustainable development. Renewable Energy Act 2010 and Sustainable Energy Act 2010 were passed in parliament early this year and have been introduced in Malaysia. In terms of energy capacity or power generation, Malaysia has set a number of ambitious targets; to achieve 985MW or 5.5% share of renewable energy in the energy mix by 2015 as shown by Table 1 below. Currently, renewable energy contributes less than 1% to the energy mix in Malaysia. By 2020, the target is for renewable energy to comprise 11% or 2,080MW of overall electricity generation in the country (The Star, 26th March 2011).
Table 1 : Planned Increase in Renewable Energy CapacitySource: The Star, 26th March 2011
For the public sector, a directive from the Minister of Energy, Green Technology and Water has been announced in August 2011 stating that all government buidings are to maintain their internal temperature to not more than 24°C except for special rooms such as surgical theatres or storage facilities. This is expected to save the government approximately about RM700,000.00 on electricity yearly.

23
All these outline positive steps forward taken by Malaysia in line with global awareness campaign and collective move on sustainability.
Sustainable development begins with sustainable procurement. It is very much so as procurement plays a major role in any process of acquiring goods or services or buildings in construction. Thus is a major contributor to the sustainable world as a whole. Sustainable procurement indeed has a big share in paving the way for sustainable development. Therefore, it plays a key role in contributing to sustainable development The following paragraphs will explain and discuss more on sustainable procurement.
SUSTAINABLE PROCUREMENT
What is Sustainable Procurement? Sustainable Procurement is the process whereby organisations meet their needs for goods, services, works and utilities in a way that achieves value for money on a whole life basis. It results in benefits not only to organisation, but also to society and the economy, whilst minimising damage to the environment. (‘Procuring the Future’ – the report of the UK Sustainable Procurement Task Force, June 2006). Sustainable Procurement is about taking environmental, social and economic factors into consideration in purchasing decisions and only purchasing goods and services that are really needed. In construction industry, applying the same principles, it is all about considering the three (3) aspects in constructing for example building projects, etc. It looks at what your products are made of, where they come from and who has made them. It promotes to avoid or minimise any negative impact on the environment and society by considering the production, use and disposal involved with products, goods, works and services that are procured.
Kennard (2006) states; ‘Sustainable Procurement is the process whereby economic development, social development and environmental protection are balanced against business needs’. And why do we need to care all these three factors? There are obviously numerous tangible and intangible benefits that organisations, the public and finally the nations gained whether come directly or indirectly from Sustainable Procurement. Generally, on the environment, for instance, Sustainable Procurement will help to reduce carbon and greenhouse gas emissions, improve
energy and water efficiency, encourage optimise use of resources, support recycling and concurrently manage waste production to a minimum level. Designing products or buildings that care for the environment will eventually deliver environmentally harmonious outcomes.
Economically, it will reduce or save costs because focus would be given on getting value for money on the whole life cost of the contract or lifespan and not just to get the cheapest price from tenderer. Cost savings also are generated from the optimise use of resources, energy and water efficiency, more recycling as well as reduced waste generation. While organisations are realising the importance and benefits of Sustainable Procurement, there is a strong drive towards innovation resulting from the move to become more energy and water efficient, to reduce waste, more recycling and the use of concept ‘design-for-the-environment’ methodologies. Innovation will save costs in many aspects and increase profits (Bobis, Staniszewski, 2009).
On social aspects, practicing Sustainable Procurement will improve the supply chain interactions and efficiency thus building stronger partnership with competent sustainable suppliers and contractors that share the same spirit of supporting the sustainable procurement. Other social impacts are promoting fair business and trade along the supply chain, better risk and reputation of organisations, compliance with Health and Safety regulation in the work environment and at work. This is what sustainability is all about.
Therefore, sustainable procurement organisations in manufacturing, construction business or services, would address the economic, social and environmental elements of every procurement decision. Balanced evaluation of the elements would result in enormous positive outcomes that benefit the organisations, society, environment and the nation.
In summary, some of the key benefits of Sustainable Procurement will be:-
Economical aspects:
• Value for money by not looking at the cheapest option but take into account the whole life costs, quality and long term savings. Award of

24
contracts for construction projects or supply of products or services should be changed from the current practice of public sector procurement in Malaysia; ‘lowest acceptable tender’ to ‘the most economically advantegous tender (MEAT)’ (Brunel University Sustainable Procurement Guide, UK, 2010).
• Cost savings or reduced costs from optimise use of resources, energy and water efficiency, more recycling as well as reduced waste generation
Environmental aspects:
• Save carbon emissions
• Save resources; energy, water
• Reduced waste
• Increased recycle, reuse
Social aspects:
• Improved supply chain and partnership with contractors and suppliers
• Fair business and trade
• Better risk and reputation of organizations
• Improved Health and Safety compliance
Waste Hierarchy Model = Procurement Hierarchy
Fundamental in the concept of Sustainable Procurement is addressing the need to buy in the first place or in a more specific word, the need to procure any products, equipments or buildings etc (Brunel University Sustainable Procurement Guide, UK, 2010). The above model shows the comparison between the waste issues associated with purchasing. This model elaborates in a simple way the very basic concept of sustainable procurement. The opportunity to re-think the need to buy at the very top of the hierarchy, to avoiding the purchase, reduce the amount or to shift from buying a product to just buy a service and lastly considering the reuse and recycling options. Equally in design and construction of buildings, there are so many from A to Z opportunities for sustainable procurement at various stages. When designing, for example, use the most energy efficient and environmentally friendly and green materials, products, machinaries
ReduceUse less
Re-UseBy Customer or
supplier/contractor
RecyclingNegotiate optionswith contractors
EnergyRecovery
Waste Prevention
Re-Use
Recycle/Compost
Energy Recovery
WasteHierarchy
Disposal
End of Life
Negotiate end-of-life management optionswith suppliers/contractors
Procurement Hierarchy
Rethink NeedEliminate waste at source
(no purchase/purchase service instead of product)
Figure 1 : Waste Hierarchy Model = Procurement HierarchySource: ‘Procuring the Future’ – the report of the UK Sustainable Procurement Task Force, June 2006

25
Figure 2 : Sustainability in the Procurement ProcessSource: Brunel University Sustainable Procurement Guide, UK, 2010
Your businesscase inc. need to
buy
Apply sustainability
principlesthrough each
step of theprocess
Specifying your requirements
Sourcing
Managing yourcontract ..and your
contractor
Your business case inc. need
to buy
Your contract
and equipments that could save energy and costs and indirectly environmental savings. These can be incorporated too into the specifications and method of construction. Consider adopting construction method that produce minimum waste and high possibilities for recycling.
Addressing the need also can be defined in a way that reduces the use of resources. For instance use less timber and more steel formwork. Prefabricated products and IBS (Industrialised Building System) method are some examples that are green and sustainable.
Realising the concept of Sustainable Procurement, the old way of designing buildings luxuriously and freely with so much room for fulfilling designers’ philosophical and aesthetical needs, has to forego and need to be reconsidered as much as the need to move from the current practice of public sector procurement in Malaysia; ‘lowest acceptable tender’ to ‘the most economically advantegous tender (MEAT)’. Designers that design-for-the-environment’ and give duly care for the environment, social and economical wellbeing, will always bear in their mind the words; ‘Rethink need, Reduce, Re-use, Recycle, Energy Recovery/Efficiency, Renewable’ in the design options.
Should this concept of ‘procurement of the future’ be widely understood, well accepted and practiced, then the number of abundant public and private buildings which are those completed but vacant for no use afterwards would be very minimum. Apart from that, our buildings that we will occupy in the future would be those which care so much for the environment, energy and water efficient, made of high recycled products and environmentally friendly materials, produce minimum waste during construction and use, eventually give lots of cost savings in the operation phase and provide more value to the users and environment.
Sustainability in the Procurement ProcessThe early stage of the process is actually where we can find the strongest points and numerous opportunities for achieving sustainable procurement. This is so when identifying the need, establishing the business case and defining the specifications because we are free to define the subject matter of a contract in a manner we feel to be mostly sustainable.
As shown in Figure 2, sustainability requirements need to be addressed and specified in the designs, drawings and specifications in the procurement process.

26
Sustainable Issues to consider when Preparing Requirements and Specifications
Sustainability need to be considered in every steps of procurement including specifications, no matter how small. Some examples are:-
• Take into account of recognised environmental and social performance standards and system such as ‘green’labels, recycle labels, energy efficient and renewable energy labels, EMS 14001 Environmental Management System etc
• Take into account sustainable measures such as waste reduction, energy efficiency and carbon emissions
• Incorporate any latest initiatives or legislation on sustainability, Sustainable Procurement, environmental or social.
• Require tenderers as part of their plan to specify and explain how they will comply with sustainability, environmental and social needs.
• Clearly indicate if needed for some materials, products to have characteristics such as ‘made from recycled materials’, energy efficient products, ease of dissemble, recyclable etc.
• Insert sustainability clauses in Instruction to Tenderers and Conditions of Contracts.
Evaluation of Tender and Award of Contract
Sustainability and its relevant subjects, features and characteristics need to be embedded into the procurement process from the preparation of tender documents, defining needs and requirements, evaluating options, designing and determining specifications, contractor/supplier selection, tender evaluation and award of contract. In sustainable procurement, as what has been practiced in the UK in a few years back, contracts are awarded not to the lowest price tenderer but based on value for money on a whole life basis of that particular projects, products or services. Whole life cost over a lifespan of a product, building or service will not only look at short term costs at the initial stage such as purchase cost, acquisition costs or construction costs but will also fairly consider operation, use, repair and maintenance costs until disposal and recycling costs at later stage. Whole life
cycle cost is taking into account the total costs of a building or product over its whole lifetime.
In Sustainable Procurement, contracts will be awarded to the Most Economically Advantegous Tender (MEAT). In MEAT, sustainability criteria are incorporated into the tender evaluation. For example, in the evaluation, a few recognised standards are used to assist in whole life costs analysis, such as energy efficiency ratings, environmental friendliness, recycled materials content etc.
Setting Key Performance Indicators – Contract Monitoring
Key Performance Indicators (KPI) will be included in the tender document to monitor the performance of contractor against all the sustainable criterias. Examples are:-• Measure the percentage of energy consumption• Measure the water consumption• Measure the percentage of green or sustainable
products/materials/components used such as green roof, energy efficient lightings, etc
• Measure the percentage of waste that is recycled• Measure of reduced gas emissions
KPIs performance will be measured and compared to the targets or requirements in the tender document.
CHALLENGES TO SUSTAINABLE PROCUREMENT
Kennard (2006) states some barriers or challenges to sustainable procurement:-
• Lowest Price• Leadership• Improving the Supply Chain• Building Capacity• Opportunities
Lowest Price
It takes a lot of efforts to change the mindset of industry players to move away from normal practice of favouring lowest price tender to what we call as ‘Most Economically Advantegous Tender’ (MEAT) based on whole life costs as what has been practiced in recent
27
years in EU and UK. For Malaysia, the public sector through the central agencies; the Ministry of Finance, Economic Planning Unit (EPU) and the technical arm of the government, the Public Works Department (PWD) should lead if this change were to take place. For example, new sustainable procurement policy that encompass environmental, social and economical factors need to be formulated and introduced for government future projects. As the whole concept of sustainable procurement is still low in terms of awareness and priority, more awareness campaign and government directives are needed to make way for this concept to be used in the future.
Leadership
Change begins with effective and good leadership that have the courage and will to lead the change and deliver the desired results. For Malaysia, the public sector alone will not be able to succeed. Collective efforts from both public and private sectors thus are needed to promote more on sustainability and sustainable procurement. More forums, seminars and platforms need to be initiated, that will disseminate the concept of sustainable procurement, its benefits and promoting the theme such as ‘Good Procurement is Sustainable Procurement’. Change will never take place without strong courage and determination as well as continuous and persistent effort to encounter the high resistance to change culture. The Public Works Department (PWD) should lead the change and champion the sustainable procurement by beginning to embark on sustainable procurement in some new government projects. There are great potentials in the PWD itself as it implements physical and infrastructure public projects that are worth billions ringgit and it has the blend of technical capacity and competency.
Improving the Supply Chain
Promoting the concept of sustainable procurement for the future also needs some enforcement and be regulated especially at the beginning era to trigger the starting point of change. Apart from disseminating information and building the knowledge base about sustainable procurement on voluntarily basis to the industry players through seminar, forums and academic platforms, to enhance awareness along
the construction industry supply chain from the manufacturers, suppliers, subcontractors, main contractors, clients, users, financers etc, new standards on compulsory basis need to be formalised and introduced. This initiative will ensure that sustainable procurement ball has been ‘kick-off’ to the market.
Building Capacity Creating the brand of sustainable procurement in the market may also be done in smaller trainings, courses and sessions other than the bigger ones such as seminars, conferences and forums. This will reach out the target groups of those directly involved in the procurement process and documentation. This will help in enhancing the building capacity of this concept.
Opportunities
Sustainable procurement is driving the construction industry towards cost effectiveness, efficiency and smart business methodology and strategy, partnership, innovation and ‘best practice management’ in all aspects with due respect to the society and environment. This will spur enormous opportunities in organisations, in the whole market and industry.
THE WAY FORWARD
Sustainable procurement is still at its early stage in Malaysia. It is a new procurement and the future business strategy that applies holistic and balanced approach which will bring enormous benefits encompassing economical, social and environmental elements. Sustainable procurement plays a key role in contributing to sustainable development. Malaysia has made some progress in sustainable development in recent years and thus it is now timely for the government to start promoting sustainable procurement. As construction industry is a significant portion of the overall economy of Malaysia, therefore there is definitely a lot of opportunities for sustainable procurement. Looking at the present scenario, it takes lots of effort and a long way for sustainable procurement to succeed. Apart from enhancing the concept through disseminating information and increasing awareness on sustainable procurement across all sectors amongst industry players and stakeholders, the general perception that applying sustainable concept and buying sustainable

28
products, goods and services would increase costs and the current practice of favouring the cheapest price tender, would have to be realigned and extensively overcome. These are among the critical issues that need to be addressed in order to pave the way for the success of sustainable procurement.
REFERENCES
[1] Bobis, V., Staniszewski, J. (2009), ‘The Challenges and Opportunities of Sustainable Procurement’, http://www.environmentalleader.com/2009/03/31/the-challenges-and-opportunities-of-sustainable-procurement/.accessed on .30.09.2011
[2] Brunel University (2010), Sustainable Procurement Guide, http://www.brunel.ac.uk/business/tender/general/contracts. accessed on 06.09.2011.
[3] Construction Industry Development Board of Malaysia (CIDB), Construction Quarterly Statistical Bulletin, 4th Quarter 2010, http://www.cidb.gov.my/v6/?q=en/content/984. accessed on 06.05.2011
[4] Guide to Sustainable Procurement, (2007), The Chartered Institute of Purchasing & Supply, http://www.ekobai.com/analysis/details/1. accessed on 15.09.2011
[5] Hill, J. (2006), ‘Sustainable Construction – are we closing the loop?’, A Seminar jointly by Green Alliance and the Eden Project, 30 January 2006, Cornwall, United Kingdom.
[6] Kennard, M., (2006), ‘Sustainable Procurement’, A paper presented in XXIII FIG Congress, Munich, Germany, October 8 -13, 2006.
[7] Leong, H.Y., ‘Renewable Energy Needs a Push’, The Star, Saturday March 26, 2011, http://biz.thestar.com.my/news/story.asp?file=/2011/3/26/business/8336530&sec=business, accessed on 15.07.2011
[8] Simms, N., (2006), ‘Sustainable Procurement Task Force’, Green Alliance – Eden Project Seminar, on 30 January 2006, United Kingdom.
[9] Project Procurement and Sustainable (2010), European Bank for Reconstruction and Development, http://www.ebrd.com/pages/workingwithus/procurement/project/sustainability.shtml. accessed on 30.09.2011
[10] United Nations Environment Programme (UNEP) (2011), ‘Capacity Building for Sustainable Public Procurement’, http://www.enep.fr/scp/procurement. Accessed on 30.09.2011.
[11] United Nations Development Programme (UNDP) (2008), Environmental Procurement, Practice Guide, Volume 1, http://www.undp.org/procurement. Accessed on 21.11.2011
[12] Walker, H., Brammer, S., (2007), ‘Sustainable Procurement in the United Kingdom Public Sector’, University of Bath, School of Management, Working Paper Series, 2007.15
* Presented at Seminar on Green Approaches In Sustainable Development (December 2011), Kuala Lumpur
2929
DEVELOPMENT OF DESIGN GUIDELINE
FOR RURAL LOW VOLUME ROADS IN
MALAYSIA
IR. ABDUL MUTALIF B. ABDUL HAMEEDKetua Penolong Pengarah Kanan (Awam)
Cawangan Kejuruteraan Jalan dan Geoteknik
BSc (Hons) Civil Engineering, Leeds University, United Kingdom
MPhil (Engineering), University of Birmingham, United Kingdom
SUFIYAN B. ZAKARIA Penolong Pengarah Kanan (Awam)
Cawangan Kejuruteraan Jalan dan Geoteknik
B. Eng (Civil), Universiti Putra Malaysia
MSc (Highway & Transportation Engineering), Universiti Putra Malaysia
INTRODUCTION
The road network is a very important asset and acts as an enabler to the economic and social development of a country. In today’s world of globalization, the provision of good road network and infrastructure will enhance the nation’s competitiveness and maintain an edge over its competitions. In Malaysia, the economic contribution by the road network is enormous as it carries about 96% of transported goods and passengers. Conservation of the road asset condition is therefore very crucial to ensure the network continues to be effective and serves its functions to the required quality standards throughout its lifetime.
Roads in Malaysia are classified into two broad categories, namely Federal Roads and State Roads. Federal roads are all roads declared under the Federal Roads Ordinance (1959). This category of roads includes the National Expressways and Highways under the administration of the Malaysian Highway Authority (MHA).
Currently, Malaysia has more than 80,300km of roads. The roads are divided into three main categories namely Toll Expressways, Federal Roads and State Roads.
Road Categories Length (km)
Toll Expressways 1,700
Federal 17,500
State 61,100
Purpose
The purpose of this Design Guide for Low-volume Roads Pavement Structure is to provide JKR and consultants engaged in pavement engineering projects in Malaysia with a uniform process of designing pavements for low-volume traffics. This Guide is based on Manual on Design of Flexible Pavement Structures (JKR 20601-LK-0156-KP-05), Arahan Teknik Jalan 5/85 and Road Note 31. It builds on past JKR practice and experience and on design methodologies that have been successfully used in other countries. The design approach recommended in this Guide combines improved design development data and mechanistic methods of analysis into a single tool that is presented in the form of a catalogue of pre-designed pavement structures. This Guide, which has been simplified, is meant to be used for low-volume roads throughout Malaysia including Sabah and Sarawak.
Road Categories and Length

30
This Guide contains procedures for the design of the following pavement structures:
New flexible pavements for low-volume •roads containing one or more bound layers. New flexible pavements for low-volume •roads, consisting of unbound or stabilised granular materials capped with a thin bituminous surface treatment.
For the purpose of this Guide, flexible pavements shall consist of one bituminous paving materials or a thin bituminous surface treatment on a granular road base supported by a granular sub-base. Semi-rigid pavements shall include cement-bound or similarly stabilised base course consisting either of plant-mixed aggregate stabilised with cement, fly-ash or lime or of an in-situ recycled and stabilised layer using CIPR technique, incorporating additives such as bituminous emulsion, foamed bitumen or cement.
This Guide does not contain information related to the structural design of rigid pavements.
Issues related to Low-volume Roads
Low-volume roads can be understood as roads having low average daily traffic (ADT) or low cumulative number of Equivalent Standard Axle Load (ESAL) traversing over the design life of the road. Indeed some would equate low-volume roads with low cost and even low standard roads. Most low-volume road documentation will cite around 250 vehicles per day (vpd) as the upper limit for low-volume roads. However, even this upper limit can range from a lightly to heavily trafficked roads depending on the type of vehicles using the road.Careful consideration needs to be given to determine the traffic growth rate. Projecting traffic growth and assigning accurate equivalence factors to the traffic is crucial if economic designs are to be achieved. Usually unrealistically high growth rates or equivalence factors opens the door to the traditional pavement design approaches and construction methods required for more heavily traffic roads. This reduces the level of risk for the engineer but results in conservative pavement designs being adopted.
Another issue that needs consideration is the overwhelming evidence to indicate that a general relaxation in the specifications for low-volume roads
is required. Recent research carried out by Transport Research Laboratory (TRL) in southern Africa was aimed at achieving this. As an example, a common feature of the specifications for natural gravel base materials are the requirements to meet strict compliance criteria on particle size distribution, plasticity index below 6, and strength (soaked CBR greater than 80 at 98% Modified AASHTO compaction). In most cases, one of the biggest challengers the engineer is facing is to identify the location of materials which meet these specifications. Many natural gravels are often excluded from use because they fail to meet at least one of these criteria. Where materials meeting the specification are not available locally, the alternatives are to:
Import suitable materials over long distances, or•Improve the available materials by adding •stabilising agents such as lime, cement or others.
STRUCTURAL PAVEMENT DESIGN REQUIREMENT
The key information needed for design of flexible pavements is as follows:
Types and volumes of commercial vehicles for •which the pavement structure is designed.Design life of the pavement.•Sub-grade type and strength.•Types and properties of paving materials used.•Environment to which the pavement structure will •be exposed.
DESIGN PROCEDURE USED IN THIS GUIDE
The procedure for calculating the traffic volume to be used as design input (number of 80 kN ESALs over a Design Period), is as follows:
From traffic counts for the project under i. consideration (information provided by HPU for the past 5 or more years), determine:
Initial Average Daily Traffic in one direction a. (ADT).Percentage of Commercial Vehicles (CV) with b. an un-laden weight of more than 1.5 tons (PCV)Average Annual Traffic Growth Factor (r) for c. CV.

Determine the following information from the geometric design of the ii. road for which the structural pavement design is carried out:
Number of lanes.a. Terrain conditions (flat, rolling, mountainous).b.
Select Design Period.iii.
Calculate the Design Traffic (Number of ESALs) for the Design Lane and iv. Base Year Y1 (First Year of Design Period) using the following formula:
ESALY1 = ADT x 365 x PCV x LEF x L x T .......... (1) where; ESALY1 = Number of ESALs for the Base Year (Design Lane) ADT = Average Daily Traffic PCV = Percentage of CV (Un-laden weight > 1.5 tons) LEF = Load Equivalence Factor L = Lane Distribution Factor (refer to Table 1(b)) T = Terrain Factor (refer to Table 1(c)) v. Calculate the Design Traffic (Number of ESALs) for the Design Period
(Design Life in Years) using the following formula:
Design Traffic ESALDES = ESALY1 x [(1 + r) n – 1] / r .......... (2) where;
ESALDES = Design Traffic for the Design Lane in one direction (determines the traffic category used as basis for selecting a pavement structure from the catalogue)
ESALY1 = Number of ESALs for the Base Year (Equation 1) r = Annual Traffic Growth Factor for Design Period n = Number of Years in Design Period
Properties of Sub-Grade
Sub-grade strength is one of the most important factors in determining pavement thickness, composition of layers and overall pavement performance. The magnitude and consistency of support that is provided by the sub-grade is dependent on soil type, density and moisture conditions during construction and changes that may occur over the service life of a pavement.
For pavement design purposes, several parameters shall be used to categorise sub-grade support. Traditionally, the California Bearing Ratio (CBR) has been widely used for this purpose. For this Guide, CBR has been retained as a design tool. The CBR values used as input values for selecting alternative pavement structures from the catalogue are 5 – 10%, 10.1 – 20%, 20.1 – 30% and > 30%.
Properties of Paving Materials
Pavement design in accordance with the procedure outlined in this Guide permits the use of a range of paving materials, provided that such materials
meet the requirements of JKR Standard Specifications for Road Works. The choice of materials shall be based on considerations of regional experience and availability of materials, and on costs.
For the purpose of this Guide, paving materials are classified into several categories in accordance with their intended function within the pavement structure. The categories include (from top of the pavement downwards):
Bituminous wearing mix •(AC14)Unbound granular road •base.Cemented or otherwise •stabilised road base.Unbound granular sub-•base.
Descriptions of all paving materials used in this Guide are contained in the JKR Standard Specifications for Road Works.
Bituminous Wearing CourseSpecifications for bituminous mixtures are contained in the JKR Standard Specifications for Road Works.
Crushed Aggregate and Wet-Mix Road BaseUnbound granular materials used for road base consist of crushed rock or gravel with a grading that imparts on the mixture a mechanically stable course that is capable of distributing effectively traffic loads transmitted by overlaying bituminous courses. The performance of well graded granular materials is largely governed by their shear strength, stiffness and by material break-down that may occur during
31
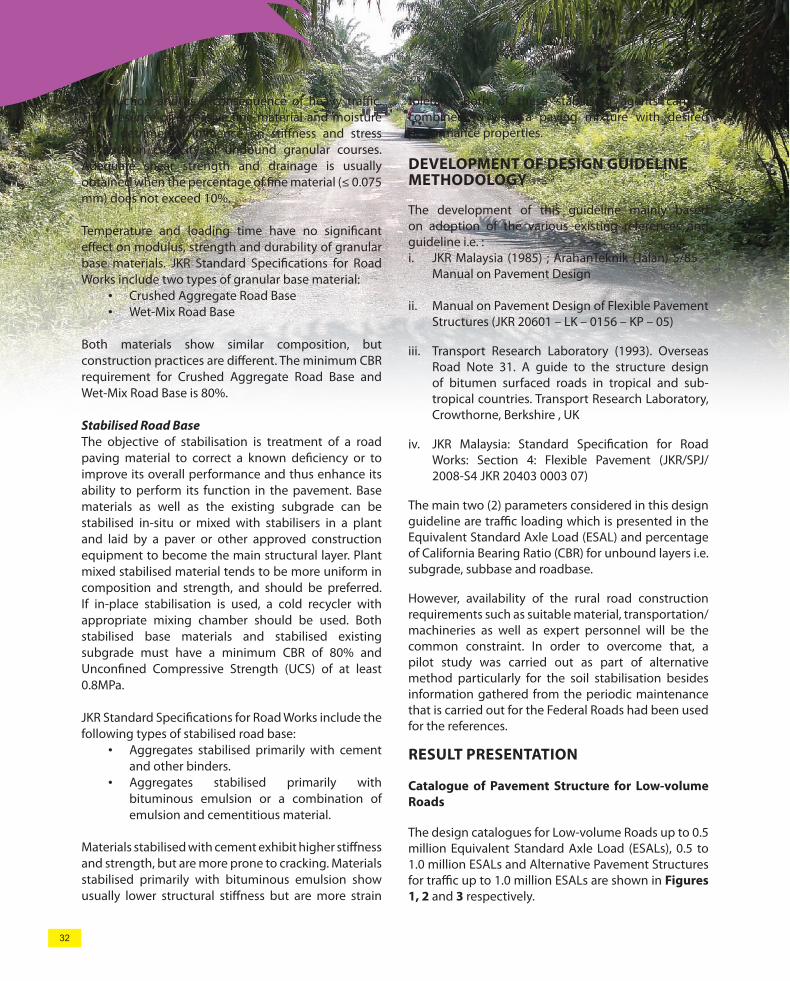
construction and as a consequence of heavy traffic. The presence of excessive fine material and moisture has a detrimental influence on stiffness and stress distribution capacity of unbound granular courses. Adequate shear strength and drainage is usually obtained when the percentage of fine material (≤ 0.075 mm) does not exceed 10%.
Temperature and loading time have no significant effect on modulus, strength and durability of granular base materials. JKR Standard Specifications for Road Works include two types of granular base material:
Crushed Aggregate Road Base•Wet-Mix Road Base•
Both materials show similar composition, but construction practices are different. The minimum CBR requirement for Crushed Aggregate Road Base and Wet-Mix Road Base is 80%.
Stabilised Road BaseThe objective of stabilisation is treatment of a road paving material to correct a known deficiency or to improve its overall performance and thus enhance its ability to perform its function in the pavement. Base materials as well as the existing subgrade can be stabilised in-situ or mixed with stabilisers in a plant and laid by a paver or other approved construction equipment to become the main structural layer. Plant mixed stabilised material tends to be more uniform in composition and strength, and should be preferred. If in-place stabilisation is used, a cold recycler with appropriate mixing chamber should be used. Both stabilised base materials and stabilised existing subgrade must have a minimum CBR of 80% and Unconfined Compressive Strength (UCS) of at least 0.8MPa.
JKR Standard Specifications for Road Works include the following types of stabilised road base:
Aggregates stabilised primarily with cement •and other binders.Aggregates stabilised primarily with •bituminous emulsion or a combination of emulsion and cementitious material.
Materials stabilised with cement exhibit higher stiffness and strength, but are more prone to cracking. Materials stabilised primarily with bituminous emulsion show usually lower structural stiffness but are more strain
tolerant. Both of these stabilising agents can be combined to yield a paving mixture with desired performance properties.
DEVELOPMENT OF DESIGN GUIDELINE METHODOLOGY
The development of this guideline mainly based on adoption of the various existing references and guideline i.e. :
JKR Malaysia (1985) ; ArahanTeknik (Jalan) 5/85 – i. Manual on Pavement Design
Manual on Pavement Design of Flexible Pavement ii. Structures (JKR 20601 – LK – 0156 – KP – 05)
Transport Research Laboratory (1993). Overseas iii. Road Note 31. A guide to the structure design of bitumen surfaced roads in tropical and sub-tropical countries. Transport Research Laboratory, Crowthorne, Berkshire , UK
JKR Malaysia: Standard Specification for Road iv. Works: Section 4: Flexible Pavement (JKR/SPJ/ 2008-S4 JKR 20403 0003 07)
The main two (2) parameters considered in this design guideline are traffic loading which is presented in the Equivalent Standard Axle Load (ESAL) and percentage of California Bearing Ratio (CBR) for unbound layers i.e. subgrade, subbase and roadbase.
However, availability of the rural road construction requirements such as suitable material, transportation/machineries as well as expert personnel will be the common constraint. In order to overcome that, a pilot study was carried out as part of alternative method particularly for the soil stabilisation besides information gathered from the periodic maintenance that is carried out for the Federal Roads had been used for the references.
RESULT PRESENTATION
Catalogue of Pavement Structure for Low-volume Roads
The design catalogues for Low-volume Roads up to 0.5 million Equivalent Standard Axle Load (ESALs), 0.5 to 1.0 million ESALs and Alternative Pavement Structures for traffic up to 1.0 million ESALs are shown in Figures 1, 2 and 3 respectively.
32

33
Figure 1 : Pavement structures for Low-volume Roads up to 0.5 million Equivalent Standard Axle Load (ESALs)
CBR 2
CBR 3
CBR 4
CBR 5
CBR 6
CBR 7
CBR 8 - 24
Legend: (Pavement layers thicknesses are in mm)
Surface treatment
Road base course (crushed granular material with maximum 8% �nes)
Sub-base course (crushed or natural granular material with maximum 10% �nes)
250Minimum subbase thickness of 100mm to be used (if applicable).Subbase material to have a CBR value >30%.
250
570
250
560
250
450
250
380
250
330
250
320
250
310
250
360
250
370
250
340
250
280
250
460
250
390
250
340
250
290
250
250
250
245
250
240250
230250220
250210
250240
250280
250
300
250320
250
390
250
410
250
430
250
440
250
490
0.05 0.1 0.2 0.3 0.4 0.5
250
510
250
540
250
550
250
260
250
270
250
280
CBRESAL (MILLION)
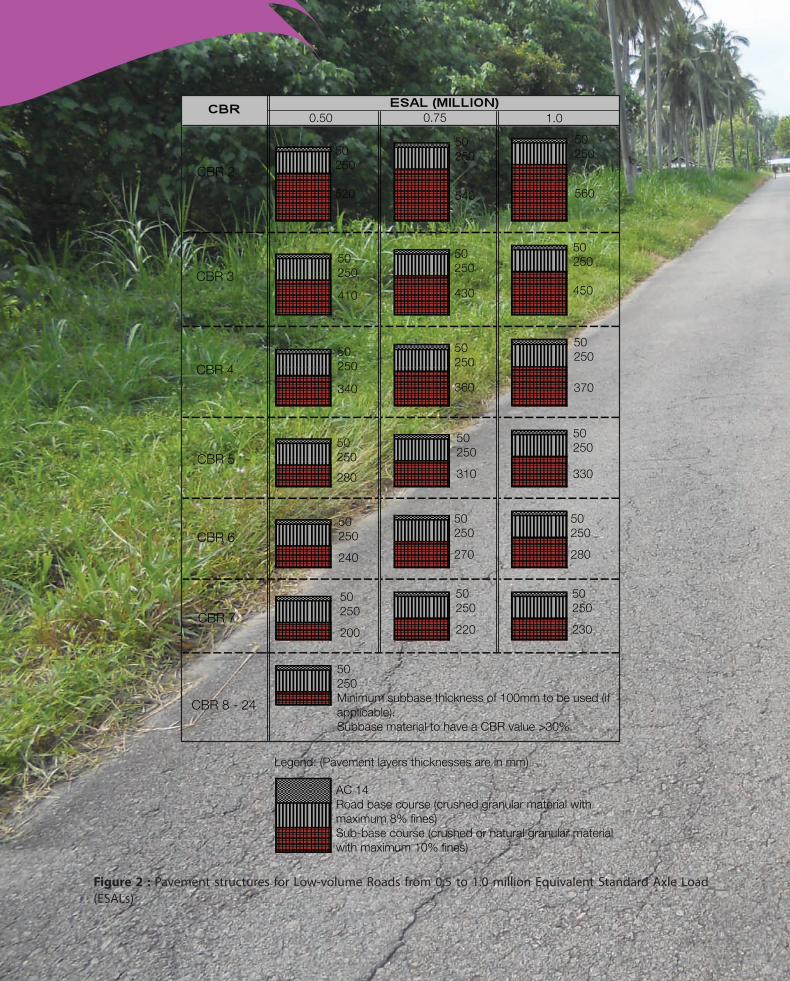
34
Figure 2 : Pavement structures for Low-volume Roads from 0.5 to 1.0 million Equivalent Standard Axle Load (ESALs)
AC 14Road base course (crushed granular material with maximum 8% �nes)Sub-base course (crushed or natural granular material with maximum 10% �nes)
CBR 2
50250
520
50250
540
0.50 0.75 1.0
50250
560
50250
450
50250
370
50250
330
50250
230
50250
220
50250
200
50250
280
50250
270
50250
240
50250
310
50250
360
50250
410
50250
340
50250
430
50250
280
CBR 3
CBR 4
CBR 5
CBR 6
CBR 7
CBR 8 - 24
Legend: (Pavement layers thicknesses are in mm)
50250Minimum subbase thickness of 100mm to be used (if applicable).Subbase material to have a CBR value >30%.

Figure 3 : Alternative pavement structures for traffic up to 1.0 million Equivalent Standard Axle Load (ESALs)
Surface treatment
AC 14
Road base course (crushed granular material with maximum 8% fines)Sub-base course (crushed or natural granular material with maximum 10% fines)
Stabilised subgrade (minimum 80% CBR & UCS ≥0.8 MPa)
Stabilised base (minimum 80% CBR & UCS ≥0.8 MPa)
Legend: (Pavement layers thicknesses are in mm)
CBR 5 to 10 300
50100
200
50100
150
50
200
150
50
200
100
50
100
100
50
100
100
50
100
100
250
200
200
CBR 10.1 to 20
CBR 20.1 to 30
CBR > 30
Pavement Types
ConventionalFlexible : Granular
Base
CBR Semi RigidPavement
Stabilised Base withsurface treatment
CONCLUSION
This new design guideline was developed to ease the road authority as well as road contractor to built a low-volume road particularly in the rural area with the usage of local material for the especially the existing subgrade layer. It also enhances the job opportunity
to the local people mainly during the maintenance period.
* Accepted for presentation at the 25th ARRB Conference 2012, 23 - 26 September 2012, Perth, Western Australia
3535

36
PERFORMANCE OF VARIOUS
PIEZOMETERS IN SOFT MARINE CLAY IN
KANDANG, MELAKA
IR. EDAYU BT. SALEH @ AMANPenolong Pengarah Kanan (Awam)
Cawangan Pengurusan Korporat
B. Eng (Civil), Universiti Teknologi Malaysia
M.Sc (Civil & Structure), Universiti Kebangsaan Malaysia
ABSTRACT
The main problem in construction of embankments on soft clay other than stability is settlement.
Usually the more important parameters that govern the consolidation process is pore water pressure. The objective of this study is to evaluate the performance of various types of piezometer under loading which changes with time. A 2.7 m high trial embankment constructed on top of soft clay was installed with 24 piezometers from four different types; standpipe, pneumatic, vibrating wire and fiber optic. The instruments were installed at 2.0 and 5.0 m depths. A site in Kandang, Melaka was chosen as a research area under a JKR project entitled “Menaik Taraf Jalan Simpang Ampat - Alor Gajah – Muar - Melaka”. The performances of the piezometers were observed for one year to monitor excess pore water pressure patterns. The study was also conducted to observe the performance of the piezometers under different type of installation methods: conventional and grout-in method. In the conventional method, sand was used as intake zone whereby in the grout-in method, water, cement and bentonite mix was used to grout the whole borehole. Eight (8) different mixes were prepared in the laboratory and only 2 mixes which have similar strength and permeability characteristics with the surrounding ground were chosen for use at the site. The results of the study indicated that the standpipe piezometer gave higher excess pore water pressure readings compared to the other types of piezometer.
The piezometer readings for the two methods of installation yield the same results. This shows that with suitable mixes, installation of piezometer using grout-in method can be practically used in Malaysia.
Keywords : piezometer, soft clay, pore water pressure
INTRODUCTION
Apart from embankment stability, settlement is another major problem that has always been associated with road construction over soft soil that requires designers’ in-depth consideration.
Pore water pressure measurement is one of the important parameters that has to be acquired in order to assess the rate of embankment settlement. Piezometers of various types were installed on site to measure pore water pressure. Nevertheless as a means to measure pore water pressure each and every type of piezometer owns advantages and disadvantages (Dunnicliff, 1993).
In conventional installation, piezometers tip is placed in sand at intake zone and topped by bentonite tablet. However due to simplicity, rapid installation, accuracy and economics, grout-in method is most preferred (Mc Kenna, 1995). Figure 1 demonstrates the difference between conventional and grout-in method of installation.

3737
STUDY OBJECTIVE
a. To compare the performance of various types of piezometer subjected to loading over finite period of time.
b. To compare the performance of various types of conventional piezometer and grout–in piezometer subjected to loading over finite period of time.
Figure 1 : Conventional and Grout-In Piezometer
Figure 2 : Study Location
Ground Surface
Grout
Grout
BentoniteTablet
IntakeZone(Sand
Conventional Method
Grout In Method
Piezometer Tip
STUDY LOCATION
The study was conducted at Kandang, Melaka in the west coast of Peninsular Malaysia which is shown in Figure 2.
Soil Investigation
Amongst the test that had been conducted on site were two numbers of boreholes and one penetration vane. Borehole results revealed that the soil comprises of 20 meters soft layer of varied undrained strength from 15.5 kPa to 38 kPa that increases with soil depth. Summary of soil properties of the study location is shown in Table 1.
Trial Embankment
Trial embankment of 2.7 meters high was quickly constructed one layer per day. Nevertheless a gap of

38
10 days between the first and second layer occurred largely due to inevitable site constraint. Filling works was controlled as such every fill layer did not exceed 300 mm thick to ensure that the filling process is in compliance with JKR Standard Specification for Road Works: 1988.
In planning stage, trial embankment was planned to be constructed symmetrically. However due to inevitable site constraint during construction, all piezometers location were concentrated in only one side as shown in Figure 3. The outermost piezometers were installed at minimum distance at 2 meters from embankment edge.
Instrument Installation Works
Four types of piezometers in 24 numbers which comprises of standpipe, pneumatic, vibrating wire and fibre optic were installed on site to a depth of 2 meters and 5 meters respectively. Their performances were monitored for about one year to investigate pore water pressure dissipation trend. However, fibre optic piezometer was inevitably excluded from this study due to its malfunction subsequent to embankment completion.
Piezometers were installed at six locations namely location A,B and C which comprise of 2 meter depth piezometers and on the other hand location D, E and F comprise of 5 meter depth piezometers. By installation method, at location A and D they were conventional and in contrast to location B and E they were grout-in of M1 mix (13% cement: 5% bentonite: 82% water) and at location C and F, they were also grout-in of M2 mix(10.5% cement: 7.5% bentonite:82% water). All the standpipe piezometers at all locations were installed by conventional method. Observation well was also constructed away from the embankment to measure ground water level for the purpose of this study and monitored continuously for one year. Piezometers layout plan is shown in Figure 3.
Magnetic extensometers were installed at 2 meters and 5 meters depth at location C, D and F to measure the settlement rate at piezometers tip level for the purpose of adjustment of piezometer reading.
GROUT MIX DESIGN
Eight numbers of grout mix of different cement:bentonite:water ratio were designed and tested in laboratory to investigate their rheology,
Table 1 : Summary of Soil Properties of the Study Location
BH SampleNo
Depth(m)
MoistureContent,
m(%)
UnitWeight,
ϒb(kN/m3)
SpecificGravity
G3
Atterberg Limit Particle Size Analysis
LL
(%)
PL
(%)
PI
(%)
Gravel
(%)
Sand
(%)
Silt
(%)
Clay
(%)
BH 54A D2 1.0 - 1.45 36.72 2.61 38.4 22.65 15.75 0 5 78 17
UD 1 2.0 - 3.0 51.15 16.7 2.62 57.2 23.54 33.66 0 3 59 38
D3 3.0 - 3.45 59.78 2.62 59.5 22.22 37.28 0 2 65 33
UD 2 5.0 - 6.0 65.13 15.7 2.65 66.9 22.74 41.16 0 3 46 52
D4 6.5-6.95 64.27 2.59 54 32.86 39.14 0 1 56 43
UD3 8.0 - 9.0 51.15 16.7 2.63 55 22.75 32.28 0 3 42 55
D5 9.0 - 9.45 49.07 2.68 54.2 23.61 30.59 0 2 64 34
BH 54 UD 1 2.0 - 2.5 40.9 17.2
UD 2 5.0 - 5.5 54 15.7
UD 3 8.0 - 8.5 68 15
D9 13.5 - 13.95 64 27 37 1 63 36
D15 22.5 22-95 1 30
D23 34.5 - 34.95 51 33 16
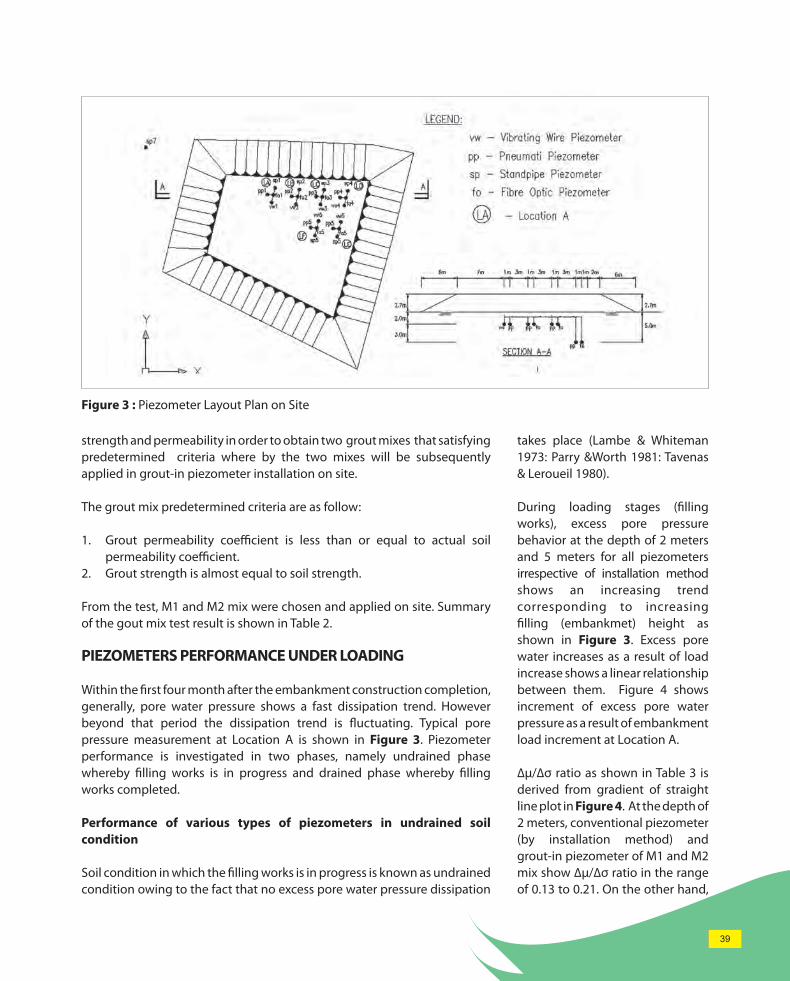
39
strength and permeability in order to obtain two grout mixes that satisfying predetermined criteria where by the two mixes will be subsequently applied in grout-in piezometer installation on site.
The grout mix predetermined criteria are as follow:
1. Grout permeability coefficient is less than or equal to actual soil permeability coefficient.
2. Grout strength is almost equal to soil strength.
From the test, M1 and M2 mix were chosen and applied on site. Summary of the gout mix test result is shown in Table 2. PIEZOMETERS PERFORMANCE UNDER LOADING
Within the first four month after the embankment construction completion, generally, pore water pressure shows a fast dissipation trend. However beyond that period the dissipation trend is fluctuating. Typical pore pressure measurement at Location A is shown in Figure 3. Piezometer performance is investigated in two phases, namely undrained phase whereby filling works is in progress and drained phase whereby filling works completed.
Performance of various types of piezometers in undrained soil condition
Soil condition in which the filling works is in progress is known as undrained condition owing to the fact that no excess pore water pressure dissipation
Figure 3 : Piezometer Layout Plan on Site
takes place (Lambe & Whiteman 1973: Parry &Worth 1981: Tavenas & Leroueil 1980).
During loading stages (filling works), excess pore pressure behavior at the depth of 2 meters and 5 meters for all piezometers irrespective of installation method shows an increasing trend corresponding to increasing filling (embankmet) height as shown in Figure 3. Excess pore water increases as a result of load increase shows a linear relationship between them. Figure 4 shows increment of excess pore water pressure as a result of embankment load increment at Location A.
∆µ/∆σ ratio as shown in Table 3 is derived from gradient of straight line plot in Figure 4. At the depth of 2 meters, conventional piezometer (by installation method) and grout-in piezometer of M1 and M2 mix show ∆µ/∆σ ratio in the range of 0.13 to 0.21. On the other hand,

40
Table 2 : Summary of Test Result of Grout Mix
Figure 3 : Excess Pore Water Pressure at Location A (Conventional Piezometer at 2m Depth)
Mix. No.
(Water : Cement : Bentonite)
Types of Test
Rheology Setting Time
Unconfine Compression
Strength*
Permeability Coefficient*Bleeding Fluidity
(%) (s) (Day) (KPa) (m/s)
M1 (82%:13%:5%) 2.5 34 9 33.4 8.57x10⁻⁸
M2 (82%:10.5%:7.5%) 0.62 55 9 40.4 7.20x10⁻⁸
M3 (82%:9%:9%) 0.48 107 8 45.4 6.37x10⁻⁸
M4 (82%:7.5%10.5%) 0 231 7 46.9 4.32x10⁻⁸
M5 (82%:5%:13%) 0 - 6 53.9 2.87x10⁻⁸
M6 (80%:10%:10%) 0 - 6 48.8 5.67x10⁻⁸
M7 (75%:10%:15%) 0 - 2 146.1 1.74x10⁻⁸
M8 (78%:13%:9%) 1.23 151 3 114.2 2.21x10⁻⁸
Note: * Test Conducted on 28 Days Grout.

41
Figure 4 : Excess Pore Water Pressure Increment against Vertical Stress Increment at Location A
Table 3 : Δu/Δσ Ratio and Maximum Excess Pore Water Pressure
Location Depth InstallationMethod
Instrument No. Δu/Δσ
Max. Excess Pore Water Pressure
m H2O
A 2 m conventionalSP 1APP 1VW 1
0.170.180.16
1.941.481.46
B 2m Grout M1SP 2PP 2VW 2
0.200.180.13
1.501.821.36
C 2m Grout M2SP 3PP 3VW 3
0.200.210.18
1.991.721.30
D 5m conventionalSP 4PP 4VW 4
0.200.210.21
2.351.891.65
E 5m Grout M1SP 5PP 5VW 5
0.220.180.17
2.591.481.48
F 5m Grout M2SP 6APP 6VW 6
0.200.280.23
2.482.301.99

42
Table 4 : Dissipation Percentage of Excess Pore Water Pressure
at the depth of 5 meters the piezometers show ∆µ/∆σ ratio in the range of 0.17 to 0.28.
In a trial embankment of 1:2.5 slope profile, Tavenas et al (1974) reported that the soft founding clay behaves elastically until the embankment attained 2.4 m high and at piezometer tip of 2.6 meters in soft clay, the corresponding ∆µ/∆σ ratio is 0.32. According to Tavenas et al (1974), founding soil will be behaving elastically until the embankment attained its critical height which is equivalent to 50% of total height. However, in this trial, critical height could not be determined due to the fact that 2.7 meters high is still well below critical height.
Maximum excess pore water pressure obtained from piezometer at 2 meters depth of conventional, grout -in M1 or grout-in M2 is in the range of 1.3m H2O to 1.99 m H2O as compared to at depth of 5 meters whereby the maximum excess pore water pressure is in the range of 1.48m H2O to 2.59 m H2O. Based on data obtained from the study, the maximum excess pore water pressure obtained from various types of piezometers reveals wide range of variation whereby the highest reading is shown by stand pipe piezometer.
Performance of various types of piezometers during pore pressure dissipation
As filling works progress, excessive pore water pressure increases and as the embankment is completed the pore pressure keep on increasing for a few days before it starts to dissipate. The same pore pressure behavior was observed in trial embankment conducted in Kuala Perlis (Hussein 1995). According to Hoeg et al. (1969), rapid increase in excessive pore water pressure can be attributed to the time consumed before dissipation started. Similar possibilities could had happened in this investigation as the filling works was carried out at fast rate of 0.3m per day which had resulted in rapid increase of excessive pore water pressure.
Dissipation percentage of excessive pore water pressure is shown in Table 4. Generally, within the first four month after the embankment construction completion, pore water pressure shows a fast dissipation trend. Beyond that period the dissipation trend is fluctuating. Stand pipe piezometer shows relatively slow rate of dissipation of excessive pore water pressure as compared to other types of piezometer. Disregard stand pipe piezometer, other piezometers show dissipation
Location Instrument No
Max. Excess Pore Water Pressure
(m H2O)
% of Pore Water Pressure Dissipation Subsequent to Filling Completion
30 Days
60 Days
120 Days
150 Days
180 Days
360 Days
ASP 1A 1.94 36 42 51 86 95 75PP 1 1.48 41 55 61 79 74 22VW 1 1.46 52 53 73 34 50 46
BSP 2 1.50 48 48 61 67 45 63PP 2 1.82 49 47 69 71 78 25VW 2 1.36 54 59 63 52 67 35
CSP 3 1.99 32 26 33 80 89 72PP 3 1.72 54 55 62 61 66 15VW 3 1.30 47 55 64 46 62 39
DSP 4 2.35 42 39 57 88 93 79PP 4 1.89 41 52 59 53 65 36VW 4 1.65 41 62 66 30 42 44
ESP 5 2.59 29 25 42 61 67 55PP 5 1.48 64 68 76 73 91 39VW 5 1.48 45 61 79 68 82 60
FSP 6A 2.49 32 36 48 80 88 75PP 6 2.30 38 52 74 52 55 47VW 6 1.99 35 43 60 51 61 44

43
percentage of excess pore water pressure for the first four months is in the range of 42% to 79%.Similar result was reported by Adachi and Todo (1979) for west coast of Malaysia Peninsula with some variation in figures which could be attributed to different location and different rate of filling.
These dissipation trends probably could be attributed to reduction in soil permeability properties and rearrangement of soil grain structure resulting from filling works. Table 5 shows dissipation percentage of excess pore water pressure on study site and result from previous study in west coast of Malaysia Peninsula for comparison purposes.
Generally, the trend of pore pressure dissipation revealed by the grout-in M1 and grout-in M2 piezometers almost similar as compared to conventional (by installation method) piezometers both at 2 meters depth and at 5 meters depth. This indicates that both grout mix are applicable for grout-in piezometer installation.
CONCLUSION
During filling works, excess pore water pressure increases and as the embankment is completed the pore pressure keep on increasing for a few days before it starts to dissipate. Soft clay remains in elastic condition until filling works completed. Within the first four month after the embankment construction completion, pore water pressure shows a fast dissipation trend between 42% and 79%. Beyond that period the dissipation trend is fluctuating. These dissipation trends probably could be attributed to reduction in soil permeability coefficient and rearrangement of soil grain structure resulting from filling load.
Standpipe piezometer shows relatively slow rate of dissipation of excess pore water pressure due to the its relatively slower respond as compared to pneumatic and vibrating wire piezometer. Therefore its application in clay (low permeability) is not so suitable.
Table 5 : Comparison of Dissipation of Excess Pore Water Pressure in Present Study and From Previous Study in the west coast of Peninsular Malaysia
Location EmbankmentHeight (m)
% Dissipation of Pore Water Pressure*
Present study Melaka 2.7 42%-79% within 4 months
Adachi & Todo (1979) Pulau Pinang 3.3 40%-60% within 12 months
James (1970) Kedah 2.74 75%-95% within 2 to 3 months
Mesri & Choi (1979)
Pulau Pinang 3 40% within 1 month
Note: * % Dissipation of Excess Pore Water Pressure Subsequent to Filing Completion

44
* Accepted for presentation at the 8th International Conference and Transportation Engineering “GEOTROPIKA 2010”, 1-3 December 2010, Sutera Harbour, Sabah
Piezometer that has been installed conventionally and by grout-in method show similar reading indicates that grout mix is suitable and applicable in clay on study site. Owing to the fact that the soft clay parameters on the site within the range that shown by the clay in the west coast of peninsular Malaysia, probably the grout mix is also applicable in most part of west coast of peninsular Malaysia.
Due to its simplicity and lower installation cost as compared to conventional method, grout-in method is suggested in piezometer installation in the future. However grout mix quality must be given due attention for the mix is highly affected by bentonite quality, mixing method, mixing duration, temperature and water pH value.
ACKNOWLEDGEMENT
This study was conducted in “Projek Menaik Taraf Jalan Simpang Ampat-Muar-Alor Gajah-Melaka” and funded by the Government of Malaysia. The authors wish to express their gratitude to all those involved and have contributed to this study.
REFERENCES
[1] Adachi, K. & Todo, H. 1979. A case study on settlement of soft clay in Penang. Proc. 6th Asian Regional Conference on Soil Mechanics and Foundation Engineering 1: 117-120.
[2] Dunnicliff, J. 1993. Geotechnical instrumentation for monitoring field performance. New York : John Wiley & Sons.
[3] Hoeg, K., Andersland, O. B. & Rolfsen, E. N. 1969. Undrained behavior of quick clay under load tests at Asrum. Geotechnique 19 (1): 101-115.
[4] Hussein, A. N. 1995. The formation, properties and behavior of coastal soft soil deposits at Perlis and other sites in Peninsular Malaysia. Tesis Ph.D. University of Strathclyde, Glasgow.
[5] Lambe, T.W. & Whitman, R.V. 1979. Soil mechanics. SI version. New York : John Wiley & Sons.
[6] McKenna, G.T. 1995.Grout-in installation of piezometers in boreholes, Canadian Geotechnical Journal 32: 355-363.
[7] Parry, R.H.G. & Wroth, C. P. 1981. Shear stress strain properties of soft clay. Dlm. Brand, E. W. & Brenner, R. P. (pnyt.). Soft clay engineering, hlm. 311-364. Amsterdam: Elsevier/North-Holland Inc.
[8] Tavenas, F., Chapeau, C., Rochelle, P. L. & Roy, M. 1974. Immediate settlement of three test embankment on Champlain clay. Canadian Geotechnical Journal 11: 109 – 140.
[9] Tavenas, F. & Leroueil, S. 1980. The behaviour of embankments on clay foundations. Canadian Geotechnical Journal 17: 236-260.

45
ANALYSIS OF THE PERFORMANCE AND
IMPACT OF THE RURAL ELECTRIFICATION USING
SOLAR HYBRID SYSTEM FOR RURAL SCHOOLS IN
SABAH, MALAYSIA – CASE STUDY
ABDUL MUHAIMIN B. MAHMUDPenolong Pengarah Kanan (Elektrik)
Cawangan Kejuruteraan Elektrik
B.Eng Electrical Engineering (Hons), UiTM, Shah Alam, Malaysia
MSc Renewable Energy, University of Oldenburg, Germany
ABSTRACT
The impact and performance of solar photovoltaic (PV) hybrid system on the education and social
life style of the users at rural primary schools in Sabah, Malaysia has been analyzed in this paper. The project was initiated by the Malaysia’s Ministry of Education with the target to electrify rural schools that do not have grid connected electricity in Sabah with alternative power supply; ie, the renewable energy. The first phase was started in 2008 and the aimed was to give electricity to 78 rural schools in Sabah using Solar PV Hybrid System.
Keywords : Solar hybrid, Rural schools, JSCADA, Battery, Inverter
INTRODUCTION
Malaysia, although moving rapidly towards being a developed nation, has a considerable number of under-developed rural areas. Most of these are tiny pockets of inhibited villages, sprawling over large areas of Sabah and Sarawak (the Borneo Island part of Malaysia). In general, basic infrastructures are inadequate and grid connected electricity supply is the major one. Out of more than 10,000 schools in Malaysia, 809 in Sabah and Sarawak still lacked 24-hour electricity supply and have to rely on decentralized diesel generator as
45
the main source. The main reasons can be attributed to the remote locations of these villages and the community size is very small. These factors caused the investment cost for grid supply prohibitively expensive and un-economic. The cost of electricity using diesel generator is very high – primarily due to the fuel transportation to the sites. Furthermore, consistent electricity cannot be guaranteed because of the climatic and geographical conditions that may hamper the fuel supply route. To ensure that these areas are not lagging behind in the country’s modernization strategy, the Ministry of Education (MOE), together with the Public Works Department of Malaysia as the Project Manager, has initiated a large electrification program for rural schools in Sabah. It is recognized that stable and reliable electricity supply is the key element for conducive learning environment and enables the use of computers, communication system, lighting and etc [2].
Despite the fact that the program has been going on for two years, there is no documented literature describing the design methodology, performance analysis, economics evaluation and the social impact of the installed systems. It is envisaged that the lessons learned from these experiences can provide valuable guidelines for future rural electrification programs using Solar Photovoltaic (PV) Hybrid System. Hence this work is carried out.

Schools SK Penontomon SK Binanon SK Tudan SK Paus
Solar PV 20 kWp 15 kWp 15 kWp 24.48 kWp
Inverter system 19.2 kW 12.8 kW Grid Inv : 11.4 kW, Bidirectional Inv : 10 kW
Grid Inv : 22.8 kW, Bidirectional Inv : 15 kW
Battery system 3,200 Ah 2,250 Ah 1,500 Ah 2,000 Ah
Diesel Generator 27 kVA 20 kVA 12 kVA 20 kVA
Table 1 : The solar PV hybrid system components at the four schools [6].
METHODOLOGY
The study can be divided into two parts, which are to analyze the technical and the economical aspects of the system design and daily operation based on real data and to study and analyze the impact of the system on the end user lifestyle and the learning environment.
Impact On The Solar PV Hybrid System
Structured questionnaires were distributed to the 40 selected respondents, which consists of the teachers and pupils. The questionnaire was developed to ensure that the impact of the system can be analyzed base on;
a) Comparison of the users’ experience before and after the system installed and how the system does affects their life and the learning environment.
b) Comparison of the users’ knowledge of renewable energy especially the Solar Hybrid System before and after the installation.
c) Load management strategies which are being exercised by the users.
d) Users’ opinions on how the system can benefit the entire community should the same system implemented for their village as well.
Implementation and Operation of the solar PV hybrid System
The second part of the methodologies determines the solar PV hybrid system performance technically
and economically. The design and actual load analysis compares the design load profile with the actual load profile (average) and the system operation analysis answers the sustainability and reliability issues of the system. The measurement data, recorded by the online monitoring system; ie, JKR Supervisory Control and Data Acquisition System (JSCADA) are used to analyze the system performance. The economic analysis includes both costs and benefits of the system. Parameters like investment cost, operating cost and cost of energy are used to measure the beneficial of the system as compared to the conventional diesel generator [4].
SOLAR PV HYBRID SYSTEM
The solar PV hybrid system integrates two power sources. The system is designed to supply electricity for every building in the school like class rooms, computer lab, guard house and teachers’ quarters. For the purpose of the analysis, four primary schools have been identified to be the sample site for evaluation and analysis processes. The schools are SK Penontomon, SK Binanon, SK Paus and SK Tudan.
System Configuration
Two schools were installed with a DC couple solar PV hybrid system, and the other two schools used an AC Couple Solar PV hybrid system. Table 1 below described the system components at the schools.
46

47
RESULTS AND ANALYSIS
User Experiences
Knowledge
All of the teachers and only six pupils have some knowledge of the solar PV system before the installation of the system. The numbers of the pupils that gain information of the system after it is in operation increased by 10%.
Books, magazines and newspapers are the popular sources of information of the system. 40% of the respondents have read about the technology. For the pupils, most of them knew about renewable energy by reading from the school library. Alternative information is from the internet as 20% of the respondents get the information from the World Wide Web (www.). The internet can be access from the school’s computer lab or at other places/towns nearby.
35% of the respondents have seen the technology before at other places/villages. The technology was installed for village communities in other rural electrification programs like Solar Home System by Ministry of Rural and Region Development and solar PV stand alone system for Rural ICT Centre by Ministry of Energy, Water and Communication.
User Training
At least a teacher from each school is required to attend training on solar PV hybrid technology. The teacher will be responsible to give the information on the technology to the other users. 24 respondents were given informal information from the trained teacher and eighteen respondents understand well about the technology, while another six respondents requested for more explanation and formal training.
Load Management Strategies
All of the respondents replied that they practiced load management when using the electricity. However, they do not have a schedule management or do not strategies their usage. All loads would only be turned on when required. For example, if during the class
there was enough sunlight to light the room, lamps will not be used. All the loads in the school building would be turned off when there is no occupant in the room, except for the equipments that need 24 hours operation like refrigerator.
Users’ Opinions
All of the respondents voted that technology gives benefit and impact to their lifestyle and the learning environment. Nowadays, the teaching and learning process is more comfortable as teachers can use interactive teaching methods using computers and projector at anytime during the school period. Besides, the teachers and pupils can get access to the internet from the already installed satellite communication system (Very Small Aperture Terminal – VSAT). There is no case of damage electronic equipments after the installation and for teachers who live in the teachers’ quarters; they can access the latest news and entertainment from the television and radio, store food in the refrigerator, and stay awake for more time during the night. As for the pupils, they can have extra classes during the night especially for pupils who will sit for the national primary school examination.
The respondents believe that, electricity is an important element for developing a community and nation and therefore can bridge the development gap between the urban and rural areas in economy, education, lifestyle, communication and etc.
Design and Actual Load Analysis
Figures 1 and 2 below show the comparison of the load profile for SK Penontomon schools.
The actual base load (minimum load) for the school is double the value of the design base load. The maximum actual load is half the value of the design load. The maximum actual load for SK Penontomon occurred at night instead of day as assumed in the design profile.
The total daily energy consumption was less 30% than the design values. The actual energy consumption at SK Penontomon was higher at night. The reason is the teachers’ quarters in SK Penontomon contribute 41% of the total load sharing. The same load profile was found at the other schools as well.
47

System Operation Analysis
Parameter that can determine the reliability of the PV system to supply electricity to the load is Loss of Load (LL). Moreover, another two useful parameters are the Generator Capacity, CA and the Accumulator Capacity, CS. CA, is defined as the ratio of the daily energy output of the PV generator divided by the daily energy consumption of the load [3]. CS is the maximum energy that can be extracted from the accumulator divided by the daily energy consumption of the load [3]. Hence the equations will be;
Figure 1 and 2 : The design load profile [6] (left) and the actual load profile (right) for SK Penontomon. The actual load profile was calculated based on the load consumption in September 2009 recorded from the JSCADA system
Design Load Profile - SK Penontomon
0
1,000
2,000
3,000
4,000
5,000
6,000
7,000
01:00 03:00 05:00 07:00 09:00 11:00 13:00 15:00 17:00 19:00 21:00 23:00Hour
Load
(W)
Design Load Profile
Actual load profile - SK Penontomon
0
1,000
2,000
3,000
4,000
5,000
6,000
7,000
00:00 02:00 04:00 06:00 08:00 10:00 12:00 14:00 16:00 18:00 2 0:00 22:00Time
Pow
er (W
)
Actual load profile
LEPVCA
(1)
LCC U
S (2)
Where EPV is the daily energy output of the PV generator, L is the daily energy consumption of the load and Cu is the maximum energy that can be extracted from the battery. For rural electrification purposes as mentioned in [3], the values of both CA and CS are commonly used as CA ≈ 1.1 and 3 ≤ CS ≤ 5. But CA is also depending on the local solar climate condition.
Solar fraction, also known as renewable energy fraction, is the amount of energy provided by the solar technology system divided by the total energy required [5]. This shows the system dependency on the solar PV as compared to the diesel generator.
Parameter Symbol SK Penontomon
SK Binanon SK Tudan SK Paus
Loss of load LL 0% 0% 0% 0%
PV Generator capacity CA 1.57 1.3 1.39 1.21
Accumulator capacity CS 5.76 6.5 6.1 4.62
Solar Fraction SF 92% 92% 100% 100%
Performance Ratio % 75% 70% 81% 82%
Table 2 : Summary of the system energy parameters in a month
48

49
The system satisfies the entire load required. Loss of load value of zero shows that the system which consists of PV, storage and generator is reliable and can produce sufficient and sustainable energy to satisfy the electricity demand by users.
The combination of the PV and the diesel generator shows that the system is not very dependent on the usage of the generator and allows a significant lower quantity of diesel used during the measurement. The data also showed that the system can work without any major problems.
Table 3 : Result from Homer simulation on the economic aspect [4]
Parameters20 kWp solar PV hybrid system
Diesel generator Solar Hybrid System
Investment cost €134,371.00 €568,131.00
Operating cost €59,787.00/yr €49,415.00/yr
Diesel Generator energy produced 29.36 MWh/yr 2.06 MWh/yr
Diesel consumption 12,514.00 L/yr 778.00 L/yr
Cost of Diesel1 €18,771.00/yr €1,167.00/yr
Figure 3 : Project total cost of the solar hybrid system. The project lifetime is at 25 years
PV, 16.59%
Batteries, 44.56%Converter, 1.78%
Charge Controller, 0.36%Diesel Generator, 2.24%
O&M, 25.80%
Fuel, 0.91%Civil, 3.45%
Electrical, 4.31%
PV Batteries Converter Charge Controller Diesel Generator O&M Fuel Civil Electrical
Project Total Cost with lifetime at 25 years
Economic Analysis
The operating cost which includes the cost of diesel shows that the client will be burden by the higher cost for operating the diesel generator system compared to the solar hybrid system. For solar PV hybrid system, the service and maintenance routine should be done at least twice a year excluding the corrective maintenance. The diesel generator for the solar PV hybrid system has less services every year since the operation hours is minimum.
Figure 3 is the total cost of the project in twenty five years of its lifetime. It includes the components cost including their replacement cost, civil works of building the power house, electrical works especially for mini grid installation, fuel cost and the operation and maintenance costs. Replacement of batteries is considered in every 6 years, diesel generator in 8 years and inverter and charge controller in 15 years [3]. It is clearly shows that the batteries are the most important component of the system as it contributes 45% of the lifetime project cost.

50
CONCLUSION
In general the solar hybrid system offers better services to the rural schools than the old and conventional diesel generator system. The technology gives benefit and impact to the pupils and teachers by creating more comfortable lifestyle and conducive learning environment.
The measurements and simulation of the system shows that the solar hybrid system can produce reliable power supply to meet the electricity need of rural schools. The system was designed and configured correctly but predicting the load pattern to be as accurate as the actual load consumption has always been the challenging part.
The combination of the PV-batteries-generator reduces the dependency of the fuel consumption and fully utilizes the clean energy from the sun. Even though a diesel generator system costs less than a solar hybrid system, but the fact that its operating costs in providing a proper service and maintenance makes the system less favorable compared to the solar hybrid system. The study shows that most important component is the batteries as it contributes almost half of the total lifetime cost and almost half of the daily load consumption is served by the batteries. Improper handling and usage on the system may directly affect the batteries performance which may lead to the failure of the system.
The main barrier in implementing PV system in any rural electrification program is the operation period. PV system and its implementation are frequently looked upon in a very simplistic manner by a number of people which has resulted in a large number of failures [3]. Proper transfer of technology training program is required for the end users because the awareness and knowledge on the system technology are equally as important as the adequate financing and institutional framework.
REFERENCES
[1] National Green Energy Technology Policy, (2009), Ministry of Energy, Green Technology and Water, Malaysia.
[2] United Nation Development Programme – Malaysia, MDG7 – Achieve Universal Primary Education, http://www.undp.org.my/
[3] Luque, L., Hegedus, S., (2003), Handbook of Photovoltaic Science and Engineering, Wiley.
[4] National Renewable Energy Laboratory, HOMER – The Micropower Optimization Model, http://www.nrel.gov/homer
[5] Wikipedia, Solar Saving Fraction, http://en.wikipedia.org/wiki/Solar_fraction
[6] Public Works Department of Malaysia, (2008), Cadangan Merekabentuk, Membina, Membekal, Menyiapkan dan Menyelenggara Sistem Solar Hibrid Bagi Sekolah Luar Bandar Negeri Sabah Pakej 1(Design, Build, Supply, Commission and Maintain of the Solar Hybrid System for Rural Schools in Sabah Package 1), Contract Document.
* Presented at 6th European Conference on PV-Hybrid & Mini Grid 26-27 April 2012, Chambery, France

5151
STRUCTURAL ASSESSMENT AND STRENGTHENING
OF A CRACKED BRIDGE PIER
IR. DR. LIM CHAR CHINGKetua Penolong Pengarah Kanan (Awam)
Cawangan Kejuruteraan Awam, Struktur dan Jambatan
B.Sc (Hons 1)(Civil), University of Glasgow, United Kingdom
M.Eng (Structures), Asian Institute of Technology, Thailand
PhD (Civil Engineering), University of New South Wales, Australia
ABSTRACT
Severe cracks were found on several piers of a viaduct which was opened to traffic after 5 years. A design
review was carried out to determine the design adequacy of the pier structure with respect to the bridge design code BS5400 and design highway loadings to BD37/88. In addition, the JKR assessment load called the “Medium-Term Axle Load” was also used to assess the design adequacy of the pier with respect to the current vehicular loads permitted on the viaduct under the Malaysian Weight Restriction (Federal Roads) Order 2003.
This paper presents the structural assessment and analysis of one of the piers at the viaduct, designated as P-11A. P-11A is an inverted “L-shape” pier consisting of a crosshead beam supported on a circular column. Results from structural analysis indicated that the pier satisfied the ultimate limit state condition. However, it did not comply with the crack width limit at serviceability limit state. It was also found that poor structural detailing had led to the occurrence of cracks on the crosshead beam. A structural strengthening method was proposed.
Keywords : Structural assessment, bridge pier, strengthening, cracks
INTRODUCTION
A 2.7 km long viaduct connecting the West Port and North Port in the state of Selangor was constructed in 1997. The superstructure consisted of reinforced
concrete slabs on prestressed concrete beams spanning across 28.0m. The piers were reinforced concrete with a typical crosshead beam supported on circular columns. The viaduct was completed and opened to traffic in 1999. Cracks on the crosshead beams and columns were found in several piers in 2004 and again in few other piers in 2010.
An independent design review was carried out to determine the design adequacy of the pier structure with respect to bridge design code BS5400 and design highway loadings to BD37/88[1]. In addition, the JKR assessment load called the “Medium-Term Axle Load” [2] was also used to assess the design adequacy of the pier with respect to the current vehicular loads permitted on the viaduct under the Malaysian Weight Restriction (Federal Roads) Order 2003[3].
This paper presents the structural assessment and analysis of Pier Type 1 at the viaduct. Pier Type 1 is an inverted “L-shape” pier consisting of a crosshead beam supported on a circular column as shown is Figure 1. The pier is supporting a span of 28.0m on both sides. Each span of the superstructure consists of 6 nos. of precast M10 girders and 2 nos. of precast UM10 edge girders. The pier is supported on 4 nos. of 1200mm dia. bored pile with a working capacity of 6,000kN each. There are 25 number of Pier Type 1 at the viaduct and at least 15 of them have cracks on the crosshead beams and columns. Overall height of the pier (H) varies from 10.5m to 11.1m. Concrete grade 40 was used for the pier.

52
CRACK MAPPING AND MATERIAL TESTS
A typical detailed crack mapping of the pier is shown in Figure 2. Cracks are randomly patterned and the measured crack widths between 0.1mm to 0.4mm. A few 50mm diameter cores were taken across the cracks to determine the crack depths below the concrete surface. Petrographic examination was carried out on some cored samples from the pier to determine material-related chemical reactions such as Delayed Ettringite Formation (DEF) or Alkali-Aggregate Reaction (AAR). Crack movements were monitored by Demec Gauge over 3 months duration.
DESIGN REVIEW
Information from the as-built drawings was used to develop a 3-D model of Pier Type 1 to investigate the maximum induced forces acting on the pier column and crosshead beam. The forces were checked against two limit state conditions, i.e., Serviceability Limit State (SLS) and Ultimate Limit State (ULS). The axial and bending capacities were computed and checked against the maximum forces from the analysis under ULS condition. The
Figure 1 : A Typical Cross-Section of Pier Type 1
View from West Port View from North Port
Figure 2 : Typical Crack Mapping of Pier Type 1

5353
crack widths were computed based on the maximum force from the analysis under SLS condition. Strut and Tie models (STM) and Finite Element Analysis (FEM) were performed to investigate the tension tie forces and localized tensile stress distribution of the pier crosshead beam.
The highway live loads are in accordance with BD37/88 and load applications are in accordance with the notional lane width concept in BS5400. In addition, the JKR Assessment Load (called the Medium-Term Axle Load) was also considered. MTAL consists of HA-UDL and HA-KEL representing the load effects of the vehicle fleets in Malaysia complying with the current Weight Restriction (Federal Roads) Order 2003. MTAL loads were applied on 2.5m fixed-lane width concept [2].
RESULTS AND DISCUSSION
Crack Depths
Semi-destructive in-situ concrete cores sampling were carried out by extracting 50mm diameter concrete cores from the pier columns and crosshead beams. The cores were taken by drilling across the cracklines using a diamond core cutter. Twenty numbers of concrete core samples were carried out on several piers and the results of the crack depths are shown in Table 1. Shallow cracks are due to shrinkage. However, deep cracks, i.e., where the crack depth goes beyond the cover thickness, could be structural. Results from Table 1 shows that some of the cracks on the pier may be due to structural issue.
Table 1 : Average Crack Depths of Pier Type 1
Pier No. Average Crack Depth (mm)
Crosshead Beam Column
10 45 25
11 15 45
12 150 100
13 75 35
14 80 -
15 110 -
Petrographic Examination
Two numbers of concrete core samples were sent for petrographic examination in accordance with ASTM C856-04 - “Standard Practice for Petrographic Examination of Hardened Concrete”. The core sizes are Ø100mm x 145mm and Ø75mm x 115mm. Results from the examination do not indicate the presence of delayed ettringite formation (DEF), alkali-silica reaction (ASR) and alkali-carbonate reaction (ACR). Hence, the cracks on the pier are not caused by material-related chemical reaction.
Crack Movement
Demec gauge was used to measure the crack width movement of some cracks on six numbers of piers. Crack width measurements were taken on a weekly basis for a period of 3 months. The initial crack width recorded on the first week was used as a datum to compute the net movement of the crack during the 3-month monitoring period. Figure 3 shows typical results of crack width monitoring for 2 piers. The crack widths are stable and there is no significant trend to increase in size.
Structural Analysis
Structural analyses were carried on three types of model; (a) 3D framed structure for superstructure and pier, (b) 2D strut and tie model for crosshead beam, and (c) 2D finite element model for pier.
3D Framed Analysis
The results of Ultimate Limit State (ULS) for moment and shear checks are shown in Table 2 and Table 3 respectively. Shear capacity of pier crossbeam is checked at critical section, i.e., 2.5m depth. Pier Type 1 is found to satisfy the ULS condition for bending and shear for both loading criteria, BD37/88 and JKR-MTAL. However, at Serviceability Limit State (SLS), the computed crack widths of 0.40mm and 0.42mm at pier column have exceeded the allowable limit of 0.25mm. The measured crack width at pier column was between 0.1mm and 0.40mm.

54
Figure 3 : Typical Crack Monitoring Results
Pier Type 1Loading Criteria
Max ULS Moment
(kNm)
Ultimate Moment Capacity (kNm) Capacity
Ratio* Remarks
Pier Crosshead Beam
BD37/88 25,805 26,069 0.99 OK
JKR MTAL 25,173 26,069 0.97 OK
Pier ColumnBD37/88 Within P-M plot (see Fig.4) OK
JKR MTAL Within P-M plot (see Fig.5) OK
*Capacity Ratio = Max ULS Moment / Ult. Moment Capacity
Loading Criteria Load Case (Asv/sv)reqd (Asv/sv)prov Capacity Ratio
Remarks
BD37/88
ULS1C1 7.72 8.04 0.96 OK
ULS2C1 7.28 8.04 0.90 OK
ULS3C1 6.96 8.04 0.87 OK
ULS4C1 7.71 8.04 0.96 OK
JKR-MTAL ULS1C1 7.57 8.04 0.94 OK
Pier Type 1 Loading Criteria
Calculated Crack Width (mm)
Allowable Crack Width (mm)
Remarks
Pier Crosshead BeamBD37/88 0.27
0.25Not OK
JKR MTAL 0.25 OK
Pier ColumnBD37/88 0.42
0.25Not OK
JKR-MTAL 0.40 Not OK
Table 2 : Summary of ULS Moment Capacity Check for Pier Type 1
Table 3 : Summary of ULS Shear Capacity Check for Pier Type 1 (Crosshead Beam)
Table 4 : Summary of SLS Check for Crack Width

5555
2D Strut and Tie Analysis
The strut and tie analysis was carried for pier crosshead beam only. Figure 6 shows the as-built reinforcement details of Pier Type 1. The strut-and-tie model (STM) of the pier crosshead beam in Figure 7 was constructed from the as-built reinforced concrete details in the construction drawings.
Figure 4 : P-M Plot for Pier Column Figure 5 : P-M Plot for Pier Column (JKR-
TENSION (TIE)
COMPRESSION (STRUT)
Figure 6 : As-built Reinforcement Details of Pier Type 1
Figure 7 : Strut and Tie Model of Pier Crosshead Beam
N1 to N8 are the reactions of the superstructure on the crosshead beam corresponding to BD37/88 loadings for ultimate limit state condition under load combination 1. Figure 8 shows the axial force diagram. The summary of strut and tie design check is given in Table 5. The top flexural reinforcement in the crosshead beam is found to be adequate. Beam is safe against diagonal compression failure. However, results show inadequate vertical reinforcements at critical sections, i.e., column-beam interface.
Figure 8 : Strut and Tie Axial Force Diagram
Tie
Strut
For tie member 103-203, the reinforcement required was 26,700 mm2 against 14,311 mm2 from the shear reinforcements in the beam. The column main reinforcements Y32@150 into the beam were not considered in the tie resistance because of insufficient anchorage into the top reinforcements. These reinforcements should have been extended into the beam’s top flexural reinforcements and followed by a bend for adequate anchorage.

56
2D Finite Element Analysis
The finite element analysis was carried out to determine the tension zone in the pier crosshead beam corresponding to BD37/88 loadings for serviceability limit state condition under load combination 1. Figure 9 shows the S22 tensile stress zone extends approximately 2.0m from the top of pier column into the crosshead beam. The column main reinforcements should not be terminated in the tension zone but extended to the beam top flexural reinforcement for adequate and proper anchorage. The poor detailing of the column main reinforcements anchorage into the beam have resulted in cracks at the crosshead beam.
STRUCTURAL STRENGTHENING
Pier Column
Remedial work to pier column is essentially to fulfil the serviceability requirement. Cracks have to be
Member Number Strut or Tie
Member Force (kN)
Reinf. req’d (mm2)
Reinf. prov (mm2) Remarks
103-104 Tie 9,190 22,964 27,336 OK
104-105 Tie 9,190 22,964 27,336 OK
103-203 Tie 10,685 26,700 14,311* Not OK
105-205 Tie 3,670 9,161 8,040 Not OK
204-205 Strut 7,675 conc. stress = 4.5MPaallowable stress = 0.4fcu
= 16MPa
OK
103-204 Strut 14,532 diagonal compression strut capacity = 26,137 kN
OK
*Area of stirrup in beam was considered only. Column reinforcement Y32@150 into beam was ignored because it did not contribute to strut and tie model due to inadequate anchorage.
Figure 9 : Pier Type 1 – S22 Tension Stress Diagram
Tension12.0
11.1
10.2
9.3
8.3
7.4
6.5
5.6
4.7
3.8
2.8
1.9
1.0
0.1
sealed to ensure concrete durability is not compromised. Suitable polymer-modified cementitious waterproofing coating was specified. The material has an excellent crack bridging capacity up to 1.0mm crack width.
Pier Crosshead Beam
Carbon fibre reinforced polymer (CFRP) plates were proposed to strengthen the region where the main pier column reinforcement anchorage length into the crosshead beam was found to be insufficient. Figure.10 shows a typical detail of the proposed strengthening.
Table 5 : Summary of Strut and Tie Design Check

5757
CONCLUSIONS
Pier Type 1 was found to satisfy the ultimate limit state requirement for strength. However, it did not comply with the crack width limit of 0.25mm at serviceability limit state. It was also found that poor structural detailing had led to the occurrence of cracks at the crosshead beam. The column main reinforcement should not have terminated in the tension zone of the crosshead beam, i.e., within 2.0m from the top of pier column. Instead, it should be extended to the beam top flexural reinforcements, with a 90o bend at the end, for a proper anchorage. Structural strengthening using CFRP laminates were used externally to address the inadequate anchorage of the column reinforcements in the beam.
ACKNOWLEDGEMENT
The authors would like to thank the Director-General of Public Works Department Malaysia and the Senior Director of Civil, Structural and Bridge Engineering
Branch of PWD Malaysia for their permissions to publish this paper.
REFERENCES
[1] Public Works Department Malaysia (2011), “An Independent Design Check of the Piers at Viaduct on Federal Route FT180/001/40 West Port to North Port, Selangor Darul Ehsan”.
[2] Government of Malaysia (1987), “Report on Axle Load Study”, Rendel Palmer & Tritton Ltd. in association with Minconsult Sdn Bhd and jointly with Ministry of Works, Malaysia.
[3] Road Transport Act 1987 – Weight Restriction (Federal Roads) Amendment Order 2003, Ministry of Transport Malaysia.
Figure 10 : Typical CFRP Strengthening to Pier Type 1
* Presented at 13th International Conference on Inspection, Appraisal, Repairs and Maintenance of Structures, 27-28 July 2012, Wuyishan, China
58
DO WE NEED CRUMB RUBBER
ASPHALT?MOHD HIZAM B. HARUN
Ketua Penolong Pengarah (Awam)Cawangan Kejuruteraan Senggara
BSc (Hons) Civil Engineering, Leeds University, United Kingdom
Msc Higway Engineering, University of Birmingham, United Kingdom
ROZIAWATI BT. RAZALIPenolong Pengarah (Awam)
Cawangan Kejuruteraan Jalan dan Geoteknik
Sarjana Muda Kejuruteraan Awam, Universiti Teknologi MalaysiaSarjana Kejuruteraan Awam,
Universiti Teknologi Mara.
ABSTRACT
As bitumen additive, various forms of rubber which include scrap rubber from motor vehicle tyres (crumb
rubber) have been used for many years throughout the world with varying degree of success. This fact has interest to both rubber producers and road engineers in Malaysia, particularly in producing road surfacing bituminous materials with improved durability and stability. In addition, the use of crumb rubber sounds very attractive from the point of view of preservation of the environment. The disposal of used tyres poses quite a serious problem in Malaysia and throughout the world as they are virtually indestructible except by burning which again creates another problem in the form of air pollution. With this in mind, a Memorandum of Agreement between Lembaga Getah Malaysia (LGM) and Jabatan Kerja Raya Malaysia (JKR) was signed in December 2002 whereby both parties jointly agreed to carry out a joint development project titled “The Use of Crumb Rubber as Bitumen Additive”. It was specifically prepared to carry out a full-scale road trial project using crumb rubber as bitumen additive on Route 2 in Kuantan.
A full-scale road trial was successfully constructed on Route 2, Section Nos. 340 - 345, Kuantan bound, in June 2003. The objectives of the trial were to compare the performance of dense graded bituminous overlay incorporating crumb rubber modified bitumen in mitigating reflective cracking with a similar overlay using conventional penetration grade 80-100 bitumen and to assess the durability of porous asphalt incorporating crumb rubber modified bitumen as well as a proprietary modified bitumen produced by Petronas.
Based on early performance of the test sections ie. 30 months after construction, there was an indication that the presence of crumb rubber in asphalt mixtures could significantly mitigate the propagation of cracks from underlying layers through relatively thin overlay with relatively fine aggregate gradation. This was shown by considerably less percentage of cracks that was reflected. However, with coarser aggregate gradation and thicker overlay, the crumb rubber does not appear to impart appreciable improvements in resistance to reflective cracking as it was observed that the section with crumb

5959
rubber performed only slightly better than the section without crumb rubber after 30 months.
There was no ravelling in all three porous asphalt test sections after the same period. This could be attributed to the relatively thick film of binder coating the aggregates and improved resistance to oxidative aging of the binder due to the presence of either crumb rubber or proprietary additive.
INTRODUCTION
The use of scrap rubber from motor vehicle tyres as bitumen additive in the road construction industry sounds very attractive from the point of view of preservation of the environment. The disposal of the used tyres poses quite a serious problem in Malaysia and throughout the world as they are virtually indestructible except by burning which again creates another problem in the form of air pollution.
As bitumen additive, various forms of rubber which include scrap rubber from motor vehicle tyres (hereafter is referred to as crumb rubber) have been used for many years throughout the world with varying degree of success. This fact has interest to both rubber producers and road engineers in Malaysia, particularly in producing road surfacing bituminous materials with improved durability and stability. With this in mind, a Memorandum of Agreement between Lembaga Getah Malaysia (LGM) and Jabatan Kerja Raya Malaysia (JKR) was signed in December 2002 whereby both parties jointly agreed to carry out a joint development project titled “The Use of Crumb Rubber as Bitumen Additive”.
As stated in the above Memorandum of Agreement, LGM inter alia has the expertise in the development of different forms of rubber for use as bitumen additives in road construction whereas JKR inter alia has the expertise in the production and placement of asphalt mixes incorporating various forms of bitumen additive including crumb rubber.
LITERATURE REVIEW
The concept of adding rubber into bitumen is more than 100 years old. The first attempt was made in
1898 by de Caudenberg who patented a process for manufacturing rubber – bitumen. However, many difficulties were encountered in exploiting the patent and the process lapsed before 1914.
While the rubber industry had been using bitumen to modify rubber for various purposes, no further progress was made in the modification of bitumen by adding rubber until rubber in granular or powder form was developed in 1930. Then, laboratory assessment and some full-scale road trials on rubber-modified bitumen commenced, notably in the Netherlands and Great Britain. It was reported that the trial sections laid in 1936 at Bussum, the Netherlands showed marked improvement, and the rubberised rolled-asphalt surfacing at New Cross, Great Britain was still in good condition in 1959 after 22 years1.
The concept of using recycled rubber from car and truck tires, typically referred to as crumb rubber, is at least 50 years old. Laboratory and field trials were carried out from the mid 1950s onwards. Experiments showed promising results when crumb rubber - modified binder was used for seal coats and stress-absorbing membranes, but yielded initially mixed results in terms of performance and cost effectiveness when crumb rubber was used as modifier for asphalt paving mixtures.
Experiences in the United Kingdom
During the period 1953 – 1966, the Road Research Laboratory of the United Kingdom in co-operation with the Natural Rubber Producers’ Research Association (NRPRA, Malayan Rubber Fund Board) carried out a research programme to investigate the possibility of improving the performance of road surfacing by incorporating a small proportion of rubber in bituminous binders1.
In those early days, the forms of rubber which were available for incorporation into the binder were;
i. Latex. Extract from rubber trees which was concentrated and stabilised in various ways. Available in two forms, evaporated and centrifuged.
ii. Sheet rubber. Made from coagulated latex.
60
iii. Rubber powder. Made either by spray-drying the latex or by hammer-milling lightly vulcanised coagulum to form a crumb. Available in several forms; • Pulvatex – an unvulcanised rubber powder
containing 40% inert filler.• Mealorub – a lightly vulcanised powder
containing 96% rubber.• Harcrumb – substantially similar to Mealorub.
Manufactured in then Malaya.• Rodorub – a lightly vulcanised powder
containing 75% natural rubber and 25% inert filler.
iv. Ground tyre-tread. Waste tyres ground into a powder.
In Huntingdonshire, it was reported that bitumen macadam, rubberised by direct addition of about 7% Pulvatex to the asphalt mixes and laid down in 1955, had lasted eight years as compared to a normal life of six years with standard bitumen macadam2.
In a full-scale experiment on trunk road A6 in Leicestershire in 1963, Szatkowski3 reported that asphalt mixes containing 4% natural rubber in the form of evaporated latex and with the binder content increased by 1% had exhibited more resistant to reflection cracking than standard mixes.
It was highlighted elsewhere4 that latex was the most effective form of rubber, followed by unvulcanised rubber powders (eg. Pulvatex). Vulcanised rubber powders (eg. Harcrumb) dispersed more slowly and were less effective due to the breakdown of rubber during dispersion. As such, addition by dry process was not recommended.
In their Technical Bulletin No.95, NRPRA highlighted that four forms of natural rubber which were commonly used in the preparation of bituminous binders were centrifuged latex, evaporated latex, lightly vulcanised or unvulcanised rubber powders specially prepared for blending into bitumen (eg. Harcrumb, Rodorub and Pulvatex) and sheet rubber. Rubber powder from scrap sources was then not recommended as it was variable in composition and generally too highly vulcanised to blend into bitumen without prolonged and excessive heating.
Experiences in Malaysia
In Malaysia, trials using rubberised bitumen were initiated in 1950s when 100 yards of road between Kota Bharu and Kuala Krai was laid with 5% rubber powder. Following that, several other trials were laid in the states of Kedah, Perlis, Kelantan, Johor, Negeri Sembilan and Melaka. Unfortunately, none of these trials was monitored closely and as such no details are available.
Chew and Ting6 reported a full-scale experiment that was carried out in late 1968 at two sites; KL – Seremban road at mile 17 - 18 and KL – Bentong road at mile 14 ¼ - 14 ½. A conventional 80 - 100 penetration grade bitumen was used with 1.5% and 3% natural rubber latex. The trial sections however failed after three years due to rapid increase in traffics. At that point, JKR concluded that there was nothing to be gained by adding rubber into road surfacing.
With the formation of Institut Kerja Raya Malaysia in l987, a more concerted effort was given by JKR in the research work. A collaboration with Rubber Research Institute of Malaysia (RRIM) was solicited to tap expertise from local rubber researchers. A number of laboratory assessments and field trials were subsequently conducted under the collaborative study as described below.
Laboratory Assessment
RRIM researcher Azemi7 carried out laboratory assessment on the toughness, elongation at break, tenacity and yield strength of rubberised bitumen samples using an Instron 4206 machine. The samples were prepared using four different forms of rubber namely prevulcanised NR latex, NR latex concentrated, rejected glove crumbs and tyre shavings.
A similar study was carried out earlier by Institut Kerja Raya Malaysia whereby the temperature susceptibility of rubberised bitumen prepared using various forms of rubber was evaluated8.
In the RRIM’s laboratory, Lai and Rouyan9 investigated on the use of Pyrolysis Gas Chromatography to determine the content of unvulcanised rubber in rubberised bitumen blend.

61
Field Trials
a. Klang Trial
The first opportunity to construct a full-scale road trial under the collaborative study came in 1988 during the construction of a new dual carriageway in Port Klang. Natural rubber latex at 2% concentration had been proposed for the trial. The plant engaged to manufacture the bituminous materials was a continuous drum mixer. It had no facility for injecting latex directly into the mixing drum, therefore the rubber was preblended with bitumen in the bitumen storage tank prior to mixing. TRRL Road Note 3612 specified that a propeller type stirrer should be used. However, the plant did not have this facility so the contractor proposed to blend the latex into the bitumen by circulating the binder from one storage tank to another by means of an external circulating pump. This method of blending was not satisfactory as the resulted blend of rubber and latex was not uniform. Nonetheless, some latex which appeared to have blended with the bitumen seemed to have improved the performance of the modified binder in that the aging of the top few millimetres of the surfacing appeared to be less than in the control and the stiffening effect of the rubber additive reduced FWD deflections more than in the control10,11.
b. Rembau Trial
In December 1993, another trial was constructed on Route 1, between Rembau and Tampin. The trial spanned about one kilometre with eight different test sections. Three forms of rubber were used; latex, tyre shaving (or crumb rubber) and rubber powder from rejected domestic gloves. Dry process of mixing was adopted whereby a measured amount of the rubber additives was manually added into the pugmill. Dense graded asphaltic concrete and bituminous macadam, and open graded porous asphalt were laid in the test sections. Up to May 1997, when the last monitoring was carried out, the control test section showed an average rut depth of 2.3 mm while the rest of the test sections had either zero or negligible rut. All test sections had not cracked then.
Indirect Tensile Strength (IDT) tests carried out on cored samples indicated consistently that rubberised mixes had stiffness modulus higher than the conventional mix.
c. Sg. Buluh Trial
This trial was constructed in December 1996 whereby three kilometres of rubberised mix and one kilometre of conventional mix were constructed. Rubberised bitumen was produced by blending crumb rubber from old tyres passing No. 40 mesh with 80/100 penetration grade bitumen. Detail evaluations were carried out within a 200-metre stretch in each test section.
The only post construction survey reported was carried out in January - March 1997. Except for some localised minor segregation problems found in the control test section, there was no other distress observed then.
Laboratory test results from the trial, however, showed some inconsistent properties. For example, the binder content of the control mix was much lower (4.1%) than the rubberised mix (5.8%) whereas the air voids content was lower in the control mix. There are two possible explanations for this inconsistency; the centrifugal method of binder recovery in accordance to ASTM D 2172 was not accurate enough when rubberised bitumen was involved and the presence of rubber granules in the mix had resisted compaction thereby resulting in relatively high air voids even at relatively high binder contents.
Laboratory dynamic creep tests indicated that the rubberised mix reaches 3% strain faster than the control mix. Based on this observation, it would imply that the rubberised mix had less resistance to permanent deformation. However, the presence of relatively high air voids in the rubberised mix that might contribute to earlier strain development merits a review on this implication.
Both the rubberised and control mixes have relatively low density. The mean density for the control and the rubberised mix was reported to be 2.193 Mg/m3 and 2.154 Mg/m3 respectively compared to typical values
61
62
in the range 2.30 - 2.35 Mg/m3 for dense graded mix. This could be attributed to inadequate compaction during construction.
d. KLIA Project
The experience mentioned above had led Institut Kerja Raya Malaysia to propose the use of rubberised bitumen in the prestigious KL International Airport project.
Specification Series 900 of the KL International Airport project included the preparation of rubberised bitumen in compliance with TRRL Road Note 3612 for use in the construction of wearing course of the perimeter road. As recommended by RRIM, high quality grade natural rubber powder with specific vulcanizate properties was specified (refer to page 25 for further details). It did not, however, specifically indicate that crumb rubber from old tyres should be used as the rubber additive. Superpave performance grade PG70 in compliance with AASHTO MP1 – Standard Specification For Performance Graded Asphalt Binder13,14 was specified for the rubberised bitumen.
A total length of approximately 50 kilometres of the wearing course of the perimeter road was successfully constructed using rubberised bitumen blend of crumb rubber from old tyres which was tested and certified by LGM. The modified bitumen product, called Shell Rubberised Bitumen, which met performance grade PG70 and had been used extensively in the KLIA perimeter road.
e. Other Proprietary Product
Bituminas Premium-R is a proprietary formulation of rubberised bitumen produced and marketed by Petronas. It was claimed that the binder had been used to manufacture dense asphalt mixes for over 15 kilometres of road in Putrajaya as well as access roads and parking areas at the oil and gas plants in Kerteh and Gebeng.
Experiences in India
India is currently the leading user of crumb rubber for modification of asphalt in Asia. “Guideline Specifications on the Use of Polymer and Rubber Modified Bitumen in Road Construction” were issued by the Indian Roads Congress (IRC) as Special Publication 53 in 1999, and a First Revision of these guidelines was published in 2002. The Bureau of Indian Standards has issued in 2004 Indian Standard IS 14462, which is similar but not identical to IRC Special Publication 53. Both IRC guidelines and IS Standard 14462 include separate specification properties for bitumen modified with natural rubber (NRMB) and for bitumen modified with crumb rubber (CRMB).
Of the three CRMB grades included in IS 14462, CRMB 60 is most appropriate for use on major highways located in hot climate. Comparative testing was carried out on polymer and crumb rubber modified binders from India, using traditional (Indian) test methods and specifications as well as more advanced test methods and specifications for Performance Graded Binders (AASHTO M 320 and ASTM D 6373). It was found that CRMB 60 is about equivalent to PG 76, which is a widely specified binder grade for heavily trafficked highways in warm to hot climates.
Experiences in Europe
In Europe, crumb rubber has so far not been as extensively used as asphalt modifier as in the US. However, the European Tire Recycling Association (ETRA) is aggressively promoting environmental and performance benefits of crumb rubber as bitumen additive, and in view of the increasing emphasis on the need for recycling and economic use of recycled materials, crumb rubber usage in asphalt pavement is expected to increase also in Europe.
Experiences in the United States
Because disposal of used tyres in landfills presents an increasing environmental problem, legislation at federal, state and local government levels in the US started about 20 years ago to promote, and in some

63
cases mandate, the use of crumb rubber (CR) in asphalt pavements. The most notable of these legislations was the Intermodal Surface Transportation Efficiency ACT (ISTEA) passed by the US Congress in 1991. It mandated that starting in 1994, at least 5% of all asphalt mixtures used for federally funded highway projects be modified with CR. The mandate stated further that each of the following years, usage of CR as asphalt modifier was to be increased by 5%; in 1997 and each year thereafter, at least 20% of all federally funded asphalt paving projects should have included CR as modifier. This legislation caused a sharp increase in interest and in use of CR as asphalt modifier. Because many state transportation departments did not have sufficient experience in CR-modified binder and mix design, and in related asphalt mix production and pavement construction, some of the projects carried out during this period did not meet performance expectations. As a result, the federal mandate of using CR in asphalt pavements was suspended in the Transportation Appropriations Bill of 1995 and funds were set aside to conduct more research on;
a. Test methods and specifications for CR modified asphalt binders and mixtures.Performance properties of asphalt binders and a. mixtures containing CR.Asphalt mix design using CRMB as binder. b. Asphalt mix production and pavement construction c. using CRMB.Project quality control and quality assurance.d.
The US is not only the primary contributor to CR technology development, but is currently also the largest user of CR in asphalt pavements. Until 1992, more than 6 million tonnes of asphalt mix modified with CR was produced and used in pavement construction; since then, usage has been growing, especially in Florida, California, Texas and Georgia, and has now reached in the US more than 15 million tonnes of CR-modified asphalt mixes per year. Most of the CR-modified binder is used in gap-graded mixtures, such as porous asphalt and open-graded friction course. The percentage of CR in bituminous binder used for friction course is typically in the range of 12 to 16%; higher CR dosages are typically used in Arizona. For dense graded
asphalt mixtures, low CR dosages are used, ranging from about 5% in Florida to approximately 8% in some other states.
The performance of crumb rubber modified asphalt mixes in the US in 1970s and 1980s are summarised in Table 1 (extracted from an unknown source).
It was also reported that the Texas Transportation Institute (TTI) has carried out a comprehensive study on dense-graded mixes which TTI claimed that the addition of crumb rubber does not improve the properties of the mixes (source unknown, extracted from LGM’s literature review).
QUALITY OF TYPICAL CRUMB RUBBER IN MALAYSIA
Crumb rubber for use in the laboratory assessments and subsequent field trials in Kuantan was obtained from Jeng Yuan Reclaimed Rubber Sdn. Bhd. This company was established in 1988 with the principal activity in manufacturing and sale of premium quality reclaimed rubber.
During a visit to the factory in Port Klang by JKR and LGM officials in March 2003, it was briefed that its monthly output then was 600 metric tons, 50% of which was exported to countries like Taiwan, Japan, Vietnam, India and Australia. Crumb rubber of mesh 40 (420 μm) appeared to be a major product with a monthly output of approximately 500 metric tons. It was used mainly in the manufacture of moulded rubber products. Finer crumb of mesh 80 (180 μm) was produced in much lesser quantity of 12 metric tons per month as the factory did not have facilities to purposely produce the finer crumb which was mainly used in making shoe soles.
The source for the crumb rubber was rubber buffings and dust which were purchased at 40 sen/kg from various tyre retreading companies. The type of tyre that was retreaded was mainly truck tyres which contain higher proportion of natural rubber as compared to passenger car tyres which are generally made of Styrene-Butadiene synthetic rubber (SBR) or polybutadiene synthetic rubber. The crumb rubber of mesh 40 was then priced at 80 sen/kg.
63

64
STATE REMARKS
1 AlaskaPavement sections placed in 1979 – 1983 using dry process (refer to Note below) have superior fatigue resistance but were not as good as conventional in resisting ravelling and pothole formation.
2 ArizonaThe longest user of crumb rubber modified mixes, Arizona presently uses dense and open-graded mixes made with asphalt-rubber binders for overlays on existing rigid and flexible pavements.
3 California
After using crumb rubber for more than 20 years, California recommends;Asphalt-rubber open-graded mixes should no longer be considered as an i. experimental technology.Asphalt-rubber dense and gap-graded mixes should be used on an experimental ii. basis.Dry process using devulcanised rubber should not be used. iii.
4 Connecticut
Based on nine-year performance study of asphalt-rubber pavement produced using dry process, Connecticut concludes;
On thick overlays, 2% crumb rubber increase reflection cracking as compared with i. control sections.On thin overlays, 1% crumb rubber reduce reflection cracking by two-third. ii. Increased in crumb rubber contents result in more cracking.
5 FloridaAll asphalt-rubber dense and open-graded sections performed well since 1989-1990. Beginning in January 1994, all dense and open-graded friction courses require an asphalt-rubber binder.
6 Kansas Two experimental asphalt-rubber dense-graded sections placed in 1990 showed more reflection cracking.
7 MichiganEight experimental sections constructed in 1978-1979 performed poorly in terms of reflection cracking and surface disintegration cracking. Michigan does not recommend the use of crumb rubber modified asphalt.
8 Minnesota Three experimental sections did not show benefits which offset costs. No future sections were planned until more specific benefits were identified.
9 MississippiA test section with 6% devulcanised rubber showed little significant difference in crack pattern, skid resistance and rutting after 2 years as compared with the control section.
10 Oregon After 5 years, rubber modified section showed better resistance to cracking. However, ravelling in the section was of concern.
11 South Dakota Dry process rubber modified sections developed some potholes and break-up after 1 year which subsequently developed into large areas of delamination and peeling.
12 Texas Of two sections, one ravelled shortly after construction while the other performed satisfactorily.
13 Utah Dry process rubber modified section was removed after 3 years because of severe ravelling.
14 Washington Five open-graded sections showed good to very good performance. Dry process sections showed poor to average performance.
TABLE 1 : United States experiences in crumb rubber

65
The typical quality of crumb rubber produced by Jeng Yuan as compared to the Caltrans specification is shown in Table 2 below.
Table 2 : Chemical composition of Jeng Yuan crumb rubber
Test Parameter Caltrans Crumb Rubber
Jeng Yuan Crumb Rubber
Acetone Extract (%) 6 – 16 10.9
Rubber Hydrocarbon (%) 42 – 65 57.0
Carbon Black (%) 28 – 38 28.3
Natural Rubber (%) 22 – 39 n.a.
Ash (%) < 8.0 3.7
FULL-SCALE ROAD TRIAL IN KUANTAN
Objectives
The objectives of the trial were to compare the performance of dense graded bituminous overlay incorporating crumb rubber modified bitumen with a similar overlay but using conventional penetration grade 80-100 bitumen in mitigating reflective cracking and to assess the durability of porous asphalt incorporating crumb rubber modified bitumen as well as a proprietary modified bitumen produced by Petronas.
Site selection
A site on Route 2, between Section No. 340 and 345, Kuantan bound was proposed by JKR District of Kuantan. The road pavement of the four-lane dual carriageway which was constructed in early 1990s has visibly reached a critical or fail condition over a substantial proportion of its length and rehabilitation was then urgently required. In fact it had been identified by the JKR District of Kuantan to be overlaid by the Federal Road maintenance concessionaire, Road Care Sdn. Bhd. The proposed site was therefore needed to be truncated from the maintenance contract in order to facilitate the construction of the test sections.
Experimental Design
As the incorporation of crumb rubber modified bitumen, as reported elsewhere, can extend the design life for any given overlay thickness, it can also be used to reduce the thickness of overlay of a given design life. However this design approach was not adopted, instead overlay of similar thickness was placed for each type of aggregate gradation used, with or without crumb rubber. The test site was divided into seven test sections as follows;
Dense-graded asphaltic i. concrete, aggregate grading A, with crumb rubber modified bitumen (hereby referred to as R-Dense A), 40 mm thick.Dense-graded asphaltic ii. concrete, aggregate grading A, with conventional penetration grade 80-100 bitumen (Dense A), 40 mm thick.Dense-graded asphaltic iii. concrete, relatively fine aggregate grading B, with conventional penetration grade 80-100 bitumen (Dense B), 30 mm thick.Dense-graded asphaltic iv. concrete, relatively fine aggregate grading B, with crumb rubber modified bitumen (R-Dense B), 30 mm thick.Open-graded porous asphalt, v. aggregate grading C, with crumb rubber modified bitumen (R-Porous C), 40 mm thick.Open-graded porous asphalt, vi. aggregate grading C with Petronas modified bitumen (Petronas-Porous C), 40 mm thick.Open-graded porous asphalt, vii. relatively fine aggregate grading D, with crumb rubber modified bitumen (R-Porous D), 40 mm thick.
Dense B and R-Dense B were to be laid to 30 mm thickness because the maximum nominal size of the aggregate was only 10 mm and pavement surface cracks were expected to appear faster than in the 40 mm thick overlay.

66
Determination of optimum crumb rubber content
Crumb rubber-bitumen blends with variable content of crumb rubber (CR) were prepared in the laboratory. The quantity of CR added ranged from 0% to 16% at an increment of 4%, by weight of the bitumen.
Dynamic Shear Rheometer testing
Dynamic Shear Rheometer (DSR) is used to characterize the viscous and elastic behaviour of the bitumen. It does this by measuring the complex shear modulus G* and phase angle delta of the bitumen. G* is a measure of the total resistance of the bitumen to deform when repeatedly sheared and it consists of two parts; elastic (recoverable) and viscous (non-recoverable). Delta is an indication of the relative amount of recoverable and non-recoverable deformation.
Non-recoverable or permanent deformation is controlled by limiting G*/sin delta at any test temperature to value greater than 1.0 kPa for fresh or unaged bitumen and 2.2 kPa after aging in Thin Rolling Film Oven Test (RTFOT) or Rolling Thin Film Oven Test (TFOT).
It is this DSR test that was used to determine the optimum content of crumb rubber in the modified binder. Binder grade PG 76 has been specified for the crumb rubber modified binder. As such, samples of the laboratory blend of crumb rubber-bitumen were subjected to DSR test at 76oC. TFOT was used for aging the binders. The tests were carried out at University Malaya.
Referring to Figure 1, G*/sin delta of unaged sample equals to 1.0 kPa at crumb rubber content of about 12% whereas Figure 2 indicates that G*/sin delta of TFOT-aged sample reaches 2.2 kPa at rubber crumb content of about 17%.The results show that G*/sin delta increases exponentially with increasing crumb rubber content for both unaged and TFOT-aged samples. It was jointly decided by JKR and LGM that crumb rubber content of 16% be used in the road trial in Kuantan.
The blend with 16% CR content was subsequently used in the preparation of dense-graded (grading A & B) and open-graded (grading C & D) mixtures at varying binder contents ranging from 4.5% to 7.5%.
Construction The construction of the trial commenced on 13th June 2003 beginning from test point -10 on the slow lane. As monitoring of the test sections would be confined to the slow lane only, supervision of the construction was carried out on this lane only. The construction of all seven test sections on the slow lane was completed on 30th June 2003.
Figure 1 : Variation of G*/sin delta with crumb rubber content for unaged binder.
0
2.5
2.0
1.5
1.0
0.5
0.0
Crumb Rubber Content (%)
5 10 15 20 25
G* /
sin
delt
a (k
Pa)
0Crumb Rubber Content (%)
5 10 15 20 25
3.0
2.5
2.0
1.5
1.0
0.5
0.0
G* /
sin
delt
a (k
Pa)
Figure 2 : Variation of G*/sin delta with crumb rubber content for TFOT- aged binder

67
DISCUSSION
The full-scale road trial in Kuantan provided an opportunity to evaluate the performance of crumb rubber modified bituminous overlay in mitigating reflective cracking, the most widely reported benefit of using crumb rubber as bitumen modifier. The presence of crumb rubber in the bitumen improves significantly the binder resistance to oxidative aging. Some components of crumb rubber have lower activation energy than bitumen, while other components act as anti-oxidant. The components with low activation energy react more rapidly with oxygen than bitumen. This influences
positively the aging behaviour of the modified binder, because the product of rubber-oxygen reaction is less detrimental to the binder and mixture performance than is the product of bitumen-oxygen reaction. Overall hardening of the binder is, therefore, slowed down significantly by the presence of crumb rubber. The effect of aging is further reduced by the presence of carbon black, which is an anti-oxidant, and by the typically thicker binder films of crumb rubber-modified asphalt mixtures. Despite its being more viscous and higher stiffness, failure strain of properly formulated and produced crumb rubber modified binder is larger than that of conventional bitumen, thus increasing also resistance to crack initiation and propagation.
With extensive cracking in the underlying layer, high traffic loading and relatively thin cosmetic overlay (40 mm), it was anticipated that the cracks would propagate into the new overlay within a relatively short period of time. Even a thinner overlay (30 mm) was included in the test sections in order to expedite further the impending appearance of reflection cracks on the surface of the new overlay so that the comparison of performance between the test sections with and without crumb rubber could be made after a shorter period of time.
The approach adopted in the design of thickness of the new overlay was that a similar thickness was specified for both test sections with and without crumb rubber rather than reducing the thickness of the overlay modified with
Photo 1 : Crumb rubber
Photo 2 : Bitumen blending system at JKR Kuari Bukit Penggorak

68
crumb rubber accordingly such that a design life similar to the overlay without crumb rubber was achieved.
With the possibility of thicker film of binder having improved resistance to oxidative aging, the crumb rubber modified binder was also used in the construction of porous asphalt test sections.
The other benefit that is normally associated with the use of crumb rubber as bitumen modifier is improved resistance to rutting of overlay due to the presence of the more viscous modified binder. However, as the test sections were located on a relatively flat terrain, the overlay was not expected to be subjected to high traffic loads at extremely long loading times which would be normally associated with slow moving heavy commercial vehicles. Under such
extreme conditions, the binder would behave in a more viscous manner, allowing the bituminous mixture to flow under the high traffic stresses. The progression of surface deformation along the wheelpaths was therefore not monitored in this trial.
Periodic monitoring on the formation of surface cracks in the dense mixture test sections and ravelling in the porous asphalt test sections was carried out by manual observation and this was confined to the slow lane only where most of the heavy vehicles would be travelling on.
The presence of cracking and ravelling were recorded as percentage of the total area within each test section. Table 3 shows these results for all the test sections which were obtained at various time intervals after construction.
There is an indication that the presence of crumb rubber in asphalt mixtures could significantly mitigate the propagation of cracks from underlying layers through relatively thin overlay with relatively fine aggregate gradation. This was shown by considerably less percentage of cracks that was reflected. However, with coarser aggregate gradation and thicker overlay, the crumb rubber does not appear to impart appreciable improvements in resistance to reflective cracking as it was observed that both sections with and without crumb rubber were performing equally well after 30 months of monitoring. The extra cost incurred by the addition of crumb rubber to the road surfacing material would not be justifiable if significant improvements could not be attained. Further monitoring of the test sections is recommended to ascertain that appreciable
Mix Types
Time after Construction (months)
% of Initial at Month 30
Percentage Area of Cracking
Initial (before const) 0 2 6 12 18 30
R-Dense A 52.5 0 0 0 0 2.8 5.8 11.0
Dense A 44.8 4.5 4.5 4.5 5.0 5.0 7.0 15.6
Dense B 14.3 5.0 5.0 5.0 6.0 6.0 8.0 55.9
R-Dense B 12.0 0 0 0 0 0.8 2.0 16.7
Percentage Area of Ravelling
R-Porous C 3.0 0 0 0 0 0 0 0
R-Porous D 1.5 0 0 0 0 0 0 0
Petronas-Porous C
1.5 0 0 0 0 0 0 0
Table 3 : Extent of cracking and ravelling after construction
69
improvements as in the thin overlay could be achieved in the thicker overlay after a longer time period.
It was also observed that there was no ravelling in all three porous asphalt test sections. This could be attributed to the relatively thick film of binder coating the aggregates due to the presence of crumb rubber in the R - Porous C and R - Porous D test sections and proprietary additive in the Petronas - Porous C test section.
CONCLUSIONS
The presence of crumb rubber in the road i. surfacing dense material appear to impart appreciable improvements on resistance to reflective cracking in relatively thin overlay with relatively fine aggregate gradation. However, similar improvements could not be ascertained in thicker overlay with coarser aggregate gradation as it was observed that the section with crumb rubber performed only slightly better than the section without crumb rubber after 30 months.
With properly designed dense graded asphalt ii. mixture using coarser Superpave aggregate gradation, the overlay appears to have the ability to resist reflective cracking even without crumb rubber additive.
There was no ravelling in all three porous iii. asphalt test sections. This could be attributed to the relatively thick film of binder coating the aggregates and improved resistance to oxidative aging of the binder due to the presence of crumb rubber in the R - Porous C and R - Porous D test sections and proprietary additive in the Petronas - Porous C test section.
The addition of 16% crumb rubber to penetration iv. grade 80-100 bitumen reduces the penetration value by 2 grades. However, the softening point merely increases marginally from a normal range of 45 - 52 oC to 56 oC.
v. The ductility is significantly reduced from over 100 cm, a requirement for penetration grade 80-100 bitumen, to about 27 cm with an addition of 16% crumb rubber.
vi. PG 76 binder could be achieved by adding 16% crumb rubber from truck tyre buffing to penetration grade 80-100 bitumen.
vii. The crumb rubber obtained locally from Jeng Yuan Reclaimed Rubber Sdn. Bhd. in Port Klang which was produced by grinding rubber buffing from truck tyres did comply with California Department of Transports specification for chemical composition of crumb rubber.
RECOMMENDATIONS
LGM should proceed in developing better forms of i. rubber for use as bitumen additive, whether it is to be applied in the dense-graded or open-graded asphalt, as crumb rubber from rubber buffing of truck tyres would not be a good proposition and would definitely not resolve the problem in disposing the abundant used car tyres in this country. If natural rubber latex could be developed by LGM as cost-effective bitumen additive, it is envisaged that the impact to the Malaysia rubber industry would be more pronounced.
The rubber modified binder and asphalt mixes ii. should be subjected to laboratory testing such binder elastic recovery, indirect tensile fatigue and resilient modulus for some indications of improved resistance to reflective and surface cracking of dense-graded asphalt mixes prior to trial application on the roads.
Crumb rubber modified binder in dense asphalt iii. mixtures should be equivalent to Type II asphalt rubber as specified in California. This blend should contain 75% rubber from scrap tyres and 25% rubber from high natural rubber resources.
The scrap tyres should consist of ground rubber iv. derived from tyre buffing of truck tyres whereas the high natural rubber should be ground rubber derived from materials that utilise high natural rubber resources.
Based on California Department of Transports, the v. properties of the rubber from scrap tyres and high natural rubber resources should be as follow;
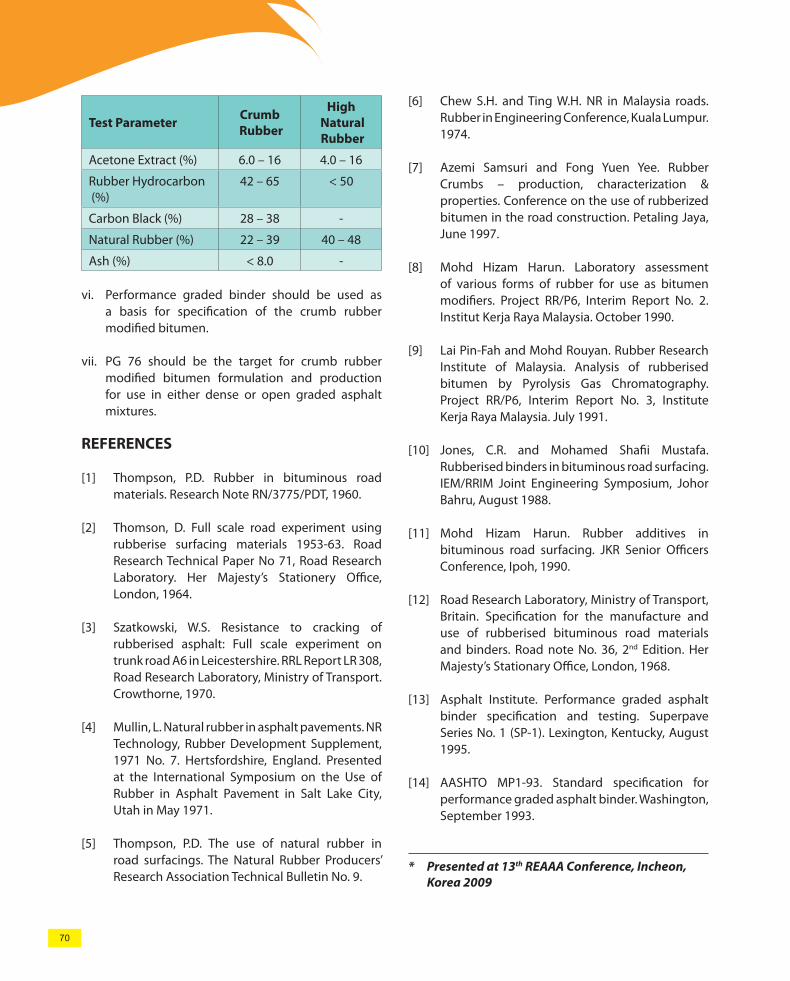
70
Test Parameter Crumb Rubber
High Natural Rubber
Acetone Extract (%) 6.0 – 16 4.0 – 16
Rubber Hydrocarbon (%)
42 – 65 < 50
Carbon Black (%) 28 – 38 -
Natural Rubber (%) 22 – 39 40 – 48
Ash (%) < 8.0 -
Performance graded binder should be used as vi. a basis for specification of the crumb rubber modified bitumen.
PG 76 should be the target for crumb rubber vii. modified bitumen formulation and production for use in either dense or open graded asphalt mixtures.
REFERENCES
[1] Thompson, P.D. Rubber in bituminous road materials. Research Note RN/3775/PDT, 1960.
[2] Thomson, D. Full scale road experiment using rubberise surfacing materials 1953-63. Road Research Technical Paper No 71, Road Research Laboratory. Her Majesty’s Stationery Office, London, 1964.
[3] Szatkowski, W.S. Resistance to cracking of rubberised asphalt: Full scale experiment on trunk road A6 in Leicestershire. RRL Report LR 308, Road Research Laboratory, Ministry of Transport. Crowthorne, 1970.
[4] Mullin, L. Natural rubber in asphalt pavements. NR Technology, Rubber Development Supplement, 1971 No. 7. Hertsfordshire, England. Presented at the International Symposium on the Use of Rubber in Asphalt Pavement in Salt Lake City, Utah in May 1971.
[5] Thompson, P.D. The use of natural rubber in road surfacings. The Natural Rubber Producers’ Research Association Technical Bulletin No. 9.
[6] Chew S.H. and Ting W.H. NR in Malaysia roads. Rubber in Engineering Conference, Kuala Lumpur. 1974.
[7] Azemi Samsuri and Fong Yuen Yee. Rubber Crumbs – production, characterization & properties. Conference on the use of rubberized bitumen in the road construction. Petaling Jaya, June 1997.
[8] Mohd Hizam Harun. Laboratory assessment of various forms of rubber for use as bitumen modifiers. Project RR/P6, Interim Report No. 2. Institut Kerja Raya Malaysia. October 1990.
[9] Lai Pin-Fah and Mohd Rouyan. Rubber Research Institute of Malaysia. Analysis of rubberised bitumen by Pyrolysis Gas Chromatography. Project RR/P6, Interim Report No. 3, Institute Kerja Raya Malaysia. July 1991.
[10] Jones, C.R. and Mohamed Shafii Mustafa. Rubberised binders in bituminous road surfacing. IEM/RRIM Joint Engineering Symposium, Johor Bahru, August 1988.
[11] Mohd Hizam Harun. Rubber additives in bituminous road surfacing. JKR Senior Officers Conference, Ipoh, 1990.
[12] Road Research Laboratory, Ministry of Transport, Britain. Specification for the manufacture and use of rubberised bituminous road materials and binders. Road note No. 36, 2nd Edition. Her Majesty’s Stationary Office, London, 1968.
[13] Asphalt Institute. Performance graded asphalt binder specification and testing. Superpave Series No. 1 (SP-1). Lexington, Kentucky, August 1995.
[14] AASHTO MP1-93. Standard specification for performance graded asphalt binder. Washington, September 1993.
* Presented at 13th REAAA Conference, Incheon, Korea 2009
7171
MALAYSIA’S NATIONAL SLOPE
MASTER PLAN – FROM THEORY
TO PRACTICE
DR. CHE HASSANDI B. ABDULLAHPengarah,
Cawangan Kejuruteraan Senggara
BSc (Hons) (Civil Engineering),Hertfordshire UniversityME (Geotechnical Eng),
Ehime University, JapanPh.D (Geotechnical.Eng),
University of Wisconsin-Madison, United States of America
ABSTRACT
Dealing with landslide risk reduction in real life is more challenging than designing slopes in a
complex environment. Many papers on landslides do not deal with the realities faced by engineers or organi-sations tasked with landslide management via legislation, guidelines, and research and development. The Ma-laysian Public Works Department (PWD) came face to face with these realities after a series of devastating landslides between 1993 and 2003, including the Highland Towers incident in 1993 that killed 48 people. As a result, the Malaysian Government decided that concrete actions had to be taken by establishing a dedicated slope management unit and creating a National Slope Master Plan to reduce the risks and losses due to land-slides. During this time, public opinion and outcry was starting to be vocalized by the general public. This paper shares the experiences and challenges of an organisation that not only deals with technical matters, but also has to engage with the public through landslide awareness and education. In addition to the general pub-lic, PWD also has to provide awareness and education to other various target groups such as local authorities and state governments. However, compounding the issue is the fact that PWD does not have jurisdiction over the affairs of the states.
INTRODUCTIONMalaysia is blessed with very few natural disasters that many other countries in ASEAN have to face. Disastrous
earthquakes, typhoons and forest fires are non-existent. Two major natural disasters that are common to Malaysia are floods and landslides. These two natural disasters are interrelated, because both are caused by water be it underground or on the ground surface. Both disasters are exacerbated by developments especially when due consideration is not given to the environment.
Malaysia’s economic development began in earnest in the late 1980’s from an agricultural economy to a manufacturing one (Yusof &Bhattasali, 2008). This resulted in a boom in construction and physical development which then encroached into hilly terrain areas, especially around major cities such as Kuala Lumpur and Penang Island. New roads that traversed across hilly terrain were constructed sometimes without consideration to environmental, social and economic consequences. As a result of the rapid developments, frequency of landslides and landslides with fatalities havealso increased. This phenomenon is in tandem with the observations made by Remendo et al. (2005)with regards to relationship between frequency of landslides and human activity.
Landslides began to make their mark in 1993 when a catastrophic landslide caused undermining and subsequently the toppling of an apartment block that killed 48 people. The incident is known as the Highland Towers tragedy that resulted in litigation that only came to conclusion in 2006. Apart from the 48 people that were killed and the collapse of the apartment block, two other apartment blocks remained abandoned.

72
This landmark landslide event directed the attention of the general public on issues pertaining to landslides, much like the Po Shan Road landslide in Hong Kong. Apart from the establishment of the Special Malaysia Disaster Assistance and Rescue Team (SMART), which was established in 1995 and comprisingvery loose guidelines on development which was not included in any of the guidelines on development on hilly terrain (Abdullah et. al. 2007), no other initiatives were carried out to minimise risk due to landslides.
In November 2003 another devastating landslide event occurred at Bukit Lanjanthat severed the leading toll expressway from the north to the nation’s capital of Kuala Lumpur (Figure 1). The landslide caused part of the toll expressway to be closed for more than 6 months. The Bukit Lanjan rockslide was the last straw that triggered the Malaysian Government to take the initiative to establish a body that would deal explicitly with slopes issues. In this incident, although there were no casualties, the effect on the economy was profoundly significant, not to mention the difficulty faced by motorists around the city and the losses incurred by the expressway concessionaire. It is estimated that this failure alone caused the country USD270 million in direct and indirect economic losses (Slope Engineering Branch 2009). The estimated total loss due to landslides since 1973 to 2011 was more than USD1 billion. From 1961 to 2011, the total number of deaths due to landslides was 611 or an average of 12 deaths per year. In 2011 alone 23 people were killed due to landslides.
Three months after the Bukit Lanjan incident, a dedicated Slope Engineering Branch was established within PWD Malaysia. Thus, the Slope Engineering Branch came into being on February 2, 2004. In May of the same year, the Government instructed the Slope Engineering Branch to carry out a National Slope Master Plan (NSMP) study with the goal of reducing risks and losses due to landslides.
The paper describes the challenges faced during the study, the way the study was carried out, the progress, practical problems faced and what has been accomplished after the NSMP was completed. The paper will also journey through some of the efforts being done to realise the NSMP and to reduce the risks and losses due to landslides.
Figure 1: Bukit Lanjan rockslide closed the expressway for more than 6 months.
ABOUT MALAYSIA
Geography of Malaysia
Malaysia has a population of approximately 28 million people. It comprises Peninsular Malaysia in the west and Sabah and Sarawak on Borneo Island which lie to the east. The total land area is approximately 300,000 km2 with Peninsular Malaysia taking up 40% of the total land area.Being in a tropical region, the country has a climate characterised by uniform temperature, high humidity and plenty of rainfall throughout the year. Average annual rainfall is approximately 2600 mm with the highest ever recorded being nearly 6000 mm. Flooding is common especially during the monsoon seasons that affect Malaysia twice a year. The monsoon seasons are also the time when landslide events occur the most, particularly during the North-East Monsoon season.
Malaysia is also not very mountainous. In fact less than 25% of the land area lies more than500 m above the mean sea level(Survey and Mapping Dept. Malaysia 2008). Malaysia’s ethnicity is diverse with the Malays making up more than 50% of the total population, followed by the Chinese, Indians and many other

73
ethnic groups in Sabah and Sarawak. The culture and education level varies according to race. Later it will be shown how significant and complex the public awareness programme is due to this diversity.
Geographically, Malaysia is divided into three regions, the Peninsular Malaysia, Sabah and Sarawak. The geology of these three regions varies distinctively from one another and from simple geology in the Peninsular Malaysia to more complex geology in Sabah and Sarawak. Approximately 40% of the land surface is made up of granitic rocks. Weathering to a depth of 40 m is common in granitic rocks in Malaysia,and Ingham and Bradford (1960) have recorded depth of weathering reaching 65 m below the ground surface. The speed of weathering is demonstrated by the total decay of fresh Main Range poryphyritic granite in deep road cuts along the Karak Highway within 20 years(Hutchison 1989).
MALAYSIA’S NATIONAL SLOPE MASTER PLAN
Methodology of the Study
The project to develop an effective NSMP was a colossal endeavour, not least because no one had done it to the scale that the terms of reference specified. Hong Kong has been successful in reducing landslide risks by initially focusing on major actions that can drastically reduce landslide risks. Malaysia did not pursue the path that Hong Kong and other countries took, but drew from their experiences and charted its own course. One of the first steps that formed part of the requirement in the study was to carry out exhaustive literature reviews of efforts that have been carried out by other countries to reduce landslide risk. Apart from Hong Kong, USA andAustralia, practices from other countries such as Sri Lanka and Korea were also scrutinized (Slope Engineering Branch 2009). The idea was to see whether any of the activities can be adopted and adapted tofit Malaysian needs.
The NSMP study was officially launched in March 2006, although the groundwork had started more than a year earlier. The study was completed in December 2008 with a total estimated cost of approximately USD1.9 million. A consortium of consultants was appointed to
carry out the study. The NSMP Terms of Reference was partly based on USGS Circular 1244 (Spiker&Gori2003) and works by Committee on the Review of the National Landslide Hazards Mitigation Strategy Board of the United States National Research Council (2004).In USGS Circular 1244 there are 9 components that form the mainstay of the NSMP study; the component Policy and Institutional Frameworkwas added in the NSMP study.
Three experts on slope engineering were appointed to be advisors to the project. They were Norbert R. Morgenstern, Emeritus Professor at University of Alberta, Canada; David N. Petley, Professor at the University of Durham, UK and HarisAbas, Ex-deputy Director General of PWD, Malaysia. A technical committee that comprises relevant agencies, NGOs and toll expressway concessionaires was set up to provide direction and input for relevancy purposes and review the progress periodically. Several discussion sessions were held with the advisors and technical committee at several stages during the study period and even before the advisors were officially appointed. These included presentations by the consultants on the work progress as well as the contents of the components were discussed for their comments and queries from the technical committee.
The NSMP is a comprehensive strategic and implementation plan that cover areas as diverse as institutional framework, hazard mapping, monitoring systems, information technology, loss assessment, training, public awareness, loss reduction measures, emergency preparedness, and research & development. Replete with strategic directions, action plans and key performance indicator measures, the NSMP helps planners set priorities on what needs to be done to stem the increasing tide of landslides.
To come up with such a comprehensive plan pertaining to slopes was extremely difficult and complex due to the challenges of multi-faceted issues that can only be resolved by discussion and working together with other agencies. One of the major principles of the study was to identify weaknesses in the system and try to make improvements to these weak links. Another matter of importance was to identify the roles and responsibilities of various parties involved. Finally,
73

74
lessons learned from other countries enabled the incorporating of best practices and the state-of-the-artinto local solutions.
Questionnaires were sent to relevant federal, state and local stakeholders to examine responsibilities, capabilities and systems that they possessed in matters pertaining to slopes. Laws and regulations relating to slopes were also examined, and any deficiencies and overlaps between various parties involved in the implementation of slope policies were identified. From these questionnaires, capacity, resources, weaknesses and strengths pertaining to slope policies were identified and later used to improve on existing situations. For instance, at the time of the NSMP study, the Malaysian Meteorology Department of Malaysia (MMD) were extensively using rain gauges to measure rainfall intensity, Doppler radar were available, but the numbers are limited and the range did not cover the whole of Malaysia. Since then MMD has upgraded all their radars to Doppler radars that can provide coverage throughout Malaysia.
They are currently working on calibrating the Doppler radars.
Based on the premises mentioned above, the methodology employed is as follows:
Identification and compilation of 1. reference materials.Listing down of relevant agencies 2. and organisations and preparation of questionnairesDiscussions with government 3. agencies at all levels and other related organisationsLiterature reviews and technical 4. visits locally and overseas
Perceptions and status on slope issues before the study
Usually when a major landslide occurs, the public would blame the Government. Questions that they normally raise are: Why didn’t the government ensure that the slope is safe? Why did they allow the land to be developed when they knew the location was not safe or suitable?
Review of existing local conditions and practices overseas5. Presentation of proposed national plan to stakeholders and 6. obtaining their feedbackPreparation of inception, conceptual, interim and final reports 7. and obtaining commentsRefinement and submission of reports8.
The flowchart of the process in the study is presented in Figure 2.
Mobilization
Questionnaires & Discussions
Desk Study
Road Show & Workshops
Study of Respective
Components
Technical Committee Meetings
Progress Reports
Conceptual Plan
Inception
Interim Reports
Technical Notes
Draft Final Report
Start
Literature review
Comments from Advisors
Technical Visit
Refinement
Final Report End
Approved
Figure 2 : Flowchart of the process in the study

75
Why are actions not taken against errant developers? Why didn’t the government maintain the slope? These and many more similar questions reflected the perception that the government is responsible for all aspects of landslide and slope management. During the NSMP study it was found that most agencies believed that landslide management was confined to only providing relief to victims, aiding recovery following an event, and rebuilding damage infrastructure, when in fact slope management entails a pre-, during and post-landslide timeline continuum.
The PWD defines major landslide as having any of these criteria:
Landslide that adversely affect the local or national 1. economy and cause death and substantial destruction to propertyThe road has to be closed for more than 24 hours2. No alternative land route is available to bypass the 3. landslide areaAlternative land route is available but is more than 4. an hour away by motorised vehicleCauses road surface damage, rendering it 5. impassable by traffic for more than 24 hours.
This definition help in deciding the course of action to take in the event the disaster occurred.
Other findings made by the NSMP team during the course of the study constitute a long list of needs and deficiencies. For example, until the NSMP study there was not a single all-encompassing study made to come up with a comprehensive approach to address and handle landslides.
Some of the slope works done are badly designed, improperly supervised and defectively constructed.
Research and development work on scientific knowledge of slopes were being carried out by local universities, consultants, and Government agencies. However, there was a pressing need for co-ordination and collaboration among agencies and relevant stakeholders to avoid duplication of roles and responsibilities with limited resources.
Institutions endowed with landslide management sometimes experienced overlapping of activities, tasks and guidelines.
There was low appreciation of the economic value and cost-efficiencies in risk reduction compared to replacing lost assets, and persistent difficulty in demonstrating the cost-efficiencies in saving lives and public property before disasters occur.
There was little reference on early warning systems to landslide risk reduction in the national development plans. Even though there are some early warning systems (EW) and real-time monitoring systems (RTMS) in Malaysia, their application remained limited and their success questionable.
The existing loss reduction measures for landslides were mostly done on an ad-hoc basis and lacked systematic planning.
Construction practices in PWD elsewhere in Malaysia before 1990s was by prescriptive method, for example cut slopes it is 45o ( 1 vertical to 1 horizontal) and for fill embankments 34o or less (1 vertical to 1.5 horizontal) much like Hong Kong before 1977 (Wong & Ho 2006). The history of this practice can be traced back to England and France from 1850 to 1950 for slopes along railroads and canal embankments (Rogers 1992). This practice was brought over into this country by the British during the colonial period and has been the de facto method until recently. Although many slopes designed prescriptively, especially those constructed in granitic formation are still standing,many of the slopes designed in weathered rocks do not consider geology during site investigation especially in schist which is known for experiencing problems in Malaysia. End-tipping practice is also common especially for housing development.
Slopes were also designed without any limits to the height. The design of slopes also neglected to cater for ease of maintenance e.g. cascade drains were constructed without railings or dedicated stairs for maintenance purposes.
Maintenance of existing slopes is almost always neglected for public and most private slopes, except for expressway concessionaires or highland resort owners that maintain the slopes under their jurisdiction in order to safeguard their commercial interests.
75
76
Slopes that were inadequately designed and improperly constructed (including end-tipped slopes) had yet to be identified and strengthened.
Losses due to landslides in Malaysia are frequent, but were not consistently compiled and properly tracked. Data on losses is crucial to help the Government identify trends and track progress in reducing losses.
Public awareness and education on slope safety was carried out on ad-hoc basis and not continuous.The public is generally aware of the danger of landslides, but were not aware of the signs of landslides, their role in mitigation and early warning. There are no acts that deal specifically with slopes. There were no agencies that dealt and coordinated on slope matters. Landslide data was scattered and not systematically compiled.
Hazard and risk maps are generally not available in critical highly populated places. However, PWD had produced several hazard and risk maps along highways that traverse through rugged terrain.
Landslide records are only based on various media sources obtained between 1973 and 2004. The landslide events within this period were not recorded in detail.
There were no specific legislation to handle landslide disasters, and landslides were handled within the general current legislation that is designed to cope with disasters in general. As described above, there were many weaknesses in the system for which many improvements could be made.
Problems encountered during the study
Many problems were faced by the NSMP study team during the study. Some of the problems were internally generated; others were caused by external factors that were more difficult to resolve (Abdullah & Mohamad 2008a). An example of internal problems faced by the team was ensuring that overlapping of the issueswas kept to a minimum. Integration meetings were regularly carried out between various teams working on different components so that the NSMP would be more consistent.
It was expected that all the plans presented would not be implemented at the same time due to limited
resources. Therefore, one of the key issues of the plan was prioritisation of the implementation of the NSMP in terms of the short-, medium- and long-term goals. The short term goals were to ensure that the impact of the plan not only would address the urgent problems faced by the nation presently, but also to ensure maximum impact was felt once the plan was implemented. Prioritisation would in essence consider the essential, important and desirable aspects of the overall implementation plan which would then be linked up with other phases of the NSMP. One of the priority plans proposed by the committee was to produce hazard and risk maps for the local authorities to use for preventive maintenance and monitoring. This has borne fruit in one locality where actions and monitoring were carried out at these high-risk areas.
Other problem faced by the study teams is acquiringenough reliable data to formulate plans to address some of the problems faced by the country on the matters pertaining to slopes. Some of the available data are inadequate others were scattered in various departments or with private consultants and highway concessionaires. An example of the problem faced pertained to loss assessment, whereby a general idea of the money spent on repairs and direct damages to properties was difficult to assess due to data that were available but improperly archived and again scatteredthroughout various agencies and companies. Moreover, the highway concessionaires were reluctant to share their repair and maintenance costsbecause they are part of their trade secrets. In other cases the information was withheld because they are due to pending litigation that clients were unwilling to divulge.
On the cost of maintenance of slopes, usually the total cost is combined with that for other maintenance works such as road works, drainage works, and structural works. Separating the maintenance cost into various elements would be time consuming and require input from people who have intimate knowledge on the works done.
Questionnaires were sent to relevant federal agencies and all state and local governments. For the questionnaires that were sent to federal agencies, 58% of the reply was received and more than 25% from the state and localgovernments. The lack of interest

77
from the state and local governments did not bode well with the aspirations of the NSMP whereby active participation from the state and local governments was essential for the success of NSMP implementation since only they havejurisdiction over land development and control in their states or districts.
There were many cases where the answers obtained were inadequate and further enquiries had to be made with the relevant parties to obtain cleareranswers. When questionnaires were not answered by the relevant parties, the study teams had to contact the parties directly or at other times conductworkshops with the parties concerned at the state level and the local council level.
A key challenge faced by the study team wastrying to gauge whether the progress made in coming up with the plan was headed in the right direction and could be successfully implemented. Essential factors for success identified in the NSMP study were as follows:
Support and cooperation from and between 1. all levels of governmentCooperation between the relevant agencies2. Responsive public3. Well-prepared and responsive government 4. agencies to respond to public inquiries and reports
Components and objectives of the National Slope Master Plan
The NSMP consists of 10 main objectives which were translated into 10 components of the study. The objectives of the NSMP are as follows:
1. Develop an effective policy and institutional framework to minimise risk from landslides on slopes nationwide.
2. Develop a framework for establishing an inventory of susceptible areas and different types of landslide hazards and risk at a scale useful for planning and decision-making.
3. Establish a system for monitoring landslides that pose substantial risk.
4. Compile and evaluate information on the economic impacts and all other relevant information on landslide hazards.
5. Establish an effective system for landslide hazards information transfer.
6. Develop programmes for guidelines, training, and education for engineers, scientists and decision-makers.
7. Develop awareness programmes of landslide hazard to general public, developers, engineers, scientist, decision makers, etc.
8. Develop a plan for appropriate mitigation measures.
9. Improve the nation’s ability to respond and recover from landslide disaster.
10. Develop a predictive understanding of landslide processes, thresholds and triggering mechanisms.
Many of these objectives were taken from USGS Circular 1244.The objectives provided a very comprehensive coverage of the matters pertaining to slope management and planning. Out of these objectives, 10 components under the following headings were derived:
Policies and institutional frameworki. Hazard mapping and assessments ii. Early warning and real-time monitoring systemiii. Loss assessment iv. Information collection, interpretation, dissemination v. and archivingTraining vi. Public awareness and educationvii. Loss reduction measures viii. Emergency preparedness, response and ix. recovery Research and development.x.
Output of the National Slope Master Plan study
The results of the NSMP study are divided into sixsections with the following titles: 1. Identification of the current situations2. Strategic thrusts3. Recommended strategies4. Implementation plans5. Key Performance Indicators (KPI)6. Cost-benefit analysis (Abdullah & Mohamed
2008b).
Out of the 10 strategic thrusts, 34 strategies were proposed, out of which 77 implementation plans were derived.The NSMP is to be implemented in three phases that covers a total period of 15 years. The first
77

78
phase is the most important in that it is supposed to create the greatest impact in reducing landslide risk.
The first phase is from 2009 to 2013; the second phase is from 2014 to 2018; and finally the third phase from 2019 to 2023. It was decided by the technical committee that the NSMP shall be reviewed every five years to see whether revision is required.
The NSMP was completed in December 2008 and was submitted to the Malaysian Cabinet for approval. It was approved for implementation after high-level deliberation amongst heads of departments of the relevant agencies and approved by the Malaysian Cabinet in September 2009. Figure 3 shows typical implementation plans extracted from the NSMP.
Tracking of the progress of the NSMP is carried out once every four months. Although tracking is generally based on the expenditure, but physical progress is also considered (Abdullah & Mohamad 2010)
of a dedicated engineering agency for managing and controllingslope developments and matters pertaining to slopes. However, the difficulty still persists because all land matters belongs to the state and there are still inter agency relationships that needs further development. One of the ways to overcome this issue is by setting up committee on slope at federal and state levels such that whatever matters that has been discussed and agreed can be directly carried to the ministries or the states for endorsement. This initiative among the federal agencies has already begun to take place. However, it needs to cascade down to state and local government level for proper follow through.
There was also suggestion to place Slope Engineering Agency (SEA) under the Prime Minister’s office to give SEA greater power, but the departments under the Prime Minister’s office usually deal with policies and do not undertake operational works which the SEA set up issupposed to do.
During the NSMP study a committee was set up by the Ministry of Housing and Local Government to draft a set of regulations called “Guidelines for Developments on Hilly Terrain and Mountainous Areas”(Town and Country Panning Department 2009). A more comprehensive and stringent development conditions were included in the guidelines. The guidelines came into effect on September 2009 and become mandatory for any development where the slope angle is more 15 degrees. Slope Design Guidelines (Slope Engineering Branch 2009) and Guidelines on Slope
Figure 3 : Example of implementation plan indicating the cost and time of expenditure of each plan and agencies responsible
No Action Plan Who
When/Cost (RM Million)
Phase 1 Phase 2 Phase 3
(2009 - 2010)
(2011 - 2013)
(2014-2018)
(2019 - 2023)
2.1 Develop on inventory of known landslide nationwide
2.1.1 Plan and carry out data collection
CKC/SEAJMG
MACRES2.2 14.7 46.9 5.6
2.1.2 Prepare landslide inventory map
CKC/SEA
0.3 0.5 1.0 1.0
2.2 Develop a plan for mapping and assessing landslide hazard and risk
2.2.1 Develop slope hazard and risk maps for areas identified in Strategy 2.1
CKC/SEA
5.5 7.5 20.5 6.0
2.3 Develope guidelines for landslide hazard and risk mapping and assessment
2.3.1 Develop standard procedures for hazard and risk assesment and mapping
CKC/SEA
0.1 1.0 0.5
Sub-total 8.1 23.7 68.9 12.6
Total 113.3
PERFORMANCE OF THE NATIONAL SLOPE MASTER PLAN
Policy and institutional frameworks
Under this component there are five strategies and 12 implementation plans. One of the important proposals for this component was the setting up

79
Maintenance in Malaysia (Slope Engineering Branch 2006) have been includedas mandatory reference.
Out of 12 implementation plans proposed in the NSMP, only six are showing a healthy progress.One of the plans is to commence in the second phase, while thereis no progress on implementation for rest.
Hazard mapping and assessments
Even before the completion of the NSMP a programme to produce hazard and risk maps for federal roads had already started. Efforts were already on the way to produce hazard and risk maps for the Kuala Lumpur area or what is known as Klang Valley area. Hazard and risk maps study and usage is not new to Malaysia.
Jamaludin and Hussein (2006) stated that there have been five linear based landslide hazard and risk assessment studies that have been commissioned by PWD. The first was started in 1993 for the East-West highway connecting Jeli, Kelantan in the east and Gerik, Perak in the west (PWD Malaysia 1996). The road traverses across the Main Range of Peninsular Malaysia. This landslide hazard assessment was based on works by Anbalagan (1995). Lloyd et al. (2001) mentioned that using the landslide risk assessment based on the 1996 study in the East-West highway has reduced the annual expenditure on slope remedial works from 4.2% to 2.3% of the original roadconstruction costs. Jamaludin et al. (1999) stated that preventive maintenance for
the highway was more systematic after the landslide risk assessment was used.
The last linear based study commissioned by PWD was carried out based on slope data along the Tamparuli – Sandakan road in Sabah. The study is known as “TSR study” based on the names of the towns that the road connects. The outcome of this study is a slope zonation system known as SMART (Slope Management and Risk Tracking System). In SMART, the total risk score and associated risk rating for each slope feature along the TSR is the product of instability score (IS) and consequence score. The IS ranges from 0 to 1 and was derived through the integration of results from three assessment methods: statistical method using discriminant analysis; deterministic method, where the factor of safety was determined by the Combined Hydrology and Stability Model (CHASM) and then converted to probability using Monte-Carlo simulations; and where appropriate, heuristic method was applied. The consequence score, which also ranges from 0 to 1 is derived using a method adopted from Hong Kong GEO, Report No. 68 (1998). The study was completed in 2004 and was found to be more applicable for many locations around Malaysia compared to other slope assessment methods (Jamaluddin et al. 2006). A simplified SMART has now been developed to reduce the number of parameters considered in the analysis. Figure 4 presents a linearrisk map along a part of the Tamparuli-Sandakan road.
Figure 4 : Typical linear risk map along a road
79
Jamaludin & Hussein (2006) also reported that there were three government agencies in Malaysia that were carrying out different landslide risk assessments to produce hazard and risk maps. The difference between PWD and these agencies is that based on IAEG (1976) scale category: PWD was creating a medium scale slope hazard and risk map the other agencies have prepared large scale maps. All three agencies used different methods

80
to come up with their hazard and risk maps. In the case of PWD, statistical, deterministic and heuristic methods were combined to finally come up with the SMART system. In the case of one agency, the Malaysian Remote Sensing Agency, they used Information Value Method developed by Yin and Yan (1988) and Kobashi and Suzuki (1988)was used to identify the most relevant parameters. Parameter maps were generated from geological, land use, geomorphological, slope and distance maps.
The landslide assessment system developed by Department of Mineral and Geoscience Malaysia (JMG) is based on a large-scale assessment for land use planning. The assessment level of the works carried out by JMG is mainly at medium scale and uses Qualitative Map Combination method of assessment. Chow & Mohamad (2002) describe the use of terrain analysis and classification maps by JMG that are based on four attributes: slope gradient, morphology, human activity, and erosion and instability.
PWD is currently engaged in spatial hazard and risk mapping in Miriin the state of Sarawak and Penang Island. This is part of the implementation plan to produce as many hazard and risk maps as possible in landslide prone areas for the purpose of planning and preventive treatments by the local authorities who are responsible for these localities.
The toll expressway concessionaires and highland resorts that privately hillside roads have their own hazard and risk maps. For example PLUS, the company that runs the North–South toll expressway and manages over 6,000 slopes (cut and fill slopes),uses the risk ranking maps to carry out periodic inspection. They rank their slopes and inspection programme as follows:
1. AA slopes (very high risk) - every 4 months
2. A slopes (high risk) - every 6 months
3. B slopes (medium risk) - every 12 months
4. C slopes (low risk) - every 18 months
The slope rank and conditions will determine the priority of remedial works required in the case of defects and the inspection programmes and record collation yearly. The database of the assets, inspection results,
remedial works carried out are stored in TEMAN (Total Expressway Maintenance Management System) for a structured asset management, retrieval and reference.
Another company operating a resort on a mountain top above 2000 m also maintain a mountainous road. The company has carried out a risk ranking exercise for the purpose of inspection and maintenance. High risk slopes are strengthened to reduce the risk ranking. The company also has their own slope management system known as the Genting Slope Management System.
Whilst slope hazard and risk maps has been utilized since 1996 in Malaysia, the lack of coordination between various agencies and variations in the maps produced create confusion among planners and local authorities when checking for development in landslide risk areas especially when there are conflicting risk ranking. It is hoped that with the setup of the Inter-governmental Committee on Slope Management (ICSM), overlapping of duties, division of tasks and responsibilities, coordination of slope activities can be centralised and better managed.
Early warning and real-time monitoring system
Based on the data collected during the NSMP study, a map of landslide-prone areas has been produced. Some of these areas are not to be very high in elevation; however, the adverse geological conditions make the areas prone to landslides. Such areas include Miri in Sarawak, an area well-known for its oil deposits. Figures 5 and 6 show the landslide prone areas in Peninsular Malaysia, Sabah and Sarawak.
The framework of the landslide early warning system (LEWS)to be adopted will be based on rainfall-landslide correlation over several areas where rain gauges are used to monitor rainfall and correlated with historical landslides. Existing infrastructure that includes Doppler radars and rain gauges own by other agencies will also be utilised in the development of LEWS. At critical locations such as a site near Kuala Lumpur and another in a mountain known as Mount Pass where the landslides are active, instruments to measure surface movements, pore water pressure, ground movements and others are installed and monitored in real-time. Through EWS, real-time monitoring and prediction capabilities will be developed based on

81
measured parameters. The data obtained at the monitoring sites are transmitted to a central Control Centre via a telemetry system. PWD is in the midst of developing rainfall-landslide correlation throughout Malaysia based on “Guidelines for Development of Warning and Evacuation System against Sediment Disasters in Developing Countries” published by Infrastructure Development Institute, Ministry of Land, Infrastructure and Transport (MLIT), Japan (2004).
PWD is also involved in a discussion with various stakeholders headed by National Security Council in the Prime Minister’s Department to establish a networking system for LEWS. The set up ofa Landslide Emergency Control Centre in PWD although is in the pipeline, but is still at an early stage where information from a few sites is collected and analysed. Schematic diagram of regional centres for Real-time monitoring system is proposed as in Figure 7.
Localised early warning systems have been installed at two locations in an area near Mount Pass. Many slopes in this area have shown signs of instability due to adverse geological conditions. The geology of the Mount Pass area consists of a sequence of metasedimentary rocks that are confined within a 4km-wide area surrounding the mountain complex. The rocks have been highly deformed and adulated, and have undergone low to medium-grade dynamic metamorphism (Andrew Malone Ltd., 2006). The metasedimentary rocks have been intruded by
Figure 5 : Landslide-prone areas (shaded) in Peninsular Malaysia
Figure 6 : Landslide-prone areas (shaded) in Sabah and Sarawak
81

82
granite plutons that are predominantly Permian to Jurassic in age (Gobbet & Hutchinson, 1973). The exposed rock cut slope within the site include: quartz mica schist, graphitic schist, quartzite and phyllite with weathering grades varying from Grade II (slightly weathered) to Grade VI (residual soils). The residual soils are confined to the 3-6 m top section of the slopes. According to a study by Andrew Malone Ltd (2006), the rock sequence is cut by a series of faults.
Due to the nature of the geology in the area, most of cut slopes in the area have been showing signs of movement since their construction. At two of these slopes surface movement monitoring are currently undertaken to track the movements.
At Section 44, a cut slope has translated downward and outward by more than 30 m. Even during construction this slope had already started to fail. It was initially designed for a cut of no more than 40 m highwhich is quite common in Malaysia when tunnels and viaducts are deemed too expensive compared with cut and fill. PWD has drafted the Slope Design Guidelines (Slope Engineering Branch 2009) to limit the height of cut and fill slopes to less than 40 m to facilitate maintenance of the slope and reduce environmental impact of the construction.At the same time the guidelines encourage the construction of tunnels and viaducts, which is more environmental friendly. This case clearly illustrates that the present method of cut and fill may not necessarily be more cost effective compared with tunnels and viaducts in the long run.Monitoring of the slope movement is carried out in real time using surface monitoring device to measure the movements of the slope surface. In this case,two automatic total stationswith prisms as markers are
Figure 7 : The proposed regional centres for Landslide Early Warning and Real-time Monitoring System in Malaysia
used to monitor the movements of the slope.
Based on the geological study that was carried out at Section 44, it was estimated that the thickest part of the slip surfaceis 60 m thick and the volume of the unstable mass is between 2 to 3 million m3(Othman et al. 2006). Realignment of the road the road utilising tunnel and viaducts were considered but the idea was deemed to expensive and finally rejected. After due considerations, it was decided that the best option is to carry out risk reduction exercises along the stretch of road between Section 44 to Section 46. Some of the actions taken include conducting round-the-clock inspections, monitoring and minor realignment of the road.
Figure 8 shows the head scarp at the top of the mountain and locations of the markers on the slope surface. The road is located at the bottom of the figure.
Movements of the slope surface have been monitored since 2003. Initially, manually until 2007 when two automatic total stations were installed and data were acquired at three-hourinterval as opposed to once a day when measurements were made manually. Figure 9 presents the movements of the most active marker near the head scarp.
In addition to round-the-clock inspection of the area, other actions taken include installed solar powered streetlights along a stretch of the road and automatic measurement of slope movements.

83
Since the site is located in a remote unpopulated area where basic amenities like electricity and clean water. The automatic total stations also have to be solar powered.
Works on regional rainfall-induced landslide warning system has started with some research being carried out along the high prone landslide roads in the highlands.
Figure 8 : Locations of markers for slope movement monitoring purposes
Figure 9 : Movements at Marker 2A-11 indicating cumulative movements of more than 16 m.
DISPLACEMENT OF POINT 2A-11
0
2
4
6
8
10
12
14
16
18
16/1
0/20
03
16/0
2/20
04
16/0
6/20
04
16/1
0/20
04
16/0
2/20
05
16/0
6/20
05
16/1
0/20
05
16/0
2/20
06
16/0
6/20
06
16/1
0/20
06
16/0
2/20
07
16/0
6/20
07
16/1
0/20
07
16/0
2/20
08
16/0
6/20
08
Time (date)
Disp
lacem
ent (
m)
Vertical Displacement Horizontal DisplacementTotal Displacement
Loss assessment and cost benefit analysis
This is the one of the most difficult components to work due to inadequate data. Many major landslides are usually rebuilt by the Federal Government through funds provided to the PWD. Minor landslides are usually left unattended except for protecting the affected areas with plastic sheeting to prevent erosion and aggravation in the areas. These measures may not always work because of the inherent weakness of the slope in the first place. In many cases the small landslides develop into larger ones that require a lot more input and funds to make it right.
A cost-benefit analysis was carried out during the NSMP study which showed that the total direct and indirect losses due to landslides from 1973 to 2007 are nearly USD one billion. The study shows that if a dedicated Slope Engineering Agency (SEA) were to be established,a reduction in landslide risk can be achieved by 25% over a period of 10 years. Past performance of the GEO in Hong Kong also indicates that the institution, along with its programme, has managed to reduce the risk of landslide by about 50% 23 years after its establishment (Massey et al, 2001). In the best case scenario, it is conservatively assumed that SEA will be able to achieve programme effectiveness at about one half of that accomplished by GEO. A significantly lower degree of effectiveness is anticipated because the countermeasures implemented by GEO, unlike SEA, involved major retrofitting works.
83

84
Therefore, for consistency, the projection of the benefits of the proposed counter measures for Malaysia excludes the benefits arising from the savings from slope restoration cost so that the cost of retrofitting which has not been made part of the master plan will be fully offset. Table 1 indicates the potential benefits should the establishment of SEA materialise.The prospect of this materialising is unclear as the procedure to establish this agency is lengthy and requires strong support of the Minister of Works. However, there is an argument that without a proper legislation the agency would not be empowered to carry out the tasks on its shoulder.
Many of the implementation plans for this component has not commenced as proposed by the NSMP as some of the measures involved mandatory insurance coverage for high landslide risk areas and mandatory declaration to PWD of the costs incurred for major landslide repairs by government and private entities. Other plans include guidelines to calculate direct and indirect economic losses due to landslide by agencies and local governments.
Table 1 : Economic feasibility indicators
Net PresentValue (USD)
Benefit-CostRatio
Economic InternalRate of Return
95 million 1.23 24.6%
Information collection, interpretation, dissemination, and archiving
Since the establishment of the Slope Engineering Branch, PWD has taken steps in the development of a slope management system. This is to facilitate slope preventive maintenance works, landslide disaster mitigation and expenditure prioritisation. One of the earliest effortsis to catalogue all slopes along the federal roads. The total length of the roads is more than 16,500 km including the roads in Sabah and Sarawak. Apart from inventorising the road, data captured are used to produce hazard and risk maps. Data are stored in a GIS. To date, more than 19,000 slopes have been catalogued and are used in hazard and risk maps .
Slope information is stored in two databases:spatial database and non-spatial database. Non-spatial database stores slope information which are physical attributes such as slope length, height, gradient and shape.
Integrated Slope Information system (ISIS) is a GIS-based slope management system that has been developed to store and disseminate information on slopes. It storesslope inventory, slope prioritisation, landslide’s inventory, and SMART module integration. It can also cater for any other modules such as monitoring system. All possible slope features and conditions that may cause instability are recorded using Primary Data Capture Proforma (PDCP). The information collected is used in the analysis to determine the hazard and risk ranking for each slope feature using a software that was especially developed for this purpose. With GIS software, the series of hazard and risk
ranking can be presented in the form of hazard and risk maps. The ISIS framework for data collection, processing and dissemination is shown in Figure 10.
The spatial databases are extracted from Light Detection And Ranging (LiDar), orthophotos, satellite imagery, topography and other related geographical representations. From this information,a Digital Elevation Model (DEM) can be produced. Subsequently other models can be generated such as Hillshade model, Slope Angle model and hydrological models. With the integration of non-spatial and spatial data, an assessment of slope stability can be carried out and the results of the assessment can be presented in graphical form.
ArcPad software (Mobile GIS) is customized in a handheld GPS device to facilitate slope data collection. Together with the kilometer post layer, it will help the process of collecting data as accurate and as fast as possible.
ArcIMS is being utilised and customized in order to publish and dissemination all the information that have been collected and processed. Publishing and dissemination are done through the intranet.The end user will be able to view and use all the slope information and risk maps. One of the implementation plans in the NSMP is for the integration of hazard and risk data with loss assessment and warning system elements. Also, data obtain would be able to generate the common data required such as hazard and risk ranking. These outcomes have

85
Figure 10 : The framework for Integrated Slope Information System
not yet materialised but initial efforts are been taken to generate hazard and risk maps (Mohamad et al. 2010).
Private slope owners such as toll expressway concessionaires and some highland resorts have their own slope information system that are being used for inspection, maintenance programme, hazard and risk mapping. In the case of the concession companies they have to provide the Malaysian Highway Authority (MHA) with their annual inspection and maintenance programme, failurefor which the MHA can carry out what they deem necessary to ensure the safety of the expressway under the care of the concessionaires.
Slope information collection, storage and dissemination are being carried out by most of the entities that have slope problems. However, sharing of information, even among government agencies is still a hurdle. It is hoped with the formation of the Intergovernmental Committee on Slope Management, some of the issues about the sharing raw data can be ironed out. Apart from the issue on sharing, other matters may include the nature of information to be shared, formats, protocolsfor the shared data and the systems that have to be used. It is also important that the agencies concerned know that most of the information required for landslide warning and prediction requires not just static but real-time data.
Training
In this componenttwo strategies were proposed to increase knowledge and awareness among
students, practicing engineers, stakeholders such as developers, local government officers, contractors, planners and geologists. In the case of students, one of the recommendations was to introduce curriculum and course templates for undergraduates and post graduates courses. Although has been discussed with the academia from various local universities during the drafting of the NSMP do not receive a favourable response from them simply because there is no space for a new course to be taught within the already congested course schedule. It was suggested that special talks be given by practising engineers on relevant topics on slope engineering to under and post graduates students. The programme has already started with a few universities and will be expanded to other institutes that teach civil engineering and soil sciences.
Other stakeholders include practicing engineers, planners, developers, contractors and geologists who would require training and awareness programmes. Developers and contractors in particular would require such training so that their works have better quality especially during embankment and slope constructions. PWD plans to work with the Malaysian Construction Industry Development Board to carry out a systematic courses and seminars for the construction industry players on good practices on slopes.
Figure 11 : Lectures on landslides presented to civil engineering students in a local university
85

86
Public awareness and education
One of the first programmes to be rolled out upon the completion of the NSMP was public awareness and education. The programme was about creating awareness of slope safety by minimising the effects of landslides through proactive actions and measures that can be taken by community members as well as by government and private owners of slopes.
Generally, people tend to focus on safety only after a disaster happens, so the programme aimed at getting them thinking about averting disasters before they occur.
Although the main target groups of the programmes were the communities-at-risk and the general public, there were other target groups consisting of the state and local governments, private slope owners, media, universities and schools.
The objective of the awareness programmes was to convey two key messages to the public. The first was to let the public know that there is a body of useful information that is available to the public on the phenomenon of landslides and tips on monitoring and maintenance. The second is that there is a government agency dedicated to safeguarding the interest of public safety.
These messages were encapsulated in the campaign theme of “Learn, Maintain, Monitor and Report” and all activities of the awareness programmes were centered around this theme. The motif that tied all these activities together was the slogan “Safe Slopes Save Lives”, courtesy of the Geotechnical Engineering Office in Hong Kong.The campaign logo featured an animated face of a friendly and helpful PWD engineer, as the role of PWD was to provide advice to the public.
One of the most important groups is the communities in at-risk areas because of the obvious risk to life and property. The assumption at the outset of the programme was that public awareness to this group would yield the best results among all the target groups because of the immediate safety concern to themselves.
Next to communities-at-risk, the most important target group was the local authorities. The authorities
are the only government body with the charter to enforce safety guidelines and by-laws and engage in maintenance measures. Because they are the first line of contact with the residents, it is crucial that the engineering departments of the authorities are well-trained and well-equipped.
Because land is a state matter in Malaysia, an understanding of the impact of state government decisions on land use was critical. Thus it was necessary to ensure that all levels of state government body were aware of issues in hillside development.
As with the local authorities, topics such as design, construction and maintenance of slopes were presented in seminars around the country.
Malaysia being a multi-racial country with diverse ethnicity, language and culture the public awareness campaigns and education will have to take these issues into consideration. Therefore, in some cases the public awareness campaign will have to tailor for the targeted community rather than for the general public at large. For example, the target audience in the rural village of Kundasang in Sabah, consisting mostly farmers, were very different in education level, attitudes and needs than the suburban group in Kuala Lumpur.
A baseline measurement survey on communities at risk was carried out prior to commencement of the
Figure 12 : Children lining up to receive prizes in a colouring contest
87
programmes for residents, and a follow-up survey was taken at the end of the programme period. The measurement instrument used was Knowledge, Attitude, Perception and Behavior study. Comparative analysis was conducted, and results showed that the public awareness programme met the overall target of 8% increase in awareness set in the NSMP for phase 1. Some of the modules showed more results than others; in the Preception module of the survey, there was a 24% increase. However, results showed while awareness increased, some respondents were not yet ready to convert that into proactive action. This need to be addressed in future programmes(Motoyama& Abdullah 2011).
Qualitatively, there were many impacts resulting from the public awareness. The programme impacted various target groups differently. Due to the programme’s phase one emphasis on capacity building, the groups that were most influenced were the state and local governments and the communities-at-risk. This reflected the time and commitment the Project Team spent on these two groups in particular.
The outcomes resulting from this programme are significant in that they reflect institutional and long-term changes that affect the way hillside developments will be carried out in the future. They are as follows:
Awareness among local authorities in hilly areas for a 1. proper slope management mechanism within their scope of work and the subsequent establishment of Slope unit within 3 local authorities in the high-risk states in the countryEstablishment of state-level independent slope 2. oversight committees for checking and approving all new development orders involving hills.Reporters of newspapers providing regular coverage 3. of slope issues in the local beat, and coverage now includes educational material in addition to problem cases.Formation of SlopeWatch, a community-based 4. organization that has grown into an non-governmental organization due to demand by residents for more information and advice on averting slope problems and pushing the authorities for stricter supervision of developers.Residents associations in urban areas establishing 5. sub-committees on slope monitoring so that residents can do their own monitoring and report to the authorities on any signs
These are some of the changes that the programme has effected, although there is much more work to be done. However, what the PWD has achieved through the Public Awareness and Education Programme on Landslides and Slope Safety was to create opportunities for the federal government, the public, local and state governments and other stakeholders to engage in a fruitful dialogue and collaboration that is hoped will continue for years to come.
Loss reduction measures
Thiscomponent covers such a wide range of issues that is related to other components that some overlapping of issues is inevitable but is has been kept to a minimum. There are many measures that can be taken to reduce losses such as hazard and risk maps and effective legislation and enforcement. The drafting of the NSMP is one of the actions that is part of the loss reduction measures (Abdullah & Mohamad 2008c). These are examples that this component may overlap with the other component to reduce risk. During the study, it was decided that the Loss Reduction Measures component would address matters that have not been taken up by other components. The strategies proposed in the NSMP for this component are as follows:• Remove various impediments for effective
implementation of current legal framework.• Introduce the participation of Slope Engineering
Branch of PWDat various stages of development and construction approval – for better control and check during development and construction stages.
• Develop and implement a detailed framework for planning, design, construction, maintenance and landslide reduction measures of slopes.
• Implement an incentive and disincentive scheme for developers, engineers and contractors to encourage good planning and engineering practices.
These are some of the strategies that have been proposed, along with 11 implementation plans to reduce losses. The Slope Engineering Branch, PWD has already started auditing of development plan submitted to the local authority although it is not yet mandatory for the developer and contractor to do so, unless requested by the local authority. Although an incentive and disincentive scheme proposal has been set in place by the government to mitigate major mistakes
87

88
by developers, contractors and engineers but for lesser ones are more complicated and require investigation and substantiation. As suggested in this component, more funds are required in public and private sectors for routine and preventive maintenance.
Emergency preparedness, response and recovery
There are two strategies proposed for this component. One is to develop capacity for quality emergency response and recovery while the other is to provide necessary support, advice and forensic reports in landslide emergencies. The idea is to provide resources and allocation placement in landslide prone areas. An emergency control has already being set up at the National Security Council, but the communication between the site and centre is still not smooth.
As a result of the 1993 landslide that caused toppling of an apartment block a special rescue team known as Special Malaysia Disaster Assistance and Rescue Team (SMART) was establishedto carry out special rescue operation such as in the case of landslide emergency. In Malaysia there are three agencies that carry out rescue operation. They are the fire brigade, Malaysian Civil Defence Department (JPAM) and the SMART team. The police is in charge of coordinating and controlling the disaster area, whilst the district officer or the president of the local authority is in charge at the district level. Even the army is involved in providing logistic support.
In Hong Kong, Geotechnical Engineering Office is actively involved in advising the first responders regarding the stability of the site. In Malaysia, Slope Engineering Branch would provide technical assistance if the disaster is near Kuala Lumpur.
With so many agencies involved in rescue operations coordination at the site is an issue. No coordinated drills have been carried out among the first responders. Some special equipmentused by the emergency responders are available in major cities,but are still unavailable in the remote landslide-prone areas.
Research and Development
Two strategies were formulated forthis component. The first is to develop a national research and
development framework and multi-year implementation plan. The second is to implement a national research and development agenda. The strategies called for coordination, collaboration, networking and dissemination of research works. In doing so,prioritisation of research can be enhanced while redundant, overlapping works can be avoided. Another agenda was to carry out applied research that can be readily utilised by practitioners.
PWD has started research on understanding the characteristics of debris flows in Malaysia, which to date has not been carried out. Debris flow is the most lethal type of landslide in Malaysia. On record there are only 13 major debris flow events that occurred from 1995 to 2011, two of which occurred at one location at different times. Although this type of landslide is not common in Malaysia, out of the 611 deaths due to landslides since 1961, 381 or 62% of the total deaths are due to this type of landslide. A tropical storm called Gregg that passed through the West Coast of Sabah on December 26, 1996 killed more than 300 people and destroyed more than 4925 houses(National Security Division 1997). Figure 12 shows the destruction caused by the debris flow.The objectives of the study are to:
• identify the characteristics of debris flow in Malaysia
• identify factors that contribute to the initiation of debris flows, and
• estimate rainfall threshold values that may trigger debris flows.
Figure 12 : Destruction due to debris flow in Keningau, Sabah

89
The study looked at 8 out of the 13 debris flow cases. The reason why not all cases were included in the study because some of the debris flows occurred more than 10 years ago and most of the footprints of the debris flows have disappeared.
The following information has been obtained from the study that was carried out. They are that:
initiation point at these sites begins in residual 1. soils in granitic formationthe thickness of the soil to the more 2. impermeable layer of weathered rocks is usually less than 3 mthe slope angle at the initiation points is 3. greater than 20 degreesthe soils at the initiation points are either 4. sandy silt or silty sandthe length of the initiation to discharge points 5. is between 230 to 2900 m.
An open source software is also used to simulate debris flow run out distance.
CONCLUSION
The NSMP is a unique and ambitious plan to reduce landslide risk and losses. It presents some of the aspirations and strategies initially mooted by USGS in its Circular 1244. The Malaysian NSMP attempts to put this theory into practice by proposing tangible implementation plans. The ten components proposed cover all aspects of the landslide risk reduction elements. There have been questions raised as to whether taking actions in all the components is the way to go in landslide risk reduction. The other alternative would be to follow what Hong Kong has done i.e.tackling what has been identified as the most important and the greatest impact in reducing the risk. The differences in approach take into consideration key differences between the two countries, such as the physical size of the country and the government structure. For example, Hong Kong has only one level of government, whereas other countries usually have three levels with their own authority and responsibilities. A directive from the federal government may not be followed by the state and the local governments because they have the power to do so. State and local level politics also come into play in some cases.
The progress tracking carried out indicates that most of the delay occurred in plans that require cooperation among agencies and institutions. Lack of funds is another factor that contributes to the lack of progress. The progress and success of the NSMP varies but generally many of the implementation plans are behind schedule.
The NSMP is driven by the PWD but with the support of all stakeholder agencies. The personnel that oversee the NSMP are not dedicated just to monitor and spur the NSMP but they are also currently carrying out their routine works. One of the first and the most important recommendation in the NSMP is to establish a dedicated Slope Engineering Branch to get the implementation plans going.
The NSMP can serve as a template for other countries that wish to carry out comprehensive actions to reduce landslide risk. The plan is not cast in stone but will be reviewed every 5 years interval.
Success factors for the NSMP are 1) agency or dedicated group of people to push for implementation plans; 2) adequate funds; 3) political will; 4) support and pressure from the public; and legislation for empowerment. By overcoming the obstacles to these factors, the NSMP can be a powerful tool towards effective landslide risk reduction and mitigation.
ACKNOWLEDGEMENT
The author would like to express his sincere appreciation to PLUS Ltd, Genting Malaysia Ltd, and Mohd Asbi and Associates for sharing their information and making this paper more comprehensive. The author would also like to thank Eriko Motoyama and Suhaimi Jamaludin for their assistance.
REFERENCES
[1] Abdullah, C.H., Mohamad A., Yusof, M. A. M, Gue, S. S. & Mahmud, M. A. 2007. Development of Slope Management in Malaysia. In K. Ho & V. Li (eds), The 2007 International Forum on Landslide Disaster Management: Vol. 1, 3-16. The Hong Kong Institution of Engineers.
89

90
[2] Abdullah, C. H. and Mohamad, A. 2008a. Malaysian National Slope Master Plan – The challenges to producing an effective plan. The Tenth International Symposium on Landslides and Engineered Slopes, Xian, China.
[3] Abdullah, C. H. and Mohamad, A. 2008b. Model of Slope Master Plan The First World Landslide Forum, 18-21 November, Tokyo, Japan
[4] Abdullah, C. H. and Mohamad, A. 2008c. Landslide mitigation strategy in the Malaysia National Slope Master Plan.The Second International Conference on Slopes, 4-5 November, Kuala Lumpur, Malaysia.
[5] Abdullah, C. H., 2010. National Slope Master Plan – the progress so far. The International Conference on Slopes, 28-30 July, Chiang Mai, Thailand.
[6] Anbalagan, R. 1995. Terrain evaluation and landslide hazard zonation for environmental regeneration and land use planning in mountainous terrain. The 6th Symposium on Landslides, Christchurch, New Zealand.861-868.
[7] Andrew Malone Ltd. 2006.Landslide study at Ch 23+800 to Ch 24+460, Simpang Pulai – Lojing Highway, Final report (Unpubl).
[8] Chow, W.S. & Mohamad, Z. 2002. Terrain and landslide hazards mapping for disaster management. Internal report. Department of Mineral and Geoscience Malaysia. (unpubl)
[9] Gobbett, D. J and Hutchison, C. S. (1973).Geology of Malay Peninsula. The Geological Society of Malaysia.Wiley-International, New York.
[10] Ingham, F.T. & Bradford, E. F. 1960.The geology and mineral resources of the Kinta Valley, Perak.Federation of Malaya Geological Survey District Memoir 9
[11] Infrastructure Development Institute, 2004.Development of warning and evacuation system against sediment disastersin developing countries. Guidelines for Construction Technology Transfer. Ministry of Land, Infrastructure and Transport, Japan.
[12] International Association of Engineering Geology (IAEG) 1976. Engineering geological maps: A guide to their preparation, Paris, UNESCO Press.
[13] Jamaludin, A., Muda, Z., Alias, S. & Yusof, N. M., 1999. Application of hazard and risk mapping to a mountainous higway in Malaysia. In Yagi, Yamagami & Jiang (eds), Slope Stability Engineering: 1291-1296: Rotterdam: Balkema.
[14] Jamaludin, S. & Hussein, A. N., 2006. Landslide hazard and risk assessment: The Malaysia experience. The 10th IAEG Congress, Nottingham UK, 1-10. The Geological Society of London.
[15] Jamaludin, S., Huat, B. B. K. & Omar, H. 2006.Evaluation of slope assessment systems for predicting landslides of cut slopes in granitic and meta-sediment formations. American Journal of Environmental Sciences, Vol. 2(4), 135-142. Science Publications.
[16] Kobayashi, S. & Suzuki, M. 1988.Hazard index for the judgement of slope stability in the Rokko Mountain region. The INTRAPRAEVENT Graz, Austria, 1 : 223-233.
[17] Lloyd, D. M., Wilkinson, P. L., Othman, M. A. & Anderson, M. G. 2001. Predicting landslides: assessment of an automated rainfall based landslide warning system. The 14th South East Asian Geotechnical Conference, Hong Kong, 10-14 December, 135-139.
[18] Massey, J.B., Mak, S.H. and Yim, K.P. 2001. Community based approach to landslide risk reduction. Geotechnical Engineering Meeting Society’s Needs. The Fourteenth Southeast Asian Geotechnical Conference, Hong Kong, (1) p 141-147.
[19] Mohamad, A., Sharom, S., Kassim, K., Abdullah C. H. & Hameed, A. M. A. 2010. Slope management along federal roads in Malaysia. The 8th Malaysian Road Conference, 10-13 October, Kuala Lumpur, Malaysia.
[20] Motoyama, E. & Abdullah, C. H. 2011. Landslide public awareness and education programmes in

91
Malaysia.The Second World Landslide Forum, 3-7 October, Rome, Italy.
[21] National Research Council, 2004. Partnerships for reducing landslide risk – assessment of the national landslide hazards mitigation strategy, The National Academies Press, USA
[22] National Security Division 1997.Policy and mechanism of national disaster management and relief. National Security Council Directive No. 20, Prime Minister’s Department, Malaysia.
[23] Othman, M.A, Low, T.H, Jamaluddin, T. A. &Komoo, I. 2006. Characteristics of a geological controlled landslide at the SimpangPulai – Blue Valley Road. Proc. of International Conference on Slopes, Malaysia, 75-88.
[24] Public Works Department 1996. East-West Highway long term preventive measures and stability study. Final Hazard Analysis Report. Public Works Department, Malaysia (unpubl).
[25] Remendo, J., Soto, J., Gonzalez-Diaz, A., de Teran, J. R. D., & Cendrero, A. 2005. Human impact on geomorphic processes and hazards in mountain areas in northern Spain. Geomorphology, Vol. 66, 69-84.
[26] Rogers, J. D. 1992. Recent developments in landslide mitigation techniques, Review in Engineering Geology, Vol. IX, 95-118. Geological Society of America.
[27] Slope Engineering Branch, 2006. Guidelines on slope maintenance in Malaysia – Cerun 1, Public Works Department, Malaysia.
[28] Slope Engineering Branch 2009. National Slope Master Plan. Public Works Department, Malaysia.
[29] Slope Engineering Branch, 2009. Slope design guidelines, Public Works Department, Malaysia.
[30] Spiker, E. C. &Gori, P. L. 2003. National landslide hazards mitigation strategy – a framework for loss reduction, Circular 1244, United States Geological Survey.
[31] Survey and Mapping Department 2008. Map of Malaysia: Ground Elevation greater than 500 m. Ministry of Sciences, Technology and Innovation (pers. comm.)
[32] Town and Country Panning Department 2009.Guidelines for developments on hilly terrain and mountainous areas, Ministry of Housing and Local Government, Malaysia.
[33] Wong, H. N. & Ho. K. K. S., 2006. Landslide risk management and slope engineering in Hong Kong, The Seminar on The State-of-the-Practice of Geotechnical Engineering in Taiwan and Hong Kong, Hong Kong.
[34] Wong C. K. L. 1998. The New Priority Classification Systems for slopes and retaining walls. GEO REPORT No. 68. Geotechnical Engineering Office, Civil Engineering Department, Hong Kong.
[35] Yin, K. L. & Yan, T. Z. 1988.Statistical prediction method for slope instability for metamorphosed rocks. The 5th International Symposium on Landslide, Lausanne, Switzerland, 2: 1269-1272.
[36] Yusof, Z. A &Bhattasali, D. (2008). Economic growth and development in Malaysia: policy making and leadership. Commission on Growth and Development, Working Paper No. 27.The World Bank.
91
* Presented at Landslides and Engineered Slopes: Protecting Society Through Improved Understanding – Eberhardt et al, held in Banff, Alberta Canada, 2-8 June 2012

92
VALUE PROBLEM SOLVING AT DESIGN
STAGE OF PUBLIC CONSTRUCTION
PROJECTS IN MALAYSIA
ROHANIS BT. AB. GHANIPenolong Pengarah Kanan (Ukur Bahan)Cawangan Pengurusan Projek Kompleks
Sarjana Muda Ukur Bahan, Universiti Teknologi Malaysia
MSc.Eng International Construction Management and Engineering (ICME),
University of Leeds, United Kingdom
ZAWIDATUL ASMA BT. GHAZALIKetua Penolong Pengarah Kanan (Arkitek)
Cawangan Pengurusan Projek Kompleks
Bachelor of Arts in Architecture, Iowa State University, United States of America
ABSTRACT
The competitive environment in construction requires the organizations constantly to seek ways
to enhance value for money of projects. In the quest for improving value, Value Management (VM) is well acknowledged as a methodological management tool that seeks for an optimal balance between function, quality, cost and time. Since December 2009, the Malaysian Economic Planning Unit (EPU) of Prime Minister Department has mandated VM implementation in all public programmes or projects valued at MYR 50 million (USD 16 million) and above. This recent government’s initiative introduces new paradigm of VM as an emerging tool in management of construction projects in the country. In May 2011, the EPU’s VM guide has marked three major VM study interventions along the project life cycle – at Strategic Planning Stage, Design Stage and Use Stage. The primary objectives of this paper are to identify the recurring value problems at the design stage in construction projects through observations and a literature review, and to theoretically explore the benefits of VM in solving the identified value problems. The authors identified 8 prominent value problems that can lead to poor value in public construction projects through a literature search and the authors’ experiences
gained in facilitating design stage Value Engineering (VE) studies. The paper demonstrates that VM is a reliable technique for applying to value problems in construction, identifying 10 significant benefits that VE can achieve in construction projects at design stage. Finally, the remainder part of this paper aims to validate the viability of VM through demonstrating how value problems were solved in four selected VM studies of the Malaysian public construction projects.
Keywords : VM in malaysia, value problems, VM benefits, VM viability
INTRODUCTION
Since over the past two decades, Value Management (VM) has been adopted for use as a value for money measure in construction projects of a number of countries (Kelly, Male and Graham, 2004). As stated, it has seen growth in its development and practice at differing intervention points across a wide range of construction project types. It is acknowledged that VM is highly effective in early planning stage of a project as well as during various stages of design, construction and operation. A well-managed and effective implementation of VM will result in value enhancements which are focused on meeting or even
9393
surpassing client’s expectation. As discussed by Norton and McElligott (1995), a construction project requires a large capital investment which translates into significant financial commitment for an organization. This suggests that such commitment forces an organization to set sound business strategies to deliver the products or services as intended.
Traditionally, once a project design and its cost estimate have been developed, the success measure of the project is to deliver within the capped budget. Walker and Greenwood (2002) argued that cost is only one of the measurements of value, and in many ways it is a crude measurement, as value goes beyond cost. There are other underlying value attributes which need to be explored in order to achieve the optimum project value. Therefore, the management of value requires some articulation of the concept of value and it is necessary to understand its common meaning to the organization in the context of balancing between the cost, time, quality and functionality.
Hence, the application of VM in a construction project is critical to its success due to VM’s ability to provide basis for improving value for money (Ashworth and Hog, 2000). VM and VE are effective techniques for aligning or realigning the project value chain (Smith, 2008) as VM is about getting the right project, whilst VE is done to get the project right (Hammersley, 2002).
VM DEVELOPMENT IN MALAYSIA As cited by local authors (Jaapar and Torrence 2005; Jaapar 2006), VM was first introduced in Malaysia in1986. However since its inception, it is observed that VM is not widely practised in Malaysia largely due the lack of knowledge and resistance to change within the industry (Jaapar and Torrence, 2006), as well as the absence of regulation to enforce VM application. This has resulted in a significant gap between the global development and VM application in the Malaysian construction industry.
Despite the slow growth of VM application, many construction industry players have acknowledged that VM contributes to the achievement of value for money in projects. Thus, endorsing a positive future for VM in Malaysia. The level of awareness and appreciation of VM has increased over time since the establishment
of the Institute of Value Management Malaysia (IVMM) in the year 2000. IVMM has garned much support and encouragement from the various government agencies, professional boards and educational institutions, reflected through the increase in academic research and training expenditure.
The promotion of VM in recent years has created new opportunities for VM application in projects. This is echoed by the government’s support through the issuance of a mandate in 2009 by the Economic Planning Unit (EPU) of the Malaysian Prime Minister’s Department requiring compulsory VM studies for public programmes or projects valued at MYR 50 million (USD 16 million) and above (EPU, 2009). This government’s directive marks the beginning of a new paradigm for VM with the expectation of significant growth of VM application in the construction industry.
Following the mandate in May 2011, the EPU launched the “Value Management Implementation Guide in Government Programmes / Projects” (EPU, 2011) to set three major VM study interventions at various stages of a project life cycle. As outlined in the VM Guide, the three VM studies to be conducted in a programme or project are as follows:
(1) “Value Assessment” at the Strategic Planning Stage
(2) “Value Engineering” at Design Stage
(3) “Value Review” at Use Stage
Figure 1 illustrates the VM interventions stipulated in the VM Guide, taking into consideration the best opportunity points where VM studies are most beneficial for public construction projects in Malaysia.
VALUE PROBLEMS AT DESIGN STAGE
Generally, the concept of value as defined by Dell ‘Isola relates to the delivery of functions and expected qualities against the total life cycle cost of the product (Che Mat, 2002). Similarly, as cited by Male (Kelly, Morledge and Wilkinson, 2002), value is historically presented by the cost ratio to benefits and normally in monetary terms or economic perspectives. However, further discussion has suggested that value is also presented in terms of use qualities, esteem features, exchange properties, cost characteristics and functional aspect from users’ perspectives.

94
Figure 1 : VM study interventions in a project life cycle (adapted from VM Guide, EPU, 2011)
Meanwhile, a value problem refers to an event or situation embedded within value systems where it must be addressed, judged and solved (Kelly, Male and Graham, 2004) in achieving best value in projects. The identification of value problems is fundamental in VM practice as it facilitates sound judgement and decision making to improve value in projects.
As such, this paper attempts to identify the value problems at design stage in conventionally procured construction projects, focusing on clients, designers and cost advisers as primary contributors to the identified problems. Based on recent facilitation experiences and critical observations on various Malaysian construction projects, supported by relevant theoretical evidences from various literature reviews, the authors have discovered eight prominent value problems occurring at design stage, as described in Table 1:
Value Problems Literature References
1. Inadequate project definition
Inadequacy of project definition occurs due to insufficient information in describing the client’s needs and requirements, project missions, objectives and output expectations which may lead to poor design or non fit for purpose output.
Smith (2008):
“Project suffers from poor definition due to inadequate thought given for a careful analysis of needs”
2. Less emphasis on value objectives
The value objectives from client’s perspectives are seldom explored and prioritised in terms of the expected best value to be delivered.
Kelly and Male (1993):
“The emerging design should be audited against the client’s value system in transmitting a clear value requirements”
3. Non rigorous functional analysis
Functionality is not always rigorously analysed to identify clearly and explicitly the project functions in achieving value improvement.
Hammersley (2002): “Function analysis is for identifying clearly what each project or element does rather than what they are”
4. Insufficient end-use analysis
A design review is not always extensive and in-depth in orientating users’ activities to comprehend process flows and usage efficiency in ensuring users’ satisfaction.
Kelly, Male & Drummond (2004):
“It is necessary to understand end users’ activities for maximum usage efficiency”.
5. Embedded unnecessary costs
Unnecessary costs are unknowingly embedded in projects where they do not contribute meaningfully to either function, quality, life, use or appearance.
Che Mat (2002):
“There are so many reasons contributed to the unnecessary costs in a project that should be eliminated”
6. Inadequate exploration of issues and constraints
These deficiencies often occur in the normal design and cost reviews especially in projects with tight schedule. They may translate into risks for the projects.
CUP No. 54 (1996):
“Project related issues and constraints should be explored before deciding to progress further”
Table 1 : Identified Value Problems at Design StageVALUE MANAGEMENT STUDYINTERVENTION
(FOR PHYSICAL PROJECTS)
PROJECTS SCOPING& BUDGET CAPPING
CLIENTS STRATEGIC BRIEF
VALUE MANAGEMENT
VALUE ENGINEERING
VALUE REVIEW
DESIGN DEVELOPMENT
DESIGN & COST OPTIMIZATION
PROJECT IMPLEMENTATION& DELIVERY
POST REVIEW& IMPROVEMENT

95
VM BENEFITS AT DESIGN STAGE
VM benefits as tabulated in Table 2 is based on the authors’ review on various literatures, with the aim of identifying the most significant benefits arising from the implementation of VM at design stage (commonly termed as VE). The ten significant VM benefits identified are listed below and will be used as basis for further analysis in the remainder parts of the paper:
Table 2 : Identified VM Benefits at Design Stage
VM Benefits Author References
1. Achieves clarity of project needs and requirements.
IVM UK (2009);
Che Mat (2002);
Smith (2008).
2. Governs strategic focus on project objectives and priorities.
CUP No. 54 (1996);
Smith (2008);
Kelly and Male (1993).
3. Emphasizes client’s value systems or value objectives.
Kelly, Male and Graham (2004);
Kelly and Male (1993).
4. Identifies and eliminates unnecessary costs.
Norton and McElligott (1995);
CUP No. 54 (1996);
Smith (2008).
Value Problems Literature References
7. Less effort in seeking alternatives
Design team tends to refrain from exhaustively seek alternatives or re-look for better design solutions.
Leeuw (2001):
“Many of us look for a quick fix decision within the norms that have been set”
8. Lack of consideration for Life Cycle Cost (LCC)
Life Cycle Cost implication is seldom considered when making decision to determine optimum design solution of project.
Pasquire, C. and Swaffield (2002):
“There has been relatively little success of LCC application in construction projects”
5. Focuses on functions and fitness for purpose.
CUP No. 54 (1996);
Smith (2008) .
6. Enhances operational process and end-users’ satisfactions
Kirk (1998);
Beard, Loukakis and Wundram, (2001).
7. Improves communication and decision making process
IVM UK (2009);
Smith (2008) page 18;
Che Mat (2002).
8. Promotes team dynamics, creativity and innovation
CUP No. 54 (1996);
Smith (2008);
Che Mat (2002).
9. Deals with Life Cycle Costs, not just initial capital
Norton and McElligott (1995), Smith (2008);
OGC 07 (2007).
10. Performs robust review on entire project and constraint exploration
Norton and McElligott (1995), Smith (2008);
Che Mat (2002).
THE VIABILITY OF VM AT DESIGN STAGE
Based on the findings presented in Table 1 and Table 2, the following Table 3 summarizes the relation of the identified VM benefits with the respective value problems. This is based on the authors’ critical evaluation and the findings are captured in a matrix to demonstrate that VM is viable in solving the identified value problems at design stage in construction projects.
Table 3 shows that VM benefit No. 10 -“performs robust review on entire project and constraint exploration” is most effective in solving the identified value problems at design stage. Two other VM benefits namely No. 5 - “focuses on functions and fitness for purpose” and No. 7 - “improves communication and decision making process” have significantly contributed to the same purpose. The remaining benefits were also proven to be viable. This evidence of VM viability at design stage will be validated through a critical analysis on selected Malaysian case studies in the final part of this paper.
95

96
VALUE PROBLEMS
Inad
equa
te p
roje
ct d
efini
tion
Les
s em
phas
is o
n va
lue
obje
ctiv
es
Non
rigo
rous
func
tiona
l ana
lysi
s
Insu
ffici
ent e
nd-u
se a
naly
sis
Em
bedd
ed u
nnec
essa
ry co
sts
Inad
equa
te e
xplo
ratio
n of
issu
es a
nd co
nstr
aint
s
Les
s effo
rt in
seek
ing
alte
rnat
ives
Lac
k of
con
side
ratio
n fo
r LCC
VM BENEFITS 1 2 3 4 5 6 7 8
1. Achieves clarity of project needs and requirements
√ √ √ √
2. Governs strategic focus on project objectives and priorities
√ √ √
3. Emphasizes client’s value systems or value objectives
√ √ √ √
4. Identifies and eliminates unnecessary costs
√ √ √ √ √
5. Focuses on functions and fitness for purpose
√ √ √ √ √ √
6. Enhances operational process and end-users’ satisfactions
√ √ √ √ √
7. Improves communication and decision making process
√ √ √ √ √ √
8. Promotes team dynamics, creativity and innovation
√ √ √ √ √
9. Deals with Life Cycle Costs, not just initial capital
√ √ √ √
10. Performs robust review on entire project and constraint exploration
√ √ √ √ √ √ √ √
CASE STUDIES – VALIDATION OF VM VIABILITY AT DESIGN STAGE OF PUBLIC CONSTRUCTION PROJECTS IN MALAYSIA
This final part aims to validate the viability of VM in solving the identified value problems at design stage in four sample projects where VM studies were facilitated by the authors’ facilitation team from the Public Works Department of Malaysia. The sample projects selected were conventionally procured and the VM studies were conducted during design development.
The information regarding the context of VM studies conducted for each case study is described in the following part. Table 4 highlights the prominent value problems identified in each case study and followed by the validation of each VM benefit that significantly realised through VM implementation (in one or more case studies) as presented in Table 5.
Case Study 1
Project (Sector): A Vocational Institution (Higher Education)
VM Study Scope: All spaces; selected elements and components
Design Level: Schematic Design and initial Bills of Quantities
Achievements: Compact design for building and site layout; Functional and operational performance improved;
Table 3 : VM Viability at Design Stage

97
Design improvement (Industrilised Building System); and Cost optimization.
Cost Avoidance: 10.72% from original cost estimate
Case Study 2
Project (Sector): A Rural Road (Public Infrastructure)
VM Study Scope: Most of elements and components
Design Level: Schematic Design and initial Bills of Quantities
Achievements: Clearer project definition; Innovative solutions (geotechnical and road specification); Land acquisition constraints resolved; Utilities relocation cost reduced; and Cost optimization.
Cost Avoidance: 23.63% from original cost estimate
Case Study 3
Project (Sector): A Bridge (Public Infrastructure)
VM Study Scope: Most of elements and selected components
Design Level: Detail Design and Bills of Quantities
Achievements: Innovative solution (from Prestressed Concrete to Steel Cable Stay); Environmentally and operationally improved (maximum horizontal clearance); Construction time reduced; Better appearance (aesthetical); and Cost optimization
Cost Avoidance: 9.89% from original cost estimate
Case Study 4
Project (Sector): A State Hospital (Health)
VM Study Scope: Selected elements and components
Design Level: Detail Design and Bills of Quantities
Achievements: Design redundancies reduced; Energy efficiency and Life Cycle Costing
(LCC) improved; Green Building Index Certification Compliance; and Cost optimization
Cost Avoidance: 5.98% from original cost estimate
Table 4 : Identified Value Problems in Case Studies
CASE STUDIES
CASE
STU
DY
1
CASE
STU
DY
2
CASE
STU
DY
3
CASE
STU
DY
4
VALUE PROBLEMS
1. Inadequate project definition √
2. Less emphasis on value objectives
√ √ √ √
3. Non rigorous functional analysis
√ √
4. Insufficient end-use analysis √ √
5. Embedded unnecessary costs √ √ √ √
6. Inadequate exploration of issues and constraints
√ √
7. Less effort in seeking alternatives
√ √
8. Lack of consideration for LCC √ √ √ √
Table 5 : Validation of VM Viability Through Case Studies
CASE STUDIES
CASE
STU
DY
1
CASE
STU
DY
2
CASE
STU
DY
3
CASE
STU
DY
4
VM BENEFITS
1. Clarity of project needs and requirements achieved
√
2. Strategic focus on project objectives and priorities governed
√ √
3. Client’s value systems or value objectives emphasized
√ √ √ √
97

98
4. Unnecessary costs identified and eliminated
√ √ √ √
5. Focused on functions and fitness for purpose
√ √
6. Operational process and end-users’ satisfactions enhanced
√
7. Communication and decision making process improved
√ √ √ √
8. Promoted team dynamics, creativity and innovation
√ √ √ √
9. Dealt with Life Cycle Costs, not just initial capital
√ √ √ √
10. Performed robust review on entire project and constraint exploration
√ √ √ √
Table 4 demonstrates that the earlier identified value problems are genuine project issues as discovered in the case studies. At the same time, Table 5 also demonstrates that the earlier identified VM benefits are validated in the case studies.
CONCLUSIONS
This paper has critically explored the prominent value problems and highlighted VM benefits at design stage of construction projects. Further to that, the paper has also demonstrated the correlation between the identified value problems and VM benefits in a matrix, suggesting that VM is viable in solving value problems at design stage of construction projects.
The above notion is evidently validated through actual value problems solving at design stage in the presented case studies. At the same time, the above findings have triggered the thinking that value problems are embedded in all construction projects. With thorough exploration of the value problems, issues can be effectively discussed and evaluated, prompting creativity in coming up with solutions. This can be achieved through a robust methodology as postulated by Value Management. Thus proving, VM is the effective project management tool to enhance value and deliver tangible benefits to construction projects.
ACKNOWLEDGMENTS
Sincere appreciation extended to co-author Mdm Zawidatul Asma, all Directors Dato’ Ir Salehuddin, Ir Nazari and Ir Mohd Daud. Greatest thanks to all VM team members for continuous support given; Sharifah Muna, Ir. Mukhzani, Muhammad Fahmi, Syamsul Kamal, Rezal, Hanida, Nazariah and Zuraida; friends and families.
REFERENCES
[1] Ashworth, A and K. Hogg (2000). Added Value in Design and Construction. Essex, Pearson Education Limited
[2] Beard, J. L., Loukakis, M. C. Sr. and Wundram, E. C. (2001). Design and Build, Planning Through Development, Mc Graw-Hill, USA.
[3] Central Unit on Procurement (CUP) (1996) Guidance No. 54 - Value Management, H.M. Treasury, UK Government, 2, 5
[4] Che Mat, M. M. (2002). Value Management Principles and Applications, Prentice Hall, Selangor, Malaysia, 4, 8, 9, 11.
[5] EPU (Economic Planning Unit), (2009). “Value Management Implementation Guideline No. 3/2009”, Malaysian Prime Minister’s Department, Putrajaya, Malaysia
[6] EPU (Economic Planning Unit) VM Guide, (2011). “Value Management Implementation Guide in Government Programmes / Projects”, Malaysian Prime Minister’s Department, Putrajaya, Malaysia
[7] Hammersley, H. (2002). “Value Management in Construction” <http://www.alabc. org.uk/downloaded PDF>, 2, 9
[8] IVM UK (Institute of Value Management, UK) (2009). “What is Value Management, <http://www.ivm.org.uk/vm_generic_vm_process.htm>
[9] Jaapar, A. and J. V. Torrence (2005). “Value Management and its Current Status in Malaysia”, The Malaysian Surveyor, 39.2 (February), 14-25

99
[10] Jaapar, A. (2006). The Application of Value Management in the Malaysian Construction Industry and Development of Prototype Value Management Guidelines, Faculty of Architecture, Planning and Surveying, Universiti Teknologi MARA, Selangor, Malaysia, 380.
[11] Jaapar, A. and J.V. Torrence (2006). “Contribution of Value Management to the Malaysian Construction Industry: A New Insight”, The International Conference on Construction Industry 2006 (ICCI 2006), Universitas Bung Hatta, Padang, Indonesia
[12] Kelly, J. and Male, S. (1993). Value Management in Design and Construction, The Economic Management of Projects, Taylor and Francis, Oxon, UK. 3, 70, 81-83
[13] Kelly, J., Male, S., and Graham, D. (2004). Value Management of Construction Projects, Blackwell Publishing, Oxford, UK. 1-2, 153
[14] Kelly, J., Morledge, R. and Wilkinson S. (2002) Best Value in Construction, Blackwell Science Ltd, UK. 12-13
[15] Kirk, S.J. (1998). “Value Management Assistance in Design-Build”, SAVE International Conference Proceedings 1998, <http://www.value_eng.org/pdf_docs/ conference_ proceedings>
[16] Leeuw (2001). “Value Management: An Optimum Solution”, International Conference on Spatial Information for Sustainable Development, Nairobi, Kenya, 2
[17] Norton, R. B. and Mc Elligott W.C. (1995). Value Management in Construction, A Practical Guide, Macmillan Press Ltd, UK., 29.
[18] Office of Government Commerce (OGC 07) (2007), Achieving Excellence in Construction, Procurement Guide No. 07: Whole Life Costing, UK.
[19] Pasquire, C. and Swaffield, L. edited by Kelly et al (2002) Life Cycle/Whole Life Costing in Best Value in Construction, Blackwell Publishing, Oxford, UK. 147-151
[20] Smith, N.J. (2008) Engineering Project Development, Third Edition, Blackwell Publishing, Oxford, UK., 17, 18, 24
[21] Walker, P. and Greenwood, D. (2002). Risk and Value Management, RIBA Enterprise Ltd, London, UK (Walker and Greenwood, 2002).
99
* Presented at International Conference of Value Engineering and Management (ICVEM) 2012 The Hong Kong Polytechnic University 06 – 07 December 2012

100
PROJECT MANAGEMENT :LEBUHRAYA PANTAI
TIMUR FASA 2 - A CASE STUDY
IR. HUROLAINE BT. CHE AB AZIZPenolong Pengarah Kanan (Awam)
Cawangan Pengurusan Korporat
B. Eng (Civil) ,Carleton University, Canada
Master of Project Management, RMIT University, Australia
INTRODUCTION
Project management researchers had conducted a lot of research on project success since the late 1960s. One of the areas that had gained considerable attention in recent research is critical success factors (CSFs). Cooke-Davis (2002) distinguishes between project success (measured against the overall objectives of the project) and project management success (measured against the widespread and traditional measures of performance against cost, time and quality), and between success criteria (the measures by which success or failure of a project or business will be judged) and success factors (those inputs to the management system that lead directly or indirectly to the success of the project or business). Since the management system that has been widely used in managing activities in a project is the body of project management, it can be said that CSFs are inputs to project management that lead directly or indirectly to the success of the project. Munns & Bjeirmi (1996) also argued that project management and project success are not necessarily directly related. The objectives of both project management and the project are different and in order to measure project success, a distinction should be made between the success of a project and the success of the project management activities. The concept is also historically proven by projects around the world, such as Sydney Opera House, Australia and Thames Barrier, England, which were considered as relatively successful despite of being thought as a failure in the aspect of project control.
It is the purpose of this paper to examine what are the project management critical success factors in a case study as compared to the project management body of literature. Due to the limitations of the paper’s scope it will only focus on the planning phase of the case study including the setting up of the project team. It is believed that observations made in the case study will provide a better understanding in project management critical success factor.
The paper will first discuss the difference between project and project management followed by the concept of project success and project management success by drawing upon the relevant literature in the subject. Next, critical success factors for project management will be discussed for different project life-cycle and from different organizational conditions and dimensions including leadership. Then the paper will discuss the case study based on the author’s direct experience and observations. The paper will then summarize the CSFs that have been identified from the case study and draw its conclusion on project management success.
LITERATURE REVIEW
The Project Management Body of Knowledge Guide (PMI 2008) defines project as a temporary endeavour undertaken to create a unique product, service or result. The temporary nature of project indicates a definite beginning and end. The end is reached when the project’s objectives have been reached or when

the project is terminated because its objectives will not or cannot be met, or when the need for the project no longer exists. As for project management, it is defined as the application of knowledge, skills, tools and techniques to project activities to meet the project requirements. Project management is accomplished through the appropriate application and integration of the five process group of initiation, planning, executing, monitoring and controlling and closing. Some of the activities involved in managing a project are:
• identifying the project requirements• addressing the various needs, concerns and
expectation of the stakeholders• balancing the project constraints such as
scope, quality, schedule, budget, resources and risk.
The relationship among these factors is such that if any one factor changes, at least one other factor is likely to be affected. From these definitions, it can be said that a project is a series of activities that need to be carried out in order to achieve its objectives while project management is the process of controlling those activities to ensure that they achieve the project’s objectives.
Munns and Bjeirmi (1996) states that the definition of a project has suggested that there is an orientation towards higher and long-term goals. Higher and long-term goals indicate objectives that are meant to be achieved after the closing of a project such as return on investment, profitability, competition and market ability. The definition of project management suggested a shorter term and more specific context for success such as the obvious indicators of completion to budget, satisfying the project schedule, adequate quality standards and meeting the project goal. Project management is usually considered to end when a project is delivered to the client but for a project, it will continue until either it meets its objectives or terminated. This indicates that project management is a subset of the wider context of the project and may contribute, although not guaranteed, to project success.
The definitions provided above also indicate that project success and project management success are relative to a time frame. Shenhar et al. (2002) observed that the nature of success measurement changes
with its short and long term implications. In a very short term time frame, which is during the project’s execution and immediately after its completion, project efficiency is found to be as the most important dimension to a project success. In this case, project efficiency is defined as how well the project has been managed, usually measured by how the project meets its resources constraints (time and cost) and how well it copes with deviations from plans (the process of monitoring and control). Therefore it can be said that, at the implementation phase of a project, project management is a critical success factor to overall project success.
From project management’s perspective, the completion of a project requires it to go through a set of project life-cycle starting from initiation until closing (handover). Pinto and Prescott (1988) had examined CSFs over the project life-cycle and found that the relative importance of several of the critical factors change significantly based on the life-cycle stages. Zwikael and Globerson (2006) had made comparison between CSFs identified in previous researches and discovered that planning is repeatedly considered as a CSF in project implementation. The authors had also identified 16 critical planning processes that have significant but unequal impact on project success. The 6 processes with the highest impact are:
• Definition of activities to be performed in the project
• Schedule development• Organizational planning• Staff acquisition• Communication planning• Developing a project plan
The study also had identified two planning processes that have low impact on project success, risk management plan and resource planning. Providing extra efforts in these two processes may not increase their contribution to project success as compared to investing more effort in other critical processes.
While the above CSFs are at planning phase, Cooke-Davies (2002) had identified eight factors that are critical to overall project management success. Six of the factors correlated to on-time performance while the other two factors correlated to on-cost performance. Interestingly, the factors that correlated
101

102
to on-time performance are practices that are related to risk management and factors that correlated to on-cost performance are practices found in scope management.
The completion of a project requires input from a variety of groups including the client, the project team, the parent organisation and the stakeholders. Among these groups, parent organisation and project team are the two parties that are directly responsible for the project management success. Understanding the relationship between organisational context of the parent organisation and CSFs could improve the rate of project success. Hyväri (2006) concluded that it is possible to identify CSFs in project management that are significantly related to company/organization size, project size, organization type and project manager’s work experience. The study found that company/organization size was significantly related to communication in project teams especially for bigger companies, while adequacy of funds/resources is more critical for smaller companies. Managerial is also a critical factor since successful projects are mostly led by individuals who possess not only a blend of technical and management knowledge, but also leadership skills that are internally compatible with the project team motivation and externally compatible with client focus strategies. The total work experience of project managers is also significant where junior project managers seem to need clearer project management organizations and job descriptions than senior project managers do.
As mentioned above, project team is one the parties directly responsible for implementation of a project. In this case, the project team will be responsible for the planning and control of the resources provided by the parent organisation. Hyväri (2006) had identified three critical factors related to project team members that could contribute to project management success, namely communication, commitment and technical background. This is logical since the orientation of the project team will usually be towards the task and it is particularly true as deadlines for the achieving work are stressed and become paramount to the project.
Leadership is also important in any organisation or project. One of the most significant contributions that a leader can make in an organisation or project is that of creating and clearly communicating a shared vision (Christenson and Walker, 2004). A project vision serves
the purpose of being a focus in managing projects. Project management leader needs to effectively align project team members’ goals and commitments to project goals, so that team members are prepared to support project goals as their own personal goals. When a project team has common and shared ideas of what difference they are trying to make with the project, there’s a big chance that it will become successful. Four characteristics that a vision should possess are it must be understood, it must be motivational, it must be credible and it must be both demanding and challenging (Christenson and Walker, 2004). Once developed, the vision needs to be communicated clearly and simply. It requires a communication strategy that effectively explains and brings forth commitment to the delivery of the vision. Some aspects of effective communication strategy that should be explored early in the project are the role and expectation of all stakeholders and their communication requirements, systems for regular communication with stakeholders and documentation of decisions and discussions.
THE CASE STUDY
Lebuhraya Pantai Timur Fasa 2 (LPT2) is an expressway that traverses the east coast of Peninsular Malaysia for a total mainline distance of about 185 km. The expressway is a high quality dual 2-lane carriageway furnished with a full range of facilities to benefit the travelling public with an emphasis on road safety, economical and ease of maintenance. The estimated construction cost of this expressway is about AUD$1.3 billion.
The Government’s main objective in constructing LPT2 is to open up a new socio-economic corridor in the area. Compared to the west coast, this part of the country is quite under developed. Therefore it is the intention of the Government to provide a new socio-economic corridor to the people, with the hope that it will be able to generate a lot of economic activities to the relevant states. Another intention of the Government is to improve the existing highways network by providing another link between the two coasts.
Public Works Department (PWD) is a technical government agency that has been commissioned by the Government to implement this project. Upon appointment by the Government, PWD had immediately assembled a dedicated project team comprising of few senior project managers from various

103
offices within the department and the team is known as Pasukan Projek LPT2. A project office was quickly set up for the team at the department’s headquarters. The main objective of the project team is to manage the design and construction work of the expressway within the specified time, cost and quality. Among the project team members, one of them was appointed as Project Director by the department. The selected engineer is the most senior and experienced project manager in road construction and well known for his technical and managerial ability by the Department’s top management.
After the appointment of the Project Director, the project team had quickly prepared a Project Brief that consists of proposed alignment for LPT2 along with the preliminary scope, cost and schedule of the project. It also contained the project team’s proposal on how to execute the project. It is proposed for the project to be divided into twelve packages for easier management. Four of the packages will be designed in-house with the rest designed by appointed consultants. Procurement for the expressway’s construction will be through open and selected tender. The Project Brief was prepared after the project team had discussed and consulted the Project Sponsor, relevant government agencies and politicians. It was then presented to the project’s Steering Committee for approval.
Once approved, the project team started to identify the project team’s structure and requirements. An
organisation chart for the project team was developed and the team was given the liberty of choosing additional team members from any offices within PWD. This is very advantageous to the team since they have the opportunity to recruit team members based on the individual’s capabilities and commitment.
Because the project will be implemented in stages, requirement for staffs is also in stages. In the beginning, only few additional members were recruited as designers. For efficient utilization of these designers, each designer was assigned to work for more than one package. Some of them were also appointed as assistant project managers. The matrix nature of the team allows this pool of designers to work in a highly flexible way. Monitoring of the project is handled by the project management team which consists of senior and junior engineers. Besides designers and monitors, few non-technical staffs were also recruited to handle the project office’s administration. The last team to be formed was supervision team when the expressway’s construction commences. Figure 1 shows the organisation chart for Pasukan Projek LPT2.
PWD is an MS ISO certified organisation since 1999 and has an established Quality Management System for one of its core businesses which is project management. This system is applicable for the planning, design, procurement, construction and handover process

104
of different type of projects (conventional, design and build, etc.). Some of the plans that have to be prepared for this project in the planning phase are Quality Plan, Design Plan and Construction Plan. Quality Plan contains the overall schedule for project implementation while Design Plan and Construction Plan contains design and construction schedule for each package. These plans detailed out the required activies for the project and were used for monitoring and control of the project progress.
In order to ensure that the project meet its objectives, meetings were conducted frequently with the external and internal stakeholders. Once a month, the Project Director attended a Steering Committe meeting to report the physical and financial progress of the project. Within the project team, formal meetings between Project Director, all Assistant Project Director and all Project Manager are conducted weekly for the purpose of reporting each package’s progress and
to discuss any technical or managerial issues. Each Project Manager also conduct regular meetings with their team members to discuss technical or managerial issues and to monitor the work progress. Informal discussions were also held frequently throughout the implementation of the project.
In this project, every Project Manager is fully responsible in managing their work packages. Because of this, various style of stakeholders management could be observed. For two of the packages where the author was the Assistant Project Manager and designer, communication between the team and various stakeholders are mostly conducted through formal and informal meetings, letters, e-mails and phone calls, as and when necessary. For example, the relevant stakeholders were invited to join some of the arranged site visits and subsequent project meetings. This allows the stakeholders to experience the project and understand some of the issues faced by the project
MONITORING ANDADMINISTRATION
SUPERVISION
DESIGN
ASSISTANTPROJECT DIRECTOR
(ROAD)
ASSISTANTPROJECT DIRECTOR
(PROJECTMANAGEMENT)
ADMINISTRATION
PACKAGE(5, 6 & 7)
PACKAGE(8 & 9)
PROJECTMANAGER
PROJECTMANAGER
PLANNING,CONTROL &REPORTING
LANDACQUISITION& UTILITIES
QA& QC
ARCHITECTURE& LANDSCAPE
RSA& OSH
MECHANICAL& ELECTIRCAL
GEOTECHNICAL
PROCUREMENTEIA& EMP
PROJECTMANAGER
PACKAGE(1 & 2)
PROJECTMANAGER
PACKAGE(3 & 4)
PROJECTMANAGER
PROJECTMANAGER
PROJECTMANAGER
PROJECTMANAGER
PROJECTMANAGER
PACKAGE(11 & 12)
PROJECTMANAGER
ASSISTANTPROJECT DIRECTOR
(STRUCTURE)
ASSISTANTPROJECT DIRECTOR
(SUPPORT SERVICES)
PACKAGE(1 – 7)
PACKAGE(8 – 12)
RISK & VALUEMANAGEMENT
DOCUMENTS PUBLICRELATIONS
FINANCE
DESIGNTEAM
DESIGNTEAM
DESIGNTEAM
DESIGNTEAM
DESIGNTEAM
DESIGNTEAM
DESIGNTEAM
DESIGNTEAM
DESIGNTEAM
DESIGNTEAM
SITESUPERVISOR 2
SITESUPERVISOR 3
SITESUPERVISOR 1
SUPERVISIONTEAM 1
SUPERVISIONTEAM 2
SUPERVISIONTEAM 3
Legend:
Occupied
Vacant
Formal reporting and communication
PROJECTDIRECTOR
Figure 1 : Pasukan Projek LPT2’s Organisation Chart

but also leadership skills that are internally compatible with the project team motivation and externally compatible with client focus strategies. The total work experience of project managers is also significant where junior project managers seem to need clearer project management organizations and job descriptions than senior project managers do.
PWD’s decision to allow the project team to choose their own team members can be considered as another right decision for the project. As widely known, human resource is the most important factor in a project since all activities are essentially carried out by them. It is the quality of the human resources that will determine the project outcomes. Even without going through any team building training, the team members had been able to work cohesively together because they understood their roles and responsibilities in the team and have a ‘team player’ attitude. Each member’s preparation and expectation allows the team members to fill the gaps and make other adjustments in order to achieve the project’s objectives. Good technical knowledge possessed by team members also played a big role in the project. Due to this factor, team members were able to carry out their tasks as required and finished them as scheduled. This is consistent with Hyväri (2006) findings where three critical factors related to project team members that could contribute to project management success are communication, commitment and technical background.
Although this project doesn’t have its own vision, it is felt that the team is mostly inspired by the department’s vision of becoming a prominent project management service provider in the country. All team members are aware of this vision and it drives the team to perform well and meet the project objectives. As a high performance project team, everybody understood that they need to deliver an excellent project management service that the department had envisioned. Constant reminder of the project objectives during the meetings is also an effective measure in ensuring the team performed their work as planned.
Two activities that were not carried out at the planning phase of this project are risk management and stakeholder analysis. In order to improve the planning activity, it is suggested for the team to conduct a
team. Although there was never any formal stakeholder analysis conducted, both packages didn’t encounter any major problems with regards to the stakeholders and both packages were able to finish the design work and produced tender documents as scheduled.
The project is currently in the execution phase where all the packages had been successfully tendered and the expressway is under construction.
ANALYSIS AND DISCUSSION
PWD main business is to manage the implementation of the Government’s infrastructure projects such as road, building and port construction. Therefore, it can be said that the department’s portfolio and governance is very compatible with the objective of this project. It has the appropriate organisation’s structure, policies, objectives, roles, accountabilities and decision making process to implement this project’s successfully. PWD also has the knowledge (technical and project management), resources (human resources and technology) and systems (quality, procurement, etc.) to carry out the project. Its vision of being the best project management service provider in the country is also compatible with the project’s need.
Appointing a Project Director that is very senior and experienced in road construction management and well known for his technical and managerial ability is appropriate for this project. Because the team members respect and trust the Project Director, everybody had worked together with full cooperation under his leadership. The Project Director also seems to respect and trust his Project Managers since they were all fully empowered to manage their respective work packages. Leadership style is principally determined by the maturity of the followers. It’s possible that the Project Director had used this style of leadership because he believed that the Project Managers in the team are experienced enough to manage their work packages on their own.
This observation also match the findings by Hyväri (2006) where managerial is found to be a critical factor for project management success since successful projects are mostly led by individuals who possess not only a blend of technical and management knowledge,
105

106
proper risk management and stakeholder analysis. As identified by Cooke-Davis (2002), risk management practices are the four critical success factors in project management that correlate to on-time performance. The result of risk management and stakeholder analyses could also be used as an additional input to any existing communication plan that the project team had in the initiation stage. An effective and comprehensive communication plan can guide the project team on what, who and when to communicate with everybody that’s involved in the project.
Another activity that could be carried out by the project team is knowledge management. Knowledge is defined by Oxford Dictionary as facts, information and skills acquired through experience or education. In an organisation, knowledge comprised of insights and experiences that is either embodied in individuals or embedded in organisational processes or practices. Intellectual capital of an organisation is represented by its employee’s accumulated knowledge and know-how. By having superior intellectual resources, an organisation can understand how to exploit and develop their traditional resources better than competitors, even if some or all of those traditional resources are not unique. Therefore, knowledge can be considered as the most important strategic resource for building competitive
advantage (Zack 1999). Competitive advantage is a condition in which an organisation is able to operate in a more efficient or high-quality manner than its competitors, which results in benefits accruing to the organisation. Thus, managing its knowledge is one of the means for PWD to secure project management success in the future. Managerial and technical lessons that have been learned by the project team should be documented, analysed and communicated to the whole organisation. Best practices from this project also should be identified and shared. With the accumulated knowledge, it’s possible for the department not to repeat past mistakes and to be innovative and creative in future project management endeavour. Only then, can it be said that the department has truly learn and grow from these experiences and best practices. The department could also take this one step further by formally adopting knowledge management as its new strategy in achieving the department’s vision.
The result of the examination of project management critical success factors in the case study against the project management body of literature is summarised in Table 1:

107
THEORY PRACTICE
Zwikael and Globerson (2006) had identified six (6) critical planning processes with the highest impact to project success:
• Definition of activities to be performed in the project
• Schedule development• Organisational planning• Staff acquisition• Communication planning• Developing a project plan
The Government had set a clear objective for this project, thus allowing PWD to define the required project management activities in a clear manner. Compatibility of the PWD’s governance with the project’s objective also helps in defining the required activities and developing an appropriate project plan.
The project team’s experiences and technical background along with the established Quality Management System of the PWD had allowed the project team to develop a schedule that can meet the objective of the project.
The following department’s decisions can be considered as the ‘organisational planning’ success factor to the project:• Appointing a Project Director that is senior and
experienced in road construction management; • Allowing the project team to choose their own
team members. The freedom to select and pick staff essentially means having members that are committed and able to carry out their tasks as required.
Hyväri (2006) concluded that managerial is a critical factor since successful projects are mostly led by individuals who possess not only a blend of technical and management knowledge, but also leadership skills that are internally compatible with the project team motivation and externally compatible with client focus strategies.
Leadership style is principally determined by the maturity of the followers. The Project Director’s style of fully empowering the Project Managers to manage their respective work packages is probably due to his belief that they are experienced enough to do so. The matrix nature of the team allows staff to work in a highly flexible way.
Hyväri (2006) had identified three critical factors related to project team members that could contribute to project management success, namely communication, commitment and technical background.
Although some factors may have stronger presence than the other, essentially all factors that have been academically identified are present in the project team.
One of the most significant contributions that a leader can make in an organisation or project is that of creating and clearly communicating a shared vision (Christenson and Walker, 2004).
Although this project doesn’t have its own vision, it is felt that the team is mostly inspired by the PWD’s vision of becoming a prominent project management service provider in the country.
Table 1 : Summary of the analysis and discussion
108
* Part of fulfilment for Master in Project Management, RMIT University, Australia.
CONCLUSIONS
Project success is unequal to project management success because the objectives of the project are different than the objectives of project management. At the implementation phase of a project, project management is a CSF to project success and among the project life-cycles, planning is the most critical factor. Two project management CSFs that have been identified in the case study’s planning phase are leadership and project team. Leadership style that’s compatible with the project team’s motivation is important since it will provide the right level of motivation for the team to perform their tasks. A functioning project team is also necessary because essentially all activities in the project are carried out by team members. If team members were not committed and capable enough to perform the activities, the project is at risk of being unsuccessful.
To secure project management success in the future, an organisation could adopt knowledge management as a strategy. Managerial and technical lessons that have been learned in previous projects should be documented, analysed and communicated to the whole organisation. Best practices from all the projects also need to be identified and shared. With the accumulated knowledge, it is possible for an organisation not to repeat past mistakes and to be innovative and creative in future project management endeavour.
REFERENCES
[1] Christenson, D and Walker, D. H. T. (2004), “Understanding the Role of “Vision” in Project Success”, Project Management Journal, 35 (3): 39 – 52
[2] Cooke-Davies, T. (2002), “The ‘Real’ Success Factors On Projects”, International Journal of Project Management, 20, pp. 185 – 190
[3] Hyväri, I. (2006), “Success of Projects in Different Organizational Conditions”, Project Management Journal, 37 (4): 31 – 41
[4] Munns, A. K & Bjeirmi, B. F (1996), “The Role of Project Management in Achieving Project Success”, International Journal of Project Management, 14, pp. 81 – 87
[5] PMI Standards Committee (2008), A Guide to The Project Management Body of Knowledge, Project Management Institute, Newton Square, PA
[6] Shenhar, A. J., Dvir, D., Levy, O. and Maltz, A. C. (2001), “Project Success : A Multidimensional Strategic Concept.”, Long Range Planning, 34 (6): 699 – 725
[7] Zack, M. H. (1999), “Developing a Knowledge Strategy.” California Management Review, 41 (3): 125 – 145
[8] Zwikael, O. and Globerson, S. (2006), “From Critical Success Factors To Critical Success Processes”, International Journal of Production Research, 44 (17): 3433 – 3449
BIBLIOGRAPHIES
[1] Fortune, J. and White, D. (2006), “Framing of Project Critical Success Factors by A Systems Model”, International Journal of Project Management, 24 (1): 53 – 65
[2] Nogeste, K. and Walker, D. H. T. (2005), “Project Outcomes and Outputs – Making The Intangible Tangible”, Measuring Business Excellence, Emerald, UK, 9 (4): 55 – 68
[3] Turner, J. R. and Cochrane, R. A. (1993), “The Goals and Methods Matrix : Coping With Projects With Ill Defined Goals And/Or Methods of Achieving Them”, International Journal of Project Management, 11 (2): 95 – 102