Embed Size (px)
Citation preview
JUNOS® Software
Administration Guidefor J-series Services Routers and SRX-series ServicesGateways
Release 9.2
Juniper Networks, Inc.1194 North Mathilda Avenue
Sunnyvale, California 94089
USA
408-745-2000
www.juniper.net
Part Number: 530-025660-01, Revision 1

This product includes the Envoy SNMP Engine, developed by Epilogue Technology, an Integrated Systems Company. Copyright © 1986-1997, EpilogueTechnology Corporation. All rights reserved. This program and its documentation were developed at private expense, and no part of them is in the publicdomain.
This product includes memory allocation software developed by Mark Moraes, copyright © 1988, 1989, 1993, University of Toronto.
This product includes FreeBSD software developed by the University of California, Berkeley, and its contributors. All of the documentation and softwareincluded in the 4.4BSD and 4.4BSD-Lite Releases is copyrighted by the Regents of the University of California. Copyright © 1979, 1980, 1983, 1986, 1988,1989, 1991, 1992, 1993, 1994. The Regents of the University of California. All rights reserved.
GateD software copyright © 1995, the Regents of the University. All rights reserved. Gate Daemon was originated and developed through release 3.0 byCornell University and its collaborators. Gated is based on Kirton’s EGP, UC Berkeley’s routing daemon (routed), and DCN’s HELLO routing protocol.Development of Gated has been supported in part by the National Science Foundation. Portions of the GateD software copyright © 1988, Regents of theUniversity of California. All rights reserved. Portions of the GateD software copyright © 1991, D. L. S. Associates.
This product includes software developed by Maker Communications, Inc., copyright © 1996, 1997, Maker Communications, Inc.
Juniper Networks, the Juniper Networks logo, NetScreen, and ScreenOS are registered trademarks of Juniper Networks, Inc. in the United States and othercountries. JUNOS and JUNOSe are trademarks of Juniper Networks, Inc. All other trademarks, service marks, registered trademarks, or registered servicemarks are the property of their respective owners.
Juniper Networks assumes no responsibility for any inaccuracies in this document. Juniper Networks reserves the right to change, modify, transfer, orotherwise revise this publication without notice.
Products made or sold by Juniper Networks or components thereof might be covered by one or more of the following patents that are owned by or licensedto Juniper Networks: U.S. Patent Nos. 5,473,599, 5,905,725, 5,909,440, 6,192,051, 6,333,650, 6,359,479, 6,406,312, 6,429,706, 6,459,579, 6,493,347,6,538,518, 6,538,899, 6,552,918, 6,567,902, 6,578,186, and 6,590,785.
JUNOS Software Administration GuideRelease 9.2Copyright © 2008, Juniper Networks, Inc.All rights reserved. Printed in USA.
Revision HistoryAugust 2008—Revision 1
The information in this document is current as of the date listed in the revision history.
YEAR 2000 NOTICE
Juniper Networks hardware and software products are Year 2000 compliant. The JUNOS software has no known time-related limitations through the year2038. However, the NTP application is known to have some difficulty in the year 2036.
SOFTWARE LICENSE
The terms and conditions for using this software are described in the software license contained in the acknowledgment to your purchase order or, to theextent applicable, to any reseller agreement or end-user purchase agreement executed between you and Juniper Networks. By using this software, youindicate that you understand and agree to be bound by those terms and conditions. Generally speaking, the software license restricts the manner in whichyou are permitted to use the software and may contain prohibitions against certain uses. The software license may state conditions under which the licenseis automatically terminated. You should consult the license for further details. For complete product documentation, please see the Juniper Networks Website at www.juniper.net/techpubs.
ii ■

End User License Agreement
READ THIS END USER LICENSE AGREEMENT (“AGREEMENT”) BEFORE DOWNLOADING, INSTALLING, OR USING THE SOFTWARE. BY DOWNLOADING,INSTALLING, OR USING THE SOFTWARE OR OTHERWISE EXPRESSING YOUR AGREEMENT TO THE TERMS CONTAINED HEREIN, YOU (AS CUSTOMEROR IF YOU ARE NOT THE CUSTOMER, AS A REPRESENTATIVE/AGENT AUTHORIZED TO BIND THE CUSTOMER) CONSENT TO BE BOUND BY THISAGREEMENT. IF YOU DO NOT OR CANNOT AGREE TO THE TERMS CONTAINED HEREIN, THEN (A) DO NOT DOWNLOAD, INSTALL, OR USE THE SOFTWARE,AND (B) YOU MAY CONTACT JUNIPER NETWORKS REGARDING LICENSE TERMS.
1. The Parties. The parties to this Agreement are Juniper Networks, Inc. and its subsidiaries (collectively “Juniper”), and the person or organization thatoriginally purchased from Juniper or an authorized Juniper reseller the applicable license(s) for use of the Software (“Customer”) (collectively, the “Parties”).
2. The Software. In this Agreement, “Software” means the program modules and features of the Juniper or Juniper-supplied software, and updates andreleases of such software, for which Customer has paid the applicable license or support fees to Juniper or an authorized Juniper reseller. “EmbeddedSoftware” means Software which Juniper has embedded in the Juniper equipment.
3. License Grant. Subject to payment of the applicable fees and the limitations and restrictions set forth herein, Juniper grants to Customer a non-exclusiveand non-transferable license, without right to sublicense, to use the Software, in executable form only, subject to the following use restrictions:
a. Customer shall use the Embedded Software solely as embedded in, and for execution on, Juniper equipment originally purchased by Customer fromJuniper or an authorized Juniper reseller.
b. Customer shall use the Software on a single hardware chassis having a single processing unit, or as many chassis or processing units for which Customerhas paid the applicable license fees; provided, however, with respect to the Steel-Belted Radius or Odyssey Access Client software only, Customer shall usesuch Software on a single computer containing a single physical random access memory space and containing any number of processors. Use of theSteel-Belted Radius software on multiple computers requires multiple licenses, regardless of whether such computers are physically contained on a singlechassis.
c. Product purchase documents, paper or electronic user documentation, and/or the particular licenses purchased by Customer may specify limits toCustomer’s use of the Software. Such limits may restrict use to a maximum number of seats, registered endpoints, concurrent users, sessions, calls,connections, subscribers, clusters, nodes, realms, devices, links, ports or transactions, or require the purchase of separate licenses to use particular features,functionalities, services, applications, operations, or capabilities, or provide throughput, performance, configuration, bandwidth, interface, processing,temporal, or geographical limits. In addition, such limits may restrict the use of the Software to managing certain kinds of networks or require the Softwareto be used only in conjunction with other specific Software. Customer’s use of the Software shall be subject to all such limitations and purchase of all applicablelicenses.
d. For any trial copy of the Software, Customer’s right to use the Software expires 30 days after download, installation or use of the Software. Customermay operate the Software after the 30-day trial period only if Customer pays for a license to do so. Customer may not extend or create an additional trialperiod by re-installing the Software after the 30-day trial period.
e. The Global Enterprise Edition of the Steel-Belted Radius software may be used by Customer only to manage access to Customer’s enterprise network.Specifically, service provider customers are expressly prohibited from using the Global Enterprise Edition of the Steel-Belted Radius software to support anycommercial network access services.
The foregoing license is not transferable or assignable by Customer. No license is granted herein to any user who did not originally purchase the applicablelicense(s) for the Software from Juniper or an authorized Juniper reseller.
4. Use Prohibitions. Notwithstanding the foregoing, the license provided herein does not permit the Customer to, and Customer agrees not to and shallnot: (a) modify, unbundle, reverse engineer, or create derivative works based on the Software; (b) make unauthorized copies of the Software (except asnecessary for backup purposes); (c) rent, sell, transfer, or grant any rights in and to any copy of the Software, in any form, to any third party; (d) removeany proprietary notices, labels, or marks on or in any copy of the Software or any product in which the Software is embedded; (e) distribute any copy ofthe Software to any third party, including as may be embedded in Juniper equipment sold in the secondhand market; (f) use any ‘locked’ or key-restrictedfeature, function, service, application, operation, or capability without first purchasing the applicable license(s) and obtaining a valid key from Juniper, evenif such feature, function, service, application, operation, or capability is enabled without a key; (g) distribute any key for the Software provided by Juniperto any third party; (h) use the Software in any manner that extends or is broader than the uses purchased by Customer from Juniper or an authorized Juniperreseller; (i) use the Embedded Software on non-Juniper equipment; (j) use the Software (or make it available for use) on Juniper equipment that the Customerdid not originally purchase from Juniper or an authorized Juniper reseller; (k) disclose the results of testing or benchmarking of the Software to any thirdparty without the prior written consent of Juniper; or (l) use the Software in any manner other than as expressly provided herein.
5. Audit. Customer shall maintain accurate records as necessary to verify compliance with this Agreement. Upon request by Juniper, Customer shall furnishsuch records to Juniper and certify its compliance with this Agreement.
6. Confidentiality. The Parties agree that aspects of the Software and associated documentation are the confidential property of Juniper. As such, Customershall exercise all reasonable commercial efforts to maintain the Software and associated documentation in confidence, which at a minimum includesrestricting access to the Software to Customer employees and contractors having a need to use the Software for Customer’s internal business purposes.
■ iii
7. Ownership. Juniper and Juniper's licensors, respectively, retain ownership of all right, title, and interest (including copyright) in and to the Software,associated documentation, and all copies of the Software. Nothing in this Agreement constitutes a transfer or conveyance of any right, title, or interest inthe Software or associated documentation, or a sale of the Software, associated documentation, or copies of the Software.
8. Warranty, Limitation of Liability, Disclaimer of Warranty. The warranty applicable to the Software shall be as set forth in the warranty statement thataccompanies the Software (the “Warranty Statement”). Nothing in this Agreement shall give rise to any obligation to support the Software. Support servicesmay be purchased separately. Any such support shall be governed by a separate, written support services agreement. TO THE MAXIMUM EXTENT PERMITTEDBY LAW, JUNIPER SHALL NOT BE LIABLE FOR ANY LOST PROFITS, LOSS OF DATA, OR COSTS OR PROCUREMENT OF SUBSTITUTE GOODS OR SERVICES,OR FOR ANY SPECIAL, INDIRECT, OR CONSEQUENTIAL DAMAGES ARISING OUT OF THIS AGREEMENT, THE SOFTWARE, OR ANY JUNIPER ORJUNIPER-SUPPLIED SOFTWARE. IN NO EVENT SHALL JUNIPER BE LIABLE FOR DAMAGES ARISING FROM UNAUTHORIZED OR IMPROPER USE OF ANYJUNIPER OR JUNIPER-SUPPLIED SOFTWARE. EXCEPT AS EXPRESSLY PROVIDED IN THE WARRANTY STATEMENT TO THE EXTENT PERMITTED BY LAW,JUNIPER DISCLAIMS ANY AND ALL WARRANTIES IN AND TO THE SOFTWARE (WHETHER EXPRESS, IMPLIED, STATUTORY, OR OTHERWISE), INCLUDINGANY IMPLIED WARRANTY OF MERCHANTABILITY, FITNESS FOR A PARTICULAR PURPOSE, OR NONINFRINGEMENT. IN NO EVENT DOES JUNIPERWARRANT THAT THE SOFTWARE, OR ANY EQUIPMENT OR NETWORK RUNNING THE SOFTWARE, WILL OPERATE WITHOUT ERROR OR INTERRUPTION,OR WILL BE FREE OF VULNERABILITY TO INTRUSION OR ATTACK. In no event shall Juniper’s or its suppliers’ or licensors’ liability to Customer, whetherin contract, tort (including negligence), breach of warranty, or otherwise, exceed the price paid by Customer for the Software that gave rise to the claim, orif the Software is embedded in another Juniper product, the price paid by Customer for such other product. Customer acknowledges and agrees that Juniperhas set its prices and entered into this Agreement in reliance upon the disclaimers of warranty and the limitations of liability set forth herein, that the samereflect an allocation of risk between the Parties (including the risk that a contract remedy may fail of its essential purpose and cause consequential loss),and that the same form an essential basis of the bargain between the Parties.
9. Termination. Any breach of this Agreement or failure by Customer to pay any applicable fees due shall result in automatic termination of the licensegranted herein. Upon such termination, Customer shall destroy or return to Juniper all copies of the Software and related documentation in Customer’spossession or control.
10. Taxes. All license fees for the Software are exclusive of taxes, withholdings, duties, or levies (collectively “Taxes”). Customer shall be responsible forpaying Taxes arising from the purchase of the license, or importation or use of the Software.
11. Export. Customer agrees to comply with all applicable export laws and restrictions and regulations of any United States and any applicable foreignagency or authority, and not to export or re-export the Software or any direct product thereof in violation of any such restrictions, laws or regulations, orwithout all necessary approvals. Customer shall be liable for any such violations. The version of the Software supplied to Customer may contain encryptionor other capabilities restricting Customer’s ability to export the Software without an export license.
12. Commercial Computer Software. The Software is “commercial computer software” and is provided with restricted rights. Use, duplication, or disclosureby the United States government is subject to restrictions set forth in this Agreement and as provided in DFARS 227.7201 through 227.7202-4, FAR 12.212,FAR 27.405(b)(2), FAR 52.227-19, or FAR 52.227-14(ALT III) as applicable.
13. Interface Information. To the extent required by applicable law, and at Customer's written request, Juniper shall provide Customer with the interfaceinformation needed to achieve interoperability between the Software and another independently created program, on payment of applicable fee, if any.Customer shall observe strict obligations of confidentiality with respect to such information and shall use such information in compliance with any applicableterms and conditions upon which Juniper makes such information available.
14. Third Party Software. Any licensor of Juniper whose software is embedded in the Software and any supplier of Juniper whose products or technologyare embedded in (or services are accessed by) the Software shall be a third party beneficiary with respect to this Agreement, and such licensor or vendorshall have the right to enforce this Agreement in its own name as if it were Juniper. In addition, certain third party software may be provided with theSoftware and is subject to the accompanying license(s), if any, of its respective owner(s). To the extent portions of the Software are distributed under andsubject to open source licenses obligating Juniper to make the source code for such portions publicly available (such as the GNU General Public License(“GPL”) or the GNU Library General Public License (“LGPL”)), Juniper will make such source code portions (including Juniper modifications, as appropriate)available upon request for a period of up to three years from the date of distribution. Such request can be made in writing to Juniper Networks, Inc., 1194N. Mathilda Ave., Sunnyvale, CA 94089, ATTN: General Counsel. You may obtain a copy of the GPL at http://www.gnu.org/licenses/gpl.html, and a copy ofthe LGPL at http://www.gnu.org/licenses/lgpl.html.
15. Miscellaneous. This Agreement shall be governed by the laws of the State of California without reference to its conflicts of laws principles. The provisionsof the U.N. Convention for the International Sale of Goods shall not apply to this Agreement. For any disputes arising under this Agreement, the Partieshereby consent to the personal and exclusive jurisdiction of, and venue in, the state and federal courts within Santa Clara County, California. This Agreementconstitutes the entire and sole agreement between Juniper and the Customer with respect to the Software, and supersedes all prior and contemporaneousagreements relating to the Software, whether oral or written (including any inconsistent terms contained in a purchase order), except that the terms of aseparate written agreement executed by an authorized Juniper representative and Customer shall govern to the extent such terms are inconsistent or conflictwith terms contained herein. No modification to this Agreement nor any waiver of any rights hereunder shall be effective unless expressly assented to inwriting by the party to be charged. If any portion of this Agreement is held invalid, the Parties agree that such invalidity shall not affect the validity of theremainder of this Agreement. This Agreement and associated documentation has been written in the English language, and the Parties agree that the Englishversion will govern. (For Canada: Les parties aux présentés confirment leur volonté que cette convention de même que tous les documents y compris toutavis qui s'y rattaché, soient redigés en langue anglaise. (Translation: The parties confirm that this Agreement and all related documentation is and will bein the English language)).
iv ■
Abbreviated Table of Contents
About This Guide xix
Part 1 Support Overview for Administration FeaturesChapter 1 Support for Administration Features on Different Device Types 3
Part 2 Configuring the Device for AdministrationChapter 2 User Interface Overview 11Chapter 3 Configuring Secure Web Access 29Chapter 4 Managing Administrator Authentication 37Chapter 5 Setting Up USB Modems for Remote Management 63Chapter 6 Configuring SNMP for Network Management 83Chapter 7 Configuring the Device for DHCP 99Chapter 8 Configuring the Device as a DNS Proxy 125Chapter 9 Configuring Autoinstallation 141
Chapter 10 Automating Network Operations and Troubleshooting 149
Part 3 Monitoring the DeviceChapter 11 Monitoring the Device and Routing Operations 161Chapter 12 Monitoring Events and Managing System Log Files 259Chapter 13 Configuring and Monitoring Alarms 273
Part 4 Managing Device SoftwareChapter 14 Performing Software Upgrades and Reboots 287Chapter 15 Understanding and Changing Secure and Router Contexts 309Chapter 16 Installing and Managing Licenses 323Chapter 17 Managing Files 329
Part 5 Diagnosing Performance and Network ProblemsChapter 18 Using Diagnostic Tools 343Chapter 19 Configuring Packet Capture 389Chapter 20 Configuring RPM Probes 403
Abbreviated Table of Contents ■ v

Part 6 IndexIndex 429
vi ■
JUNOS Software Administration Guide
Table of Contents
About This Guide xix
Objectives .....................................................................................................xixAudience ......................................................................................................xixSupported Routing Platforms .........................................................................xxHow to Use This Manual ................................................................................xxDocument Conventions ...............................................................................xxiiJUNOS Software Documentation for J-series Services Routers and SRX-series
Services Gateways ................................................................................xxivDocumentation Feedback ............................................................................xxvRequesting Technical Support .....................................................................xxvi
Part 1 Support Overview for Administration Features
Chapter 1 Support for Administration Features on Different Device Types 3
Part 2 Configuring the Device for Administration
Chapter 2 User Interface Overview 11
User Interface Support On Different Device Types ........................................11User Interface Overview ................................................................................12
J-Web Overview ......................................................................................12CLI Overview ..........................................................................................13
Before You Begin ...........................................................................................13Using the J-Web Interface ..............................................................................13
Starting the J-Web Interface ....................................................................14J-Web Layout ..........................................................................................14Elements of the J-Web Interface ..............................................................15
Top Pane Elements ..........................................................................15Main Pane Elements .........................................................................16Side Pane Elements ..........................................................................17
Table of Contents ■ vii
Navigating the J-Web Interface ................................................................17Navigating the Quick Configuration Pages ........................................18Navigating the J-Web Configuration Editor .......................................18Getting J-Web Help ...........................................................................19
J-Web Sessions ........................................................................................20Using the Command-Line Interface ...............................................................20
CLI Command Hierarchy ........................................................................20Starting the CLI .......................................................................................21CLI Operational Mode .............................................................................22CLI Configuration Mode ..........................................................................22CLI Basics ...............................................................................................23
Editing Keystrokes ............................................................................23Command Completion .....................................................................24Online Help ......................................................................................25Configuring the CLI Environment .....................................................26
Chapter 3 Configuring Secure Web Access 29
Secure Web Access Support On Different Device Types ................................29Secure Web Access Terms .............................................................................30Secure Web Access Overview ........................................................................30Before You Begin ...........................................................................................31
Generating SSL Certificates .....................................................................31Configuring Secure Web Access ....................................................................31Configuring Secure Web Access with a Configuration Editor .........................34Verifying Secure Web Access ........................................................................35
Displaying an SSL Certificate Configuration ............................................35Displaying a Secure Access Configuration ...............................................36
Chapter 4 Managing Administrator Authentication 37
Administrator Authentication Support On Different Device Types .................37User Authentication Terms ............................................................................38User Authentication Overview .......................................................................38
User Authentication ................................................................................38User Accounts .........................................................................................39Login Classes ..........................................................................................39
Permission Bits .................................................................................40Denying or Allowing Individual Commands .....................................42
Template Accounts .................................................................................42Before You Begin ...........................................................................................42Managing User Authentication with Quick Configuration ..............................42
Adding a RADIUS Server for Authentication ............................................43Adding a TACACS+ Server for Authentication ........................................44Configuring System Authentication .........................................................45Adding New Users ..................................................................................47
Managing User Authentication with a Configuration Editor ...........................48Setting Up RADIUS Authentication ..........................................................49Setting Up TACACS+ Authentication ......................................................50Configuring Authentication Order ...........................................................51
viii ■ Table of Contents
JUNOS Software Administration Guide
Controlling User Access ..........................................................................52Defining Login Classes ......................................................................52Creating User Accounts ....................................................................54
Setting Up Template Accounts ................................................................55Creating a Remote Template Account ..............................................55Creating a Local Template Account ..................................................56
Securing the Console Port .............................................................................57Accessing Remote Devices with the CLI ........................................................58
Using the telnet Command .....................................................................58Using the ssh Command .........................................................................59
Configuring Password Retry Limits for Telnet and SSH Access ......................60
Chapter 5 Setting Up USB Modems for Remote Management 63
USB Modem Remote Management Support On Different Device Types ........63USB Modem Terms .......................................................................................64USB Modem Overview ..................................................................................64
USB Modem Interfaces ...........................................................................64How the Device Initializes USB Modems .................................................65USB Modem Connection and Configuration Overview ............................66
Before You Begin ...........................................................................................67Connecting the USB Modem to the USB Port .................................................67Configuring USB Modem Interfaces with a Configuration Editor ....................68
Configuring a USB Modem Interface (Required) ......................................68Configuring a Dialer Interface (Required) ................................................69Configuring Dial-In (Required) ................................................................71Configuring CHAP on Dialer Interfaces (Optional) ...................................72
Connecting to the Device from the User End .................................................74Configuring a Dial-Up Modem Connection at the User End .....................74Connecting to the Device from the User End ..........................................75
Administering USB Modems ..........................................................................75Modifying USB Modem Initialization Commands ....................................76Resetting USB Modems ...........................................................................77
Verifying the USB Modem Configuration .......................................................77Verifying a USB Modem Interface ...........................................................78Verifying Dialer Interface Configuration ..................................................79
Chapter 6 Configuring SNMP for Network Management 83
SNMP Network Management Support On Different Device Types .................83SNMP Architecture ........................................................................................84
Management Information Base ...............................................................84SNMP Communities ................................................................................85SNMP Traps ............................................................................................85Spoofing SNMP Traps .............................................................................85SNMP Health Monitor .............................................................................86
Before You Begin ...........................................................................................86Configuring SNMP with Quick Configuration .................................................87
Table of Contents ■ ix
Table of Contents
Configuring SNMP with a Configuration Editor ..............................................91Defining System Identification Information (Required) ...........................91Configuring SNMP Agents and Communities (Required) .........................92Managing SNMP Trap Groups (Required) ................................................93Controlling Access to MIBs (Optional) .....................................................94
Verifying the SNMP Configuration .................................................................95Verifying SNMP Agent Configuration ......................................................95Verifying SNMP Health Monitor Configuration ........................................96
Chapter 7 Configuring the Device for DHCP 99
DHCP Support On Different Device Types .....................................................99DHCP Terms ...............................................................................................100DHCP Overview ..........................................................................................101
DHCP Server Operation ........................................................................101DHCP Options ................................................................................101Compatibility with Autoinstallation .................................................102
DHCP Client Operation .........................................................................102Propagation of TCP/IP Settings ..............................................................102DHCP Relay Operation .........................................................................102Conflict Detection and Resolution .........................................................102Interface Restrictions ............................................................................103
Before You Begin .........................................................................................103Configuring DHCP with Quick Configuration ...............................................103
Configuring DHCP Service with Quick Configuration ............................103Configuring the Device as a DHCP Client with Quick Configuration ......109Configuring BOOTP or DHCP Relay with Quick Configuration ..............111
Configuring DHCP with a Configuration Editor ............................................114Configuring the Device as a DHCP Server .............................................114Configuring the Device as a DHCP Client ..............................................117
Configuring the Device as a DHCP Relay Agent ..............................118Configuring the Device as a BootP/DHCP Relay Agent ..........................118
Verifying a DHCP Configuration ..................................................................120Displaying Global DHCP Information ....................................................120Verifying the DHCP Binding Database ..................................................121Verifying the DHCP Client .....................................................................122Verifying DHCP Server Operation .........................................................123Displaying DHCP Relay Statistics ..........................................................124
Chapter 8 Configuring the Device as a DNS Proxy 125
DNS Proxy Support On Different Device Types ...........................................126DNS Proxy Overview ...................................................................................126
DNS Proxy with Split DNS .....................................................................126DNS Proxy Cache ..................................................................................128Dynamic Domain Name System Client .................................................128
Configuring DNS Proxy with Quick Configuration .......................................130Configuring the DNS Proxy Service with Quick Configuration ...............130Configuring Dynamic DNS with Quick Configuration ............................133
x ■ Table of Contents
JUNOS Software Administration Guide
Configuring the Device as a DNS Proxy with the CLI ...................................135Configuring DNS Proxy Servers ............................................................135Configuring the DNS Static Cache .........................................................136Sample DNS Proxy Configuration .........................................................136
Verifying the DNS Server Configuration .......................................................137Verifying the DNS Proxy Configuration .................................................137Verifying DNS Proxy Cache ...................................................................138Verifying the Dynamic DNS Client ........................................................138Verifying Dynamic DNS Client Details ..................................................139
Chapter 9 Configuring Autoinstallation 141
Autoinstallation Support On Different Device Types ....................................141Autoinstallation Terms ................................................................................141Autoinstallation Overview ...........................................................................142
Supported Autoinstallation Interfaces and Protocols .............................143Typical Autoinstallation Process on a New Device ................................143
Before You Begin .........................................................................................144Configuring Autoinstallation with a Configuration Editor .............................145Verifying Autoinstallation ............................................................................146
Verifying Autoinstallation Status ...........................................................146
Chapter 10 Automating Network Operations and Troubleshooting 149
Network Operations and Troubleshooting Automation Support On DifferentDevice Types ........................................................................................149
Defining and Enforcing Configuration Rules with Commit Scripts ...............150Commit Script Overview .......................................................................150Enabling Commit Scripts ......................................................................151Disabling Commit Scripts ......................................................................151
Automating Network Management and Troubleshooting with OperationScripts ...................................................................................................152Operation Script Overview ....................................................................152Enabling Operation Scripts ...................................................................153Executing Operation Scripts ..................................................................154Disabling Operation Scripts ..................................................................154
Running Self-Diagnostics with Event Policies ...............................................155Event Policy Overview ..........................................................................155Configuring Event Policies ....................................................................156
Table of Contents ■ xi
Table of Contents

Part 3 Monitoring the Device
Chapter 11 Monitoring the Device and Routing Operations 161
Monitoring Terms ........................................................................................161Monitoring Overview ...................................................................................162
Monitoring Tools Overview ...................................................................162Filtering Command Output ...................................................................169
Before You Begin .........................................................................................169Using the Monitoring Tools ..........................................................................170
Monitoring System Properties ...............................................................170Monitoring the Chassis ..........................................................................177Monitoring the Interfaces ......................................................................180Monitoring Routing Information ...........................................................182
Monitoring Route Information ........................................................182Monitoring BGP Routing Information .............................................183Monitoring OSPF Routing Information ...........................................185Monitoring RIP Routing Information ..............................................186Monitoring DLSw Routing Information ...........................................187
Monitoring Class-of-Service Performance ..............................................188Monitoring CoS Interfaces ..............................................................188Monitoring CoS Classifiers ..............................................................189Monitoring CoS Value Aliases .........................................................190Monitoring CoS RED Drop Profiles .................................................190Monitoring CoS Forwarding Classes ...............................................191Monitoring CoS Rewrite Rules ........................................................192Monitoring CoS Scheduler Maps .....................................................193
Monitoring MPLS Traffic Engineering Information ................................194Monitoring MPLS Interfaces ............................................................195Monitoring MPLS LSP Information ..................................................195Monitoring MPLS LSP Statistics ......................................................196Monitoring RSVP Session Information ............................................197Monitoring MPLS RSVP Interfaces Information ...............................198
Monitoring RPM Probes ........................................................................199Monitoring PPP .....................................................................................203Monitoring PPPoE .................................................................................203Monitoring ALGs ...................................................................................206
Monitoring SIP ALG Information .....................................................206Monitoring H.323 ALG Information ................................................211Monitoring MGCP ALG Information ................................................212Monitoring SCCP ALG Information .................................................215
Monitoring Security Policies ..................................................................217Monitoring VPNs ...................................................................................220
Monitoring IKE Gateway Information .............................................221Monitoring IPsec VPN Information .................................................224
Monitoring Firewall Authentication .......................................................229Monitoring Firewall Authentication Table .......................................229Monitoring Firewall Authentication History ....................................230
Monitoring the WAN Acceleration Interface ..........................................232
xii ■ Table of Contents
JUNOS Software Administration Guide
Monitoring Firewall/NAT .......................................................................233Monitoring Incoming Table Information .........................................233Monitoring Interface NAT Information ...........................................234Monitoring Source NAT Information ...............................................234Monitoring Static NAT Information .................................................235Monitoring Screen Counters ...........................................................236Monitoring Flow Session Statistics ..................................................238Monitoring Flow Gate Information .................................................247
Monitoring DNS ....................................................................................248Monitoring Dynamic DNS ...............................................................248Monitoring DNS Proxy ....................................................................249
Monitoring DHCP ..................................................................................250Monitoring DHCP Service Statistics ................................................250Monitoring DHCP Client Bindings ...................................................251Monitoring DHCP Conflicts .............................................................252Monitoring DHCP Clients ................................................................252Monitoring DHCP Relay Statistics ...................................................253
Monitoring Enhanced Switching ...........................................................254Monitoring Spanning Tree ..............................................................254Monitoring GVRP ............................................................................255Monitoring Dot1X ...........................................................................256
Monitoring IDP .....................................................................................256
Chapter 12 Monitoring Events and Managing System Log Files 259
System Log File Support on Different Device Types ....................................259System Log Message Terms .........................................................................260System Log Messages Overview ..................................................................262
System Log Message Destinations .........................................................262System Log Facilities and Severity Levels ..............................................262Control and Data Plane Logs .................................................................263Regular Expressions ..............................................................................264
Before You Begin .........................................................................................265Configuring System Log Messages with a Configuration Editor ....................265
Sending System Log Messages to a File ................................................266Sending System Log Messages to a User Terminal ................................266Archiving System Logs ..........................................................................267Disabling System Logs ..........................................................................267
Monitoring System Log Messages with the J-Web Event Viewer ..................268Filtering System Log Messages ..............................................................268Viewing System Log Messages ..............................................................270
Chapter 13 Configuring and Monitoring Alarms 273
Alarms Support On Different Device Types .................................................273Alarm Terms ...............................................................................................274
Table of Contents ■ xiii
Table of Contents
Alarm Overview ..........................................................................................274Alarm Types .........................................................................................275Alarm Severity ......................................................................................275Alarm Conditions ..................................................................................275
Interface Alarm Conditions .............................................................275System Alarm Conditions and Corrective Actions ...........................278
Before You Begin .........................................................................................279Configuring Alarms with a Configuration Editor ..........................................279Checking Active Alarms ...............................................................................281Verifying the Alarms Configuration .............................................................282
Displaying Alarm Configurations ...........................................................282
Part 4 Managing Device Software
Chapter 14 Performing Software Upgrades and Reboots 287
Upgrade and Reboot Support On Different Device Types ............................288Upgrade and Downgrade Overview .............................................................288
Upgrade Software Packages ..................................................................288Recovery Software Packages .................................................................289
Before You Begin .........................................................................................289Downloading Software Upgrades from Juniper Networks ............................290Installing Software Upgrades .......................................................................290
Installing Software Upgrades with the J-Web Interface ..........................291Installing Software Upgrades from a Remote Server .......................291Installing Software Upgrades by Uploading Files ............................293
Installing Software Upgrades Using the CLI ...........................................294Downgrading the Software ..........................................................................295
Downgrading the Software with the J-Web Interface .............................296Downgrading the Software with the CLI ................................................296
Configuring Boot Devices ............................................................................297Configuring a Boot Device for Backup with the J-Web Interface ............298Configuring a Boot Device for Backup with the CLI ...............................300Configuring a Boot Device to Receive Software Failure Memory
Snapshots .......................................................................................302Rebooting or Halting the Device ..................................................................303
Rebooting or Halting the Device with the J-Web Interface .....................303Rebooting the Device with the CLI ........................................................305Halting the Device with the CLI .............................................................306
Bringing Chassis Components Online and Offline .......................................307Chassis Control Restart Options ..................................................................308
Chapter 15 Understanding and Changing Secure and Router Contexts 309
Secure and Router Context Support On Different Device Types ..................309Understanding Secure and Router Contexts ................................................310
Secure Context .....................................................................................310Router Context .....................................................................................310
xiv ■ Table of Contents
JUNOS Software Administration Guide
Secure Context Configuration Settings .........................................................311Router Context Configuration Settings .........................................................314Changing from Secure Context to Router Context .......................................315
Secure-to-Router Context Task Overview ..............................................316Changing to Router Context ..................................................................317
Changing from Router Context to Secure Context .......................................319Router-to-Secure Context Task Overview ..............................................319
Chapter 16 Installing and Managing Licenses 323
Licensed Features on Different Device Types ..............................................323JUNOS Software with Enhanced Services License Overview ........................324
License Enforcement ............................................................................324Software Feature Licenses ....................................................................324License Key Components ......................................................................325
Before You Begin .........................................................................................325Managing JUNOS Software with Enhanced Services Licenses with the
CLI ........................................................................................................325Adding New Licenses with the CLI ........................................................325Deleting a License with the CLI .............................................................326Saving License Keys with the CLI ..........................................................326
Verifying JUNOS Software with Enhanced Services License Management ....326Displaying Installed Licenses ................................................................326Displaying License Usage ......................................................................327Displaying Installed License Keys .........................................................328
Chapter 17 Managing Files 329
File Management Support On Different Device Types .................................329Before You Begin .........................................................................................330Managing Files with the J-Web Interface ......................................................330
Cleaning Up Files ..................................................................................330Downloading Files ................................................................................332Deleting Files ........................................................................................333Deleting the Backup Software Image ....................................................334
Cleaning Up Files with the CLI .....................................................................334Managing Accounting Files ..........................................................................335Encrypting and Decrypting Configuration Files ...........................................336
Encrypting Configuration Files ..............................................................337Decrypting Configuration Files ..............................................................338Modifying the Encryption Key ..............................................................338
Table of Contents ■ xv
Table of Contents
Part 5 Diagnosing Performance and Network Problems
Chapter 18 Using Diagnostic Tools 343
Diagnostic Tools Support On Different Device Types ..................................343Diagnostic Terms ........................................................................................344Diagnostic Tools Overview ..........................................................................344
J-Web Diagnostic Tools Overview .........................................................345CLI Diagnostic Commands Overview ....................................................346MPLS Connection Checking ..................................................................347
Before You Begin .........................................................................................349General Preparation ..............................................................................349Ping MPLS Preparation .........................................................................349
MPLS Enabled ................................................................................349Loopback Address ..........................................................................350Source Address for Probes ..............................................................350
Pinging Hosts from the J-Web Interface .......................................................350Using the J-Web Ping Host Tool ............................................................350Ping Host Results and Output Summary ...............................................353
Checking MPLS Connections from the J-Web Interface ................................354Using the J-Web Ping MPLS Tool ...........................................................355Ping MPLS Results and Output ..............................................................358
Tracing Unicast Routes from the J-Web Interface ........................................359Using the J-Web Traceroute Tool ...........................................................359Traceroute Results and Output Summary .............................................361
Capturing and Viewing Packets with the J-Web Interface ............................362Using J-Web Packet Capture ..................................................................362Packet Capture Results and Output Summary .......................................366
Using CLI Diagnostic Commands ................................................................367Pinging Hosts from the CLI ...................................................................367Checking MPLS Connections from the CLI ............................................369
Pinging RSVP-Signaled LSPs and LDP-Signaled LSPs ......................370Pinging Layer 3 VPNs .....................................................................371Pinging Layer 2 VPNs .....................................................................372Pinging Layer 2 Circuits ..................................................................373
Tracing Unicast Routes from the CLI .....................................................374Using the traceroute Command ......................................................374Using the traceroute monitor Command ........................................375
Tracing Multicast Routes from the CLI ..................................................377Using the mtrace from-source Command .......................................378Using the mtrace monitor Command .............................................380
Displaying Log and Trace Files from the CLI .........................................381Monitoring Interfaces and Traffic from the CLI .....................................381
Using the monitor interface Command ..........................................381Using the monitor traffic Command ...............................................383
xvi ■ Table of Contents
JUNOS Software Administration Guide
Chapter 19 Configuring Packet Capture 389
Packet Capture Support On Different Device Types .....................................389Packet Capture Terms .................................................................................390Packet Capture Overview ............................................................................391
Packet Capture on Device Interfaces .....................................................391Firewall Filters for Packet Capture ........................................................392Packet Capture Files .............................................................................392Analysis of Packet Capture Files ............................................................393
Before You Begin .........................................................................................393Configuring Packet Capture with a Configuration Editor ..............................393
Enabling Packet Capture (Required) ......................................................393Configuring Packet Capture on an Interface (Required) .........................395Configuring a Firewall Filter for Packet Capture (Optional) ...................395Disabling Packet Capture ......................................................................397Deleting Packet Capture Files ................................................................397
Changing Encapsulation on Interfaces with Packet Capture Configured ......398Verifying Packet Capture .............................................................................399
Displaying a Packet Capture Configuration ...........................................399Displaying a Firewall Filter for Packet Capture Configuration ................400Verifying Captured Packets ...................................................................400
Chapter 20 Configuring RPM Probes 403
RPM Probe Support On Different Device Types ...........................................403RPM Terms .................................................................................................403RPM Overview ............................................................................................404
RPM Probes ..........................................................................................404RPM Tests .............................................................................................405Probe and Test Intervals .......................................................................405Jitter Measurement with Hardware Timestamping ................................405RPM Statistics .......................................................................................406RPM Thresholds and Traps ...................................................................407RPM for BGP Monitoring .......................................................................407
Before You Begin .........................................................................................408Configuring RPM with Quick Configuration .................................................408Configuring RPM with a Configuration Editor ..............................................414
Configuring Basic RPM Probes ..............................................................414Configuring TCP and UDP Probes .........................................................417Tuning RPM Probes ..............................................................................419Configuring RPM Probes to Monitor BGP Neighbors .............................420
Configuring RPM Probes for BGP Monitoring ..................................421Directing RPM Probes to Select BGP Routers ..................................422
Verifying an RPM Configuration ..................................................................423Verifying RPM Services .........................................................................423Verifying RPM Statistics ........................................................................424Verifying RPM Probe Servers ................................................................425
Table of Contents ■ xvii
Table of Contents

Part 6 Index
Index ...........................................................................................................429
xviii ■ Table of Contents
JUNOS Software Administration Guide
About This Guide
This preface provides the following guidelines for using the JUNOS SoftwareAdministration Guide:
■ Objectives on page xix
■ Audience on page xix
■ Supported Routing Platforms on page xx
■ How to Use This Manual on page xx
■ Document Conventions on page xxii
■ JUNOS Software Documentation for J-series Services Routers and SRX-seriesServices Gateways on page xxiv
■ Documentation Feedback on page xxv
■ Requesting Technical Support on page xxvi
Objectives
This guide contains instructions for managing users and operations, monitoringnetwork performance, upgrading software, and diagnosing common problems onJ-series Services Routers running JUNOS software with enhanced services andSRX-series services gateways running JUNOS software.
NOTE: This manual documents Release 9.2 of JUNOS software. For additionalinformation—either corrections to or information that might have been omitted fromthis manual—see the JUNOS Software with Enhanced Services Release Notes or JUNOSSoftware for SRX-series Services Gateways Release Notes at http://www.juniper.net.
Audience
This manual is designed for anyone who installs, sets up, configures, monitors, oradministers a J-series Services Router running JUNOS software with enhanced servicesor an SRX-series services gateway running JUNOS software. The manual is intendedfor the following audiences:
■ Customers with technical knowledge of and experience with networks andnetwork security, the Internet, and Internet routing protocols
■ Network administrators who install, configure, and manage Internet routers
Objectives ■ xix
Personnel operating the equipment must be trained and competent; must not conductthemselves in a careless, willfully negligent, or hostile manner; and must abide bythe instructions provided by the documentation.
Supported Routing Platforms
This manual describes features supported on J-series Services Routers running JUNOSsoftware with enhanced services and SRX-series services gateways running JUNOSsoftware.
How to Use This Manual
This manual and the other manuals in this set explain how to install, configure, andmanage:
■ JUNOS software with enhanced services for J-series Services Routers
■ JUNOS software for SRX-series services gateways
Table 1 on page xx identifies the tasks required to configure and manage thesedevices and shows where to find task information and instructions.
For an annotated list of the documentation referred to in Table 1 on page xx, see“JUNOS Software Documentation for J-series Services Routers and SRX-series ServicesGateways” on page xxiv. All documents are available at http://www.juniper.net/techpubs/.
Table 1: Tasks and Related Documentation
Related DocumentationTask
Basic Device Installation and Setup
J-series Services Routers:
■ JUNOS Software with Enhanced Services Quick Start
■ JUNOS Software with Enhanced Services Hardware Guide
■ JUNOS Software with Enhanced Services Release Notes
SRX-series services gateways:
■ SRX 5600 Services Gateway Getting Started Guide
■ SRX 5800 Services Gateway Getting Started Guide
■ Reviewing safety warnings and compliance statements
■ Installing hardware and establishing basic connectivity
■ Initially setting up a device
Migration from ScreenOS or JUNOS Software to JUNOS Software with Enhanced Services (if necessary)
JUNOS Software with Enhanced Services Migration Guide (J-seriesServices Routers only)
■ Migrating from JUNOS Release 8.3 or later to JUNOSsoftware with enhanced services
■ Migrating from ScreenOS Release 5.4 or later JUNOSsoftware with enhanced services
Context—Changing to Secure Context or Router Context
JUNOS Software Administration GuideChanging the device from one context to another andunderstanding the factory default settings
xx ■ Supported Routing Platforms
JUNOS Software Administration Guide
Table 1: Tasks and Related Documentation (continued)
Related DocumentationTask
Interface Configuration
■ JUNOS Software Interfaces and Routing Configuration Guide
■ JUNOS Software CLI Reference
Configuring device interfaces
Deployment Planning and Configuration
JUNOS Software with Enhanced Services Design andImplementation Guide (J-series Services Routers only)
■ Understanding and gathering information required todesign network firewalls and IPsec VPNs
■ Implementing a JUNOS software with enhanced servicesfirewall from a sample scenario
■ Implementing a policy-based IPsec VPN from a samplescenario
Security Configuration
■ JUNOS Software Security Configuration Guide
■ JUNOS Software CLI Reference
Configuring and managing the following security services:
■ Stateful firewall policies
■ Zones and their interfaces and address books
■ IPsec VPNs
■ Firewall screens
■ Interface modes: Network Address Translation (NAT)mode and Router mode
■ Public Key Cryptography (PKI)
■ Application Layer Gateways (ALGs)
■ Chassis clusters
■ Intrusion Detection and Prevention (IDP)
Routing Protocols and Services Configuration
■ JUNOS Software Interfaces and Routing Configuration Guide
■ JUNOS Software CLI Reference
■ Configuring routing protocols, including static routes andthe dynamic routing protocols RIP, OSPF, BGP, and IS-IS
■ Configuring class-of-service (CoS) features, includingtraffic shaping and policing
■ Configuring packet-based stateless firewall filters (accesscontrol lists) to control access and limit traffic rates
■ Configuring MPLS to control network traffic patterns
WAN Acceleration Module Installation (Optional)
WXC Integrated Services Module Installation and ConfigurationGuide (J-series Services Routers only)
Installing and initially configuring a WXC Integrated ServicesModule (ISM 200)
User and System Administration
How to Use This Manual ■ xxi
About This Guide

Table 1: Tasks and Related Documentation (continued)
Related DocumentationTask
JUNOS Software Administration Guide■ Administering user authentication and access
■ Monitoring the device, routing protocols, and routingoperations
■ Configuring and monitoring system alarms and events,real-time performance (RPM) probes, and performance
■ Monitoring the firewall and other security-related services
■ Managing system log files
■ Upgrading software
■ Diagnosing common problems
User Interfaces
■ JUNOS Software with Enhanced Services Quick Start(J-series Services Routers only)
■ JUNOS Software Administration Guide
■ Understanding and using the J-Web interface
■ Understanding and using the CLI configuration editor
Document Conventions
Table 2 on page xxii defines the notice icons used in this guide.
Table 2: Notice Icons
DescriptionMeaningIcon
Indicates important features or instructions.Informational note
Indicates a situation that might result in loss of data or hardware damage.Caution
Alerts you to the risk of personal injury or death.Warning
Alerts you to the risk of personal injury from a laser.Laser warning
Table 3 on page xxii defines the text and syntax conventions used in this guide.
Table 3: Text and Syntax Conventions
ExamplesDescriptionConvention
To enter configuration mode, type theconfigure command:
user@host> configure
Represents text that you type.Bold text like this
xxii ■ Document Conventions
JUNOS Software Administration Guide
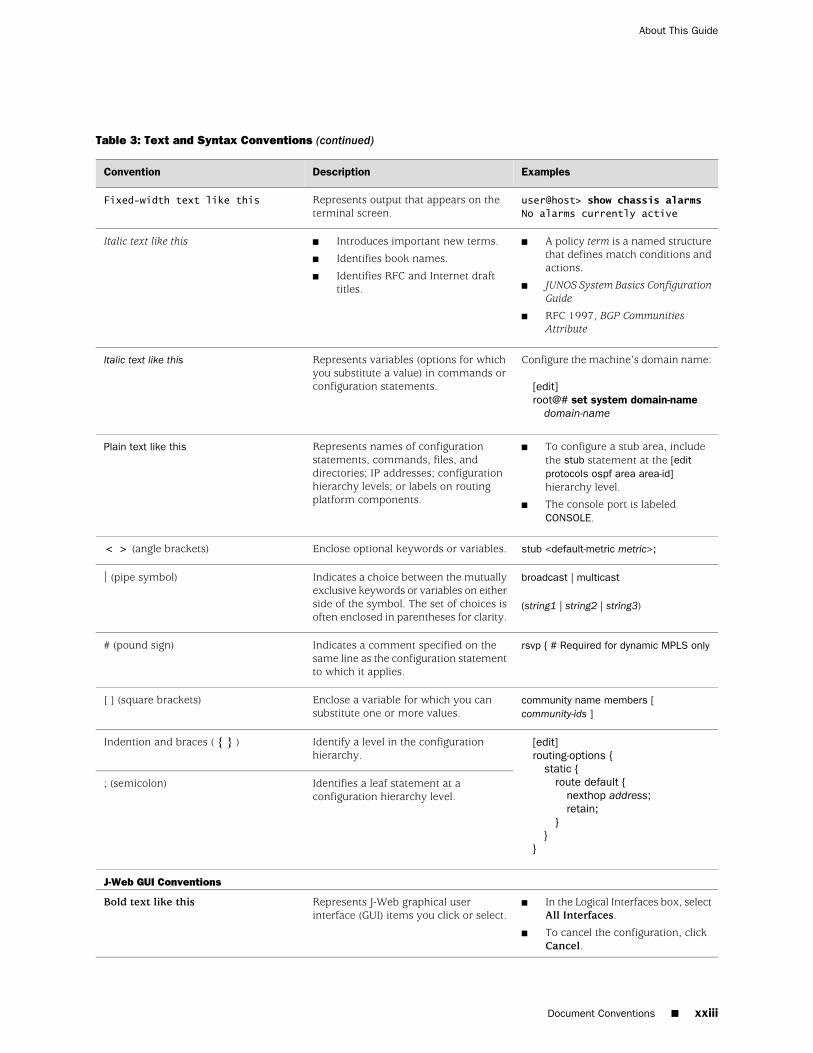
Table 3: Text and Syntax Conventions (continued)
ExamplesDescriptionConvention
user@host> show chassis alarmsNo alarms currently active
Represents output that appears on theterminal screen.
Fixed-width text like this
■ A policy term is a named structurethat defines match conditions andactions.
■ JUNOS System Basics ConfigurationGuide
■ RFC 1997, BGP CommunitiesAttribute
■ Introduces important new terms.
■ Identifies book names.
■ Identifies RFC and Internet drafttitles.
Italic text like this
Configure the machine’s domain name:
[edit]root@# set system domain-name
domain-name
Represents variables (options for whichyou substitute a value) in commands orconfiguration statements.
Italic text like this
■ To configure a stub area, includethe stub statement at the [editprotocols ospf area area-id]hierarchy level.
■ The console port is labeledCONSOLE.
Represents names of configurationstatements, commands, files, anddirectories; IP addresses; configurationhierarchy levels; or labels on routingplatform components.
Plain text like this
stub <default-metric metric>;Enclose optional keywords or variables.< > (angle brackets)
broadcast | multicast
(string1 | string2 | string3)
Indicates a choice between the mutuallyexclusive keywords or variables on eitherside of the symbol. The set of choices isoften enclosed in parentheses for clarity.
| (pipe symbol)
rsvp { # Required for dynamic MPLS onlyIndicates a comment specified on thesame line as the configuration statementto which it applies.
# (pound sign)
community name members [community-ids ]
Enclose a variable for which you cansubstitute one or more values.
[ ] (square brackets)
[edit]routing-options {
static {route default {
nexthop address;retain;
}}
}
Identify a level in the configurationhierarchy.
Indention and braces ( { } )
Identifies a leaf statement at aconfiguration hierarchy level.
; (semicolon)
J-Web GUI Conventions
■ In the Logical Interfaces box, selectAll Interfaces.
■ To cancel the configuration, clickCancel.
Represents J-Web graphical userinterface (GUI) items you click or select.
Bold text like this
Document Conventions ■ xxiii
About This Guide
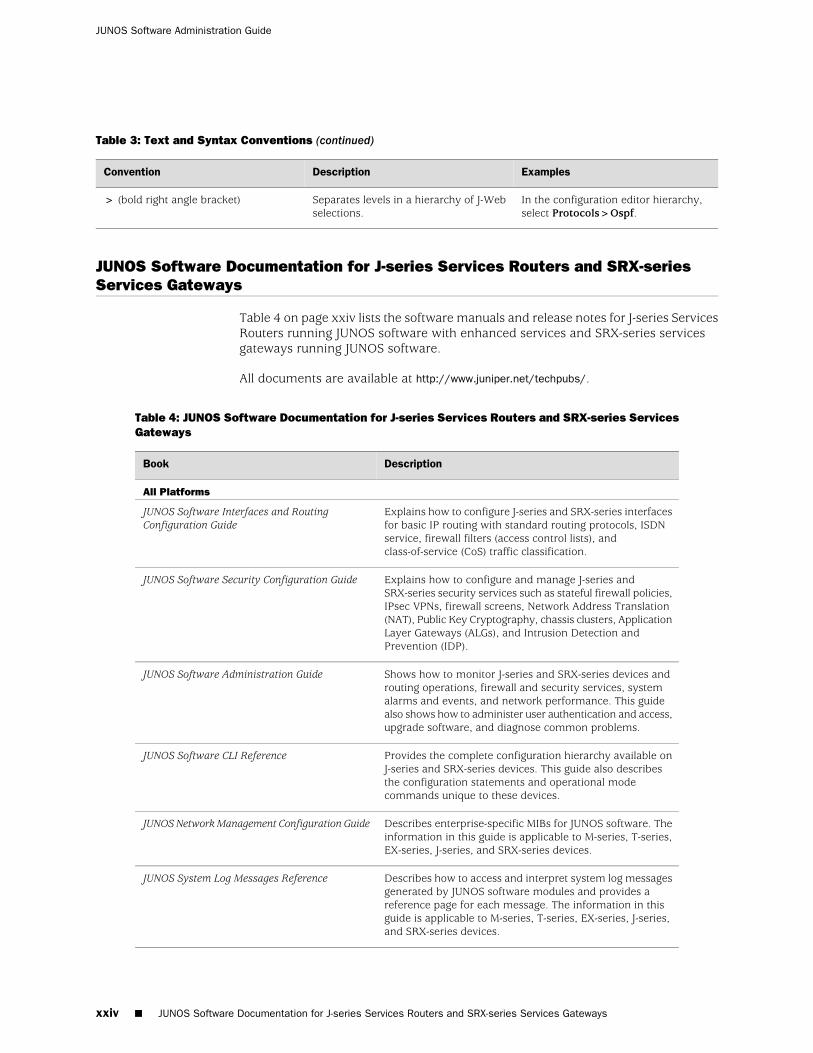
Table 3: Text and Syntax Conventions (continued)
ExamplesDescriptionConvention
In the configuration editor hierarchy,select Protocols>Ospf.
Separates levels in a hierarchy of J-Webselections.
> (bold right angle bracket)
JUNOS Software Documentation for J-series Services Routers and SRX-seriesServices Gateways
Table 4 on page xxiv lists the software manuals and release notes for J-series ServicesRouters running JUNOS software with enhanced services and SRX-series servicesgateways running JUNOS software.
All documents are available at http://www.juniper.net/techpubs/.
Table 4: JUNOS Software Documentation for J-series Services Routers and SRX-series ServicesGateways
DescriptionBook
All Platforms
Explains how to configure J-series and SRX-series interfacesfor basic IP routing with standard routing protocols, ISDNservice, firewall filters (access control lists), andclass-of-service (CoS) traffic classification.
JUNOS Software Interfaces and RoutingConfiguration Guide
Explains how to configure and manage J-series andSRX-series security services such as stateful firewall policies,IPsec VPNs, firewall screens, Network Address Translation(NAT), Public Key Cryptography, chassis clusters, ApplicationLayer Gateways (ALGs), and Intrusion Detection andPrevention (IDP).
JUNOS Software Security Configuration Guide
Shows how to monitor J-series and SRX-series devices androuting operations, firewall and security services, systemalarms and events, and network performance. This guidealso shows how to administer user authentication and access,upgrade software, and diagnose common problems.
JUNOS Software Administration Guide
Provides the complete configuration hierarchy available onJ-series and SRX-series devices. This guide also describesthe configuration statements and operational modecommands unique to these devices.
JUNOS Software CLI Reference
Describes enterprise-specific MIBs for JUNOS software. Theinformation in this guide is applicable to M-series, T-series,EX-series, J-series, and SRX-series devices.
JUNOS Network Management Configuration Guide
Describes how to access and interpret system log messagesgenerated by JUNOS software modules and provides areference page for each message. The information in thisguide is applicable to M-series, T-series, EX-series, J-series,and SRX-series devices.
JUNOS System Log Messages Reference
xxiv ■ JUNOS Software Documentation for J-series Services Routers and SRX-series Services Gateways
JUNOS Software Administration Guide
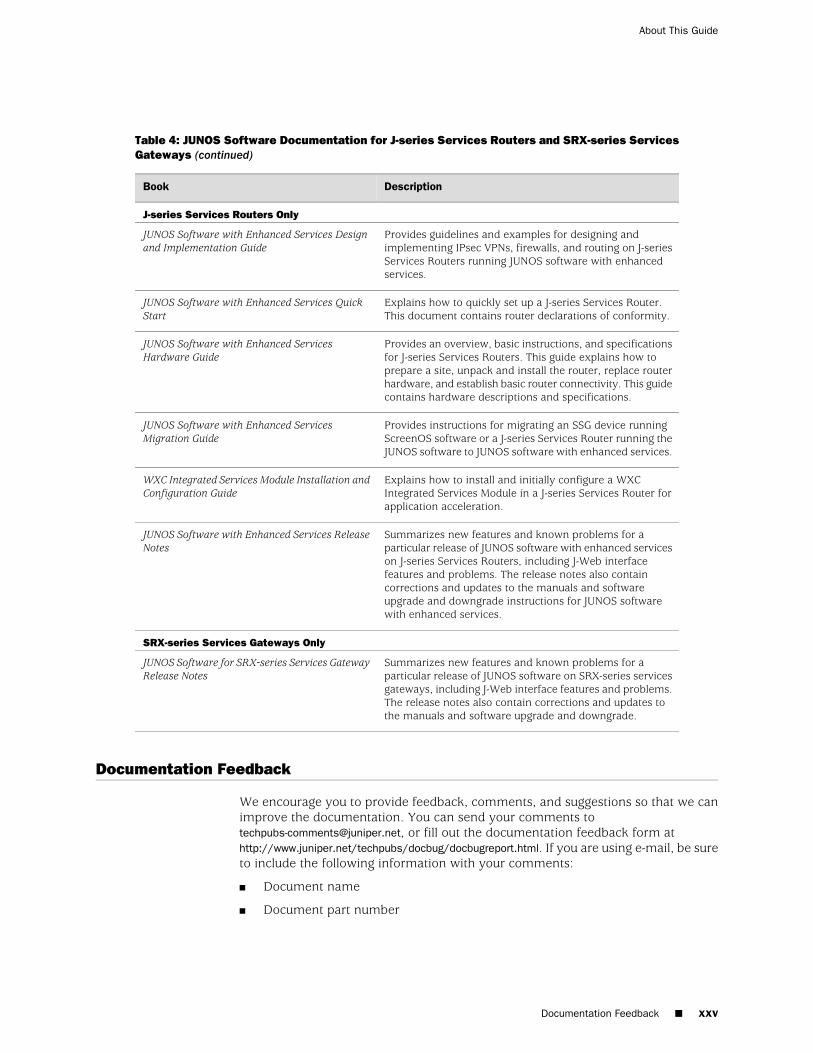
Table 4: JUNOS Software Documentation for J-series Services Routers and SRX-series ServicesGateways (continued)
DescriptionBook
J-series Services Routers Only
Provides guidelines and examples for designing andimplementing IPsec VPNs, firewalls, and routing on J-seriesServices Routers running JUNOS software with enhancedservices.
JUNOS Software with Enhanced Services Designand Implementation Guide
Explains how to quickly set up a J-series Services Router.This document contains router declarations of conformity.
JUNOS Software with Enhanced Services QuickStart
Provides an overview, basic instructions, and specificationsfor J-series Services Routers. This guide explains how toprepare a site, unpack and install the router, replace routerhardware, and establish basic router connectivity. This guidecontains hardware descriptions and specifications.
JUNOS Software with Enhanced ServicesHardware Guide
Provides instructions for migrating an SSG device runningScreenOS software or a J-series Services Router running theJUNOS software to JUNOS software with enhanced services.
JUNOS Software with Enhanced ServicesMigration Guide
Explains how to install and initially configure a WXCIntegrated Services Module in a J-series Services Router forapplication acceleration.
WXC Integrated Services Module Installation andConfiguration Guide
Summarizes new features and known problems for aparticular release of JUNOS software with enhanced serviceson J-series Services Routers, including J-Web interfacefeatures and problems. The release notes also containcorrections and updates to the manuals and softwareupgrade and downgrade instructions for JUNOS softwarewith enhanced services.
JUNOS Software with Enhanced Services ReleaseNotes
SRX-series Services Gateways Only
Summarizes new features and known problems for aparticular release of JUNOS software on SRX-series servicesgateways, including J-Web interface features and problems.The release notes also contain corrections and updates tothe manuals and software upgrade and downgrade.
JUNOS Software for SRX-series Services GatewayRelease Notes
Documentation Feedback
We encourage you to provide feedback, comments, and suggestions so that we canimprove the documentation. You can send your comments [email protected], or fill out the documentation feedback form athttp://www.juniper.net/techpubs/docbug/docbugreport.html. If you are using e-mail, be sureto include the following information with your comments:
■ Document name
■ Document part number
Documentation Feedback ■ xxv
About This Guide

■ Page number
■ Software release version (not required for Network Operations Guides [NOGs])
Requesting Technical Support
Technical product support is available through the Juniper Networks TechnicalAssistance Center (JTAC). If you are a customer with an active J-Care or JNASC supportcontract, or are covered under warranty, and need postsales technical support, youcan access our tools and resources online or open a case with JTAC.
■ JTAC policies—For a complete understanding of our JTAC procedures and policies,review the JTAC User Guide located athttp://www.juniper.net/customers/support/downloads/710059.pdf.
■ Product warranties—For product warranty information, visithttp://www.juniper.net/support/warranty/.
■ JTAC Hours of Operation —The JTAC centers have resources available 24 hoursa day, 7 days a week, 365 days a year.
Self-Help Online Tools and Resources
For quick and easy problem resolution, Juniper Networks has designed an onlineself-service portal called the Customer Support Center (CSC) that provides you withthe following features:
■ Find CSC offerings: http://www.juniper.net/customers/support/
■ Search for known bugs: http://www2.juniper.net/kb/
■ Find product documentation: http://www.juniper.net/techpubs/
■ Find solutions and answer questions using our Knowledge Base:http://kb.juniper.net/
■ Download the latest versions of software and review release notes:http://www.juniper.net/customers/csc/software/
■ Search technical bulletins for relevant hardware and software notifications:https://www.juniper.net/alerts/
■ Join and participate in the Juniper Networks Community Forum:http://www.juniper.net/company/communities/
■ Open a case online in the CSC Case Manager: http://www.juniper.net/cm/
To verify service entitlement by product serial number, use our Serial NumberEntitlement (SNE) Tool located at https://tools.juniper.net/SerialNumberEntitlementSearch/.
Opening a Case with JTAC
You can open a case with JTAC on the Web or by telephone.
■ Use the Case Manager tool in the CSC at http://www.juniper.net/cm/ .
■ Call 1-888-314-JTAC (1-888-314-5822 toll-free in the USA, Canada, and Mexico).
xxvi ■ Requesting Technical Support
JUNOS Software Administration Guide

For international or direct-dial options in countries without toll-free numbers, visitus at http://www.juniper.net/support/requesting-support.html.
Requesting Technical Support ■ xxvii
About This Guide

xxviii ■ Requesting Technical Support
JUNOS Software Administration Guide

Part 1
Support Overview for AdministrationFeatures
■ Support for Administration Features on Different Device Types on page 3
Support Overview for Administration Features ■ 1

2 ■ Support Overview for Administration Features
JUNOS Software Administration Guide
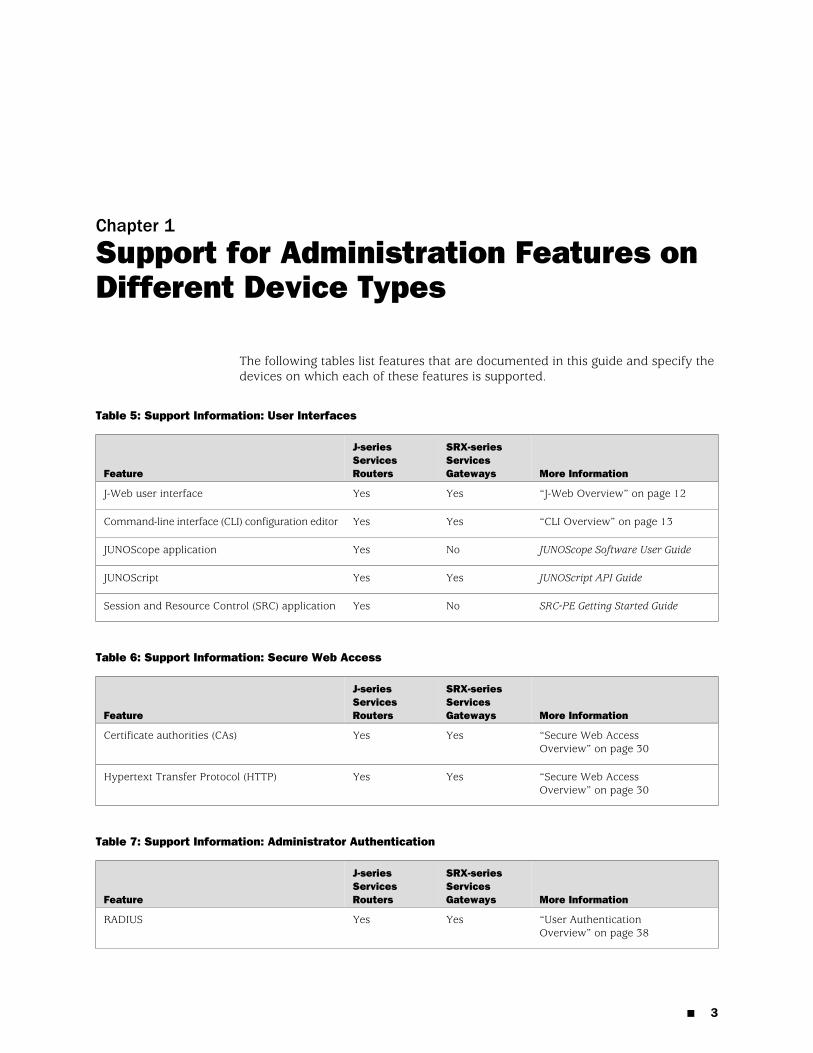
Chapter 1
Support for Administration Features onDifferent Device Types
The following tables list features that are documented in this guide and specify thedevices on which each of these features is supported.
Table 5: Support Information: User Interfaces
More Information
SRX-seriesServicesGateways
J-seriesServicesRoutersFeature
“J-Web Overview” on page 12YesYesJ-Web user interface
“CLI Overview” on page 13YesYesCommand-line interface (CLI) configuration editor
JUNOScope Software User GuideNoYesJUNOScope application
JUNOScript API GuideYesYesJUNOScript
SRC-PE Getting Started GuideNoYesSession and Resource Control (SRC) application
Table 6: Support Information: Secure Web Access
More Information
SRX-seriesServicesGateways
J-seriesServicesRoutersFeature
“Secure Web AccessOverview” on page 30
YesYesCertificate authorities (CAs)
“Secure Web AccessOverview” on page 30
YesYesHypertext Transfer Protocol (HTTP)
Table 7: Support Information: Administrator Authentication
More Information
SRX-seriesServicesGateways
J-seriesServicesRoutersFeature
“User AuthenticationOverview” on page 38
YesYesRADIUS
■ 3
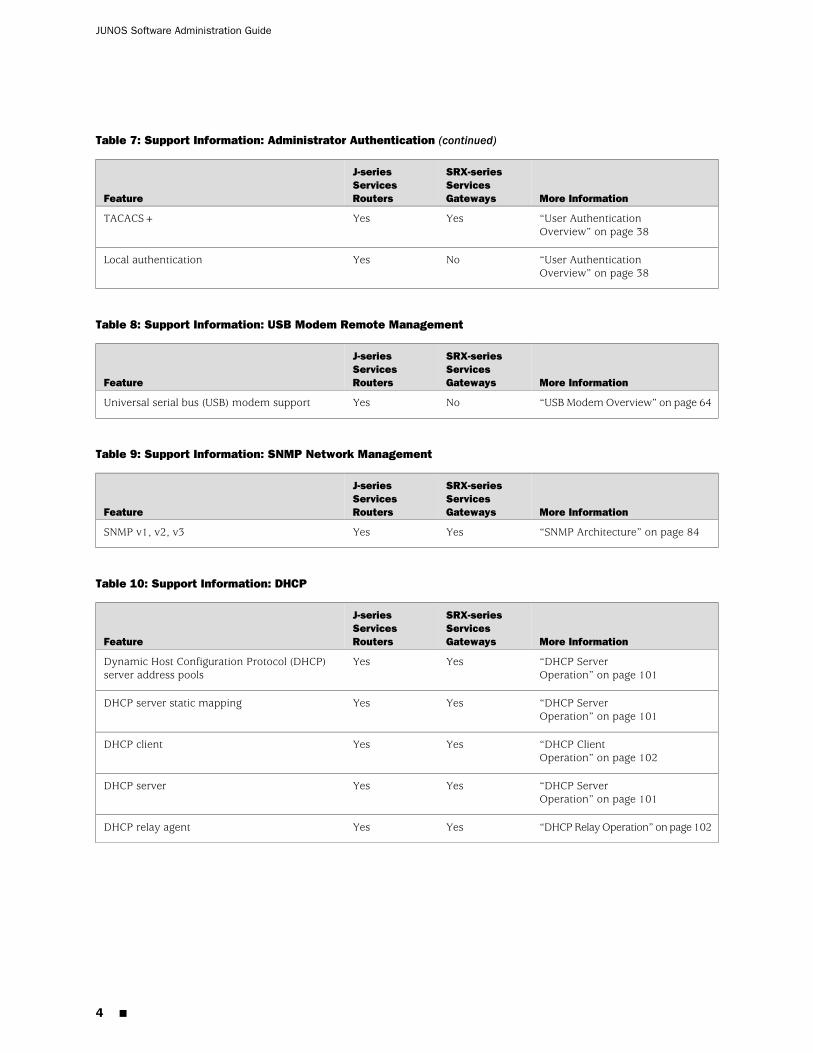
Table 7: Support Information: Administrator Authentication (continued)
More Information
SRX-seriesServicesGateways
J-seriesServicesRoutersFeature
“User AuthenticationOverview” on page 38
YesYesTACACS+
“User AuthenticationOverview” on page 38
NoYesLocal authentication
Table 8: Support Information: USB Modem Remote Management
More Information
SRX-seriesServicesGateways
J-seriesServicesRoutersFeature
“USB Modem Overview” on page 64NoYesUniversal serial bus (USB) modem support
Table 9: Support Information: SNMP Network Management
More Information
SRX-seriesServicesGateways
J-seriesServicesRoutersFeature
“SNMP Architecture” on page 84YesYesSNMP v1, v2, v3
Table 10: Support Information: DHCP
More Information
SRX-seriesServicesGateways
J-seriesServicesRoutersFeature
“DHCP ServerOperation” on page 101
YesYesDynamic Host Configuration Protocol (DHCP)server address pools
“DHCP ServerOperation” on page 101
YesYesDHCP server static mapping
“DHCP ClientOperation” on page 102
YesYesDHCP client
“DHCP ServerOperation” on page 101
YesYesDHCP server
“DHCP Relay Operation” on page 102YesYesDHCP relay agent
4 ■
JUNOS Software Administration Guide
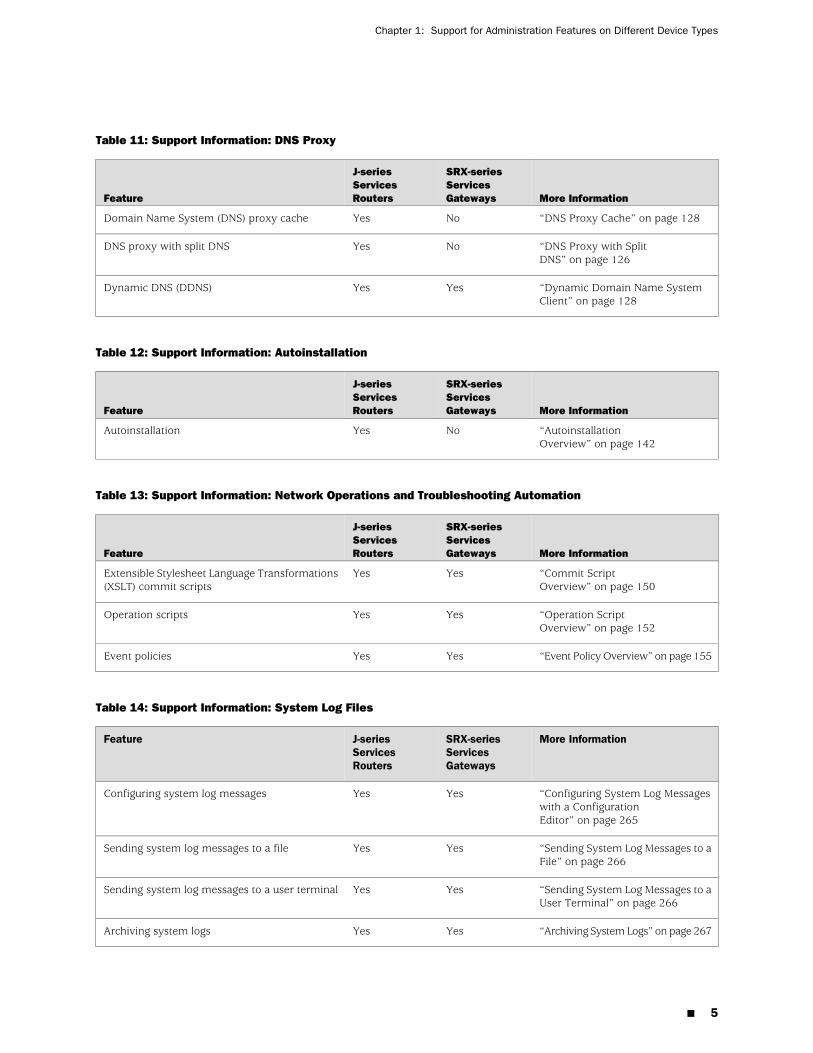
Table 11: Support Information: DNS Proxy
More Information
SRX-seriesServicesGateways
J-seriesServicesRoutersFeature
“DNS Proxy Cache” on page 128NoYesDomain Name System (DNS) proxy cache
“DNS Proxy with SplitDNS” on page 126
NoYesDNS proxy with split DNS
“Dynamic Domain Name SystemClient” on page 128
YesYesDynamic DNS (DDNS)
Table 12: Support Information: Autoinstallation
More Information
SRX-seriesServicesGateways
J-seriesServicesRoutersFeature
“AutoinstallationOverview” on page 142
NoYesAutoinstallation
Table 13: Support Information: Network Operations and Troubleshooting Automation
More Information
SRX-seriesServicesGateways
J-seriesServicesRoutersFeature
“Commit ScriptOverview” on page 150
YesYesExtensible Stylesheet Language Transformations(XSLT) commit scripts
“Operation ScriptOverview” on page 152
YesYesOperation scripts
“Event Policy Overview” on page 155YesYesEvent policies
Table 14: Support Information: System Log Files
More InformationSRX-seriesServicesGateways
J-seriesServicesRouters
Feature
“Configuring System Log Messageswith a ConfigurationEditor” on page 265
YesYesConfiguring system log messages
“Sending System Log Messages to aFile” on page 266
YesYesSending system log messages to a file
“Sending System Log Messages to aUser Terminal” on page 266
YesYesSending system log messages to a user terminal
“Archiving System Logs” on page 267YesYesArchiving system logs
■ 5
Chapter 1: Support for Administration Features on Different Device Types
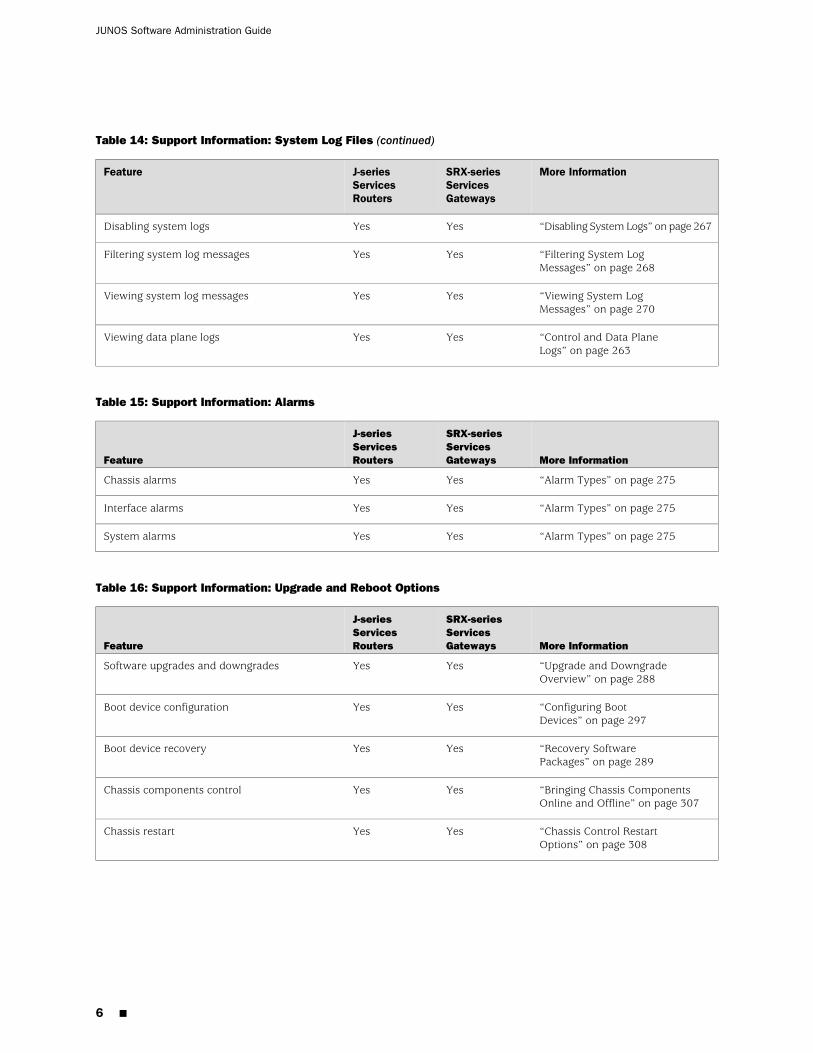
Table 14: Support Information: System Log Files (continued)
More InformationSRX-seriesServicesGateways
J-seriesServicesRouters
Feature
“Disabling System Logs” on page 267YesYesDisabling system logs
“Filtering System LogMessages” on page 268
YesYesFiltering system log messages
“Viewing System LogMessages” on page 270
YesYesViewing system log messages
“Control and Data PlaneLogs” on page 263
YesYesViewing data plane logs
Table 15: Support Information: Alarms
More Information
SRX-seriesServicesGateways
J-seriesServicesRoutersFeature
“Alarm Types” on page 275YesYesChassis alarms
“Alarm Types” on page 275YesYesInterface alarms
“Alarm Types” on page 275YesYesSystem alarms
Table 16: Support Information: Upgrade and Reboot Options
More Information
SRX-seriesServicesGateways
J-seriesServicesRoutersFeature
“Upgrade and DowngradeOverview” on page 288
YesYesSoftware upgrades and downgrades
“Configuring BootDevices” on page 297
YesYesBoot device configuration
“Recovery SoftwarePackages” on page 289
YesYesBoot device recovery
“Bringing Chassis ComponentsOnline and Offline” on page 307
YesYesChassis components control
“Chassis Control RestartOptions” on page 308
YesYesChassis restart
6 ■
JUNOS Software Administration Guide
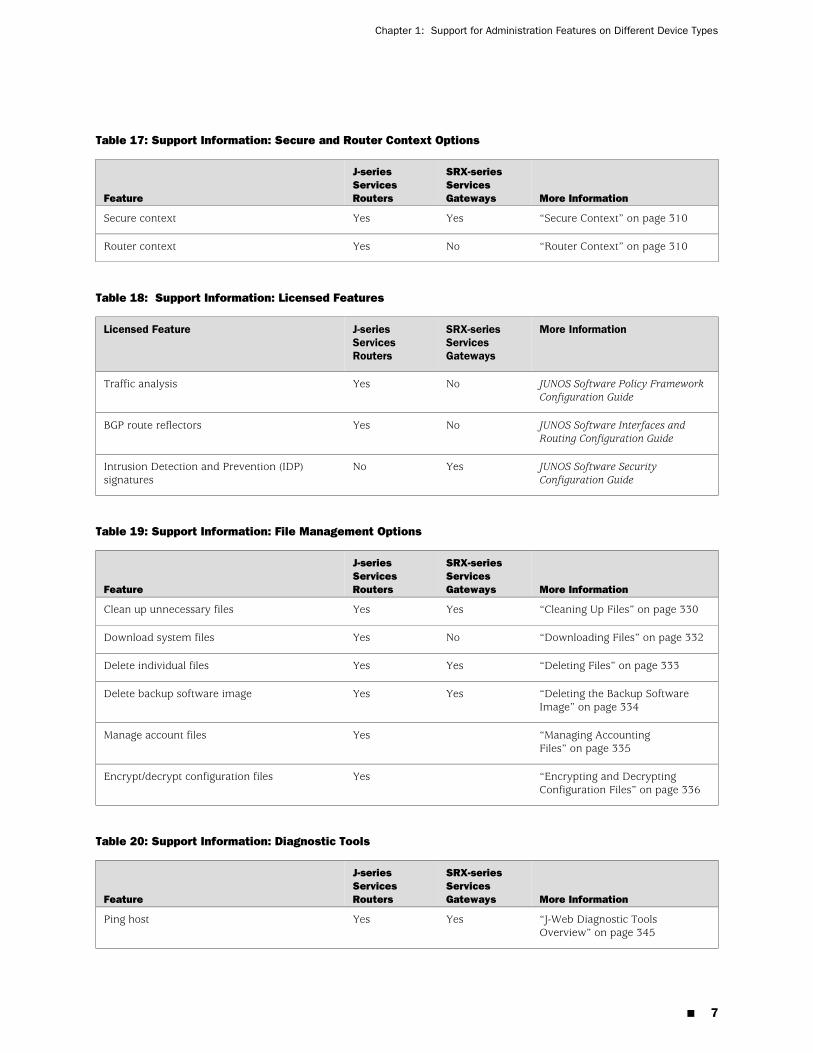
Table 17: Support Information: Secure and Router Context Options
More Information
SRX-seriesServicesGateways
J-seriesServicesRoutersFeature
“Secure Context” on page 310YesYesSecure context
“Router Context” on page 310NoYesRouter context
Table 18: Support Information: Licensed Features
More InformationSRX-seriesServicesGateways
J-seriesServicesRouters
Licensed Feature
JUNOS Software Policy FrameworkConfiguration Guide
NoYesTraffic analysis
JUNOS Software Interfaces andRouting Configuration Guide
NoYesBGP route reflectors
JUNOS Software SecurityConfiguration Guide
YesNoIntrusion Detection and Prevention (IDP)signatures
Table 19: Support Information: File Management Options
More Information
SRX-seriesServicesGateways
J-seriesServicesRoutersFeature
“Cleaning Up Files” on page 330YesYesClean up unnecessary files
“Downloading Files” on page 332NoYesDownload system files
“Deleting Files” on page 333YesYesDelete individual files
“Deleting the Backup SoftwareImage” on page 334
YesYesDelete backup software image
“Managing AccountingFiles” on page 335
YesManage account files
“Encrypting and DecryptingConfiguration Files” on page 336
YesEncrypt/decrypt configuration files
Table 20: Support Information: Diagnostic Tools
More Information
SRX-seriesServicesGateways
J-seriesServicesRoutersFeature
“J-Web Diagnostic ToolsOverview” on page 345
YesYesPing host
■ 7
Chapter 1: Support for Administration Features on Different Device Types
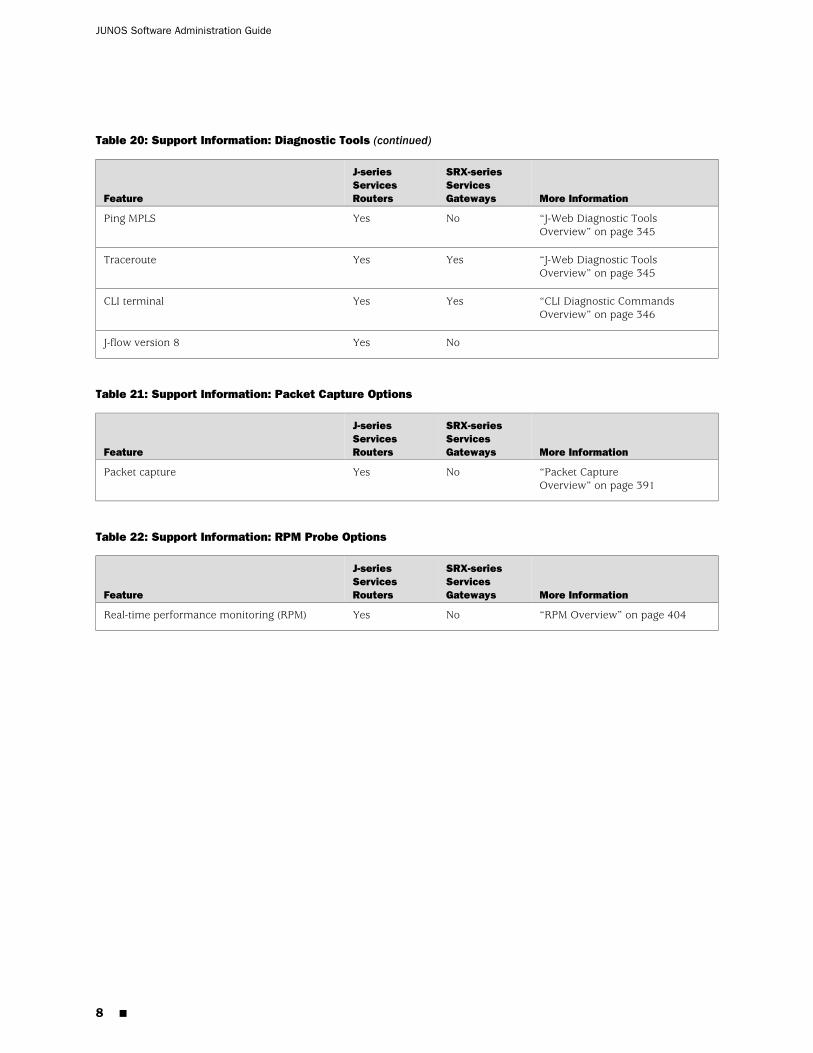
Table 20: Support Information: Diagnostic Tools (continued)
More Information
SRX-seriesServicesGateways
J-seriesServicesRoutersFeature
“J-Web Diagnostic ToolsOverview” on page 345
NoYesPing MPLS
“J-Web Diagnostic ToolsOverview” on page 345
YesYesTraceroute
“CLI Diagnostic CommandsOverview” on page 346
YesYesCLI terminal
NoYesJ-flow version 8
Table 21: Support Information: Packet Capture Options
More Information
SRX-seriesServicesGateways
J-seriesServicesRoutersFeature
“Packet CaptureOverview” on page 391
NoYesPacket capture
Table 22: Support Information: RPM Probe Options
More Information
SRX-seriesServicesGateways
J-seriesServicesRoutersFeature
“RPM Overview” on page 404NoYesReal-time performance monitoring (RPM)
8 ■
JUNOS Software Administration Guide
Part 2
Configuring the Device for Administration
■ User Interface Overview on page 11
■ Configuring Secure Web Access on page 29
■ Managing Administrator Authentication on page 37
■ Setting Up USB Modems for Remote Management on page 63
■ Configuring SNMP for Network Management on page 83
■ Configuring the Device for DHCP on page 99
■ Configuring the Device as a DNS Proxy on page 125
■ Configuring Autoinstallation on page 141
■ Automating Network Operations and Troubleshooting on page 149
Configuring the Device for Administration ■ 9

10 ■ Configuring the Device for Administration
JUNOS Software Administration Guide
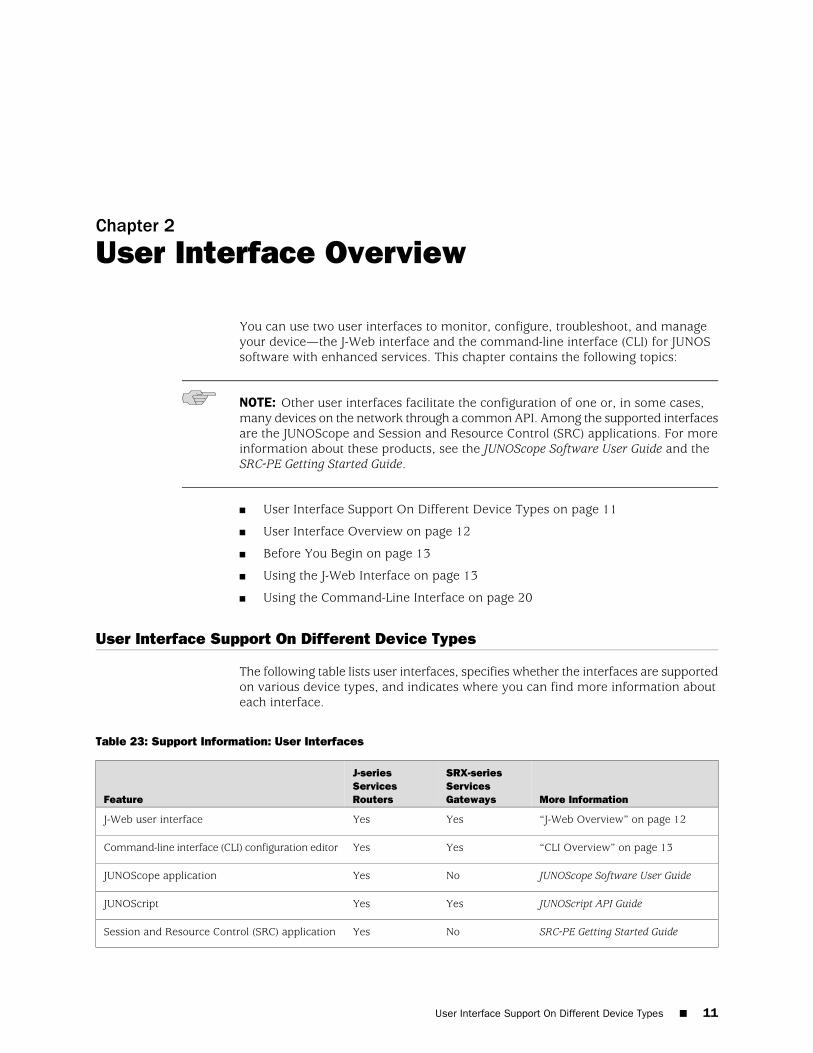
Chapter 2
User Interface Overview
You can use two user interfaces to monitor, configure, troubleshoot, and manageyour device—the J-Web interface and the command-line interface (CLI) for JUNOSsoftware with enhanced services. This chapter contains the following topics:
NOTE: Other user interfaces facilitate the configuration of one or, in some cases,many devices on the network through a common API. Among the supported interfacesare the JUNOScope and Session and Resource Control (SRC) applications. For moreinformation about these products, see the JUNOScope Software User Guide and theSRC-PE Getting Started Guide.
■ User Interface Support On Different Device Types on page 11
■ User Interface Overview on page 12
■ Before You Begin on page 13
■ Using the J-Web Interface on page 13
■ Using the Command-Line Interface on page 20
User Interface Support On Different Device Types
The following table lists user interfaces, specifies whether the interfaces are supportedon various device types, and indicates where you can find more information abouteach interface.
Table 23: Support Information: User Interfaces
More Information
SRX-seriesServicesGateways
J-seriesServicesRoutersFeature
“J-Web Overview” on page 12YesYesJ-Web user interface
“CLI Overview” on page 13YesYesCommand-line interface (CLI) configuration editor
JUNOScope Software User GuideNoYesJUNOScope application
JUNOScript API GuideYesYesJUNOScript
SRC-PE Getting Started GuideNoYesSession and Resource Control (SRC) application
User Interface Support On Different Device Types ■ 11
User Interface Overview
This section contains the following topics:
■ J-Web Overview on page 12
■ CLI Overview on page 13
You can operate the device either in secure or router context. With the J-Web interfaceand the command-line interface (CLI), you configure the routing protocols that runon the device, and the device security features, including stateful firewall policies,Network Address Translation (NAT) attack prevention screens, Application LayerGateways (ALGs), and IPSec VPNs. You also set the properties of its network interfaces.After activating a software configuration, you can use either user interface to monitorthe system and the protocol traffic passing through the device, manage operations,and diagnose protocol and network connectivity problems.
For information about secure and router contexts, see “Understanding Secure andRouter Contexts” on page 310.
J-Web Overview
The J-Web interface allows you to monitor, configure, troubleshoot, and manageyour device by means of a Web browser enabled with Hypertext Transfer Protocol(HTTP) or HTTP over Secure Sockets Layer (HTTPS). J-Web provides access to all theconfiguration statements supported by the device, so you can fully configure it withoutusing the CLI editor.
You can perform the following tasks with the J-Web interface:
■ Monitoring—Display the current configuration and information about the system,interfaces, chassis, routing protocols, routing tables, routing policy filters, andother features.
■ Configuring—View the current configurations at a glance, configure the device,and manage configuration files. The J-Web interface provides the followingdifferent configuration methods:
■ Configure the device quickly and easily without configuring each statementindividually.
■ Edit a graphical version of the JUNOS software with enhanced services CLIconfiguration statements and hierarchy.
■ Edit the configuration in a text file.
■ Upload a configuration file.
The J-Web interface also allows you to manage configuration history and set arescue configuration.
■ Diagnosing—Diagnose routing problems by running the ping or traceroutediagnostic tool. The diagnostic tools also allow you to capture and analyze controltraffic on the devices.
12 ■ User Interface Overview
JUNOS Software Administration Guide
■ Managing—Manage log, temporary, and core (crash) files and schedule rebootson your devices. You can also manage software packages and licenses and copya snapshot of the system software to a backup device.
■ Configuring and monitoring events—Filter and view system log messages thatrecord events occurring on the device. You can configure files to log system logmessages and also assign attributes, such as severity levels, to messages.
■ Configuring and monitoring alarms—Monitor and diagnose the device bymonitoring active alarms that alert you to the conditions on a network interface.You can also set the conditions that trigger alarms on an interface.
For more information about the J-Web interface, see “Using the J-WebInterface” on page 13.
CLI Overview
The CLI is a straightforward command interface in which you type commands on aline and press Enter to execute them. The CLI provides command help, commandcompletion, and Emacs-style keyboard sequences for moving around on the commandline and scrolling through a buffer of recently executed commands.
The CLI has two modes:
■ Operational mode—Complete set of commands to control the CLI environment,monitor and troubleshoot network connectivity, manage the device, and enterconfiguration mode.
■ Configuration mode—Complete set of commands to configure the device. Thisguide refers to configuration mode as the CLI configuration editor.
For more information about the CLI, see “Using the Command-LineInterface” on page 20.
Before You Begin
Before you start the user interface, you must perform the initial device configurationdescribed in the Getting Started Guide for your device. After the initial configuration,you use your username and password, and the hostname or IP address of the device,to start the user interface.
Using the J-Web Interface
This section contains the following topics:
■ Starting the J-Web Interface on page 14
■ J-Web Layout on page 14
■ Elements of the J-Web Interface on page 15
■ Navigating the J-Web Interface on page 17
■ J-Web Sessions on page 20
Before You Begin ■ 13
Chapter 2: User Interface Overview
For more information about using the J-Web interface, see the J-Web Interface UserGuide.
Starting the J-Web Interface
To start the J-Web interface:
1. Launch your HTTP-enabled or HTTPS-enabled Web browser.
To use HTTPS, you must have installed the certificate provided by the device.
NOTE: If the device is running the worldwide version of the JUNOS software and youare using the Microsoft Internet Explorer Web browser, you must disable theUse SSL 3.0 option in the Web browser to access the device.
2. After http:// or https:// in your Web browser, type the hostname or IP addressof the device and press Enter.
The J-Web login page appears.
3. On the login page, type your username and password, and click Log In.
To correct or change the username or password you typed, click Reset, type thenew entry or entries, and click Log In.
NOTE: The default username is root with no password. You must change this duringinitial configuration or the system does not accept the configuration.
The J-Web Quick Configuration>Set Up or Monitor>System page appears.
To explicitly terminate a J-Web session at any time, click Logout in the top pane.
J-Web Layout
Each page of the J-Web interface is divided into the following panes:
■ Top pane—Displays identifying information and links.
■ Main pane—Location where you monitor, configure, diagnose, and manage thedevice by entering information in text boxes, making selections, and clickingbuttons.
■ Side pane—Displays subtasks of the Monitor, Configuration, Diagnose, or Managetask currently displayed in the main pane. For the configuration editor, this panedisplays the hierarchy of configuration statements committed on the device.Click an item to access it in the main pane.
■ Bottom pane—Displays copyright and trademark information.
14 ■ Using the J-Web Interface
JUNOS Software Administration Guide
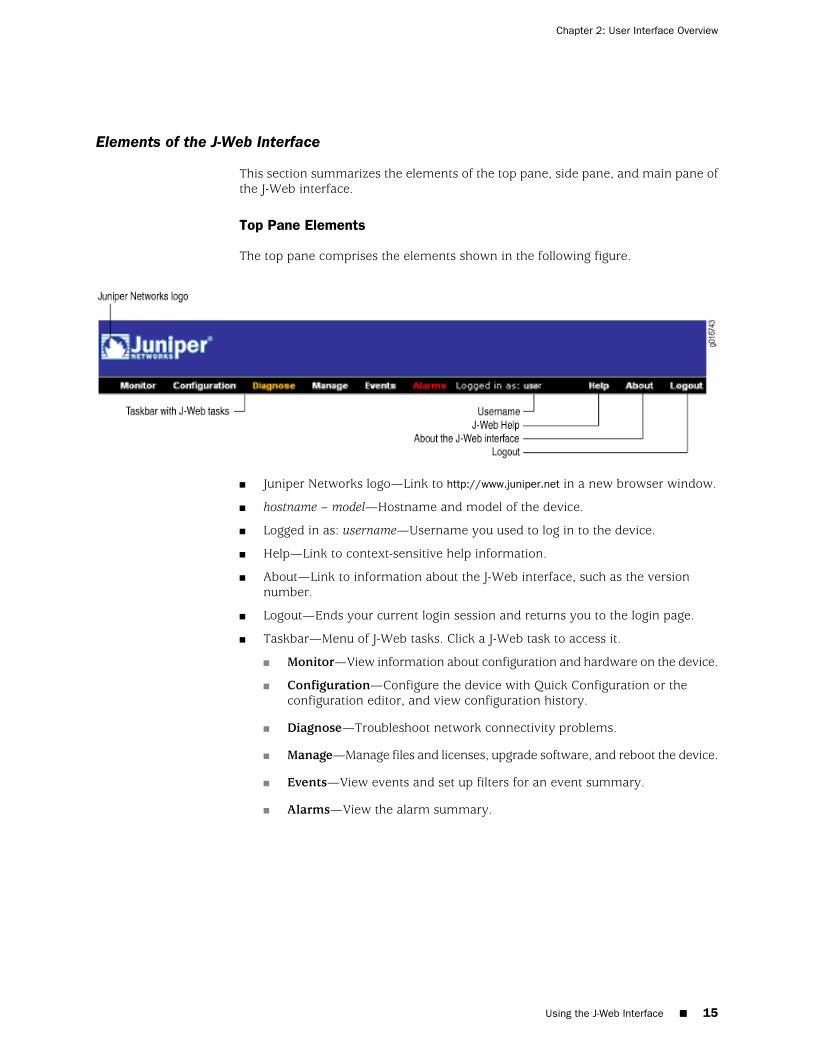
Elements of the J-Web Interface
This section summarizes the elements of the top pane, side pane, and main pane ofthe J-Web interface.
Top Pane Elements
The top pane comprises the elements shown in the following figure.
■ Juniper Networks logo—Link to http://www.juniper.net in a new browser window.
■ hostname – model—Hostname and model of the device.
■ Logged in as: username—Username you used to log in to the device.
■ Help—Link to context-sensitive help information.
■ About—Link to information about the J-Web interface, such as the versionnumber.
■ Logout—Ends your current login session and returns you to the login page.
■ Taskbar—Menu of J-Web tasks. Click a J-Web task to access it.
■ Monitor—View information about configuration and hardware on the device.
■ Configuration—Configure the device with Quick Configuration or theconfiguration editor, and view configuration history.
■ Diagnose—Troubleshoot network connectivity problems.
■ Manage—Manage files and licenses, upgrade software, and reboot the device.
■ Events—View events and set up filters for an event summary.
■ Alarms—View the alarm summary.
Using the J-Web Interface ■ 15
Chapter 2: User Interface Overview
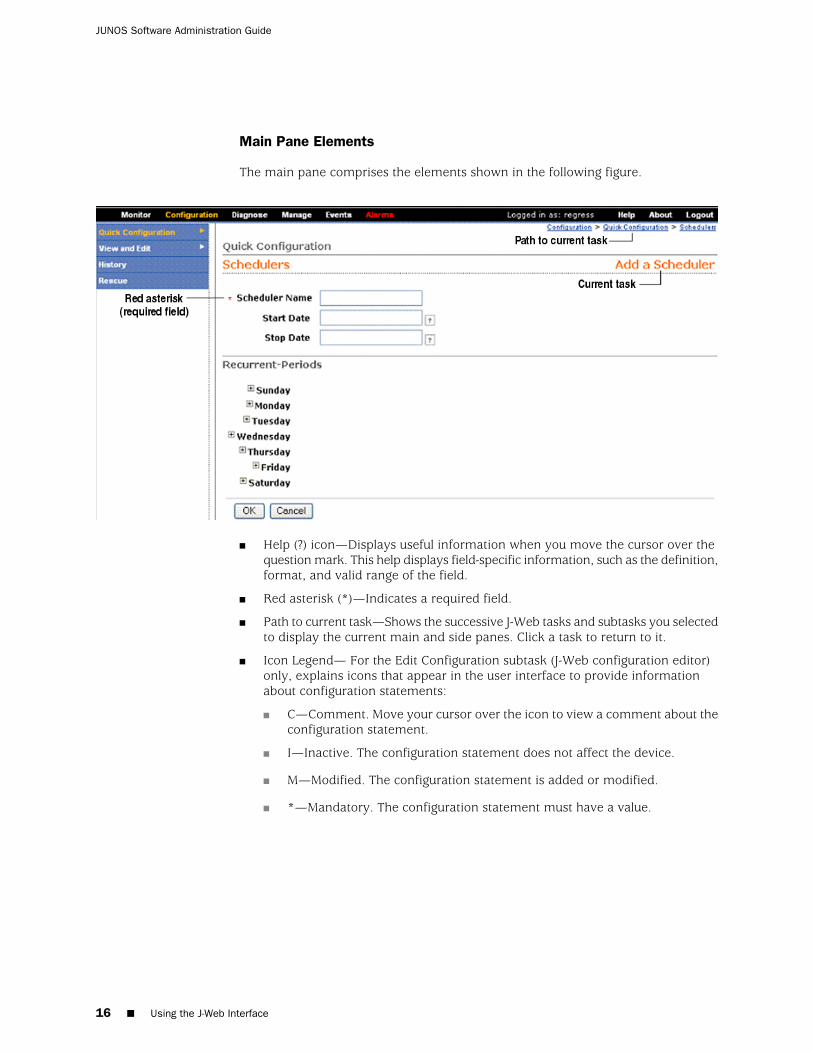
Main Pane Elements
The main pane comprises the elements shown in the following figure.
■ Help (?) icon—Displays useful information when you move the cursor over thequestion mark. This help displays field-specific information, such as the definition,format, and valid range of the field.
■ Red asterisk (*)—Indicates a required field.
■ Path to current task—Shows the successive J-Web tasks and subtasks you selectedto display the current main and side panes. Click a task to return to it.
■ Icon Legend— For the Edit Configuration subtask (J-Web configuration editor)only, explains icons that appear in the user interface to provide informationabout configuration statements:
■ C—Comment. Move your cursor over the icon to view a comment about theconfiguration statement.
■ I—Inactive. The configuration statement does not affect the device.
■ M—Modified. The configuration statement is added or modified.
■ *—Mandatory. The configuration statement must have a value.
16 ■ Using the J-Web Interface
JUNOS Software Administration Guide
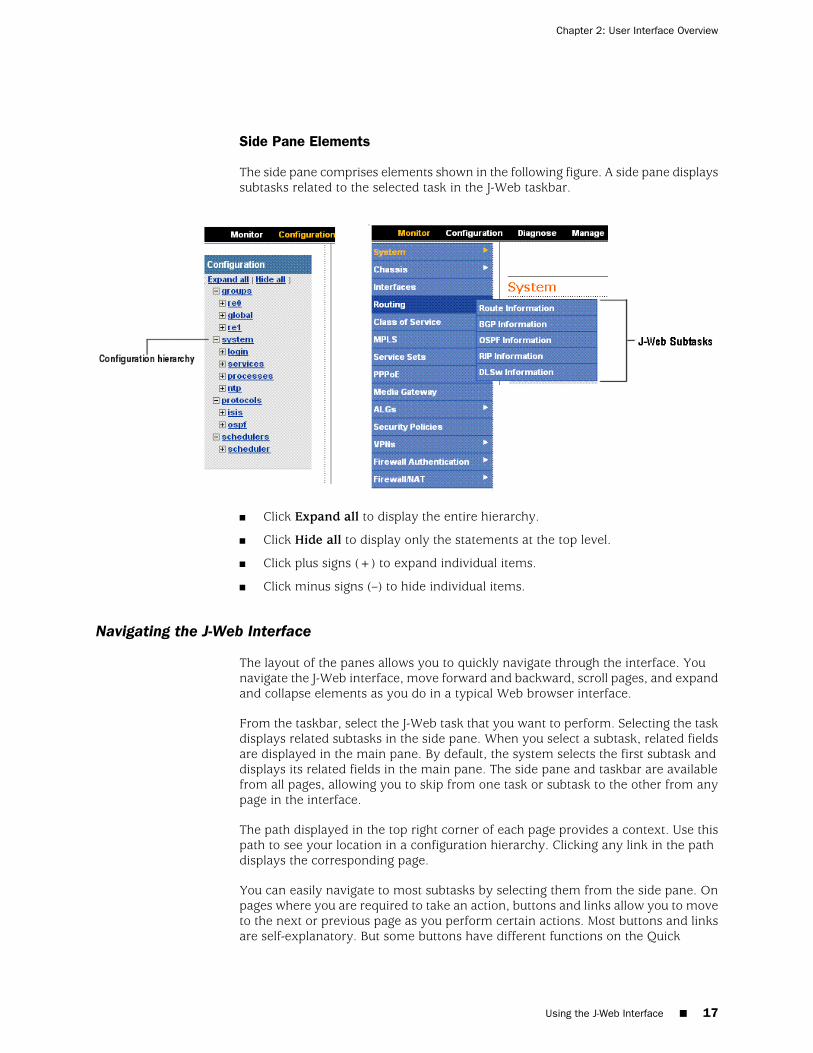
Side Pane Elements
The side pane comprises elements shown in the following figure. A side pane displayssubtasks related to the selected task in the J-Web taskbar.
■ Click Expand all to display the entire hierarchy.
■ Click Hide all to display only the statements at the top level.
■ Click plus signs (+) to expand individual items.
■ Click minus signs (–) to hide individual items.
Navigating the J-Web Interface
The layout of the panes allows you to quickly navigate through the interface. Younavigate the J-Web interface, move forward and backward, scroll pages, and expandand collapse elements as you do in a typical Web browser interface.
From the taskbar, select the J-Web task that you want to perform. Selecting the taskdisplays related subtasks in the side pane. When you select a subtask, related fieldsare displayed in the main pane. By default, the system selects the first subtask anddisplays its related fields in the main pane. The side pane and taskbar are availablefrom all pages, allowing you to skip from one task or subtask to the other from anypage in the interface.
The path displayed in the top right corner of each page provides a context. Use thispath to see your location in a configuration hierarchy. Clicking any link in the pathdisplays the corresponding page.
You can easily navigate to most subtasks by selecting them from the side pane. Onpages where you are required to take an action, buttons and links allow you to moveto the next or previous page as you perform certain actions. Most buttons and linksare self-explanatory. But some buttons have different functions on the Quick
Using the J-Web Interface ■ 17
Chapter 2: User Interface Overview
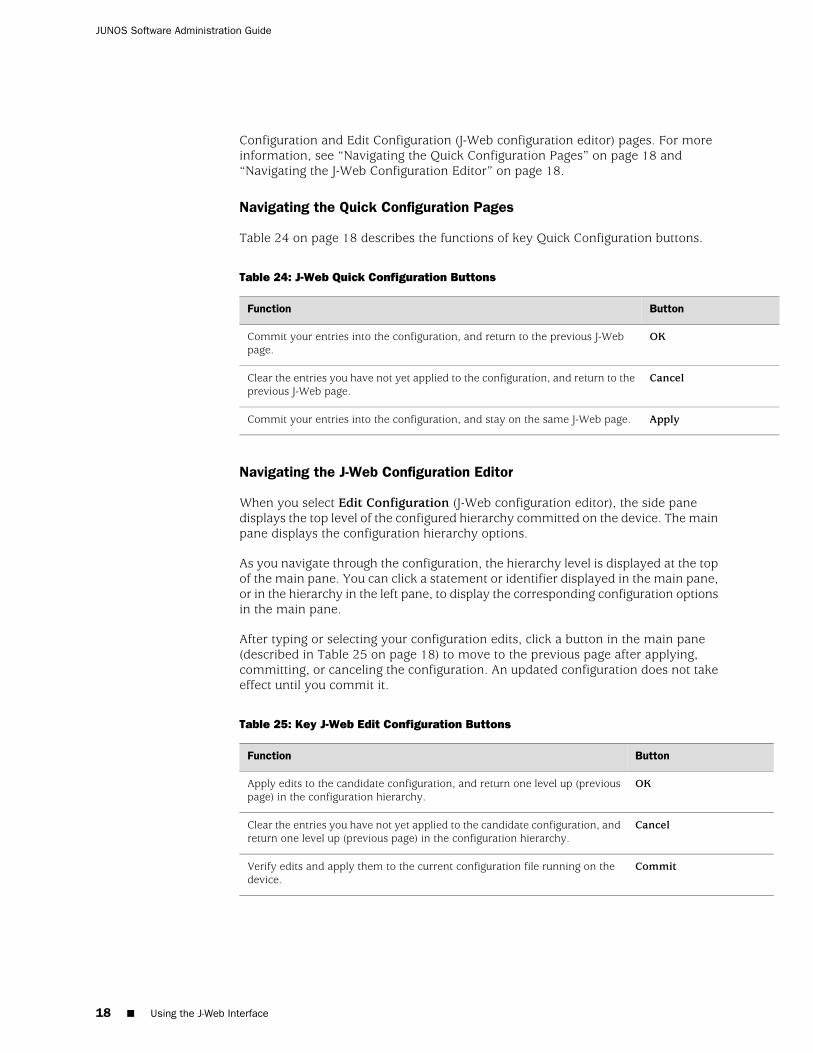
Configuration and Edit Configuration (J-Web configuration editor) pages. For moreinformation, see “Navigating the Quick Configuration Pages” on page 18 and“Navigating the J-Web Configuration Editor” on page 18.
Navigating the Quick Configuration Pages
Table 24 on page 18 describes the functions of key Quick Configuration buttons.
Table 24: J-Web Quick Configuration Buttons
ButtonFunction
OKCommit your entries into the configuration, and return to the previous J-Webpage.
CancelClear the entries you have not yet applied to the configuration, and return to theprevious J-Web page.
ApplyCommit your entries into the configuration, and stay on the same J-Web page.
Navigating the J-Web Configuration Editor
When you select Edit Configuration (J-Web configuration editor), the side panedisplays the top level of the configured hierarchy committed on the device. The mainpane displays the configuration hierarchy options.
As you navigate through the configuration, the hierarchy level is displayed at the topof the main pane. You can click a statement or identifier displayed in the main pane,or in the hierarchy in the left pane, to display the corresponding configuration optionsin the main pane.
After typing or selecting your configuration edits, click a button in the main pane(described in Table 25 on page 18) to move to the previous page after applying,committing, or canceling the configuration. An updated configuration does not takeeffect until you commit it.
Table 25: Key J-Web Edit Configuration Buttons
ButtonFunction
OKApply edits to the candidate configuration, and return one level up (previouspage) in the configuration hierarchy.
CancelClear the entries you have not yet applied to the candidate configuration, andreturn one level up (previous page) in the configuration hierarchy.
CommitVerify edits and apply them to the current configuration file running on thedevice.
18 ■ Using the J-Web Interface
JUNOS Software Administration Guide
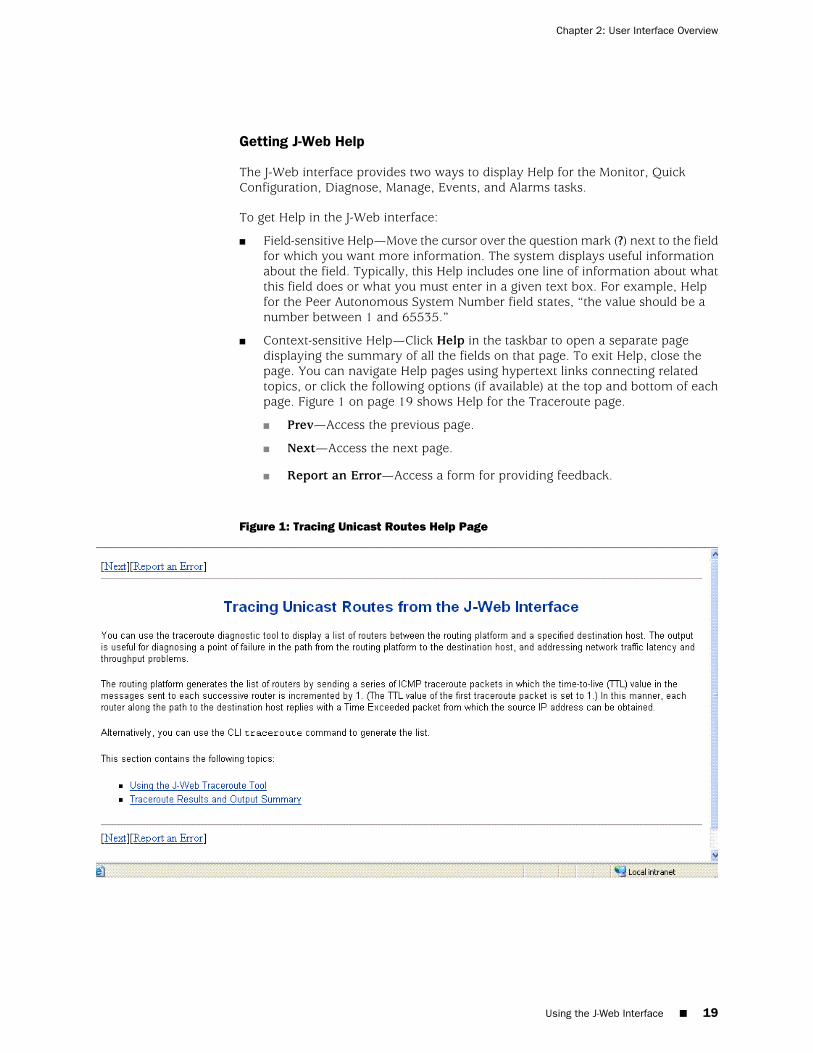
Getting J-Web Help
The J-Web interface provides two ways to display Help for the Monitor, QuickConfiguration, Diagnose, Manage, Events, and Alarms tasks.
To get Help in the J-Web interface:
■ Field-sensitive Help—Move the cursor over the question mark (?) next to the fieldfor which you want more information. The system displays useful informationabout the field. Typically, this Help includes one line of information about whatthis field does or what you must enter in a given text box. For example, Helpfor the Peer Autonomous System Number field states, “the value should be anumber between 1 and 65535.”
■ Context-sensitive Help—Click Help in the taskbar to open a separate pagedisplaying the summary of all the fields on that page. To exit Help, close thepage. You can navigate Help pages using hypertext links connecting relatedtopics, or click the following options (if available) at the top and bottom of eachpage. Figure 1 on page 19 shows Help for the Traceroute page.
■ Prev—Access the previous page.
■ Next—Access the next page.
■ Report an Error—Access a form for providing feedback.
Figure 1: Tracing Unicast Routes Help Page
Using the J-Web Interface ■ 19
Chapter 2: User Interface Overview
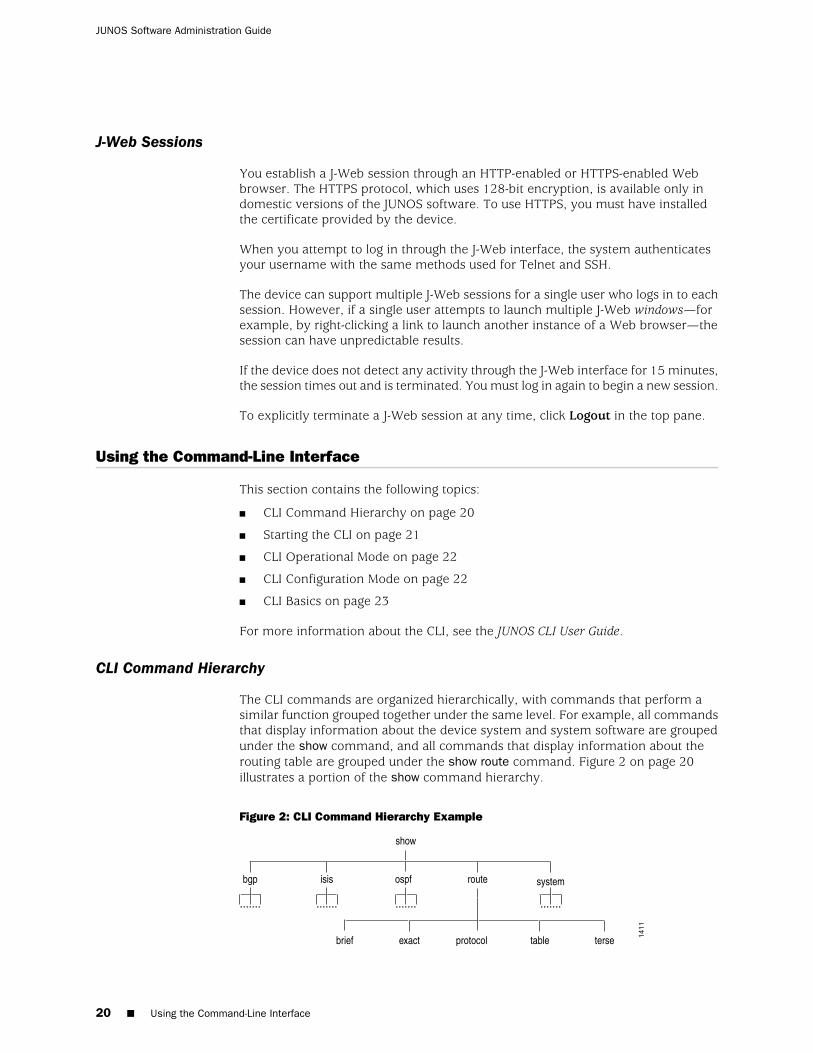
J-Web Sessions
You establish a J-Web session through an HTTP-enabled or HTTPS-enabled Webbrowser. The HTTPS protocol, which uses 128-bit encryption, is available only indomestic versions of the JUNOS software. To use HTTPS, you must have installedthe certificate provided by the device.
When you attempt to log in through the J-Web interface, the system authenticatesyour username with the same methods used for Telnet and SSH.
The device can support multiple J-Web sessions for a single user who logs in to eachsession. However, if a single user attempts to launch multiple J-Web windows—forexample, by right-clicking a link to launch another instance of a Web browser—thesession can have unpredictable results.
If the device does not detect any activity through the J-Web interface for 15 minutes,the session times out and is terminated. You must log in again to begin a new session.
To explicitly terminate a J-Web session at any time, click Logout in the top pane.
Using the Command-Line Interface
This section contains the following topics:
■ CLI Command Hierarchy on page 20
■ Starting the CLI on page 21
■ CLI Operational Mode on page 22
■ CLI Configuration Mode on page 22
■ CLI Basics on page 23
For more information about the CLI, see the JUNOS CLI User Guide.
CLI Command Hierarchy
The CLI commands are organized hierarchically, with commands that perform asimilar function grouped together under the same level. For example, all commandsthat display information about the device system and system software are groupedunder the show command, and all commands that display information about therouting table are grouped under the show route command. Figure 2 on page 20illustrates a portion of the show command hierarchy.
Figure 2: CLI Command Hierarchy Example
20 ■ Using the Command-Line Interface
JUNOS Software Administration Guide

To execute a command, you enter the full command name, starting at the top levelof the hierarchy. For example, to display a brief view of the routes in the routingtable, use the command show route brief.
The hierarchical organization results in commands that have a regular syntax andprovides the following features that simplify CLI use:
■ Consistent command names—Commands that provide the same type of functionhave the same name, regardless of the portion of the software they are operatingon. For example, all show commands display software information and statistics,and all clear commands erase various types of system information.
■ Lists and short descriptions of available commands—Information about availablecommands is provided at each level of the CLI command hierarchy. If you typea question mark (?) at any level, you see a list of the available commands alongwith a short description of each command.
■ Command completion—Command completion for command names (keywords)and command options is also available at each level of the hierarchy. If you typea partial command name followed immediately by a question mark (with nointervening space), you see a list of commands that match the partial name youtyped.
Starting the CLI
To start the CLI:
1. Establish a connection with the device:
■ To access the device remotely from the network, enter the command youtypically use to establish a remote connection (such as Telnet or ssh) usingthe device hostname.
■ To access the device through a management device attached to the consoleport, start the terminal application.
■ To access the device through the J-Web interface, select Diagnose>CLITerminal in the J-Web interface. For more information, see the J-WebInterface User Guide.
2. Log in using your username and password.
After you log in, you enter a UNIX shell.
3. Start the CLI.
% cliuser@host>
The presence of the angle bracket (>) prompt indicates the CLI has started. Bydefault, the prompt is preceded by a string that contains your username and thehostname of the router.
To exit the CLI and return to the UNIX shell, enter the quit command.
Using the Command-Line Interface ■ 21
Chapter 2: User Interface Overview
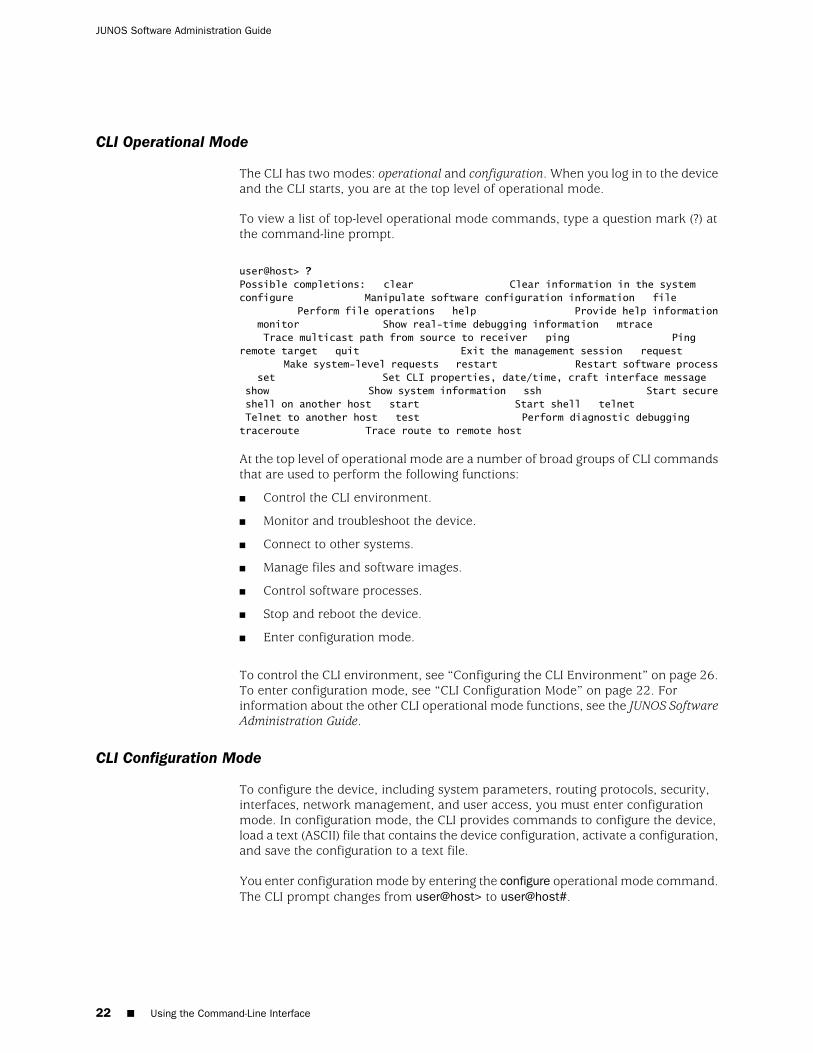
CLI Operational Mode
The CLI has two modes: operational and configuration. When you log in to the deviceand the CLI starts, you are at the top level of operational mode.
To view a list of top-level operational mode commands, type a question mark (?) atthe command-line prompt.
user@host> ?Possible completions: clear Clear information in the system configure Manipulate software configuration information file Perform file operations help Provide help information monitor Show real-time debugging information mtrace Trace multicast path from source to receiver ping Ping remote target quit Exit the management session request Make system-level requests restart Restart software process set Set CLI properties, date/time, craft interface message show Show system information ssh Start secure shell on another host start Start shell telnet Telnet to another host test Perform diagnostic debugging traceroute Trace route to remote host
At the top level of operational mode are a number of broad groups of CLI commandsthat are used to perform the following functions:
■ Control the CLI environment.
■ Monitor and troubleshoot the device.
■ Connect to other systems.
■ Manage files and software images.
■ Control software processes.
■ Stop and reboot the device.
■ Enter configuration mode.
To control the CLI environment, see “Configuring the CLI Environment” on page 26.To enter configuration mode, see “CLI Configuration Mode” on page 22. Forinformation about the other CLI operational mode functions, see the JUNOS SoftwareAdministration Guide.
CLI Configuration Mode
To configure the device, including system parameters, routing protocols, security,interfaces, network management, and user access, you must enter configurationmode. In configuration mode, the CLI provides commands to configure the device,load a text (ASCII) file that contains the device configuration, activate a configuration,and save the configuration to a text file.
You enter configuration mode by entering the configure operational mode command.The CLI prompt changes from user@host> to user@host#.
22 ■ Using the Command-Line Interface
JUNOS Software Administration Guide
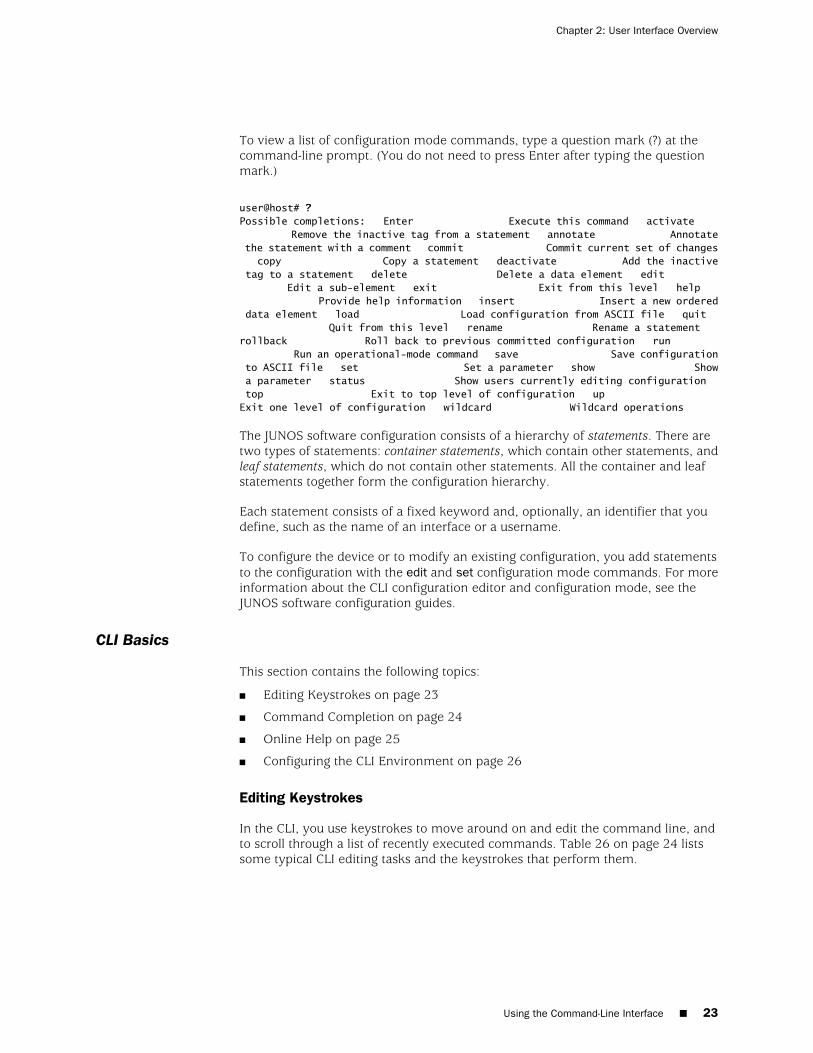
To view a list of configuration mode commands, type a question mark (?) at thecommand-line prompt. (You do not need to press Enter after typing the questionmark.)
user@host# ?Possible completions: Enter Execute this command activate Remove the inactive tag from a statement annotate Annotate the statement with a comment commit Commit current set of changes copy Copy a statement deactivate Add the inactive tag to a statement delete Delete a data element edit Edit a sub-element exit Exit from this level help Provide help information insert Insert a new ordered data element load Load configuration from ASCII file quit Quit from this level rename Rename a statement rollback Roll back to previous committed configuration run Run an operational-mode command save Save configuration to ASCII file set Set a parameter show Show a parameter status Show users currently editing configuration top Exit to top level of configuration up Exit one level of configuration wildcard Wildcard operations
The JUNOS software configuration consists of a hierarchy of statements. There aretwo types of statements: container statements, which contain other statements, andleaf statements, which do not contain other statements. All the container and leafstatements together form the configuration hierarchy.
Each statement consists of a fixed keyword and, optionally, an identifier that youdefine, such as the name of an interface or a username.
To configure the device or to modify an existing configuration, you add statementsto the configuration with the edit and set configuration mode commands. For moreinformation about the CLI configuration editor and configuration mode, see theJUNOS software configuration guides.
CLI Basics
This section contains the following topics:
■ Editing Keystrokes on page 23
■ Command Completion on page 24
■ Online Help on page 25
■ Configuring the CLI Environment on page 26
Editing Keystrokes
In the CLI, you use keystrokes to move around on and edit the command line, andto scroll through a list of recently executed commands. Table 26 on page 24 listssome typical CLI editing tasks and the keystrokes that perform them.
Using the Command-Line Interface ■ 23
Chapter 2: User Interface Overview
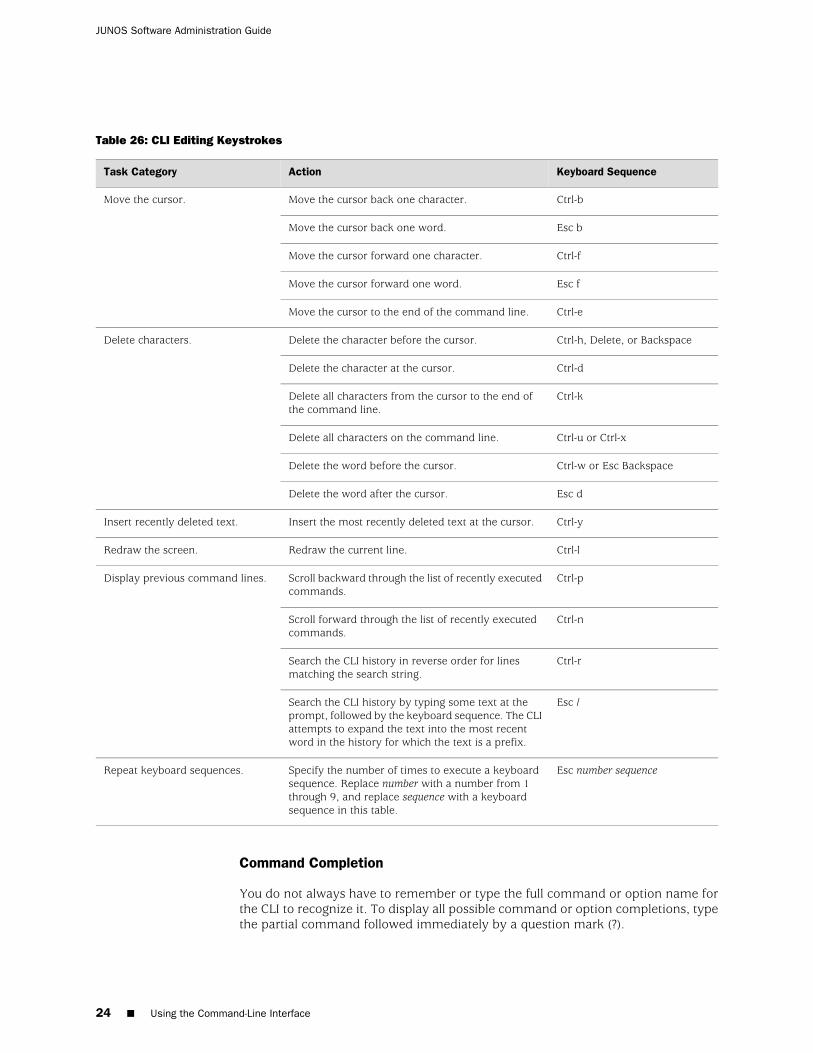
Table 26: CLI Editing Keystrokes
Keyboard SequenceActionTask Category
Ctrl-bMove the cursor back one character.Move the cursor.
Esc bMove the cursor back one word.
Ctrl-fMove the cursor forward one character.
Esc fMove the cursor forward one word.
Ctrl-eMove the cursor to the end of the command line.
Ctrl-h, Delete, or BackspaceDelete the character before the cursor.Delete characters.
Ctrl-dDelete the character at the cursor.
Ctrl-kDelete all characters from the cursor to the end ofthe command line.
Ctrl-u or Ctrl-xDelete all characters on the command line.
Ctrl-w or Esc BackspaceDelete the word before the cursor.
Esc dDelete the word after the cursor.
Ctrl-yInsert the most recently deleted text at the cursor.Insert recently deleted text.
Ctrl-lRedraw the current line.Redraw the screen.
Ctrl-pScroll backward through the list of recently executedcommands.
Display previous command lines.
Ctrl-nScroll forward through the list of recently executedcommands.
Ctrl-rSearch the CLI history in reverse order for linesmatching the search string.
Esc /Search the CLI history by typing some text at theprompt, followed by the keyboard sequence. The CLIattempts to expand the text into the most recentword in the history for which the text is a prefix.
Esc number sequenceSpecify the number of times to execute a keyboardsequence. Replace number with a number from 1through 9, and replace sequence with a keyboardsequence in this table.
Repeat keyboard sequences.
Command Completion
You do not always have to remember or type the full command or option name forthe CLI to recognize it. To display all possible command or option completions, typethe partial command followed immediately by a question mark (?).
24 ■ Using the Command-Line Interface
JUNOS Software Administration Guide

To complete a command or option that you have partially typed, press Tab orSpacebar. If the partially typed letters uniquely identify a command, the completecommand name appears. Otherwise, a message indicates that your entry is ambiguousor invalid. Possible command completions are displayed if your entry is ambiguous.
You can also use command completion on filenames and usernames. To display allpossible values, type one or more characters followed immediately by a questionmark. To complete these partial entries, press Tab only. Pressing Spacebar does notwork.
Online Help
The CLI provides context-sensitive Help at every level of the command hierarchy.The Help information tells you which commands are available at the current level inthe hierarchy and provides a brief description of each.
To get help while in the CLI, type a question mark (?) in one of the following ways:
■ Type a question mark at the command-line prompt. The CLI lists the availablecommands and options. For examples, see “CLI Operational Mode” on page 22and “CLI Configuration Mode” on page 22.
■ Type a question mark after entering the complete name of a command orcommand option. The CLI lists the available commands and options, thenredisplays the command names and options that you typed:
user@host# set schedulers ?
regress@arcona# set schedulers ?Possible completions:+ apply-groups Groups from which to inherit configuration data+ apply-groups-except Don't inherit configuration data from these groups> scheduler Scheduler configuration[edit]user@host# set schedulers
■ Type a question mark in the middle of a command name. The CLI lists possiblecommand completions that match the letters you have entered so far, thenredisplays the letters that you typed. For example, to list all operational modecommands that start with the letter s, type the following:
user@host> s?
Possible completions: set Set CLI properties, date/time, craft interface message show Show system information ssh Start secure shell on another host start Start shelluser@host> s
When you enter the help commands described in Table 27 on page 26, the CLIdisplays usage guidelines and summary information for configuration statements
Using the Command-Line Interface ■ 25
Chapter 2: User Interface Overview
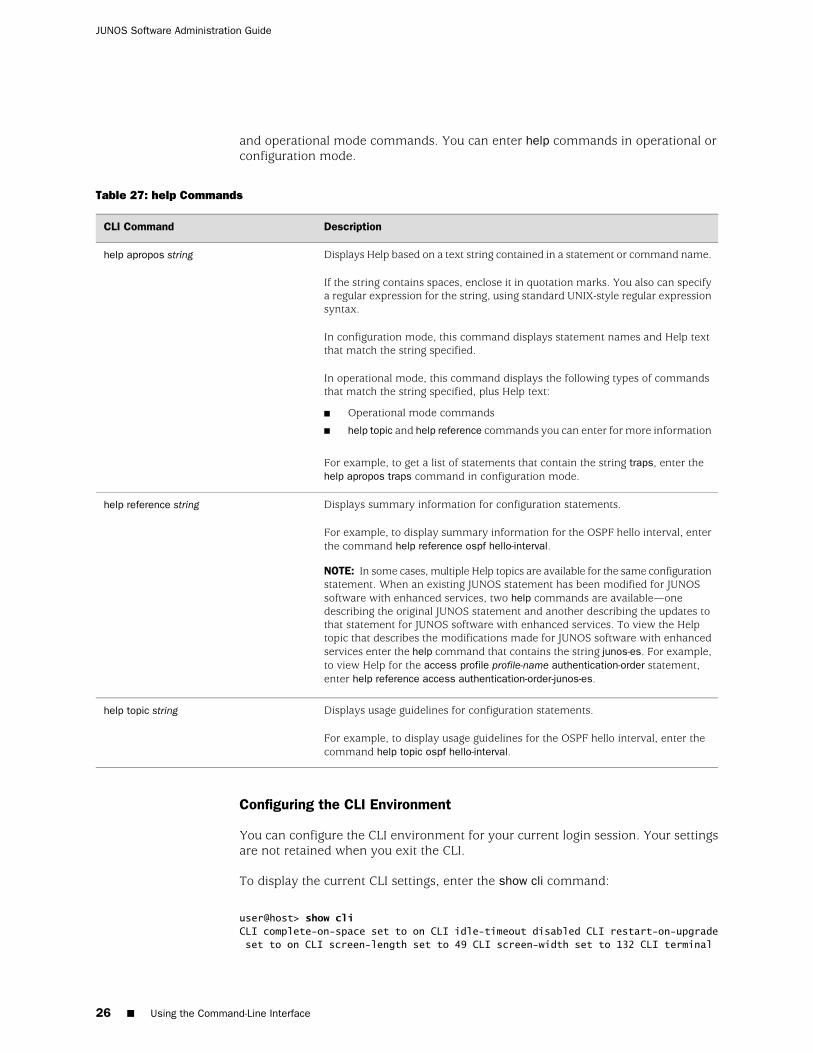
and operational mode commands. You can enter help commands in operational orconfiguration mode.
Table 27: help Commands
DescriptionCLI Command
Displays Help based on a text string contained in a statement or command name.
If the string contains spaces, enclose it in quotation marks. You also can specifya regular expression for the string, using standard UNIX-style regular expressionsyntax.
In configuration mode, this command displays statement names and Help textthat match the string specified.
In operational mode, this command displays the following types of commandsthat match the string specified, plus Help text:
■ Operational mode commands
■ help topic and help reference commands you can enter for more information
For example, to get a list of statements that contain the string traps, enter thehelp apropos traps command in configuration mode.
help apropos string
Displays summary information for configuration statements.
For example, to display summary information for the OSPF hello interval, enterthe command help reference ospf hello-interval.
NOTE: In some cases, multiple Help topics are available for the same configurationstatement. When an existing JUNOS statement has been modified for JUNOSsoftware with enhanced services, two help commands are available—onedescribing the original JUNOS statement and another describing the updates tothat statement for JUNOS software with enhanced services. To view the Helptopic that describes the modifications made for JUNOS software with enhancedservices enter the help command that contains the string junos-es. For example,to view Help for the access profile profile-name authentication-order statement,enter help reference access authentication-order-junos-es.
help reference string
Displays usage guidelines for configuration statements.
For example, to display usage guidelines for the OSPF hello interval, enter thecommand help topic ospf hello-interval.
help topic string
Configuring the CLI Environment
You can configure the CLI environment for your current login session. Your settingsare not retained when you exit the CLI.
To display the current CLI settings, enter the show cli command:
user@host> show cliCLI complete-on-space set to on CLI idle-timeout disabled CLI restart-on-upgrade set to on CLI screen-length set to 49 CLI screen-width set to 132 CLI terminal
26 ■ Using the Command-Line Interface
JUNOS Software Administration Guide
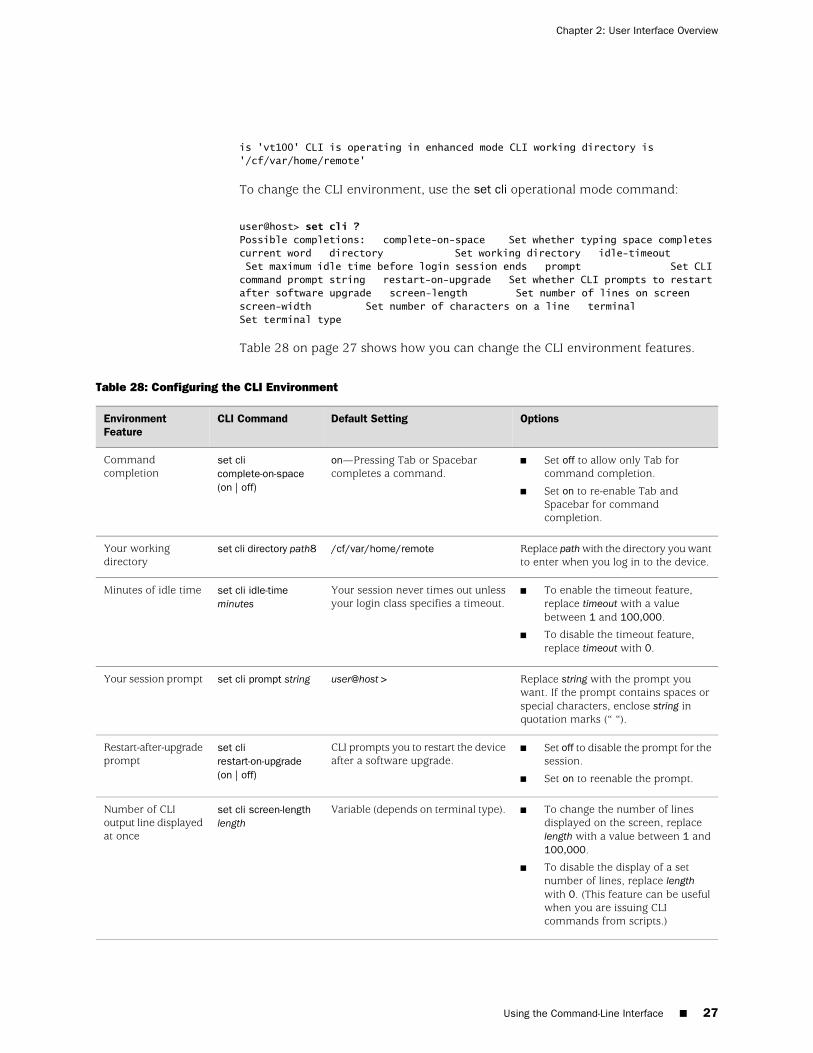
is 'vt100' CLI is operating in enhanced mode CLI working directory is '/cf/var/home/remote'
To change the CLI environment, use the set cli operational mode command:
user@host> set cli ?Possible completions: complete-on-space Set whether typing space completes current word directory Set working directory idle-timeout Set maximum idle time before login session ends prompt Set CLI command prompt string restart-on-upgrade Set whether CLI prompts to restart after software upgrade screen-length Set number of lines on screen screen-width Set number of characters on a line terminal Set terminal type
Table 28 on page 27 shows how you can change the CLI environment features.
Table 28: Configuring the CLI Environment
OptionsDefault SettingCLI CommandEnvironmentFeature
■ Set off to allow only Tab forcommand completion.
■ Set on to re-enable Tab andSpacebar for commandcompletion.
on—Pressing Tab or Spacebarcompletes a command.
set clicomplete-on-space(on | off)
Commandcompletion
Replace path with the directory you wantto enter when you log in to the device.
/cf/var/home/remoteset cli directory path8Your workingdirectory
■ To enable the timeout feature,replace timeout with a valuebetween 1 and 100,000.
■ To disable the timeout feature,replace timeout with 0.
Your session never times out unlessyour login class specifies a timeout.
set cli idle-timeminutes
Minutes of idle time
Replace string with the prompt youwant. If the prompt contains spaces orspecial characters, enclose string inquotation marks (“ “).
user@host>set cli prompt stringYour session prompt
■ Set off to disable the prompt for thesession.
■ Set on to reenable the prompt.
CLI prompts you to restart the deviceafter a software upgrade.
set clirestart-on-upgrade(on | off)
Restart-after-upgradeprompt
■ To change the number of linesdisplayed on the screen, replacelength with a value between 1 and100,000.
■ To disable the display of a setnumber of lines, replace lengthwith 0. (This feature can be usefulwhen you are issuing CLIcommands from scripts.)
Variable (depends on terminal type).set cli screen-lengthlength
Number of CLIoutput line displayedat once
Using the Command-Line Interface ■ 27
Chapter 2: User Interface Overview
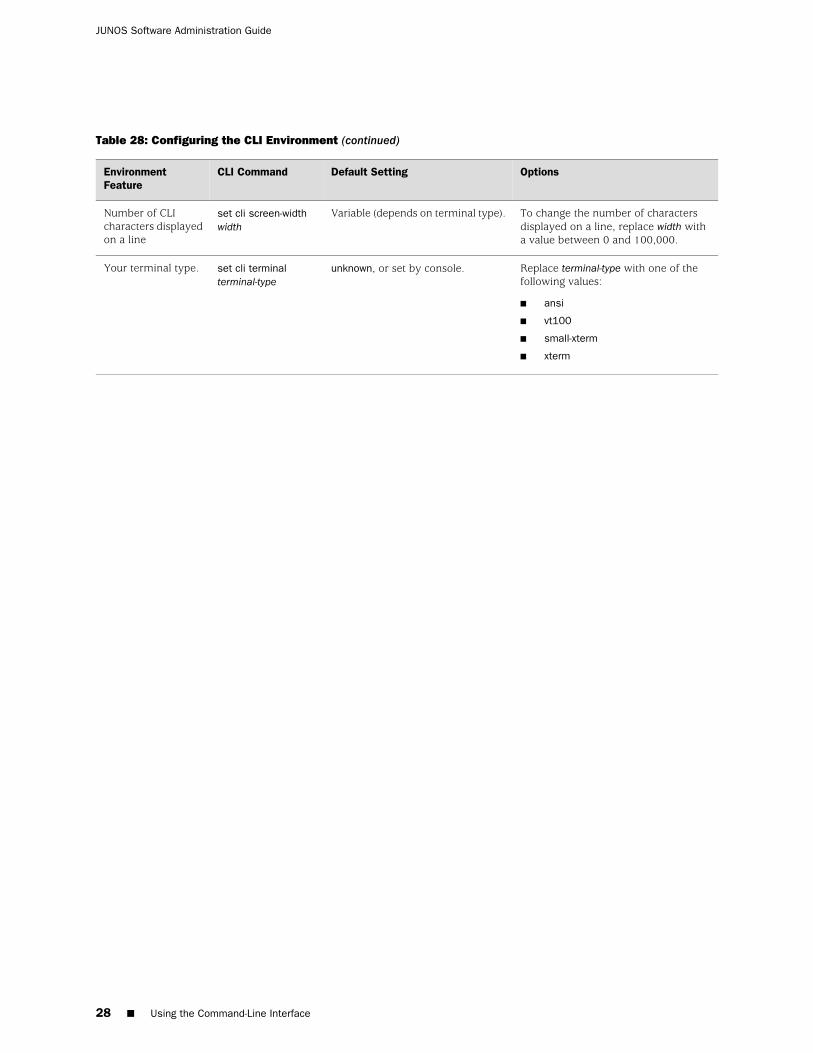
Table 28: Configuring the CLI Environment (continued)
OptionsDefault SettingCLI CommandEnvironmentFeature
To change the number of charactersdisplayed on a line, replace width witha value between 0 and 100,000.
Variable (depends on terminal type).set cli screen-widthwidth
Number of CLIcharacters displayedon a line
Replace terminal-type with one of thefollowing values:
■ ansi
■ vt100
■ small-xterm
■ xterm
unknown, or set by console.set cli terminalterminal-type
Your terminal type.
28 ■ Using the Command-Line Interface
JUNOS Software Administration Guide
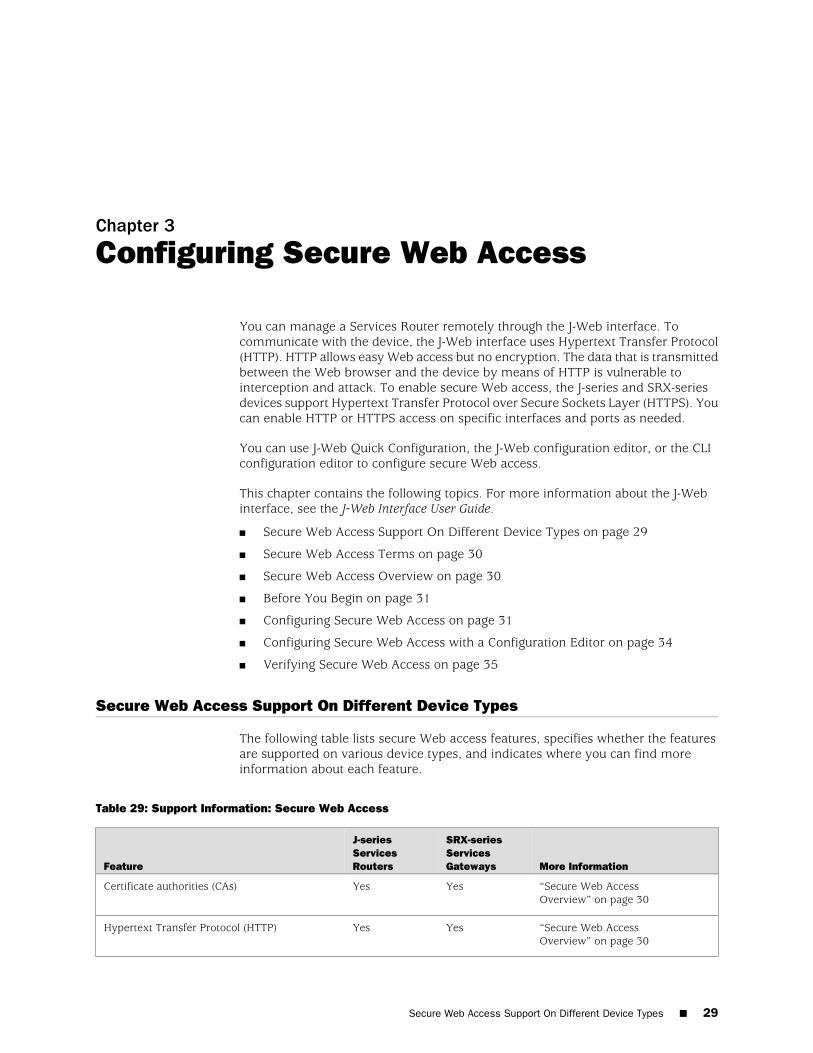
Chapter 3
Configuring Secure Web Access
You can manage a Services Router remotely through the J-Web interface. Tocommunicate with the device, the J-Web interface uses Hypertext Transfer Protocol(HTTP). HTTP allows easy Web access but no encryption. The data that is transmittedbetween the Web browser and the device by means of HTTP is vulnerable tointerception and attack. To enable secure Web access, the J-series and SRX-seriesdevices support Hypertext Transfer Protocol over Secure Sockets Layer (HTTPS). Youcan enable HTTP or HTTPS access on specific interfaces and ports as needed.
You can use J-Web Quick Configuration, the J-Web configuration editor, or the CLIconfiguration editor to configure secure Web access.
This chapter contains the following topics. For more information about the J-Webinterface, see the J-Web Interface User Guide.
■ Secure Web Access Support On Different Device Types on page 29
■ Secure Web Access Terms on page 30
■ Secure Web Access Overview on page 30
■ Before You Begin on page 31
■ Configuring Secure Web Access on page 31
■ Configuring Secure Web Access with a Configuration Editor on page 34
■ Verifying Secure Web Access on page 35
Secure Web Access Support On Different Device Types
The following table lists secure Web access features, specifies whether the featuresare supported on various device types, and indicates where you can find moreinformation about each feature.
Table 29: Support Information: Secure Web Access
More Information
SRX-seriesServicesGateways
J-seriesServicesRoutersFeature
“Secure Web AccessOverview” on page 30
YesYesCertificate authorities (CAs)
“Secure Web AccessOverview” on page 30
YesYesHypertext Transfer Protocol (HTTP)
Secure Web Access Support On Different Device Types ■ 29
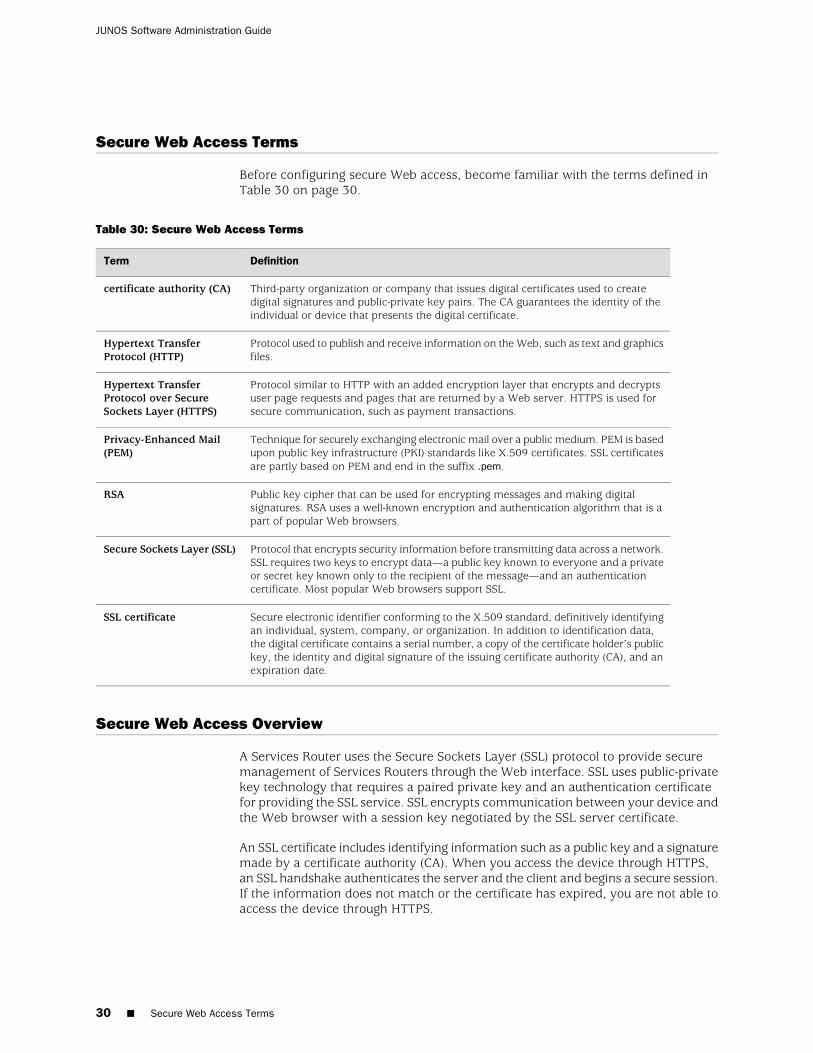
Secure Web Access Terms
Before configuring secure Web access, become familiar with the terms defined inTable 30 on page 30.
Table 30: Secure Web Access Terms
DefinitionTerm
Third-party organization or company that issues digital certificates used to createdigital signatures and public-private key pairs. The CA guarantees the identity of theindividual or device that presents the digital certificate.
certificate authority (CA)
Protocol used to publish and receive information on the Web, such as text and graphicsfiles.
Hypertext TransferProtocol (HTTP)
Protocol similar to HTTP with an added encryption layer that encrypts and decryptsuser page requests and pages that are returned by a Web server. HTTPS is used forsecure communication, such as payment transactions.
Hypertext TransferProtocol over SecureSockets Layer (HTTPS)
Technique for securely exchanging electronic mail over a public medium. PEM is basedupon public key infrastructure (PKI) standards like X.509 certificates. SSL certificatesare partly based on PEM and end in the suffix .pem.
Privacy-Enhanced Mail(PEM)
Public key cipher that can be used for encrypting messages and making digitalsignatures. RSA uses a well-known encryption and authentication algorithm that is apart of popular Web browsers.
RSA
Protocol that encrypts security information before transmitting data across a network.SSL requires two keys to encrypt data—a public key known to everyone and a privateor secret key known only to the recipient of the message—and an authenticationcertificate. Most popular Web browsers support SSL.
Secure Sockets Layer (SSL)
Secure electronic identifier conforming to the X.509 standard, definitively identifyingan individual, system, company, or organization. In addition to identification data,the digital certificate contains a serial number, a copy of the certificate holder’s publickey, the identity and digital signature of the issuing certificate authority (CA), and anexpiration date.
SSL certificate
Secure Web Access Overview
A Services Router uses the Secure Sockets Layer (SSL) protocol to provide securemanagement of Services Routers through the Web interface. SSL uses public-privatekey technology that requires a paired private key and an authentication certificatefor providing the SSL service. SSL encrypts communication between your device andthe Web browser with a session key negotiated by the SSL server certificate.
An SSL certificate includes identifying information such as a public key and a signaturemade by a certificate authority (CA). When you access the device through HTTPS,an SSL handshake authenticates the server and the client and begins a secure session.If the information does not match or the certificate has expired, you are not able toaccess the device through HTTPS.
30 ■ Secure Web Access Terms
JUNOS Software Administration Guide
Without SSL encryption, communication between your device and the browser issent in the open and can be intercepted. We recommend that you enable HTTPSaccess on your WAN interfaces.
HTTP access is enabled by default on the built-in management interfaces. By default,HTTPS access is supported on any interface with an SSL server certificate.
Before You Begin
Before you begin initial configuration, complete the following tasks:
■ Establish basic connectivity. See the Getting Started Guide for your device.
■ Obtain an SSL certificate from a trusted signing authority. See “Generating SSLCertificates” on page 31.
Generating SSL Certificates
To enable secure Web access, you must first generate a digital SSL certificate, andthen enable HTTPS access on the Services Router.
To generate an SSL certificate:
1. Enter the following openssl command in your Secure Shell command-lineinterface. The openssl command generates a self-signed SSL certificate in theprivacy-enhanced mail (PEM) format. It writes the certificate and an unencrypted1024-bit RSA private key to the specified file.
% openssl req –x509 –nodes –newkey rsa:1024 –keyout filename.pem -outfilename.pem
Replace filename with the name of a file in which you want the SSL certificateto be written—for example, new.pem.
2. When prompted, type the appropriate information in the identification form.For example, type US for the country name.
3. Display the contents of the file new.pem.
cat new.pem
Copy the contents of this file for installing the SSL certificate.
You can use either J-Web Quick Configuration or a configuration editor to install theSSL certificate and enable HTTPS.
Configuring Secure Web Access
Navigate to the Secure Access Quick Configuration page by selectingConfiguration>Quick Configuration>Secure Access. On this page, you can enableHTTP and HTTPS access on interfaces for managing devices through the Webinterface. You can also install SSL certificates and enable JUNOScript over SSL withthe Secure Access page.
Before You Begin ■ 31
Chapter 3: Configuring Secure Web Access
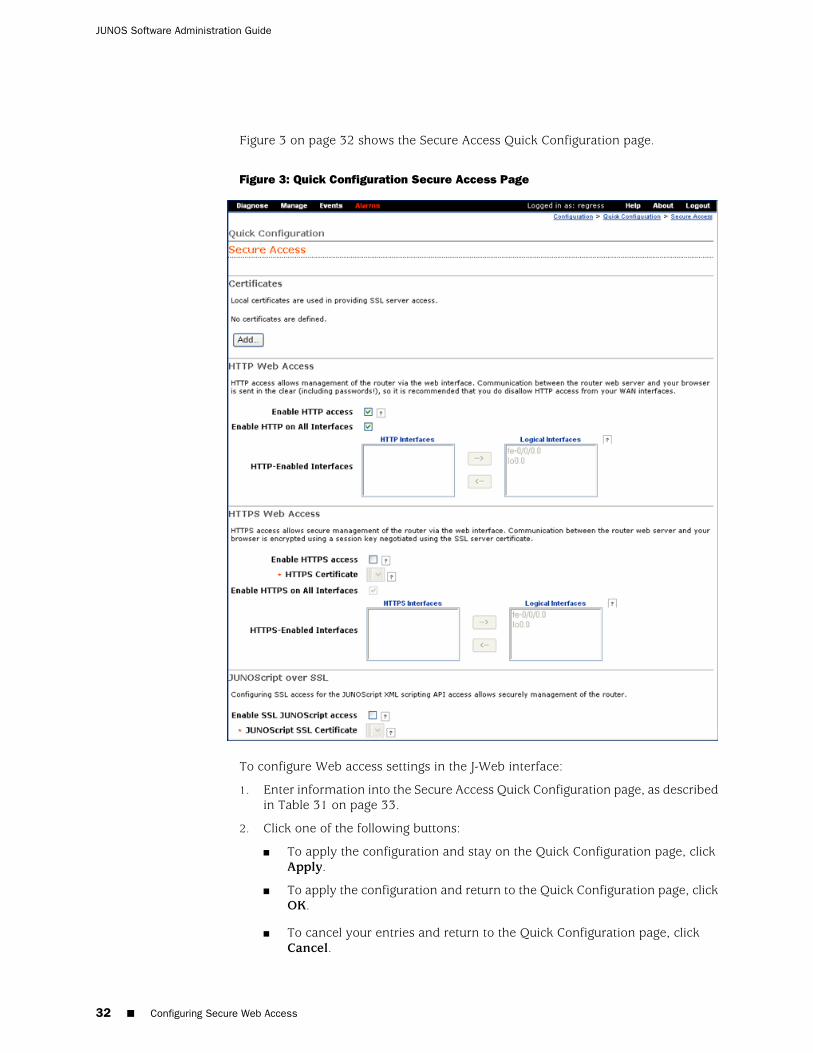
Figure 3 on page 32 shows the Secure Access Quick Configuration page.
Figure 3: Quick Configuration Secure Access Page
To configure Web access settings in the J-Web interface:
1. Enter information into the Secure Access Quick Configuration page, as describedin Table 31 on page 33.
2. Click one of the following buttons:
■ To apply the configuration and stay on the Quick Configuration page, clickApply.
■ To apply the configuration and return to the Quick Configuration page, clickOK.
■ To cancel your entries and return to the Quick Configuration page, clickCancel.
32 ■ Configuring Secure Web Access
JUNOS Software Administration Guide
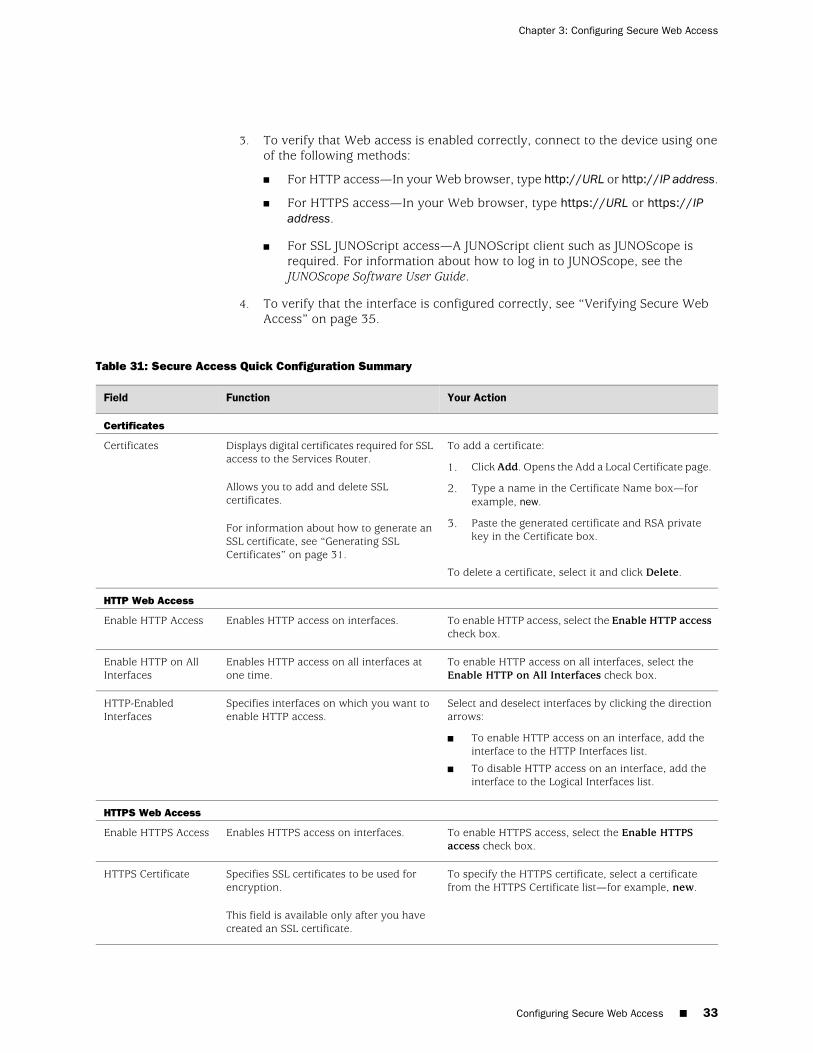
3. To verify that Web access is enabled correctly, connect to the device using oneof the following methods:
■ For HTTP access—In your Web browser, type http://URL or http://IP address.
■ For HTTPS access—In your Web browser, type https://URL or https://IPaddress.
■ For SSL JUNOScript access—A JUNOScript client such as JUNOScope isrequired. For information about how to log in to JUNOScope, see theJUNOScope Software User Guide.
4. To verify that the interface is configured correctly, see “Verifying Secure WebAccess” on page 35.
Table 31: Secure Access Quick Configuration Summary
Your ActionFunctionField
Certificates
To add a certificate:
1. Click Add. Opens the Add a Local Certificate page.
2. Type a name in the Certificate Name box—forexample, new.
3. Paste the generated certificate and RSA privatekey in the Certificate box.
To delete a certificate, select it and click Delete.
Displays digital certificates required for SSLaccess to the Services Router.
Allows you to add and delete SSLcertificates.
For information about how to generate anSSL certificate, see “Generating SSLCertificates” on page 31.
Certificates
HTTP Web Access
To enable HTTP access, select the Enable HTTP accesscheck box.
Enables HTTP access on interfaces.Enable HTTP Access
To enable HTTP access on all interfaces, select theEnable HTTP on All Interfaces check box.
Enables HTTP access on all interfaces atone time.
Enable HTTP on AllInterfaces
Select and deselect interfaces by clicking the directionarrows:
■ To enable HTTP access on an interface, add theinterface to the HTTP Interfaces list.
■ To disable HTTP access on an interface, add theinterface to the Logical Interfaces list.
Specifies interfaces on which you want toenable HTTP access.
HTTP-EnabledInterfaces
HTTPS Web Access
To enable HTTPS access, select the Enable HTTPSaccess check box.
Enables HTTPS access on interfaces.Enable HTTPS Access
To specify the HTTPS certificate, select a certificatefrom the HTTPS Certificate list—for example, new.
Specifies SSL certificates to be used forencryption.
This field is available only after you havecreated an SSL certificate.
HTTPS Certificate
Configuring Secure Web Access ■ 33
Chapter 3: Configuring Secure Web Access
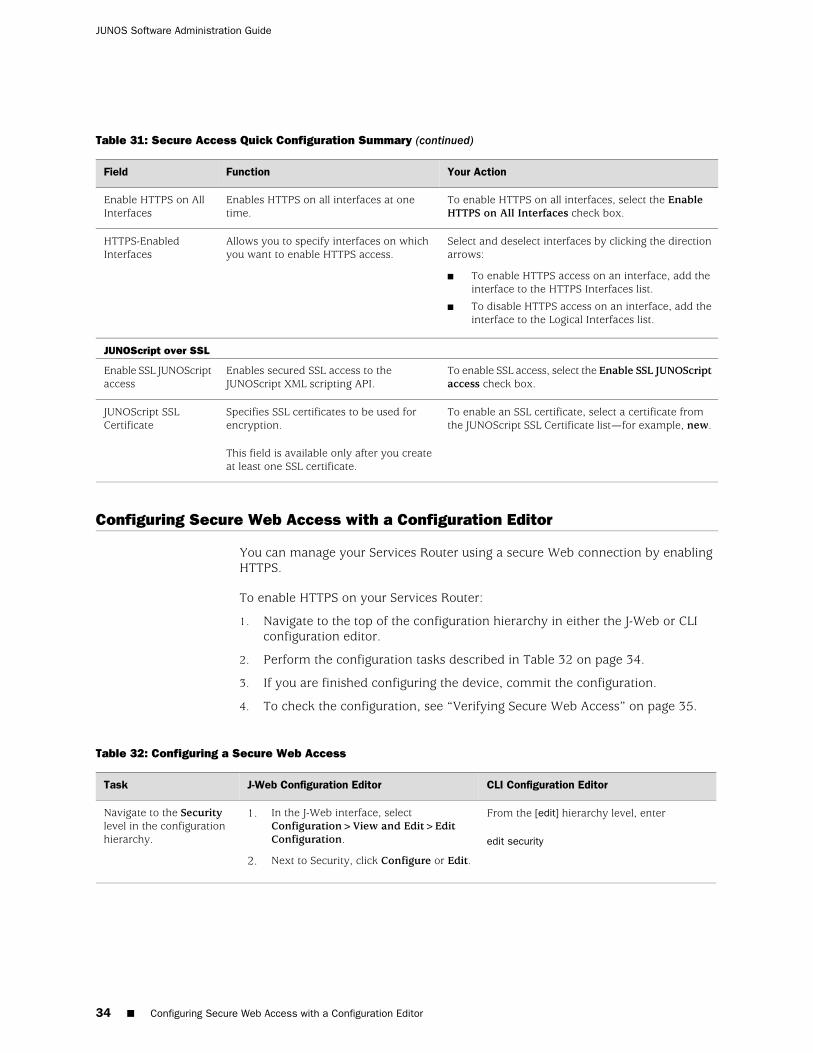
Table 31: Secure Access Quick Configuration Summary (continued)
Your ActionFunctionField
To enable HTTPS on all interfaces, select the EnableHTTPS on All Interfaces check box.
Enables HTTPS on all interfaces at onetime.
Enable HTTPS on AllInterfaces
Select and deselect interfaces by clicking the directionarrows:
■ To enable HTTPS access on an interface, add theinterface to the HTTPS Interfaces list.
■ To disable HTTPS access on an interface, add theinterface to the Logical Interfaces list.
Allows you to specify interfaces on whichyou want to enable HTTPS access.
HTTPS-EnabledInterfaces
JUNOScript over SSL
To enable SSL access, select the Enable SSL JUNOScriptaccess check box.
Enables secured SSL access to theJUNOScript XML scripting API.
Enable SSL JUNOScriptaccess
To enable an SSL certificate, select a certificate fromthe JUNOScript SSL Certificate list—for example, new.
Specifies SSL certificates to be used forencryption.
This field is available only after you createat least one SSL certificate.
JUNOScript SSLCertificate
Configuring Secure Web Access with a Configuration Editor
You can manage your Services Router using a secure Web connection by enablingHTTPS.
To enable HTTPS on your Services Router:
1. Navigate to the top of the configuration hierarchy in either the J-Web or CLIconfiguration editor.
2. Perform the configuration tasks described in Table 32 on page 34.
3. If you are finished configuring the device, commit the configuration.
4. To check the configuration, see “Verifying Secure Web Access” on page 35.
Table 32: Configuring a Secure Web Access
CLI Configuration EditorJ-Web Configuration EditorTask
From the [edit] hierarchy level, enter
edit security
1. In the J-Web interface, selectConfiguration>View and Edit>EditConfiguration.
2. Next to Security, click Configure or Edit.
Navigate to the Securitylevel in the configurationhierarchy.
34 ■ Configuring Secure Web Access with a Configuration Editor
JUNOS Software Administration Guide
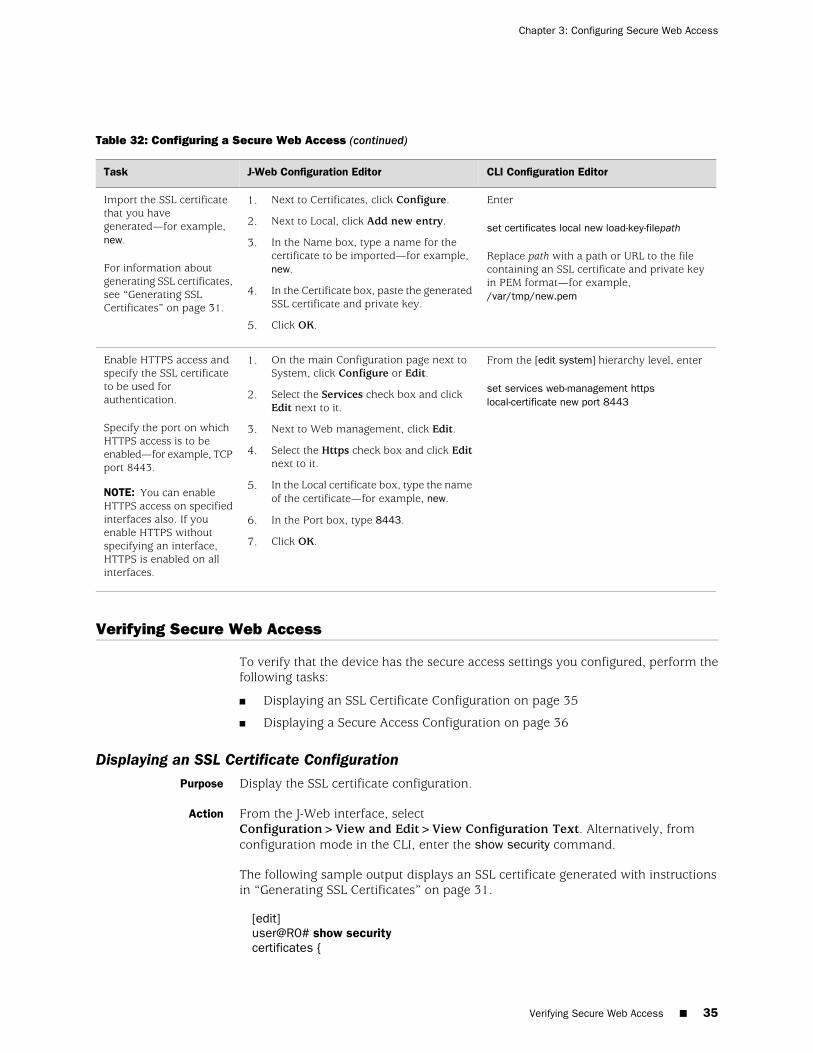
Table 32: Configuring a Secure Web Access (continued)
CLI Configuration EditorJ-Web Configuration EditorTask
Enter
set certificates local new load-key-filepath
Replace path with a path or URL to the filecontaining an SSL certificate and private keyin PEM format—for example,/var/tmp/new.pem
1. Next to Certificates, click Configure.
2. Next to Local, click Add new entry.
3. In the Name box, type a name for thecertificate to be imported—for example,new.
4. In the Certificate box, paste the generatedSSL certificate and private key.
5. Click OK.
Import the SSL certificatethat you havegenerated—for example,new.
For information aboutgenerating SSL certificates,see “Generating SSLCertificates” on page 31.
From the [edit system] hierarchy level, enter
set services web-management httpslocal-certificate new port 8443
1. On the main Configuration page next toSystem, click Configure or Edit.
2. Select the Services check box and clickEdit next to it.
3. Next to Web management, click Edit.
4. Select the Https check box and click Editnext to it.
5. In the Local certificate box, type the nameof the certificate—for example, new.
6. In the Port box, type 8443.
7. Click OK.
Enable HTTPS access andspecify the SSL certificateto be used forauthentication.
Specify the port on whichHTTPS access is to beenabled—for example, TCPport 8443.
NOTE: You can enableHTTPS access on specifiedinterfaces also. If youenable HTTPS withoutspecifying an interface,HTTPS is enabled on allinterfaces.
Verifying Secure Web Access
To verify that the device has the secure access settings you configured, perform thefollowing tasks:
■ Displaying an SSL Certificate Configuration on page 35
■ Displaying a Secure Access Configuration on page 36
Displaying an SSL Certificate ConfigurationPurpose Display the SSL certificate configuration.
Action From the J-Web interface, selectConfiguration>View and Edit>View Configuration Text. Alternatively, fromconfiguration mode in the CLI, enter the show security command.
The following sample output displays an SSL certificate generated with instructionsin “Generating SSL Certificates” on page 31.
[edit]user@R0# show securitycertificates {
Verifying Secure Web Access ■ 35
Chapter 3: Configuring Secure Web Access
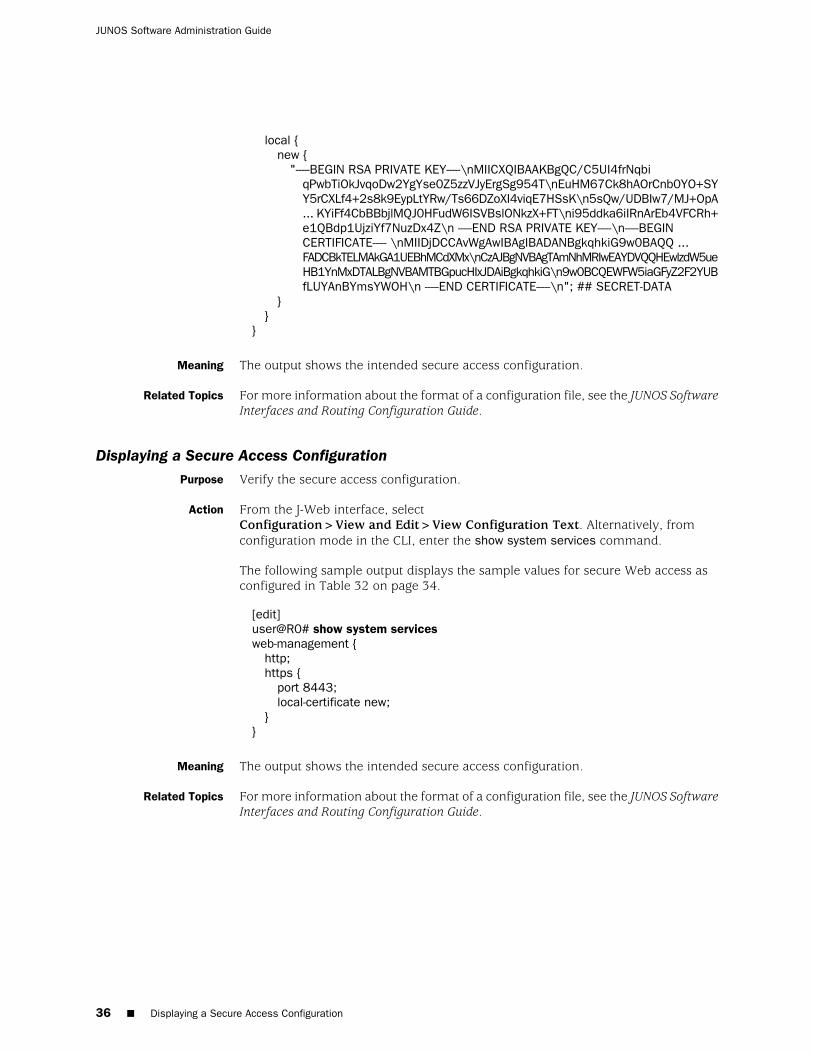
local {new {
"-----BEGIN RSA PRIVATE KEY-----\nMIICXQIBAAKBgQC/C5UI4frNqbiqPwbTiOkJvqoDw2YgYse0Z5zzVJyErgSg954T\nEuHM67Ck8hAOrCnb0YO+SYY5rCXLf4+2s8k9EypLtYRw/Ts66DZoXI4viqE7HSsK\n5sQw/UDBIw7/MJ+OpA... KYiFf4CbBBbjlMQJ0HFudW6ISVBslONkzX+FT\ni95ddka6iIRnArEb4VFCRh+e1QBdp1UjziYf7NuzDx4Z\n -----END RSA PRIVATE KEY-----\n-----BEGINCERTIFICATE----- \nMIIDjDCCAvWgAwIBAgIBADANBgkqhkiG9w0BAQQ ...FADCBkTELMAkGA1UEBhMCdXMx\nCzAJBgNVBAgTAmNhMRIwEAYDVQQHEwlzdW5ueHB1YnMxDTALBgNVBAMTBGpucHIxJDAiBgkqhkiG\n9w0BCQEWFW5iaGFyZ2F2YUBfLUYAnBYmsYWOH\n -----END CERTIFICATE-----\n"; ## SECRET-DATA
}}
}
Meaning The output shows the intended secure access configuration.
Related Topics For more information about the format of a configuration file, see the JUNOS SoftwareInterfaces and Routing Configuration Guide.
Displaying a Secure Access ConfigurationPurpose Verify the secure access configuration.
Action From the J-Web interface, selectConfiguration>View and Edit>View Configuration Text. Alternatively, fromconfiguration mode in the CLI, enter the show system services command.
The following sample output displays the sample values for secure Web access asconfigured in Table 32 on page 34.
[edit]user@R0# show system servicesweb-management {
http;https {
port 8443;local-certificate new;
}}
Meaning The output shows the intended secure access configuration.
Related Topics For more information about the format of a configuration file, see the JUNOS SoftwareInterfaces and Routing Configuration Guide.
36 ■ Displaying a Secure Access Configuration
JUNOS Software Administration Guide
Chapter 4
Managing Administrator Authentication
You can use either J-Web Quick Configuration or a configuration editor to managesystem functions, including RADIUS and TACACS+ servers, and user login accounts.
NOTE: In this chapter, user authentication refers to administrator authentication.For information about firewall user authentication, see the JUNOS Software SecurityConfiguration Guide.
This chapter contains the following topics. For more information about systemmanagement, see the JUNOS System Basics Configuration Guide.
■ Administrator Authentication Support On Different Device Types on page 37
■ User Authentication Terms on page 38
■ User Authentication Overview on page 38
■ Before You Begin on page 42
■ Managing User Authentication with Quick Configuration on page 42
■ Managing User Authentication with a Configuration Editor on page 48
■ Securing the Console Port on page 57
■ Accessing Remote Devices with the CLI on page 58
■ Configuring Password Retry Limits for Telnet and SSH Access on page 60
Administrator Authentication Support On Different Device Types
The following table lists administrator authentication features, specifies whether thefeatures are supported on various device types, and indicates where you can findmore information about each feature.
Table 33: Support Information: Administrator Authentication
More Information
SRX-seriesServicesGateways
J-seriesServicesRoutersFeature
“User AuthenticationOverview” on page 38
YesYesRADIUS
Administrator Authentication Support On Different Device Types ■ 37
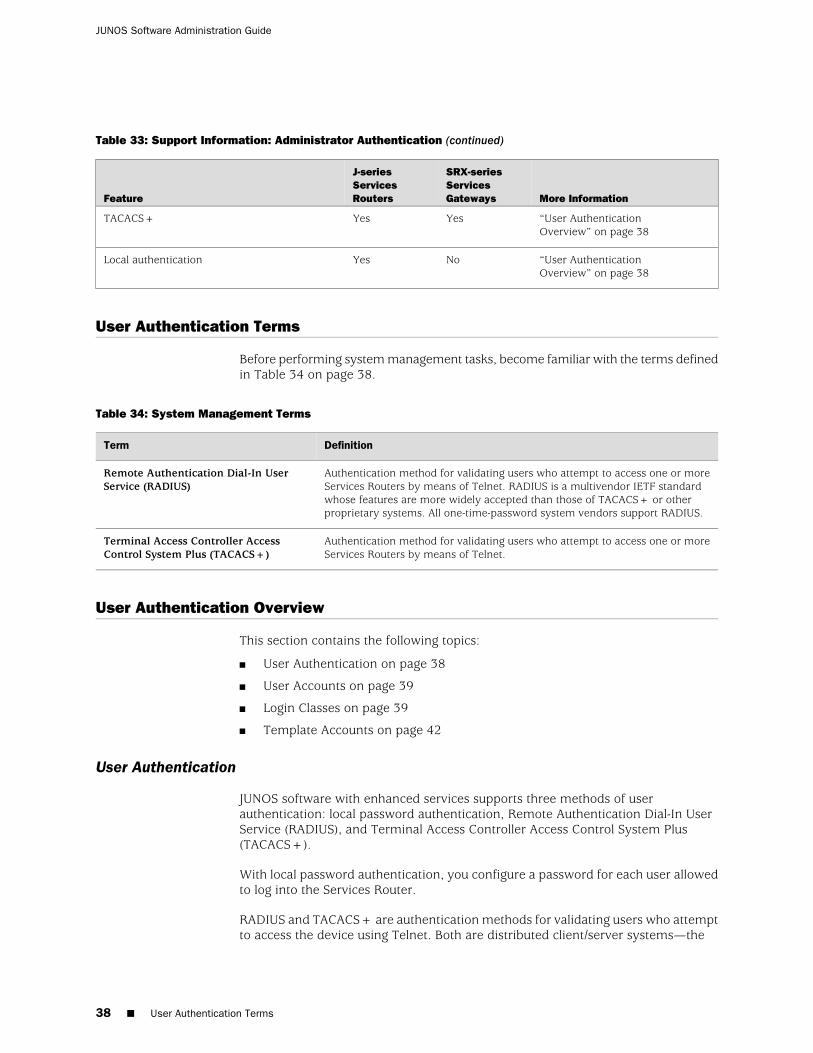
Table 33: Support Information: Administrator Authentication (continued)
More Information
SRX-seriesServicesGateways
J-seriesServicesRoutersFeature
“User AuthenticationOverview” on page 38
YesYesTACACS+
“User AuthenticationOverview” on page 38
NoYesLocal authentication
User Authentication Terms
Before performing system management tasks, become familiar with the terms definedin Table 34 on page 38.
Table 34: System Management Terms
DefinitionTerm
Authentication method for validating users who attempt to access one or moreServices Routers by means of Telnet. RADIUS is a multivendor IETF standardwhose features are more widely accepted than those of TACACS+ or otherproprietary systems. All one-time-password system vendors support RADIUS.
Remote Authentication Dial-In UserService (RADIUS)
Authentication method for validating users who attempt to access one or moreServices Routers by means of Telnet.
Terminal Access Controller AccessControl System Plus (TACACS+)
User Authentication Overview
This section contains the following topics:
■ User Authentication on page 38
■ User Accounts on page 39
■ Login Classes on page 39
■ Template Accounts on page 42
User Authentication
JUNOS software with enhanced services supports three methods of userauthentication: local password authentication, Remote Authentication Dial-In UserService (RADIUS), and Terminal Access Controller Access Control System Plus(TACACS+).
With local password authentication, you configure a password for each user allowedto log into the Services Router.
RADIUS and TACACS+ are authentication methods for validating users who attemptto access the device using Telnet. Both are distributed client/server systems—the
38 ■ User Authentication Terms
JUNOS Software Administration Guide

RADIUS and TACACS+ clients run on the device, and the server runs on a remotenetwork system.
You can configure the device to use RADIUS or TACACS+ authentication, or both,to validate users who attempt to access the device. If you set up both authenticationmethods, you also can configure which the device will try first.
User Accounts
User accounts provide one way for users to access the Services Router. Users canaccess the device without accounts if you configured RADIUS or TACACS+ servers,as described in “Managing User Authentication with Quick Configuration” on page 42 and “Managing User Authentication with a Configuration Editor” on page 48.After you have created an account, the device creates a home directory for the user.An account for the user root is always present in the configuration. For informationabout configuring the password for the user root, see the JUNOS SoftwareAdministration Guide. For each user account, you can define the following:
■ Username—Name that identifies the user. It must be unique within the device.Do not include spaces, colons, or commas in the username.
■ User's full name—If the full name contains spaces, enclose it in quotation marks(“ ”). Do not include colons or commas.
■ User identifier (UID)—Numeric identifier that is associated with the user accountname. The identifier must be in the range 100 through 64000 and must be uniquewithin the device. If you do not assign a UID to a username, the software assignsone when you commit the configuration, preferring the lowest available number.
■ User's access privilege—You can create login classes with specific permissionbits or use one of the default classes listed in Table 35 on page 40.
■ Authentication method or methods and passwords that the user can use to accessthe device—You can use SSH or an MD5 password, or you can enter a plain-textpassword that JUNOS software with enhanced services encrypts using MD5-styleencryption before entering it in the password database. If you configure theplain-text-password option, you are prompted to enter and confirm the password.
Login Classes
All users who log into the Services Router must be in a login class. You can defineany number of login classes. You then apply one login class to an individual useraccount. With login classes, you define the following:
■ Access privileges users have when they are logged into the device. For moreinformation, see “Permission Bits” on page 40.
■ Commands and statements that users can and cannot specify. For moreinformation, see “Denying or Allowing Individual Commands” on page 42.
■ How long a login session can be idle before it times out and the user is loggedoff.
The software contains a few predefined login classes, which are listed inTable 35 on page 40. The predefined login classes cannot be modified.
User Authentication Overview ■ 39
Chapter 4: Managing Administrator Authentication
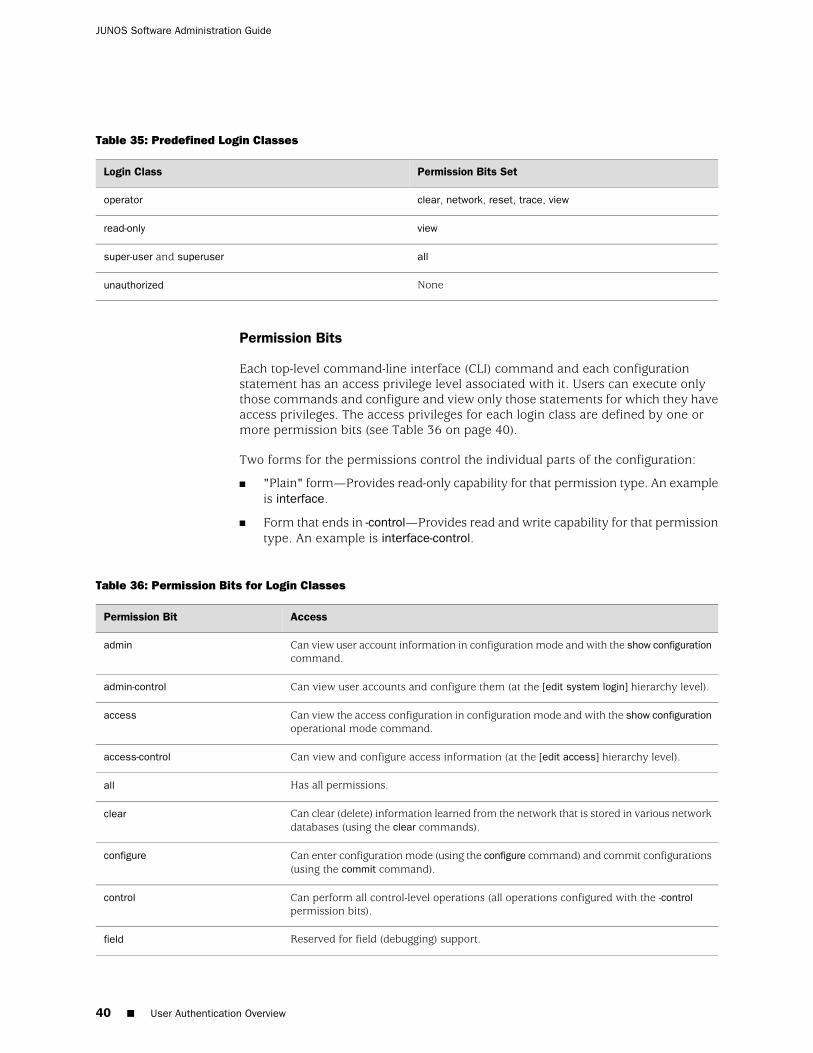
Table 35: Predefined Login Classes
Permission Bits SetLogin Class
clear, network, reset, trace, viewoperator
viewread-only
allsuper-user and superuser
Noneunauthorized
Permission Bits
Each top-level command-line interface (CLI) command and each configurationstatement has an access privilege level associated with it. Users can execute onlythose commands and configure and view only those statements for which they haveaccess privileges. The access privileges for each login class are defined by one ormore permission bits (see Table 36 on page 40).
Two forms for the permissions control the individual parts of the configuration:
■ "Plain" form—Provides read-only capability for that permission type. An exampleis interface.
■ Form that ends in -control—Provides read and write capability for that permissiontype. An example is interface-control.
Table 36: Permission Bits for Login Classes
AccessPermission Bit
Can view user account information in configuration mode and with the show configurationcommand.
admin
Can view user accounts and configure them (at the [edit system login] hierarchy level).admin-control
Can view the access configuration in configuration mode and with the show configurationoperational mode command.
access
Can view and configure access information (at the [edit access] hierarchy level).access-control
Has all permissions.all
Can clear (delete) information learned from the network that is stored in various networkdatabases (using the clear commands).
clear
Can enter configuration mode (using the configure command) and commit configurations(using the commit command).
configure
Can perform all control-level operations (all operations configured with the -controlpermission bits).
control
Reserved for field (debugging) support.field
40 ■ User Authentication Overview
JUNOS Software Administration Guide
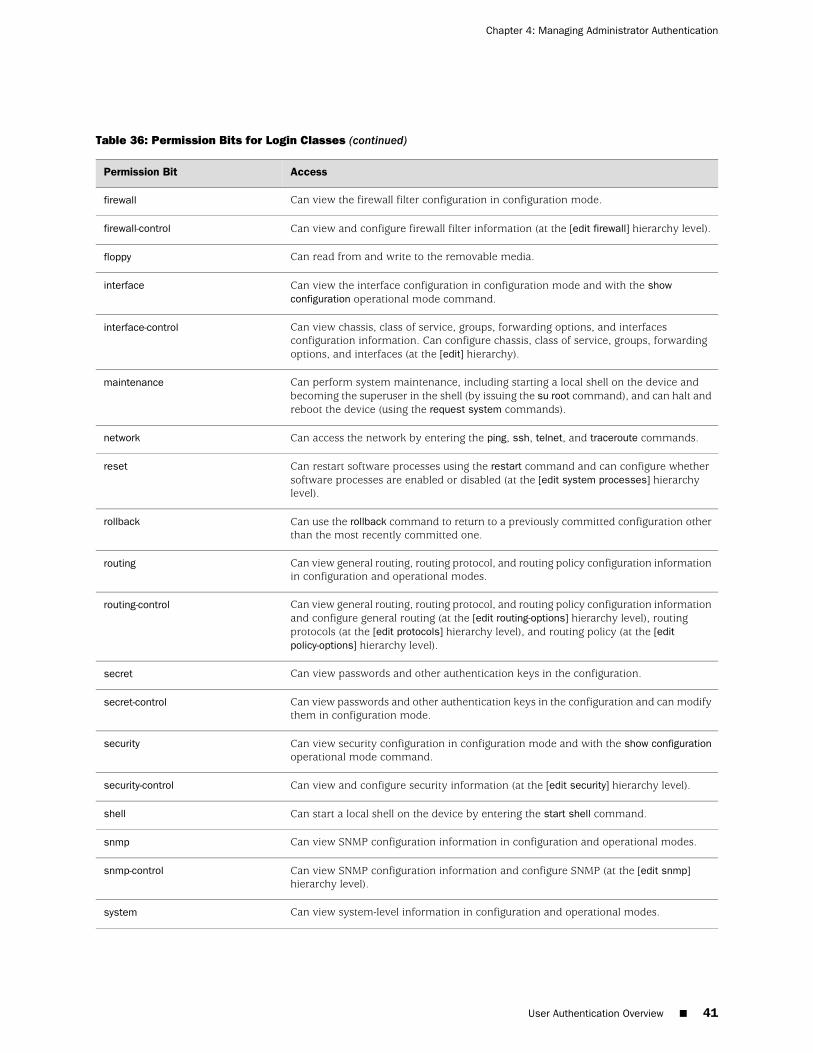
Table 36: Permission Bits for Login Classes (continued)
AccessPermission Bit
Can view the firewall filter configuration in configuration mode.firewall
Can view and configure firewall filter information (at the [edit firewall] hierarchy level).firewall-control
Can read from and write to the removable media.floppy
Can view the interface configuration in configuration mode and with the showconfiguration operational mode command.
interface
Can view chassis, class of service, groups, forwarding options, and interfacesconfiguration information. Can configure chassis, class of service, groups, forwardingoptions, and interfaces (at the [edit] hierarchy).
interface-control
Can perform system maintenance, including starting a local shell on the device andbecoming the superuser in the shell (by issuing the su root command), and can halt andreboot the device (using the request system commands).
maintenance
Can access the network by entering the ping, ssh, telnet, and traceroute commands.network
Can restart software processes using the restart command and can configure whethersoftware processes are enabled or disabled (at the [edit system processes] hierarchylevel).
reset
Can use the rollback command to return to a previously committed configuration otherthan the most recently committed one.
rollback
Can view general routing, routing protocol, and routing policy configuration informationin configuration and operational modes.
routing
Can view general routing, routing protocol, and routing policy configuration informationand configure general routing (at the [edit routing-options] hierarchy level), routingprotocols (at the [edit protocols] hierarchy level), and routing policy (at the [editpolicy-options] hierarchy level).
routing-control
Can view passwords and other authentication keys in the configuration.secret
Can view passwords and other authentication keys in the configuration and can modifythem in configuration mode.
secret-control
Can view security configuration in configuration mode and with the show configurationoperational mode command.
security
Can view and configure security information (at the [edit security] hierarchy level).security-control
Can start a local shell on the device by entering the start shell command.shell
Can view SNMP configuration information in configuration and operational modes.snmp
Can view SNMP configuration information and configure SNMP (at the [edit snmp]hierarchy level).
snmp-control
Can view system-level information in configuration and operational modes.system
User Authentication Overview ■ 41
Chapter 4: Managing Administrator Authentication
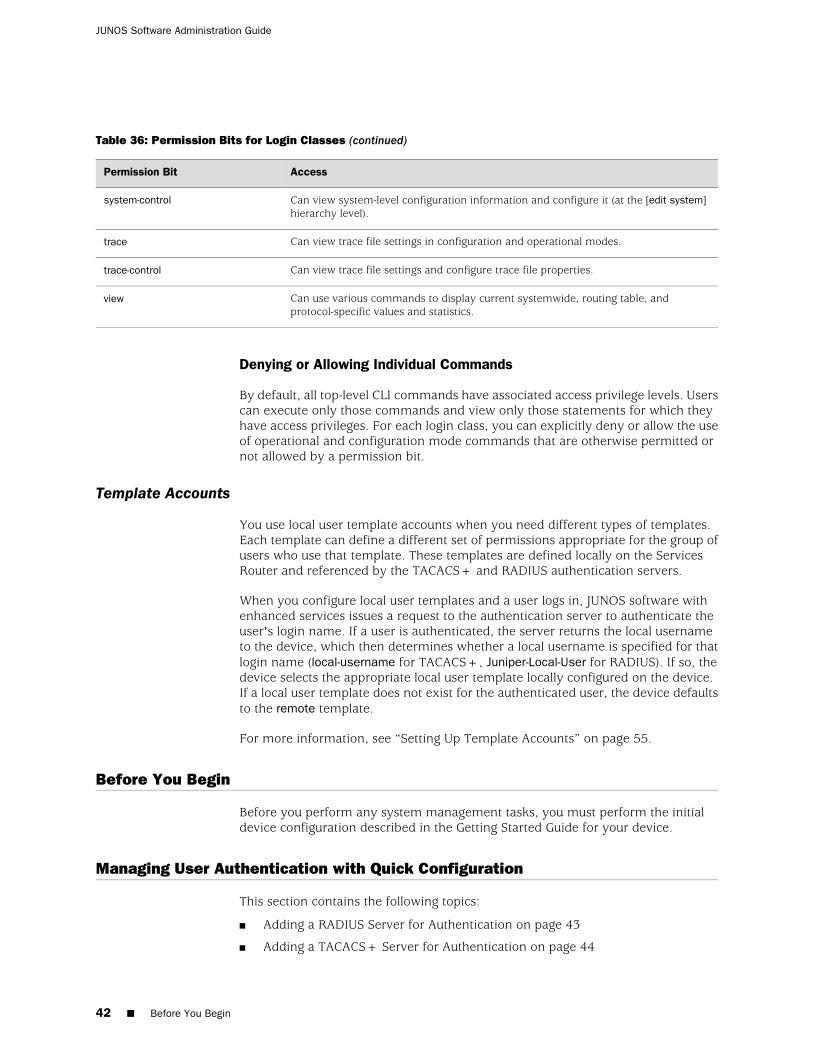
Table 36: Permission Bits for Login Classes (continued)
AccessPermission Bit
Can view system-level configuration information and configure it (at the [edit system]hierarchy level).
system-control
Can view trace file settings in configuration and operational modes.trace
Can view trace file settings and configure trace file properties.trace-control
Can use various commands to display current systemwide, routing table, andprotocol-specific values and statistics.
view
Denying or Allowing Individual Commands
By default, all top-level CLI commands have associated access privilege levels. Userscan execute only those commands and view only those statements for which theyhave access privileges. For each login class, you can explicitly deny or allow the useof operational and configuration mode commands that are otherwise permitted ornot allowed by a permission bit.
Template Accounts
You use local user template accounts when you need different types of templates.Each template can define a different set of permissions appropriate for the group ofusers who use that template. These templates are defined locally on the ServicesRouter and referenced by the TACACS+ and RADIUS authentication servers.
When you configure local user templates and a user logs in, JUNOS software withenhanced services issues a request to the authentication server to authenticate theuser's login name. If a user is authenticated, the server returns the local usernameto the device, which then determines whether a local username is specified for thatlogin name (local-username for TACACS+, Juniper-Local-User for RADIUS). If so, thedevice selects the appropriate local user template locally configured on the device.If a local user template does not exist for the authenticated user, the device defaultsto the remote template.
For more information, see “Setting Up Template Accounts” on page 55.
Before You Begin
Before you perform any system management tasks, you must perform the initialdevice configuration described in the Getting Started Guide for your device.
Managing User Authentication with Quick Configuration
This section contains the following topics:
■ Adding a RADIUS Server for Authentication on page 43
■ Adding a TACACS+ Server for Authentication on page 44
42 ■ Before You Begin
JUNOS Software Administration Guide
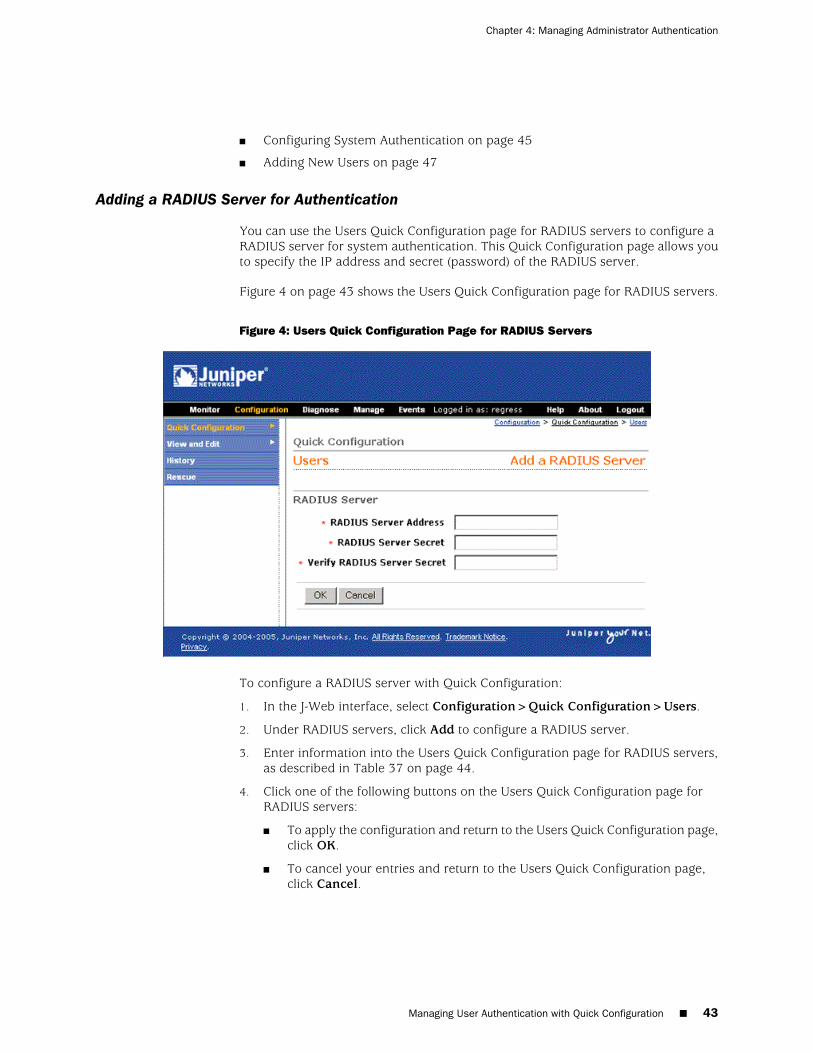
■ Configuring System Authentication on page 45
■ Adding New Users on page 47
Adding a RADIUS Server for Authentication
You can use the Users Quick Configuration page for RADIUS servers to configure aRADIUS server for system authentication. This Quick Configuration page allows youto specify the IP address and secret (password) of the RADIUS server.
Figure 4 on page 43 shows the Users Quick Configuration page for RADIUS servers.
Figure 4: Users Quick Configuration Page for RADIUS Servers
To configure a RADIUS server with Quick Configuration:
1. In the J-Web interface, select Configuration>Quick Configuration>Users.
2. Under RADIUS servers, click Add to configure a RADIUS server.
3. Enter information into the Users Quick Configuration page for RADIUS servers,as described in Table 37 on page 44.
4. Click one of the following buttons on the Users Quick Configuration page forRADIUS servers:
■ To apply the configuration and return to the Users Quick Configuration page,click OK.
■ To cancel your entries and return to the Users Quick Configuration page,click Cancel.
Managing User Authentication with Quick Configuration ■ 43
Chapter 4: Managing Administrator Authentication
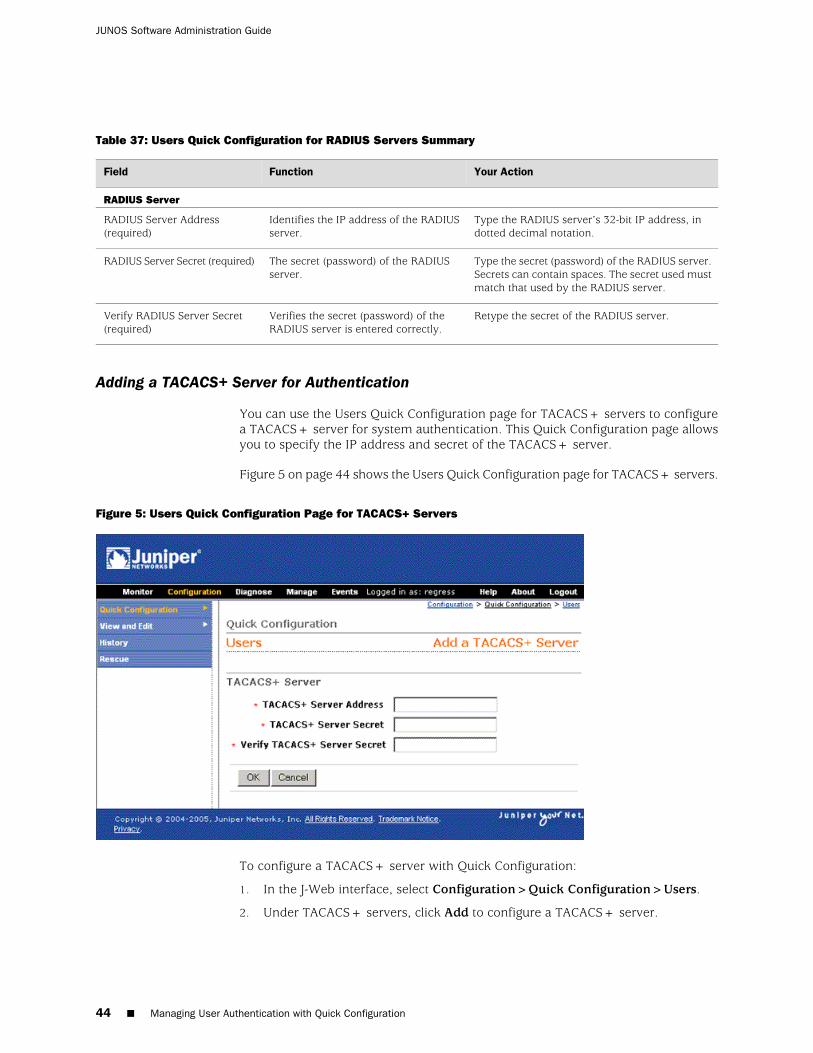
Table 37: Users Quick Configuration for RADIUS Servers Summary
Your ActionFunctionField
RADIUS Server
Type the RADIUS server’s 32-bit IP address, indotted decimal notation.
Identifies the IP address of the RADIUSserver.
RADIUS Server Address(required)
Type the secret (password) of the RADIUS server.Secrets can contain spaces. The secret used mustmatch that used by the RADIUS server.
The secret (password) of the RADIUSserver.
RADIUS Server Secret (required)
Retype the secret of the RADIUS server.Verifies the secret (password) of theRADIUS server is entered correctly.
Verify RADIUS Server Secret(required)
Adding a TACACS+ Server for Authentication
You can use the Users Quick Configuration page for TACACS+ servers to configurea TACACS+ server for system authentication. This Quick Configuration page allowsyou to specify the IP address and secret of the TACACS+ server.
Figure 5 on page 44 shows the Users Quick Configuration page for TACACS+ servers.
Figure 5: Users Quick Configuration Page for TACACS+ Servers
To configure a TACACS+ server with Quick Configuration:
1. In the J-Web interface, select Configuration>Quick Configuration>Users.
2. Under TACACS+ servers, click Add to configure a TACACS+ server.
44 ■ Managing User Authentication with Quick Configuration
JUNOS Software Administration Guide
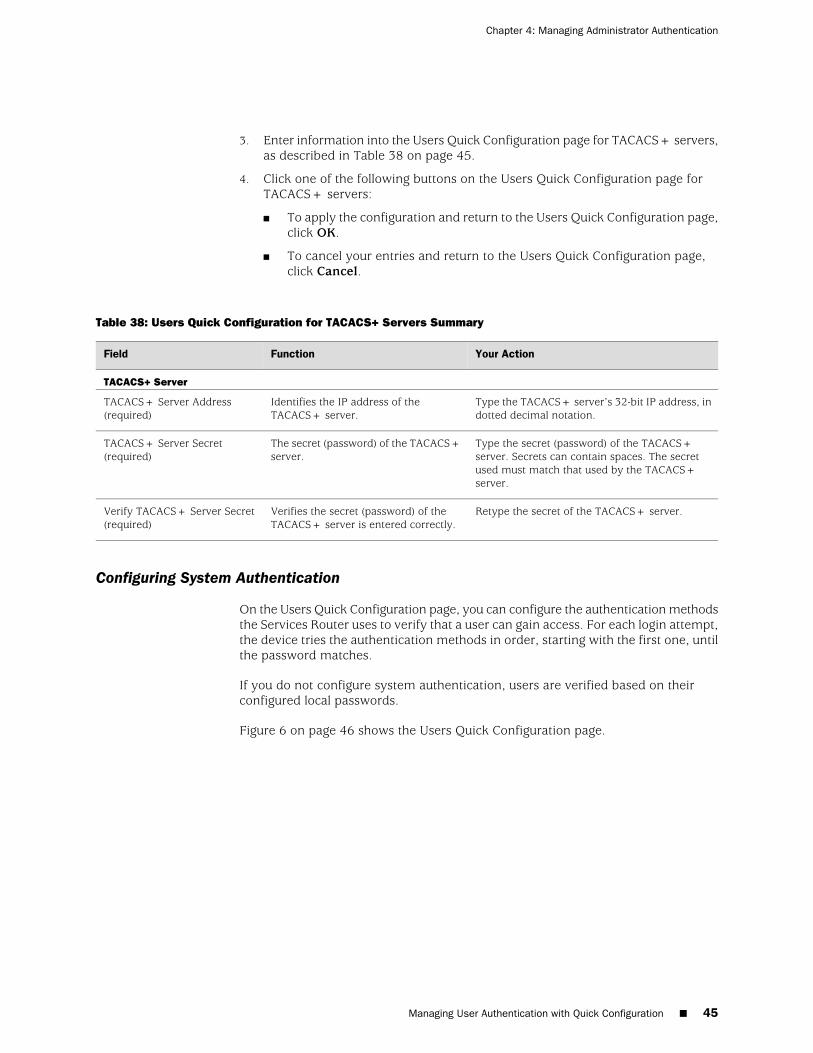
3. Enter information into the Users Quick Configuration page for TACACS+ servers,as described in Table 38 on page 45.
4. Click one of the following buttons on the Users Quick Configuration page forTACACS+ servers:
■ To apply the configuration and return to the Users Quick Configuration page,click OK.
■ To cancel your entries and return to the Users Quick Configuration page,click Cancel.
Table 38: Users Quick Configuration for TACACS+ Servers Summary
Your ActionFunctionField
TACACS+ Server
Type the TACACS+ server’s 32-bit IP address, indotted decimal notation.
Identifies the IP address of theTACACS+ server.
TACACS+ Server Address(required)
Type the secret (password) of the TACACS+server. Secrets can contain spaces. The secretused must match that used by the TACACS+server.
The secret (password) of the TACACS+server.
TACACS+ Server Secret(required)
Retype the secret of the TACACS+ server.Verifies the secret (password) of theTACACS+ server is entered correctly.
Verify TACACS+ Server Secret(required)
Configuring System Authentication
On the Users Quick Configuration page, you can configure the authentication methodsthe Services Router uses to verify that a user can gain access. For each login attempt,the device tries the authentication methods in order, starting with the first one, untilthe password matches.
If you do not configure system authentication, users are verified based on theirconfigured local passwords.
Figure 6 on page 46 shows the Users Quick Configuration page.
Managing User Authentication with Quick Configuration ■ 45
Chapter 4: Managing Administrator Authentication
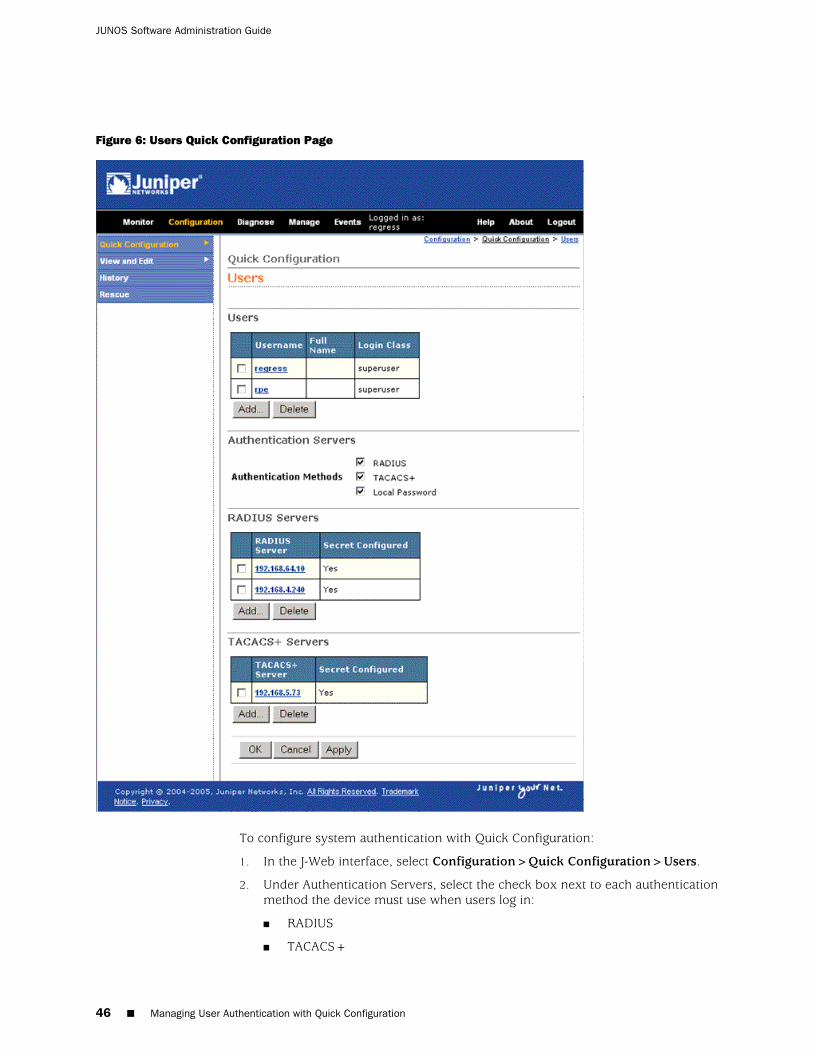
Figure 6: Users Quick Configuration Page
To configure system authentication with Quick Configuration:
1. In the J-Web interface, select Configuration>Quick Configuration>Users.
2. Under Authentication Servers, select the check box next to each authenticationmethod the device must use when users log in:
■ RADIUS
■ TACACS+
46 ■ Managing User Authentication with Quick Configuration
JUNOS Software Administration Guide
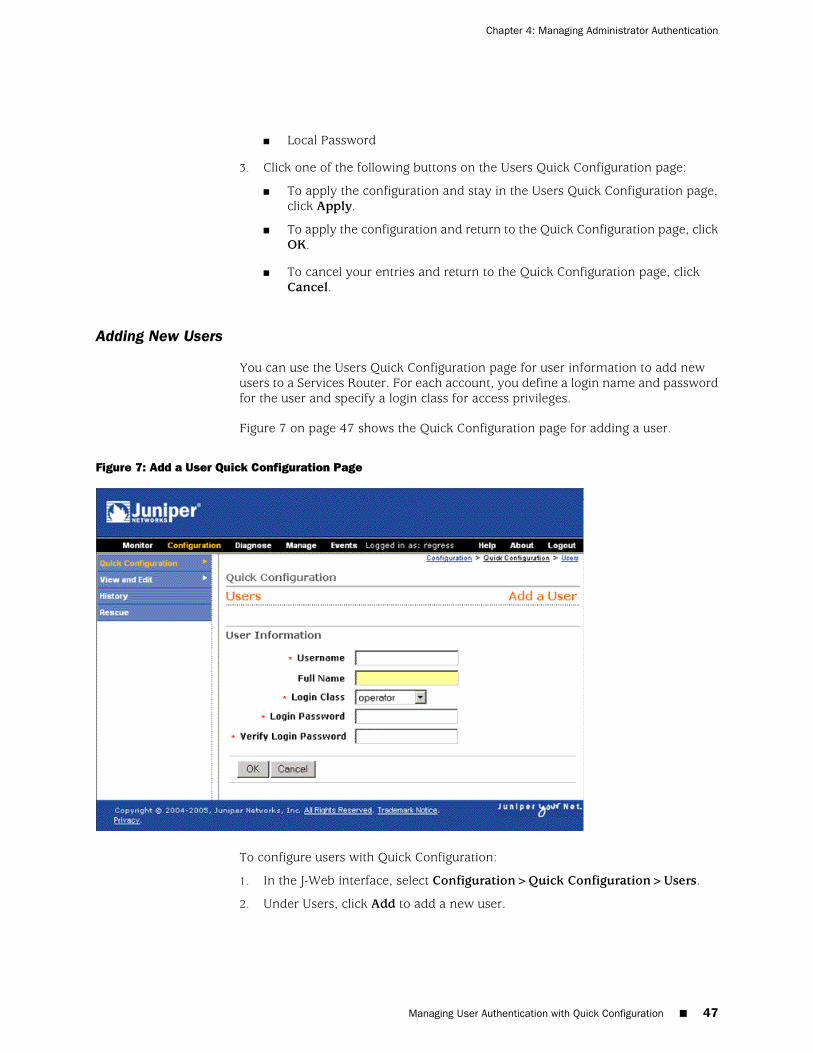
■ Local Password
3. Click one of the following buttons on the Users Quick Configuration page:
■ To apply the configuration and stay in the Users Quick Configuration page,click Apply.
■ To apply the configuration and return to the Quick Configuration page, clickOK.
■ To cancel your entries and return to the Quick Configuration page, clickCancel.
Adding New Users
You can use the Users Quick Configuration page for user information to add newusers to a Services Router. For each account, you define a login name and passwordfor the user and specify a login class for access privileges.
Figure 7 on page 47 shows the Quick Configuration page for adding a user.
Figure 7: Add a User Quick Configuration Page
To configure users with Quick Configuration:
1. In the J-Web interface, select Configuration>Quick Configuration>Users.
2. Under Users, click Add to add a new user.
Managing User Authentication with Quick Configuration ■ 47
Chapter 4: Managing Administrator Authentication
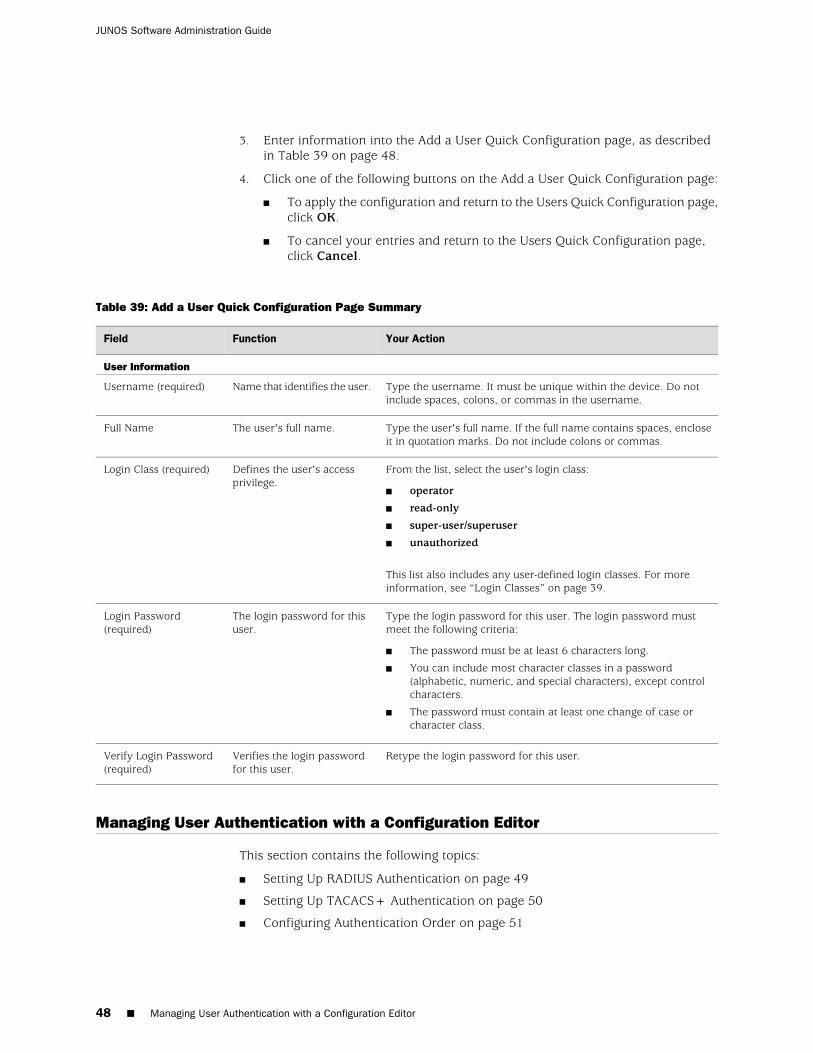
3. Enter information into the Add a User Quick Configuration page, as describedin Table 39 on page 48.
4. Click one of the following buttons on the Add a User Quick Configuration page:
■ To apply the configuration and return to the Users Quick Configuration page,click OK.
■ To cancel your entries and return to the Users Quick Configuration page,click Cancel.
Table 39: Add a User Quick Configuration Page Summary
Your ActionFunctionField
User Information
Type the username. It must be unique within the device. Do notinclude spaces, colons, or commas in the username.
Name that identifies the user.Username (required)
Type the user's full name. If the full name contains spaces, encloseit in quotation marks. Do not include colons or commas.
The user's full name.Full Name
From the list, select the user's login class:
■ operator
■ read-only
■ super-user/superuser
■ unauthorized
This list also includes any user-defined login classes. For moreinformation, see “Login Classes” on page 39.
Defines the user's accessprivilege.
Login Class (required)
Type the login password for this user. The login password mustmeet the following criteria:
■ The password must be at least 6 characters long.
■ You can include most character classes in a password(alphabetic, numeric, and special characters), except controlcharacters.
■ The password must contain at least one change of case orcharacter class.
The login password for thisuser.
Login Password(required)
Retype the login password for this user.Verifies the login passwordfor this user.
Verify Login Password(required)
Managing User Authentication with a Configuration Editor
This section contains the following topics:
■ Setting Up RADIUS Authentication on page 49
■ Setting Up TACACS+ Authentication on page 50
■ Configuring Authentication Order on page 51
48 ■ Managing User Authentication with a Configuration Editor
JUNOS Software Administration Guide
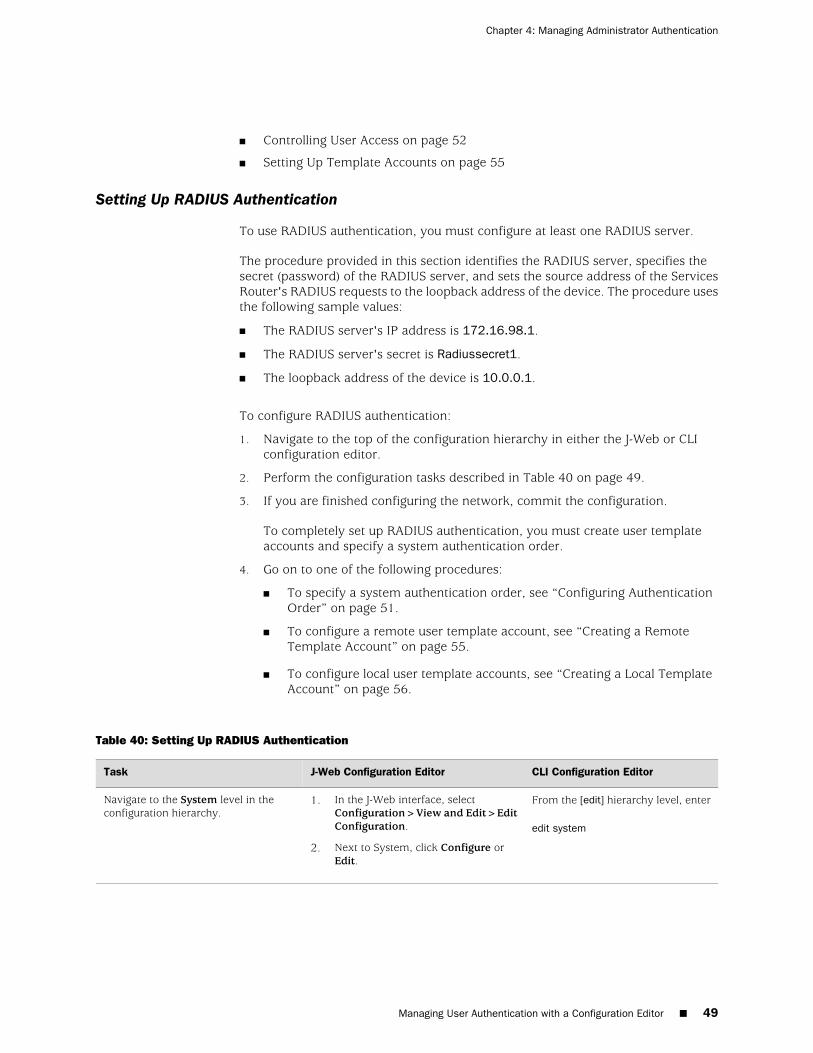
■ Controlling User Access on page 52
■ Setting Up Template Accounts on page 55
Setting Up RADIUS Authentication
To use RADIUS authentication, you must configure at least one RADIUS server.
The procedure provided in this section identifies the RADIUS server, specifies thesecret (password) of the RADIUS server, and sets the source address of the ServicesRouter's RADIUS requests to the loopback address of the device. The procedure usesthe following sample values:
■ The RADIUS server's IP address is 172.16.98.1.
■ The RADIUS server's secret is Radiussecret1.
■ The loopback address of the device is 10.0.0.1.
To configure RADIUS authentication:
1. Navigate to the top of the configuration hierarchy in either the J-Web or CLIconfiguration editor.
2. Perform the configuration tasks described in Table 40 on page 49.
3. If you are finished configuring the network, commit the configuration.
To completely set up RADIUS authentication, you must create user templateaccounts and specify a system authentication order.
4. Go on to one of the following procedures:
■ To specify a system authentication order, see “Configuring AuthenticationOrder” on page 51.
■ To configure a remote user template account, see “Creating a RemoteTemplate Account” on page 55.
■ To configure local user template accounts, see “Creating a Local TemplateAccount” on page 56.
Table 40: Setting Up RADIUS Authentication
CLI Configuration EditorJ-Web Configuration EditorTask
From the [edit] hierarchy level, enter
edit system
1. In the J-Web interface, selectConfiguration>View and Edit>EditConfiguration.
2. Next to System, click Configure orEdit.
Navigate to the System level in theconfiguration hierarchy.
Managing User Authentication with a Configuration Editor ■ 49
Chapter 4: Managing Administrator Authentication
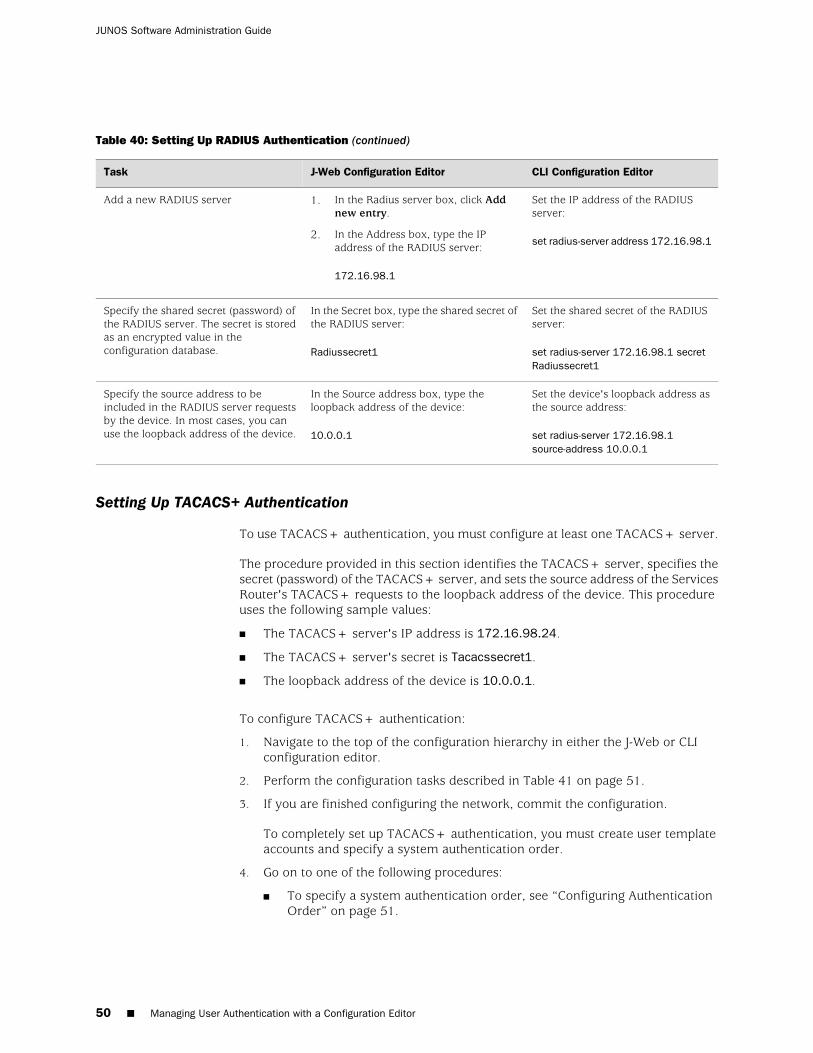
Table 40: Setting Up RADIUS Authentication (continued)
CLI Configuration EditorJ-Web Configuration EditorTask
Set the IP address of the RADIUSserver:
set radius-server address 172.16.98.1
1. In the Radius server box, click Addnew entry.
2. In the Address box, type the IPaddress of the RADIUS server:
172.16.98.1
Add a new RADIUS server
Set the shared secret of the RADIUSserver:
set radius-server 172.16.98.1 secretRadiussecret1
In the Secret box, type the shared secret ofthe RADIUS server:
Radiussecret1
Specify the shared secret (password) ofthe RADIUS server. The secret is storedas an encrypted value in theconfiguration database.
Set the device's loopback address asthe source address:
set radius-server 172.16.98.1source-address 10.0.0.1
In the Source address box, type theloopback address of the device:
10.0.0.1
Specify the source address to beincluded in the RADIUS server requestsby the device. In most cases, you canuse the loopback address of the device.
Setting Up TACACS+ Authentication
To use TACACS+ authentication, you must configure at least one TACACS+ server.
The procedure provided in this section identifies the TACACS+ server, specifies thesecret (password) of the TACACS+ server, and sets the source address of the ServicesRouter's TACACS+ requests to the loopback address of the device. This procedureuses the following sample values:
■ The TACACS+ server's IP address is 172.16.98.24.
■ The TACACS+ server's secret is Tacacssecret1.
■ The loopback address of the device is 10.0.0.1.
To configure TACACS+ authentication:
1. Navigate to the top of the configuration hierarchy in either the J-Web or CLIconfiguration editor.
2. Perform the configuration tasks described in Table 41 on page 51.
3. If you are finished configuring the network, commit the configuration.
To completely set up TACACS+ authentication, you must create user templateaccounts and specify a system authentication order.
4. Go on to one of the following procedures:
■ To specify a system authentication order, see “Configuring AuthenticationOrder” on page 51.
50 ■ Managing User Authentication with a Configuration Editor
JUNOS Software Administration Guide
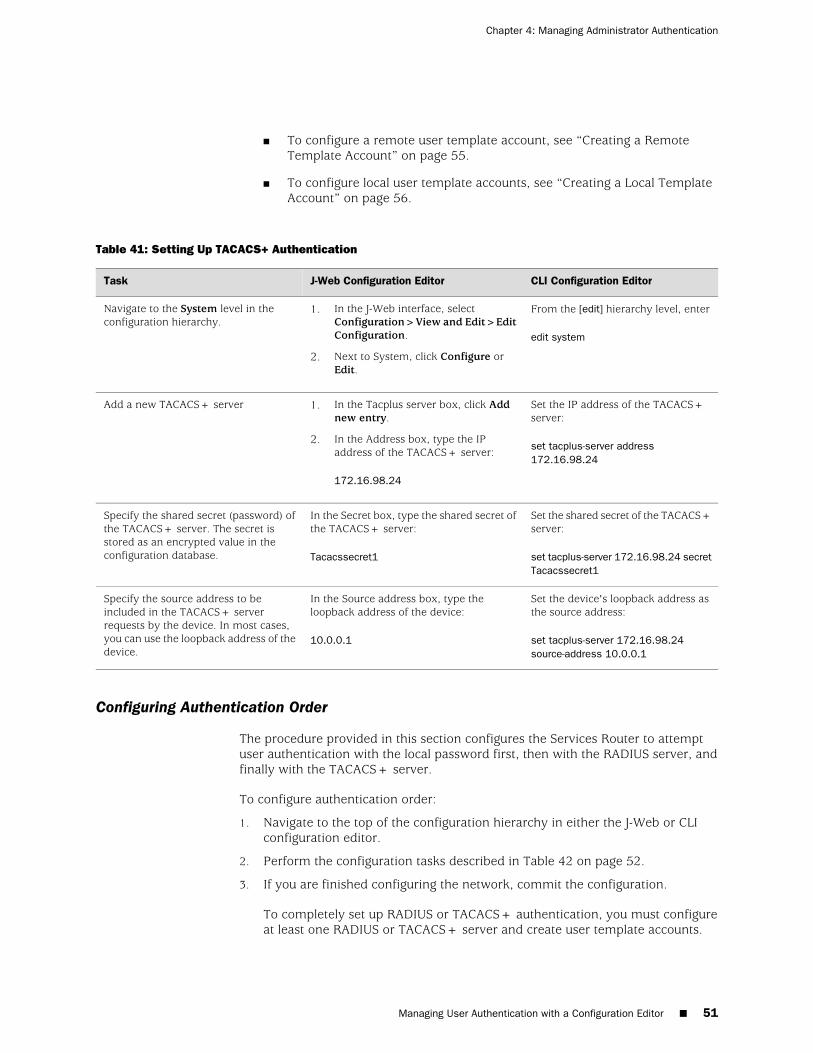
■ To configure a remote user template account, see “Creating a RemoteTemplate Account” on page 55.
■ To configure local user template accounts, see “Creating a Local TemplateAccount” on page 56.
Table 41: Setting Up TACACS+ Authentication
CLI Configuration EditorJ-Web Configuration EditorTask
From the [edit] hierarchy level, enter
edit system
1. In the J-Web interface, selectConfiguration>View and Edit>EditConfiguration.
2. Next to System, click Configure orEdit.
Navigate to the System level in theconfiguration hierarchy.
Set the IP address of the TACACS+server:
set tacplus-server address172.16.98.24
1. In the Tacplus server box, click Addnew entry.
2. In the Address box, type the IPaddress of the TACACS+ server:
172.16.98.24
Add a new TACACS+ server
Set the shared secret of the TACACS+server:
set tacplus-server 172.16.98.24 secretTacacssecret1
In the Secret box, type the shared secret ofthe TACACS+ server:
Tacacssecret1
Specify the shared secret (password) ofthe TACACS+ server. The secret isstored as an encrypted value in theconfiguration database.
Set the device's loopback address asthe source address:
set tacplus-server 172.16.98.24source-address 10.0.0.1
In the Source address box, type theloopback address of the device:
10.0.0.1
Specify the source address to beincluded in the TACACS+ serverrequests by the device. In most cases,you can use the loopback address of thedevice.
Configuring Authentication Order
The procedure provided in this section configures the Services Router to attemptuser authentication with the local password first, then with the RADIUS server, andfinally with the TACACS+ server.
To configure authentication order:
1. Navigate to the top of the configuration hierarchy in either the J-Web or CLIconfiguration editor.
2. Perform the configuration tasks described in Table 42 on page 52.
3. If you are finished configuring the network, commit the configuration.
To completely set up RADIUS or TACACS+ authentication, you must configureat least one RADIUS or TACACS+ server and create user template accounts.
Managing User Authentication with a Configuration Editor ■ 51
Chapter 4: Managing Administrator Authentication
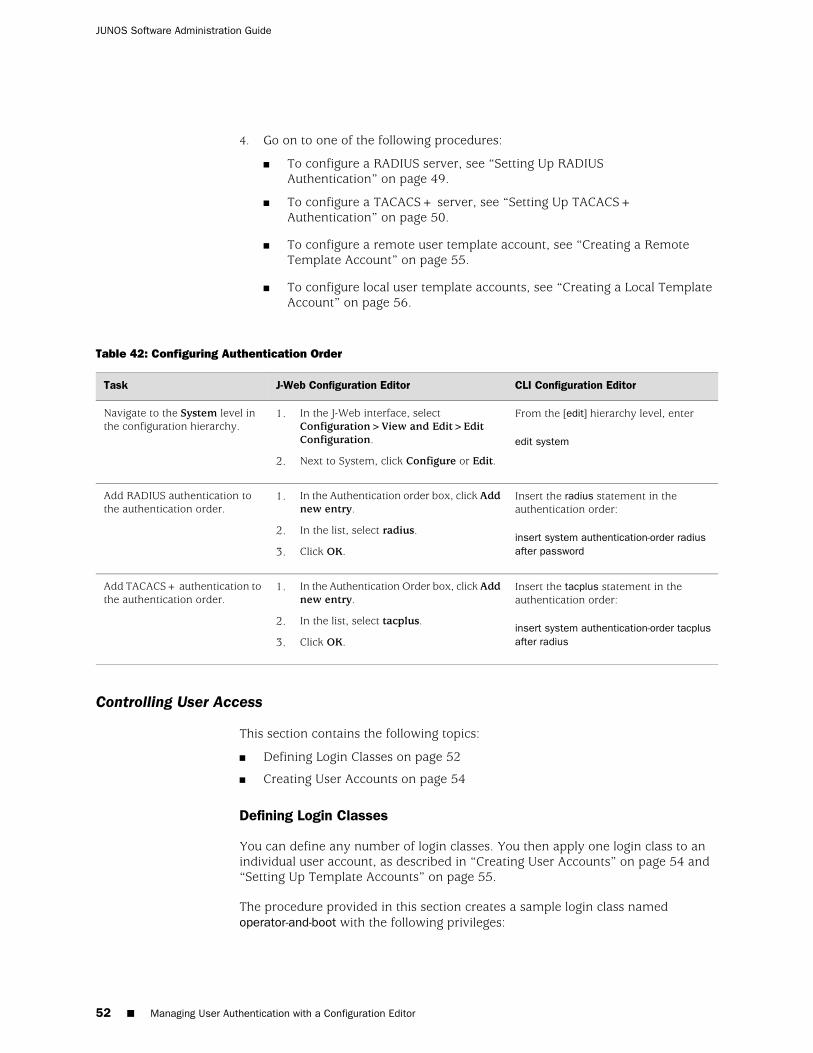
4. Go on to one of the following procedures:
■ To configure a RADIUS server, see “Setting Up RADIUSAuthentication” on page 49.
■ To configure a TACACS+ server, see “Setting Up TACACS+Authentication” on page 50.
■ To configure a remote user template account, see “Creating a RemoteTemplate Account” on page 55.
■ To configure local user template accounts, see “Creating a Local TemplateAccount” on page 56.
Table 42: Configuring Authentication Order
CLI Configuration EditorJ-Web Configuration EditorTask
From the [edit] hierarchy level, enter
edit system
1. In the J-Web interface, selectConfiguration>View and Edit>EditConfiguration.
2. Next to System, click Configure or Edit.
Navigate to the System level inthe configuration hierarchy.
Insert the radius statement in theauthentication order:
insert system authentication-order radiusafter password
1. In the Authentication order box, click Addnew entry.
2. In the list, select radius.
3. Click OK.
Add RADIUS authentication tothe authentication order.
Insert the tacplus statement in theauthentication order:
insert system authentication-order tacplusafter radius
1. In the Authentication Order box, click Addnew entry.
2. In the list, select tacplus.
3. Click OK.
Add TACACS+ authentication tothe authentication order.
Controlling User Access
This section contains the following topics:
■ Defining Login Classes on page 52
■ Creating User Accounts on page 54
Defining Login Classes
You can define any number of login classes. You then apply one login class to anindividual user account, as described in “Creating User Accounts” on page 54 and“Setting Up Template Accounts” on page 55.
The procedure provided in this section creates a sample login class namedoperator-and-boot with the following privileges:
52 ■ Managing User Authentication with a Configuration Editor
JUNOS Software Administration Guide
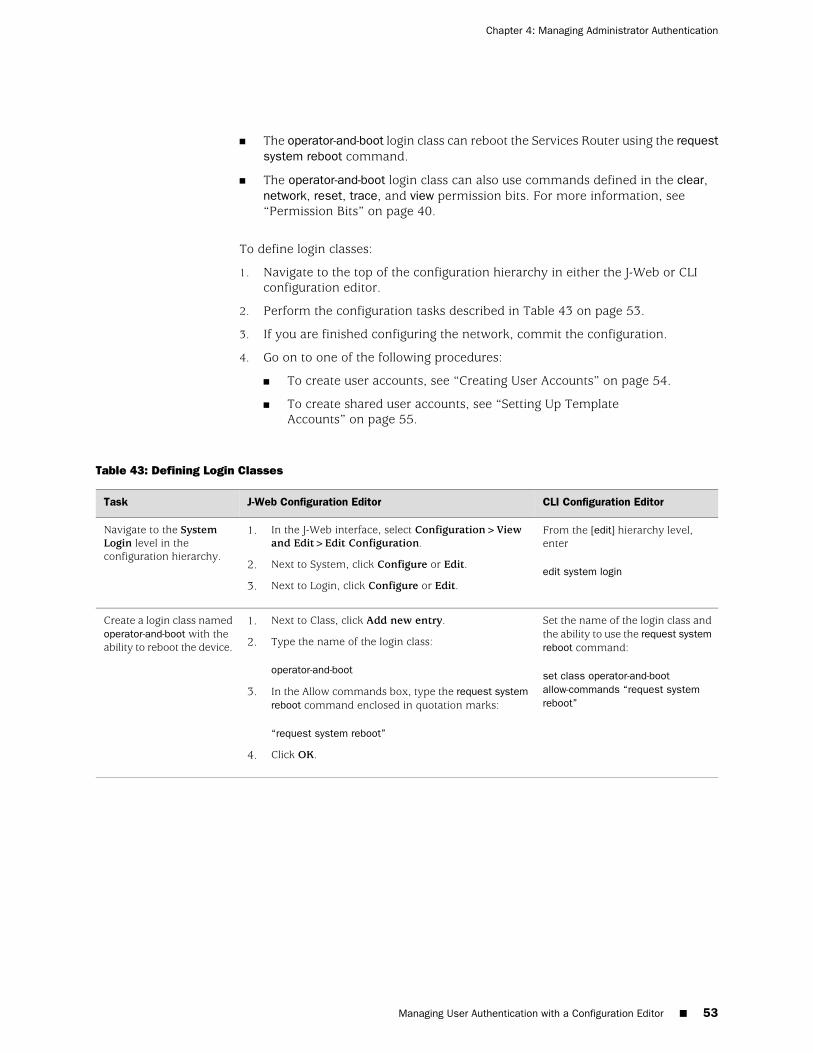
■ The operator-and-boot login class can reboot the Services Router using the requestsystem reboot command.
■ The operator-and-boot login class can also use commands defined in the clear,network, reset, trace, and view permission bits. For more information, see“Permission Bits” on page 40.
To define login classes:
1. Navigate to the top of the configuration hierarchy in either the J-Web or CLIconfiguration editor.
2. Perform the configuration tasks described in Table 43 on page 53.
3. If you are finished configuring the network, commit the configuration.
4. Go on to one of the following procedures:
■ To create user accounts, see “Creating User Accounts” on page 54.
■ To create shared user accounts, see “Setting Up TemplateAccounts” on page 55.
Table 43: Defining Login Classes
CLI Configuration EditorJ-Web Configuration EditorTask
From the [edit] hierarchy level,enter
edit system login
1. In the J-Web interface, select Configuration>Viewand Edit>Edit Configuration.
2. Next to System, click Configure or Edit.
3. Next to Login, click Configure or Edit.
Navigate to the SystemLogin level in theconfiguration hierarchy.
Set the name of the login class andthe ability to use the request systemreboot command:
set class operator-and-bootallow-commands “request systemreboot”
1. Next to Class, click Add new entry.
2. Type the name of the login class:
operator-and-boot
3. In the Allow commands box, type the request systemreboot command enclosed in quotation marks:
“request system reboot”
4. Click OK.
Create a login class namedoperator-and-boot with theability to reboot the device.
Managing User Authentication with a Configuration Editor ■ 53
Chapter 4: Managing Administrator Authentication
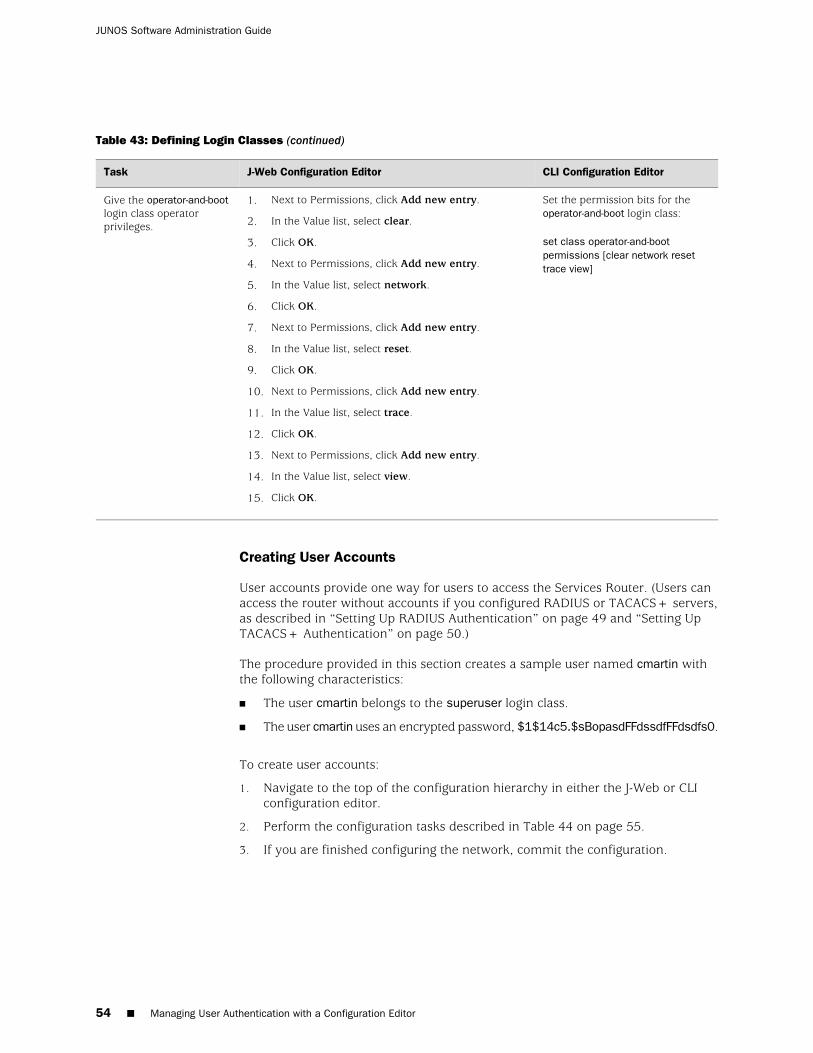
Table 43: Defining Login Classes (continued)
CLI Configuration EditorJ-Web Configuration EditorTask
Set the permission bits for theoperator-and-boot login class:
set class operator-and-bootpermissions [clear network resettrace view]
1. Next to Permissions, click Add new entry.
2. In the Value list, select clear.
3. Click OK.
4. Next to Permissions, click Add new entry.
5. In the Value list, select network.
6. Click OK.
7. Next to Permissions, click Add new entry.
8. In the Value list, select reset.
9. Click OK.
10. Next to Permissions, click Add new entry.
11. In the Value list, select trace.
12. Click OK.
13. Next to Permissions, click Add new entry.
14. In the Value list, select view.
15. Click OK.
Give the operator-and-bootlogin class operatorprivileges.
Creating User Accounts
User accounts provide one way for users to access the Services Router. (Users canaccess the router without accounts if you configured RADIUS or TACACS+ servers,as described in “Setting Up RADIUS Authentication” on page 49 and “Setting UpTACACS+ Authentication” on page 50.)
The procedure provided in this section creates a sample user named cmartin withthe following characteristics:
■ The user cmartin belongs to the superuser login class.
■ The user cmartin uses an encrypted password, $1$14c5.$sBopasdFFdssdfFFdsdfs0.
To create user accounts:
1. Navigate to the top of the configuration hierarchy in either the J-Web or CLIconfiguration editor.
2. Perform the configuration tasks described in Table 44 on page 55.
3. If you are finished configuring the network, commit the configuration.
54 ■ Managing User Authentication with a Configuration Editor
JUNOS Software Administration Guide
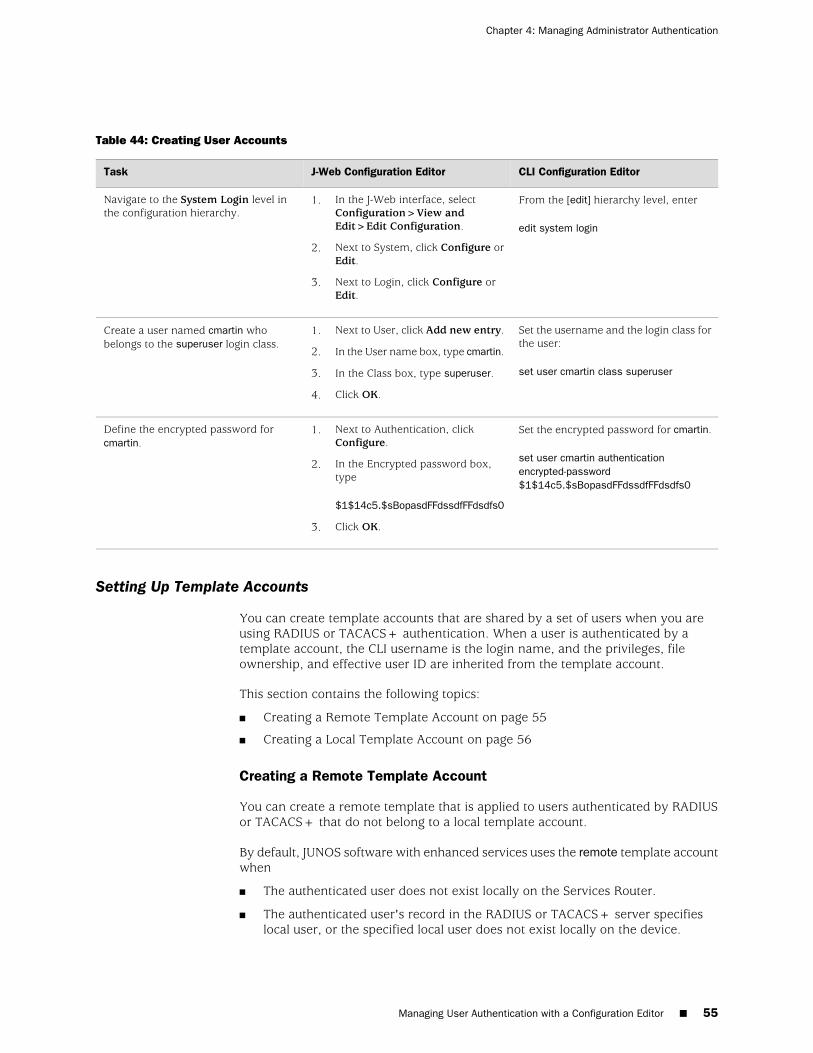
Table 44: Creating User Accounts
CLI Configuration EditorJ-Web Configuration EditorTask
From the [edit] hierarchy level, enter
edit system login
1. In the J-Web interface, selectConfiguration>View andEdit>Edit Configuration.
2. Next to System, click Configure orEdit.
3. Next to Login, click Configure orEdit.
Navigate to the System Login level inthe configuration hierarchy.
Set the username and the login class forthe user:
set user cmartin class superuser
1. Next to User, click Add new entry.
2. In the User name box, type cmartin.
3. In the Class box, type superuser.
4. Click OK.
Create a user named cmartin whobelongs to the superuser login class.
Set the encrypted password for cmartin.
set user cmartin authenticationencrypted-password$1$14c5.$sBopasdFFdssdfFFdsdfs0
1. Next to Authentication, clickConfigure.
2. In the Encrypted password box,type
$1$14c5.$sBopasdFFdssdfFFdsdfs0
3. Click OK.
Define the encrypted password forcmartin.
Setting Up Template Accounts
You can create template accounts that are shared by a set of users when you areusing RADIUS or TACACS+ authentication. When a user is authenticated by atemplate account, the CLI username is the login name, and the privileges, fileownership, and effective user ID are inherited from the template account.
This section contains the following topics:
■ Creating a Remote Template Account on page 55
■ Creating a Local Template Account on page 56
Creating a Remote Template Account
You can create a remote template that is applied to users authenticated by RADIUSor TACACS+ that do not belong to a local template account.
By default, JUNOS software with enhanced services uses the remote template accountwhen
■ The authenticated user does not exist locally on the Services Router.
■ The authenticated user's record in the RADIUS or TACACS+ server specifieslocal user, or the specified local user does not exist locally on the device.
Managing User Authentication with a Configuration Editor ■ 55
Chapter 4: Managing Administrator Authentication
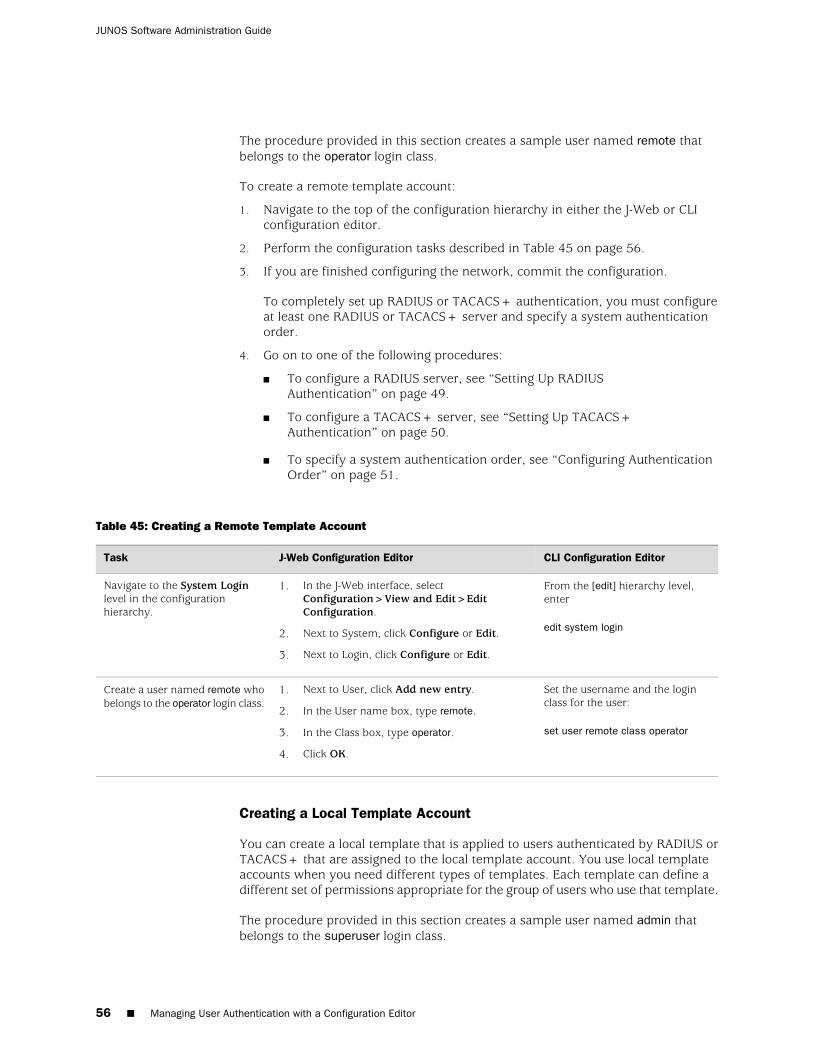
The procedure provided in this section creates a sample user named remote thatbelongs to the operator login class.
To create a remote template account:
1. Navigate to the top of the configuration hierarchy in either the J-Web or CLIconfiguration editor.
2. Perform the configuration tasks described in Table 45 on page 56.
3. If you are finished configuring the network, commit the configuration.
To completely set up RADIUS or TACACS+ authentication, you must configureat least one RADIUS or TACACS+ server and specify a system authenticationorder.
4. Go on to one of the following procedures:
■ To configure a RADIUS server, see “Setting Up RADIUSAuthentication” on page 49.
■ To configure a TACACS+ server, see “Setting Up TACACS+Authentication” on page 50.
■ To specify a system authentication order, see “Configuring AuthenticationOrder” on page 51.
Table 45: Creating a Remote Template Account
CLI Configuration EditorJ-Web Configuration EditorTask
From the [edit] hierarchy level,enter
edit system login
1. In the J-Web interface, selectConfiguration>View and Edit>EditConfiguration.
2. Next to System, click Configure or Edit.
3. Next to Login, click Configure or Edit.
Navigate to the System Loginlevel in the configurationhierarchy.
Set the username and the loginclass for the user:
set user remote class operator
1. Next to User, click Add new entry.
2. In the User name box, type remote.
3. In the Class box, type operator.
4. Click OK.
Create a user named remote whobelongs to the operator login class.
Creating a Local Template Account
You can create a local template that is applied to users authenticated by RADIUS orTACACS+ that are assigned to the local template account. You use local templateaccounts when you need different types of templates. Each template can define adifferent set of permissions appropriate for the group of users who use that template.
The procedure provided in this section creates a sample user named admin thatbelongs to the superuser login class.
56 ■ Managing User Authentication with a Configuration Editor
JUNOS Software Administration Guide
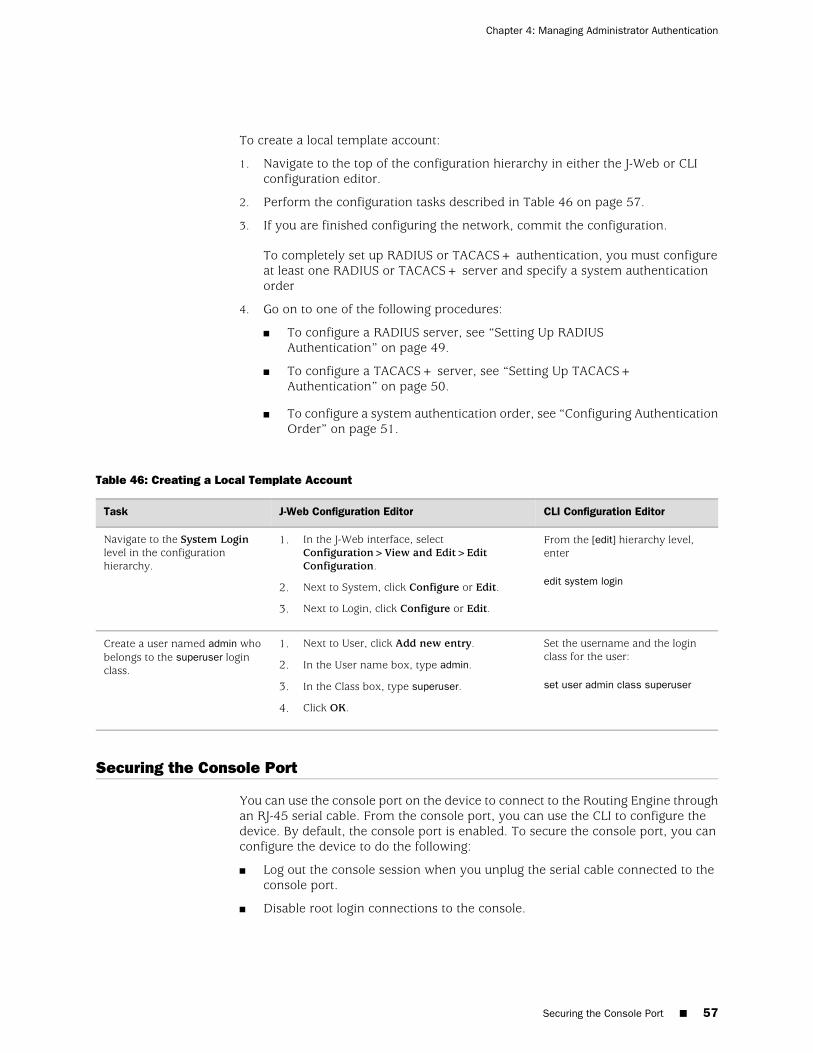
To create a local template account:
1. Navigate to the top of the configuration hierarchy in either the J-Web or CLIconfiguration editor.
2. Perform the configuration tasks described in Table 46 on page 57.
3. If you are finished configuring the network, commit the configuration.
To completely set up RADIUS or TACACS+ authentication, you must configureat least one RADIUS or TACACS+ server and specify a system authenticationorder
4. Go on to one of the following procedures:
■ To configure a RADIUS server, see “Setting Up RADIUSAuthentication” on page 49.
■ To configure a TACACS+ server, see “Setting Up TACACS+Authentication” on page 50.
■ To configure a system authentication order, see “Configuring AuthenticationOrder” on page 51.
Table 46: Creating a Local Template Account
CLI Configuration EditorJ-Web Configuration EditorTask
From the [edit] hierarchy level,enter
edit system login
1. In the J-Web interface, selectConfiguration>View and Edit>EditConfiguration.
2. Next to System, click Configure or Edit.
3. Next to Login, click Configure or Edit.
Navigate to the System Loginlevel in the configurationhierarchy.
Set the username and the loginclass for the user:
set user admin class superuser
1. Next to User, click Add new entry.
2. In the User name box, type admin.
3. In the Class box, type superuser.
4. Click OK.
Create a user named admin whobelongs to the superuser loginclass.
Securing the Console Port
You can use the console port on the device to connect to the Routing Engine throughan RJ-45 serial cable. From the console port, you can use the CLI to configure thedevice. By default, the console port is enabled. To secure the console port, you canconfigure the device to do the following:
■ Log out the console session when you unplug the serial cable connected to theconsole port.
■ Disable root login connections to the console.
Securing the Console Port ■ 57
Chapter 4: Managing Administrator Authentication
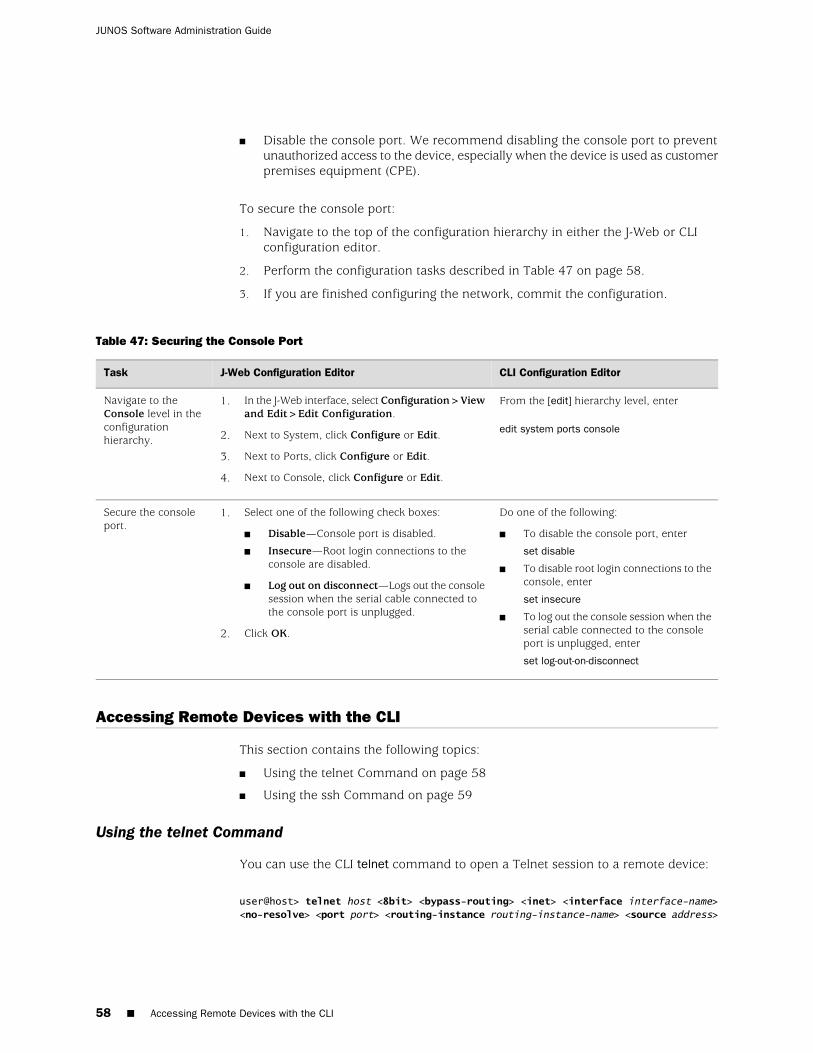
■ Disable the console port. We recommend disabling the console port to preventunauthorized access to the device, especially when the device is used as customerpremises equipment (CPE).
To secure the console port:
1. Navigate to the top of the configuration hierarchy in either the J-Web or CLIconfiguration editor.
2. Perform the configuration tasks described in Table 47 on page 58.
3. If you are finished configuring the network, commit the configuration.
Table 47: Securing the Console Port
CLI Configuration EditorJ-Web Configuration EditorTask
From the [edit] hierarchy level, enter
edit system ports console
1. In the J-Web interface, select Configuration>Viewand Edit>Edit Configuration.
2. Next to System, click Configure or Edit.
3. Next to Ports, click Configure or Edit.
4. Next to Console, click Configure or Edit.
Navigate to theConsole level in theconfigurationhierarchy.
Do one of the following:
■ To disable the console port, enter
set disable
■ To disable root login connections to theconsole, enter
set insecure
■ To log out the console session when theserial cable connected to the consoleport is unplugged, enter
set log-out-on-disconnect
1. Select one of the following check boxes:
■ Disable—Console port is disabled.
■ Insecure—Root login connections to theconsole are disabled.
■ Log out on disconnect—Logs out the consolesession when the serial cable connected tothe console port is unplugged.
2. Click OK.
Secure the consoleport.
Accessing Remote Devices with the CLI
This section contains the following topics:
■ Using the telnet Command on page 58
■ Using the ssh Command on page 59
Using the telnet Command
You can use the CLI telnet command to open a Telnet session to a remote device:
user@host> telnet host <8bit> <bypass-routing> <inet> <interface interface-name><no-resolve> <port port> <routing-instance routing-instance-name> <source address>
58 ■ Accessing Remote Devices with the CLI
JUNOS Software Administration Guide
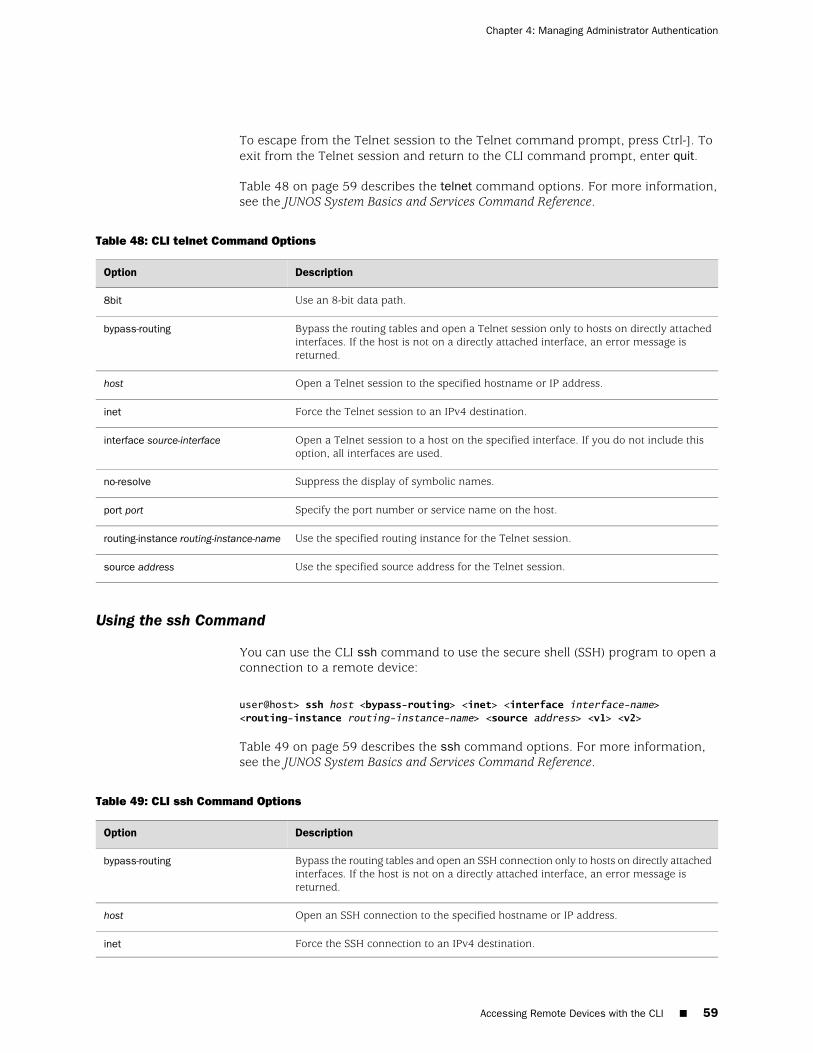
To escape from the Telnet session to the Telnet command prompt, press Ctrl-]. Toexit from the Telnet session and return to the CLI command prompt, enter quit.
Table 48 on page 59 describes the telnet command options. For more information,see the JUNOS System Basics and Services Command Reference.
Table 48: CLI telnet Command Options
DescriptionOption
Use an 8-bit data path.8bit
Bypass the routing tables and open a Telnet session only to hosts on directly attachedinterfaces. If the host is not on a directly attached interface, an error message isreturned.
bypass-routing
Open a Telnet session to the specified hostname or IP address.host
Force the Telnet session to an IPv4 destination.inet
Open a Telnet session to a host on the specified interface. If you do not include thisoption, all interfaces are used.
interface source-interface
Suppress the display of symbolic names.no-resolve
Specify the port number or service name on the host.port port
Use the specified routing instance for the Telnet session.routing-instance routing-instance-name
Use the specified source address for the Telnet session.source address
Using the ssh Command
You can use the CLI ssh command to use the secure shell (SSH) program to open aconnection to a remote device:
user@host> ssh host <bypass-routing> <inet> <interface interface-name><routing-instance routing-instance-name> <source address> <v1> <v2>
Table 49 on page 59 describes the ssh command options. For more information,see the JUNOS System Basics and Services Command Reference.
Table 49: CLI ssh Command Options
DescriptionOption
Bypass the routing tables and open an SSH connection only to hosts on directly attachedinterfaces. If the host is not on a directly attached interface, an error message isreturned.
bypass-routing
Open an SSH connection to the specified hostname or IP address.host
Force the SSH connection to an IPv4 destination.inet
Accessing Remote Devices with the CLI ■ 59
Chapter 4: Managing Administrator Authentication
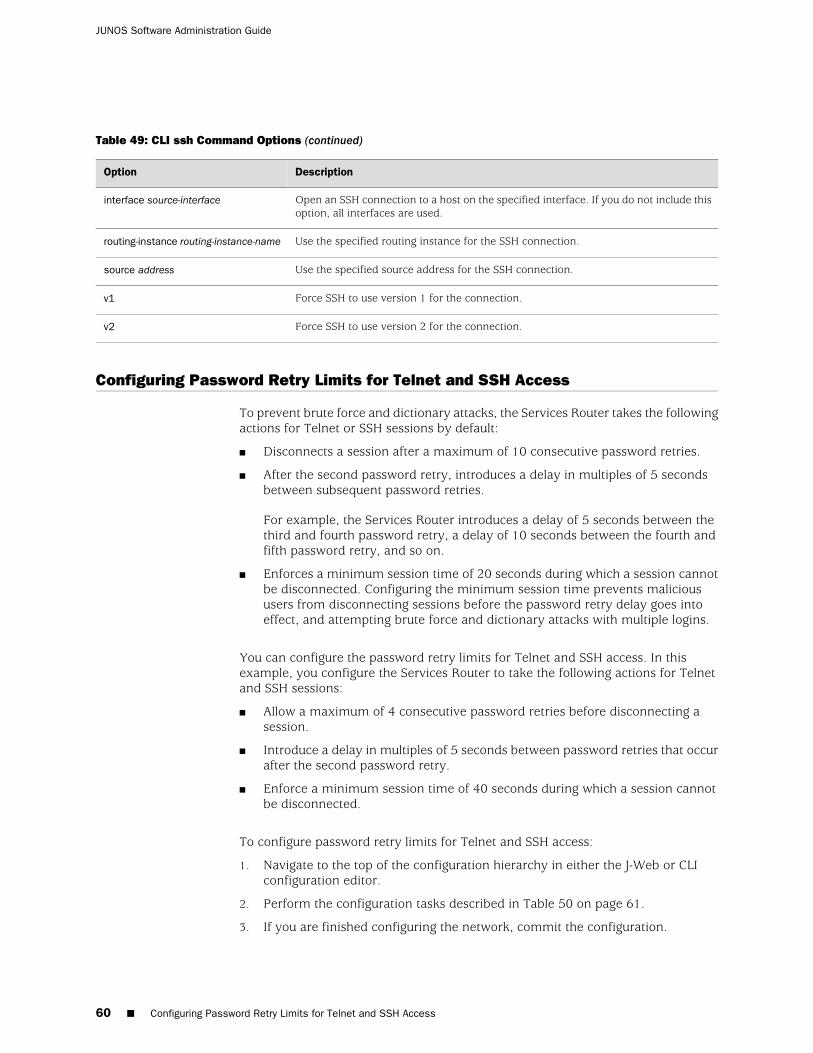
Table 49: CLI ssh Command Options (continued)
DescriptionOption
Open an SSH connection to a host on the specified interface. If you do not include thisoption, all interfaces are used.
interface source-interface
Use the specified routing instance for the SSH connection.routing-instance routing-instance-name
Use the specified source address for the SSH connection.source address
Force SSH to use version 1 for the connection.v1
Force SSH to use version 2 for the connection.v2
Configuring Password Retry Limits for Telnet and SSH Access
To prevent brute force and dictionary attacks, the Services Router takes the followingactions for Telnet or SSH sessions by default:
■ Disconnects a session after a maximum of 10 consecutive password retries.
■ After the second password retry, introduces a delay in multiples of 5 secondsbetween subsequent password retries.
For example, the Services Router introduces a delay of 5 seconds between thethird and fourth password retry, a delay of 10 seconds between the fourth andfifth password retry, and so on.
■ Enforces a minimum session time of 20 seconds during which a session cannotbe disconnected. Configuring the minimum session time prevents malicioususers from disconnecting sessions before the password retry delay goes intoeffect, and attempting brute force and dictionary attacks with multiple logins.
You can configure the password retry limits for Telnet and SSH access. In thisexample, you configure the Services Router to take the following actions for Telnetand SSH sessions:
■ Allow a maximum of 4 consecutive password retries before disconnecting asession.
■ Introduce a delay in multiples of 5 seconds between password retries that occurafter the second password retry.
■ Enforce a minimum session time of 40 seconds during which a session cannotbe disconnected.
To configure password retry limits for Telnet and SSH access:
1. Navigate to the top of the configuration hierarchy in either the J-Web or CLIconfiguration editor.
2. Perform the configuration tasks described in Table 50 on page 61.
3. If you are finished configuring the network, commit the configuration.
60 ■ Configuring Password Retry Limits for Telnet and SSH Access
JUNOS Software Administration Guide
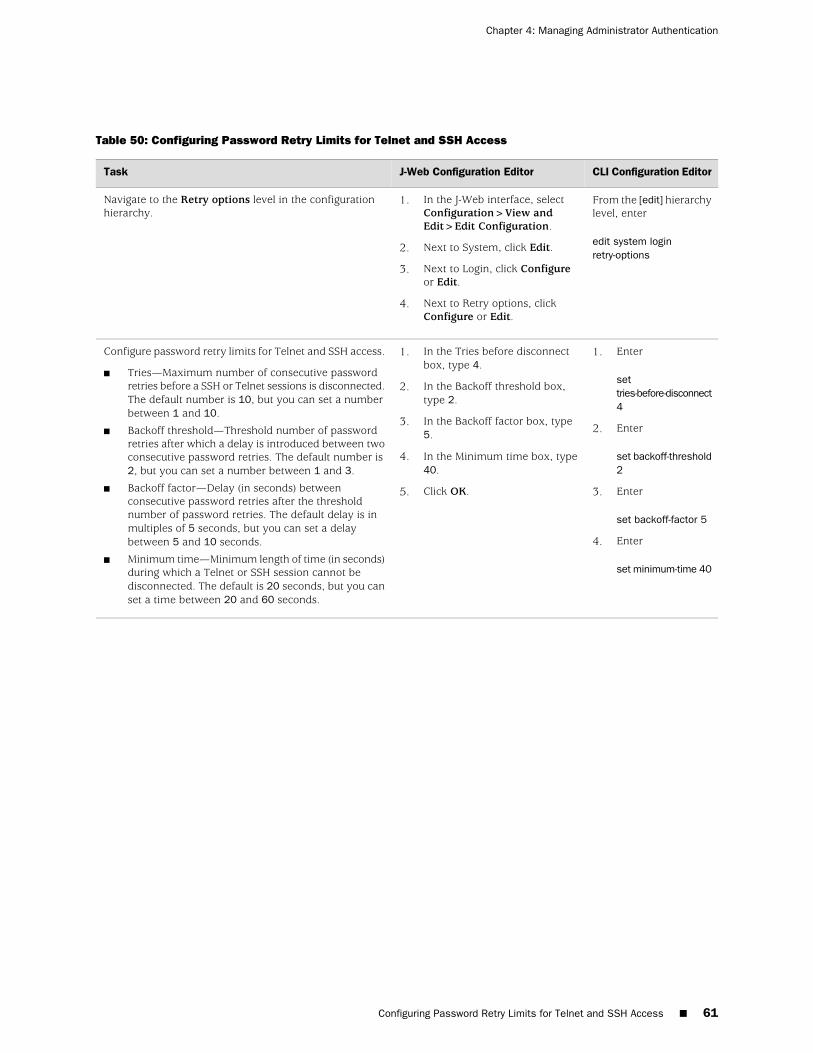
Table 50: Configuring Password Retry Limits for Telnet and SSH Access
CLI Configuration EditorJ-Web Configuration EditorTask
From the [edit] hierarchylevel, enter
edit system loginretry-options
1. In the J-Web interface, selectConfiguration>View andEdit>Edit Configuration.
2. Next to System, click Edit.
3. Next to Login, click Configureor Edit.
4. Next to Retry options, clickConfigure or Edit.
Navigate to the Retry options level in the configurationhierarchy.
1. Enter
settries-before-disconnect4
2. Enter
set backoff-threshold2
3. Enter
set backoff-factor 5
4. Enter
set minimum-time 40
1. In the Tries before disconnectbox, type 4.
2. In the Backoff threshold box,type 2.
3. In the Backoff factor box, type5.
4. In the Minimum time box, type40.
5. Click OK.
Configure password retry limits for Telnet and SSH access.
■ Tries—Maximum number of consecutive passwordretries before a SSH or Telnet sessions is disconnected.The default number is 10, but you can set a numberbetween 1 and 10.
■ Backoff threshold—Threshold number of passwordretries after which a delay is introduced between twoconsecutive password retries. The default number is2, but you can set a number between 1 and 3.
■ Backoff factor—Delay (in seconds) betweenconsecutive password retries after the thresholdnumber of password retries. The default delay is inmultiples of 5 seconds, but you can set a delaybetween 5 and 10 seconds.
■ Minimum time—Minimum length of time (in seconds)during which a Telnet or SSH session cannot bedisconnected. The default is 20 seconds, but you canset a time between 20 and 60 seconds.
Configuring Password Retry Limits for Telnet and SSH Access ■ 61
Chapter 4: Managing Administrator Authentication

62 ■ Configuring Password Retry Limits for Telnet and SSH Access
JUNOS Software Administration Guide
Chapter 5
Setting Up USB Modems for RemoteManagement
J-series Services Routers support the use of USB modems for remote management.You can use Telnet or SSH to connect to the device from a remote location throughtwo modems over a telephone network. The USB modem is connected to the USBport on the device, and a second modem is connected to a remote managementdevice such as a PC or laptop computer.
NOTE: We recommend using a Multi-Tech MultiModem MT5634ZBA-USB-V92 USBmodem with J-series Service Routers.
You use either the J-Web configuration editor or CLI configuration editor to configurethe USB modem and its supporting dialer interfaces.
This chapter contains the following topics:
■ USB Modem Remote Management Support On Different Device Types on page 63
■ USB Modem Terms on page 64
■ USB Modem Overview on page 64
■ Before You Begin on page 67
■ Connecting the USB Modem to the USB Port on page 67
■ Configuring USB Modem Interfaces with a Configuration Editor on page 68
■ Connecting to the Device from the User End on page 74
■ Administering USB Modems on page 75
■ Verifying the USB Modem Configuration on page 77
USB Modem Remote Management Support On Different Device Types
The following table lists USB modem remote management features, specifies whetherthe features are supported on various device types, and indicates where you can findmore information about each feature.
USB Modem Remote Management Support On Different Device Types ■ 63
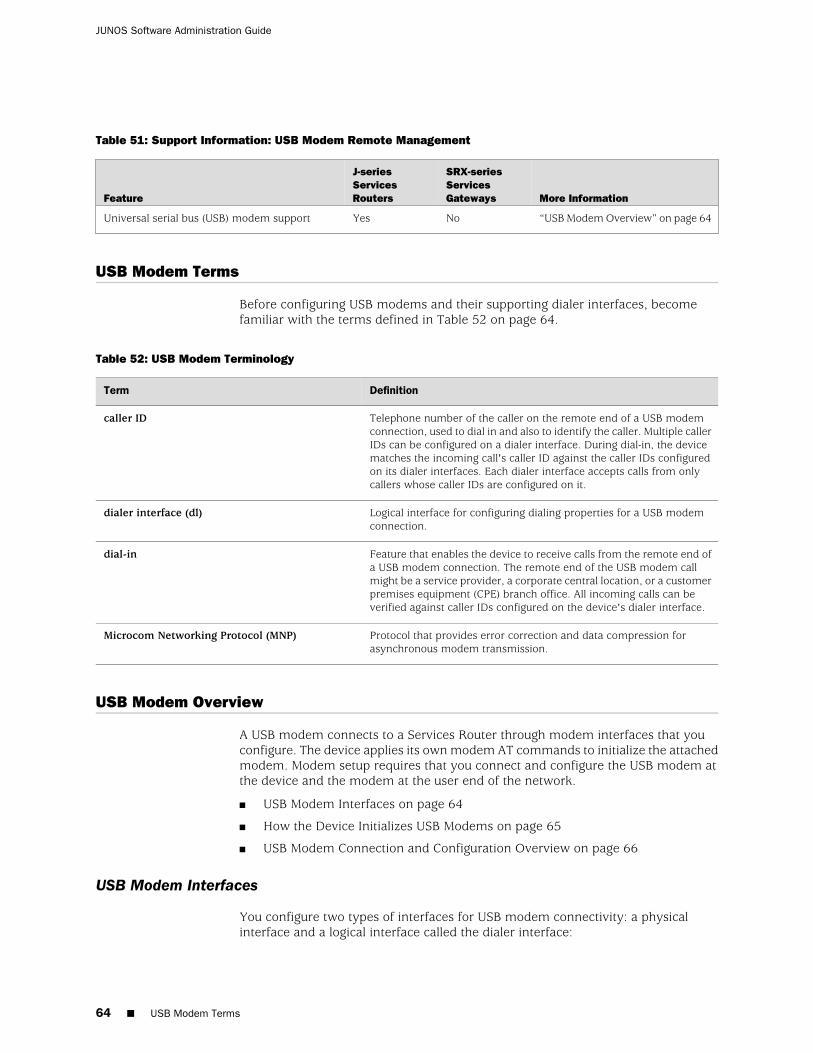
Table 51: Support Information: USB Modem Remote Management
More Information
SRX-seriesServicesGateways
J-seriesServicesRoutersFeature
“USB Modem Overview” on page 64NoYesUniversal serial bus (USB) modem support
USB Modem Terms
Before configuring USB modems and their supporting dialer interfaces, becomefamiliar with the terms defined in Table 52 on page 64.
Table 52: USB Modem Terminology
DefinitionTerm
Telephone number of the caller on the remote end of a USB modemconnection, used to dial in and also to identify the caller. Multiple callerIDs can be configured on a dialer interface. During dial-in, the devicematches the incoming call's caller ID against the caller IDs configuredon its dialer interfaces. Each dialer interface accepts calls from onlycallers whose caller IDs are configured on it.
caller ID
Logical interface for configuring dialing properties for a USB modemconnection.
dialer interface (dl)
Feature that enables the device to receive calls from the remote end ofa USB modem connection. The remote end of the USB modem callmight be a service provider, a corporate central location, or a customerpremises equipment (CPE) branch office. All incoming calls can beverified against caller IDs configured on the device's dialer interface.
dial-in
Protocol that provides error correction and data compression forasynchronous modem transmission.
Microcom Networking Protocol (MNP)
USB Modem Overview
A USB modem connects to a Services Router through modem interfaces that youconfigure. The device applies its own modem AT commands to initialize the attachedmodem. Modem setup requires that you connect and configure the USB modem atthe device and the modem at the user end of the network.
■ USB Modem Interfaces on page 64
■ How the Device Initializes USB Modems on page 65
■ USB Modem Connection and Configuration Overview on page 66
USB Modem Interfaces
You configure two types of interfaces for USB modem connectivity: a physicalinterface and a logical interface called the dialer interface:
64 ■ USB Modem Terms
JUNOS Software Administration Guide
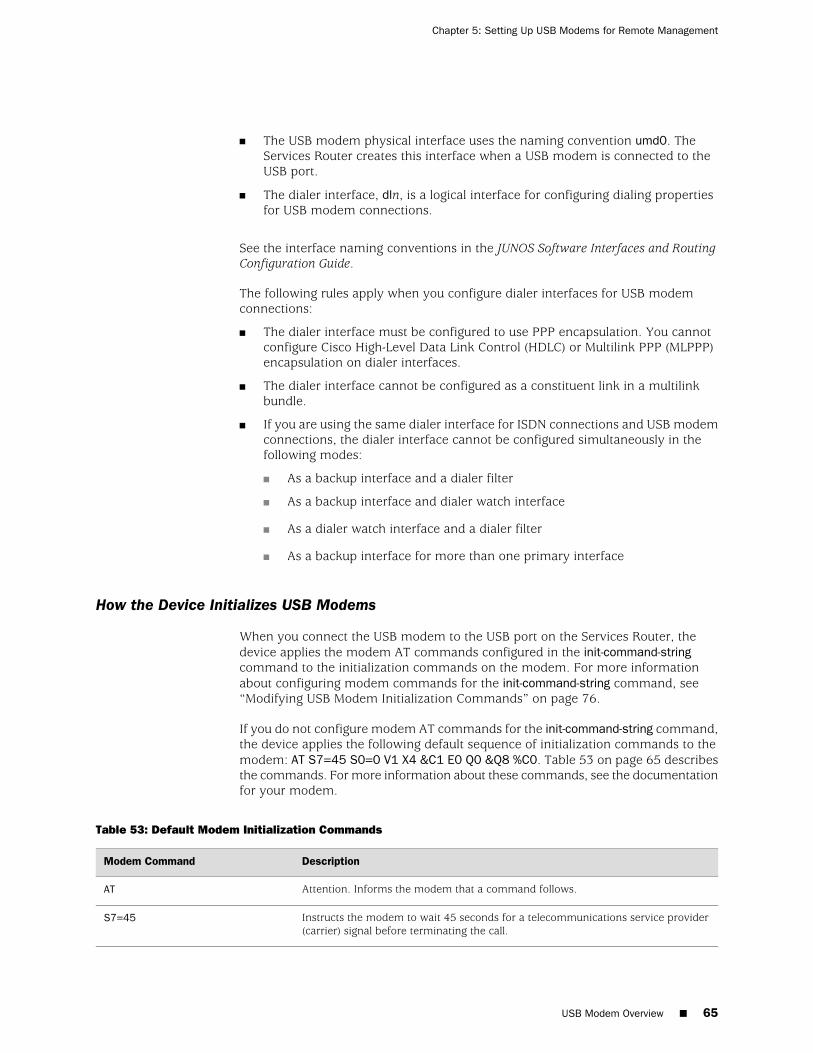
■ The USB modem physical interface uses the naming convention umd0. TheServices Router creates this interface when a USB modem is connected to theUSB port.
■ The dialer interface, dln, is a logical interface for configuring dialing propertiesfor USB modem connections.
See the interface naming conventions in the JUNOS Software Interfaces and RoutingConfiguration Guide.
The following rules apply when you configure dialer interfaces for USB modemconnections:
■ The dialer interface must be configured to use PPP encapsulation. You cannotconfigure Cisco High-Level Data Link Control (HDLC) or Multilink PPP (MLPPP)encapsulation on dialer interfaces.
■ The dialer interface cannot be configured as a constituent link in a multilinkbundle.
■ If you are using the same dialer interface for ISDN connections and USB modemconnections, the dialer interface cannot be configured simultaneously in thefollowing modes:
■ As a backup interface and a dialer filter
■ As a backup interface and dialer watch interface
■ As a dialer watch interface and a dialer filter
■ As a backup interface for more than one primary interface
How the Device Initializes USB Modems
When you connect the USB modem to the USB port on the Services Router, thedevice applies the modem AT commands configured in the init-command-stringcommand to the initialization commands on the modem. For more informationabout configuring modem commands for the init-command-string command, see“Modifying USB Modem Initialization Commands” on page 76.
If you do not configure modem AT commands for the init-command-string command,the device applies the following default sequence of initialization commands to themodem: AT S7=45 S0=0 V1 X4 &C1 E0 Q0 &Q8 %C0. Table 53 on page 65 describesthe commands. For more information about these commands, see the documentationfor your modem.
Table 53: Default Modem Initialization Commands
DescriptionModem Command
Attention. Informs the modem that a command follows.AT
Instructs the modem to wait 45 seconds for a telecommunications service provider(carrier) signal before terminating the call.
S7=45
USB Modem Overview ■ 65
Chapter 5: Setting Up USB Modems for Remote Management
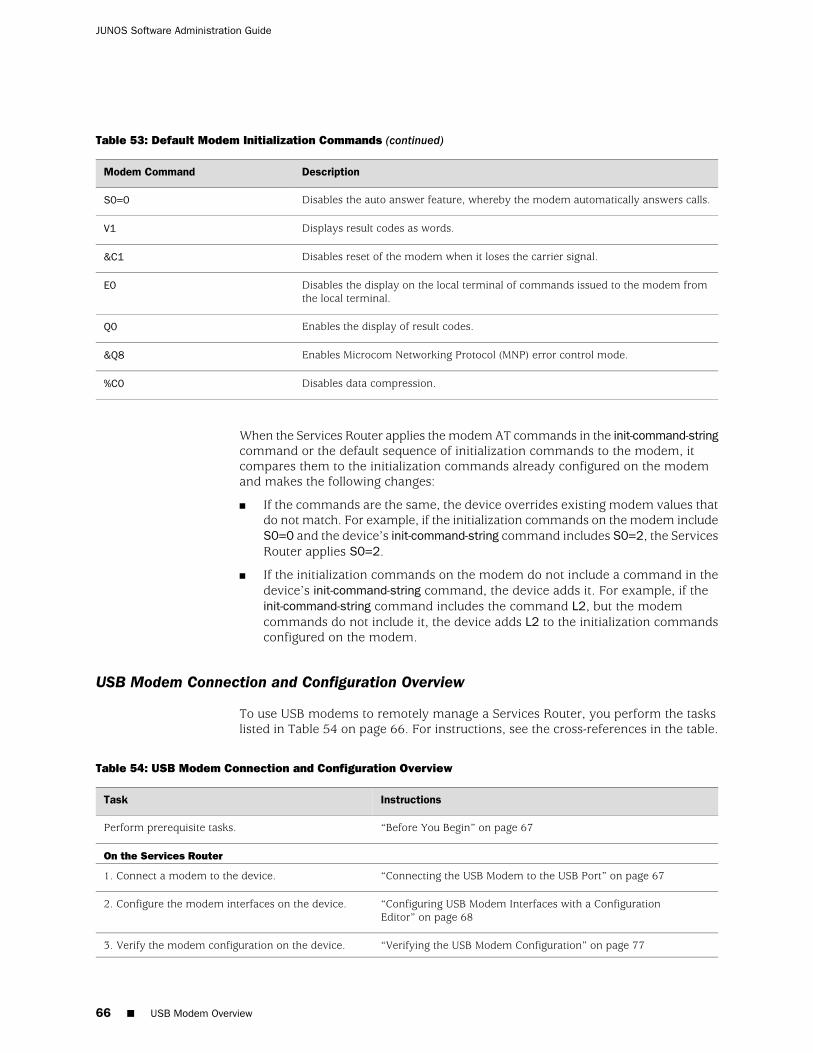
Table 53: Default Modem Initialization Commands (continued)
DescriptionModem Command
Disables the auto answer feature, whereby the modem automatically answers calls.S0=0
Displays result codes as words.V1
Disables reset of the modem when it loses the carrier signal.&C1
Disables the display on the local terminal of commands issued to the modem fromthe local terminal.
E0
Enables the display of result codes.Q0
Enables Microcom Networking Protocol (MNP) error control mode.&Q8
Disables data compression.%C0
When the Services Router applies the modem AT commands in the init-command-stringcommand or the default sequence of initialization commands to the modem, itcompares them to the initialization commands already configured on the modemand makes the following changes:
■ If the commands are the same, the device overrides existing modem values thatdo not match. For example, if the initialization commands on the modem includeS0=0 and the device’s init-command-string command includes S0=2, the ServicesRouter applies S0=2.
■ If the initialization commands on the modem do not include a command in thedevice’s init-command-string command, the device adds it. For example, if theinit-command-string command includes the command L2, but the modemcommands do not include it, the device adds L2 to the initialization commandsconfigured on the modem.
USB Modem Connection and Configuration Overview
To use USB modems to remotely manage a Services Router, you perform the taskslisted in Table 54 on page 66. For instructions, see the cross-references in the table.
Table 54: USB Modem Connection and Configuration Overview
InstructionsTask
“Before You Begin” on page 67Perform prerequisite tasks.
On the Services Router
“Connecting the USB Modem to the USB Port” on page 671. Connect a modem to the device.
“Configuring USB Modem Interfaces with a ConfigurationEditor” on page 68
2. Configure the modem interfaces on the device.
“Verifying the USB Modem Configuration” on page 773. Verify the modem configuration on the device.
66 ■ USB Modem Overview
JUNOS Software Administration Guide
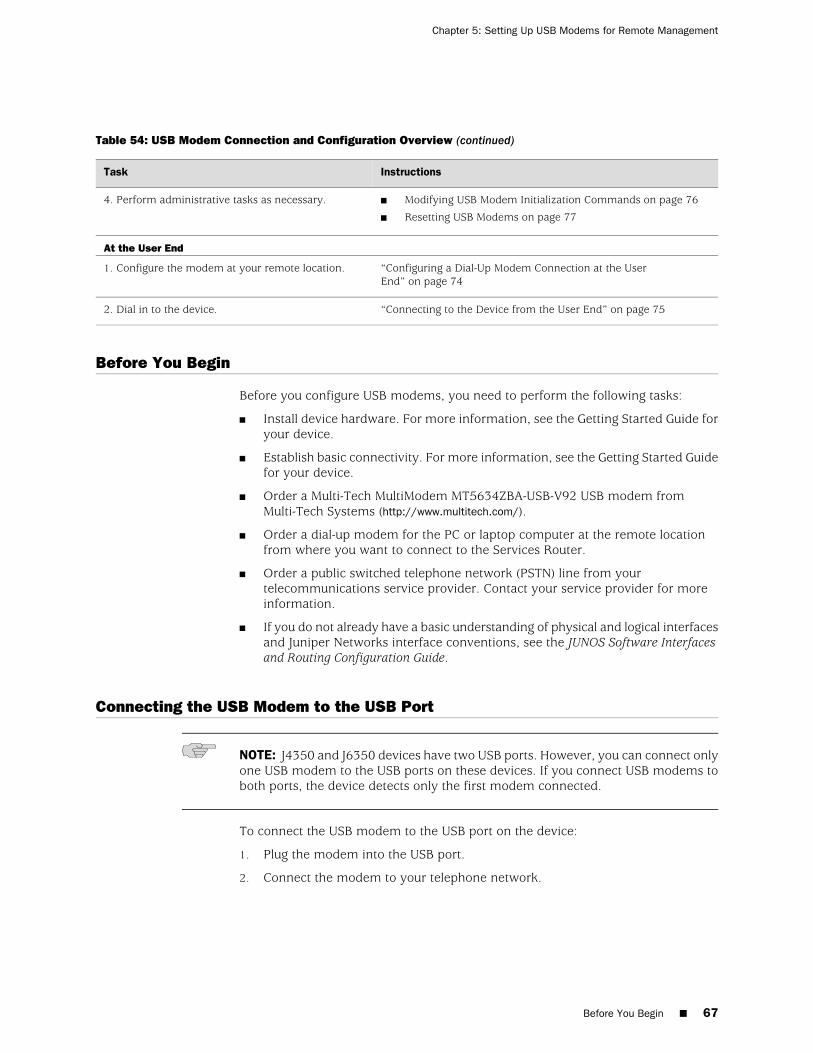
Table 54: USB Modem Connection and Configuration Overview (continued)
InstructionsTask
■ Modifying USB Modem Initialization Commands on page 76
■ Resetting USB Modems on page 77
4. Perform administrative tasks as necessary.
At the User End
“Configuring a Dial-Up Modem Connection at the UserEnd” on page 74
1. Configure the modem at your remote location.
“Connecting to the Device from the User End” on page 752. Dial in to the device.
Before You Begin
Before you configure USB modems, you need to perform the following tasks:
■ Install device hardware. For more information, see the Getting Started Guide foryour device.
■ Establish basic connectivity. For more information, see the Getting Started Guidefor your device.
■ Order a Multi-Tech MultiModem MT5634ZBA-USB-V92 USB modem fromMulti-Tech Systems (http://www.multitech.com/).
■ Order a dial-up modem for the PC or laptop computer at the remote locationfrom where you want to connect to the Services Router.
■ Order a public switched telephone network (PSTN) line from yourtelecommunications service provider. Contact your service provider for moreinformation.
■ If you do not already have a basic understanding of physical and logical interfacesand Juniper Networks interface conventions, see the JUNOS Software Interfacesand Routing Configuration Guide.
Connecting the USB Modem to the USB Port
NOTE: J4350 and J6350 devices have two USB ports. However, you can connect onlyone USB modem to the USB ports on these devices. If you connect USB modems toboth ports, the device detects only the first modem connected.
To connect the USB modem to the USB port on the device:
1. Plug the modem into the USB port.
2. Connect the modem to your telephone network.
Before You Begin ■ 67
Chapter 5: Setting Up USB Modems for Remote Management
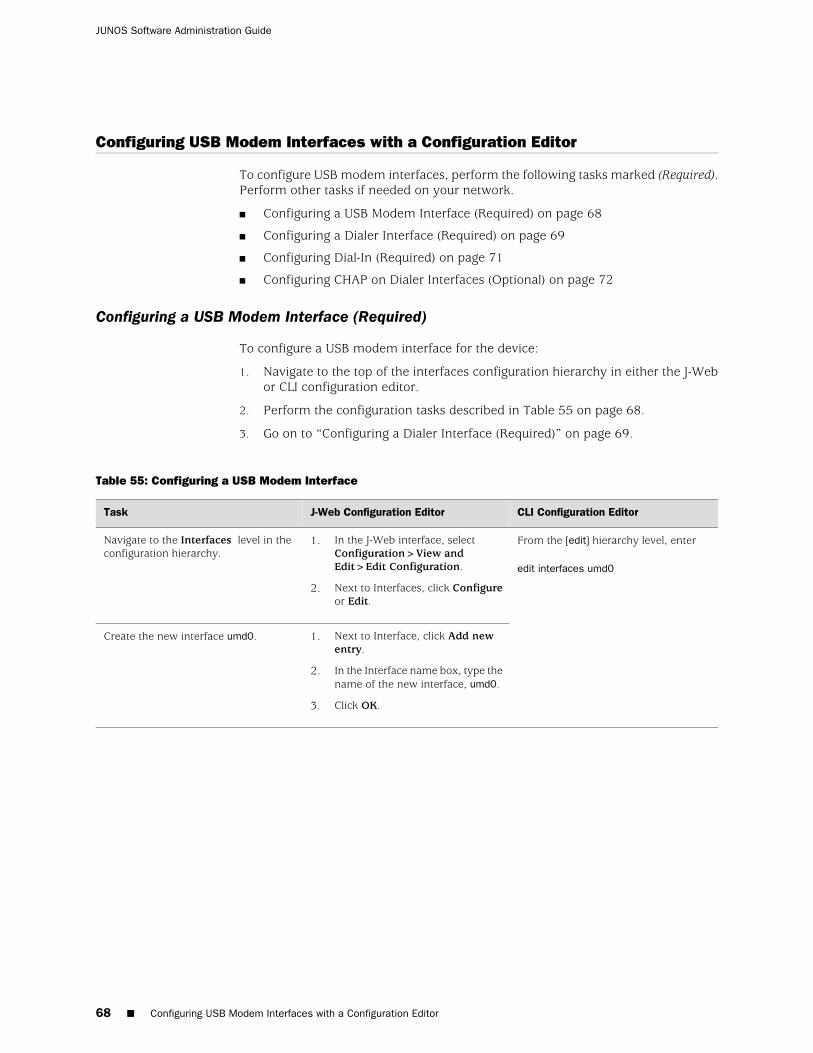
Configuring USB Modem Interfaces with a Configuration Editor
To configure USB modem interfaces, perform the following tasks marked (Required).Perform other tasks if needed on your network.
■ Configuring a USB Modem Interface (Required) on page 68
■ Configuring a Dialer Interface (Required) on page 69
■ Configuring Dial-In (Required) on page 71
■ Configuring CHAP on Dialer Interfaces (Optional) on page 72
Configuring a USB Modem Interface (Required)
To configure a USB modem interface for the device:
1. Navigate to the top of the interfaces configuration hierarchy in either the J-Webor CLI configuration editor.
2. Perform the configuration tasks described in Table 55 on page 68.
3. Go on to “Configuring a Dialer Interface (Required)” on page 69.
Table 55: Configuring a USB Modem Interface
CLI Configuration EditorJ-Web Configuration EditorTask
From the [edit] hierarchy level, enter
edit interfaces umd0
1. In the J-Web interface, selectConfiguration>View andEdit>Edit Configuration.
2. Next to Interfaces, click Configureor Edit.
Navigate to the Interfaces level in theconfiguration hierarchy.
1. Next to Interface, click Add newentry.
2. In the Interface name box, type thename of the new interface, umd0.
3. Click OK.
Create the new interface umd0.
68 ■ Configuring USB Modem Interfaces with a Configuration Editor
JUNOS Software Administration Guide
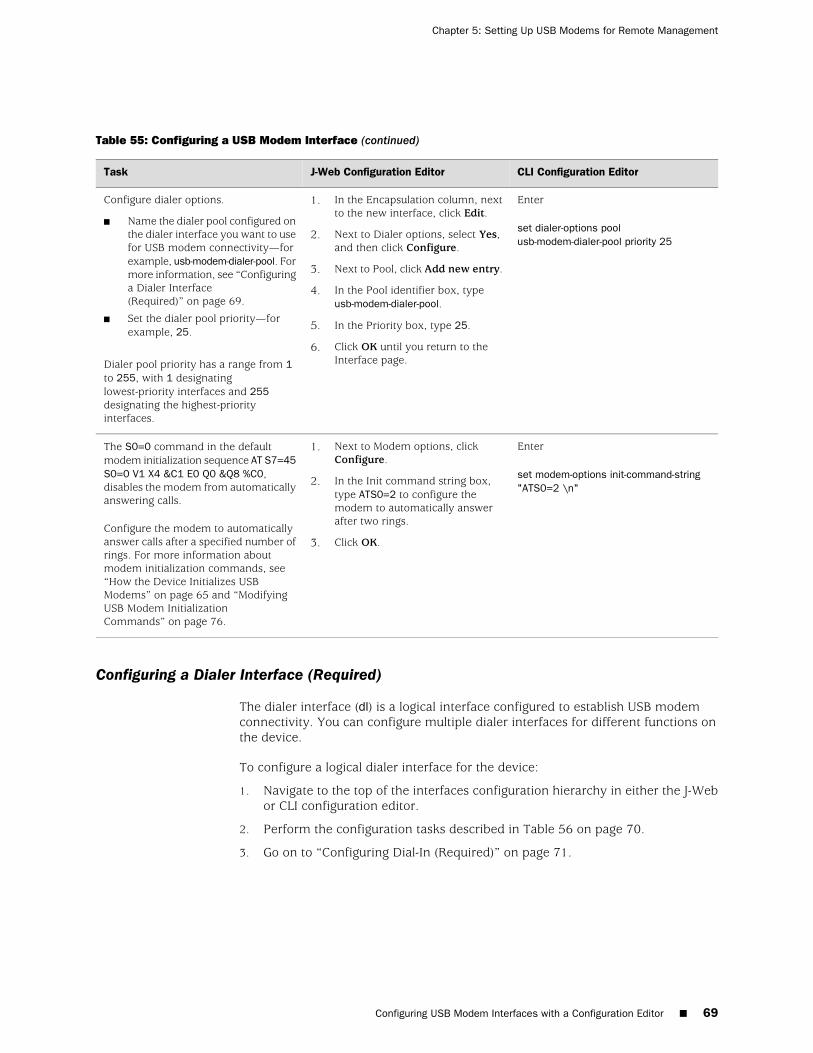
Table 55: Configuring a USB Modem Interface (continued)
CLI Configuration EditorJ-Web Configuration EditorTask
Enter
set dialer-options poolusb-modem-dialer-pool priority 25
1. In the Encapsulation column, nextto the new interface, click Edit.
2. Next to Dialer options, select Yes,and then click Configure.
3. Next to Pool, click Add new entry.
4. In the Pool identifier box, typeusb-modem-dialer-pool.
5. In the Priority box, type 25.
6. Click OK until you return to theInterface page.
Configure dialer options.
■ Name the dialer pool configured onthe dialer interface you want to usefor USB modem connectivity—forexample, usb-modem-dialer-pool. Formore information, see “Configuringa Dialer Interface(Required)” on page 69.
■ Set the dialer pool priority—forexample, 25.
Dialer pool priority has a range from 1to 255, with 1 designatinglowest-priority interfaces and 255designating the highest-priorityinterfaces.
Enter
set modem-options init-command-string"ATS0=2 \n"
1. Next to Modem options, clickConfigure.
2. In the Init command string box,type ATS0=2 to configure themodem to automatically answerafter two rings.
3. Click OK.
The S0=0 command in the defaultmodem initialization sequence AT S7=45S0=0 V1 X4 &C1 E0 Q0 &Q8 %C0,disables the modem from automaticallyanswering calls.
Configure the modem to automaticallyanswer calls after a specified number ofrings. For more information aboutmodem initialization commands, see“How the Device Initializes USBModems” on page 65 and “ModifyingUSB Modem InitializationCommands” on page 76.
Configuring a Dialer Interface (Required)
The dialer interface (dl) is a logical interface configured to establish USB modemconnectivity. You can configure multiple dialer interfaces for different functions onthe device.
To configure a logical dialer interface for the device:
1. Navigate to the top of the interfaces configuration hierarchy in either the J-Webor CLI configuration editor.
2. Perform the configuration tasks described in Table 56 on page 70.
3. Go on to “Configuring Dial-In (Required)” on page 71.
Configuring USB Modem Interfaces with a Configuration Editor ■ 69
Chapter 5: Setting Up USB Modems for Remote Management
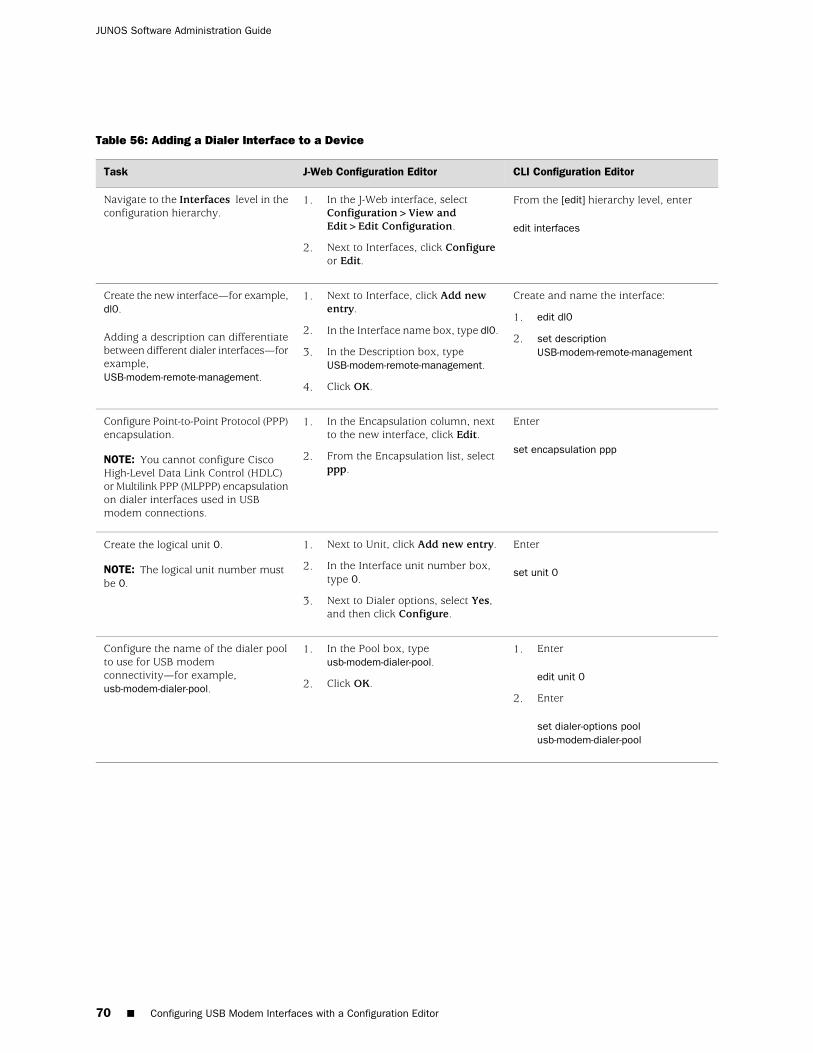
Table 56: Adding a Dialer Interface to a Device
CLI Configuration EditorJ-Web Configuration EditorTask
From the [edit] hierarchy level, enter
edit interfaces
1. In the J-Web interface, selectConfiguration>View andEdit>Edit Configuration.
2. Next to Interfaces, click Configureor Edit.
Navigate to the Interfaces level in theconfiguration hierarchy.
Create and name the interface:
1. edit dl0
2. set descriptionUSB-modem-remote-management
1. Next to Interface, click Add newentry.
2. In the Interface name box, type dl0.
3. In the Description box, typeUSB-modem-remote-management.
4. Click OK.
Create the new interface—for example,dl0.
Adding a description can differentiatebetween different dialer interfaces—forexample,USB-modem-remote-management.
Enter
set encapsulation ppp
1. In the Encapsulation column, nextto the new interface, click Edit.
2. From the Encapsulation list, selectppp.
Configure Point-to-Point Protocol (PPP)encapsulation.
NOTE: You cannot configure CiscoHigh-Level Data Link Control (HDLC)or Multilink PPP (MLPPP) encapsulationon dialer interfaces used in USBmodem connections.
Enter
set unit 0
1. Next to Unit, click Add new entry.
2. In the Interface unit number box,type 0.
3. Next to Dialer options, select Yes,and then click Configure.
Create the logical unit 0.
NOTE: The logical unit number mustbe 0.
1. Enter
edit unit 0
2. Enter
set dialer-options poolusb-modem-dialer-pool
1. In the Pool box, typeusb-modem-dialer-pool.
2. Click OK.
Configure the name of the dialer poolto use for USB modemconnectivity—for example,usb-modem-dialer-pool.
70 ■ Configuring USB Modem Interfaces with a Configuration Editor
JUNOS Software Administration Guide
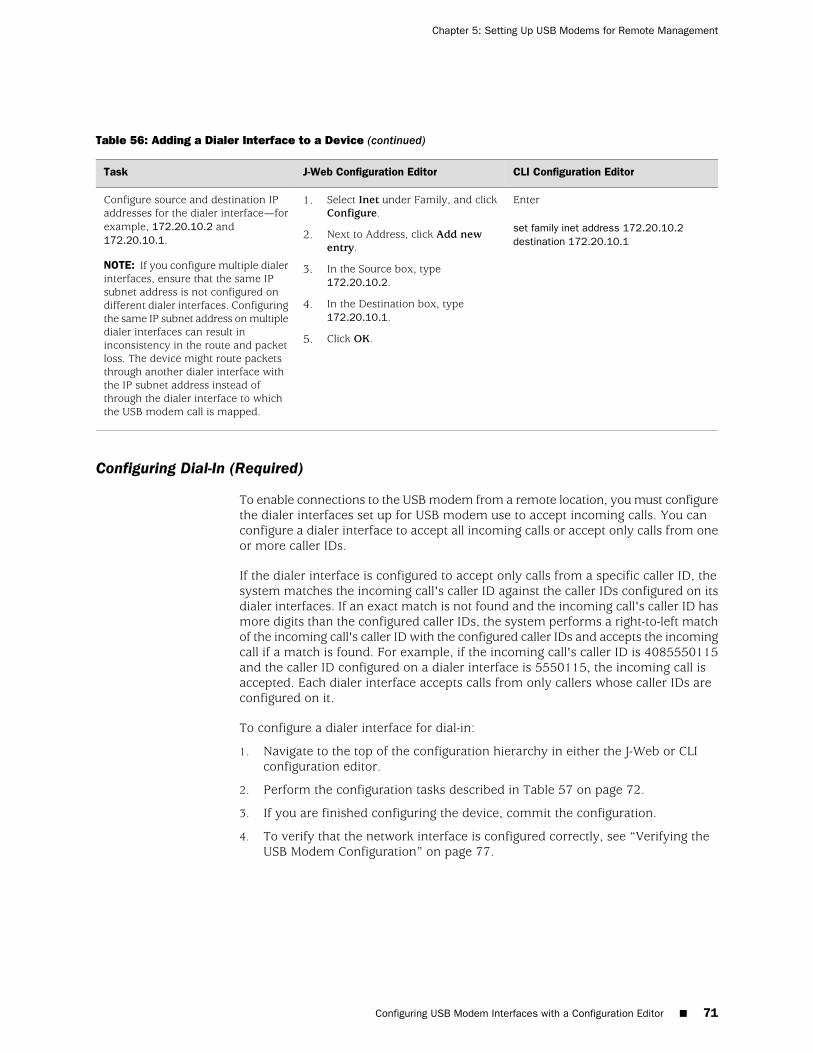
Table 56: Adding a Dialer Interface to a Device (continued)
CLI Configuration EditorJ-Web Configuration EditorTask
Enter
set family inet address 172.20.10.2destination 172.20.10.1
1. Select Inet under Family, and clickConfigure.
2. Next to Address, click Add newentry.
3. In the Source box, type172.20.10.2.
4. In the Destination box, type172.20.10.1.
5. Click OK.
Configure source and destination IPaddresses for the dialer interface—forexample, 172.20.10.2 and172.20.10.1.
NOTE: If you configure multiple dialerinterfaces, ensure that the same IPsubnet address is not configured ondifferent dialer interfaces. Configuringthe same IP subnet address on multipledialer interfaces can result ininconsistency in the route and packetloss. The device might route packetsthrough another dialer interface withthe IP subnet address instead ofthrough the dialer interface to whichthe USB modem call is mapped.
Configuring Dial-In (Required)
To enable connections to the USB modem from a remote location, you must configurethe dialer interfaces set up for USB modem use to accept incoming calls. You canconfigure a dialer interface to accept all incoming calls or accept only calls from oneor more caller IDs.
If the dialer interface is configured to accept only calls from a specific caller ID, thesystem matches the incoming call's caller ID against the caller IDs configured on itsdialer interfaces. If an exact match is not found and the incoming call's caller ID hasmore digits than the configured caller IDs, the system performs a right-to-left matchof the incoming call's caller ID with the configured caller IDs and accepts the incomingcall if a match is found. For example, if the incoming call's caller ID is 4085550115and the caller ID configured on a dialer interface is 5550115, the incoming call isaccepted. Each dialer interface accepts calls from only callers whose caller IDs areconfigured on it.
To configure a dialer interface for dial-in:
1. Navigate to the top of the configuration hierarchy in either the J-Web or CLIconfiguration editor.
2. Perform the configuration tasks described in Table 57 on page 72.
3. If you are finished configuring the device, commit the configuration.
4. To verify that the network interface is configured correctly, see “Verifying theUSB Modem Configuration” on page 77.
Configuring USB Modem Interfaces with a Configuration Editor ■ 71
Chapter 5: Setting Up USB Modems for Remote Management
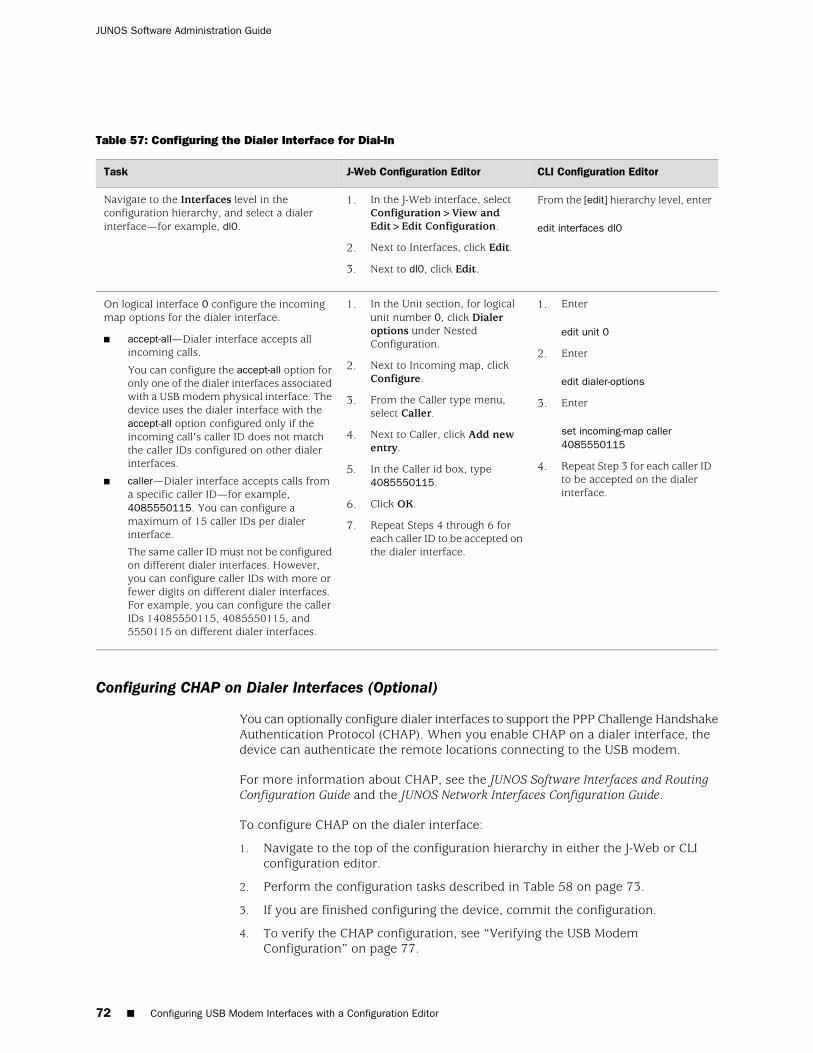
Table 57: Configuring the Dialer Interface for Dial-In
CLI Configuration EditorJ-Web Configuration EditorTask
From the [edit] hierarchy level, enter
edit interfaces dl0
1. In the J-Web interface, selectConfiguration>View andEdit>Edit Configuration.
2. Next to Interfaces, click Edit.
3. Next to dl0, click Edit.
Navigate to the Interfaces level in theconfiguration hierarchy, and select a dialerinterface—for example, dl0.
1. Enter
edit unit 0
2. Enter
edit dialer-options
3. Enter
set incoming-map caller4085550115
4. Repeat Step 3 for each caller IDto be accepted on the dialerinterface.
1. In the Unit section, for logicalunit number 0, click Dialeroptions under NestedConfiguration.
2. Next to Incoming map, clickConfigure.
3. From the Caller type menu,select Caller.
4. Next to Caller, click Add newentry.
5. In the Caller id box, type4085550115.
6. Click OK.
7. Repeat Steps 4 through 6 foreach caller ID to be accepted onthe dialer interface.
On logical interface 0 configure the incomingmap options for the dialer interface.
■ accept-all—Dialer interface accepts allincoming calls.
You can configure the accept-all option foronly one of the dialer interfaces associatedwith a USB modem physical interface. Thedevice uses the dialer interface with theaccept-all option configured only if theincoming call's caller ID does not matchthe caller IDs configured on other dialerinterfaces.
■ caller—Dialer interface accepts calls froma specific caller ID—for example,4085550115. You can configure amaximum of 15 caller IDs per dialerinterface.
The same caller ID must not be configuredon different dialer interfaces. However,you can configure caller IDs with more orfewer digits on different dialer interfaces.For example, you can configure the callerIDs 14085550115, 4085550115, and5550115 on different dialer interfaces.
Configuring CHAP on Dialer Interfaces (Optional)
You can optionally configure dialer interfaces to support the PPP Challenge HandshakeAuthentication Protocol (CHAP). When you enable CHAP on a dialer interface, thedevice can authenticate the remote locations connecting to the USB modem.
For more information about CHAP, see the JUNOS Software Interfaces and RoutingConfiguration Guide and the JUNOS Network Interfaces Configuration Guide.
To configure CHAP on the dialer interface:
1. Navigate to the top of the configuration hierarchy in either the J-Web or CLIconfiguration editor.
2. Perform the configuration tasks described in Table 58 on page 73.
3. If you are finished configuring the device, commit the configuration.
4. To verify the CHAP configuration, see “Verifying the USB ModemConfiguration” on page 77.
72 ■ Configuring USB Modem Interfaces with a Configuration Editor
JUNOS Software Administration Guide
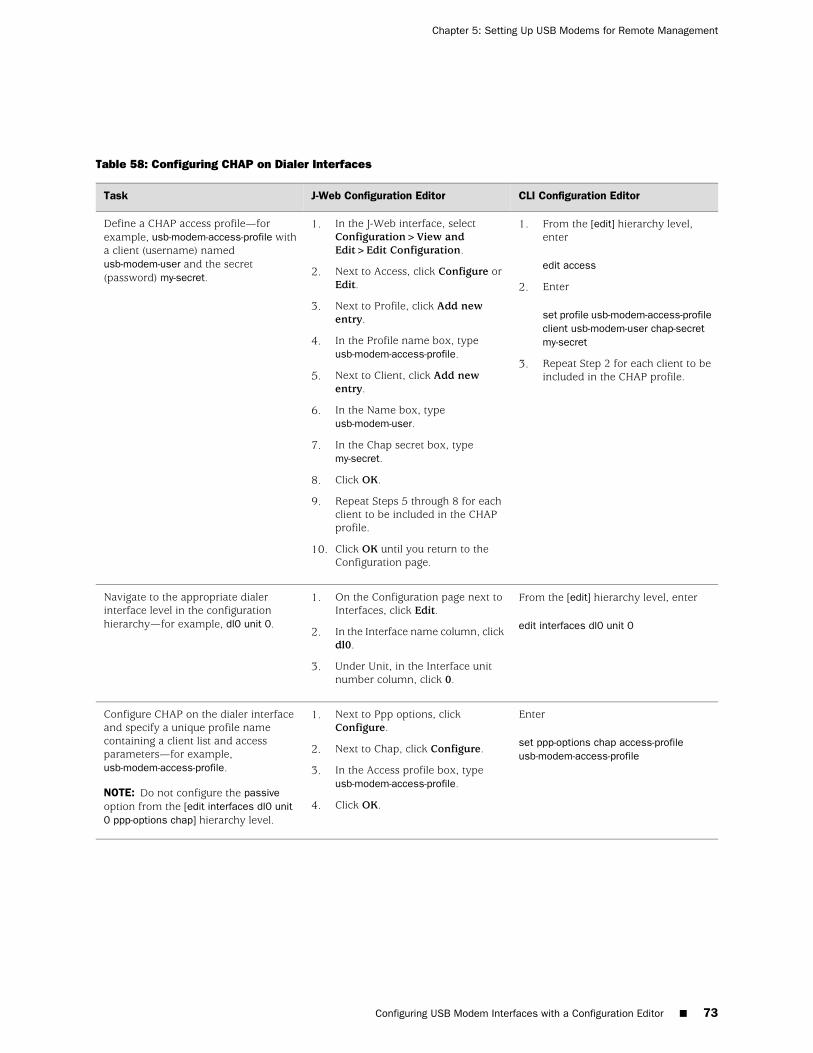
Table 58: Configuring CHAP on Dialer Interfaces
CLI Configuration EditorJ-Web Configuration EditorTask
1. From the [edit] hierarchy level,enter
edit access
2. Enter
set profile usb-modem-access-profileclient usb-modem-user chap-secretmy-secret
3. Repeat Step 2 for each client to beincluded in the CHAP profile.
1. In the J-Web interface, selectConfiguration>View andEdit>Edit Configuration.
2. Next to Access, click Configure orEdit.
3. Next to Profile, click Add newentry.
4. In the Profile name box, typeusb-modem-access-profile.
5. Next to Client, click Add newentry.
6. In the Name box, typeusb-modem-user.
7. In the Chap secret box, typemy-secret.
8. Click OK.
9. Repeat Steps 5 through 8 for eachclient to be included in the CHAPprofile.
10. Click OK until you return to theConfiguration page.
Define a CHAP access profile—forexample, usb-modem-access-profile witha client (username) namedusb-modem-user and the secret(password) my-secret.
From the [edit] hierarchy level, enter
edit interfaces dl0 unit 0
1. On the Configuration page next toInterfaces, click Edit.
2. In the Interface name column, clickdl0.
3. Under Unit, in the Interface unitnumber column, click 0.
Navigate to the appropriate dialerinterface level in the configurationhierarchy—for example, dl0 unit 0.
Enter
set ppp-options chap access-profileusb-modem-access-profile
1. Next to Ppp options, clickConfigure.
2. Next to Chap, click Configure.
3. In the Access profile box, typeusb-modem-access-profile.
4. Click OK.
Configure CHAP on the dialer interfaceand specify a unique profile namecontaining a client list and accessparameters—for example,usb-modem-access-profile.
NOTE: Do not configure the passiveoption from the [edit interfaces dl0 unit0 ppp-options chap] hierarchy level.
Configuring USB Modem Interfaces with a Configuration Editor ■ 73
Chapter 5: Setting Up USB Modems for Remote Management
Connecting to the Device from the User End
NOTE: These instructions describe connecting to the device from a remote PC orlaptop computer running Microsoft Windows XP. If your remote PC or laptopcomputer does not run Microsoft Windows XP, see the documentation for youroperating system and enter equivalent commands.
This section contains the following topics:
■ Configuring a Dial-Up Modem Connection at the User End on page 74
■ Connecting to the Device from the User End on page 75
Configuring a Dial-Up Modem Connection at the User End
To remotely connect to the USB modem connected to the USB port on the device,you must configure a dial-up modem connection on the PC or laptop computer atyour remote location. Configure the dial-up modem connection properties to disableIP header compression.
To configure a dial-up modem connection at the user end:
1. At your remote location, connect a modem to a management device such as aPC or laptop computer.
2. Connect the modem to your telephone network.
3. On the PC or laptop computer, select Start>Settings>Control Panel>NetworkConnections.
The Network Connections page is displayed.
4. Click Create a new connection.
The New Connection Wizard is displayed.
5. Click Next.
The New Connection Wizard: Network Connection Type page is displayed.
6. Select Connect to the network at my workplace, and then click Next.
The New Connection Wizard: Network Connection page is displayed.
7. Select Dial-up connection, and then click Next.
The New Connection Wizard: Connection Name page is displayed.
8. In the Company Name box, type the dial-up connection name—for example,USB-modem-connect—and then click Next.
The New Connection Wizard: Phone Number to Dial page is displayed.
9. In the Phone number box, type the telephone number of the PSTN line connectedto the USB modem at the device end.
10. Click Next twice, and then click Finish.
74 ■ Connecting to the Device from the User End
JUNOS Software Administration Guide
The Connect USB-modem-connect page is displayed.
11. If CHAP is configured on the dialer interface used for the USB modem interfaceat the device end, type the username and password configured in the CHAPconfiguration in the User name and Password boxes. For information aboutconfiguring CHAP on dialer interfaces, see “Configuring CHAP on Dialer Interfaces(Optional)” on page 72.
12. Click Properties.
The USB-modem-connect Properties page is displayed.
13. In the Networking tab, select Internet Protocol (TCP/IP), and then clickProperties.
The Internet Protocol (TCP/IP) Properties page is displayed.
14. Click Advanced.
The Advanced TCP/IP Settings page appears.
15. Clear the Use IP header compression check box.
Connecting to the Device from the User End
To remotely connect to the device through a USB modem connected to the USB porton the device:
1. On the PC or laptop computer at your remote location, selectStart>Settings>Control Panel>Network Connections.
The Network Connections page is displayed.
2. Double-click the USB-modem-connect dial-up connection configured in“Configuring a Dial-Up Modem Connection at the User End” on page 74.
The Connect USB-modem-connect page is displayed.
3. Click Dial to connect to the J-series or SRX-series device.
When the connection is complete, you can use Telnet or SSH to connect to thedevice.
Administering USB Modems
This section contains the following topics:
■ Modifying USB Modem Initialization Commands on page 76
■ Resetting USB Modems on page 77
Administering USB Modems ■ 75
Chapter 5: Setting Up USB Modems for Remote Management
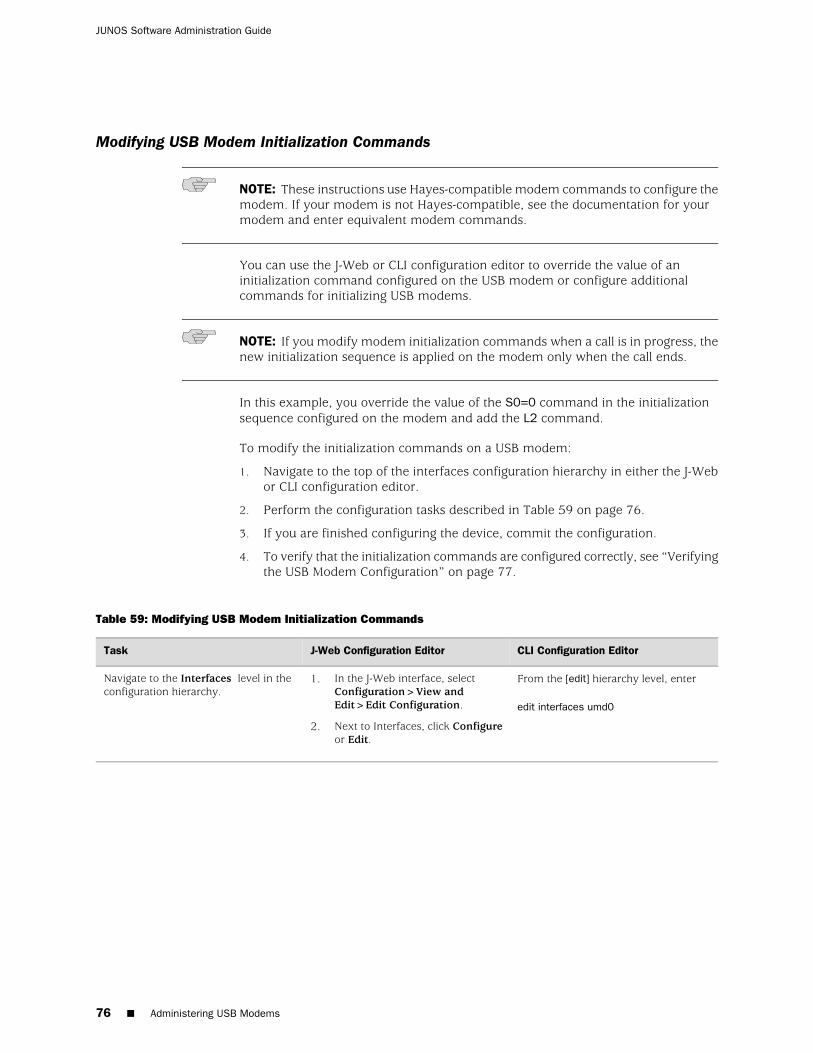
Modifying USB Modem Initialization Commands
NOTE: These instructions use Hayes-compatible modem commands to configure themodem. If your modem is not Hayes-compatible, see the documentation for yourmodem and enter equivalent modem commands.
You can use the J-Web or CLI configuration editor to override the value of aninitialization command configured on the USB modem or configure additionalcommands for initializing USB modems.
NOTE: If you modify modem initialization commands when a call is in progress, thenew initialization sequence is applied on the modem only when the call ends.
In this example, you override the value of the S0=0 command in the initializationsequence configured on the modem and add the L2 command.
To modify the initialization commands on a USB modem:
1. Navigate to the top of the interfaces configuration hierarchy in either the J-Webor CLI configuration editor.
2. Perform the configuration tasks described in Table 59 on page 76.
3. If you are finished configuring the device, commit the configuration.
4. To verify that the initialization commands are configured correctly, see “Verifyingthe USB Modem Configuration” on page 77.
Table 59: Modifying USB Modem Initialization Commands
CLI Configuration EditorJ-Web Configuration EditorTask
From the [edit] hierarchy level, enter
edit interfaces umd0
1. In the J-Web interface, selectConfiguration>View andEdit>Edit Configuration.
2. Next to Interfaces, click Configureor Edit.
Navigate to the Interfaces level in theconfiguration hierarchy.
76 ■ Administering USB Modems
JUNOS Software Administration Guide
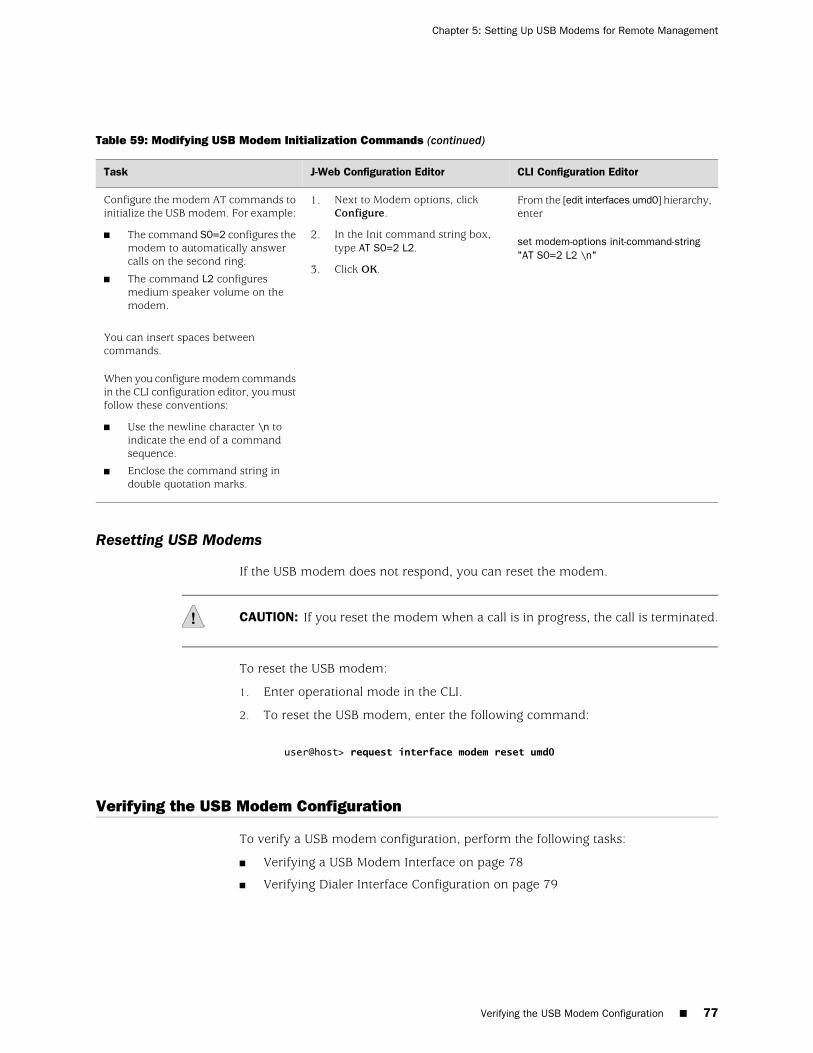
Table 59: Modifying USB Modem Initialization Commands (continued)
CLI Configuration EditorJ-Web Configuration EditorTask
From the [edit interfaces umd0] hierarchy,enter
set modem-options init-command-string"AT S0=2 L2 \n"
1. Next to Modem options, clickConfigure.
2. In the Init command string box,type AT S0=2 L2.
3. Click OK.
Configure the modem AT commands toinitialize the USB modem. For example:
■ The command S0=2 configures themodem to automatically answercalls on the second ring.
■ The command L2 configuresmedium speaker volume on themodem.
You can insert spaces betweencommands.
When you configure modem commandsin the CLI configuration editor, you mustfollow these conventions:
■ Use the newline character \n toindicate the end of a commandsequence.
■ Enclose the command string indouble quotation marks.
Resetting USB Modems
If the USB modem does not respond, you can reset the modem.
CAUTION: If you reset the modem when a call is in progress, the call is terminated.
To reset the USB modem:
1. Enter operational mode in the CLI.
2. To reset the USB modem, enter the following command:
user@host> request interface modem reset umd0
Verifying the USB Modem Configuration
To verify a USB modem configuration, perform the following tasks:
■ Verifying a USB Modem Interface on page 78
■ Verifying Dialer Interface Configuration on page 79
Verifying the USB Modem Configuration ■ 77
Chapter 5: Setting Up USB Modems for Remote Management
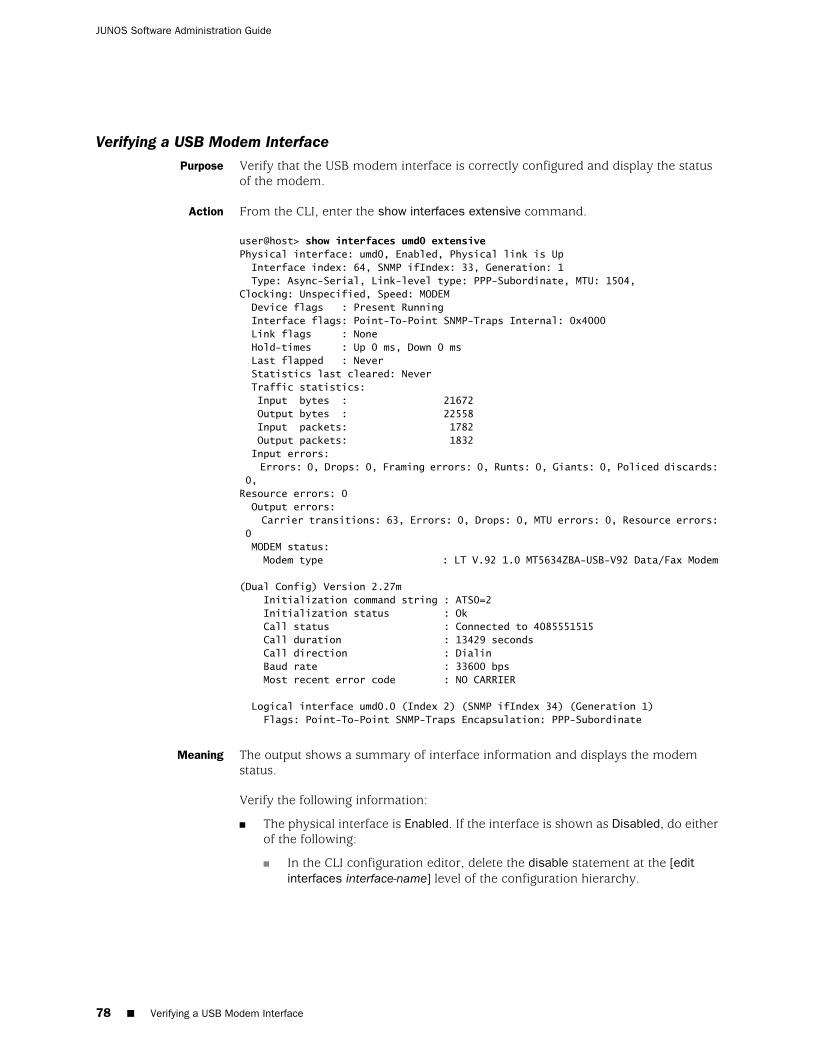
Verifying a USB Modem InterfacePurpose Verify that the USB modem interface is correctly configured and display the status
of the modem.
Action From the CLI, enter the show interfaces extensive command.
user@host> show interfaces umd0 extensivePhysical interface: umd0, Enabled, Physical link is Up Interface index: 64, SNMP ifIndex: 33, Generation: 1 Type: Async-Serial, Link-level type: PPP-Subordinate, MTU: 1504, Clocking: Unspecified, Speed: MODEM Device flags : Present Running Interface flags: Point-To-Point SNMP-Traps Internal: 0x4000 Link flags : None Hold-times : Up 0 ms, Down 0 ms Last flapped : Never Statistics last cleared: Never Traffic statistics: Input bytes : 21672 Output bytes : 22558 Input packets: 1782 Output packets: 1832 Input errors: Errors: 0, Drops: 0, Framing errors: 0, Runts: 0, Giants: 0, Policed discards: 0, Resource errors: 0 Output errors: Carrier transitions: 63, Errors: 0, Drops: 0, MTU errors: 0, Resource errors: 0 MODEM status: Modem type : LT V.92 1.0 MT5634ZBA-USB-V92 Data/Fax Modem
(Dual Config) Version 2.27m Initialization command string : ATS0=2 Initialization status : Ok Call status : Connected to 4085551515 Call duration : 13429 seconds Call direction : Dialin Baud rate : 33600 bps Most recent error code : NO CARRIER
Logical interface umd0.0 (Index 2) (SNMP ifIndex 34) (Generation 1) Flags: Point-To-Point SNMP-Traps Encapsulation: PPP-Subordinate
Meaning The output shows a summary of interface information and displays the modemstatus.
Verify the following information:
■ The physical interface is Enabled. If the interface is shown as Disabled, do eitherof the following:
■ In the CLI configuration editor, delete the disable statement at the [editinterfaces interface-name] level of the configuration hierarchy.
78 ■ Verifying a USB Modem Interface
JUNOS Software Administration Guide
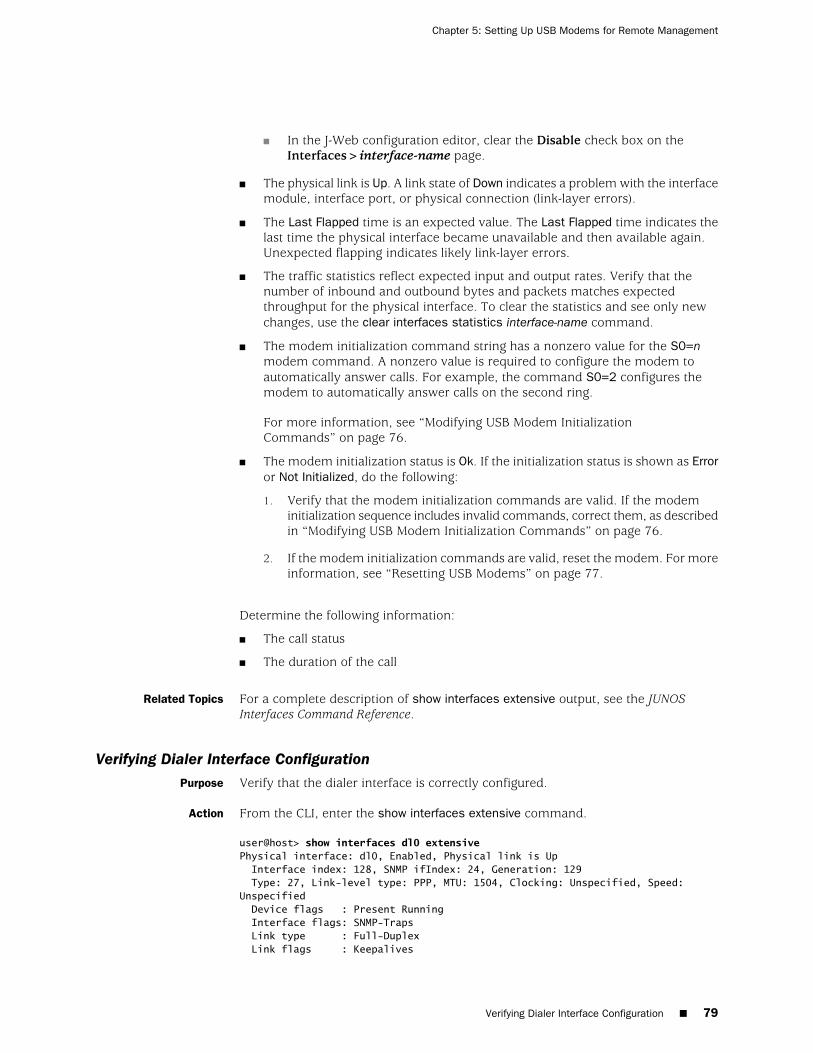
■ In the J-Web configuration editor, clear the Disable check box on theInterfaces>interface-name page.
■ The physical link is Up. A link state of Down indicates a problem with the interfacemodule, interface port, or physical connection (link-layer errors).
■ The Last Flapped time is an expected value. The Last Flapped time indicates thelast time the physical interface became unavailable and then available again.Unexpected flapping indicates likely link-layer errors.
■ The traffic statistics reflect expected input and output rates. Verify that thenumber of inbound and outbound bytes and packets matches expectedthroughput for the physical interface. To clear the statistics and see only newchanges, use the clear interfaces statistics interface-name command.
■ The modem initialization command string has a nonzero value for the S0=nmodem command. A nonzero value is required to configure the modem toautomatically answer calls. For example, the command S0=2 configures themodem to automatically answer calls on the second ring.
For more information, see “Modifying USB Modem InitializationCommands” on page 76.
■ The modem initialization status is Ok. If the initialization status is shown as Erroror Not Initialized, do the following:
1. Verify that the modem initialization commands are valid. If the modeminitialization sequence includes invalid commands, correct them, as describedin “Modifying USB Modem Initialization Commands” on page 76.
2. If the modem initialization commands are valid, reset the modem. For moreinformation, see “Resetting USB Modems” on page 77.
Determine the following information:
■ The call status
■ The duration of the call
Related Topics For a complete description of show interfaces extensive output, see the JUNOSInterfaces Command Reference.
Verifying Dialer Interface ConfigurationPurpose Verify that the dialer interface is correctly configured.
Action From the CLI, enter the show interfaces extensive command.
user@host> show interfaces dl0 extensivePhysical interface: dl0, Enabled, Physical link is Up Interface index: 128, SNMP ifIndex: 24, Generation: 129 Type: 27, Link-level type: PPP, MTU: 1504, Clocking: Unspecified, Speed: Unspecified Device flags : Present Running Interface flags: SNMP-Traps Link type : Full-Duplex Link flags : Keepalives
Verifying Dialer Interface Configuration ■ 79
Chapter 5: Setting Up USB Modems for Remote Management
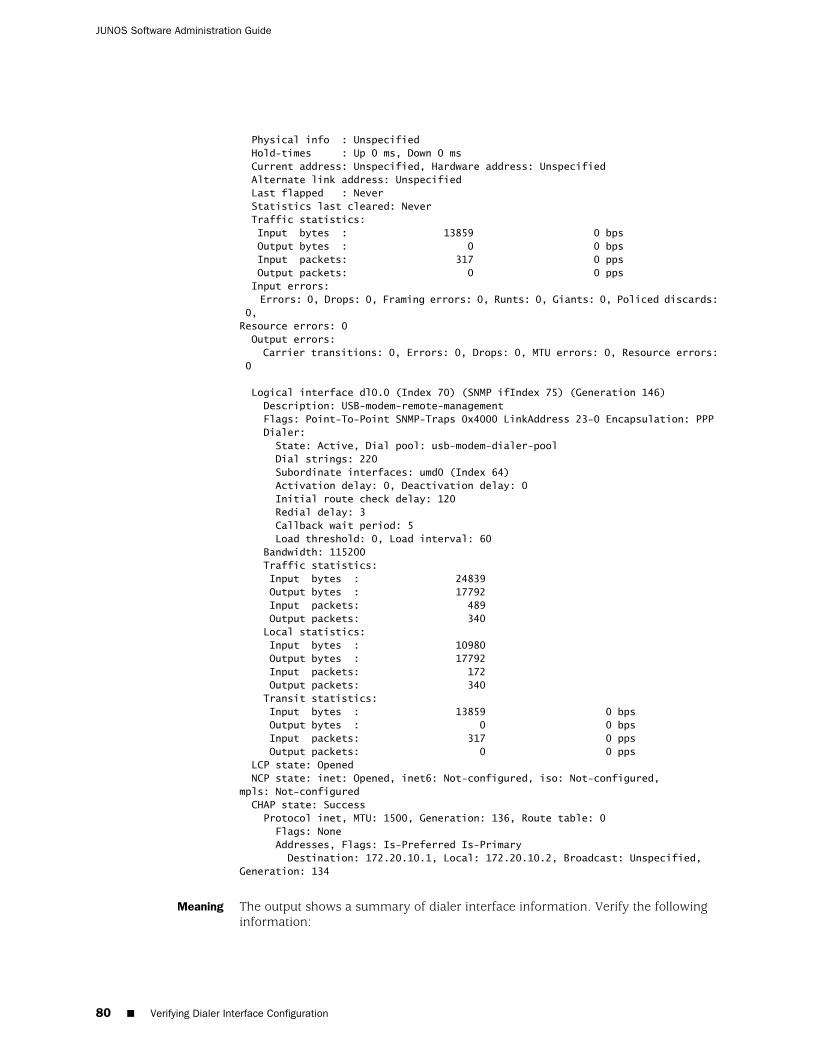
Physical info : Unspecified Hold-times : Up 0 ms, Down 0 ms Current address: Unspecified, Hardware address: Unspecified Alternate link address: Unspecified Last flapped : Never Statistics last cleared: Never Traffic statistics: Input bytes : 13859 0 bps Output bytes : 0 0 bps Input packets: 317 0 pps Output packets: 0 0 pps Input errors: Errors: 0, Drops: 0, Framing errors: 0, Runts: 0, Giants: 0, Policed discards: 0, Resource errors: 0 Output errors: Carrier transitions: 0, Errors: 0, Drops: 0, MTU errors: 0, Resource errors: 0
Logical interface dl0.0 (Index 70) (SNMP ifIndex 75) (Generation 146) Description: USB-modem-remote-management Flags: Point-To-Point SNMP-Traps 0x4000 LinkAddress 23-0 Encapsulation: PPP Dialer: State: Active, Dial pool: usb-modem-dialer-pool Dial strings: 220 Subordinate interfaces: umd0 (Index 64) Activation delay: 0, Deactivation delay: 0 Initial route check delay: 120 Redial delay: 3 Callback wait period: 5 Load threshold: 0, Load interval: 60 Bandwidth: 115200 Traffic statistics: Input bytes : 24839 Output bytes : 17792 Input packets: 489 Output packets: 340 Local statistics: Input bytes : 10980 Output bytes : 17792 Input packets: 172 Output packets: 340 Transit statistics: Input bytes : 13859 0 bps Output bytes : 0 0 bps Input packets: 317 0 pps Output packets: 0 0 pps LCP state: Opened NCP state: inet: Opened, inet6: Not-configured, iso: Not-configured, mpls: Not-configured CHAP state: Success Protocol inet, MTU: 1500, Generation: 136, Route table: 0 Flags: None Addresses, Flags: Is-Preferred Is-Primary Destination: 172.20.10.1, Local: 172.20.10.2, Broadcast: Unspecified, Generation: 134
Meaning The output shows a summary of dialer interface information. Verify the followinginformation:
80 ■ Verifying Dialer Interface Configuration
JUNOS Software Administration Guide

■ The physical interface is Enabled. If the interface is shown as Disabled, do eitherof the following:
■ In the CLI configuration editor, delete the disable statement at the [editinterfaces interface-name] level of the configuration hierarchy.
■ In the J-Web configuration editor, clear the Disable check box on theInterfaces>interface-name page.
■ The physical link is Up. A link state of Down indicates a problem with the interfacemodule, interface port, or physical connection (link-layer errors).
■ The Last Flapped time is an expected value. The Last Flapped time indicates thelast time the physical interface became unavailable and then available again.Unexpected flapping indicates possible link-layer errors.
■ The traffic statistics reflect expected input and output rates. Verify that thenumber of inbound and outbound bytes and packets matches expectedthroughput for the physical interface. To clear the statistics and see only newchanges, use the clear interfaces statistics interface-name command.
■ The dialer state is Active when a USB modem call is in progress.
■ The LCP state is Opened when a USB modem call is in progress. An LCP state ofClosed or Not Configured indicates a problem with the dialer configuration thatneeds to be debugged with the monitor traffic interface interface-name command.For information about the monitor traffic command, see “Using the monitor trafficCommand” on page 383.
Related Topics For a complete description of show interfaces dl0 extensive output, see the JUNOSInterfaces Command Reference.
Verifying Dialer Interface Configuration ■ 81
Chapter 5: Setting Up USB Modems for Remote Management

82 ■ Verifying Dialer Interface Configuration
JUNOS Software Administration Guide
Chapter 6
Configuring SNMP for NetworkManagement
The Simple Network Management Protocol (SNMP) enables the monitoring of networkdevices from a central location.
You can use either J-Web Quick Configuration or a configuration editor to configureSNMP.
NOTE: SNMP is not supported on Gigabit Ethernet interfaces on J-series ServicesRouters.
This chapter contains the following topics. For more information about SNMP, seethe JUNOS Network Management Configuration Guide.
■ SNMP Network Management Support On Different Device Types on page 83
■ SNMP Architecture on page 84
■ Before You Begin on page 86
■ Configuring SNMP with Quick Configuration on page 87
■ Configuring SNMP with a Configuration Editor on page 91
■ Verifying the SNMP Configuration on page 95
SNMP Network Management Support On Different Device Types
The following table lists SNMP network management features, specifies whether thefeatures are supported on various device types, and indicates where you can findmore information about each feature.
Table 60: Support Information: SNMP Network Management
More Information
SRX-seriesServicesGateways
J-seriesServicesRoutersFeature
“SNMP Architecture” on page 84YesYesSNMP v1, v2, v3
SNMP Network Management Support On Different Device Types ■ 83
SNMP Architecture
Use SNMP to determine where and when a network failure is occurring, and to gatherstatistics about network performance in order to evaluate the overall health of thenetwork and identify bottlenecks.
Because SNMP is a client/server protocol, SNMP nodes can be classified as eitherclients (SNMP managers) or servers (SNMP agents). SNMP managers, also callednetwork management systems (NMSs), occupy central points in the network andactively query and collect messages from SNMP agents in the network. SNMP agentsare individual processes running on network nodes that gather information for aparticular node and transfer the information to SNMP managers as queries areprocessed. The agent also controls access to the agent’s Management InformationBase (MIB), the collection of objects that can be viewed or changed by the SNMPmanager. Because SNMP agents are individual SNMP processes running on a host,multiple agents can be active on a single network node at any given time.
Communication between the agent and the manager occurs in one of the followingforms:
■ Get, GetBulk, and GetNext requests—The manager requests information fromthe agent, and the agent returns the information in a Get response message.
■ Set requests—The manager changes the value of a MIB object controlled by theagent, and the agent indicates status in a Set response message.
■ Traps notification—The agent sends traps to notify the manager of significantevents that occur on the network device.
Management Information Base
Agents store information in a hierarchical database called the Structure ofManagement Information (SMI). The SMI resembles a file system. Information isstored in individual files that are hierarchically arranged in the database. The individualfiles that store the information are known as Management Information Bases (MIBs).Each MIB contains nodes of information that are stored in a tree structure. Informationbranches down from a root node to individual leaves in the tree, and the individualleaves comprise the information that is queried by managers for a given MIB. Thenodes of information are identified by an object ID (OID). The OID is a dotted integeridentifier (1.3.6.1.2.1.2, for instance) or a subtree name (such as interfaces) thatcorresponds to an indivisible piece of information in the MIB.
MIBs are either standard or enterprise-specific. Standard MIBs are created by theInternet Engineering Task Force (IETF) and documented in various RFCs. Dependingon the vendor, many standard MIBs are delivered with the NMS software. You canalso download the standard MIBs from the IETF Web site, http://www.ietf.org, andcompile them into your NMS, if necessary.
For a list of standard and enterprise-specific supported MIBS, see the JUNOS NetworkManagement Configuration Guide.
Enterprise-specific MIBs are developed and supported by a specific equipmentmanufacturer. If your network contains devices that have enterprise-specific MIBs,
84 ■ SNMP Architecture
JUNOS Software Administration Guide

you must obtain them from the manufacturer and compile them into your networkmanagement software.
To download enterprise MIBs for a device, go tohttp://www.juniper.net/techpubs/software/index_mibs.html.
SNMP Communities
You can grant access to only specific SNMP managers for particular SNMP agents bycreating SNMP communities. The community is assigned a name that is unique onthe host. All SNMP requests that are sent to the agent must be configured with thesame community name. When multiple agents are configured on a particular host,the community name process ensures that SNMP requests are sorted to only thoseagents configured to handle the requests.
Additionally, communities allow you to specify one or more addresses or addressprefixes to which you want to either allow or deny access. By specifying a list ofclients, you can control exactly which SNMP managers have access to a particularagent.
SNMP Traps
The get and set commands that SNMP uses are useful for querying hosts within anetwork. However, the commands do not provide a means by which events cantrigger a notification. For instance, if a link fails, the health of the link is unknownuntil an SNMP manager next queries that agent.
SNMP traps are unsolicited notifications that are triggered by events on the host.When you configure a trap, you specify the types of events that can trigger trapmessages, and you configure a set of targets to receive the generated messages.
SNMP traps enable an agent to notify a network management system (NMS) ofsignificant events. You can configure an event policy action that uses system logmessages to initiate traps for events. The traps enable an SNMP trap-based applicationto be notified when an important event occurs. You can convert any system logmessage that has no corresponding traps into a trap. This feature helps you to useNMS traps rather than system log messages to monitor the network.
Spoofing SNMP Traps
You can use the request snmp spoof-trap operational mode command to mimic SNMPtrap behavior. The contents of the traps (the values and instances of the objectscarried in the trap) can be specified on the command line or they can be spoofedautomatically. This feature is useful if you want to trigger SNMP traps and ensurethey are processed correctly within your existing network management infrastructure,but find it difficult to simulate the error conditions that trigger many of the traps onthe device. For more information, see the JUNOS System Basics and Services CommandReference.
SNMP Architecture ■ 85
Chapter 6: Configuring SNMP for Network Management

SNMP Health Monitor
The SNMP health monitor feature uses existing SNMP remote monitoring (RMON)alarms and traps to monitor a select set of Services Router characteristics (objectinstances) like the CPU usage, memory usage, and file system usage. The healthmonitor feature also monitors the CPU usage of the device's forwarding process (alsocalled a daemon)—for example, the chassis process and forwarding processmicrokernel. You can configure the SNMP health monitor options rising threshold,falling threshold, and interval using the SNMP Quick Configuration page.
A threshold is a test of some SNMP variable against some value, with a report whenthe threshold value is exceeded. The rising threshold is the upper threshold for amonitored variable. When the current sampled value is greater than or equal to thisthreshold, and the value at the last sampling interval is less than this threshold, theSNMP health monitor generates an alarm. After the rising alarm, the health monitorcannot generate another alarm until the sampled value falls below the rising thresholdand reaches the falling threshold.
The falling threshold is the lower threshold for the monitored variable. When thecurrent sampled value is less than or equal to this threshold, and the value at the lastsampling interval is greater than this threshold, the SNMP health monitor generatesan alarm. After the falling alarm, the health monitor cannot generate another alarmuntil the sampled value rises above the falling threshold and reaches the risingthreshold.
The interval represents the period of time, in seconds, over which the object instanceis sampled and compared with the rising and falling thresholds.
At present, you do not have to configure a separate trap for the SNMP health monitor,because it uses the already existing RMON traps. For more information about RMONevents and alarms, see the JUNOS Network Management Configuration Guide.
To display the information collected by the SNMP health monitor, use the followingCLI show snmp health-monitor commands:
■ show snmp health-monitor
■ show snmp health-monitor alarms
■ show snmp health-monitor alarms detail
■ show snmp health-monitor logs
For more information, see the JUNOS System Basics and Services Command Reference.
Before You Begin
Before you begin configuring SNMP, complete the following tasks:
■ Establish basic connectivity. See the Getting Started Guide for your device.
■ Configure network interfaces. See the JUNOS Software Interfaces and RoutingConfiguration Guide.
86 ■ Before You Begin
JUNOS Software Administration Guide
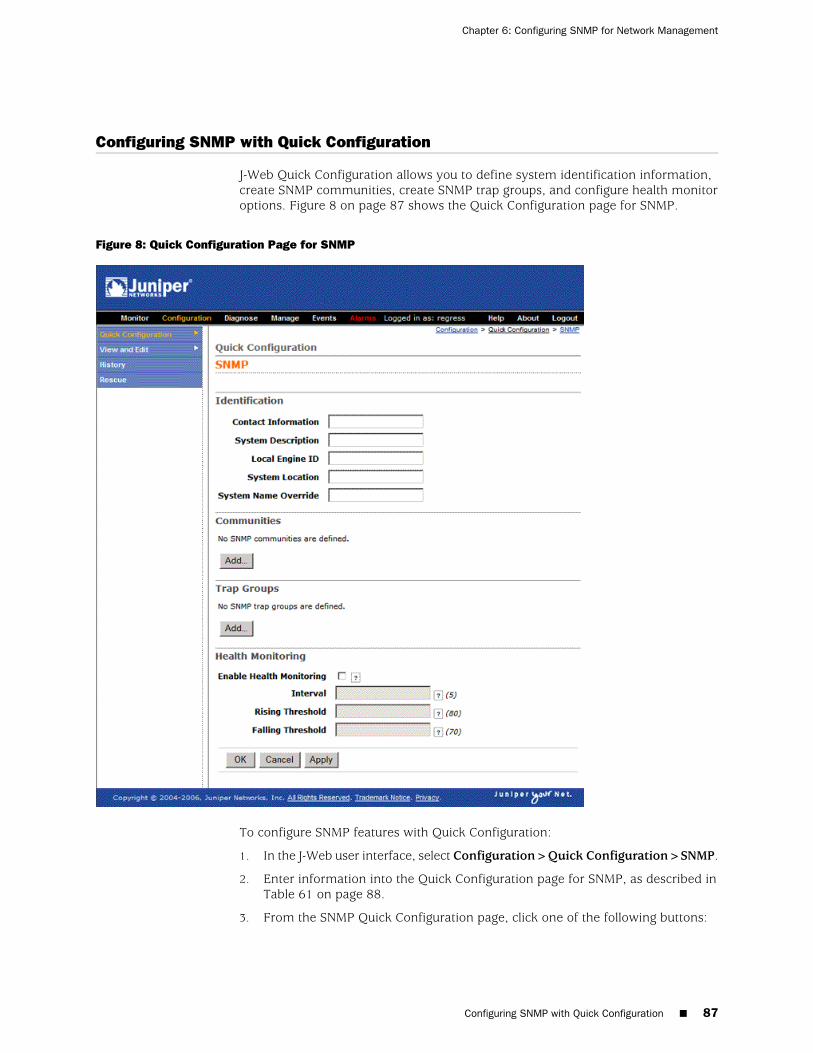
Configuring SNMP with Quick Configuration
J-Web Quick Configuration allows you to define system identification information,create SNMP communities, create SNMP trap groups, and configure health monitoroptions. Figure 8 on page 87 shows the Quick Configuration page for SNMP.
Figure 8: Quick Configuration Page for SNMP
To configure SNMP features with Quick Configuration:
1. In the J-Web user interface, select Configuration>Quick Configuration>SNMP.
2. Enter information into the Quick Configuration page for SNMP, as described inTable 61 on page 88.
3. From the SNMP Quick Configuration page, click one of the following buttons:
Configuring SNMP with Quick Configuration ■ 87
Chapter 6: Configuring SNMP for Network Management
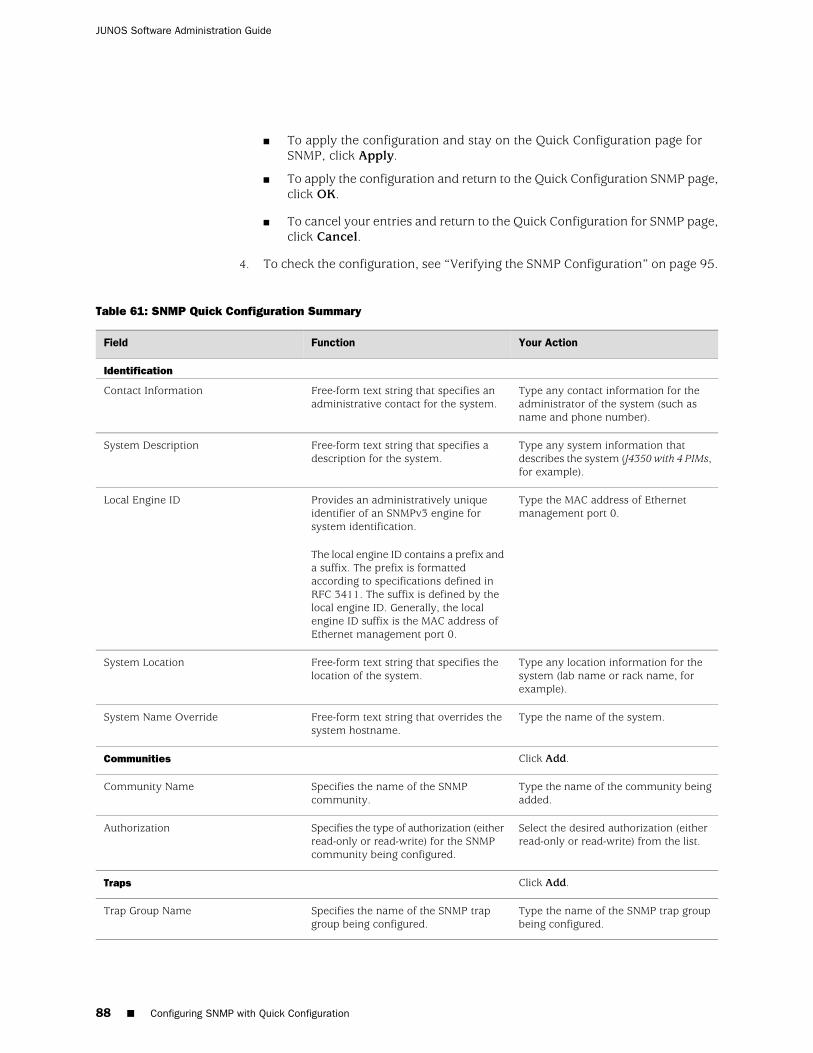
■ To apply the configuration and stay on the Quick Configuration page forSNMP, click Apply.
■ To apply the configuration and return to the Quick Configuration SNMP page,click OK.
■ To cancel your entries and return to the Quick Configuration for SNMP page,click Cancel.
4. To check the configuration, see “Verifying the SNMP Configuration” on page 95.
Table 61: SNMP Quick Configuration Summary
Your ActionFunctionField
Identification
Type any contact information for theadministrator of the system (such asname and phone number).
Free-form text string that specifies anadministrative contact for the system.
Contact Information
Type any system information thatdescribes the system (J4350 with 4 PIMs,for example).
Free-form text string that specifies adescription for the system.
System Description
Type the MAC address of Ethernetmanagement port 0.
Provides an administratively uniqueidentifier of an SNMPv3 engine forsystem identification.
The local engine ID contains a prefix anda suffix. The prefix is formattedaccording to specifications defined inRFC 3411. The suffix is defined by thelocal engine ID. Generally, the localengine ID suffix is the MAC address ofEthernet management port 0.
Local Engine ID
Type any location information for thesystem (lab name or rack name, forexample).
Free-form text string that specifies thelocation of the system.
System Location
Type the name of the system.Free-form text string that overrides thesystem hostname.
System Name Override
Click Add.Communities
Type the name of the community beingadded.
Specifies the name of the SNMPcommunity.
Community Name
Select the desired authorization (eitherread-only or read-write) from the list.
Specifies the type of authorization (eitherread-only or read-write) for the SNMPcommunity being configured.
Authorization
Click Add.Traps
Type the name of the SNMP trap groupbeing configured.
Specifies the name of the SNMP trapgroup being configured.
Trap Group Name
88 ■ Configuring SNMP with Quick Configuration
JUNOS Software Administration Guide
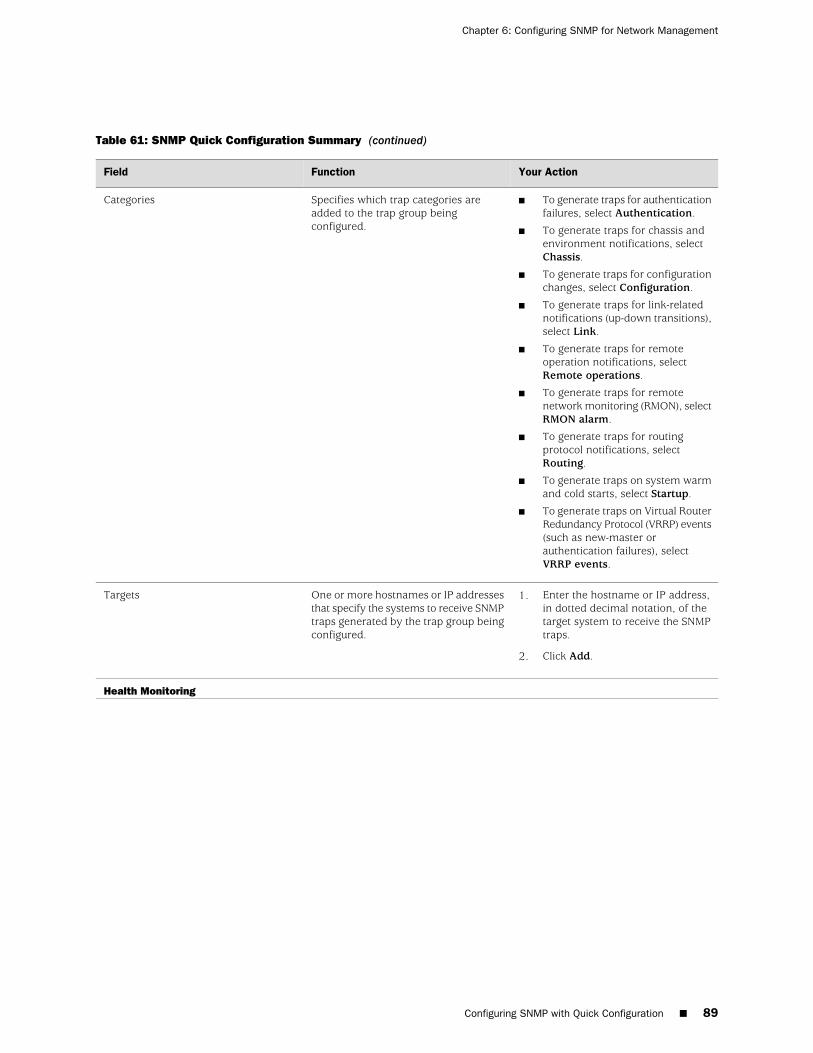
Table 61: SNMP Quick Configuration Summary (continued)
Your ActionFunctionField
■ To generate traps for authenticationfailures, select Authentication.
■ To generate traps for chassis andenvironment notifications, selectChassis.
■ To generate traps for configurationchanges, select Configuration.
■ To generate traps for link-relatednotifications (up-down transitions),select Link.
■ To generate traps for remoteoperation notifications, selectRemote operations.
■ To generate traps for remotenetwork monitoring (RMON), selectRMON alarm.
■ To generate traps for routingprotocol notifications, selectRouting.
■ To generate traps on system warmand cold starts, select Startup.
■ To generate traps on Virtual RouterRedundancy Protocol (VRRP) events(such as new-master orauthentication failures), selectVRRP events.
Specifies which trap categories areadded to the trap group beingconfigured.
Categories
1. Enter the hostname or IP address,in dotted decimal notation, of thetarget system to receive the SNMPtraps.
2. Click Add.
One or more hostnames or IP addressesthat specify the systems to receive SNMPtraps generated by the trap group beingconfigured.
Targets
Health Monitoring
Configuring SNMP with Quick Configuration ■ 89
Chapter 6: Configuring SNMP for Network Management
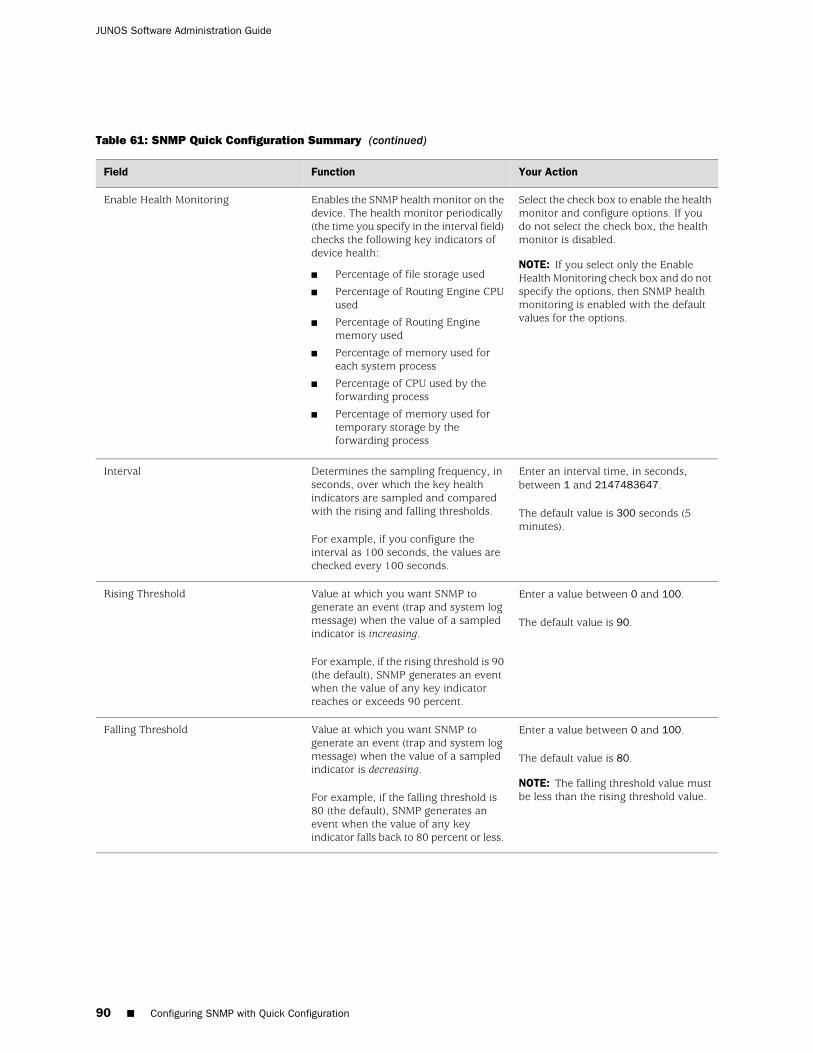
Table 61: SNMP Quick Configuration Summary (continued)
Your ActionFunctionField
Select the check box to enable the healthmonitor and configure options. If youdo not select the check box, the healthmonitor is disabled.
NOTE: If you select only the EnableHealth Monitoring check box and do notspecify the options, then SNMP healthmonitoring is enabled with the defaultvalues for the options.
Enables the SNMP health monitor on thedevice. The health monitor periodically(the time you specify in the interval field)checks the following key indicators ofdevice health:
■ Percentage of file storage used
■ Percentage of Routing Engine CPUused
■ Percentage of Routing Enginememory used
■ Percentage of memory used foreach system process
■ Percentage of CPU used by theforwarding process
■ Percentage of memory used fortemporary storage by theforwarding process
Enable Health Monitoring
Enter an interval time, in seconds,between 1 and 2147483647.
The default value is 300 seconds (5minutes).
Determines the sampling frequency, inseconds, over which the key healthindicators are sampled and comparedwith the rising and falling thresholds.
For example, if you configure theinterval as 100 seconds, the values arechecked every 100 seconds.
Interval
Enter a value between 0 and 100.
The default value is 90.
Value at which you want SNMP togenerate an event (trap and system logmessage) when the value of a sampledindicator is increasing.
For example, if the rising threshold is 90(the default), SNMP generates an eventwhen the value of any key indicatorreaches or exceeds 90 percent.
Rising Threshold
Enter a value between 0 and 100.
The default value is 80.
NOTE: The falling threshold value mustbe less than the rising threshold value.
Value at which you want SNMP togenerate an event (trap and system logmessage) when the value of a sampledindicator is decreasing.
For example, if the falling threshold is80 (the default), SNMP generates anevent when the value of any keyindicator falls back to 80 percent or less.
Falling Threshold
90 ■ Configuring SNMP with Quick Configuration
JUNOS Software Administration Guide
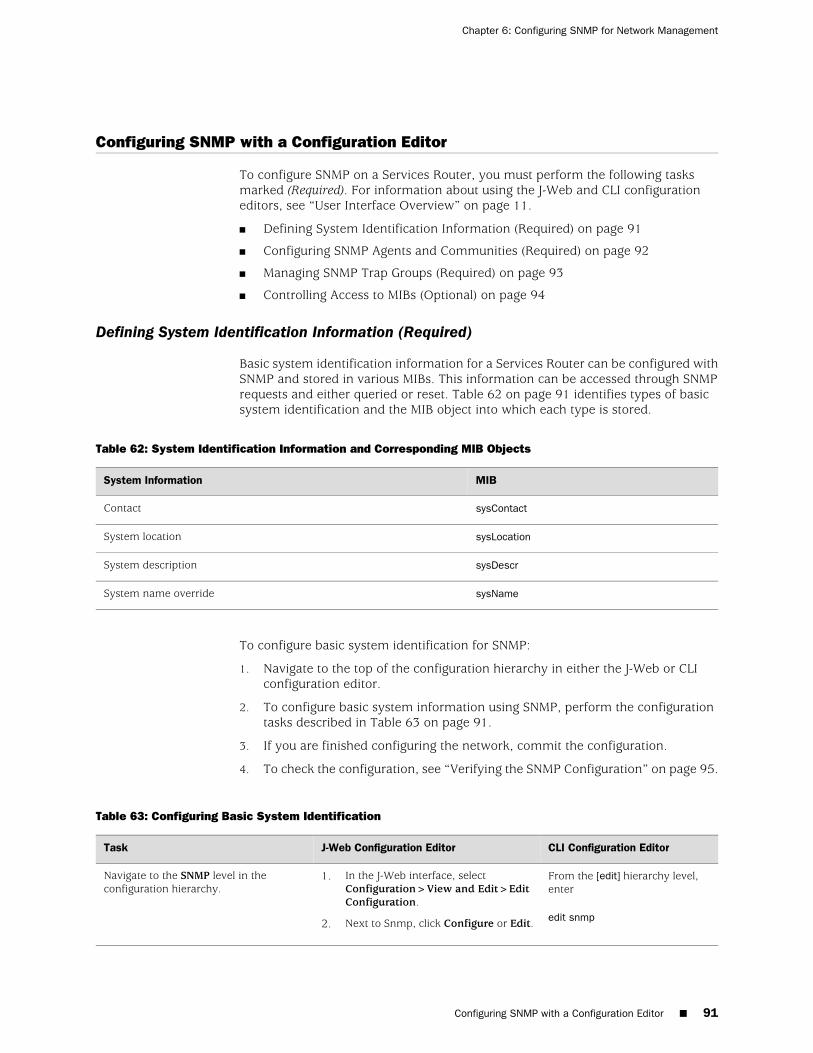
Configuring SNMP with a Configuration Editor
To configure SNMP on a Services Router, you must perform the following tasksmarked (Required). For information about using the J-Web and CLI configurationeditors, see “User Interface Overview” on page 11.
■ Defining System Identification Information (Required) on page 91
■ Configuring SNMP Agents and Communities (Required) on page 92
■ Managing SNMP Trap Groups (Required) on page 93
■ Controlling Access to MIBs (Optional) on page 94
Defining System Identification Information (Required)
Basic system identification information for a Services Router can be configured withSNMP and stored in various MIBs. This information can be accessed through SNMPrequests and either queried or reset. Table 62 on page 91 identifies types of basicsystem identification and the MIB object into which each type is stored.
Table 62: System Identification Information and Corresponding MIB Objects
MIBSystem Information
sysContactContact
sysLocationSystem location
sysDescrSystem description
sysNameSystem name override
To configure basic system identification for SNMP:
1. Navigate to the top of the configuration hierarchy in either the J-Web or CLIconfiguration editor.
2. To configure basic system information using SNMP, perform the configurationtasks described in Table 63 on page 91.
3. If you are finished configuring the network, commit the configuration.
4. To check the configuration, see “Verifying the SNMP Configuration” on page 95.
Table 63: Configuring Basic System Identification
CLI Configuration EditorJ-Web Configuration EditorTask
From the [edit] hierarchy level,enter
edit snmp
1. In the J-Web interface, selectConfiguration>View and Edit>EditConfiguration.
2. Next to Snmp, click Configure or Edit.
Navigate to the SNMP level in theconfiguration hierarchy.
Configuring SNMP with a Configuration Editor ■ 91
Chapter 6: Configuring SNMP for Network Management
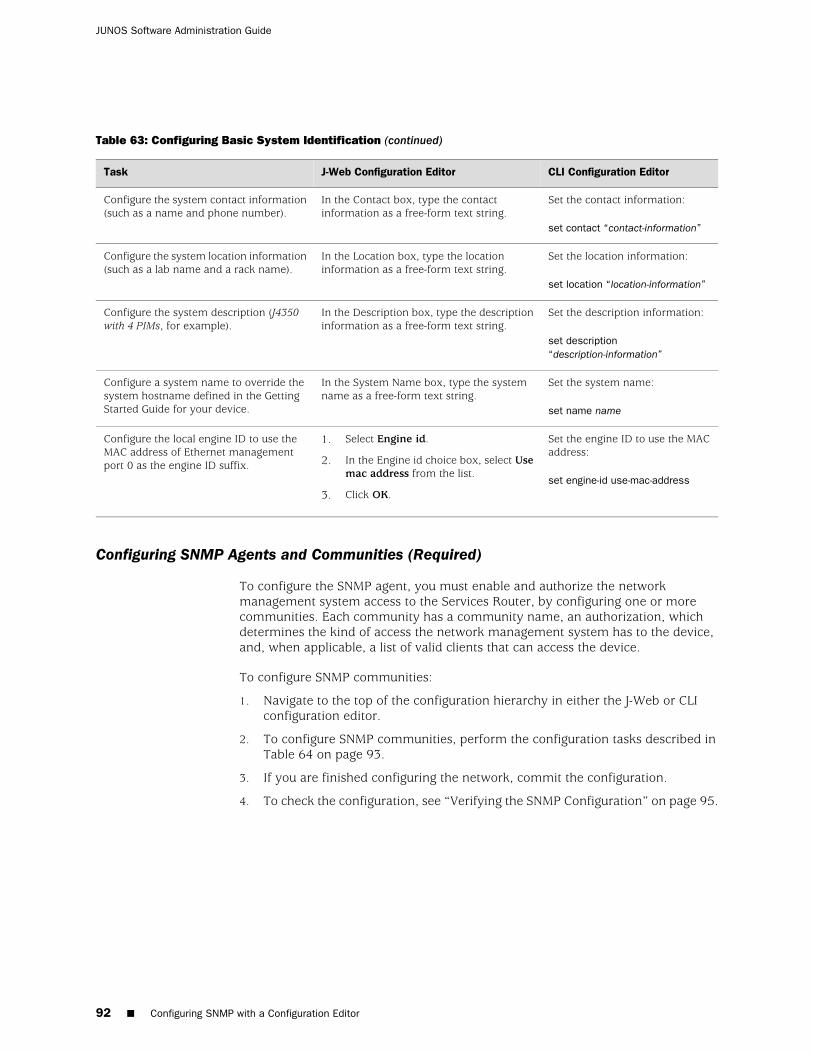
Table 63: Configuring Basic System Identification (continued)
CLI Configuration EditorJ-Web Configuration EditorTask
Set the contact information:
set contact “contact-information”
In the Contact box, type the contactinformation as a free-form text string.
Configure the system contact information(such as a name and phone number).
Set the location information:
set location “location-information”
In the Location box, type the locationinformation as a free-form text string.
Configure the system location information(such as a lab name and a rack name).
Set the description information:
set description“description-information”
In the Description box, type the descriptioninformation as a free-form text string.
Configure the system description (J4350with 4 PIMs, for example).
Set the system name:
set name name
In the System Name box, type the systemname as a free-form text string.
Configure a system name to override thesystem hostname defined in the GettingStarted Guide for your device.
Set the engine ID to use the MACaddress:
set engine-id use-mac-address
1. Select Engine id.
2. In the Engine id choice box, select Usemac address from the list.
3. Click OK.
Configure the local engine ID to use theMAC address of Ethernet managementport 0 as the engine ID suffix.
Configuring SNMP Agents and Communities (Required)
To configure the SNMP agent, you must enable and authorize the networkmanagement system access to the Services Router, by configuring one or morecommunities. Each community has a community name, an authorization, whichdetermines the kind of access the network management system has to the device,and, when applicable, a list of valid clients that can access the device.
To configure SNMP communities:
1. Navigate to the top of the configuration hierarchy in either the J-Web or CLIconfiguration editor.
2. To configure SNMP communities, perform the configuration tasks described inTable 64 on page 93.
3. If you are finished configuring the network, commit the configuration.
4. To check the configuration, see “Verifying the SNMP Configuration” on page 95.
92 ■ Configuring SNMP with a Configuration Editor
JUNOS Software Administration Guide
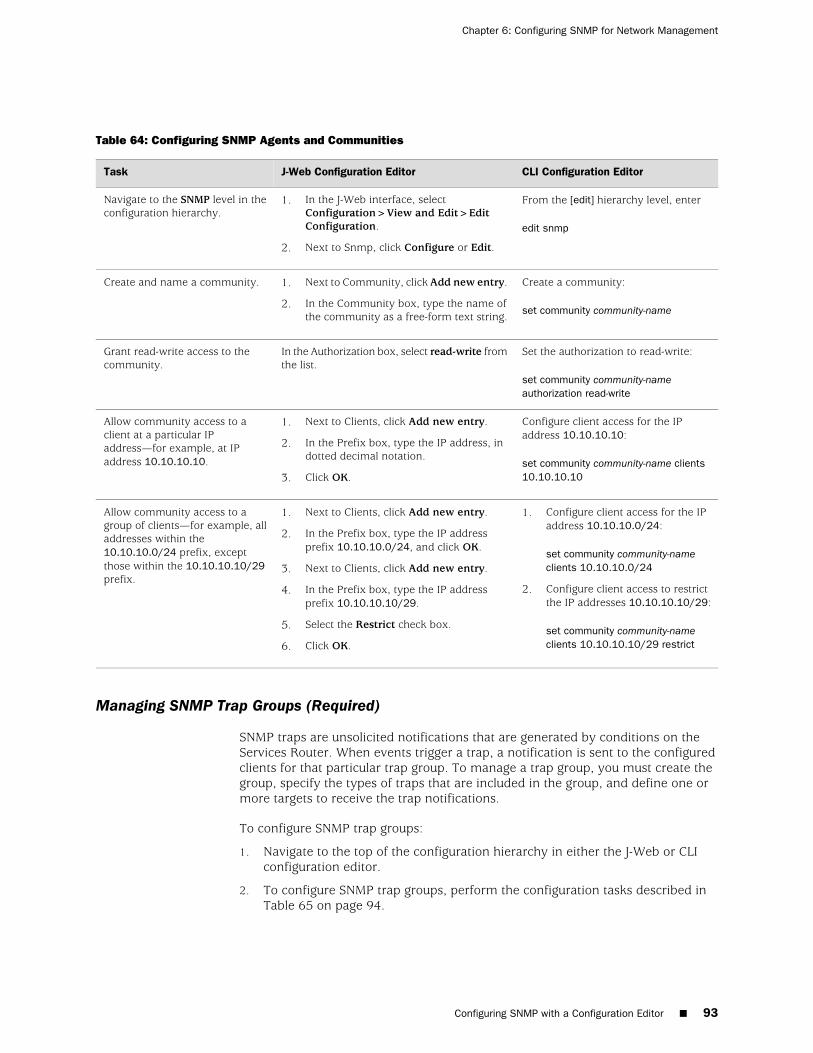
Table 64: Configuring SNMP Agents and Communities
CLI Configuration EditorJ-Web Configuration EditorTask
From the [edit] hierarchy level, enter
edit snmp
1. In the J-Web interface, selectConfiguration>View and Edit>EditConfiguration.
2. Next to Snmp, click Configure or Edit.
Navigate to the SNMP level in theconfiguration hierarchy.
Create a community:
set community community-name
1. Next to Community, click Add new entry.
2. In the Community box, type the name ofthe community as a free-form text string.
Create and name a community.
Set the authorization to read-write:
set community community-nameauthorization read-write
In the Authorization box, select read-write fromthe list.
Grant read-write access to thecommunity.
Configure client access for the IPaddress 10.10.10.10:
set community community-name clients10.10.10.10
1. Next to Clients, click Add new entry.
2. In the Prefix box, type the IP address, indotted decimal notation.
3. Click OK.
Allow community access to aclient at a particular IPaddress—for example, at IPaddress 10.10.10.10.
1. Configure client access for the IPaddress 10.10.10.0/24:
set community community-nameclients 10.10.10.0/24
2. Configure client access to restrictthe IP addresses 10.10.10.10/29:
set community community-nameclients 10.10.10.10/29 restrict
1. Next to Clients, click Add new entry.
2. In the Prefix box, type the IP addressprefix 10.10.10.0/24, and click OK.
3. Next to Clients, click Add new entry.
4. In the Prefix box, type the IP addressprefix 10.10.10.10/29.
5. Select the Restrict check box.
6. Click OK.
Allow community access to agroup of clients—for example, alladdresses within the10.10.10.0/24 prefix, exceptthose within the 10.10.10.10/29prefix.
Managing SNMP Trap Groups (Required)
SNMP traps are unsolicited notifications that are generated by conditions on theServices Router. When events trigger a trap, a notification is sent to the configuredclients for that particular trap group. To manage a trap group, you must create thegroup, specify the types of traps that are included in the group, and define one ormore targets to receive the trap notifications.
To configure SNMP trap groups:
1. Navigate to the top of the configuration hierarchy in either the J-Web or CLIconfiguration editor.
2. To configure SNMP trap groups, perform the configuration tasks described inTable 65 on page 94.
Configuring SNMP with a Configuration Editor ■ 93
Chapter 6: Configuring SNMP for Network Management
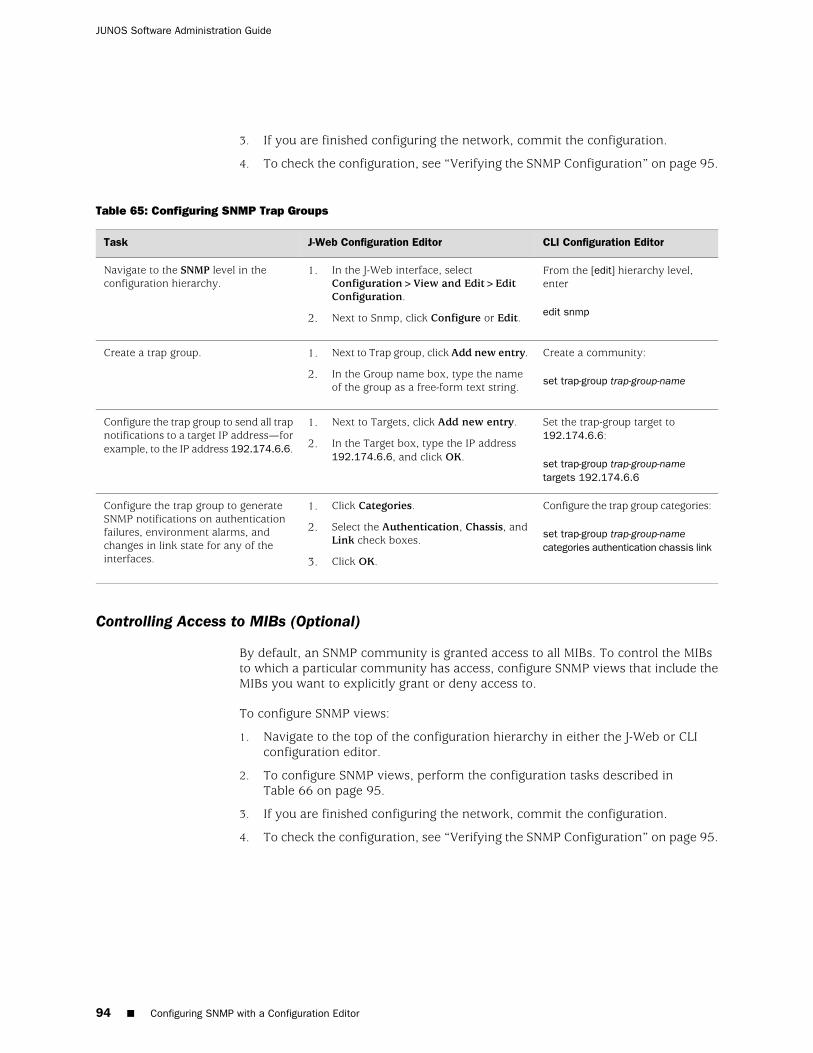
3. If you are finished configuring the network, commit the configuration.
4. To check the configuration, see “Verifying the SNMP Configuration” on page 95.
Table 65: Configuring SNMP Trap Groups
CLI Configuration EditorJ-Web Configuration EditorTask
From the [edit] hierarchy level,enter
edit snmp
1. In the J-Web interface, selectConfiguration>View and Edit>EditConfiguration.
2. Next to Snmp, click Configure or Edit.
Navigate to the SNMP level in theconfiguration hierarchy.
Create a community:
set trap-group trap-group-name
1. Next to Trap group, click Add new entry.
2. In the Group name box, type the nameof the group as a free-form text string.
Create a trap group.
Set the trap-group target to192.174.6.6:
set trap-group trap-group-nametargets 192.174.6.6
1. Next to Targets, click Add new entry.
2. In the Target box, type the IP address192.174.6.6, and click OK.
Configure the trap group to send all trapnotifications to a target IP address—forexample, to the IP address 192.174.6.6.
Configure the trap group categories:
set trap-group trap-group-namecategories authentication chassis link
1. Click Categories.
2. Select the Authentication, Chassis, andLink check boxes.
3. Click OK.
Configure the trap group to generateSNMP notifications on authenticationfailures, environment alarms, andchanges in link state for any of theinterfaces.
Controlling Access to MIBs (Optional)
By default, an SNMP community is granted access to all MIBs. To control the MIBsto which a particular community has access, configure SNMP views that include theMIBs you want to explicitly grant or deny access to.
To configure SNMP views:
1. Navigate to the top of the configuration hierarchy in either the J-Web or CLIconfiguration editor.
2. To configure SNMP views, perform the configuration tasks described inTable 66 on page 95.
3. If you are finished configuring the network, commit the configuration.
4. To check the configuration, see “Verifying the SNMP Configuration” on page 95.
94 ■ Configuring SNMP with a Configuration Editor
JUNOS Software Administration Guide
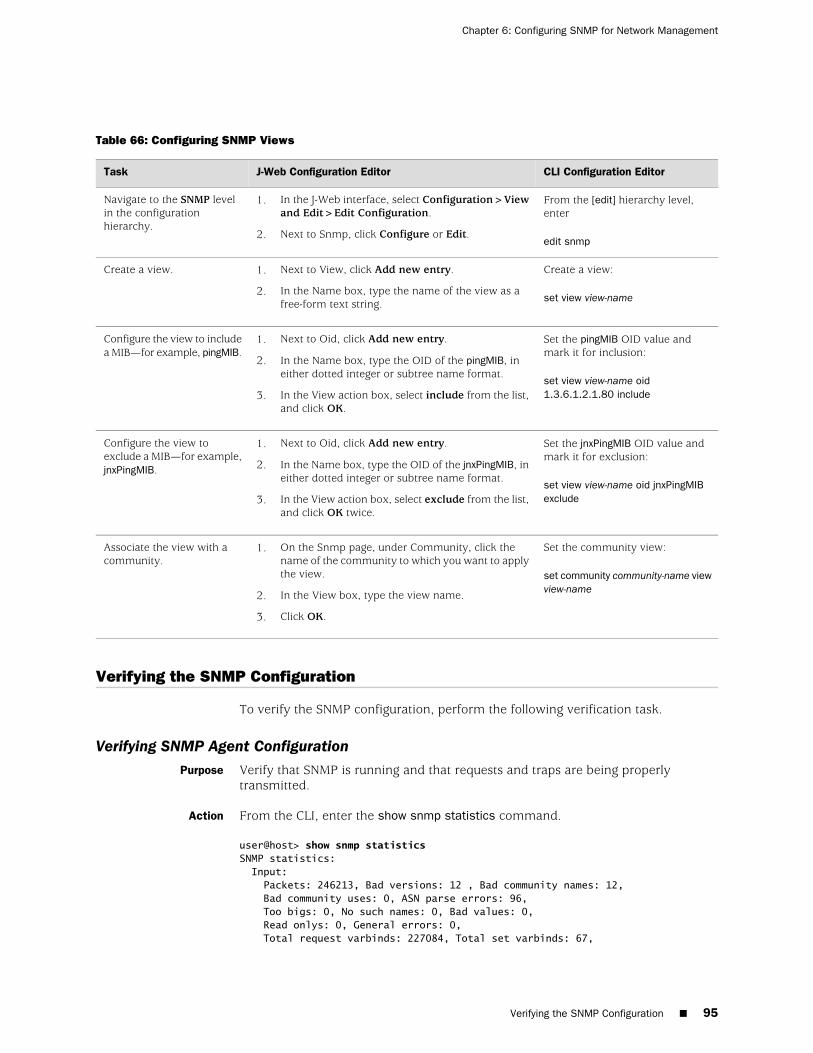
Table 66: Configuring SNMP Views
CLI Configuration EditorJ-Web Configuration EditorTask
From the [edit] hierarchy level,enter
edit snmp
1. In the J-Web interface, select Configuration>Viewand Edit>Edit Configuration.
2. Next to Snmp, click Configure or Edit.
Navigate to the SNMP levelin the configurationhierarchy.
Create a view:
set view view-name
1. Next to View, click Add new entry.
2. In the Name box, type the name of the view as afree-form text string.
Create a view.
Set the pingMIB OID value andmark it for inclusion:
set view view-name oid1.3.6.1.2.1.80 include
1. Next to Oid, click Add new entry.
2. In the Name box, type the OID of the pingMIB, ineither dotted integer or subtree name format.
3. In the View action box, select include from the list,and click OK.
Configure the view to includea MIB—for example, pingMIB.
Set the jnxPingMIB OID value andmark it for exclusion:
set view view-name oid jnxPingMIBexclude
1. Next to Oid, click Add new entry.
2. In the Name box, type the OID of the jnxPingMIB, ineither dotted integer or subtree name format.
3. In the View action box, select exclude from the list,and click OK twice.
Configure the view toexclude a MIB—for example,jnxPingMIB.
Set the community view:
set community community-name viewview-name
1. On the Snmp page, under Community, click thename of the community to which you want to applythe view.
2. In the View box, type the view name.
3. Click OK.
Associate the view with acommunity.
Verifying the SNMP Configuration
To verify the SNMP configuration, perform the following verification task.
Verifying SNMP Agent ConfigurationPurpose Verify that SNMP is running and that requests and traps are being properly
transmitted.
Action From the CLI, enter the show snmp statistics command.
user@host> show snmp statisticsSNMP statistics: Input: Packets: 246213, Bad versions: 12 , Bad community names: 12, Bad community uses: 0, ASN parse errors: 96, Too bigs: 0, No such names: 0, Bad values: 0, Read onlys: 0, General errors: 0, Total request varbinds: 227084, Total set varbinds: 67,
Verifying the SNMP Configuration ■ 95
Chapter 6: Configuring SNMP for Network Management
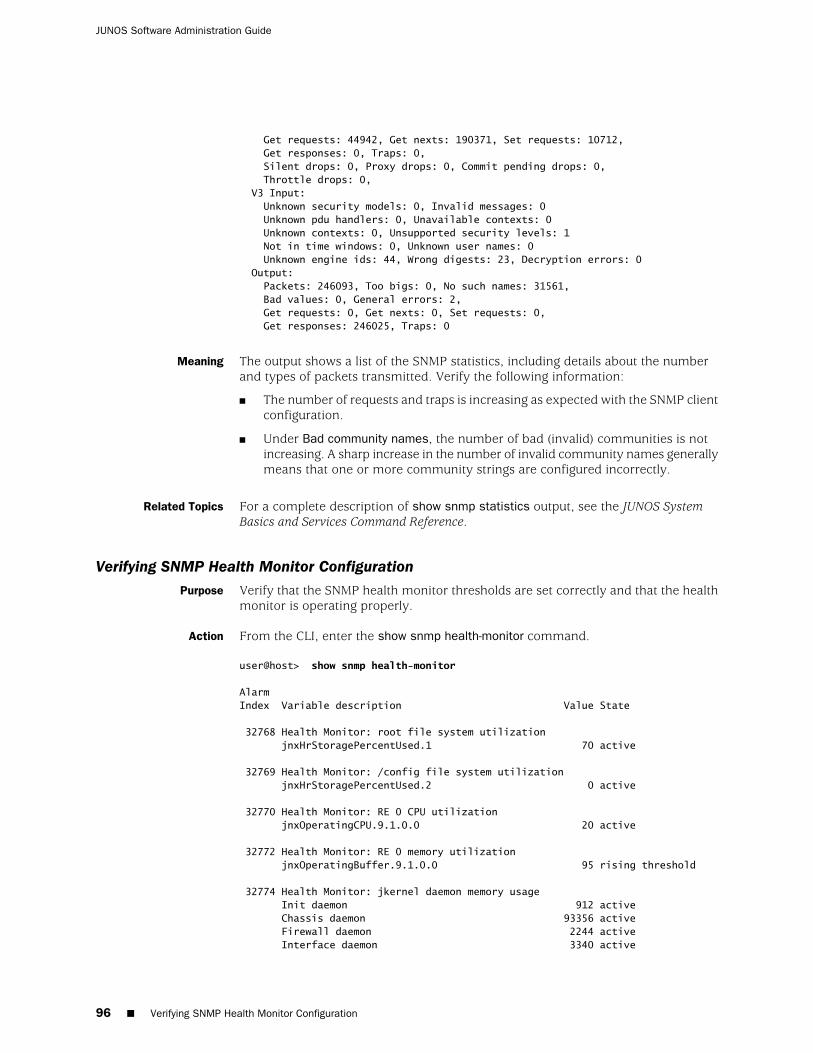
Get requests: 44942, Get nexts: 190371, Set requests: 10712, Get responses: 0, Traps: 0, Silent drops: 0, Proxy drops: 0, Commit pending drops: 0, Throttle drops: 0, V3 Input: Unknown security models: 0, Invalid messages: 0 Unknown pdu handlers: 0, Unavailable contexts: 0 Unknown contexts: 0, Unsupported security levels: 1 Not in time windows: 0, Unknown user names: 0 Unknown engine ids: 44, Wrong digests: 23, Decryption errors: 0 Output: Packets: 246093, Too bigs: 0, No such names: 31561, Bad values: 0, General errors: 2, Get requests: 0, Get nexts: 0, Set requests: 0, Get responses: 246025, Traps: 0
Meaning The output shows a list of the SNMP statistics, including details about the numberand types of packets transmitted. Verify the following information:
■ The number of requests and traps is increasing as expected with the SNMP clientconfiguration.
■ Under Bad community names, the number of bad (invalid) communities is notincreasing. A sharp increase in the number of invalid community names generallymeans that one or more community strings are configured incorrectly.
Related Topics For a complete description of show snmp statistics output, see the JUNOS SystemBasics and Services Command Reference.
Verifying SNMP Health Monitor ConfigurationPurpose Verify that the SNMP health monitor thresholds are set correctly and that the health
monitor is operating properly.
Action From the CLI, enter the show snmp health-monitor command.
user@host> show snmp health-monitor
AlarmIndex Variable description Value State
32768 Health Monitor: root file system utilization jnxHrStoragePercentUsed.1 70 active
32769 Health Monitor: /config file system utilization jnxHrStoragePercentUsed.2 0 active
32770 Health Monitor: RE 0 CPU utilization jnxOperatingCPU.9.1.0.0 20 active
32772 Health Monitor: RE 0 memory utilization jnxOperatingBuffer.9.1.0.0 95 rising threshold
32774 Health Monitor: jkernel daemon memory usage Init daemon 912 active Chassis daemon 93356 active Firewall daemon 2244 active Interface daemon 3340 active
96 ■ Verifying SNMP Health Monitor Configuration
JUNOS Software Administration Guide

SNMP daemon 4412 active MIB2 daemon 3920 active VRRP daemon 2724 active Alarm daemon 1868 active PFE daemon 2656 active CRAFT daemon 2064 active Traffic sampling control daemon 3320 active Remote operations daemon 3020 active CoS daemon 3044 active Inet daemon 1304 active Syslog daemon 1344 active Web management daemon 3264 active USB Supervise Daemon 1100 active PPP daemon 2076 active DLSWD daemon 10240 active
32775 Health Monitor: jroute daemon memory usage Routing protocol daemon 8952 active Management daemon 14516 active Management daemon 14556 active Management daemon 14556 active Command line interface 10312 active Command line interface 10312 active Periodic Packet Management daemon 1640 active Bidirectional Forwarding Detection daemon 1912 active L2 Address Learning daemon 2080 active
32776 Health Monitor: jcrypto daemon memory usage IPSec Key Management daemon 5672 active
32778 Health Monitor: FWDD Micro-Kernel threads total CPU Utilization jnxFwddMicroKernelCPUUsage.0 0 active
32779 Health Monitor: FWDD Real-Time threads total CPU Utilization jnxFwddRtThreadsCPUUsage.0 15 active
32780 Health Monitor: FWDD DMA Memory utilization jnxFwddDmaMemUsage.0 16 active
32781 Health Monitor: FWDD Heap utilization jnxFwddHeapUsage.0 54 active
---(more)---
Meaning The output shows a summary of SNMP health monitor alarms and correspondinglog entries:
■ Alarm Index—Alarm identifier.
■ Variable description—Object instance being monitored.
■ Value—Current value of the monitored variable in the most recent sample interval.
■ State—Status of the alarm. For example:
■ active—Entry is fully configured and activated.
■ falling threshold crossed—Variable value has crossed the lower thresholdlimit.
Verifying SNMP Health Monitor Configuration ■ 97
Chapter 6: Configuring SNMP for Network Management

■ rising threshold crossed—Variable value has crossed the upper thresholdlimit.
Verify that any rising threshold values are greater than the configured rising threshold,and that any falling threshold values are less than the configured falling threshold.
Related Topics For a complete description of show snmp health-monitor output, see the JUNOS SystemBasics and Services Command Reference.
98 ■ Verifying SNMP Health Monitor Configuration
JUNOS Software Administration Guide
Chapter 7
Configuring the Device for DHCP
A Dynamic Host Configuration Protocol (DHCP) server can automatically allocate IPaddresses and also deliver configuration settings to client hosts on a subnet. DHCPlets network administrators centrally manage a pool of IP addresses among hostsand automate the assignment of IP addresses in a network. An IP address can beleased to a host for a limited period of time, allowing the DHCP server to share alimited number of IP addresses among a group of hosts that do not need permanentIP addresses.
The J-series or SRX-series device acts as the DHCP server, providing IP addressesand settings to hosts, such as PCs, that are connected to device interfaces. The DHCPserver is compatible with the DHCP servers of other vendors on the network.
The device can also operate as a DHCP client and DHCP relay agent.
You can use J-Web Quick Configuration or a configuration editor to configure DHCPon the device.
This chapter contains the following topics.
■ DHCP Support On Different Device Types on page 99
■ DHCP Terms on page 100
■ DHCP Overview on page 101
■ Before You Begin on page 103
■ Configuring DHCP with Quick Configuration on page 103
■ Configuring DHCP with a Configuration Editor on page 114
■ Verifying a DHCP Configuration on page 120
DHCP Support On Different Device Types
The following table lists DHCP features, specifies whether the features are supportedon various device types, and indicates where you can find more information abouteach feature.
DHCP Support On Different Device Types ■ 99
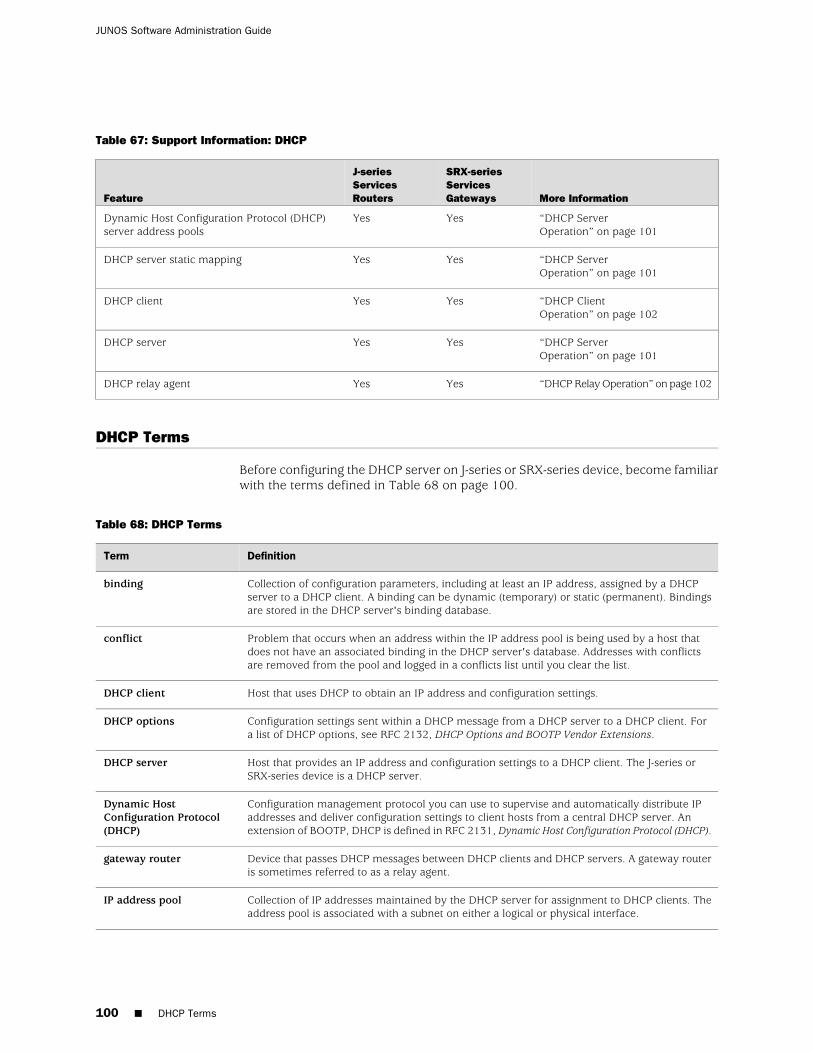
Table 67: Support Information: DHCP
More Information
SRX-seriesServicesGateways
J-seriesServicesRoutersFeature
“DHCP ServerOperation” on page 101
YesYesDynamic Host Configuration Protocol (DHCP)server address pools
“DHCP ServerOperation” on page 101
YesYesDHCP server static mapping
“DHCP ClientOperation” on page 102
YesYesDHCP client
“DHCP ServerOperation” on page 101
YesYesDHCP server
“DHCP Relay Operation” on page 102YesYesDHCP relay agent
DHCP Terms
Before configuring the DHCP server on J-series or SRX-series device, become familiarwith the terms defined in Table 68 on page 100.
Table 68: DHCP Terms
DefinitionTerm
Collection of configuration parameters, including at least an IP address, assigned by a DHCPserver to a DHCP client. A binding can be dynamic (temporary) or static (permanent). Bindingsare stored in the DHCP server's binding database.
binding
Problem that occurs when an address within the IP address pool is being used by a host thatdoes not have an associated binding in the DHCP server's database. Addresses with conflictsare removed from the pool and logged in a conflicts list until you clear the list.
conflict
Host that uses DHCP to obtain an IP address and configuration settings.DHCP client
Configuration settings sent within a DHCP message from a DHCP server to a DHCP client. Fora list of DHCP options, see RFC 2132, DHCP Options and BOOTP Vendor Extensions.
DHCP options
Host that provides an IP address and configuration settings to a DHCP client. The J-series orSRX-series device is a DHCP server.
DHCP server
Configuration management protocol you can use to supervise and automatically distribute IPaddresses and deliver configuration settings to client hosts from a central DHCP server. Anextension of BOOTP, DHCP is defined in RFC 2131, Dynamic Host Configuration Protocol (DHCP).
Dynamic HostConfiguration Protocol(DHCP)
Device that passes DHCP messages between DHCP clients and DHCP servers. A gateway routeris sometimes referred to as a relay agent.
gateway router
Collection of IP addresses maintained by the DHCP server for assignment to DHCP clients. Theaddress pool is associated with a subnet on either a logical or physical interface.
IP address pool
100 ■ DHCP Terms
JUNOS Software Administration Guide
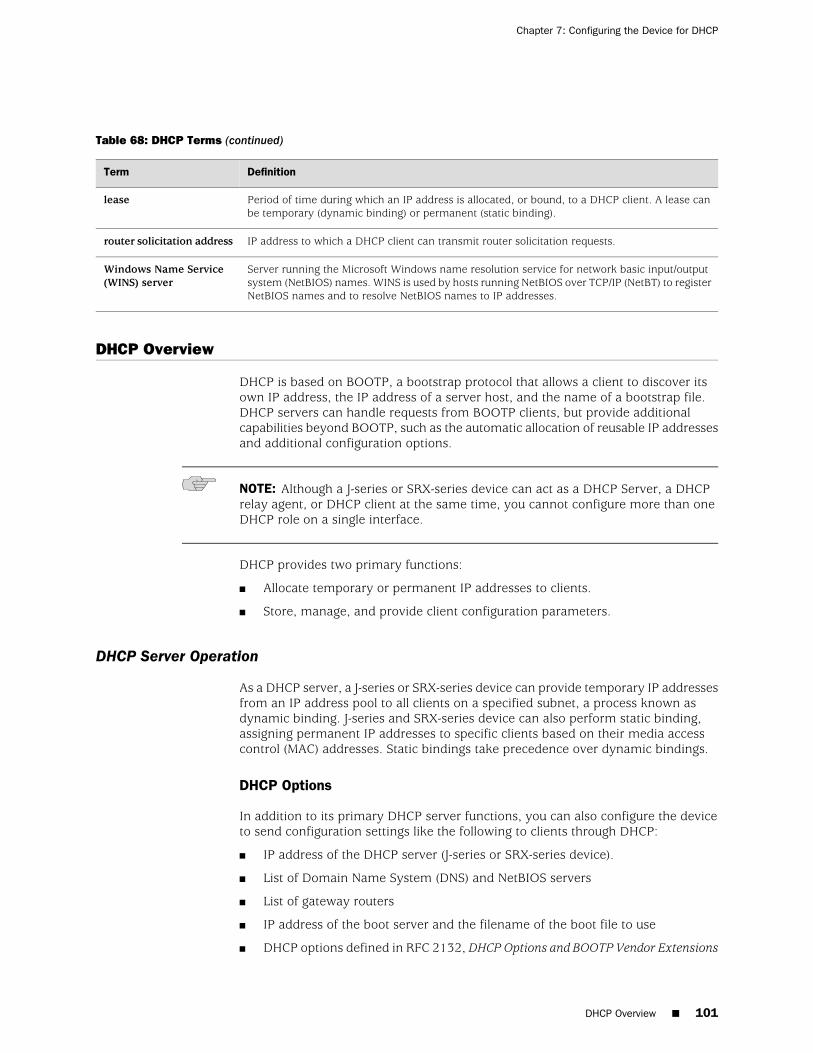
Table 68: DHCP Terms (continued)
DefinitionTerm
Period of time during which an IP address is allocated, or bound, to a DHCP client. A lease canbe temporary (dynamic binding) or permanent (static binding).
lease
IP address to which a DHCP client can transmit router solicitation requests.router solicitation address
Server running the Microsoft Windows name resolution service for network basic input/outputsystem (NetBIOS) names. WINS is used by hosts running NetBIOS over TCP/IP (NetBT) to registerNetBIOS names and to resolve NetBIOS names to IP addresses.
Windows Name Service(WINS) server
DHCP Overview
DHCP is based on BOOTP, a bootstrap protocol that allows a client to discover itsown IP address, the IP address of a server host, and the name of a bootstrap file.DHCP servers can handle requests from BOOTP clients, but provide additionalcapabilities beyond BOOTP, such as the automatic allocation of reusable IP addressesand additional configuration options.
NOTE: Although a J-series or SRX-series device can act as a DHCP Server, a DHCPrelay agent, or DHCP client at the same time, you cannot configure more than oneDHCP role on a single interface.
DHCP provides two primary functions:
■ Allocate temporary or permanent IP addresses to clients.
■ Store, manage, and provide client configuration parameters.
DHCP Server Operation
As a DHCP server, a J-series or SRX-series device can provide temporary IP addressesfrom an IP address pool to all clients on a specified subnet, a process known asdynamic binding. J-series and SRX-series device can also perform static binding,assigning permanent IP addresses to specific clients based on their media accesscontrol (MAC) addresses. Static bindings take precedence over dynamic bindings.
DHCP Options
In addition to its primary DHCP server functions, you can also configure the deviceto send configuration settings like the following to clients through DHCP:
■ IP address of the DHCP server (J-series or SRX-series device).
■ List of Domain Name System (DNS) and NetBIOS servers
■ List of gateway routers
■ IP address of the boot server and the filename of the boot file to use
■ DHCP options defined in RFC 2132, DHCP Options and BOOTP Vendor Extensions
DHCP Overview ■ 101
Chapter 7: Configuring the Device for DHCP
Compatibility with Autoinstallation
J-series and SRX-series device DHCP server functions are compatible with theautoinstallation feature. The DHCP server automatically checks any autoinstallationsettings for conflicts and gives the autoinstallation settings priority over correspondingDHCP settings. For example, an IP address set by autoinstallation takes precedenceover an IP address set by the DHCP server.
DHCP Client Operation
A J-series or SRX-series device can act as a DHCP client, receiving its TCP/IP settingsand the IP address for any physical interface in any security zone from an externalDHCP server. The device can also act as a DHCP server, providing TCP/IP settingsand IP addresses to clients in any zone. When the device operates as a DHCP clientand a DHCP server simultaneously, it can transfer the TCP/IP settings learned throughits DHCP client module to its default DHCP server module. For the device to operateas a DHCP client, you configure a logical interface on the device to obtain an IPaddress from the DHCP server in the network. You set the vendor class ID, leasetime, DHCP server address, retransmission attempts, and retry interval. You canrenew DHCP client releases.
Propagation of TCP/IP Settings
The J-series or SRX-series device can operate simultaneously as a client of the DHCPserver in the untrust zone and a DHCP server to the clients in the trust zone. Thedevice takes the TCP/IP settings that it receives as a DHCP client and forwards themas a DHCP server to the clients in the trust zone. The device interface in the untrustzone operates as the DHCP client, receiving IP addresses dynamically from an Internetservice provider (ISP) on the external network.
During the DHCP protocol exchange, the device receives TCP/IP settings from theexternal network on its DHCP client interface. Settings include the address of theISP's DHCP name server and other server addresses. These settings are propagatedto the DHCP server pools configured on the device to fulfill host requests for IPaddresses on the device's internal network.
DHCP Relay Operation
A J-series or SRX-series device operating as a DHCP relay agent forwards incomingrequests from BOOTP and DHCP clients to a specified BOOTP or DHCP server. Clientrequests can pass through virtual private network (VPN) tunnels.
You cannot configure a single device interface to operate as both a DHCP client anda DHCP relay.
For more information, see the JUNOS Policy Framework Configuration Guide
Conflict Detection and Resolution
A client that receives an IP address from the device operating as a DHCP serverperforms a series of Address Resolution Protocol (ARP) tests to verify that the address
102 ■ DHCP Overview
JUNOS Software Administration Guide
is available and no conflicts exist. If the client detects an address conflict, it informsthe DHCP server about the conflict and can request another IP address from theDHCP server.
The device maintains a log of all client-detected conflicts and removes addresseswith conflicts from the DHCP address pool. To display the conflicts list, you use theshow system services dhcp conflict command. The addresses in the conflicts listremain excluded until you use the clear system services dhcp conflict command tomanually clear the list.
Interface Restrictions
The device supports DHCP client requests received on Fast Ethernet interfaces only.However, DHCP requests received from a relay agent are supported on all interfacetypes.
DHCP is not supported on interfaces that are part of a virtual private network (VPN).
Before You Begin
Before you begin configuring the device as a DHCP server, complete the followingtasks:
■ Determine the IP address pools and the lease durations to use for each subnet.
■ Obtain the MAC addresses of the clients that require permanent IP addresses.Determine the IP addresses to use for these clients.
■ List the IP addresses that are available for the servers and routers on yournetwork—DNS, NetBIOS servers, boot servers, and gateway routers, for example.
■ Determine the DHCP options required by the subnets and clients in your network.
Configuring DHCP with Quick Configuration
This section contains the following topics:
■ Configuring DHCP Service with Quick Configuration on page 103
■ Configuring the Device as a DHCP Client with Quick Configuration on page 109
■ Configuring BOOTP or DHCP Relay with Quick Configuration on page 111
Configuring DHCP Service with Quick Configuration
The DHCP Quick Configuration pages allow you to set up the DHCP service on thedevice. From the DHCP Service Quick Configuration page, click each of the tabs toconfigure global settings, DHCP pools for subnets, and static bindings for DHCPclients.
Figure 9 on page 104 through Figure 11 on page 106 show the DHCP QuickConfiguration pages.
Before You Begin ■ 103
Chapter 7: Configuring the Device for DHCP
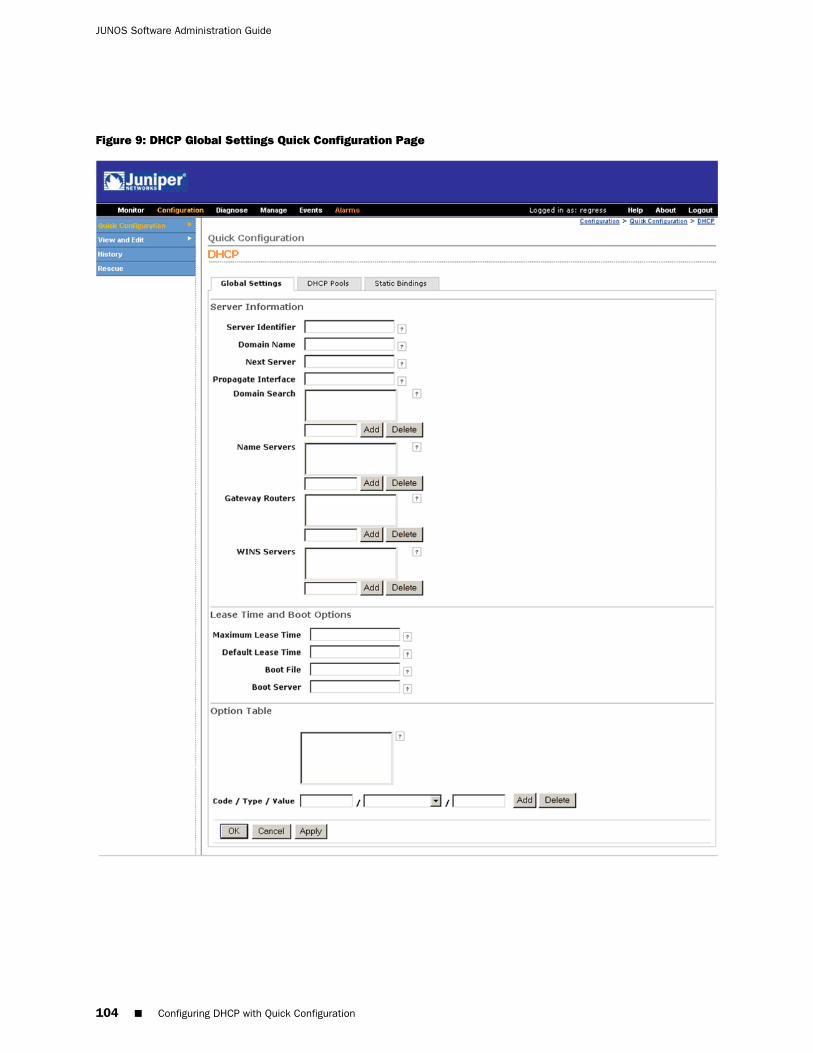
Figure 9: DHCP Global Settings Quick Configuration Page
104 ■ Configuring DHCP with Quick Configuration
JUNOS Software Administration Guide
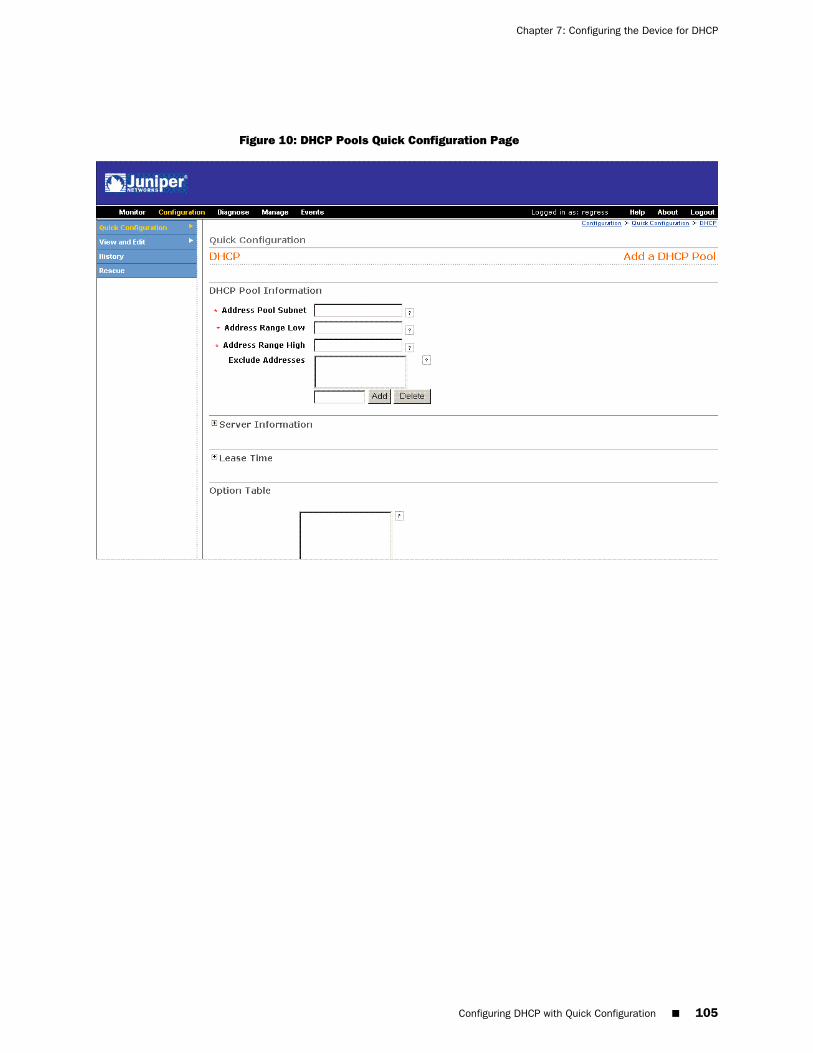
Figure 10: DHCP Pools Quick Configuration Page
Configuring DHCP with Quick Configuration ■ 105
Chapter 7: Configuring the Device for DHCP
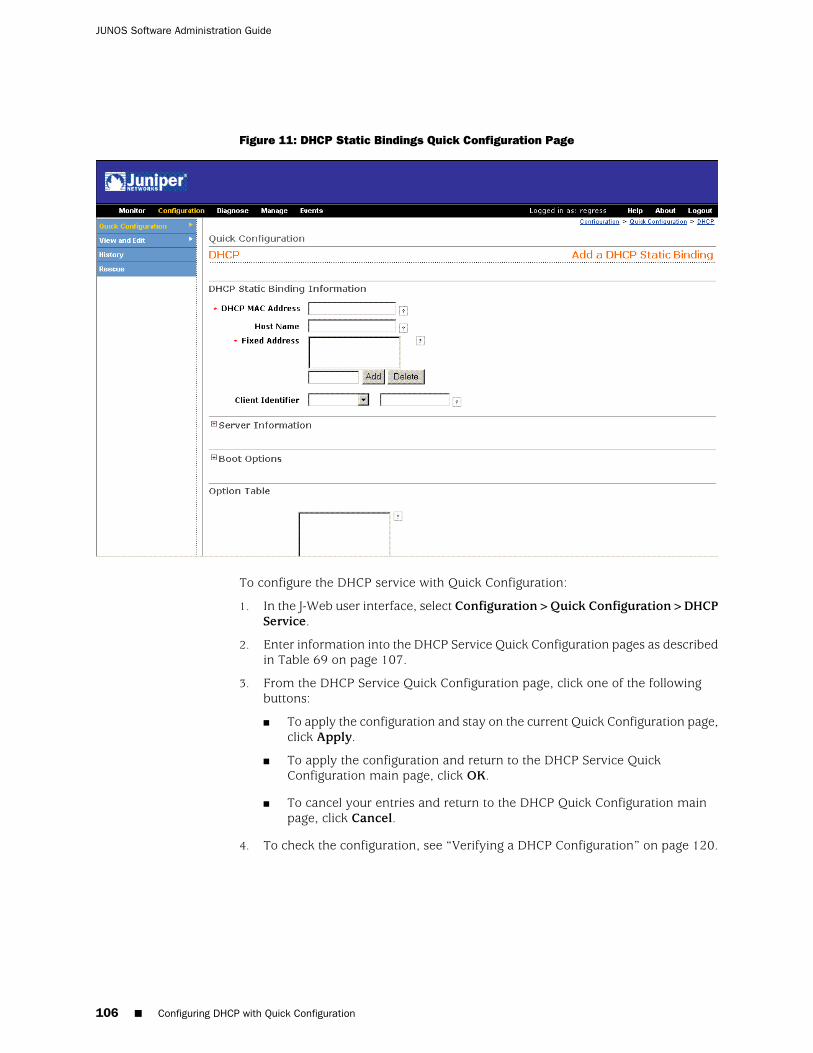
Figure 11: DHCP Static Bindings Quick Configuration Page
To configure the DHCP service with Quick Configuration:
1. In the J-Web user interface, select Configuration>Quick Configuration>DHCPService.
2. Enter information into the DHCP Service Quick Configuration pages as describedin Table 69 on page 107.
3. From the DHCP Service Quick Configuration page, click one of the followingbuttons:
■ To apply the configuration and stay on the current Quick Configuration page,click Apply.
■ To apply the configuration and return to the DHCP Service QuickConfiguration main page, click OK.
■ To cancel your entries and return to the DHCP Quick Configuration mainpage, click Cancel.
4. To check the configuration, see “Verifying a DHCP Configuration” on page 120.
106 ■ Configuring DHCP with Quick Configuration
JUNOS Software Administration Guide
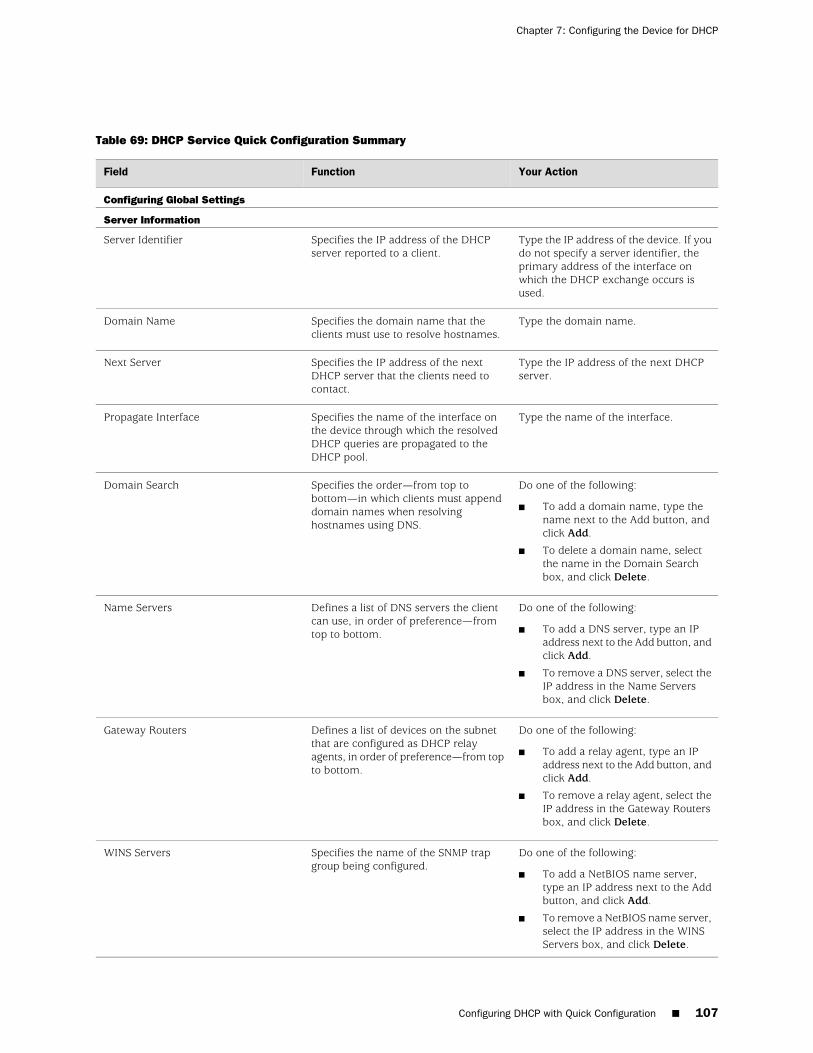
Table 69: DHCP Service Quick Configuration Summary
Your ActionFunctionField
Configuring Global Settings
Server Information
Type the IP address of the device. If youdo not specify a server identifier, theprimary address of the interface onwhich the DHCP exchange occurs isused.
Specifies the IP address of the DHCPserver reported to a client.
Server Identifier
Type the domain name.Specifies the domain name that theclients must use to resolve hostnames.
Domain Name
Type the IP address of the next DHCPserver.
Specifies the IP address of the nextDHCP server that the clients need tocontact.
Next Server
Type the name of the interface.Specifies the name of the interface onthe device through which the resolvedDHCP queries are propagated to theDHCP pool.
Propagate Interface
Do one of the following:
■ To add a domain name, type thename next to the Add button, andclick Add.
■ To delete a domain name, selectthe name in the Domain Searchbox, and click Delete.
Specifies the order—from top tobottom—in which clients must appenddomain names when resolvinghostnames using DNS.
Domain Search
Do one of the following:
■ To add a DNS server, type an IPaddress next to the Add button, andclick Add.
■ To remove a DNS server, select theIP address in the Name Serversbox, and click Delete.
Defines a list of DNS servers the clientcan use, in order of preference—fromtop to bottom.
Name Servers
Do one of the following:
■ To add a relay agent, type an IPaddress next to the Add button, andclick Add.
■ To remove a relay agent, select theIP address in the Gateway Routersbox, and click Delete.
Defines a list of devices on the subnetthat are configured as DHCP relayagents, in order of preference—from topto bottom.
Gateway Routers
Do one of the following:
■ To add a NetBIOS name server,type an IP address next to the Addbutton, and click Add.
■ To remove a NetBIOS name server,select the IP address in the WINSServers box, and click Delete.
Specifies the name of the SNMP trapgroup being configured.
WINS Servers
Configuring DHCP with Quick Configuration ■ 107
Chapter 7: Configuring the Device for DHCP
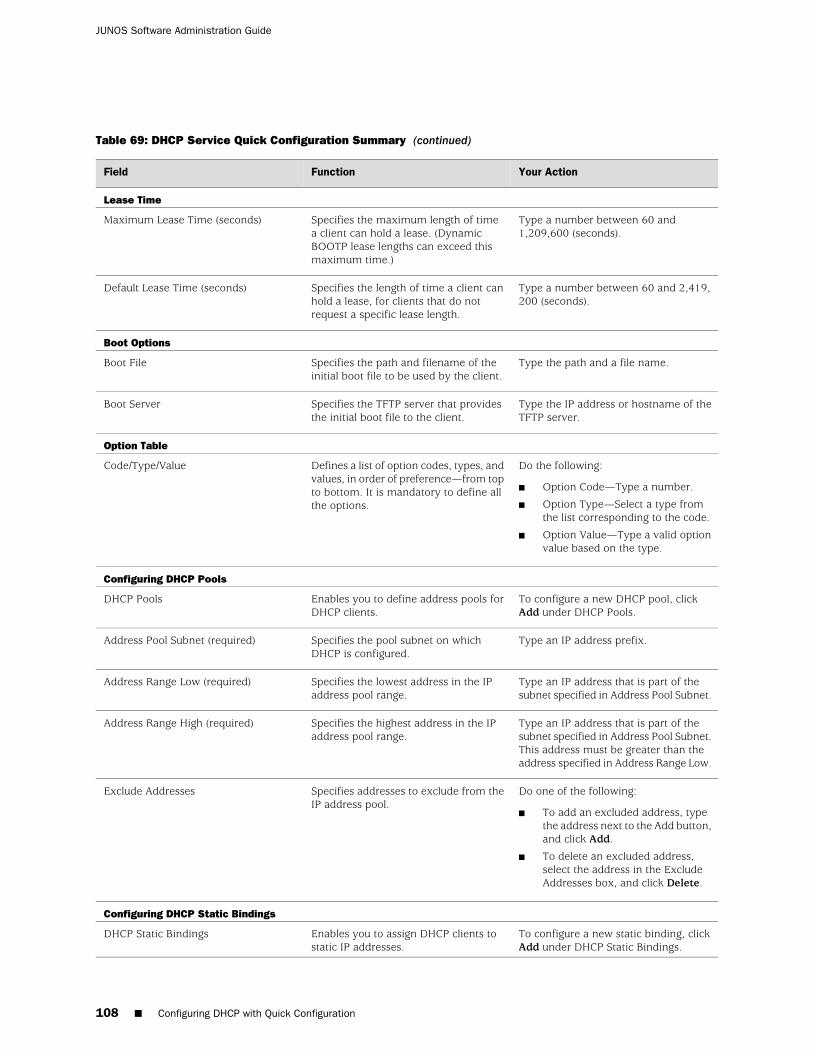
Table 69: DHCP Service Quick Configuration Summary (continued)
Your ActionFunctionField
Lease Time
Type a number between 60 and1,209,600 (seconds).
Specifies the maximum length of timea client can hold a lease. (DynamicBOOTP lease lengths can exceed thismaximum time.)
Maximum Lease Time (seconds)
Type a number between 60 and 2,419,200 (seconds).
Specifies the length of time a client canhold a lease, for clients that do notrequest a specific lease length.
Default Lease Time (seconds)
Boot Options
Type the path and a file name.Specifies the path and filename of theinitial boot file to be used by the client.
Boot File
Type the IP address or hostname of theTFTP server.
Specifies the TFTP server that providesthe initial boot file to the client.
Boot Server
Option Table
Do the following:
■ Option Code—Type a number.
■ Option Type—Select a type fromthe list corresponding to the code.
■ Option Value—Type a valid optionvalue based on the type.
Defines a list of option codes, types, andvalues, in order of preference—from topto bottom. It is mandatory to define allthe options.
Code/Type/Value
Configuring DHCP Pools
To configure a new DHCP pool, clickAdd under DHCP Pools.
Enables you to define address pools forDHCP clients.
DHCP Pools
Type an IP address prefix.Specifies the pool subnet on whichDHCP is configured.
Address Pool Subnet (required)
Type an IP address that is part of thesubnet specified in Address Pool Subnet.
Specifies the lowest address in the IPaddress pool range.
Address Range Low (required)
Type an IP address that is part of thesubnet specified in Address Pool Subnet.This address must be greater than theaddress specified in Address Range Low.
Specifies the highest address in the IPaddress pool range.
Address Range High (required)
Do one of the following:
■ To add an excluded address, typethe address next to the Add button,and click Add.
■ To delete an excluded address,select the address in the ExcludeAddresses box, and click Delete.
Specifies addresses to exclude from theIP address pool.
Exclude Addresses
Configuring DHCP Static Bindings
To configure a new static binding, clickAdd under DHCP Static Bindings.
Enables you to assign DHCP clients tostatic IP addresses.
DHCP Static Bindings
108 ■ Configuring DHCP with Quick Configuration
JUNOS Software Administration Guide
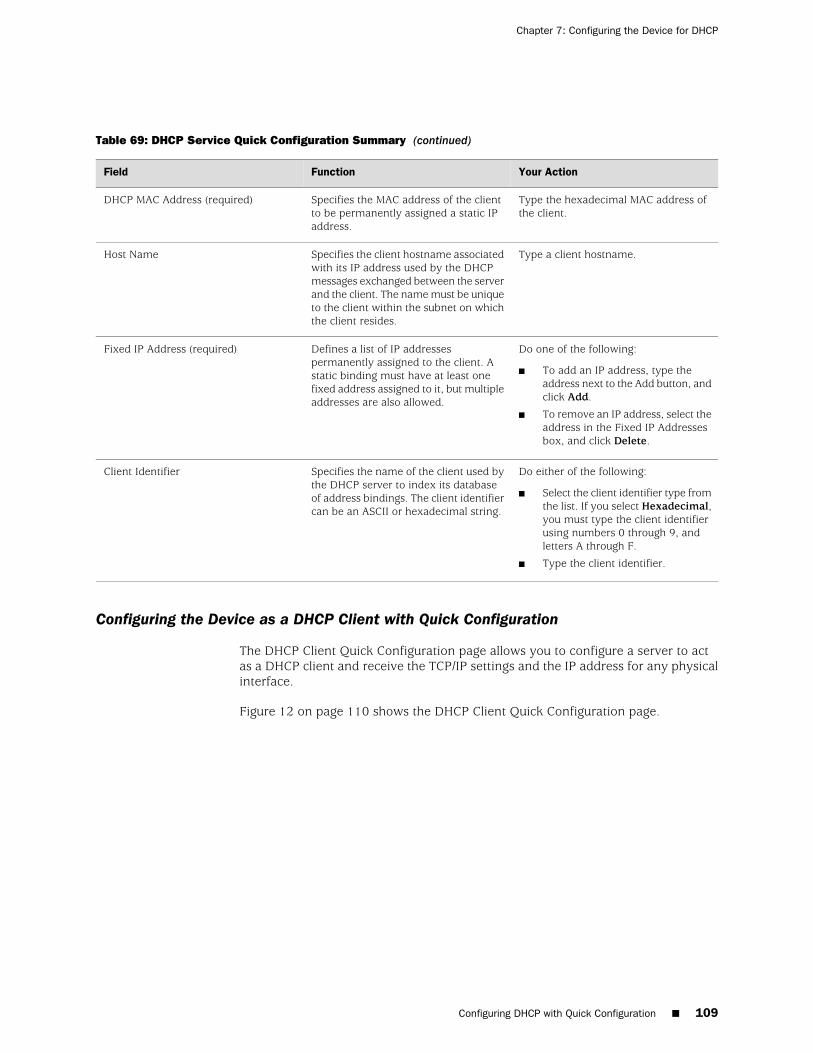
Table 69: DHCP Service Quick Configuration Summary (continued)
Your ActionFunctionField
Type the hexadecimal MAC address ofthe client.
Specifies the MAC address of the clientto be permanently assigned a static IPaddress.
DHCP MAC Address (required)
Type a client hostname.Specifies the client hostname associatedwith its IP address used by the DHCPmessages exchanged between the serverand the client. The name must be uniqueto the client within the subnet on whichthe client resides.
Host Name
Do one of the following:
■ To add an IP address, type theaddress next to the Add button, andclick Add.
■ To remove an IP address, select theaddress in the Fixed IP Addressesbox, and click Delete.
Defines a list of IP addressespermanently assigned to the client. Astatic binding must have at least onefixed address assigned to it, but multipleaddresses are also allowed.
Fixed IP Address (required)
Do either of the following:
■ Select the client identifier type fromthe list. If you select Hexadecimal,you must type the client identifierusing numbers 0 through 9, andletters A through F.
■ Type the client identifier.
Specifies the name of the client used bythe DHCP server to index its databaseof address bindings. The client identifiercan be an ASCII or hexadecimal string.
Client Identifier
Configuring the Device as a DHCP Client with Quick Configuration
The DHCP Client Quick Configuration page allows you to configure a server to actas a DHCP client and receive the TCP/IP settings and the IP address for any physicalinterface.
Figure 12 on page 110 shows the DHCP Client Quick Configuration page.
Configuring DHCP with Quick Configuration ■ 109
Chapter 7: Configuring the Device for DHCP
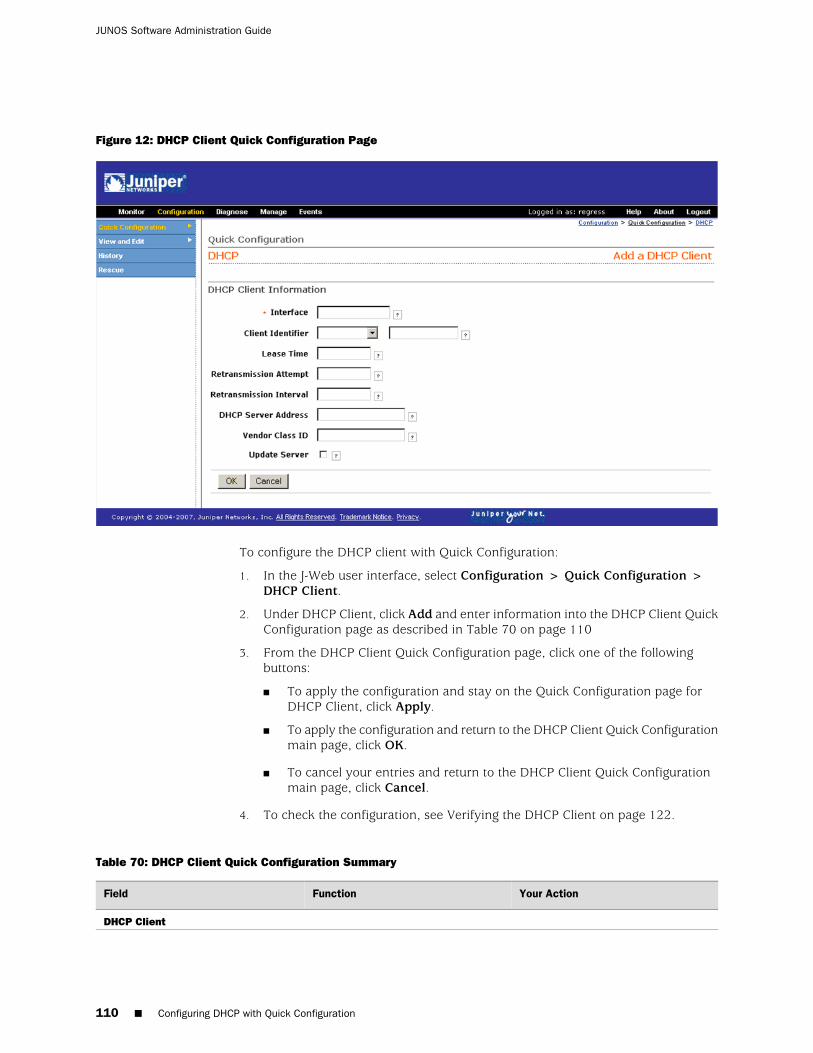
Figure 12: DHCP Client Quick Configuration Page
To configure the DHCP client with Quick Configuration:
1. In the J-Web user interface, select Configuration > Quick Configuration >DHCP Client.
2. Under DHCP Client, click Add and enter information into the DHCP Client QuickConfiguration page as described in Table 70 on page 110
3. From the DHCP Client Quick Configuration page, click one of the followingbuttons:
■ To apply the configuration and stay on the Quick Configuration page forDHCP Client, click Apply.
■ To apply the configuration and return to the DHCP Client Quick Configurationmain page, click OK.
■ To cancel your entries and return to the DHCP Client Quick Configurationmain page, click Cancel.
4. To check the configuration, see Verifying the DHCP Client on page 122.
Table 70: DHCP Client Quick Configuration Summary
Your ActionFunctionField
DHCP Client
110 ■ Configuring DHCP with Quick Configuration
JUNOS Software Administration Guide
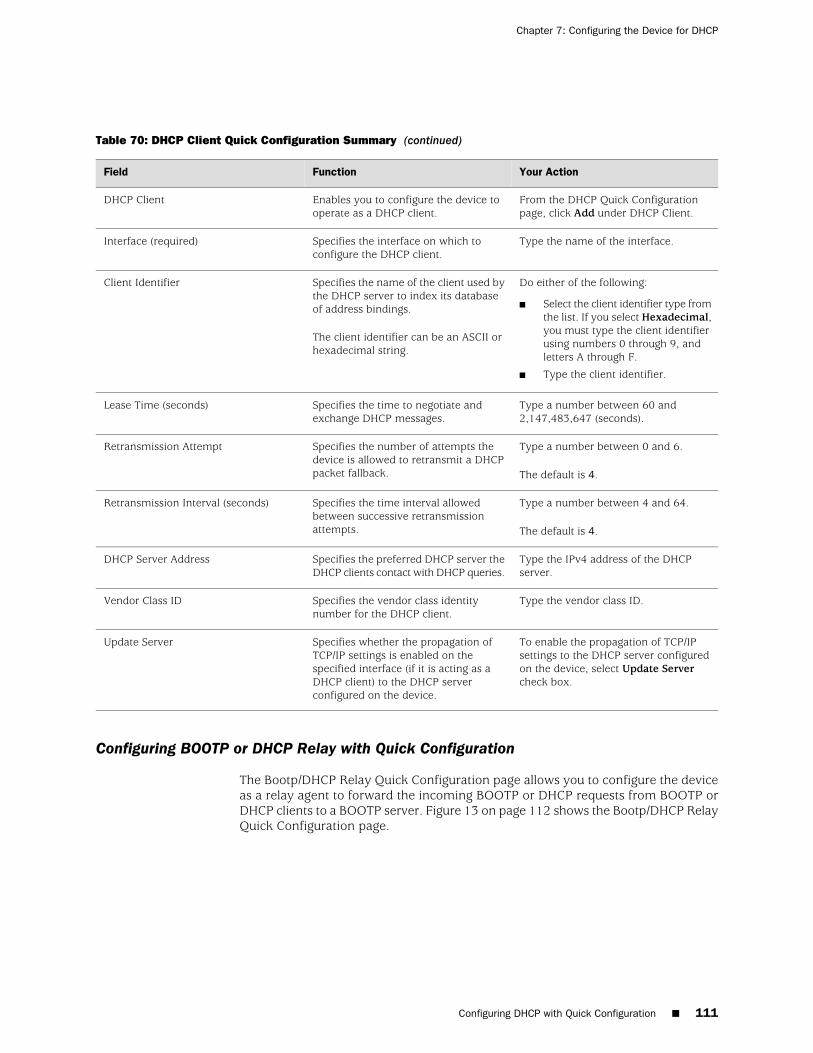
Table 70: DHCP Client Quick Configuration Summary (continued)
Your ActionFunctionField
From the DHCP Quick Configurationpage, click Add under DHCP Client.
Enables you to configure the device tooperate as a DHCP client.
DHCP Client
Type the name of the interface.Specifies the interface on which toconfigure the DHCP client.
Interface (required)
Do either of the following:
■ Select the client identifier type fromthe list. If you select Hexadecimal,you must type the client identifierusing numbers 0 through 9, andletters A through F.
■ Type the client identifier.
Specifies the name of the client used bythe DHCP server to index its databaseof address bindings.
The client identifier can be an ASCII orhexadecimal string.
Client Identifier
Type a number between 60 and2,147,483,647 (seconds).
Specifies the time to negotiate andexchange DHCP messages.
Lease Time (seconds)
Type a number between 0 and 6.
The default is 4.
Specifies the number of attempts thedevice is allowed to retransmit a DHCPpacket fallback.
Retransmission Attempt
Type a number between 4 and 64.
The default is 4.
Specifies the time interval allowedbetween successive retransmissionattempts.
Retransmission Interval (seconds)
Type the IPv4 address of the DHCPserver.
Specifies the preferred DHCP server theDHCP clients contact with DHCP queries.
DHCP Server Address
Type the vendor class ID.Specifies the vendor class identitynumber for the DHCP client.
Vendor Class ID
To enable the propagation of TCP/IPsettings to the DHCP server configuredon the device, select Update Servercheck box.
Specifies whether the propagation ofTCP/IP settings is enabled on thespecified interface (if it is acting as aDHCP client) to the DHCP serverconfigured on the device.
Update Server
Configuring BOOTP or DHCP Relay with Quick Configuration
The Bootp/DHCP Relay Quick Configuration page allows you to configure the deviceas a relay agent to forward the incoming BOOTP or DHCP requests from BOOTP orDHCP clients to a BOOTP server. Figure 13 on page 112 shows the Bootp/DHCP RelayQuick Configuration page.
Configuring DHCP with Quick Configuration ■ 111
Chapter 7: Configuring the Device for DHCP
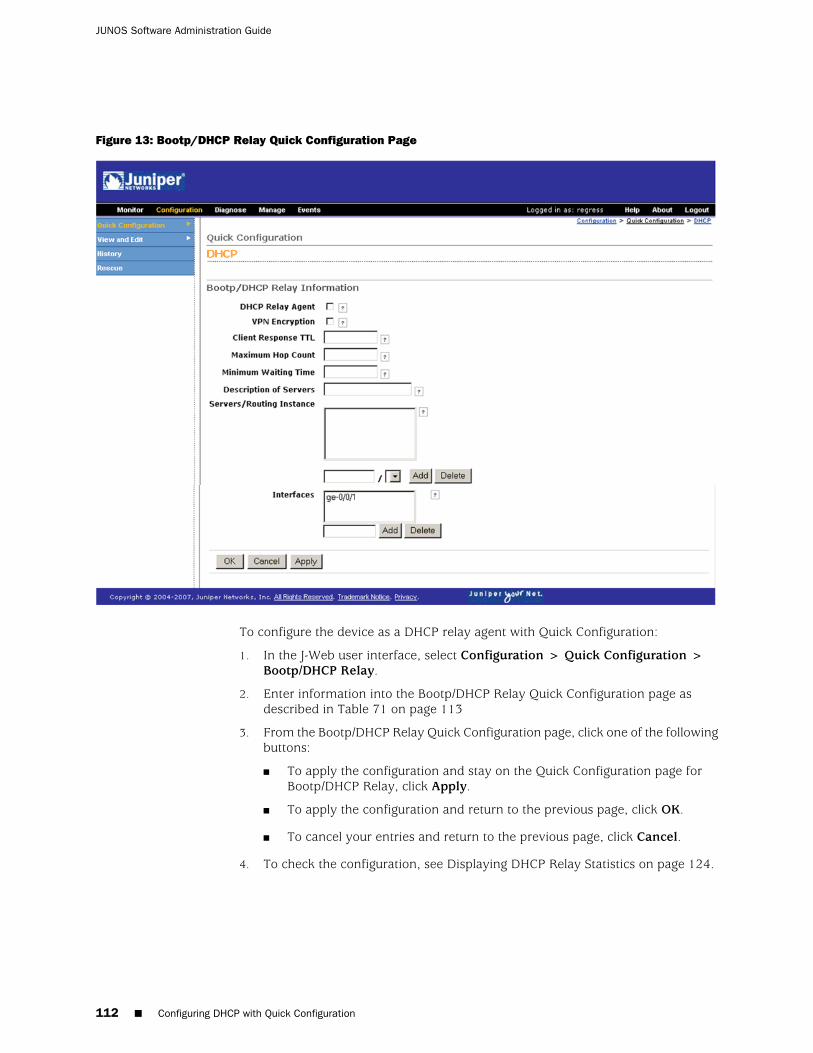
Figure 13: Bootp/DHCP Relay Quick Configuration Page
To configure the device as a DHCP relay agent with Quick Configuration:
1. In the J-Web user interface, select Configuration > Quick Configuration >Bootp/DHCP Relay.
2. Enter information into the Bootp/DHCP Relay Quick Configuration page asdescribed in Table 71 on page 113
3. From the Bootp/DHCP Relay Quick Configuration page, click one of the followingbuttons:
■ To apply the configuration and stay on the Quick Configuration page forBootp/DHCP Relay, click Apply.
■ To apply the configuration and return to the previous page, click OK.
■ To cancel your entries and return to the previous page, click Cancel.
4. To check the configuration, see Displaying DHCP Relay Statistics on page 124.
112 ■ Configuring DHCP with Quick Configuration
JUNOS Software Administration Guide
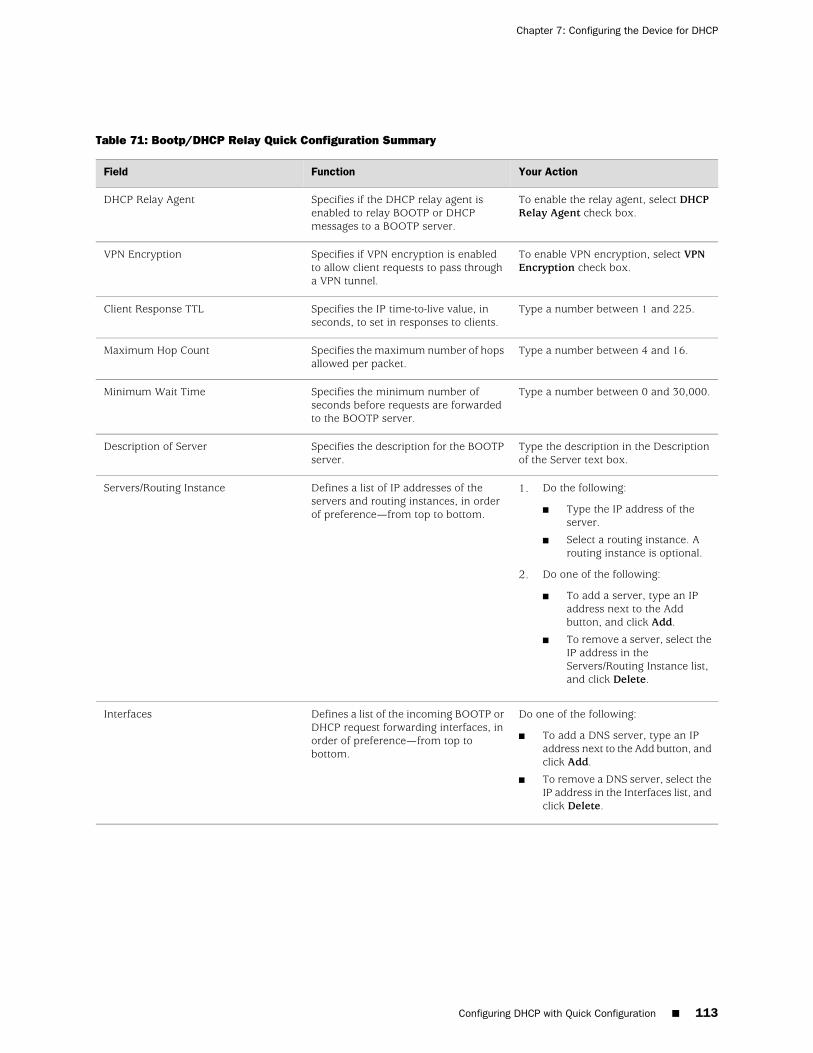
Table 71: Bootp/DHCP Relay Quick Configuration Summary
Your ActionFunctionField
To enable the relay agent, select DHCPRelay Agent check box.
Specifies if the DHCP relay agent isenabled to relay BOOTP or DHCPmessages to a BOOTP server.
DHCP Relay Agent
To enable VPN encryption, select VPNEncryption check box.
Specifies if VPN encryption is enabledto allow client requests to pass througha VPN tunnel.
VPN Encryption
Type a number between 1 and 225.Specifies the IP time-to-live value, inseconds, to set in responses to clients.
Client Response TTL
Type a number between 4 and 16.Specifies the maximum number of hopsallowed per packet.
Maximum Hop Count
Type a number between 0 and 30,000.Specifies the minimum number ofseconds before requests are forwardedto the BOOTP server.
Minimum Wait Time
Type the description in the Descriptionof the Server text box.
Specifies the description for the BOOTPserver.
Description of Server
1. Do the following:
■ Type the IP address of theserver.
■ Select a routing instance. Arouting instance is optional.
2. Do one of the following:
■ To add a server, type an IPaddress next to the Addbutton, and click Add.
■ To remove a server, select theIP address in theServers/Routing Instance list,and click Delete.
Defines a list of IP addresses of theservers and routing instances, in orderof preference—from top to bottom.
Servers/Routing Instance
Do one of the following:
■ To add a DNS server, type an IPaddress next to the Add button, andclick Add.
■ To remove a DNS server, select theIP address in the Interfaces list, andclick Delete.
Defines a list of the incoming BOOTP orDHCP request forwarding interfaces, inorder of preference—from top tobottom.
Interfaces
Configuring DHCP with Quick Configuration ■ 113
Chapter 7: Configuring the Device for DHCP
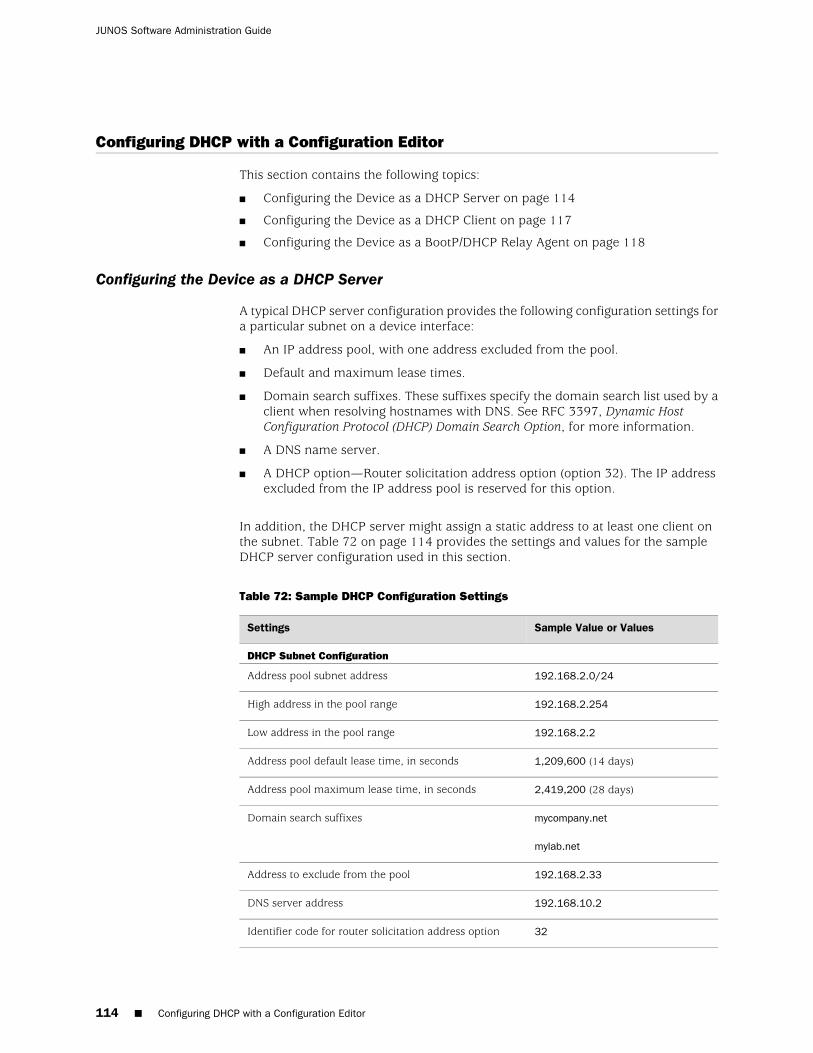
Configuring DHCP with a Configuration Editor
This section contains the following topics:
■ Configuring the Device as a DHCP Server on page 114
■ Configuring the Device as a DHCP Client on page 117
■ Configuring the Device as a BootP/DHCP Relay Agent on page 118
Configuring the Device as a DHCP Server
A typical DHCP server configuration provides the following configuration settings fora particular subnet on a device interface:
■ An IP address pool, with one address excluded from the pool.
■ Default and maximum lease times.
■ Domain search suffixes. These suffixes specify the domain search list used by aclient when resolving hostnames with DNS. See RFC 3397, Dynamic HostConfiguration Protocol (DHCP) Domain Search Option, for more information.
■ A DNS name server.
■ A DHCP option—Router solicitation address option (option 32). The IP addressexcluded from the IP address pool is reserved for this option.
In addition, the DHCP server might assign a static address to at least one client onthe subnet. Table 72 on page 114 provides the settings and values for the sampleDHCP server configuration used in this section.
Table 72: Sample DHCP Configuration Settings
Sample Value or ValuesSettings
DHCP Subnet Configuration
192.168.2.0/24Address pool subnet address
192.168.2.254High address in the pool range
192.168.2.2Low address in the pool range
1,209,600 (14 days)Address pool default lease time, in seconds
2,419,200 (28 days)Address pool maximum lease time, in seconds
mycompany.net
mylab.net
Domain search suffixes
192.168.2.33Address to exclude from the pool
192.168.10.2DNS server address
32Identifier code for router solicitation address option
114 ■ Configuring DHCP with a Configuration Editor
JUNOS Software Administration Guide
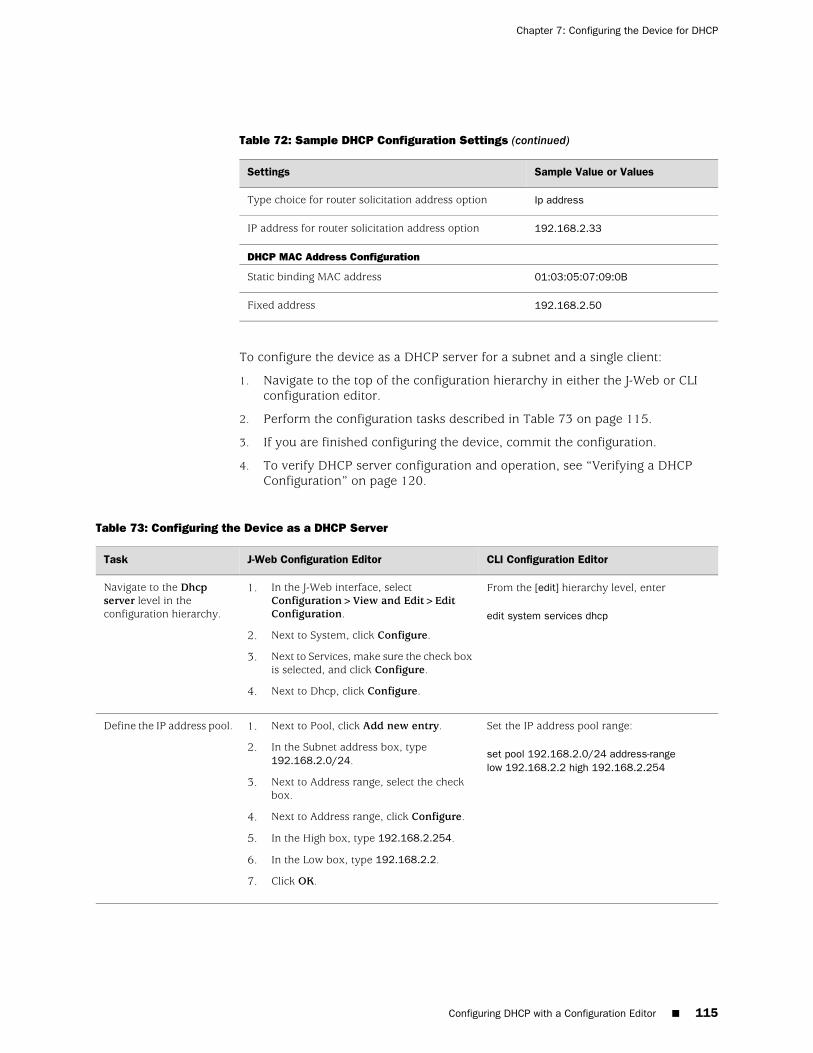
Table 72: Sample DHCP Configuration Settings (continued)
Sample Value or ValuesSettings
Ip addressType choice for router solicitation address option
192.168.2.33IP address for router solicitation address option
DHCP MAC Address Configuration
01:03:05:07:09:0BStatic binding MAC address
192.168.2.50Fixed address
To configure the device as a DHCP server for a subnet and a single client:
1. Navigate to the top of the configuration hierarchy in either the J-Web or CLIconfiguration editor.
2. Perform the configuration tasks described in Table 73 on page 115.
3. If you are finished configuring the device, commit the configuration.
4. To verify DHCP server configuration and operation, see “Verifying a DHCPConfiguration” on page 120.
Table 73: Configuring the Device as a DHCP Server
CLI Configuration EditorJ-Web Configuration EditorTask
From the [edit] hierarchy level, enter
edit system services dhcp
1. In the J-Web interface, selectConfiguration>View and Edit>EditConfiguration.
2. Next to System, click Configure.
3. Next to Services, make sure the check boxis selected, and click Configure.
4. Next to Dhcp, click Configure.
Navigate to the Dhcpserver level in theconfiguration hierarchy.
Set the IP address pool range:
set pool 192.168.2.0/24 address-rangelow 192.168.2.2 high 192.168.2.254
1. Next to Pool, click Add new entry.
2. In the Subnet address box, type192.168.2.0/24.
3. Next to Address range, select the checkbox.
4. Next to Address range, click Configure.
5. In the High box, type 192.168.2.254.
6. In the Low box, type 192.168.2.2.
7. Click OK.
Define the IP address pool.
Configuring DHCP with a Configuration Editor ■ 115
Chapter 7: Configuring the Device for DHCP
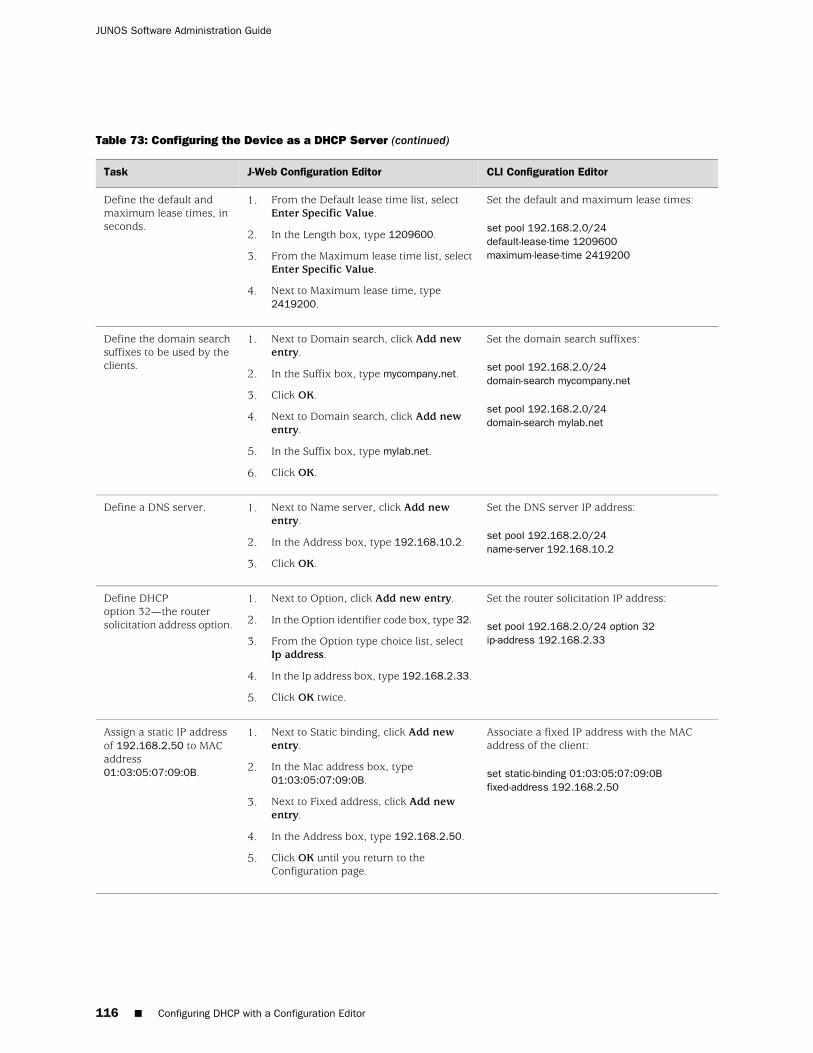
Table 73: Configuring the Device as a DHCP Server (continued)
CLI Configuration EditorJ-Web Configuration EditorTask
Set the default and maximum lease times:
set pool 192.168.2.0/24default-lease-time 1209600maximum-lease-time 2419200
1. From the Default lease time list, selectEnter Specific Value.
2. In the Length box, type 1209600.
3. From the Maximum lease time list, selectEnter Specific Value.
4. Next to Maximum lease time, type2419200.
Define the default andmaximum lease times, inseconds.
Set the domain search suffixes:
set pool 192.168.2.0/24domain-search mycompany.net
set pool 192.168.2.0/24domain-search mylab.net
1. Next to Domain search, click Add newentry.
2. In the Suffix box, type mycompany.net.
3. Click OK.
4. Next to Domain search, click Add newentry.
5. In the Suffix box, type mylab.net.
6. Click OK.
Define the domain searchsuffixes to be used by theclients.
Set the DNS server IP address:
set pool 192.168.2.0/24name-server 192.168.10.2
1. Next to Name server, click Add newentry.
2. In the Address box, type 192.168.10.2.
3. Click OK.
Define a DNS server.
Set the router solicitation IP address:
set pool 192.168.2.0/24 option 32ip-address 192.168.2.33
1. Next to Option, click Add new entry.
2. In the Option identifier code box, type 32.
3. From the Option type choice list, selectIp address.
4. In the Ip address box, type 192.168.2.33.
5. Click OK twice.
Define DHCPoption 32—the routersolicitation address option.
Associate a fixed IP address with the MACaddress of the client:
set static-binding 01:03:05:07:09:0Bfixed-address 192.168.2.50
1. Next to Static binding, click Add newentry.
2. In the Mac address box, type01:03:05:07:09:0B.
3. Next to Fixed address, click Add newentry.
4. In the Address box, type 192.168.2.50.
5. Click OK until you return to theConfiguration page.
Assign a static IP addressof 192.168.2.50 to MACaddress01:03:05:07:09:0B.
116 ■ Configuring DHCP with a Configuration Editor
JUNOS Software Administration Guide
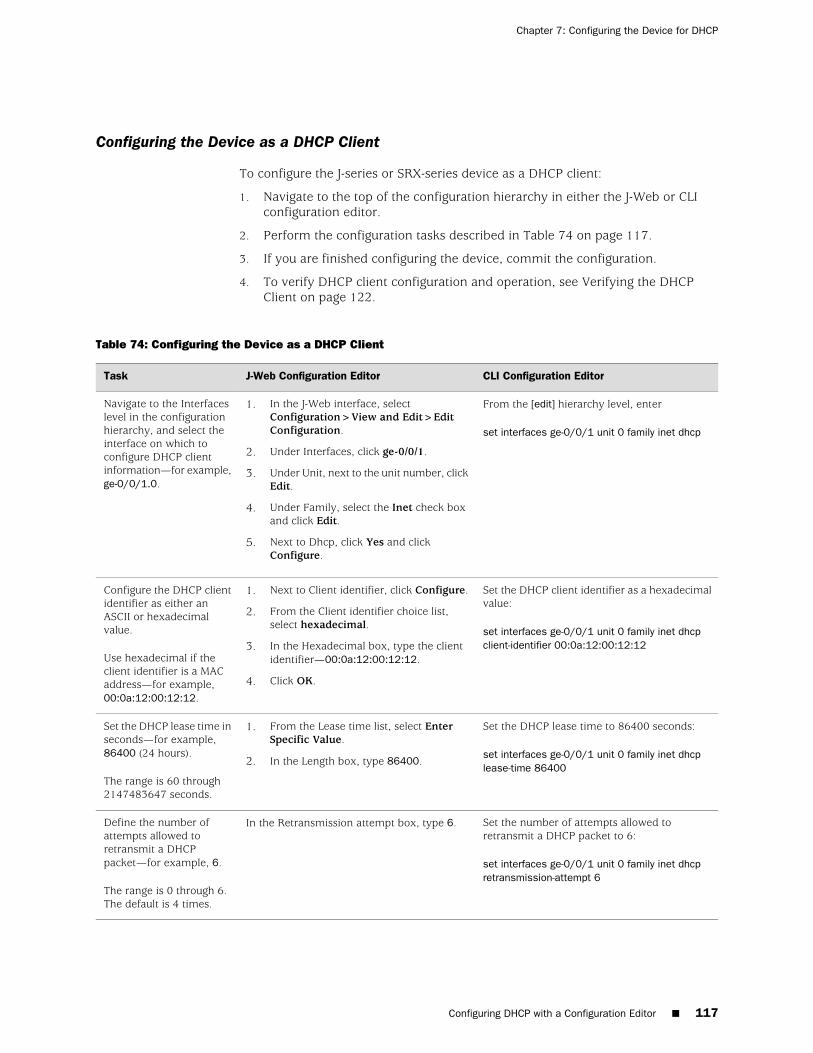
Configuring the Device as a DHCP Client
To configure the J-series or SRX-series device as a DHCP client:
1. Navigate to the top of the configuration hierarchy in either the J-Web or CLIconfiguration editor.
2. Perform the configuration tasks described in Table 74 on page 117.
3. If you are finished configuring the device, commit the configuration.
4. To verify DHCP client configuration and operation, see Verifying the DHCPClient on page 122.
Table 74: Configuring the Device as a DHCP Client
CLI Configuration EditorJ-Web Configuration EditorTask
From the [edit] hierarchy level, enter
set interfaces ge-0/0/1 unit 0 family inet dhcp
1. In the J-Web interface, selectConfiguration>View and Edit>EditConfiguration.
2. Under Interfaces, click ge-0/0/1.
3. Under Unit, next to the unit number, clickEdit.
4. Under Family, select the Inet check boxand click Edit.
5. Next to Dhcp, click Yes and clickConfigure.
Navigate to the Interfaceslevel in the configurationhierarchy, and select theinterface on which toconfigure DHCP clientinformation—for example,ge-0/0/1.0.
Set the DHCP client identifier as a hexadecimalvalue:
set interfaces ge-0/0/1 unit 0 family inet dhcpclient-identifier 00:0a:12:00:12:12
1. Next to Client identifier, click Configure.
2. From the Client identifier choice list,select hexadecimal.
3. In the Hexadecimal box, type the clientidentifier—00:0a:12:00:12:12.
4. Click OK.
Configure the DHCP clientidentifier as either anASCII or hexadecimalvalue.
Use hexadecimal if theclient identifier is a MACaddress—for example,00:0a:12:00:12:12.
Set the DHCP lease time to 86400 seconds:
set interfaces ge-0/0/1 unit 0 family inet dhcplease-time 86400
1. From the Lease time list, select EnterSpecific Value.
2. In the Length box, type 86400.
Set the DHCP lease time inseconds—for example,86400 (24 hours).
The range is 60 through2147483647 seconds.
Set the number of attempts allowed toretransmit a DHCP packet to 6:
set interfaces ge-0/0/1 unit 0 family inet dhcpretransmission-attempt 6
In the Retransmission attempt box, type 6.Define the number ofattempts allowed toretransmit a DHCPpacket—for example, 6.
The range is 0 through 6.The default is 4 times.
Configuring DHCP with a Configuration Editor ■ 117
Chapter 7: Configuring the Device for DHCP
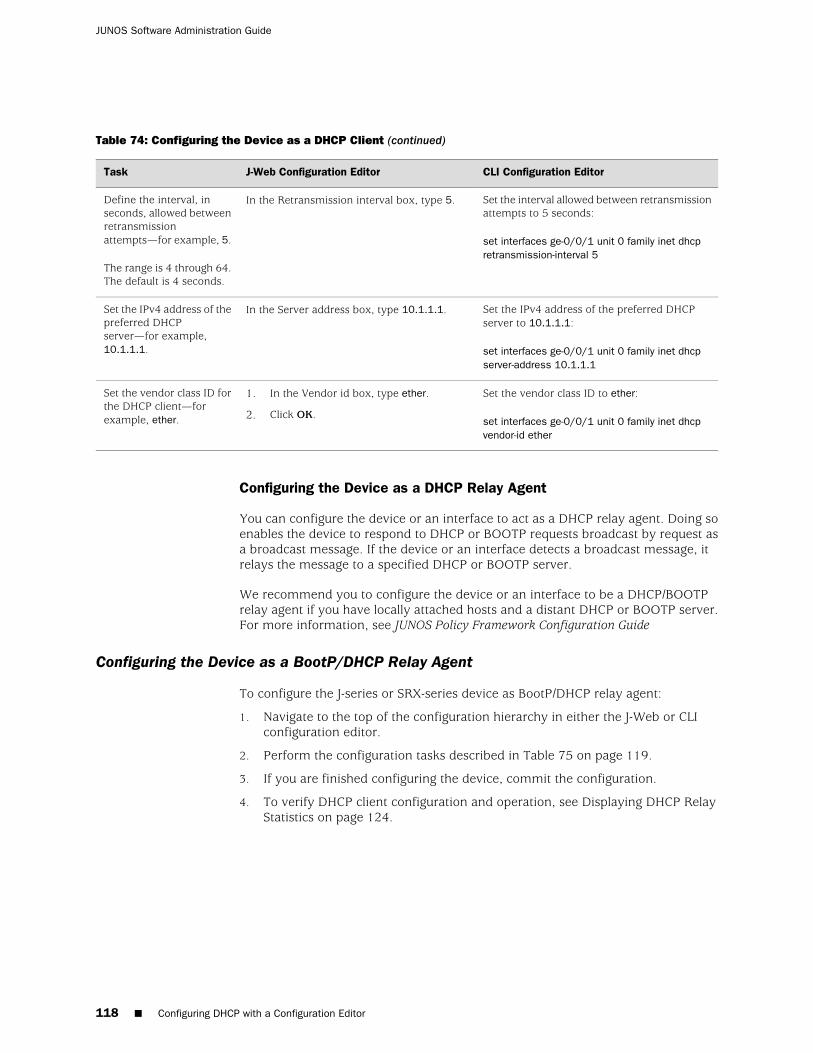
Table 74: Configuring the Device as a DHCP Client (continued)
CLI Configuration EditorJ-Web Configuration EditorTask
Set the interval allowed between retransmissionattempts to 5 seconds:
set interfaces ge-0/0/1 unit 0 family inet dhcpretransmission-interval 5
In the Retransmission interval box, type 5.Define the interval, inseconds, allowed betweenretransmissionattempts—for example, 5.
The range is 4 through 64.The default is 4 seconds.
Set the IPv4 address of the preferred DHCPserver to 10.1.1.1:
set interfaces ge-0/0/1 unit 0 family inet dhcpserver-address 10.1.1.1
In the Server address box, type 10.1.1.1.Set the IPv4 address of thepreferred DHCPserver—for example,10.1.1.1.
Set the vendor class ID to ether:
set interfaces ge-0/0/1 unit 0 family inet dhcpvendor-id ether
1. In the Vendor id box, type ether.
2. Click OK.
Set the vendor class ID forthe DHCP client—forexample, ether.
Configuring the Device as a DHCP Relay Agent
You can configure the device or an interface to act as a DHCP relay agent. Doing soenables the device to respond to DHCP or BOOTP requests broadcast by request asa broadcast message. If the device or an interface detects a broadcast message, itrelays the message to a specified DHCP or BOOTP server.
We recommend you to configure the device or an interface to be a DHCP/BOOTPrelay agent if you have locally attached hosts and a distant DHCP or BOOTP server.For more information, see JUNOS Policy Framework Configuration Guide
Configuring the Device as a BootP/DHCP Relay Agent
To configure the J-series or SRX-series device as BootP/DHCP relay agent:
1. Navigate to the top of the configuration hierarchy in either the J-Web or CLIconfiguration editor.
2. Perform the configuration tasks described in Table 75 on page 119.
3. If you are finished configuring the device, commit the configuration.
4. To verify DHCP client configuration and operation, see Displaying DHCP RelayStatistics on page 124.
118 ■ Configuring DHCP with a Configuration Editor
JUNOS Software Administration Guide

Table 75: Configuring the Device as a BootP/DHCP Relay Agent
CLI Configuration EditorJ-Web Configuration EditorTask
From the [edit] hierarchy level, enter
set forwarding-options helpers bootp
In the J-Web interface, selectConfiguration>QuickConfiguration>DHCP>BootP/DHCP RelayAgent..
Navigate to theForwarding-options levelin the configurationhierarchy, and select theinterface on which toconfigure the BootP/DHCPrelay agent information.
Enable the DHCP relay agent:
set forwarding-options helpers bootp relayagent-option
Select the DHCP relay agent check box toenable the BootP/DHCP relay agent.
Enable the DHCP relayagent to relay bootp/DHCPmessages to BootP server.
Enable VPN encryption to allow client requeststo pass through VPN tunnel:
set forwarding-options helpers bootp vpn
Select the VPN encryption check box.Enable VPN encryption toallow client requests topass through the VPNtunnel.
Set the IP time-to-live value to be set inresponses to client to 20:
set forwarding-options helpers bootpclient-response-ttl 20
In the Client response TTL box, type20.Define the IP time-to-livevalue to be set inresponses to client—forexample, 20.
The range is 1—255.
Set the maximum number of hops allowed perpacket to 10:
set forwarding-options helpers bootpmaximum-hop-count number 10
In the Maximum hop count box, type 10.Define the maximumnumber of hops allowedper packet—for example,10.
The range is 4—16.
Set the minimum number of seconds beforerequests are forwarded to 300:
set forwarding-options helpers bootpminimum-wait-time seconds 300
In the Minimum wait time box, type 300.Define the minimumnumber of seconds beforerequests areforwarded—for example,300.
The range is 0—30000seconds.
Set the description of the server:
set forwarding-options helpers bootp descriptiontext
In the Description box, type the description ofthe server.
Define the text descriptionof the server.
The value is a string.
Set the server name:
set forwarding-options helpers bootp server
1. Next to Sever, click Add new Entry.
2. Next to the Name box, type 2.2.2.2.
Define a valid server nameor address to the server toforward.
The value is an IPv4address.
Configuring DHCP with a Configuration Editor ■ 119
Chapter 7: Configuring the Device for DHCP
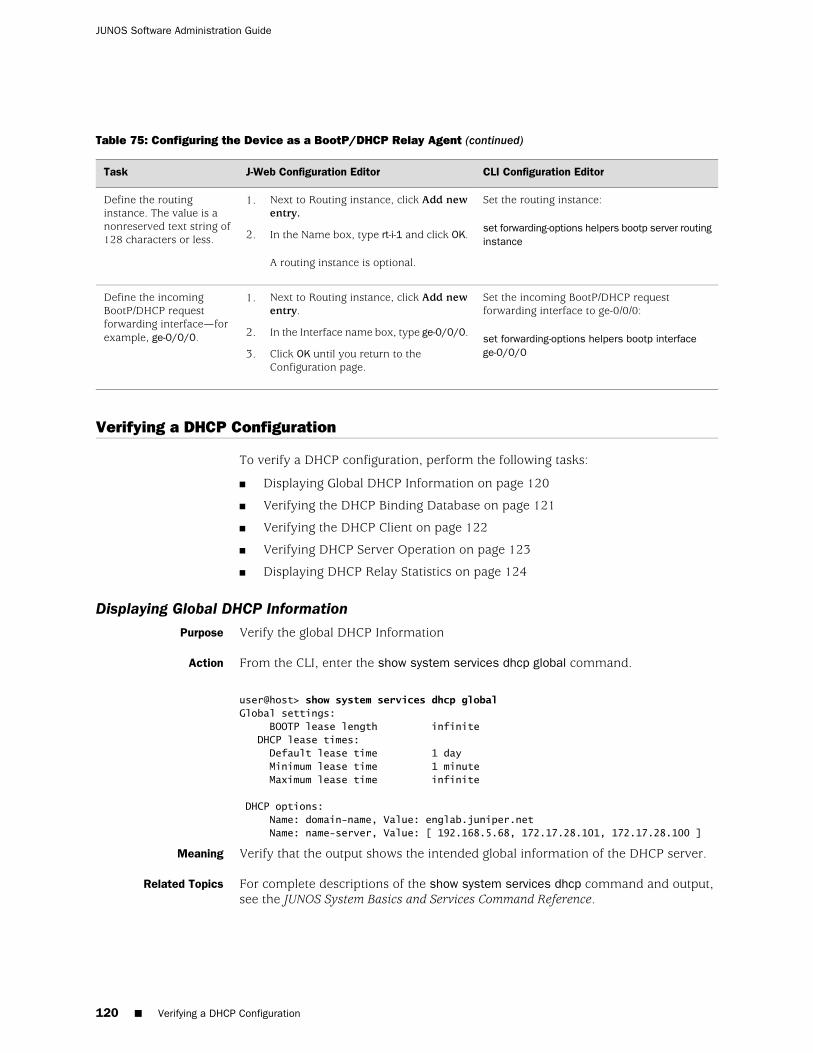
Table 75: Configuring the Device as a BootP/DHCP Relay Agent (continued)
CLI Configuration EditorJ-Web Configuration EditorTask
Set the routing instance:
set forwarding-options helpers bootp server routinginstance
1. Next to Routing instance, click Add newentry.
2. In the Name box, type rt-i-1 and click OK.
A routing instance is optional.
Define the routinginstance. The value is anonreserved text string of128 characters or less.
Set the incoming BootP/DHCP requestforwarding interface to ge-0/0/0:
set forwarding-options helpers bootp interfacege-0/0/0
1. Next to Routing instance, click Add newentry.
2. In the Interface name box, type ge-0/0/0.
3. Click OK until you return to theConfiguration page.
Define the incomingBootP/DHCP requestforwarding interface—forexample, ge-0/0/0.
Verifying a DHCP Configuration
To verify a DHCP configuration, perform the following tasks:
■ Displaying Global DHCP Information on page 120
■ Verifying the DHCP Binding Database on page 121
■ Verifying the DHCP Client on page 122
■ Verifying DHCP Server Operation on page 123
■ Displaying DHCP Relay Statistics on page 124
Displaying Global DHCP InformationPurpose Verify the global DHCP Information
Action From the CLI, enter the show system services dhcp global command.
user@host> show system services dhcp globalGlobal settings: BOOTP lease length infinite DHCP lease times: Default lease time 1 day Minimum lease time 1 minute Maximum lease time infinite
DHCP options: Name: domain-name, Value: englab.juniper.net Name: name-server, Value: [ 192.168.5.68, 172.17.28.101, 172.17.28.100 ]
Meaning Verify that the output shows the intended global information of the DHCP server.
Related Topics For complete descriptions of the show system services dhcp command and output,see the JUNOS System Basics and Services Command Reference.
120 ■ Verifying a DHCP Configuration
JUNOS Software Administration Guide
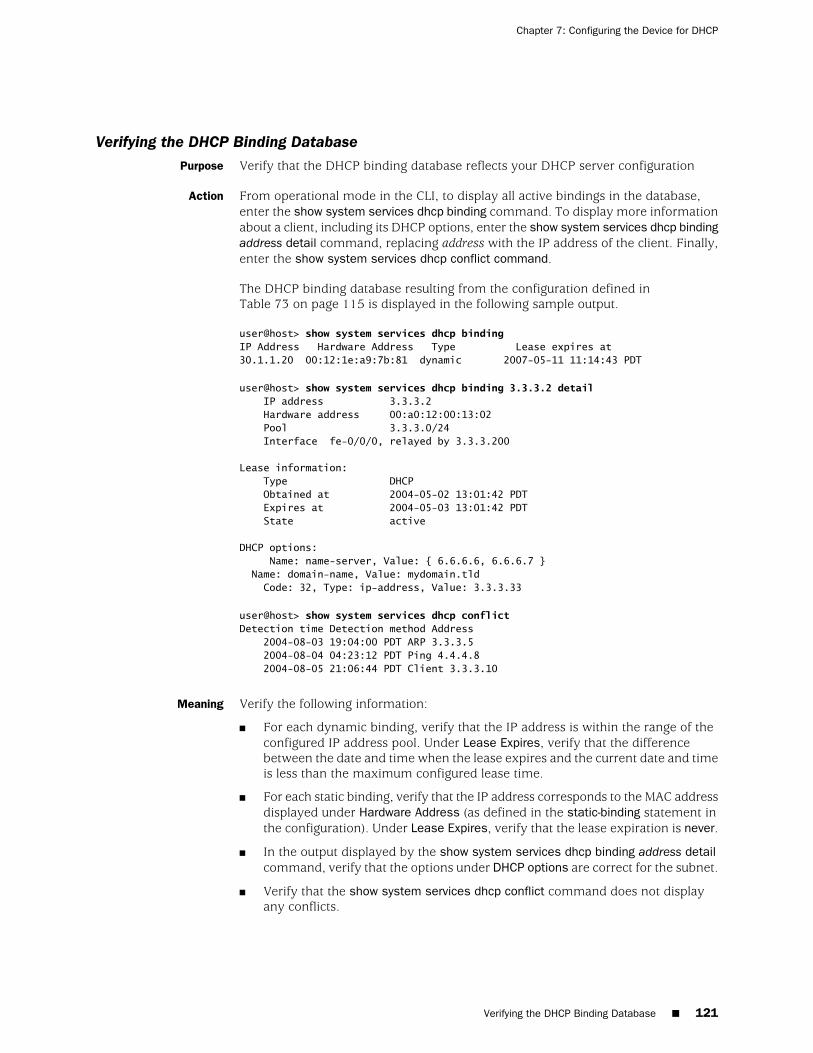
Verifying the DHCP Binding DatabasePurpose Verify that the DHCP binding database reflects your DHCP server configuration
Action From operational mode in the CLI, to display all active bindings in the database,enter the show system services dhcp binding command. To display more informationabout a client, including its DHCP options, enter the show system services dhcp bindingaddress detail command, replacing address with the IP address of the client. Finally,enter the show system services dhcp conflict command.
The DHCP binding database resulting from the configuration defined inTable 73 on page 115 is displayed in the following sample output.
user@host> show system services dhcp bindingIP Address Hardware Address Type Lease expires at30.1.1.20 00:12:1e:a9:7b:81 dynamic 2007-05-11 11:14:43 PDT
user@host> show system services dhcp binding 3.3.3.2 detail IP address 3.3.3.2 Hardware address 00:a0:12:00:13:02 Pool 3.3.3.0/24 Interface fe-0/0/0, relayed by 3.3.3.200
Lease information: Type DHCP Obtained at 2004-05-02 13:01:42 PDT Expires at 2004-05-03 13:01:42 PDT State active
DHCP options: Name: name-server, Value: { 6.6.6.6, 6.6.6.7 } Name: domain-name, Value: mydomain.tld Code: 32, Type: ip-address, Value: 3.3.3.33
user@host> show system services dhcp conflictDetection time Detection method Address 2004-08-03 19:04:00 PDT ARP 3.3.3.5 2004-08-04 04:23:12 PDT Ping 4.4.4.8 2004-08-05 21:06:44 PDT Client 3.3.3.10
Meaning Verify the following information:
■ For each dynamic binding, verify that the IP address is within the range of theconfigured IP address pool. Under Lease Expires, verify that the differencebetween the date and time when the lease expires and the current date and timeis less than the maximum configured lease time.
■ For each static binding, verify that the IP address corresponds to the MAC addressdisplayed under Hardware Address (as defined in the static-binding statement inthe configuration). Under Lease Expires, verify that the lease expiration is never.
■ In the output displayed by the show system services dhcp binding address detailcommand, verify that the options under DHCP options are correct for the subnet.
■ Verify that the show system services dhcp conflict command does not displayany conflicts.
Verifying the DHCP Binding Database ■ 121
Chapter 7: Configuring the Device for DHCP
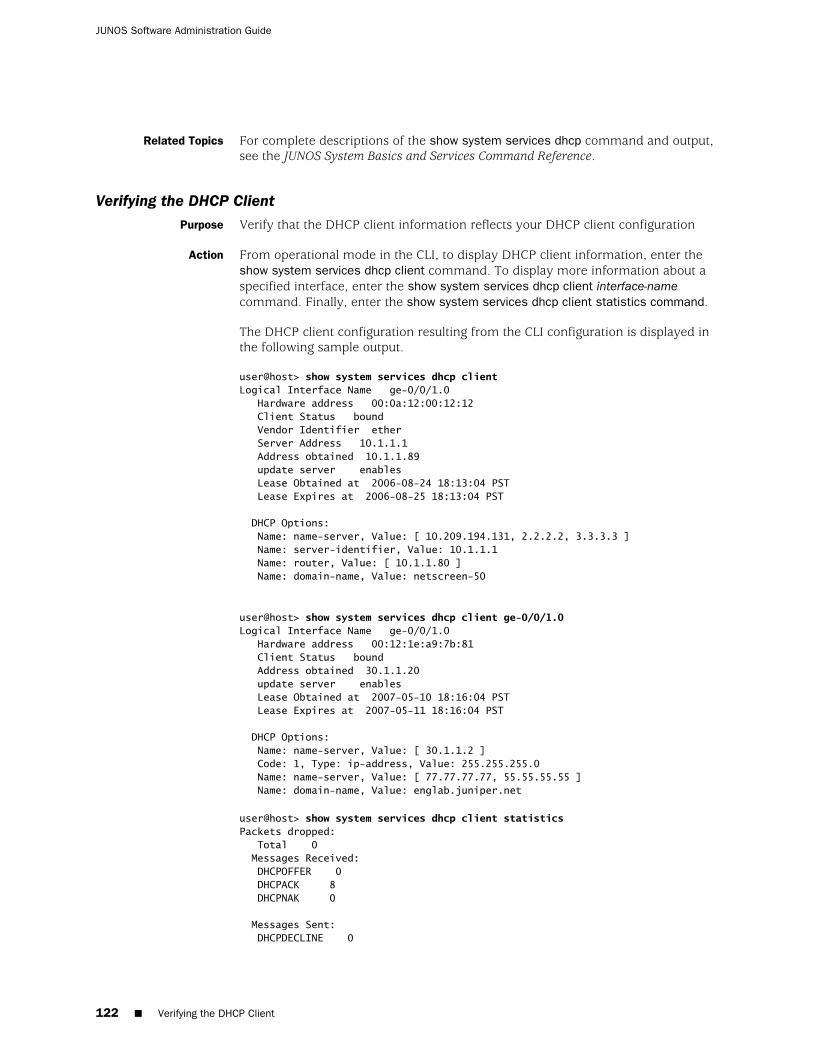
Related Topics For complete descriptions of the show system services dhcp command and output,see the JUNOS System Basics and Services Command Reference.
Verifying the DHCP ClientPurpose Verify that the DHCP client information reflects your DHCP client configuration
Action From operational mode in the CLI, to display DHCP client information, enter theshow system services dhcp client command. To display more information about aspecified interface, enter the show system services dhcp client interface-namecommand. Finally, enter the show system services dhcp client statistics command.
The DHCP client configuration resulting from the CLI configuration is displayed inthe following sample output.
user@host> show system services dhcp clientLogical Interface Name ge-0/0/1.0 Hardware address 00:0a:12:00:12:12 Client Status bound Vendor Identifier ether Server Address 10.1.1.1 Address obtained 10.1.1.89 update server enables Lease Obtained at 2006-08-24 18:13:04 PST Lease Expires at 2006-08-25 18:13:04 PST
DHCP Options: Name: name-server, Value: [ 10.209.194.131, 2.2.2.2, 3.3.3.3 ] Name: server-identifier, Value: 10.1.1.1 Name: router, Value: [ 10.1.1.80 ] Name: domain-name, Value: netscreen-50
user@host> show system services dhcp client ge-0/0/1.0Logical Interface Name ge-0/0/1.0 Hardware address 00:12:1e:a9:7b:81 Client Status bound Address obtained 30.1.1.20 update server enables Lease Obtained at 2007-05-10 18:16:04 PST Lease Expires at 2007-05-11 18:16:04 PST
DHCP Options: Name: name-server, Value: [ 30.1.1.2 ] Code: 1, Type: ip-address, Value: 255.255.255.0 Name: name-server, Value: [ 77.77.77.77, 55.55.55.55 ] Name: domain-name, Value: englab.juniper.net
user@host> show system services dhcp client statisticsPackets dropped: Total 0 Messages Received: DHCPOFFER 0 DHCPACK 8 DHCPNAK 0
Messages Sent: DHCPDECLINE 0
122 ■ Verifying the DHCP Client
JUNOS Software Administration Guide
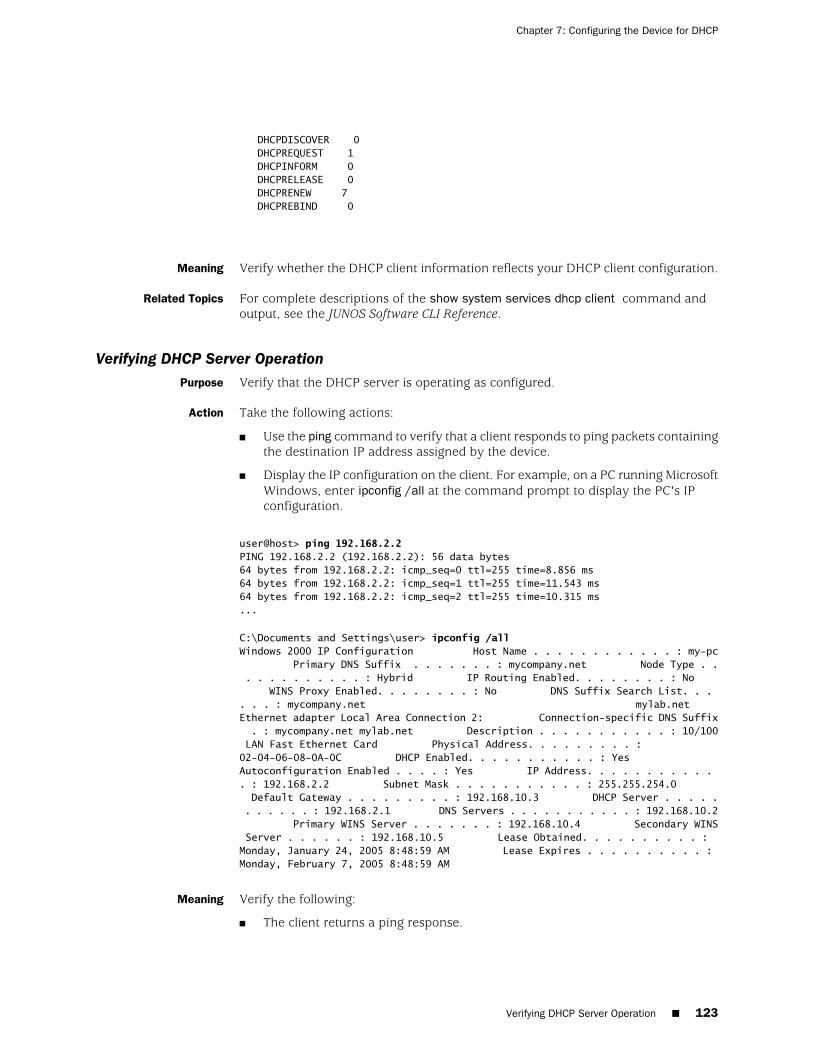
DHCPDISCOVER 0 DHCPREQUEST 1 DHCPINFORM 0 DHCPRELEASE 0 DHCPRENEW 7 DHCPREBIND 0
Meaning Verify whether the DHCP client information reflects your DHCP client configuration.
Related Topics For complete descriptions of the show system services dhcp client command andoutput, see the JUNOS Software CLI Reference.
Verifying DHCP Server OperationPurpose Verify that the DHCP server is operating as configured.
Action Take the following actions:
■ Use the ping command to verify that a client responds to ping packets containingthe destination IP address assigned by the device.
■ Display the IP configuration on the client. For example, on a PC running MicrosoftWindows, enter ipconfig /all at the command prompt to display the PC's IPconfiguration.
user@host> ping 192.168.2.2PING 192.168.2.2 (192.168.2.2): 56 data bytes64 bytes from 192.168.2.2: icmp_seq=0 ttl=255 time=8.856 ms64 bytes from 192.168.2.2: icmp_seq=1 ttl=255 time=11.543 ms64 bytes from 192.168.2.2: icmp_seq=2 ttl=255 time=10.315 ms...
C:\Documents and Settings\user> ipconfig /allWindows 2000 IP Configuration Host Name . . . . . . . . . . . . : my-pc Primary DNS Suffix . . . . . . . : mycompany.net Node Type . . . . . . . . . . . . : Hybrid IP Routing Enabled. . . . . . . . : No WINS Proxy Enabled. . . . . . . . : No DNS Suffix Search List. . . . . . : mycompany.net mylab.net Ethernet adapter Local Area Connection 2: Connection-specific DNS Suffix . : mycompany.net mylab.net Description . . . . . . . . . . . : 10/100 LAN Fast Ethernet Card Physical Address. . . . . . . . . : 02-04-06-08-0A-0C DHCP Enabled. . . . . . . . . . . : Yes Autoconfiguration Enabled . . . . : Yes IP Address. . . . . . . . . . . . : 192.168.2.2 Subnet Mask . . . . . . . . . . . : 255.255.254.0 Default Gateway . . . . . . . . . : 192.168.10.3 DHCP Server . . . . . . . . . . . : 192.168.2.1 DNS Servers . . . . . . . . . . . : 192.168.10.2 Primary WINS Server . . . . . . . : 192.168.10.4 Secondary WINS Server . . . . . . : 192.168.10.5 Lease Obtained. . . . . . . . . . : Monday, January 24, 2005 8:48:59 AM Lease Expires . . . . . . . . . . : Monday, February 7, 2005 8:48:59 AM
Meaning Verify the following:
■ The client returns a ping response.
Verifying DHCP Server Operation ■ 123
Chapter 7: Configuring the Device for DHCP
■ The client IP configuration displayed contains the configured values. For example,for the DHCP configuration in “Configuring the Device as a DHCPServer” on page 114, you can verify the following settings:
■ DNS Suffix Search List is correct.
■ IP address is within the IP address pool you configured.
■ DHCP Server is the primary IP address of the device interface on which theDHCP message exchange occurs. If you include the server-identifier statementin your configuration, the DHCP server IP address specified in this statementis displayed.
■ Lease Obtained and Lease Expires times are correct.
The ipconfig command also displays other DHCP client settings that can beconfigured on the device, including the client's hostname, default gateways, andWINS servers.
Related Topics For complete descriptions of the ping command and output, see the JUNOS SystemBasics and Services Command Reference.
Displaying DHCP Relay StatisticsPurpose Display DHCP Relay statistics to verify normal operation.
Action Enter the show system services dhcp relay-statistics command to display the DHCPrelay statistics.
user@host> show system services dhcp relay—statistics Received Packets: 4 Forwarded Packets 4 Dropped Packets 4 Due to missing interface in relay database: 4 Due to missing matching routing instance: 0 Due to an error during packet read: 0 Due to an error during packet send: 0 Due to invalid server address: 0 Due to missing valid local address: 0 Due to missing route to server/client: 0
Meaning Verify the following:
■ The default settings displayed are consistent with your DHCP server configuration.
■ The number of dropped packets and errors is small.
■ The reason for the packets being dropped.
Related Topics For complete descriptions of the show system services dhcp relay-statistics commandand output, see the JUNOS Software CLI Reference.
124 ■ Displaying DHCP Relay Statistics
JUNOS Software Administration Guide
Chapter 8
Configuring the Device as a DNS Proxy
JUNOS software with enhanced services incorporates Domain Name System (DNS)support, which allows you to use domain names as well as IP addresses for identifyinglocations. A DNS server keeps a table of the IP addresses associated with domainnames. Using DNS enables a device to reference locations by domain name (suchas www.juniper.net) in addition to using the routable IP address (207.17.137.68 forjuniper.net). DNS enhancements include:
■ DNS proxy—The device proxies hostname resolution requests on behalf of theclients behind the J-series or SRX-series device. DNS proxy improves domainlookup performance because of caching. For more information, see “DNS ProxyOverview” on page 126.
■ Split DNS—The device redirects DNS queries over a secure connection to aspecified DNS server in the private network. Split DNS prevents malicious usersfrom learning the network configuration, and thus also prevents domaininformation leaks. Once configured, split DNS operates transparently. For moreinformation, see “DNS Proxy with Split DNS” on page 126.
■ Dynamic DNS (DDNS) client—Servers protected by the device remain accessibledespite dynamic IP address changes. For example, a protected Web servercontinues to be accessible with the same hostname, even after the dynamic IPaddress changed because of address reassignment by the Dynamic HostConfiguration Protocol (DHCP) of an Internet service provider (ISP). For moreinformation, see “Dynamic Domain Name System Client” on page 128.
You can use J-Web Quick Configuration or a configuration editor to configure thedevice as a DNS proxy.
This chapter contains the following topics:
■ DNS Proxy Support On Different Device Types on page 126
■ DNS Proxy Overview on page 126
■ Configuring DNS Proxy with Quick Configuration on page 130
■ Configuring the Device as a DNS Proxy with the CLI on page 135
■ Verifying the DNS Server Configuration on page 137
■ 125
DNS Proxy Support On Different Device Types
The following table lists DNS proxy features, specifies whether the features aresupported on various device types, and indicates where you can find more informationabout each feature.
Table 76: Support Information: DNS Proxy
More Information
SRX-seriesServicesGateways
J-seriesServicesRoutersFeature
“DNS Proxy Cache” on page 128NoYesDomain Name System (DNS) proxy cache
“DNS Proxy with SplitDNS” on page 126
NoYesDNS proxy with split DNS
“Dynamic Domain Name SystemClient” on page 128
YesYesDynamic DNS (DDNS)
DNS Proxy Overview
DNS proxy allows clients to use the device as a DNS proxy server. DNS proxyimproves domain lookup performance by caching previous lookups. A typical DNSproxy processes DNS queries by issuing a new DNS resolution query to each nameserver that it has detected until the hostname is resolved.
This section contains the following topics:
■ DNS Proxy with Split DNS on page 126
■ DNS Proxy Cache on page 128
■ Dynamic Domain Name System Client on page 128
DNS Proxy with Split DNS
The split DNS proxy feature allows you to configure a set of name servers andassociate them to a given domain name. When you query that domain name, thedevice sends the DNS queries to only those name servers that are configured for thatdomain name to ensure localization of DNS queries.
You can configure the transport method used to resolve a given domain name—forexample, when the device connects to the corporate network through an IPSec VPNor any other secure tunnel. When you configure a secure VPN tunnel to transportthe domain names belonging to the corporate network, the DNS resolution queriesare not leaked to the ISP DNS server and are contained within the corporate network.
You can also configure a set of default name servers that the device can use to resolvedomain names that have no configured name servers associated with them.
Each DNS proxy must be associated with an interface. If an interface has no DNSproxy configuration, all the DNS queries received on that interface are dropped.
126 ■ DNS Proxy Support On Different Device Types
JUNOS Software Administration Guide
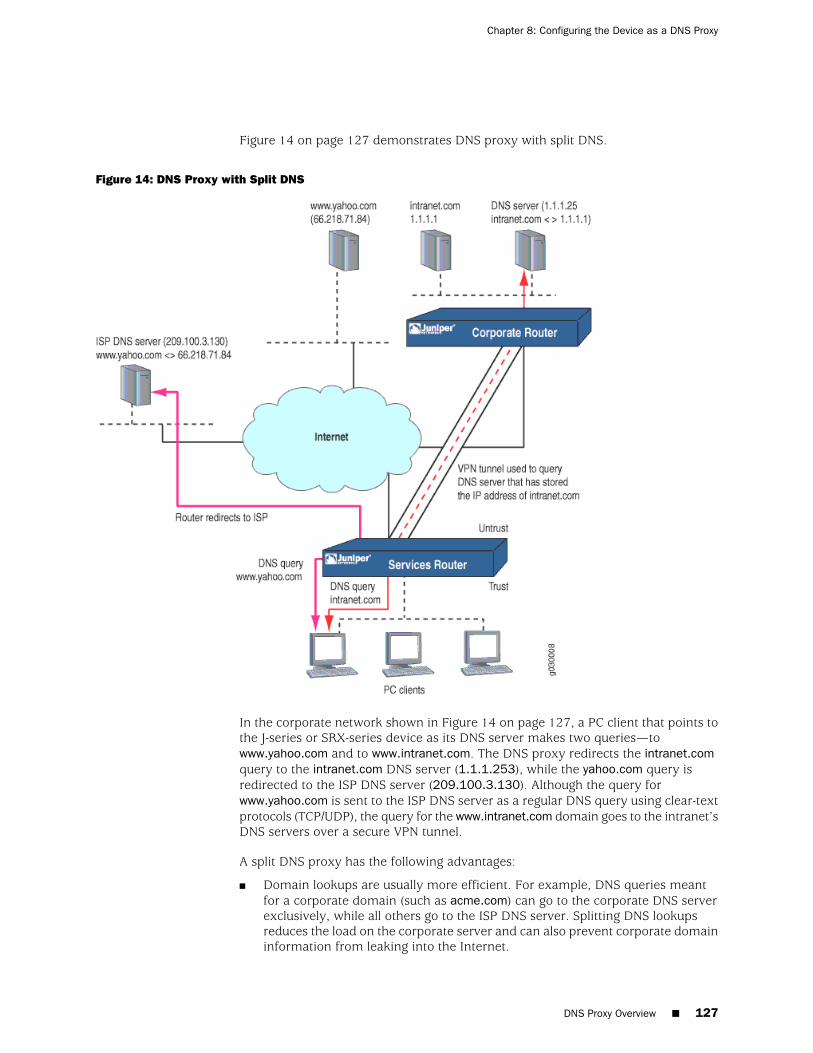
Figure 14 on page 127 demonstrates DNS proxy with split DNS.
Figure 14: DNS Proxy with Split DNS
In the corporate network shown in Figure 14 on page 127, a PC client that points tothe J-series or SRX-series device as its DNS server makes two queries—towww.yahoo.com and to www.intranet.com. The DNS proxy redirects the intranet.comquery to the intranet.com DNS server (1.1.1.253), while the yahoo.com query isredirected to the ISP DNS server (209.100.3.130). Although the query forwww.yahoo.com is sent to the ISP DNS server as a regular DNS query using clear-textprotocols (TCP/UDP), the query for the www.intranet.com domain goes to the intranet’sDNS servers over a secure VPN tunnel.
A split DNS proxy has the following advantages:
■ Domain lookups are usually more efficient. For example, DNS queries meantfor a corporate domain (such as acme.com) can go to the corporate DNS serverexclusively, while all others go to the ISP DNS server. Splitting DNS lookupsreduces the load on the corporate server and can also prevent corporate domaininformation from leaking into the Internet.
DNS Proxy Overview ■ 127
Chapter 8: Configuring the Device as a DNS Proxy
■ DNS proxy allows you to transmit selected DNS queries through a tunnel interface,which prevents malicious users from learning about the internal configurationof a network. For example, DNS queries bound for the corporate server can passthrough a tunnel interface to use security features such as authentication,encryption, and antireplay.
DNS Proxy Cache
When a DNS query is resolved by DNS proxy, the result is stored in the device's DNScache. This stored cache helps the device to resolve subsequent queries from thesame domain and avoid network latency delay.
NOTE: If the proxy cache is not available, the device sends the query to the configuredDNS server, which results in network latency delays.
DNS proxy maintains a cache entry for each resolved DNS query. These entries havea time-to-live (TTL) timer so the device purges each entry from the cache as it reachesits TTL and expires. When you delete a domain name from the DNS proxyconfiguration, the device deletes all the entries associated with that domain name.
You can also clear the DNS cache manually with the following CLI command:
user@host> clear system services dns-proxy cache
Dynamic Domain Name System Client
Dynamic DNS (DDNS) allows clients to dynamically update IP addresses for registereddomain names. This feature is useful when an ISP uses Point-to-Point (PPP), DynamicHost Configuration Protocol (DHCP), or external authentication (XAuth) to dynamicallychange the IP address for a customer premises equipment (CPE) router (such as asecurity device) that protects a Web server. Internet clients can reach the Web serverby using a domain name even if the IP address of the security device has previouslychanged dynamically.
A DDNS server maintains a list of the dynamically changed addresses and theirassociated domain names. The device updates these DDNS servers with thisinformation periodically or in response to IP address changes. The JUNOS softwarewith enhanced services DDNS client supports popular DDNS servers such as dyndns.organd ddo.jp. See Figure 15 on page 129.
128 ■ DNS Proxy Overview
JUNOS Software Administration Guide
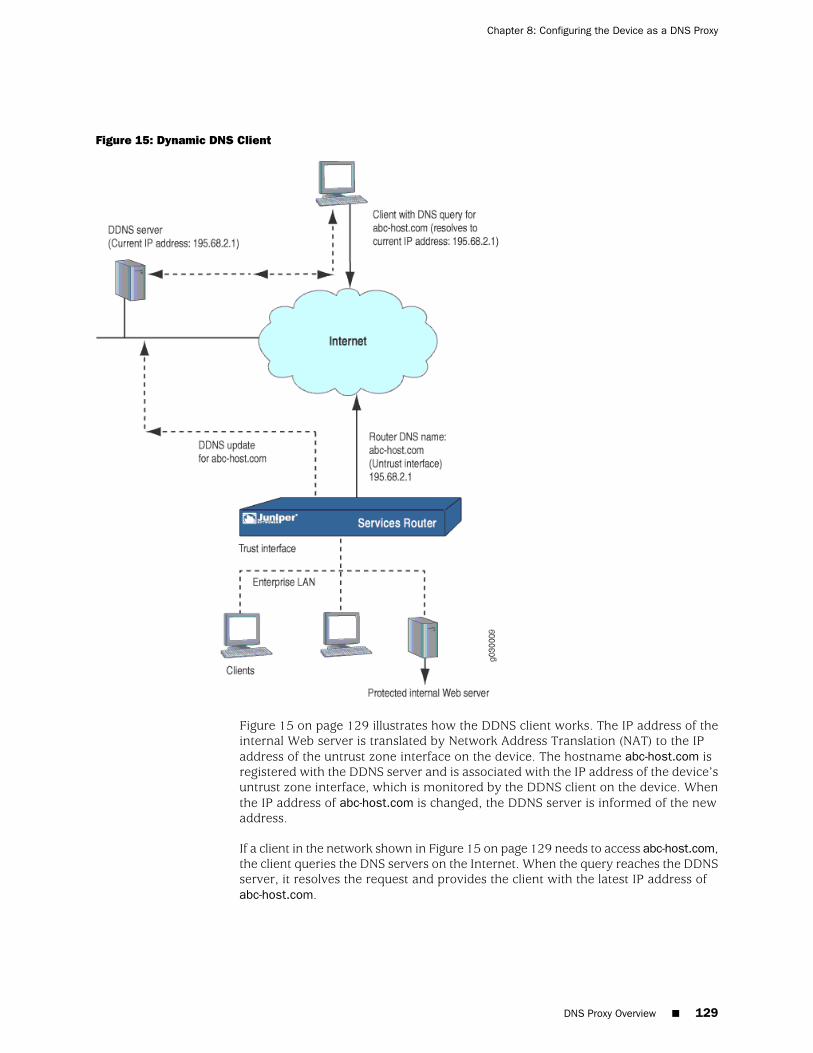
Figure 15: Dynamic DNS Client
Figure 15 on page 129 illustrates how the DDNS client works. The IP address of theinternal Web server is translated by Network Address Translation (NAT) to the IPaddress of the untrust zone interface on the device. The hostname abc-host.com isregistered with the DDNS server and is associated with the IP address of the device’suntrust zone interface, which is monitored by the DDNS client on the device. Whenthe IP address of abc-host.com is changed, the DDNS server is informed of the newaddress.
If a client in the network shown in Figure 15 on page 129 needs to access abc-host.com,the client queries the DNS servers on the Internet. When the query reaches the DDNSserver, it resolves the request and provides the client with the latest IP address ofabc-host.com.
DNS Proxy Overview ■ 129
Chapter 8: Configuring the Device as a DNS Proxy
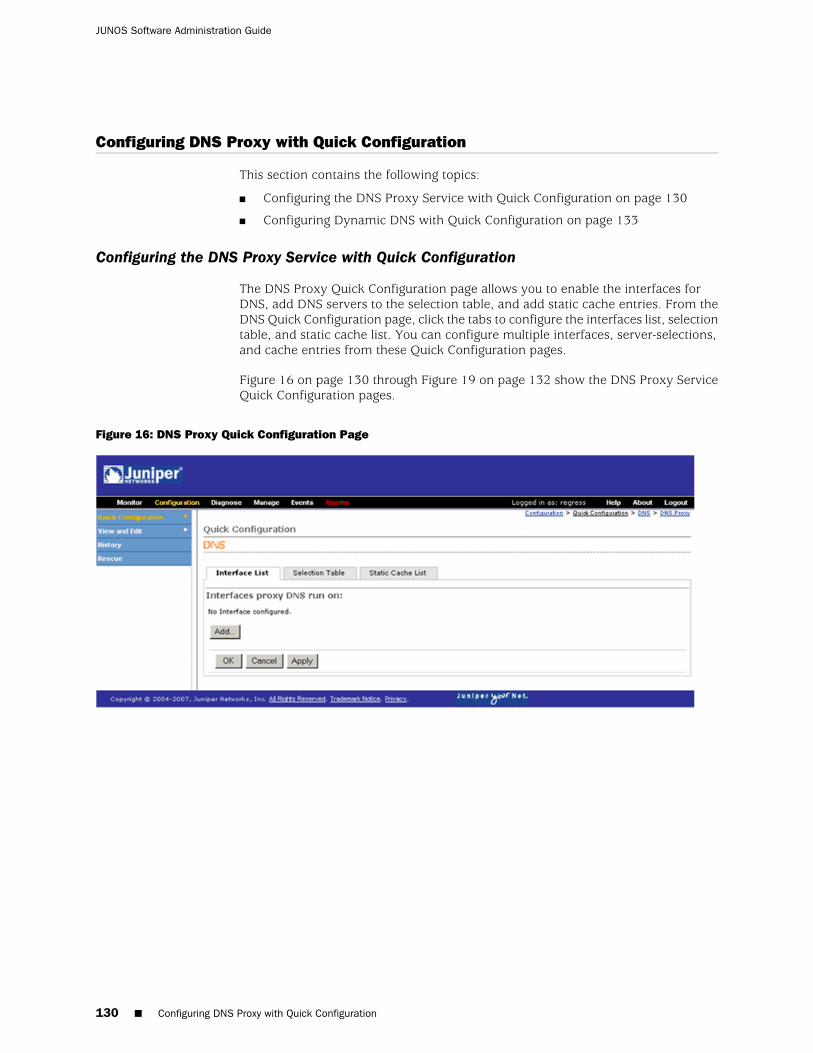
Configuring DNS Proxy with Quick Configuration
This section contains the following topics:
■ Configuring the DNS Proxy Service with Quick Configuration on page 130
■ Configuring Dynamic DNS with Quick Configuration on page 133
Configuring the DNS Proxy Service with Quick Configuration
The DNS Proxy Quick Configuration page allows you to enable the interfaces forDNS, add DNS servers to the selection table, and add static cache entries. From theDNS Quick Configuration page, click the tabs to configure the interfaces list, selectiontable, and static cache list. You can configure multiple interfaces, server-selections,and cache entries from these Quick Configuration pages.
Figure 16 on page 130 through Figure 19 on page 132 show the DNS Proxy ServiceQuick Configuration pages.
Figure 16: DNS Proxy Quick Configuration Page
130 ■ Configuring DNS Proxy with Quick Configuration
JUNOS Software Administration Guide
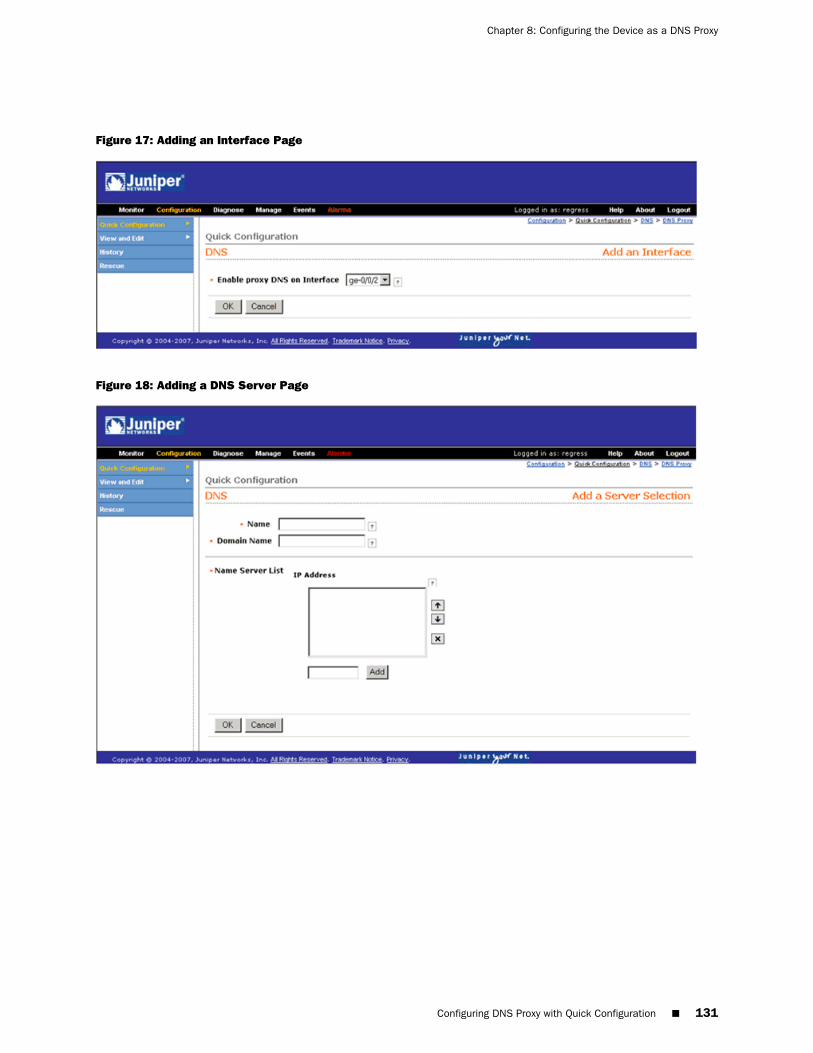
Figure 17: Adding an Interface Page
Figure 18: Adding a DNS Server Page
Configuring DNS Proxy with Quick Configuration ■ 131
Chapter 8: Configuring the Device as a DNS Proxy
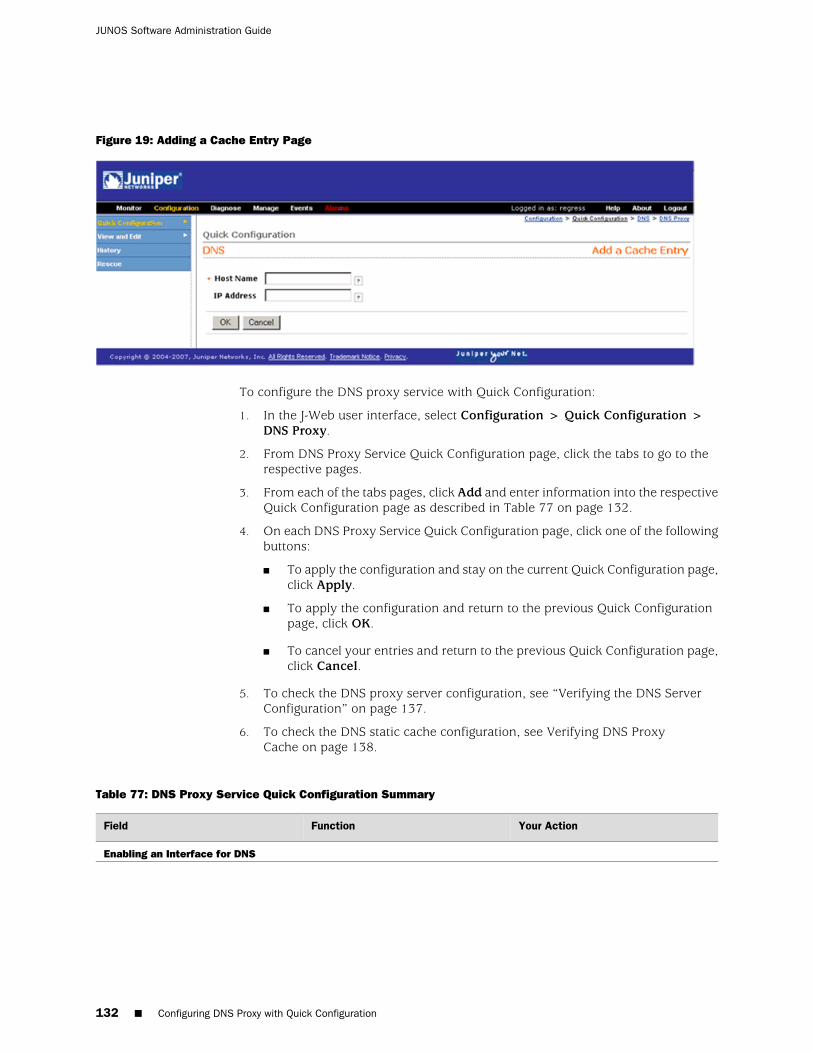
Figure 19: Adding a Cache Entry Page
To configure the DNS proxy service with Quick Configuration:
1. In the J-Web user interface, select Configuration > Quick Configuration >DNS Proxy.
2. From DNS Proxy Service Quick Configuration page, click the tabs to go to therespective pages.
3. From each of the tabs pages, click Add and enter information into the respectiveQuick Configuration page as described in Table 77 on page 132.
4. On each DNS Proxy Service Quick Configuration page, click one of the followingbuttons:
■ To apply the configuration and stay on the current Quick Configuration page,click Apply.
■ To apply the configuration and return to the previous Quick Configurationpage, click OK.
■ To cancel your entries and return to the previous Quick Configuration page,click Cancel.
5. To check the DNS proxy server configuration, see “Verifying the DNS ServerConfiguration” on page 137.
6. To check the DNS static cache configuration, see Verifying DNS ProxyCache on page 138.
Table 77: DNS Proxy Service Quick Configuration Summary
Your ActionFunctionField
Enabling an Interface for DNS
132 ■ Configuring DNS Proxy with Quick Configuration
JUNOS Software Administration Guide
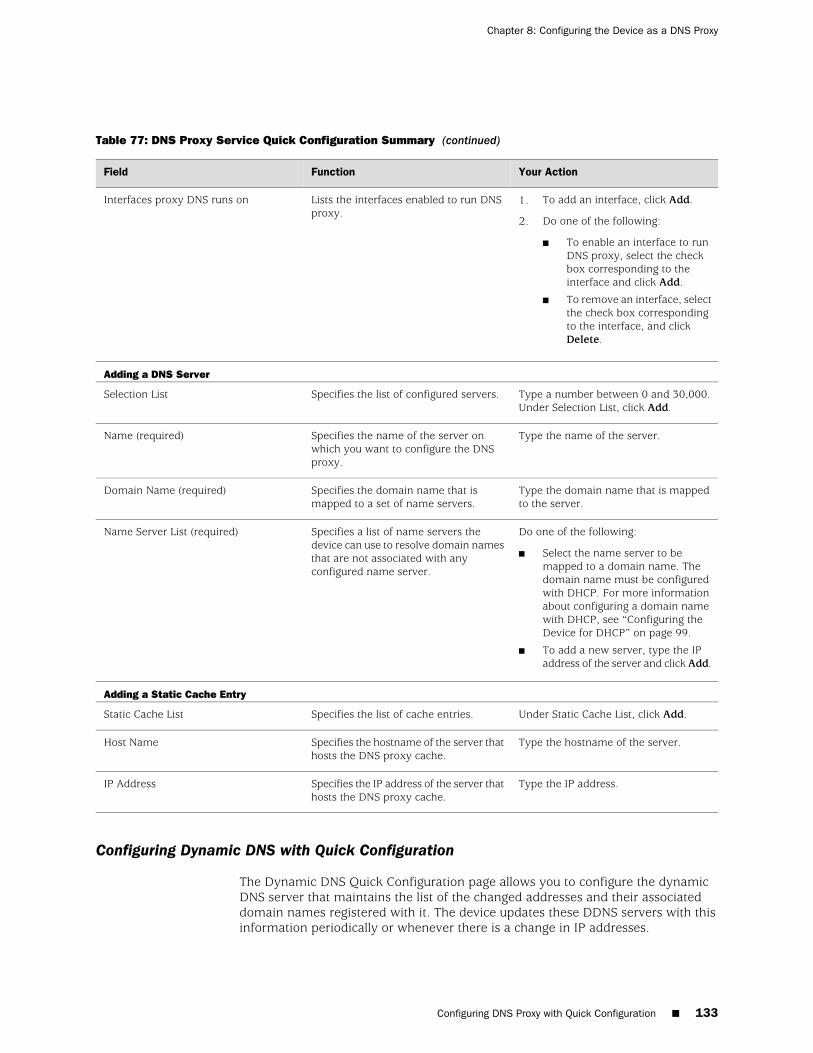
Table 77: DNS Proxy Service Quick Configuration Summary (continued)
Your ActionFunctionField
1. To add an interface, click Add.
2. Do one of the following:
■ To enable an interface to runDNS proxy, select the checkbox corresponding to theinterface and click Add.
■ To remove an interface, selectthe check box correspondingto the interface, and clickDelete.
Lists the interfaces enabled to run DNSproxy.
Interfaces proxy DNS runs on
Adding a DNS Server
Type a number between 0 and 30,000.Under Selection List, click Add.
Specifies the list of configured servers.Selection List
Type the name of the server.Specifies the name of the server onwhich you want to configure the DNSproxy.
Name (required)
Type the domain name that is mappedto the server.
Specifies the domain name that ismapped to a set of name servers.
Domain Name (required)
Do one of the following:
■ Select the name server to bemapped to a domain name. Thedomain name must be configuredwith DHCP. For more informationabout configuring a domain namewith DHCP, see “Configuring theDevice for DHCP” on page 99.
■ To add a new server, type the IPaddress of the server and click Add.
Specifies a list of name servers thedevice can use to resolve domain namesthat are not associated with anyconfigured name server.
Name Server List (required)
Adding a Static Cache Entry
Under Static Cache List, click Add.Specifies the list of cache entries.Static Cache List
Type the hostname of the server.Specifies the hostname of the server thathosts the DNS proxy cache.
Host Name
Type the IP address.Specifies the IP address of the server thathosts the DNS proxy cache.
IP Address
Configuring Dynamic DNS with Quick Configuration
The Dynamic DNS Quick Configuration page allows you to configure the dynamicDNS server that maintains the list of the changed addresses and their associateddomain names registered with it. The device updates these DDNS servers with thisinformation periodically or whenever there is a change in IP addresses.
Configuring DNS Proxy with Quick Configuration ■ 133
Chapter 8: Configuring the Device as a DNS Proxy
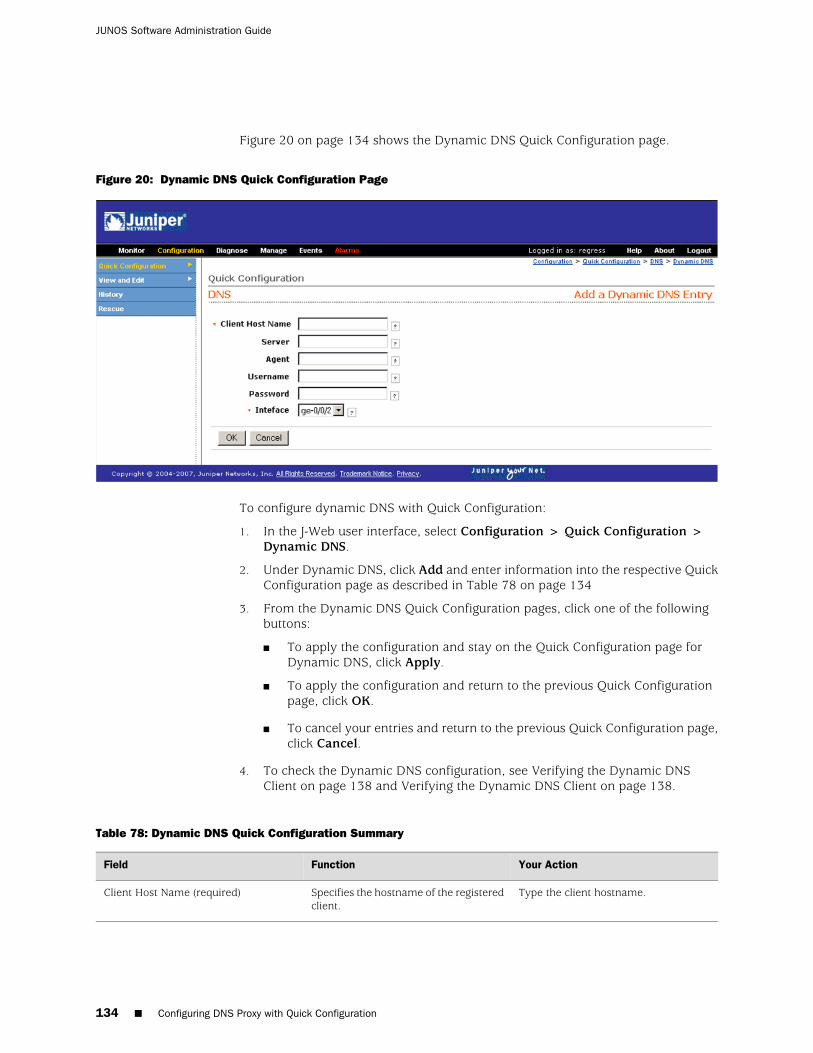
Figure 20 on page 134 shows the Dynamic DNS Quick Configuration page.
Figure 20: Dynamic DNS Quick Configuration Page
To configure dynamic DNS with Quick Configuration:
1. In the J-Web user interface, select Configuration > Quick Configuration >Dynamic DNS.
2. Under Dynamic DNS, click Add and enter information into the respective QuickConfiguration page as described in Table 78 on page 134
3. From the Dynamic DNS Quick Configuration pages, click one of the followingbuttons:
■ To apply the configuration and stay on the Quick Configuration page forDynamic DNS, click Apply.
■ To apply the configuration and return to the previous Quick Configurationpage, click OK.
■ To cancel your entries and return to the previous Quick Configuration page,click Cancel.
4. To check the Dynamic DNS configuration, see Verifying the Dynamic DNSClient on page 138 and Verifying the Dynamic DNS Client on page 138.
Table 78: Dynamic DNS Quick Configuration Summary
Your ActionFunctionField
Type the client hostname.Specifies the hostname of the registeredclient.
Client Host Name (required)
134 ■ Configuring DNS Proxy with Quick Configuration
JUNOS Software Administration Guide
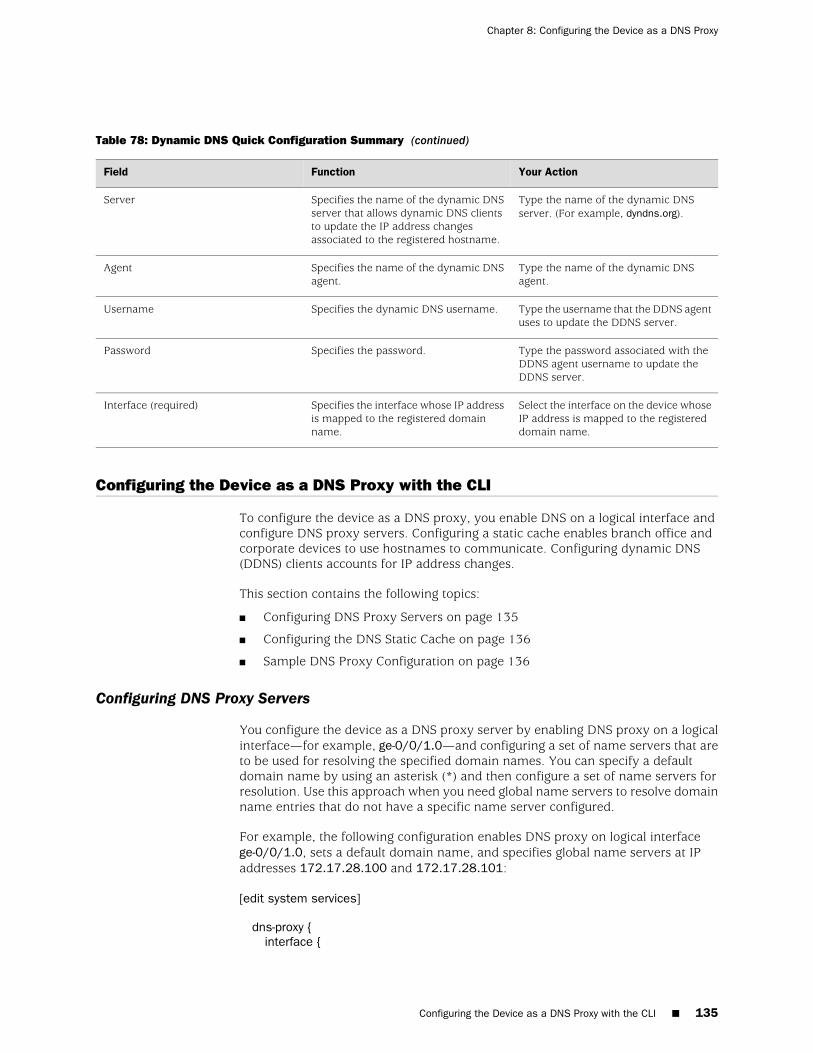
Table 78: Dynamic DNS Quick Configuration Summary (continued)
Your ActionFunctionField
Type the name of the dynamic DNSserver. (For example, dyndns.org).
Specifies the name of the dynamic DNSserver that allows dynamic DNS clientsto update the IP address changesassociated to the registered hostname.
Server
Type the name of the dynamic DNSagent.
Specifies the name of the dynamic DNSagent.
Agent
Type the username that the DDNS agentuses to update the DDNS server.
Specifies the dynamic DNS username.Username
Type the password associated with theDDNS agent username to update theDDNS server.
Specifies the password.Password
Select the interface on the device whoseIP address is mapped to the registereddomain name.
Specifies the interface whose IP addressis mapped to the registered domainname.
Interface (required)
Configuring the Device as a DNS Proxy with the CLI
To configure the device as a DNS proxy, you enable DNS on a logical interface andconfigure DNS proxy servers. Configuring a static cache enables branch office andcorporate devices to use hostnames to communicate. Configuring dynamic DNS(DDNS) clients accounts for IP address changes.
This section contains the following topics:
■ Configuring DNS Proxy Servers on page 135
■ Configuring the DNS Static Cache on page 136
■ Sample DNS Proxy Configuration on page 136
Configuring DNS Proxy Servers
You configure the device as a DNS proxy server by enabling DNS proxy on a logicalinterface—for example, ge-0/0/1.0—and configuring a set of name servers that areto be used for resolving the specified domain names. You can specify a defaultdomain name by using an asterisk (*) and then configure a set of name servers forresolution. Use this approach when you need global name servers to resolve domainname entries that do not have a specific name server configured.
For example, the following configuration enables DNS proxy on logical interfacege-0/0/1.0, sets a default domain name, and specifies global name servers at IPaddresses 172.17.28.100 and 172.17.28.101:
[edit system services]
dns-proxy {interface {
Configuring the Device as a DNS Proxy with the CLI ■ 135
Chapter 8: Configuring the Device as a DNS Proxy
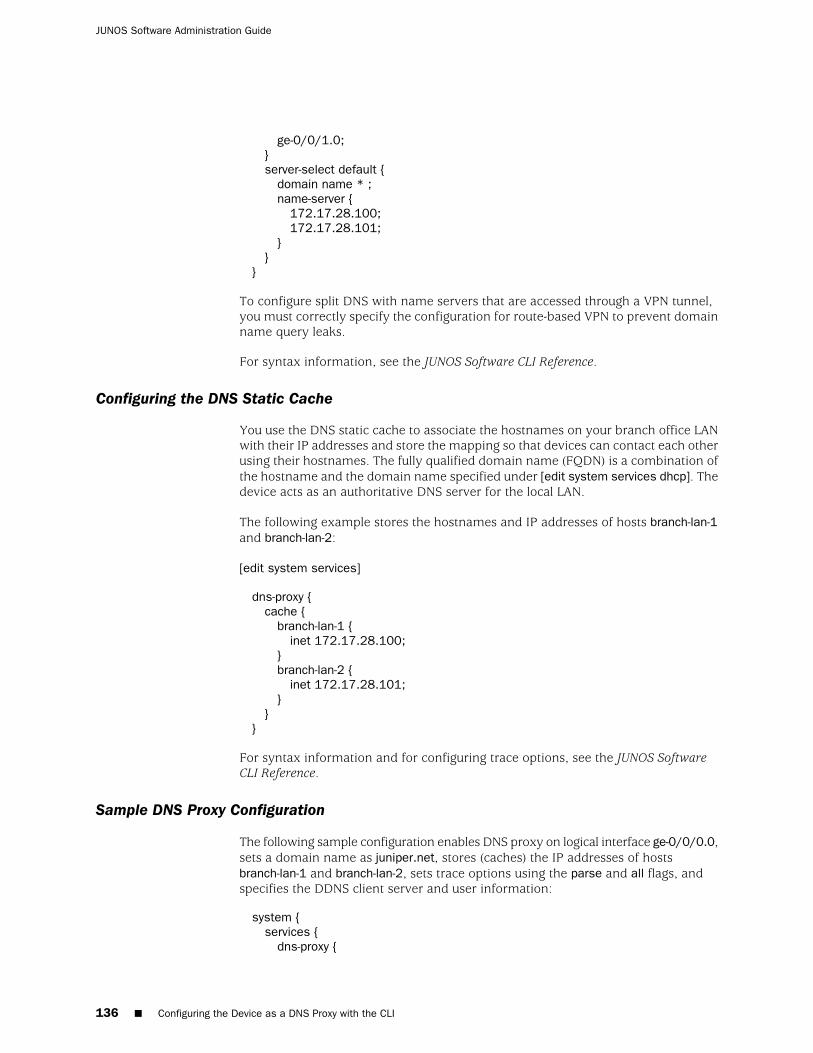
ge-0/0/1.0;}server-select default {
domain name * ;name-server {
172.17.28.100;172.17.28.101;
}}
}
To configure split DNS with name servers that are accessed through a VPN tunnel,you must correctly specify the configuration for route-based VPN to prevent domainname query leaks.
For syntax information, see the JUNOS Software CLI Reference.
Configuring the DNS Static Cache
You use the DNS static cache to associate the hostnames on your branch office LANwith their IP addresses and store the mapping so that devices can contact each otherusing their hostnames. The fully qualified domain name (FQDN) is a combination ofthe hostname and the domain name specified under [edit system services dhcp]. Thedevice acts as an authoritative DNS server for the local LAN.
The following example stores the hostnames and IP addresses of hosts branch-lan-1and branch-lan-2:
[edit system services]
dns-proxy {cache {
branch-lan-1 {inet 172.17.28.100;
}branch-lan-2 {
inet 172.17.28.101;}
}}
For syntax information and for configuring trace options, see the JUNOS SoftwareCLI Reference.
Sample DNS Proxy Configuration
The following sample configuration enables DNS proxy on logical interface ge-0/0/0.0,sets a domain name as juniper.net, stores (caches) the IP addresses of hostsbranch-lan-1 and branch-lan-2, sets trace options using the parse and all flags, andspecifies the DDNS client server and user information:
system {services {
dns-proxy {
136 ■ Configuring the Device as a DNS Proxy with the CLI
JUNOS Software Administration Guide
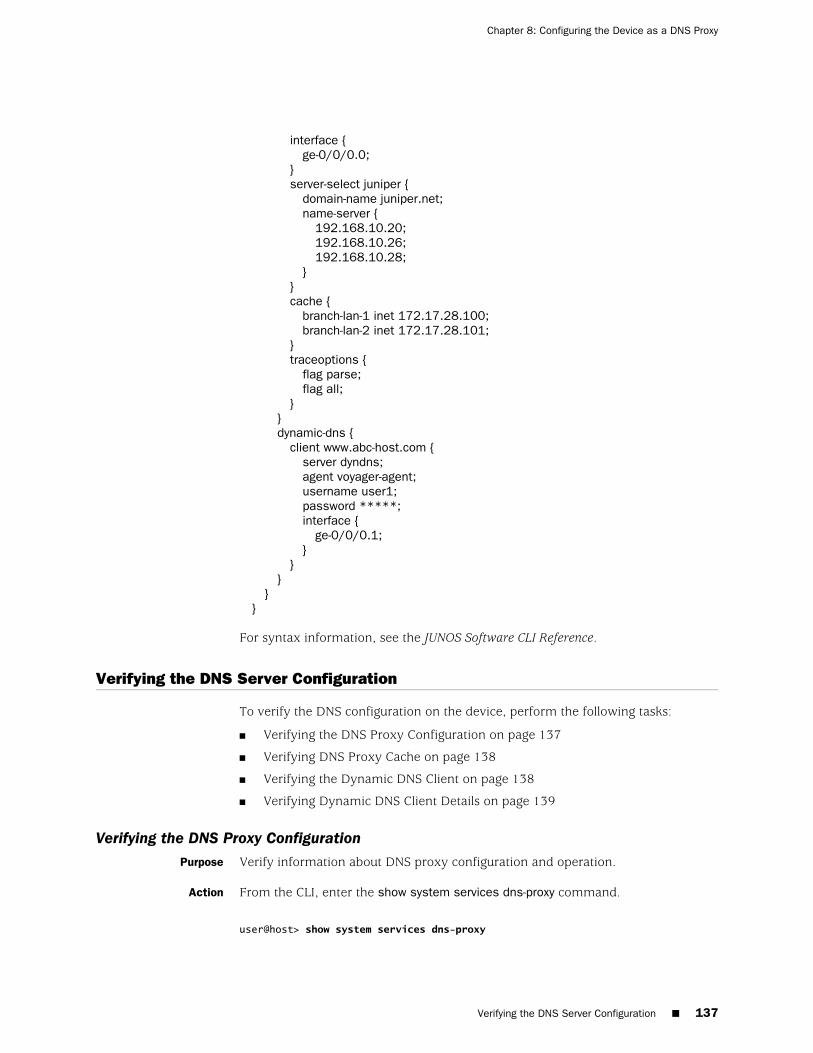
interface {ge-0/0/0.0;
}server-select juniper {
domain-name juniper.net;name-server {
192.168.10.20;192.168.10.26;192.168.10.28;
}}cache {
branch-lan-1 inet 172.17.28.100;branch-lan-2 inet 172.17.28.101;
}traceoptions {
flag parse;flag all;
}}dynamic-dns {
client www.abc-host.com {server dyndns;agent voyager-agent;username user1;password *****;interface {
ge-0/0/0.1;}
}}
}}
For syntax information, see the JUNOS Software CLI Reference.
Verifying the DNS Server Configuration
To verify the DNS configuration on the device, perform the following tasks:
■ Verifying the DNS Proxy Configuration on page 137
■ Verifying DNS Proxy Cache on page 138
■ Verifying the Dynamic DNS Client on page 138
■ Verifying Dynamic DNS Client Details on page 139
Verifying the DNS Proxy ConfigurationPurpose Verify information about DNS proxy configuration and operation.
Action From the CLI, enter the show system services dns-proxy command.
user@host> show system services dns-proxy
Verifying the DNS Server Configuration ■ 137
Chapter 8: Configuring the Device as a DNS Proxy
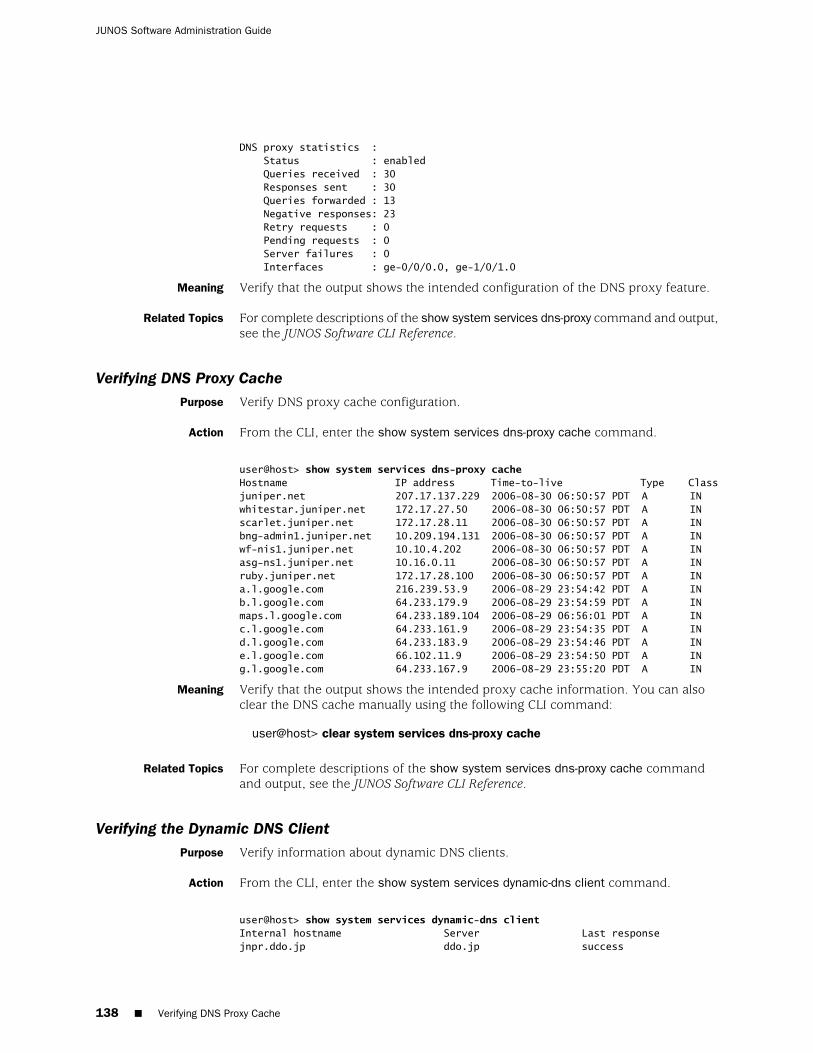
DNS proxy statistics : Status : enabled Queries received : 30 Responses sent : 30 Queries forwarded : 13 Negative responses: 23 Retry requests : 0 Pending requests : 0 Server failures : 0 Interfaces : ge-0/0/0.0, ge-1/0/1.0
Meaning Verify that the output shows the intended configuration of the DNS proxy feature.
Related Topics For complete descriptions of the show system services dns-proxy command and output,see the JUNOS Software CLI Reference.
Verifying DNS Proxy CachePurpose Verify DNS proxy cache configuration.
Action From the CLI, enter the show system services dns-proxy cache command.
user@host> show system services dns-proxy cacheHostname IP address Time-to-live Type Classjuniper.net 207.17.137.229 2006-08-30 06:50:57 PDT A INwhitestar.juniper.net 172.17.27.50 2006-08-30 06:50:57 PDT A INscarlet.juniper.net 172.17.28.11 2006-08-30 06:50:57 PDT A INbng-admin1.juniper.net 10.209.194.131 2006-08-30 06:50:57 PDT A INwf-nis1.juniper.net 10.10.4.202 2006-08-30 06:50:57 PDT A INasg-ns1.juniper.net 10.16.0.11 2006-08-30 06:50:57 PDT A INruby.juniper.net 172.17.28.100 2006-08-30 06:50:57 PDT A INa.l.google.com 216.239.53.9 2006-08-29 23:54:42 PDT A INb.l.google.com 64.233.179.9 2006-08-29 23:54:59 PDT A INmaps.l.google.com 64.233.189.104 2006-08-29 06:56:01 PDT A INc.l.google.com 64.233.161.9 2006-08-29 23:54:35 PDT A INd.l.google.com 64.233.183.9 2006-08-29 23:54:46 PDT A INe.l.google.com 66.102.11.9 2006-08-29 23:54:50 PDT A INg.l.google.com 64.233.167.9 2006-08-29 23:55:20 PDT A IN
Meaning Verify that the output shows the intended proxy cache information. You can alsoclear the DNS cache manually using the following CLI command:
user@host> clear system services dns-proxy cache
Related Topics For complete descriptions of the show system services dns-proxy cache commandand output, see the JUNOS Software CLI Reference.
Verifying the Dynamic DNS ClientPurpose Verify information about dynamic DNS clients.
Action From the CLI, enter the show system services dynamic-dns client command.
user@host> show system services dynamic-dns clientInternal hostname Server Last responsejnpr.ddo.jp ddo.jp success
138 ■ Verifying DNS Proxy Cache
JUNOS Software Administration Guide
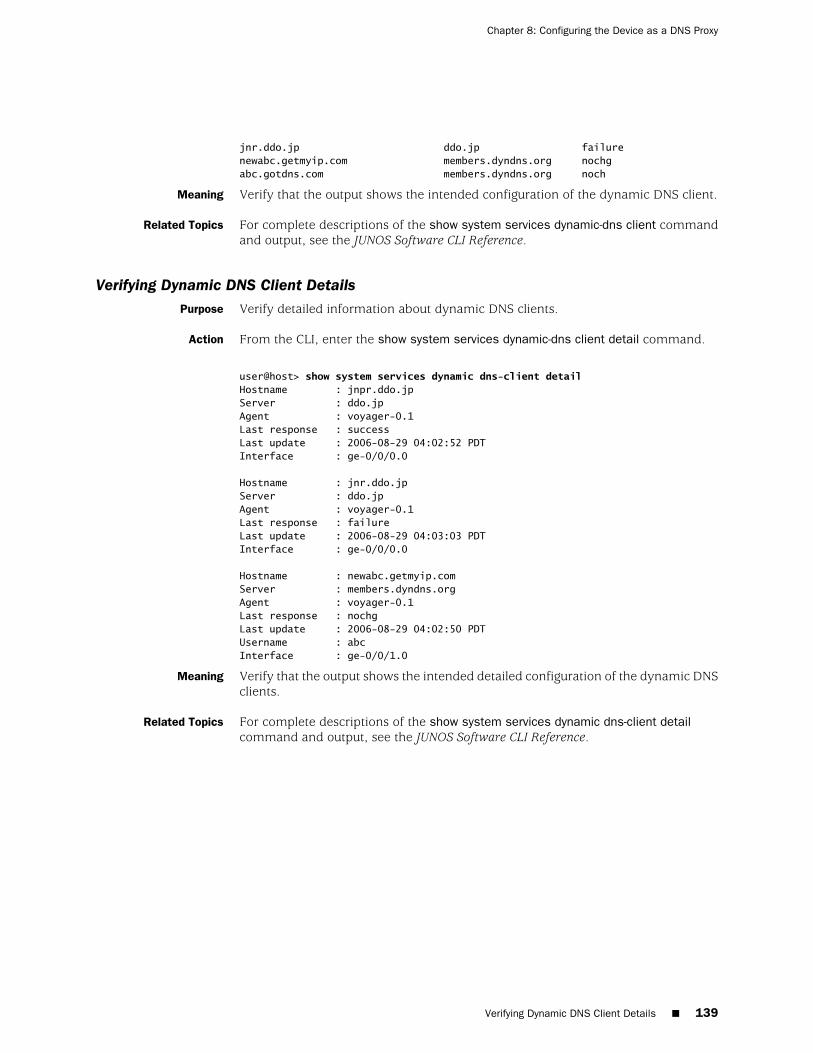
jnr.ddo.jp ddo.jp failurenewabc.getmyip.com members.dyndns.org nochgabc.gotdns.com members.dyndns.org noch
Meaning Verify that the output shows the intended configuration of the dynamic DNS client.
Related Topics For complete descriptions of the show system services dynamic-dns client commandand output, see the JUNOS Software CLI Reference.
Verifying Dynamic DNS Client DetailsPurpose Verify detailed information about dynamic DNS clients.
Action From the CLI, enter the show system services dynamic-dns client detail command.
user@host> show system services dynamic dns-client detailHostname : jnpr.ddo.jpServer : ddo.jpAgent : voyager-0.1Last response : successLast update : 2006-08-29 04:02:52 PDTInterface : ge-0/0/0.0
Hostname : jnr.ddo.jpServer : ddo.jpAgent : voyager-0.1Last response : failureLast update : 2006-08-29 04:03:03 PDTInterface : ge-0/0/0.0
Hostname : newabc.getmyip.comServer : members.dyndns.orgAgent : voyager-0.1Last response : nochgLast update : 2006-08-29 04:02:50 PDTUsername : abcInterface : ge-0/0/1.0
Meaning Verify that the output shows the intended detailed configuration of the dynamic DNSclients.
Related Topics For complete descriptions of the show system services dynamic dns-client detailcommand and output, see the JUNOS Software CLI Reference.
Verifying Dynamic DNS Client Details ■ 139
Chapter 8: Configuring the Device as a DNS Proxy

140 ■ Verifying Dynamic DNS Client Details
JUNOS Software Administration Guide
Chapter 9
Configuring Autoinstallation
If you are setting up many devices, autoinstallation can help automate theconfiguration process by loading configuration files onto new or existing devicesautomatically over the network. You can use either the J-Web configuration editoror CLI configuration editor to configure a device for autoinstallation. The J-Webinterface does not include Quick Configuration pages for autoinstallation.
This chapter contains the following topics:
■ Autoinstallation Support On Different Device Types on page 141
■ Autoinstallation Terms on page 141
■ Autoinstallation Overview on page 142
■ Before You Begin on page 144
■ Configuring Autoinstallation with a Configuration Editor on page 145
■ Verifying Autoinstallation on page 146
Autoinstallation Support On Different Device Types
The following table lists autoinstallation features, specifies whether the features aresupported on various device types, and indicates where you can find more informationabout each feature.
Table 79: Support Information: Autoinstallation
More Information
SRX-seriesServicesGateways
J-seriesServicesRoutersFeature
“AutoinstallationOverview” on page 142
NoYesAutoinstallation
Autoinstallation Terms
Before configuring autoinstallation, become familiar with the terms defined inTable 80 on page 142.
Autoinstallation Support On Different Device Types ■ 141
Table 80: Autoinstallation Terms
DefinitionTerm
Automatic configuration of a device over the network from a preexisting configurationfile that you create and store on a configuration server—typically a Trivial File TransferProtocol (TFTP) server. Autoinstallation takes place on a device that is powered onwithout a valid configuration (boot) file or is configured specifically for autoinstallation.Autoinstallation is useful for deploying multiple devices in a network.
autoinstallation
Configuration that takes place on a device unable to locate a configuration (boot) file.You can set up two default configuration files for autoinstallation on the device:network.conf to specify IP address-to-hostname mappings for devices on the network,or router.conf to provide just enough configuration for your subsequent Telnet access.
default configuration
Host-specific configuration file for autoinstallation on a device that contains all theconfiguration information necessary for the device. In the filename, hostname isreplaced with the hostname you are assigning to the device.
hostname.conf
Configuration that takes place on a device for which you have created a host-specificconfiguration file for autoinstallation called hostname.conf. The hostname.conf filecontains all the information necessary to configure the device. For the device to usehostname.conf, it must be able to determine its own hostname from the network.
host-specific configuration
Default configuration file for autoinstallation, in which you specify IP addresses andassociated hostnames for devices on the network.
network.conf
Default configuration file for autoinstallation with a minimum configuration sufficientfor you to telnet to the device and configure it manually.
router.conf
Autoinstallation Overview
Autoinstallation provides automatic configuration for a new device that you connectto the network and turn on, or for a device configured for autoinstallation. Theautoinstallation process begins anytime a device is powered on and cannot locate avalid configuration file in the compact flash. Typically, a configuration file isunavailable when a device is powered on for the first time, or if the configurationfile is deleted from the compact flash. The autoinstallation feature enables you todeploy multiple devices from a central location in the network.
For the autoinstallation process to work, you must store one or more host-specificor default configuration files on a configuration server in the network and have aservice available—typically Dynamic Host Configuration Protocol (DHCP)—to assignan IP address to the device.
Autoinstallation takes place automatically when you connect an Ethernet or serialport on a new J-series or SRX-series device to the network and power on the device.To simplify the process, you can explicitly enable autoinstallation on a device andspecify a configuration server, an autoinstallation interface, and a protocol for IPaddress acquisition.
This overview contains the following topics:
■ Supported Autoinstallation Interfaces and Protocols on page 143
■ Typical Autoinstallation Process on a New Device on page 143
142 ■ Autoinstallation Overview
JUNOS Software Administration Guide
Supported Autoinstallation Interfaces and Protocols
Before autoinstallation on a device can take place, the device must acquire an IPaddress. The protocol or protocols you choose for IP address acquisition determinethe device interface to connect to the network for autoinstallation. The device detectsthe connected interface and requests an IP address with a protocol appropriate forthe interface. Autoinstallation is supported over an Ethernet LAN interface or a serialLAN or WAN interface. Table 81 on page 143 lists the protocols that the device canuse on these interfaces for IP address acquisition.
Table 81: Interfaces and Protocols for IP Address Acqusition During Autoinstallation
Protocol for AutoinstallationInterface and Encapsulation Type
DHCP, BOOTP, or Reverse Address Resolution Protocol(RARP)
Ethernet LAN interface with High-level Data Link Control (HDLC)
Serial Line Address Resolution Protocol (SLARP)Serial WAN interface with HDLC
BOOTPSerial WAN interface with Frame Relay
If the server with the autoinstallation configuration file is not on the same LANsegment as the new device, or if a specific device is required by the network, youmust configure an intermediate device directly attached to the new device, throughwhich the new device can send Trivial File Transfer Protocol (TFTP), BOOTP, andDomain Name System (DNS) requests. In this case, you specify the IP address of theintermediate device as the location to receive TFTP requests for autoinstallation.
Typical Autoinstallation Process on a New Device
When a device is powered on for the first time, it performs the followingautoinstallation tasks:
1. The new device sends out DHCP, BOOTP, RARP, or SLARP requests on eachconnected interface simultaneously to obtain an IP address.
If a DHCP server responds, it provides the device with some or all of the followinginformation:
■ An IP address and subnet mask for the autoinstallation interface.
■ The location of the TFTP (typically), Hypertext Transfer Protocol (HTTP), orFTP server on which the configuration file is stored.
■ The name of the configuration file to be requested from the TFTP server.
■ The IP address or hostname of the TFTP server.
If the DHCP server provides only the hostname, a DNS server must beavailable on the network to resolve the name to an IP address.
■ The IP address of an intermediate device if the configuration server is on adifferent LAN segment from the new device.
Autoinstallation Overview ■ 143
Chapter 9: Configuring Autoinstallation
2. After the new device acquires an IP address, the autoinstallation process on thedevice attempts to download a configuration file in the following ways:
a. If the DHCP server specifies the host-specific configuration file (boot file)hostname.conf, the device uses that filename in the TFTP server request. (Inthe filename, hostname is the hostname of the new device.) Theautoinstallation process on the new device makes three unicast TFTP requestsfor hostname.conf. If these attempts fail, the device broadcasts three requeststo any available TFTP server for the file.
b. If the new device cannot locate hostname.conf, the autoinstallation processunicasts or broadcasts TFTP requests for a default device configuration filecalled network.conf, which contains hostname-to-IP address mappinginformation, to attempt to find its hostname.
c. If network.conf contains no hostname entry for the new device, theautoinstallation process sends out a DNS request and attempts to resolvethe new device's IP address to a hostname.
d. If the new device can determine its hostname, it sends a TFTP request forthe hostname.conf file.
e. If the new device is unable to map its IP address to a hostname, it sendsTFTP requests for the default configuration file router.conf.
3. After the new device locates a configuration file on a TFTP server, autoinstallationdownloads the file, installs the file on the device, and commits the configuration.
Before You Begin
To configure a network for device autoinstallation, complete the following tasks:
■ Configure a DHCP server on your network to meet your network requirements.
You can configure a device to operate as a DHCP server. For more information,see “Configuring the Device for DHCP” on page 99.
■ Create one of the following configuration files, and store it on a TFTP server inthe network:
■ A host-specific file with the name hostname.conf for each device undergoingautoinstallation. Replace hostname with the name of a device. Thehostname.conf file typically contains all the configuration informationnecessary for the device with this hostname.
■ A default configuration file named router.conf with the minimum configurationnecessary to enable you to telnet into the new device for furtherconfiguration.
■ Physically attach the device to the network using one or more of the followinginterface types:
■ Fast Ethernet
■ Gigabit Ethernet
■ Serial with HDLC encapsulation
144 ■ Before You Begin
JUNOS Software Administration Guide
■ If you configure the DHCP server to provide only the TFTP server hostname, addan IP address-to-hostname mapping entry for the TFTP server to the DNS databasefile on the DNS server in the network.
■ If the new device is not on the same network segment as the DHCP server (orother device providing IP address resolution), configure an existing device as anintermediate to receive TFTP and DNS requests and forward them to the TFTPserver and the DNS server. You must configure the LAN or serial interface onthe intermediate device with the IP addresses of the hosts providing TFTP andDNS service. Connect this interface to the new device.
■ If you are using hostname.conf files for autoinstallation of host-specificconfiguration files, you must also complete the following tasks:
■ Configure the DHCP server to provide a hostname.conf filename to each newdevice. Each device uses its hostname.conf filename to request a configurationfile from the TFTP server. Copy the necessary hostname.conf configurationfiles to the TFTP server.
■ Create a default configuration file named network.conf, and copy it to theTFTP server. This file contains IP address-to-hostname mapping entries. Ifthe DHCP server does not send a hostname.conf filename to a new device,the device uses network.conf to resolve its hostname based on its IP address.
Alternatively, you can add the IP address-to-hostname mapping entry forthe new device to a DNS database file.
The device uses the hostname to request a hostname.conf file from the TFTPserver.
Configuring Autoinstallation with a Configuration Editor
No configuration is required on a device on which you are performing autoinstallation,because it is an automated process. However, to simplify the process, you can specifyone or more interfaces, protocols, and configuration servers to be used forautoinstallation.
To configure autoinstallation:
1. Navigate to the top of the configuration hierarchy in either the J-Web or CLIconfiguration editor.
2. Perform the configuration tasks described in Table 82 on page 146.
3. If you are using the J-Web interface, click Commit to view a summary of yourchanges, then click OK to commit the configuration. If you are using the CLI,commit the configuration by entering the commit command.
4. To check the configuration, see “Verifying Autoinstallation” on page 146.
Configuring Autoinstallation with a Configuration Editor ■ 145
Chapter 9: Configuring Autoinstallation
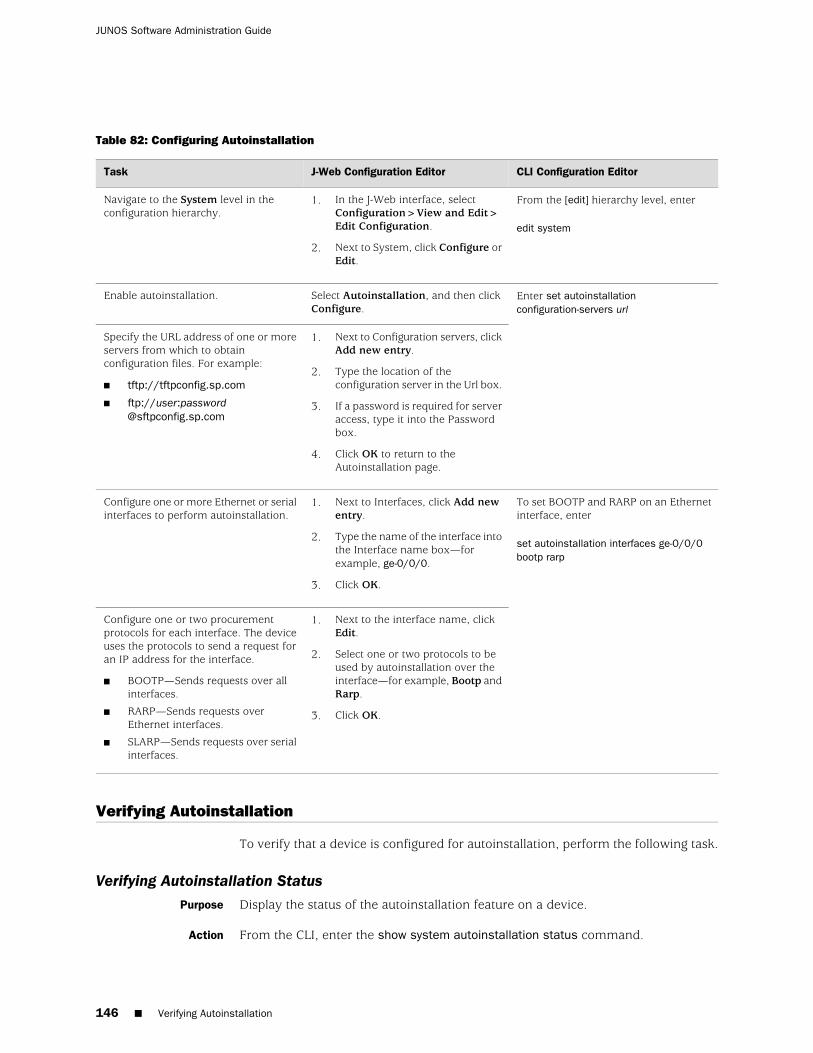
Table 82: Configuring Autoinstallation
CLI Configuration EditorJ-Web Configuration EditorTask
From the [edit] hierarchy level, enter
edit system
1. In the J-Web interface, selectConfiguration>View and Edit>Edit Configuration.
2. Next to System, click Configure orEdit.
Navigate to the System level in theconfiguration hierarchy.
Enter set autoinstallationconfiguration-servers url
Select Autoinstallation, and then clickConfigure.
Enable autoinstallation.
1. Next to Configuration servers, clickAdd new entry.
2. Type the location of theconfiguration server in the Url box.
3. If a password is required for serveraccess, type it into the Passwordbox.
4. Click OK to return to theAutoinstallation page.
Specify the URL address of one or moreservers from which to obtainconfiguration files. For example:
■ tftp://tftpconfig.sp.com
■ ftp://user:[email protected]
To set BOOTP and RARP on an Ethernetinterface, enter
set autoinstallation interfaces ge-0/0/0bootp rarp
1. Next to Interfaces, click Add newentry.
2. Type the name of the interface intothe Interface name box—forexample, ge-0/0/0.
3. Click OK.
Configure one or more Ethernet or serialinterfaces to perform autoinstallation.
1. Next to the interface name, clickEdit.
2. Select one or two protocols to beused by autoinstallation over theinterface—for example, Bootp andRarp.
3. Click OK.
Configure one or two procurementprotocols for each interface. The deviceuses the protocols to send a request foran IP address for the interface.
■ BOOTP—Sends requests over allinterfaces.
■ RARP—Sends requests overEthernet interfaces.
■ SLARP—Sends requests over serialinterfaces.
Verifying Autoinstallation
To verify that a device is configured for autoinstallation, perform the following task.
Verifying Autoinstallation StatusPurpose Display the status of the autoinstallation feature on a device.
Action From the CLI, enter the show system autoinstallation status command.
146 ■ Verifying Autoinstallation
JUNOS Software Administration Guide

user@host> show system autoinstallation statusAutoinstallation status:Master state: ActiveLast committed file: NoneConfiguration server of last committed file: 10.25.100.1Interface: Name: ge-0/0/0 State: Configuration Acquisition Acquired: Address: 192.168.124.75 Hostname: host-ge-000 Hostname source: DNS Configuration filename: router-ge-000.conf Configuration filename server: 10.25.100.3 Address acquisition: Protocol: DHCP Client Acquired address: None Protocol: RARP Client Acquired address: NoneInterface: Name: ge-0/0/1 State: None Address acquisition: Protocol: DHCP Client Acquired address: None Protocol: RARP Client Acquired address: None
Meaning The output shows the settings configured for autoinstallation. Verify that the valuesdisplayed are correct for the device when it is deployed on the network.
Verifying Autoinstallation Status ■ 147
Chapter 9: Configuring Autoinstallation

148 ■ Verifying Autoinstallation Status
JUNOS Software Administration Guide
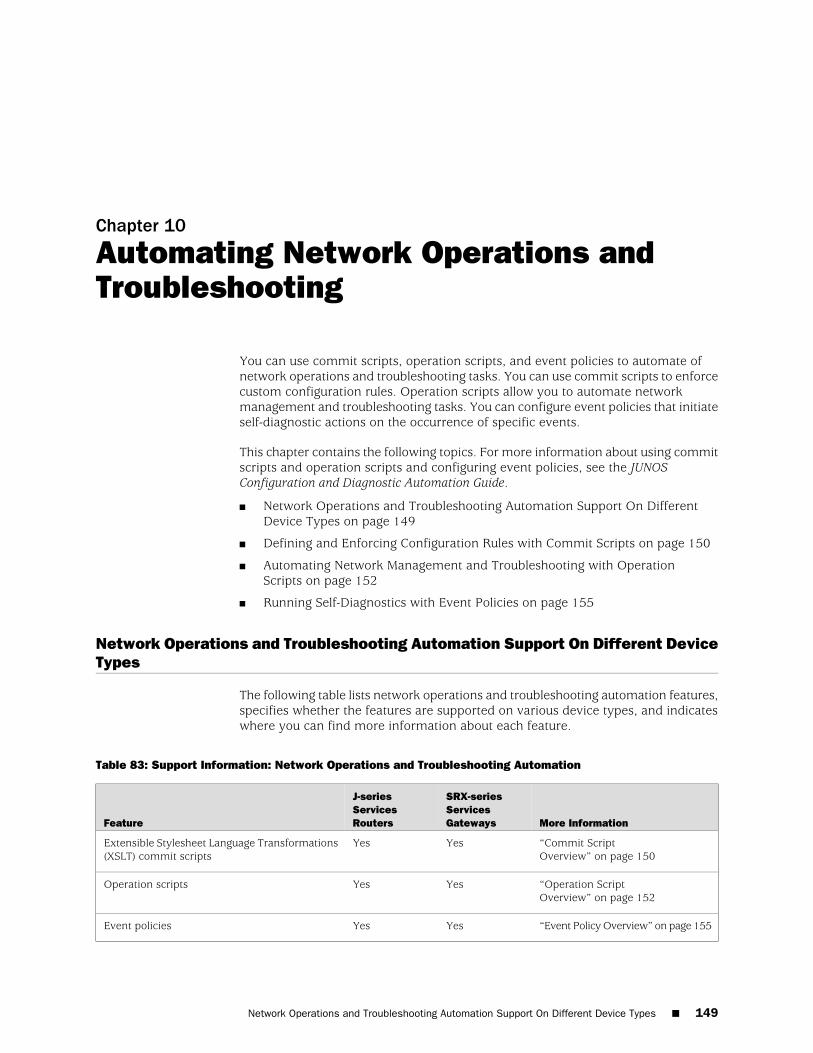
Chapter 10
Automating Network Operations andTroubleshooting
You can use commit scripts, operation scripts, and event policies to automate ofnetwork operations and troubleshooting tasks. You can use commit scripts to enforcecustom configuration rules. Operation scripts allow you to automate networkmanagement and troubleshooting tasks. You can configure event policies that initiateself-diagnostic actions on the occurrence of specific events.
This chapter contains the following topics. For more information about using commitscripts and operation scripts and configuring event policies, see the JUNOSConfiguration and Diagnostic Automation Guide.
■ Network Operations and Troubleshooting Automation Support On DifferentDevice Types on page 149
■ Defining and Enforcing Configuration Rules with Commit Scripts on page 150
■ Automating Network Management and Troubleshooting with OperationScripts on page 152
■ Running Self-Diagnostics with Event Policies on page 155
Network Operations and Troubleshooting Automation Support On Different DeviceTypes
The following table lists network operations and troubleshooting automation features,specifies whether the features are supported on various device types, and indicateswhere you can find more information about each feature.
Table 83: Support Information: Network Operations and Troubleshooting Automation
More Information
SRX-seriesServicesGateways
J-seriesServicesRoutersFeature
“Commit ScriptOverview” on page 150
YesYesExtensible Stylesheet Language Transformations(XSLT) commit scripts
“Operation ScriptOverview” on page 152
YesYesOperation scripts
“Event Policy Overview” on page 155YesYesEvent policies
Network Operations and Troubleshooting Automation Support On Different Device Types ■ 149
Defining and Enforcing Configuration Rules with Commit Scripts
Being able to restrict network configurations in accordance with custom configurationrules can reduce human error and improve network uptime and reliability. Commitscripts allow you to enforce custom configuration rules.
This section contains the following topics:
■ Commit Script Overview on page 150
■ Enabling Commit Scripts on page 151
■ Disabling Commit Scripts on page 151
Commit Script Overview
Commit scripts run each time a new candidate configuration is committed and inspectthe configuration. If a candidate configuration does not adhere to your design rules,a commit script can instruct the Services Router to perform various actions, includingthe following:
■ Generate custom warning messages, system log messages, or error messages.
If error messages are generated, the commit operation fails and the candidateconfiguration remains unchanged.
■ Change the configuration in accordance with your rules and then proceed withthe commit operation.
Consider the following examples of actions you can perform with commit scripts:
■ Run a basic sanity test. Ensure that the [edit interfaces] and [edit protocols]hierarchies have not been accidentally deleted.
■ Check configuration consistency. Ensure that every T1 interface configured atthe [edit interfaces] hierarchy level is also configured at the [edit protocols rip]hierarchy level.
■ Enforce network design rules. For example, suppose your network design requiresevery interface on which the International Organization for Standardization (ISO)family of protocols is enabled to also have Multiprotocol Label Switching (MPLS)enabled. At commit time, a commit script inspects the configuration and issuesan error if this requirement is not met. This error causes the commit operationto fail and forces the user to update the configuration to comply.
Instead of an error, the commit script can issue a warning about the configurationproblem and then automatically correct it, by changing the configuration toenable MPLS on all interfaces. A system log message can also be generatedindicating that corrective action was taken.
The scripting language you use for writing commit scripts is Extensible StylesheetLanguage Transformations (XSLT). XSLT commit scripts are based on JUNOScriptExtensible Markup Language (XML).
150 ■ Defining and Enforcing Configuration Rules with Commit Scripts
JUNOS Software Administration Guide
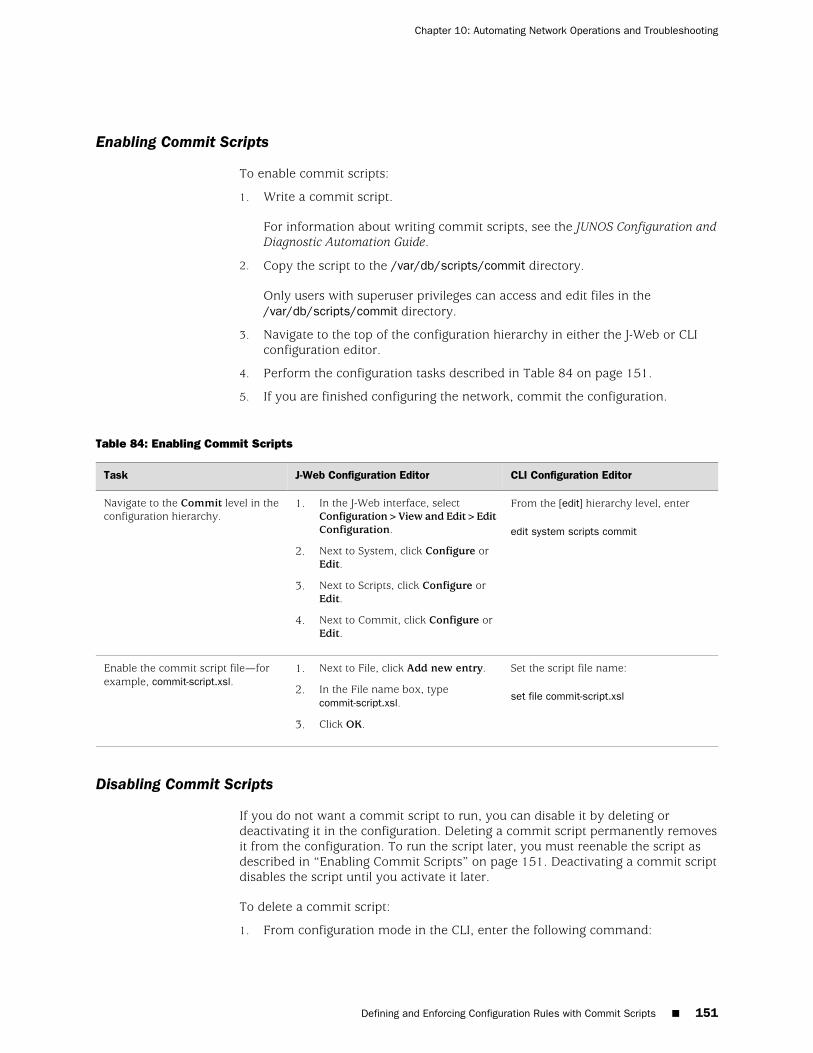
Enabling Commit Scripts
To enable commit scripts:
1. Write a commit script.
For information about writing commit scripts, see the JUNOS Configuration andDiagnostic Automation Guide.
2. Copy the script to the /var/db/scripts/commit directory.
Only users with superuser privileges can access and edit files in the/var/db/scripts/commit directory.
3. Navigate to the top of the configuration hierarchy in either the J-Web or CLIconfiguration editor.
4. Perform the configuration tasks described in Table 84 on page 151.
5. If you are finished configuring the network, commit the configuration.
Table 84: Enabling Commit Scripts
CLI Configuration EditorJ-Web Configuration EditorTask
From the [edit] hierarchy level, enter
edit system scripts commit
1. In the J-Web interface, selectConfiguration>View and Edit>EditConfiguration.
2. Next to System, click Configure orEdit.
3. Next to Scripts, click Configure orEdit.
4. Next to Commit, click Configure orEdit.
Navigate to the Commit level in theconfiguration hierarchy.
Set the script file name:
set file commit-script.xsl
1. Next to File, click Add new entry.
2. In the File name box, typecommit-script.xsl.
3. Click OK.
Enable the commit script file—forexample, commit-script.xsl.
Disabling Commit Scripts
If you do not want a commit script to run, you can disable it by deleting ordeactivating it in the configuration. Deleting a commit script permanently removesit from the configuration. To run the script later, you must reenable the script asdescribed in “Enabling Commit Scripts” on page 151. Deactivating a commit scriptdisables the script until you activate it later.
To delete a commit script:
1. From configuration mode in the CLI, enter the following command:
Defining and Enforcing Configuration Rules with Commit Scripts ■ 151
Chapter 10: Automating Network Operations and Troubleshooting
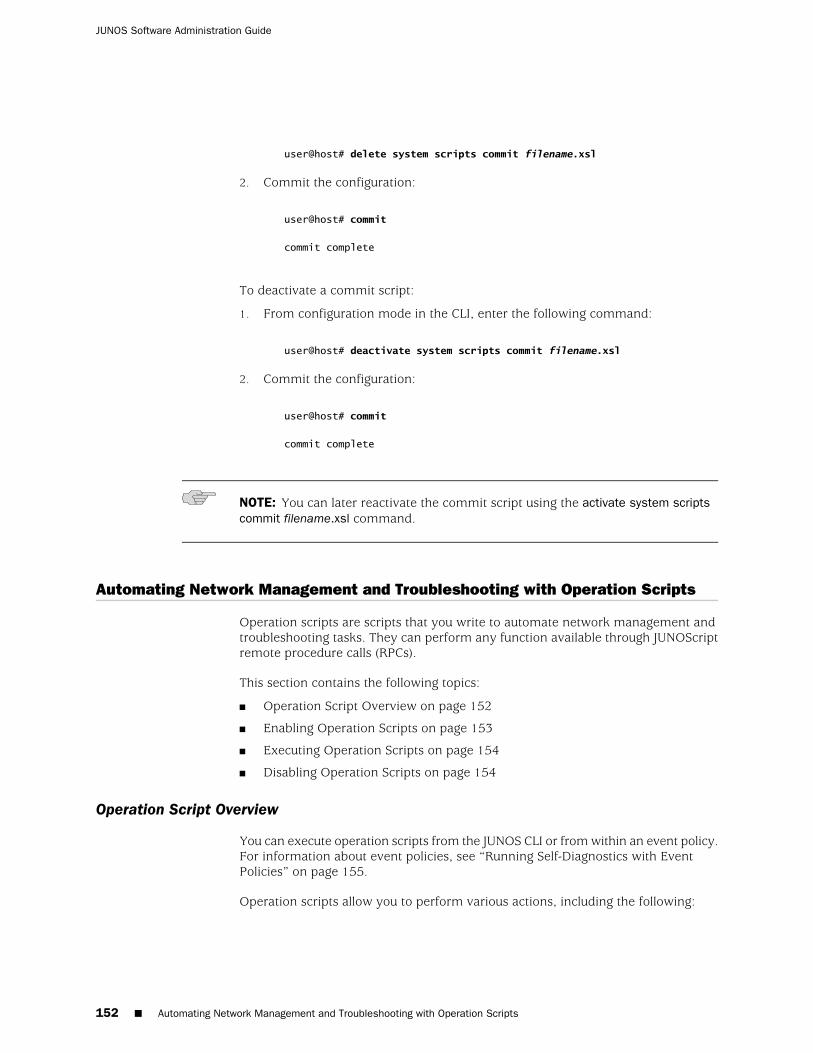
user@host# delete system scripts commit filename.xsl
2. Commit the configuration:
user@host# commit
commit complete
To deactivate a commit script:
1. From configuration mode in the CLI, enter the following command:
user@host# deactivate system scripts commit filename.xsl
2. Commit the configuration:
user@host# commit
commit complete
NOTE: You can later reactivate the commit script using the activate system scriptscommit filename.xsl command.
Automating Network Management and Troubleshooting with Operation Scripts
Operation scripts are scripts that you write to automate network management andtroubleshooting tasks. They can perform any function available through JUNOScriptremote procedure calls (RPCs).
This section contains the following topics:
■ Operation Script Overview on page 152
■ Enabling Operation Scripts on page 153
■ Executing Operation Scripts on page 154
■ Disabling Operation Scripts on page 154
Operation Script Overview
You can execute operation scripts from the JUNOS CLI or from within an event policy.For information about event policies, see “Running Self-Diagnostics with EventPolicies” on page 155.
Operation scripts allow you to perform various actions, including the following:
152 ■ Automating Network Management and Troubleshooting with Operation Scripts
JUNOS Software Administration Guide
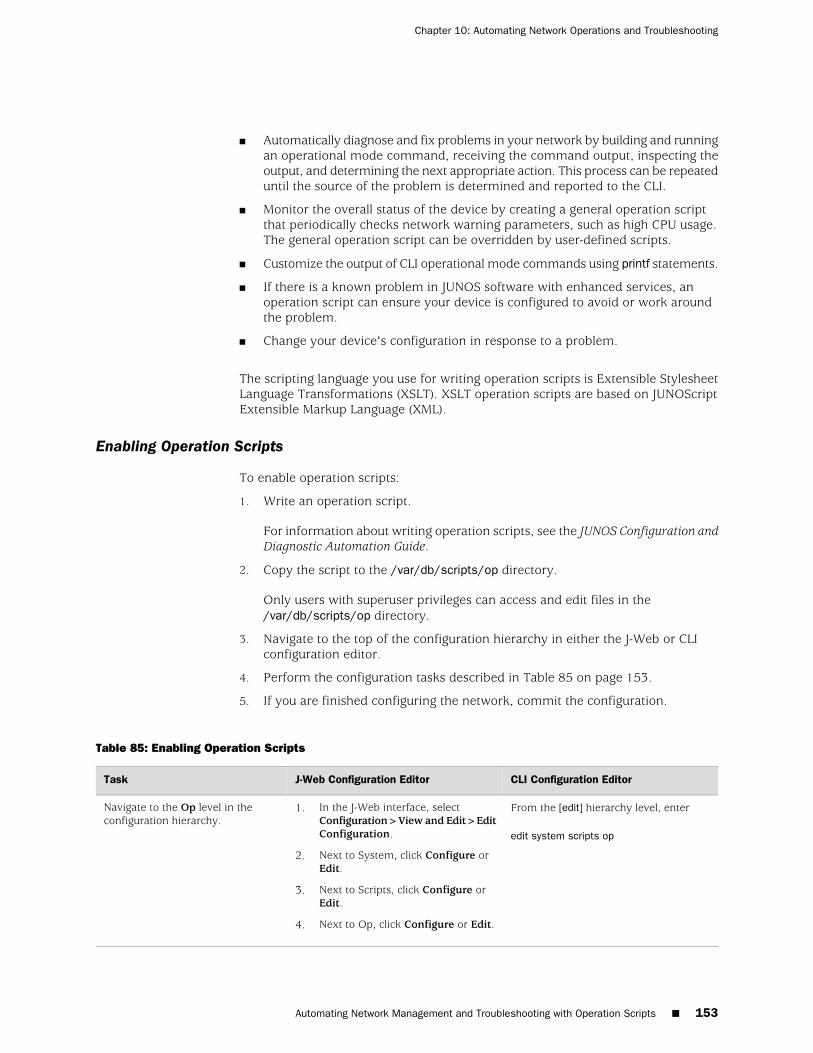
■ Automatically diagnose and fix problems in your network by building and runningan operational mode command, receiving the command output, inspecting theoutput, and determining the next appropriate action. This process can be repeateduntil the source of the problem is determined and reported to the CLI.
■ Monitor the overall status of the device by creating a general operation scriptthat periodically checks network warning parameters, such as high CPU usage.The general operation script can be overridden by user-defined scripts.
■ Customize the output of CLI operational mode commands using printf statements.
■ If there is a known problem in JUNOS software with enhanced services, anoperation script can ensure your device is configured to avoid or work aroundthe problem.
■ Change your device's configuration in response to a problem.
The scripting language you use for writing operation scripts is Extensible StylesheetLanguage Transformations (XSLT). XSLT operation scripts are based on JUNOScriptExtensible Markup Language (XML).
Enabling Operation Scripts
To enable operation scripts:
1. Write an operation script.
For information about writing operation scripts, see the JUNOS Configuration andDiagnostic Automation Guide.
2. Copy the script to the /var/db/scripts/op directory.
Only users with superuser privileges can access and edit files in the/var/db/scripts/op directory.
3. Navigate to the top of the configuration hierarchy in either the J-Web or CLIconfiguration editor.
4. Perform the configuration tasks described in Table 85 on page 153.
5. If you are finished configuring the network, commit the configuration.
Table 85: Enabling Operation Scripts
CLI Configuration EditorJ-Web Configuration EditorTask
From the [edit] hierarchy level, enter
edit system scripts op
1. In the J-Web interface, selectConfiguration>View and Edit>EditConfiguration.
2. Next to System, click Configure orEdit.
3. Next to Scripts, click Configure orEdit.
4. Next to Op, click Configure or Edit.
Navigate to the Op level in theconfiguration hierarchy.
Automating Network Management and Troubleshooting with Operation Scripts ■ 153
Chapter 10: Automating Network Operations and Troubleshooting
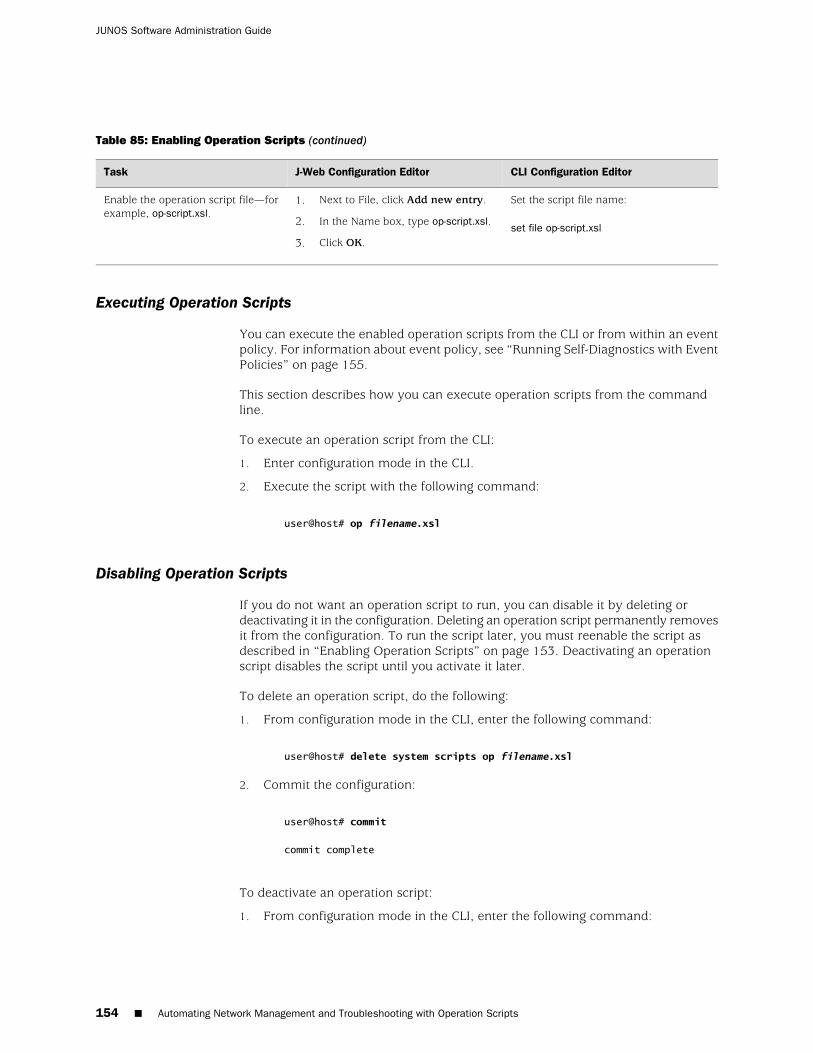
Table 85: Enabling Operation Scripts (continued)
CLI Configuration EditorJ-Web Configuration EditorTask
Set the script file name:
set file op-script.xsl
1. Next to File, click Add new entry.
2. In the Name box, type op-script.xsl.
3. Click OK.
Enable the operation script file—forexample, op-script.xsl.
Executing Operation Scripts
You can execute the enabled operation scripts from the CLI or from within an eventpolicy. For information about event policy, see “Running Self-Diagnostics with EventPolicies” on page 155.
This section describes how you can execute operation scripts from the commandline.
To execute an operation script from the CLI:
1. Enter configuration mode in the CLI.
2. Execute the script with the following command:
user@host# op filename.xsl
Disabling Operation Scripts
If you do not want an operation script to run, you can disable it by deleting ordeactivating it in the configuration. Deleting an operation script permanently removesit from the configuration. To run the script later, you must reenable the script asdescribed in “Enabling Operation Scripts” on page 153. Deactivating an operationscript disables the script until you activate it later.
To delete an operation script, do the following:
1. From configuration mode in the CLI, enter the following command:
user@host# delete system scripts op filename.xsl
2. Commit the configuration:
user@host# commit
commit complete
To deactivate an operation script:
1. From configuration mode in the CLI, enter the following command:
154 ■ Automating Network Management and Troubleshooting with Operation Scripts
JUNOS Software Administration Guide
user@host# deactivate system scripts op filename.xsl
2. Commit the configuration:
user@host# commit
commit complete
NOTE: You can later reactivate the operation script using the activate system scriptsop filename.xsl command.
Running Self-Diagnostics with Event Policies
To diagnose a fault or error condition on a routing platform, you need relevantinformation about the state of the platform. You can derive state information fromevent notifications. Event notifications are system log messages and Simple NetworkManagement Protocol (SNMP) traps.
Timely diagnosis and intervention can correct error conditions and keep the routingplatform in operation. Event policies allow you to automatically initiate self-diagnosticactions when specific events occur. These actions can either help you diagnose afault or take corrective action.
This section contains the following topics:
■ Event Policy Overview on page 155
■ Configuring Event Policies on page 156
Event Policy Overview
In response to events, event policies can execute the following actions:
■ Ignore the event—Do not generate a system log message for this event and donot process any further policy instructions for this event.
■ Raise a trap—Initiate an SNMP trap to notify SNMP trap-based applications whenthe event occurs.
■ Upload a file—Upload a file to a specified destination. You can specify a transferdelay, so that, on receipt of an event, the upload process begins after theconfigured transfer delay. For example, a transfer delay can ensure that a corefile has been completely generated before being uploaded.
■ Execute CLI operational mode commands—Execute commands when an eventoccurs. The output of these commands is stored in a file, which is then uploadedto a specified URL.
■ Execute operation scripts—Execute operation scripts when an event occurs. Theoutput of the operation scripts is stored in a file, which is then uploaded to a
Running Self-Diagnostics with Event Policies ■ 155
Chapter 10: Automating Network Operations and Troubleshooting
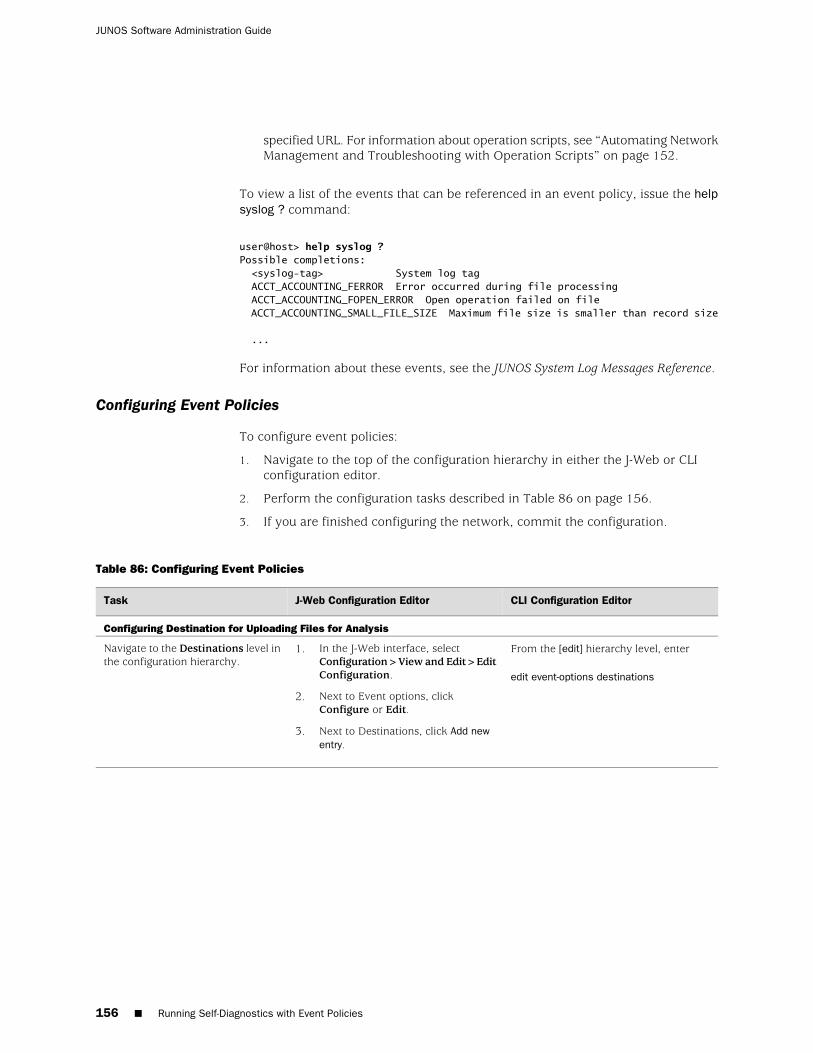
specified URL. For information about operation scripts, see “Automating NetworkManagement and Troubleshooting with Operation Scripts” on page 152.
To view a list of the events that can be referenced in an event policy, issue the helpsyslog ? command:
user@host> help syslog ?Possible completions: <syslog-tag> System log tag ACCT_ACCOUNTING_FERROR Error occurred during file processing ACCT_ACCOUNTING_FOPEN_ERROR Open operation failed on file ACCT_ACCOUNTING_SMALL_FILE_SIZE Maximum file size is smaller than record size
...
For information about these events, see the JUNOS System Log Messages Reference.
Configuring Event Policies
To configure event policies:
1. Navigate to the top of the configuration hierarchy in either the J-Web or CLIconfiguration editor.
2. Perform the configuration tasks described in Table 86 on page 156.
3. If you are finished configuring the network, commit the configuration.
Table 86: Configuring Event Policies
CLI Configuration EditorJ-Web Configuration EditorTask
Configuring Destination for Uploading Files for Analysis
From the [edit] hierarchy level, enter
edit event-options destinations
1. In the J-Web interface, selectConfiguration>View and Edit>EditConfiguration.
2. Next to Event options, clickConfigure or Edit.
3. Next to Destinations, click Add newentry.
Navigate to the Destinations level inthe configuration hierarchy.
156 ■ Running Self-Diagnostics with Event Policies
JUNOS Software Administration Guide
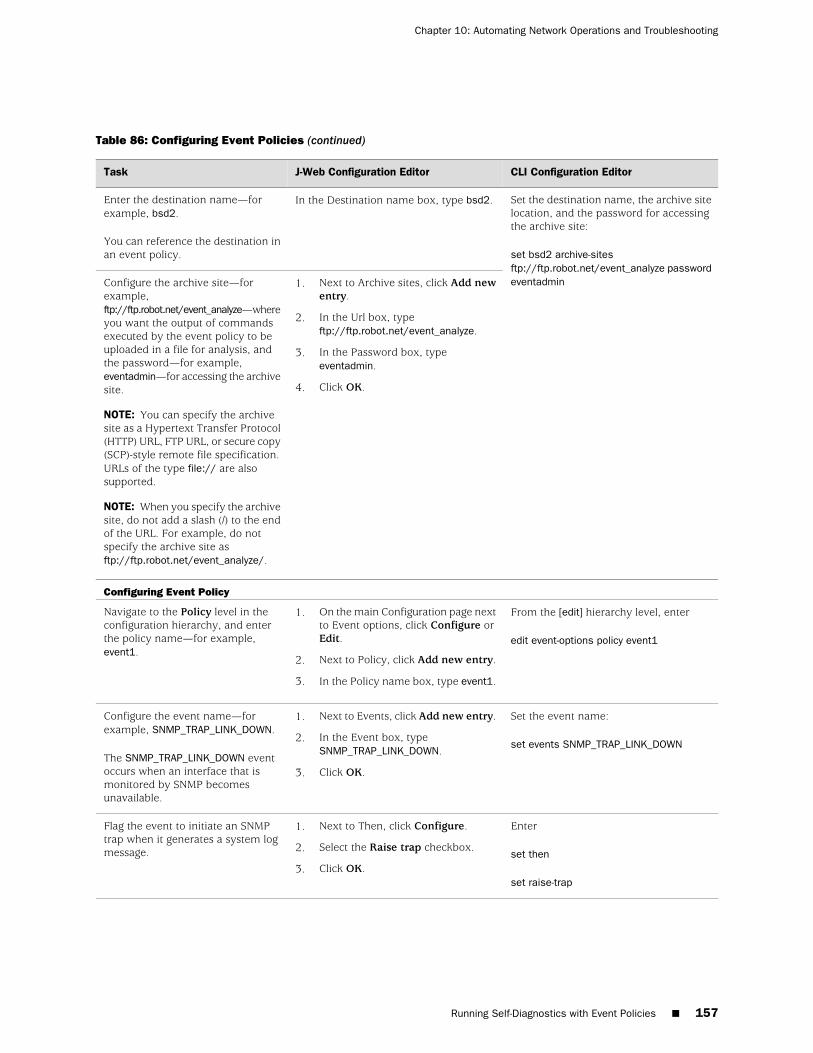
Table 86: Configuring Event Policies (continued)
CLI Configuration EditorJ-Web Configuration EditorTask
Set the destination name, the archive sitelocation, and the password for accessingthe archive site:
set bsd2 archive-sitesftp://ftp.robot.net/event_analyze passwordeventadmin
In the Destination name box, type bsd2.Enter the destination name—forexample, bsd2.
You can reference the destination inan event policy.
1. Next to Archive sites, click Add newentry.
2. In the Url box, typeftp://ftp.robot.net/event_analyze.
3. In the Password box, typeeventadmin.
4. Click OK.
Configure the archive site—forexample,ftp://ftp.robot.net/event_analyze—whereyou want the output of commandsexecuted by the event policy to beuploaded in a file for analysis, andthe password—for example,eventadmin—for accessing the archivesite.
NOTE: You can specify the archivesite as a Hypertext Transfer Protocol(HTTP) URL, FTP URL, or secure copy(SCP)-style remote file specification.URLs of the type file:// are alsosupported.
NOTE: When you specify the archivesite, do not add a slash (/) to the endof the URL. For example, do notspecify the archive site asftp://ftp.robot.net/event_analyze/.
Configuring Event Policy
From the [edit] hierarchy level, enter
edit event-options policy event1
1. On the main Configuration page nextto Event options, click Configure orEdit.
2. Next to Policy, click Add new entry.
3. In the Policy name box, type event1.
Navigate to the Policy level in theconfiguration hierarchy, and enterthe policy name—for example,event1.
Set the event name:
set events SNMP_TRAP_LINK_DOWN
1. Next to Events, click Add new entry.
2. In the Event box, typeSNMP_TRAP_LINK_DOWN.
3. Click OK.
Configure the event name—forexample, SNMP_TRAP_LINK_DOWN.
The SNMP_TRAP_LINK_DOWN eventoccurs when an interface that ismonitored by SNMP becomesunavailable.
Enter
set then
set raise-trap
1. Next to Then, click Configure.
2. Select the Raise trap checkbox.
3. Click OK.
Flag the event to initiate an SNMPtrap when it generates a system logmessage.
Running Self-Diagnostics with Event Policies ■ 157
Chapter 10: Automating Network Operations and Troubleshooting
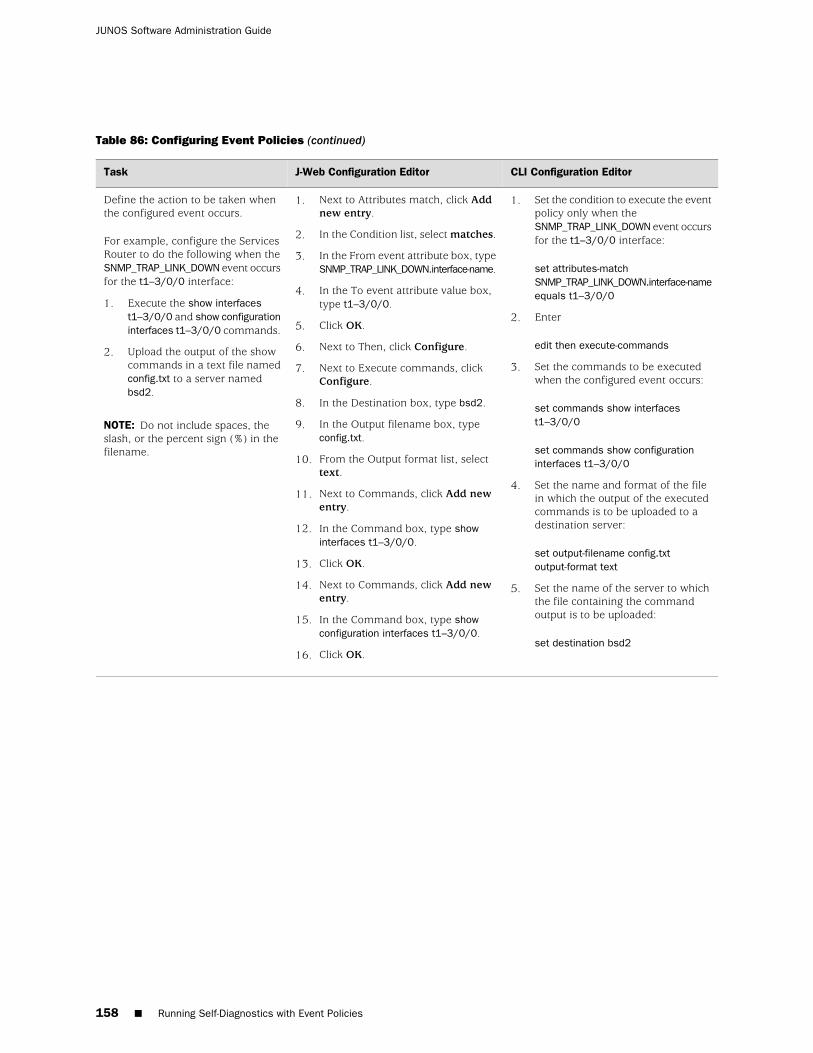
Table 86: Configuring Event Policies (continued)
CLI Configuration EditorJ-Web Configuration EditorTask
1. Set the condition to execute the eventpolicy only when theSNMP_TRAP_LINK_DOWN event occursfor the t1–3/0/0 interface:
set attributes-matchSNMP_TRAP_LINK_DOWN.interface-nameequals t1–3/0/0
2. Enter
edit then execute-commands
3. Set the commands to be executedwhen the configured event occurs:
set commands show interfacest1–3/0/0
set commands show configurationinterfaces t1–3/0/0
4. Set the name and format of the filein which the output of the executedcommands is to be uploaded to adestination server:
set output-filename config.txtoutput-format text
5. Set the name of the server to whichthe file containing the commandoutput is to be uploaded:
set destination bsd2
1. Next to Attributes match, click Addnew entry.
2. In the Condition list, select matches.
3. In the From event attribute box, typeSNMP_TRAP_LINK_DOWN.interface-name.
4. In the To event attribute value box,type t1–3/0/0.
5. Click OK.
6. Next to Then, click Configure.
7. Next to Execute commands, clickConfigure.
8. In the Destination box, type bsd2.
9. In the Output filename box, typeconfig.txt.
10. From the Output format list, selecttext.
11. Next to Commands, click Add newentry.
12. In the Command box, type showinterfaces t1–3/0/0.
13. Click OK.
14. Next to Commands, click Add newentry.
15. In the Command box, type showconfiguration interfaces t1–3/0/0.
16. Click OK.
Define the action to be taken whenthe configured event occurs.
For example, configure the ServicesRouter to do the following when theSNMP_TRAP_LINK_DOWN event occursfor the t1–3/0/0 interface:
1. Execute the show interfacest1–3/0/0 and show configurationinterfaces t1–3/0/0 commands.
2. Upload the output of the showcommands in a text file namedconfig.txt to a server namedbsd2.
NOTE: Do not include spaces, theslash, or the percent sign (%) in thefilename.
158 ■ Running Self-Diagnostics with Event Policies
JUNOS Software Administration Guide

Part 3
Monitoring the Device
■ Monitoring the Device and Routing Operations on page 161
■ Monitoring Events and Managing System Log Files on page 259
■ Configuring and Monitoring Alarms on page 273
Monitoring the Device ■ 159

160 ■ Monitoring the Device
JUNOS Software Administration Guide
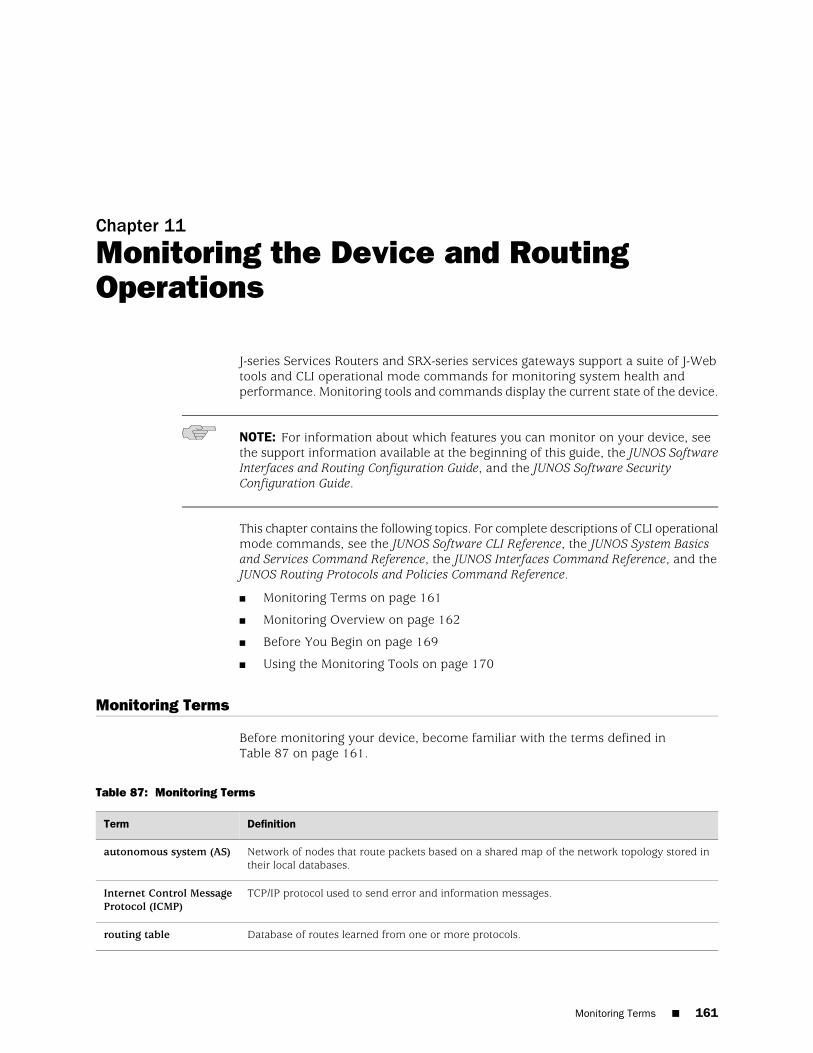
Chapter 11
Monitoring the Device and RoutingOperations
J-series Services Routers and SRX-series services gateways support a suite of J-Webtools and CLI operational mode commands for monitoring system health andperformance. Monitoring tools and commands display the current state of the device.
NOTE: For information about which features you can monitor on your device, seethe support information available at the beginning of this guide, the JUNOS SoftwareInterfaces and Routing Configuration Guide, and the JUNOS Software SecurityConfiguration Guide.
This chapter contains the following topics. For complete descriptions of CLI operationalmode commands, see the JUNOS Software CLI Reference, the JUNOS System Basicsand Services Command Reference, the JUNOS Interfaces Command Reference, and theJUNOS Routing Protocols and Policies Command Reference.
■ Monitoring Terms on page 161
■ Monitoring Overview on page 162
■ Before You Begin on page 169
■ Using the Monitoring Tools on page 170
Monitoring Terms
Before monitoring your device, become familiar with the terms defined inTable 87 on page 161.
Table 87: Monitoring Terms
DefinitionTerm
Network of nodes that route packets based on a shared map of the network topology stored intheir local databases.
autonomous system (AS)
TCP/IP protocol used to send error and information messages.Internet Control MessageProtocol (ICMP)
Database of routes learned from one or more protocols.routing table
Monitoring Terms ■ 161
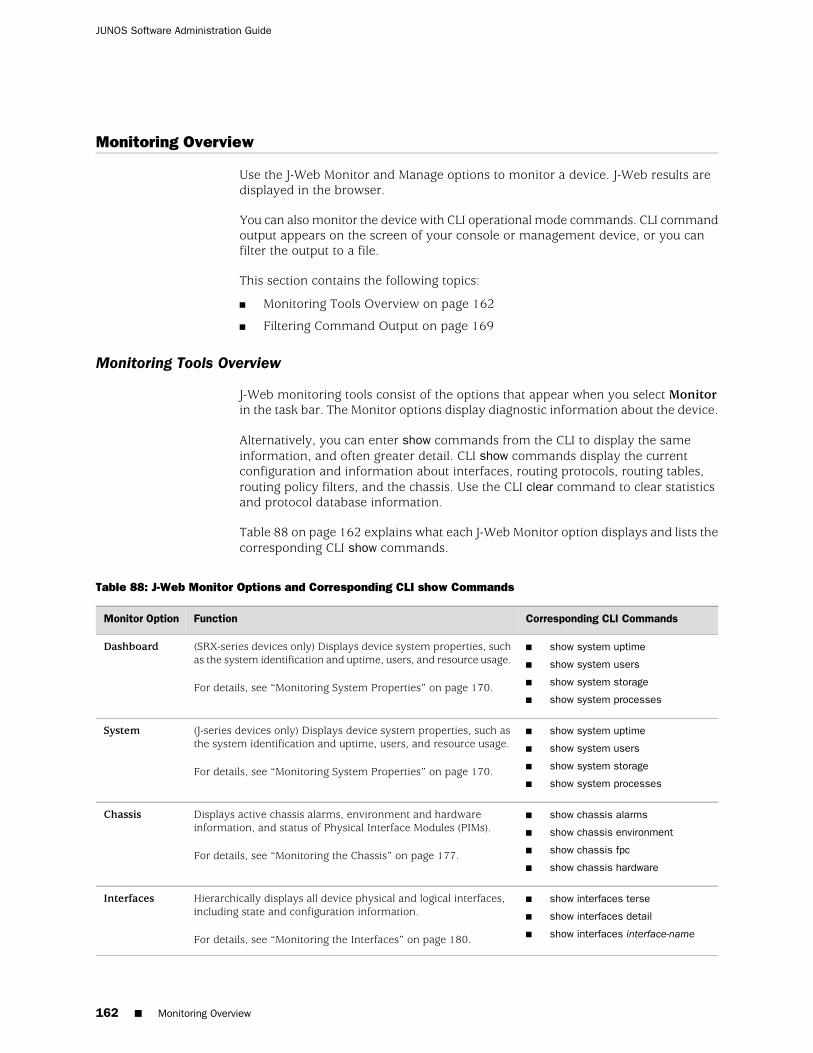
Monitoring Overview
Use the J-Web Monitor and Manage options to monitor a device. J-Web results aredisplayed in the browser.
You can also monitor the device with CLI operational mode commands. CLI commandoutput appears on the screen of your console or management device, or you canfilter the output to a file.
This section contains the following topics:
■ Monitoring Tools Overview on page 162
■ Filtering Command Output on page 169
Monitoring Tools Overview
J-Web monitoring tools consist of the options that appear when you select Monitorin the task bar. The Monitor options display diagnostic information about the device.
Alternatively, you can enter show commands from the CLI to display the sameinformation, and often greater detail. CLI show commands display the currentconfiguration and information about interfaces, routing protocols, routing tables,routing policy filters, and the chassis. Use the CLI clear command to clear statisticsand protocol database information.
Table 88 on page 162 explains what each J-Web Monitor option displays and lists thecorresponding CLI show commands.
Table 88: J-Web Monitor Options and Corresponding CLI show Commands
Corresponding CLI CommandsFunctionMonitor Option
■ show system uptime
■ show system users
■ show system storage
■ show system processes
(SRX-series devices only) Displays device system properties, suchas the system identification and uptime, users, and resource usage.
For details, see “Monitoring System Properties” on page 170.
Dashboard
■ show system uptime
■ show system users
■ show system storage
■ show system processes
(J-series devices only) Displays device system properties, such asthe system identification and uptime, users, and resource usage.
For details, see “Monitoring System Properties” on page 170.
System
■ show chassis alarms
■ show chassis environment
■ show chassis fpc
■ show chassis hardware
Displays active chassis alarms, environment and hardwareinformation, and status of Physical Interface Modules (PIMs).
For details, see “Monitoring the Chassis” on page 177.
Chassis
■ show interfaces terse
■ show interfaces detail
■ show interfaces interface-name
Hierarchically displays all device physical and logical interfaces,including state and configuration information.
For details, see “Monitoring the Interfaces” on page 180.
Interfaces
162 ■ Monitoring Overview
JUNOS Software Administration Guide
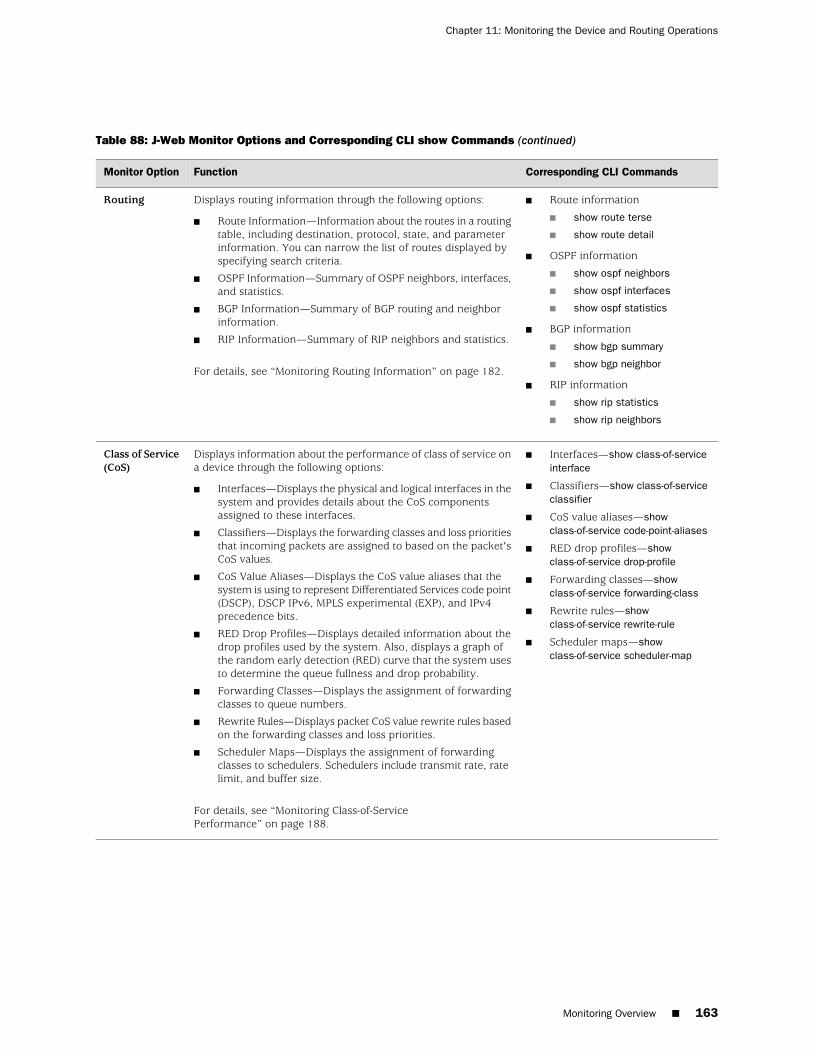
Table 88: J-Web Monitor Options and Corresponding CLI show Commands (continued)
Corresponding CLI CommandsFunctionMonitor Option
■ Route information
■ show route terse
■ show route detail
■ OSPF information
■ show ospf neighbors
■ show ospf interfaces
■ show ospf statistics
■ BGP information
■ show bgp summary
■ show bgp neighbor
■ RIP information
■ show rip statistics
■ show rip neighbors
Displays routing information through the following options:
■ Route Information—Information about the routes in a routingtable, including destination, protocol, state, and parameterinformation. You can narrow the list of routes displayed byspecifying search criteria.
■ OSPF Information—Summary of OSPF neighbors, interfaces,and statistics.
■ BGP Information—Summary of BGP routing and neighborinformation.
■ RIP Information—Summary of RIP neighbors and statistics.
For details, see “Monitoring Routing Information” on page 182.
Routing
■ Interfaces—show class-of-serviceinterface
■ Classifiers—show class-of-serviceclassifier
■ CoS value aliases—showclass-of-service code-point-aliases
■ RED drop profiles—showclass-of-service drop-profile
■ Forwarding classes—showclass-of-service forwarding-class
■ Rewrite rules—showclass-of-service rewrite-rule
■ Scheduler maps—showclass-of-service scheduler-map
Displays information about the performance of class of service ona device through the following options:
■ Interfaces—Displays the physical and logical interfaces in thesystem and provides details about the CoS componentsassigned to these interfaces.
■ Classifiers—Displays the forwarding classes and loss prioritiesthat incoming packets are assigned to based on the packet'sCoS values.
■ CoS Value Aliases—Displays the CoS value aliases that thesystem is using to represent Differentiated Services code point(DSCP), DSCP IPv6, MPLS experimental (EXP), and IPv4precedence bits.
■ RED Drop Profiles—Displays detailed information about thedrop profiles used by the system. Also, displays a graph ofthe random early detection (RED) curve that the system usesto determine the queue fullness and drop probability.
■ Forwarding Classes—Displays the assignment of forwardingclasses to queue numbers.
■ Rewrite Rules—Displays packet CoS value rewrite rules basedon the forwarding classes and loss priorities.
■ Scheduler Maps—Displays the assignment of forwardingclasses to schedulers. Schedulers include transmit rate, ratelimit, and buffer size.
For details, see “Monitoring Class-of-ServicePerformance” on page 188.
Class of Service(CoS)
Monitoring Overview ■ 163
Chapter 11: Monitoring the Device and Routing Operations
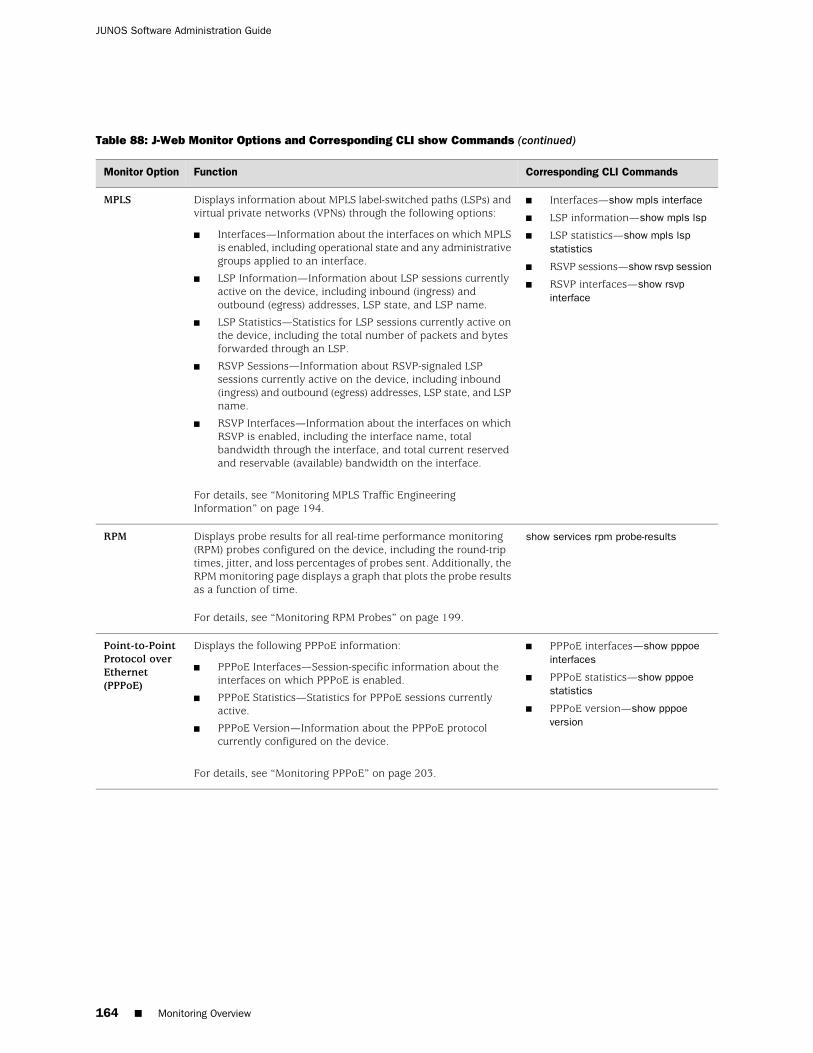
Table 88: J-Web Monitor Options and Corresponding CLI show Commands (continued)
Corresponding CLI CommandsFunctionMonitor Option
■ Interfaces—show mpls interface
■ LSP information—show mpls lsp
■ LSP statistics—show mpls lspstatistics
■ RSVP sessions—show rsvp session
■ RSVP interfaces—show rsvpinterface
Displays information about MPLS label-switched paths (LSPs) andvirtual private networks (VPNs) through the following options:
■ Interfaces—Information about the interfaces on which MPLSis enabled, including operational state and any administrativegroups applied to an interface.
■ LSP Information—Information about LSP sessions currentlyactive on the device, including inbound (ingress) andoutbound (egress) addresses, LSP state, and LSP name.
■ LSP Statistics—Statistics for LSP sessions currently active onthe device, including the total number of packets and bytesforwarded through an LSP.
■ RSVP Sessions—Information about RSVP-signaled LSPsessions currently active on the device, including inbound(ingress) and outbound (egress) addresses, LSP state, and LSPname.
■ RSVP Interfaces—Information about the interfaces on whichRSVP is enabled, including the interface name, totalbandwidth through the interface, and total current reservedand reservable (available) bandwidth on the interface.
For details, see “Monitoring MPLS Traffic EngineeringInformation” on page 194.
MPLS
show services rpm probe-resultsDisplays probe results for all real-time performance monitoring(RPM) probes configured on the device, including the round-triptimes, jitter, and loss percentages of probes sent. Additionally, theRPM monitoring page displays a graph that plots the probe resultsas a function of time.
For details, see “Monitoring RPM Probes” on page 199.
RPM
■ PPPoE interfaces—show pppoeinterfaces
■ PPPoE statistics—show pppoestatistics
■ PPPoE version—show pppoeversion
Displays the following PPPoE information:
■ PPPoE Interfaces—Session-specific information about theinterfaces on which PPPoE is enabled.
■ PPPoE Statistics—Statistics for PPPoE sessions currentlyactive.
■ PPPoE Version—Information about the PPPoE protocolcurrently configured on the device.
For details, see “Monitoring PPPoE” on page 203.
Point-to-PointProtocol overEthernet(PPPoE)
164 ■ Monitoring Overview
JUNOS Software Administration Guide
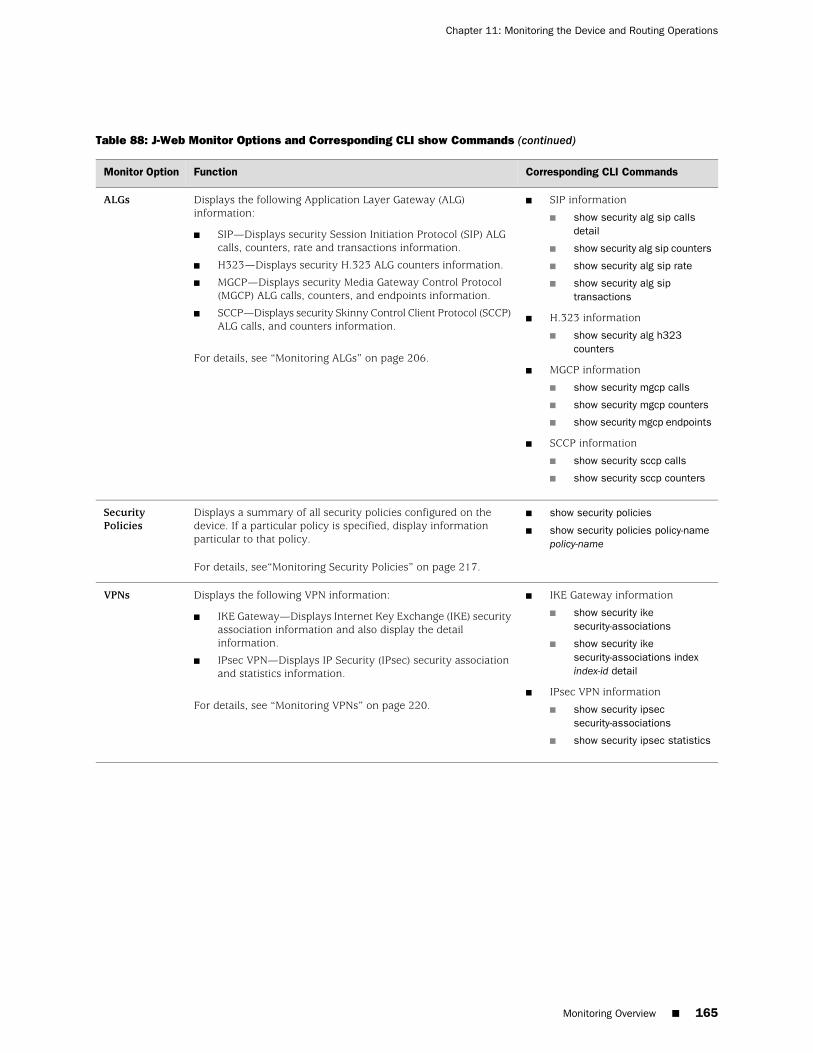
Table 88: J-Web Monitor Options and Corresponding CLI show Commands (continued)
Corresponding CLI CommandsFunctionMonitor Option
■ SIP information
■ show security alg sip callsdetail
■ show security alg sip counters
■ show security alg sip rate
■ show security alg siptransactions
■ H.323 information
■ show security alg h323counters
■ MGCP information
■ show security mgcp calls
■ show security mgcp counters
■ show security mgcp endpoints
■ SCCP information
■ show security sccp calls
■ show security sccp counters
Displays the following Application Layer Gateway (ALG)information:
■ SIP—Displays security Session Initiation Protocol (SIP) ALGcalls, counters, rate and transactions information.
■ H323—Displays security H.323 ALG counters information.
■ MGCP—Displays security Media Gateway Control Protocol(MGCP) ALG calls, counters, and endpoints information.
■ SCCP—Displays security Skinny Control Client Protocol (SCCP)ALG calls, and counters information.
For details, see “Monitoring ALGs” on page 206.
ALGs
■ show security policies
■ show security policies policy-namepolicy-name
Displays a summary of all security policies configured on thedevice. If a particular policy is specified, display informationparticular to that policy.
For details, see“Monitoring Security Policies” on page 217.
SecurityPolicies
■ IKE Gateway information
■ show security ikesecurity-associations
■ show security ikesecurity-associations indexindex-id detail
■ IPsec VPN information
■ show security ipsecsecurity-associations
■ show security ipsec statistics
Displays the following VPN information:
■ IKE Gateway—Displays Internet Key Exchange (IKE) securityassociation information and also display the detailinformation.
■ IPsec VPN—Displays IP Security (IPsec) security associationand statistics information.
For details, see “Monitoring VPNs” on page 220.
VPNs
Monitoring Overview ■ 165
Chapter 11: Monitoring the Device and Routing Operations
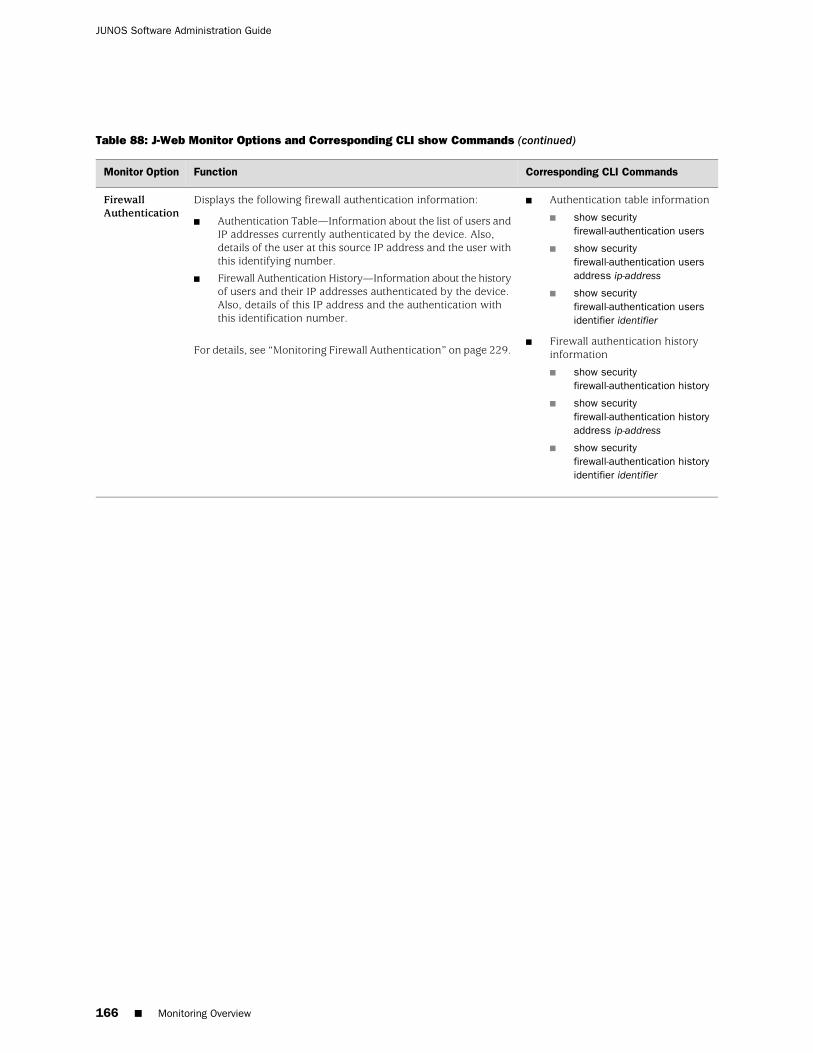
Table 88: J-Web Monitor Options and Corresponding CLI show Commands (continued)
Corresponding CLI CommandsFunctionMonitor Option
■ Authentication table information
■ show securityfirewall-authentication users
■ show securityfirewall-authentication usersaddress ip-address
■ show securityfirewall-authentication usersidentifier identifier
■ Firewall authentication historyinformation
■ show securityfirewall-authentication history
■ show securityfirewall-authentication historyaddress ip-address
■ show securityfirewall-authentication historyidentifier identifier
Displays the following firewall authentication information:
■ Authentication Table—Information about the list of users andIP addresses currently authenticated by the device. Also,details of the user at this source IP address and the user withthis identifying number.
■ Firewall Authentication History—Information about the historyof users and their IP addresses authenticated by the device.Also, details of this IP address and the authentication withthis identification number.
For details, see “Monitoring Firewall Authentication” on page 229.
FirewallAuthentication
166 ■ Monitoring Overview
JUNOS Software Administration Guide
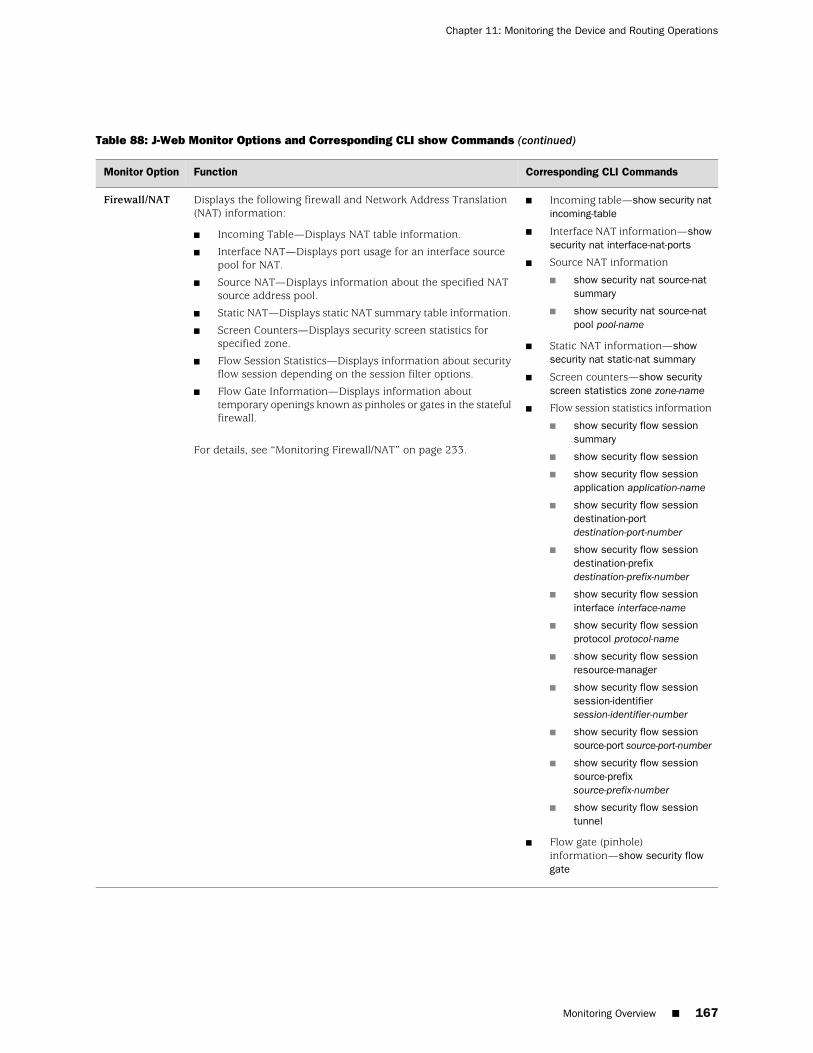
Table 88: J-Web Monitor Options and Corresponding CLI show Commands (continued)
Corresponding CLI CommandsFunctionMonitor Option
■ Incoming table—show security natincoming-table
■ Interface NAT information—showsecurity nat interface-nat-ports
■ Source NAT information
■ show security nat source-natsummary
■ show security nat source-natpool pool-name
■ Static NAT information—showsecurity nat static-nat summary
■ Screen counters—show securityscreen statistics zone zone-name
■ Flow session statistics information
■ show security flow sessionsummary
■ show security flow session
■ show security flow sessionapplication application-name
■ show security flow sessiondestination-portdestination-port-number
■ show security flow sessiondestination-prefixdestination-prefix-number
■ show security flow sessioninterface interface-name
■ show security flow sessionprotocol protocol-name
■ show security flow sessionresource-manager
■ show security flow sessionsession-identifiersession-identifier-number
■ show security flow sessionsource-port source-port-number
■ show security flow sessionsource-prefixsource-prefix-number
■ show security flow sessiontunnel
■ Flow gate (pinhole)information—show security flowgate
Displays the following firewall and Network Address Translation(NAT) information:
■ Incoming Table—Displays NAT table information.
■ Interface NAT—Displays port usage for an interface sourcepool for NAT.
■ Source NAT—Displays information about the specified NATsource address pool.
■ Static NAT—Displays static NAT summary table information.
■ Screen Counters—Displays security screen statistics forspecified zone.
■ Flow Session Statistics—Displays information about securityflow session depending on the session filter options.
■ Flow Gate Information—Displays information abouttemporary openings known as pinholes or gates in the statefulfirewall.
For details, see “Monitoring Firewall/NAT” on page 233.
Firewall/NAT
Monitoring Overview ■ 167
Chapter 11: Monitoring the Device and Routing Operations

Table 88: J-Web Monitor Options and Corresponding CLI show Commands (continued)
Corresponding CLI CommandsFunctionMonitor Option
■ Statistics information
■ show system services dhcpglobal
■ show system services dhcpstatistics
■ Binding information—showsystem services dhcp binding
■ Conflicts information—showsystem services dhcp conflicts
■ Client information—show systemservices dhcp clients
■ Relay statistics information—showsystem services dhcprelay-statistics
Displays the following Dynamic Host Control Protocol (DHCP)clients and server information:
■ Statistics—Displays information about the global scope andDHCP statistics.
■ Binding—Displays information about client bindings.
■ Conflicts—Displays information about the DHCP addressconflict statistics.
■ Client—Displays information about the DHCP client.
■ Relay Statistics—Displays information about the DHCP relaystatistics.
For details, see “Monitoring DHCP” on page 250.
DHCP
■ Dynamic DNS—show systemservices dynamic-dns client detail
■ DNS proxy
■ show system servicesdns-proxy
■ show system servicesdns-proxy cache
Displays the following Domain Name Server (DNS) information.
■ Dynamic DNS—Displays information about the configuredinterface for any IP address changes and updates it to thedynamic DNS server.
■ DNS proxy—Displays information about DNS proxy statisticsand DNS proxy cache.
For details, see “Monitoring DNS” on page 248.
DNS
■ Spanning Tree
■ show spanning-tree interface
■ show spanning-tree bridge
■ GVRP
■ show gvrp
■ Dot1X
■ show dot1x interface
■ show dot1xauthentication-failed-users
Displays the following switching protocol information:
■ Spanning Tree —Displays status, information, and statisticsabout Spanning Tree Protocol (STP) interface parameters.
■ Generic VLAN Registration Protocol (GVRP)—Displaysinformation and statistics about global GVRP interfaceparameters.
■ Dot1X—Displays information about host authentication.
For details, see “Monitoring Enhanced Switching” on page 254.
EnhancedSwitching
■ IDP Status—show IDP status
■ IDP Data Plane MemoryStatistics—show IDP data planememory statistics
Displays the following Intrusion Detection and Prevention (IDP)status and data plane memory statistics:
■ IDP Status—Displays information about the status of the IDPenabled.
■ IDP Data Plane Memory Statistics—Displays informationabout the IDP data plane memory usage statistics.
For details, see “Monitoring IDP” on page 256.
IDP
168 ■ Monitoring Overview
JUNOS Software Administration Guide
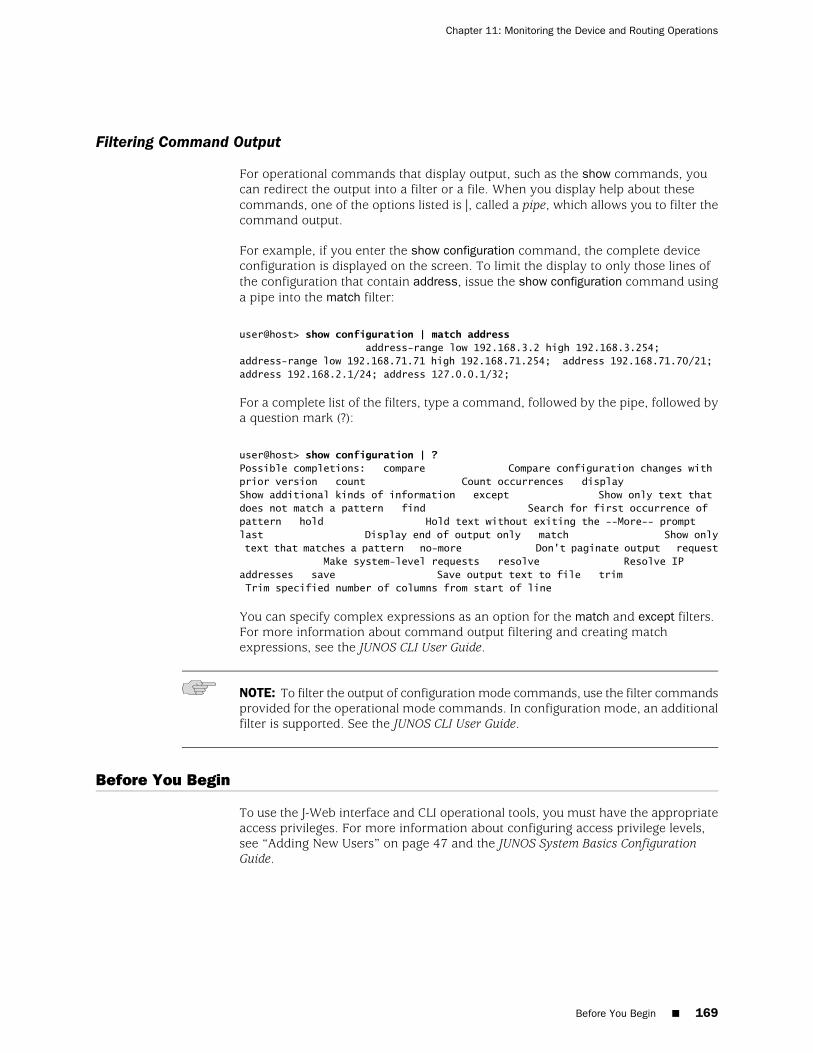
Filtering Command Output
For operational commands that display output, such as the show commands, youcan redirect the output into a filter or a file. When you display help about thesecommands, one of the options listed is |, called a pipe, which allows you to filter thecommand output.
For example, if you enter the show configuration command, the complete deviceconfiguration is displayed on the screen. To limit the display to only those lines ofthe configuration that contain address, issue the show configuration command usinga pipe into the match filter:
user@host> show configuration | match address address-range low 192.168.3.2 high 192.168.3.254; address-range low 192.168.71.71 high 192.168.71.254; address 192.168.71.70/21; address 192.168.2.1/24; address 127.0.0.1/32;
For a complete list of the filters, type a command, followed by the pipe, followed bya question mark (?):
user@host> show configuration | ?Possible completions: compare Compare configuration changes with prior version count Count occurrences display Show additional kinds of information except Show only text that does not match a pattern find Search for first occurrence of pattern hold Hold text without exiting the --More-- prompt last Display end of output only match Show only text that matches a pattern no-more Don't paginate output request Make system-level requests resolve Resolve IP addresses save Save output text to file trim Trim specified number of columns from start of line
You can specify complex expressions as an option for the match and except filters.For more information about command output filtering and creating matchexpressions, see the JUNOS CLI User Guide.
NOTE: To filter the output of configuration mode commands, use the filter commandsprovided for the operational mode commands. In configuration mode, an additionalfilter is supported. See the JUNOS CLI User Guide.
Before You Begin
To use the J-Web interface and CLI operational tools, you must have the appropriateaccess privileges. For more information about configuring access privilege levels,see “Adding New Users” on page 47 and the JUNOS System Basics ConfigurationGuide.
Before You Begin ■ 169
Chapter 11: Monitoring the Device and Routing Operations
Using the Monitoring Tools
This section describes the monitoring tools in detail. It contains the following topics:
■ Monitoring System Properties on page 170
■ Monitoring the Chassis on page 177
■ Monitoring the Interfaces on page 180
■ Monitoring Routing Information on page 182
■ Monitoring Class-of-Service Performance on page 188
■ Monitoring MPLS Traffic Engineering Information on page 194
■ Monitoring RPM Probes on page 199
■ Monitoring PPP on page 203
■ Monitoring PPPoE on page 203
■ Monitoring ALGs on page 206
■ Monitoring Security Policies on page 217
■ Monitoring VPNs on page 220
■ Monitoring Firewall Authentication on page 229
■ Monitoring the WAN Acceleration Interface on page 232
■ Monitoring Firewall/NAT on page 233
■ Monitoring DNS on page 248
■ Monitoring DHCP on page 250
■ Monitoring Enhanced Switching on page 254
■ Monitoring IDP on page 256
Monitoring System Properties
The system properties include everything from the name and IP address of the deviceto the resource usage on the Routing Engine.
To view these system properties, select Monitor>Dashboard (SRX-series devices)or Monitor>System (J-series devices) in the J-Web interface.
NOTE: The J-Web GUI interface framework used on the SRX-series devices is basedon panes. Each pane acts a separate frame that can be viewed, dragged, minimized,maximized, or hidden. The J-Web user interface has eight panes such as Systemidentification, Resource utilization, Security resources, System alarms, File usage,Login sessions, Chassis status, and Storage usage.
Only the first three panes are displayed by default. To view the other systemproperties, click the Preferences icon at top right corner of the page. You can alsoset the refresh time interval for automatically updating the data on the systemproperties.
170 ■ Using the Monitoring Tools
JUNOS Software Administration Guide
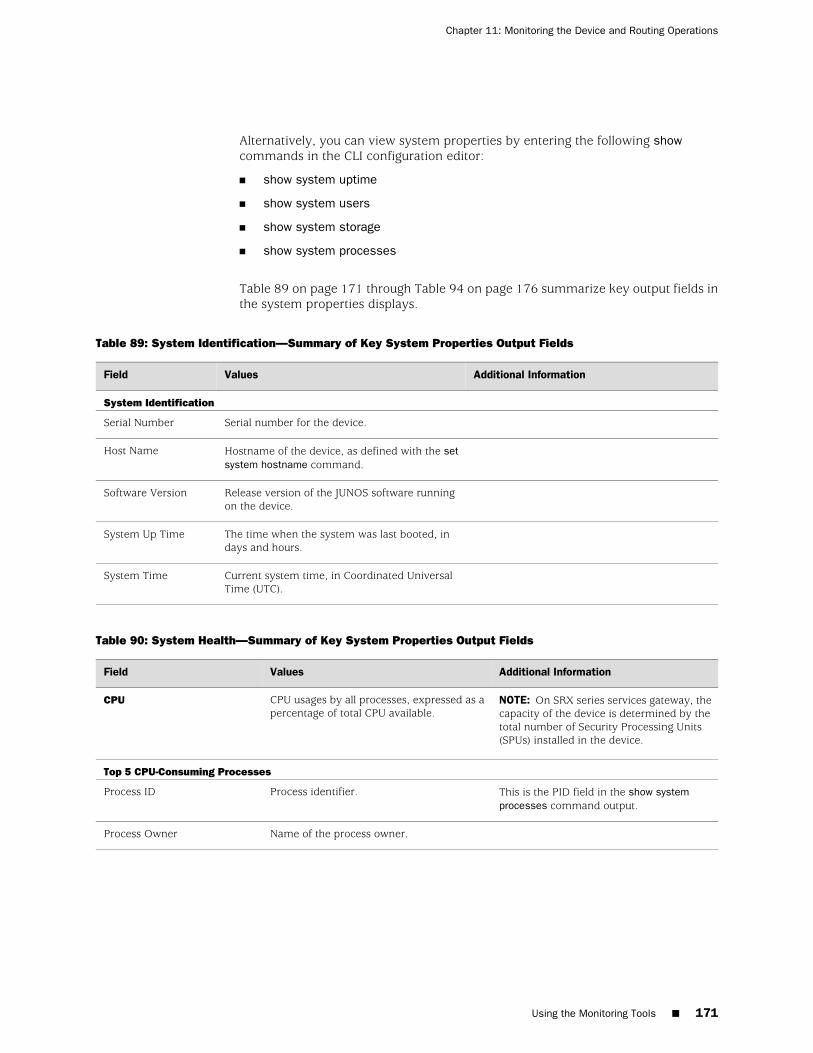
Alternatively, you can view system properties by entering the following showcommands in the CLI configuration editor:
■ show system uptime
■ show system users
■ show system storage
■ show system processes
Table 89 on page 171 through Table 94 on page 176 summarize key output fields inthe system properties displays.
Table 89: System Identification—Summary of Key System Properties Output Fields
Additional InformationValuesField
System Identification
Serial number for the device.Serial Number
Hostname of the device, as defined with the setsystem hostname command.
Host Name
Release version of the JUNOS software runningon the device.
Software Version
The time when the system was last booted, indays and hours.
System Up Time
Current system time, in Coordinated UniversalTime (UTC).
System Time
Table 90: System Health—Summary of Key System Properties Output Fields
Additional InformationValuesField
NOTE: On SRX series services gateway, thecapacity of the device is determined by thetotal number of Security Processing Units(SPUs) installed in the device.
CPU usages by all processes, expressed as apercentage of total CPU available.
CPU
Top 5 CPU-Consuming Processes
This is the PID field in the show systemprocesses command output.
Process identifier.Process ID
Name of the process owner.Process Owner
Using the Monitoring Tools ■ 171
Chapter 11: Monitoring the Device and Routing Operations
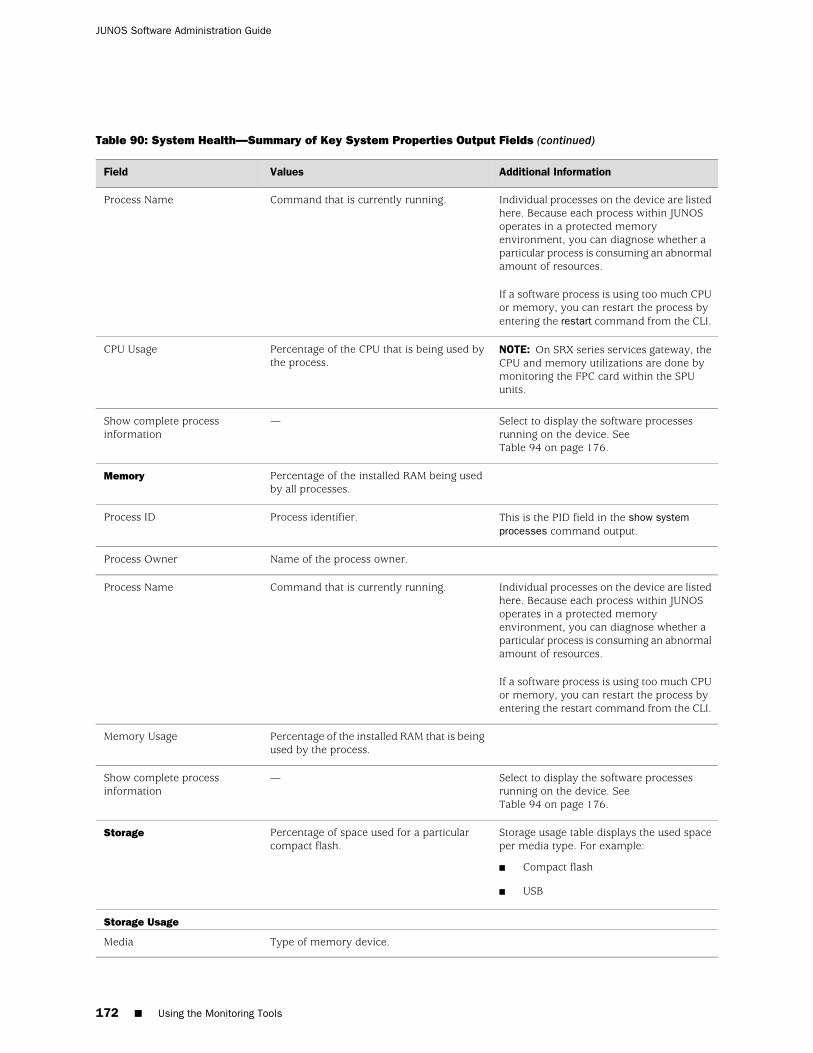
Table 90: System Health—Summary of Key System Properties Output Fields (continued)
Additional InformationValuesField
Individual processes on the device are listedhere. Because each process within JUNOSoperates in a protected memoryenvironment, you can diagnose whether aparticular process is consuming an abnormalamount of resources.
If a software process is using too much CPUor memory, you can restart the process byentering the restart command from the CLI.
Command that is currently running.Process Name
NOTE: On SRX series services gateway, theCPU and memory utilizations are done bymonitoring the FPC card within the SPUunits.
Percentage of the CPU that is being used bythe process.
CPU Usage
Select to display the software processesrunning on the device. SeeTable 94 on page 176.
—Show complete processinformation
Percentage of the installed RAM being usedby all processes.
Memory
This is the PID field in the show systemprocesses command output.
Process identifier.Process ID
Name of the process owner.Process Owner
Individual processes on the device are listedhere. Because each process within JUNOSoperates in a protected memoryenvironment, you can diagnose whether aparticular process is consuming an abnormalamount of resources.
If a software process is using too much CPUor memory, you can restart the process byentering the restart command from the CLI.
Command that is currently running.Process Name
Percentage of the installed RAM that is beingused by the process.
Memory Usage
Select to display the software processesrunning on the device. SeeTable 94 on page 176.
—Show complete processinformation
Storage usage table displays the used spaceper media type. For example:
■ Compact flash
■ USB
Percentage of space used for a particularcompact flash.
Storage
Storage Usage
Type of memory device.Media
172 ■ Using the Monitoring Tools
JUNOS Software Administration Guide
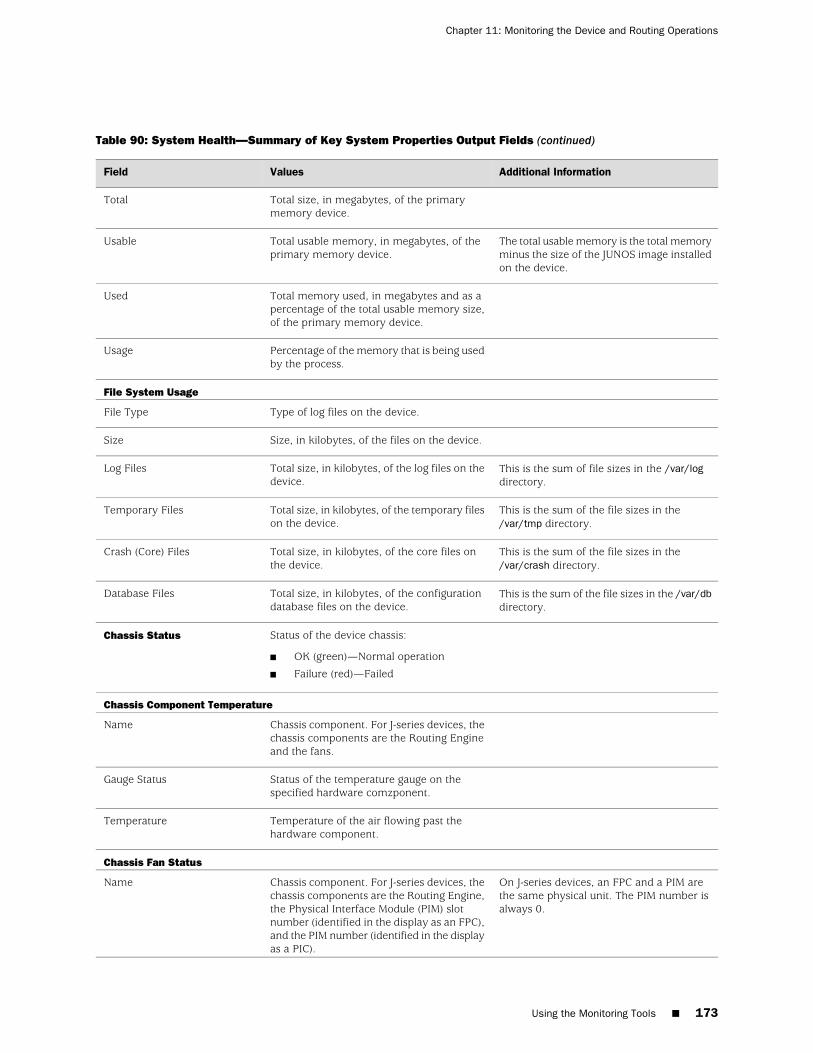
Table 90: System Health—Summary of Key System Properties Output Fields (continued)
Additional InformationValuesField
Total size, in megabytes, of the primarymemory device.
Total
The total usable memory is the total memoryminus the size of the JUNOS image installedon the device.
Total usable memory, in megabytes, of theprimary memory device.
Usable
Total memory used, in megabytes and as apercentage of the total usable memory size,of the primary memory device.
Used
Percentage of the memory that is being usedby the process.
Usage
File System Usage
Type of log files on the device.File Type
Size, in kilobytes, of the files on the device.Size
This is the sum of file sizes in the /var/logdirectory.
Total size, in kilobytes, of the log files on thedevice.
Log Files
This is the sum of the file sizes in the/var/tmp directory.
Total size, in kilobytes, of the temporary fileson the device.
Temporary Files
This is the sum of the file sizes in the/var/crash directory.
Total size, in kilobytes, of the core files onthe device.
Crash (Core) Files
This is the sum of the file sizes in the /var/dbdirectory.
Total size, in kilobytes, of the configurationdatabase files on the device.
Database Files
Status of the device chassis:
■ OK (green)—Normal operation
■ Failure (red)—Failed
Chassis Status
Chassis Component Temperature
Chassis component. For J-series devices, thechassis components are the Routing Engineand the fans.
Name
Status of the temperature gauge on thespecified hardware comzponent.
Gauge Status
Temperature of the air flowing past thehardware component.
Temperature
Chassis Fan Status
On J-series devices, an FPC and a PIM arethe same physical unit. The PIM number isalways 0.
Chassis component. For J-series devices, thechassis components are the Routing Engine,the Physical Interface Module (PIM) slotnumber (identified in the display as an FPC),and the PIM number (identified in the displayas a PIC).
Name
Using the Monitoring Tools ■ 173
Chapter 11: Monitoring the Device and Routing Operations
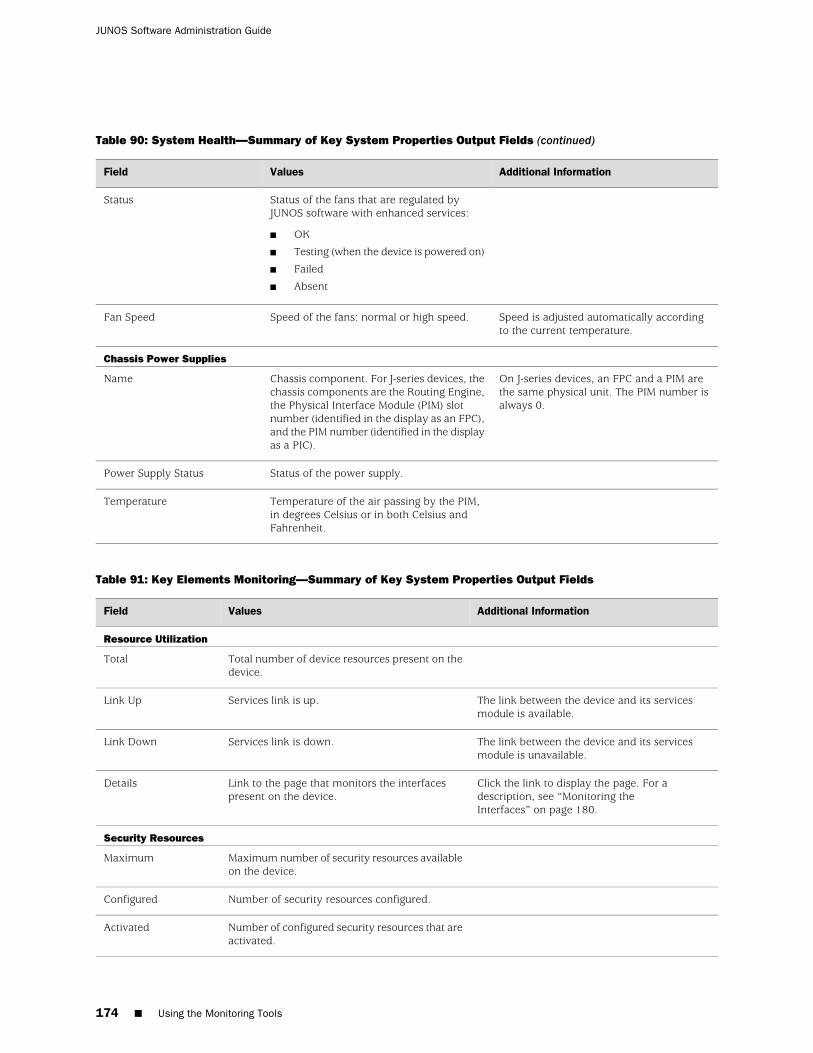
Table 90: System Health—Summary of Key System Properties Output Fields (continued)
Additional InformationValuesField
Status of the fans that are regulated byJUNOS software with enhanced services:
■ OK
■ Testing (when the device is powered on)
■ Failed
■ Absent
Status
Speed is adjusted automatically accordingto the current temperature.
Speed of the fans: normal or high speed.Fan Speed
Chassis Power Supplies
On J-series devices, an FPC and a PIM arethe same physical unit. The PIM number isalways 0.
Chassis component. For J-series devices, thechassis components are the Routing Engine,the Physical Interface Module (PIM) slotnumber (identified in the display as an FPC),and the PIM number (identified in the displayas a PIC).
Name
Status of the power supply.Power Supply Status
Temperature of the air passing by the PIM,in degrees Celsius or in both Celsius andFahrenheit.
Temperature
Table 91: Key Elements Monitoring—Summary of Key System Properties Output Fields
Additional InformationValuesField
Resource Utilization
Total number of device resources present on thedevice.
Total
The link between the device and its servicesmodule is available.
Services link is up.Link Up
The link between the device and its servicesmodule is unavailable.
Services link is down.Link Down
Click the link to display the page. For adescription, see “Monitoring theInterfaces” on page 180.
Link to the page that monitors the interfacespresent on the device.
Details
Security Resources
Maximum number of security resources availableon the device.
Maximum
Number of security resources configured.Configured
Number of configured security resources that areactivated.
Activated
174 ■ Using the Monitoring Tools
JUNOS Software Administration Guide
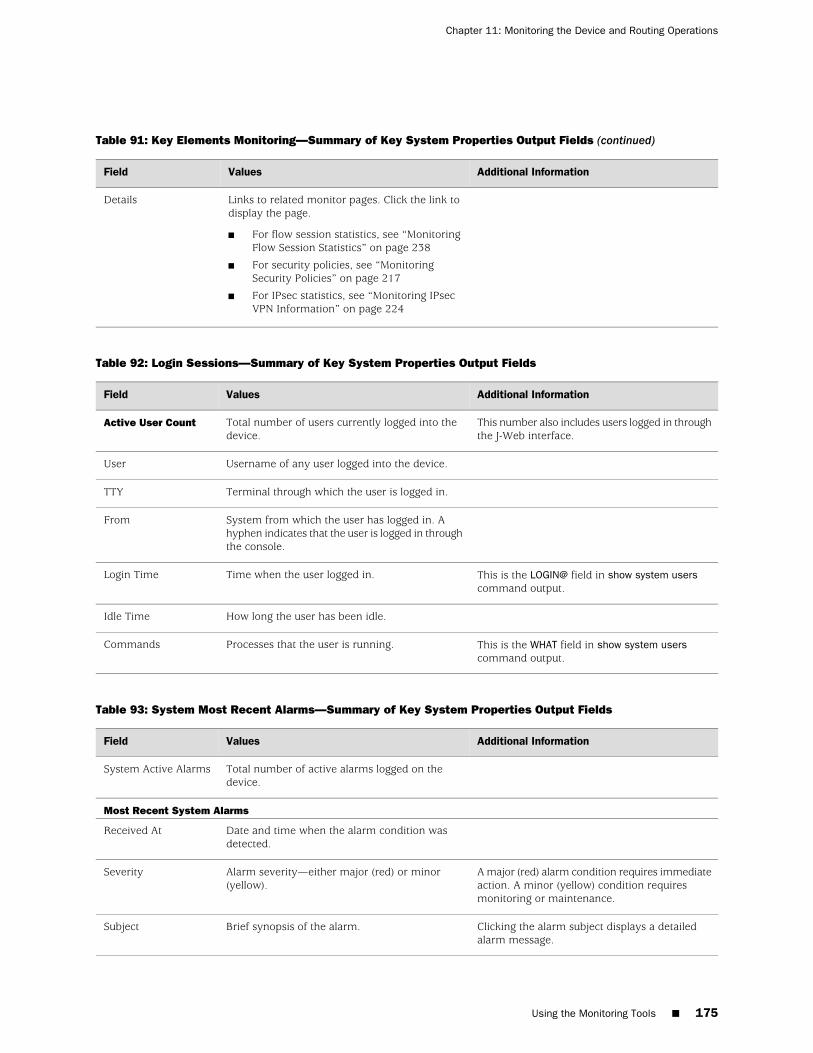
Table 91: Key Elements Monitoring—Summary of Key System Properties Output Fields (continued)
Additional InformationValuesField
Links to related monitor pages. Click the link todisplay the page.
■ For flow session statistics, see “MonitoringFlow Session Statistics” on page 238
■ For security policies, see “MonitoringSecurity Policies” on page 217
■ For IPsec statistics, see “Monitoring IPsecVPN Information” on page 224
Details
Table 92: Login Sessions—Summary of Key System Properties Output Fields
Additional InformationValuesField
This number also includes users logged in throughthe J-Web interface.
Total number of users currently logged into thedevice.
Active User Count
Username of any user logged into the device.User
Terminal through which the user is logged in.TTY
System from which the user has logged in. Ahyphen indicates that the user is logged in throughthe console.
From
This is the LOGIN@ field in show system userscommand output.
Time when the user logged in.Login Time
How long the user has been idle.Idle Time
This is the WHAT field in show system userscommand output.
Processes that the user is running.Commands
Table 93: System Most Recent Alarms—Summary of Key System Properties Output Fields
Additional InformationValuesField
Total number of active alarms logged on thedevice.
System Active Alarms
Most Recent System Alarms
Date and time when the alarm condition wasdetected.
Received At
A major (red) alarm condition requires immediateaction. A minor (yellow) condition requiresmonitoring or maintenance.
Alarm severity—either major (red) or minor(yellow).
Severity
Clicking the alarm subject displays a detailedalarm message.
Brief synopsis of the alarm.Subject
Using the Monitoring Tools ■ 175
Chapter 11: Monitoring the Device and Routing Operations
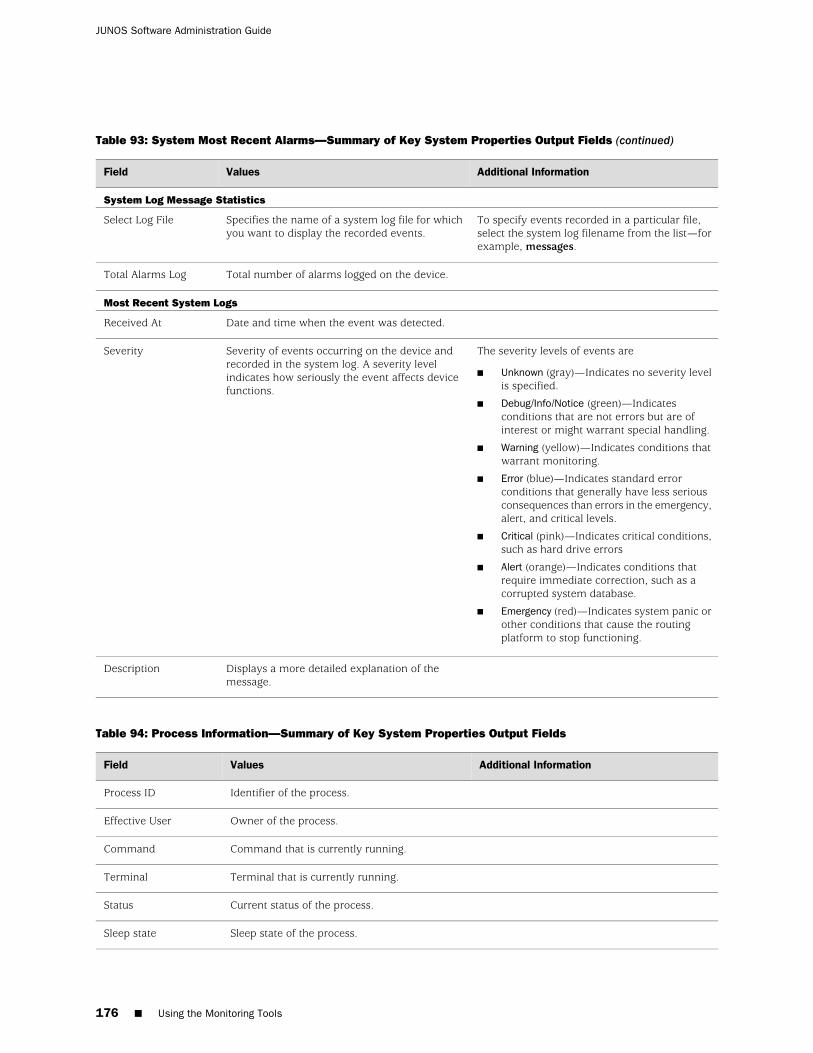
Table 93: System Most Recent Alarms—Summary of Key System Properties Output Fields (continued)
Additional InformationValuesField
System Log Message Statistics
To specify events recorded in a particular file,select the system log filename from the list—forexample, messages.
Specifies the name of a system log file for whichyou want to display the recorded events.
Select Log File
Total number of alarms logged on the device.Total Alarms Log
Most Recent System Logs
Date and time when the event was detected.Received At
The severity levels of events are
■ Unknown (gray)—Indicates no severity levelis specified.
■ Debug/Info/Notice (green)—Indicatesconditions that are not errors but are ofinterest or might warrant special handling.
■ Warning (yellow)—Indicates conditions thatwarrant monitoring.
■ Error (blue)—Indicates standard errorconditions that generally have less seriousconsequences than errors in the emergency,alert, and critical levels.
■ Critical (pink)—Indicates critical conditions,such as hard drive errors
■ Alert (orange)—Indicates conditions thatrequire immediate correction, such as acorrupted system database.
■ Emergency (red)—Indicates system panic orother conditions that cause the routingplatform to stop functioning.
Severity of events occurring on the device andrecorded in the system log. A severity levelindicates how seriously the event affects devicefunctions.
Severity
Displays a more detailed explanation of themessage.
Description
Table 94: Process Information—Summary of Key System Properties Output Fields
Additional InformationValuesField
Identifier of the process.Process ID
Owner of the process.Effective User
Command that is currently running.Command
Terminal that is currently running.Terminal
Current status of the process.Status
Sleep state of the process.Sleep state
176 ■ Using the Monitoring Tools
JUNOS Software Administration Guide
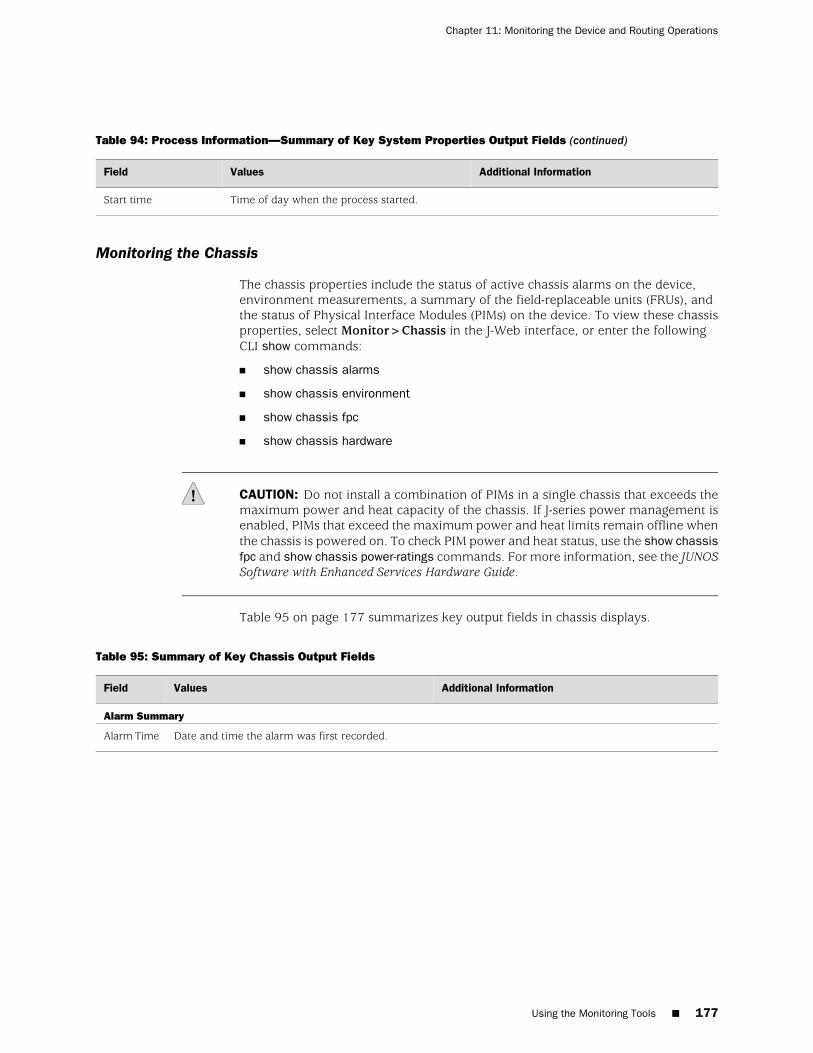
Table 94: Process Information—Summary of Key System Properties Output Fields (continued)
Additional InformationValuesField
Time of day when the process started.Start time
Monitoring the Chassis
The chassis properties include the status of active chassis alarms on the device,environment measurements, a summary of the field-replaceable units (FRUs), andthe status of Physical Interface Modules (PIMs) on the device. To view these chassisproperties, select Monitor>Chassis in the J-Web interface, or enter the followingCLI show commands:
■ show chassis alarms
■ show chassis environment
■ show chassis fpc
■ show chassis hardware
CAUTION: Do not install a combination of PIMs in a single chassis that exceeds themaximum power and heat capacity of the chassis. If J-series power management isenabled, PIMs that exceed the maximum power and heat limits remain offline whenthe chassis is powered on. To check PIM power and heat status, use the show chassisfpc and show chassis power-ratings commands. For more information, see the JUNOSSoftware with Enhanced Services Hardware Guide.
Table 95 on page 177 summarizes key output fields in chassis displays.
Table 95: Summary of Key Chassis Output Fields
Additional InformationValuesField
Alarm Summary
Date and time the alarm was first recorded.Alarm Time
Using the Monitoring Tools ■ 177
Chapter 11: Monitoring the Device and Routing Operations
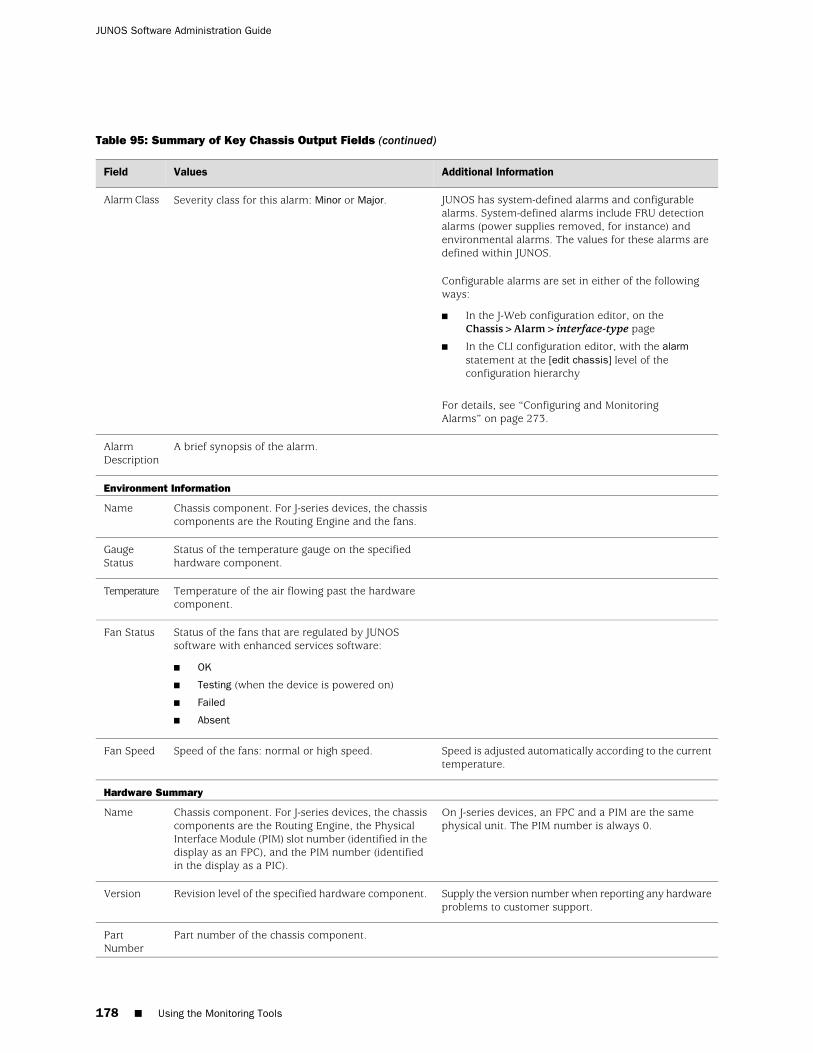
Table 95: Summary of Key Chassis Output Fields (continued)
Additional InformationValuesField
JUNOS has system-defined alarms and configurablealarms. System-defined alarms include FRU detectionalarms (power supplies removed, for instance) andenvironmental alarms. The values for these alarms aredefined within JUNOS.
Configurable alarms are set in either of the followingways:
■ In the J-Web configuration editor, on theChassis>Alarm>interface-type page
■ In the CLI configuration editor, with the alarmstatement at the [edit chassis] level of theconfiguration hierarchy
For details, see “Configuring and MonitoringAlarms” on page 273.
Severity class for this alarm: Minor or Major.Alarm Class
A brief synopsis of the alarm.AlarmDescription
Environment Information
Chassis component. For J-series devices, the chassiscomponents are the Routing Engine and the fans.
Name
Status of the temperature gauge on the specifiedhardware component.
GaugeStatus
Temperature of the air flowing past the hardwarecomponent.
Temperature
Status of the fans that are regulated by JUNOSsoftware with enhanced services software:
■ OK
■ Testing (when the device is powered on)
■ Failed
■ Absent
Fan Status
Speed is adjusted automatically according to the currenttemperature.
Speed of the fans: normal or high speed.Fan Speed
Hardware Summary
On J-series devices, an FPC and a PIM are the samephysical unit. The PIM number is always 0.
Chassis component. For J-series devices, the chassiscomponents are the Routing Engine, the PhysicalInterface Module (PIM) slot number (identified in thedisplay as an FPC), and the PIM number (identifiedin the display as a PIC).
Name
Supply the version number when reporting any hardwareproblems to customer support.
Revision level of the specified hardware component.Version
Part number of the chassis component.PartNumber
178 ■ Using the Monitoring Tools
JUNOS Software Administration Guide
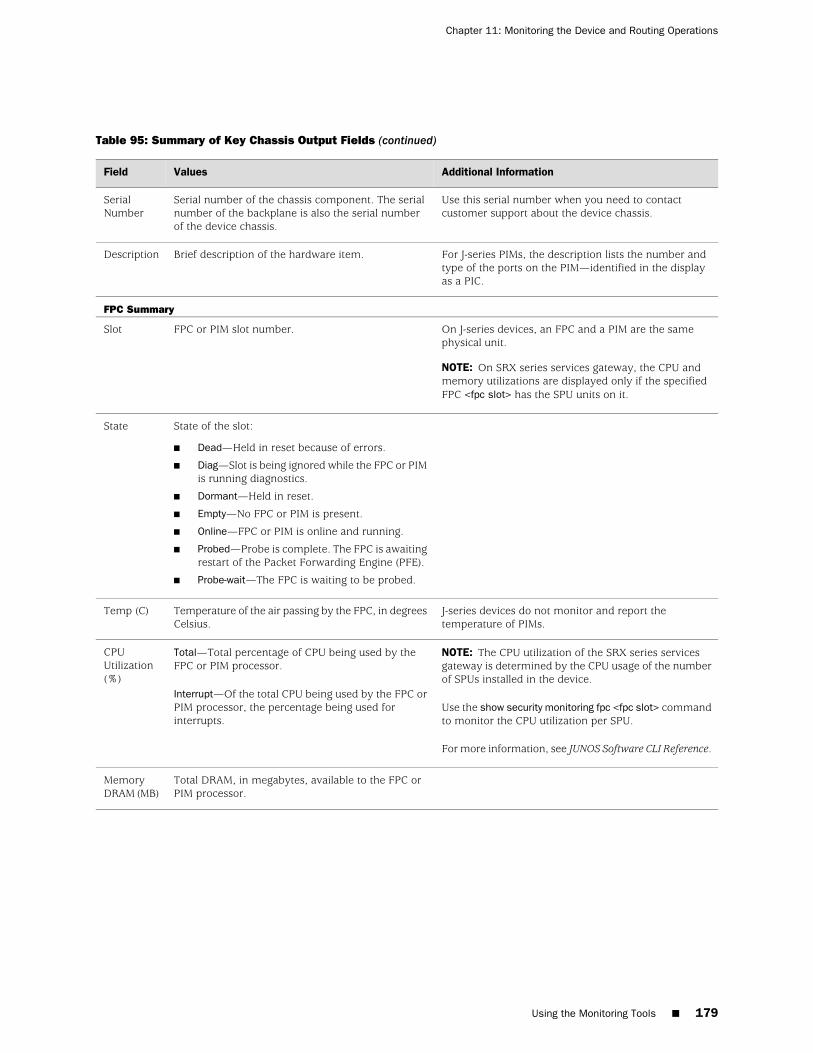
Table 95: Summary of Key Chassis Output Fields (continued)
Additional InformationValuesField
Use this serial number when you need to contactcustomer support about the device chassis.
Serial number of the chassis component. The serialnumber of the backplane is also the serial numberof the device chassis.
SerialNumber
For J-series PIMs, the description lists the number andtype of the ports on the PIM—identified in the displayas a PIC.
Brief description of the hardware item.Description
FPC Summary
On J-series devices, an FPC and a PIM are the samephysical unit.
NOTE: On SRX series services gateway, the CPU andmemory utilizations are displayed only if the specifiedFPC <fpc slot> has the SPU units on it.
FPC or PIM slot number.Slot
State of the slot:
■ Dead—Held in reset because of errors.
■ Diag—Slot is being ignored while the FPC or PIMis running diagnostics.
■ Dormant—Held in reset.
■ Empty—No FPC or PIM is present.
■ Online—FPC or PIM is online and running.
■ Probed—Probe is complete. The FPC is awaitingrestart of the Packet Forwarding Engine (PFE).
■ Probe-wait—The FPC is waiting to be probed.
State
J-series devices do not monitor and report thetemperature of PIMs.
Temperature of the air passing by the FPC, in degreesCelsius.
Temp (C)
NOTE: The CPU utilization of the SRX series servicesgateway is determined by the CPU usage of the numberof SPUs installed in the device.
Use the show security monitoring fpc <fpc slot> commandto monitor the CPU utilization per SPU.
For more information, see JUNOS Software CLI Reference.
Total—Total percentage of CPU being used by theFPC or PIM processor.
Interrupt—Of the total CPU being used by the FPC orPIM processor, the percentage being used forinterrupts.
CPUUtilization(%)
Total DRAM, in megabytes, available to the FPC orPIM processor.
MemoryDRAM (MB)
Using the Monitoring Tools ■ 179
Chapter 11: Monitoring the Device and Routing Operations
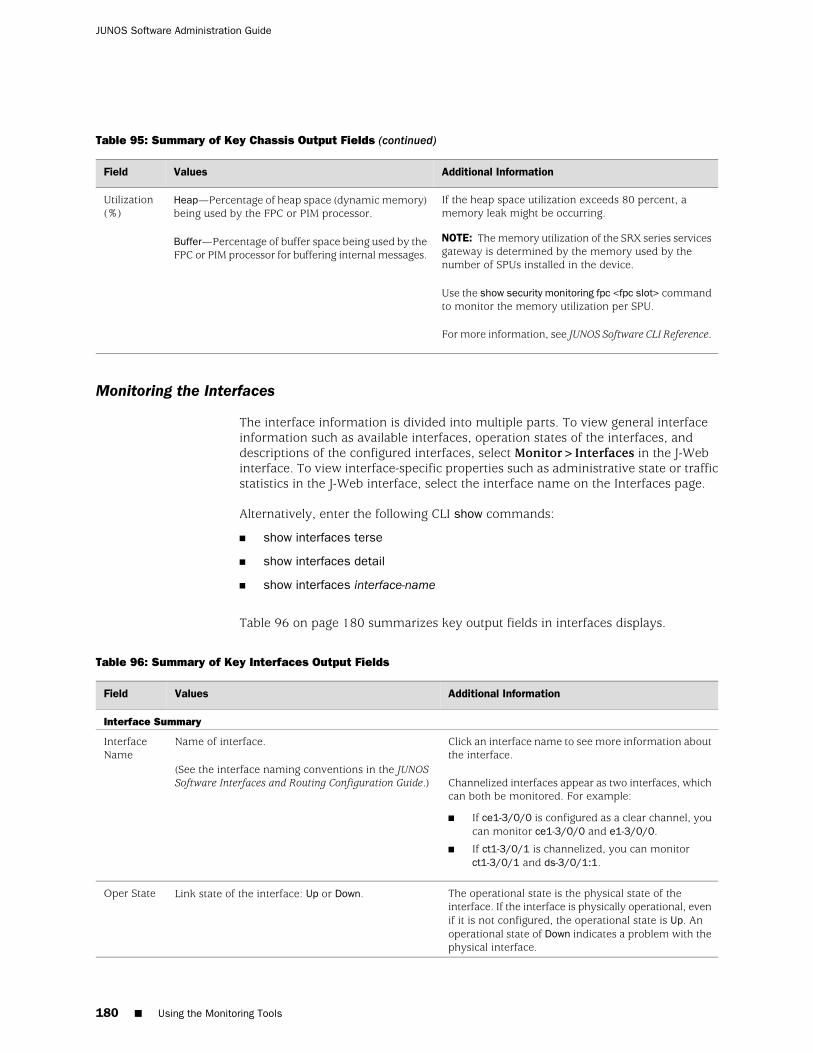
Table 95: Summary of Key Chassis Output Fields (continued)
Additional InformationValuesField
If the heap space utilization exceeds 80 percent, amemory leak might be occurring.
NOTE: The memory utilization of the SRX series servicesgateway is determined by the memory used by thenumber of SPUs installed in the device.
Use the show security monitoring fpc <fpc slot> commandto monitor the memory utilization per SPU.
For more information, see JUNOS Software CLI Reference.
Heap—Percentage of heap space (dynamic memory)being used by the FPC or PIM processor.
Buffer—Percentage of buffer space being used by theFPC or PIM processor for buffering internal messages.
Utilization(%)
Monitoring the Interfaces
The interface information is divided into multiple parts. To view general interfaceinformation such as available interfaces, operation states of the interfaces, anddescriptions of the configured interfaces, select Monitor>Interfaces in the J-Webinterface. To view interface-specific properties such as administrative state or trafficstatistics in the J-Web interface, select the interface name on the Interfaces page.
Alternatively, enter the following CLI show commands:
■ show interfaces terse
■ show interfaces detail
■ show interfaces interface-name
Table 96 on page 180 summarizes key output fields in interfaces displays.
Table 96: Summary of Key Interfaces Output Fields
Additional InformationValuesField
Interface Summary
Click an interface name to see more information aboutthe interface.
Channelized interfaces appear as two interfaces, whichcan both be monitored. For example:
■ If ce1-3/0/0 is configured as a clear channel, youcan monitor ce1-3/0/0 and e1-3/0/0.
■ If ct1-3/0/1 is channelized, you can monitorct1-3/0/1 and ds-3/0/1:1.
Name of interface.
(See the interface naming conventions in the JUNOSSoftware Interfaces and Routing Configuration Guide.)
InterfaceName
The operational state is the physical state of theinterface. If the interface is physically operational, evenif it is not configured, the operational state is Up. Anoperational state of Down indicates a problem with thephysical interface.
Link state of the interface: Up or Down.Oper State
180 ■ Using the Monitoring Tools
JUNOS Software Administration Guide
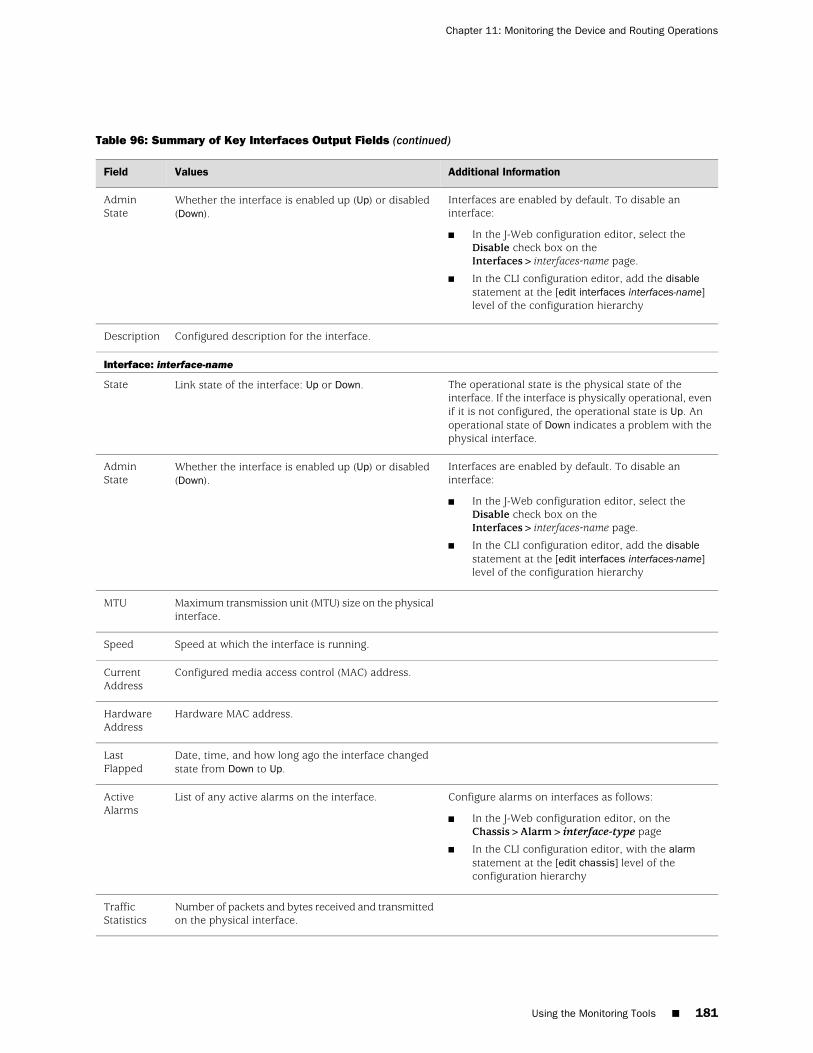
Table 96: Summary of Key Interfaces Output Fields (continued)
Additional InformationValuesField
Interfaces are enabled by default. To disable aninterface:
■ In the J-Web configuration editor, select theDisable check box on theInterfaces>interfaces-name page.
■ In the CLI configuration editor, add the disablestatement at the [edit interfaces interfaces-name]level of the configuration hierarchy
Whether the interface is enabled up (Up) or disabled(Down).
AdminState
Configured description for the interface.Description
Interface: interface-name
The operational state is the physical state of theinterface. If the interface is physically operational, evenif it is not configured, the operational state is Up. Anoperational state of Down indicates a problem with thephysical interface.
Link state of the interface: Up or Down.State
Interfaces are enabled by default. To disable aninterface:
■ In the J-Web configuration editor, select theDisable check box on theInterfaces>interfaces-name page.
■ In the CLI configuration editor, add the disablestatement at the [edit interfaces interfaces-name]level of the configuration hierarchy
Whether the interface is enabled up (Up) or disabled(Down).
AdminState
Maximum transmission unit (MTU) size on the physicalinterface.
MTU
Speed at which the interface is running.Speed
Configured media access control (MAC) address.CurrentAddress
Hardware MAC address.HardwareAddress
Date, time, and how long ago the interface changedstate from Down to Up.
LastFlapped
Configure alarms on interfaces as follows:
■ In the J-Web configuration editor, on theChassis>Alarm>interface-type page
■ In the CLI configuration editor, with the alarmstatement at the [edit chassis] level of theconfiguration hierarchy
List of any active alarms on the interface.ActiveAlarms
Number of packets and bytes received and transmittedon the physical interface.
TrafficStatistics
Using the Monitoring Tools ■ 181
Chapter 11: Monitoring the Device and Routing Operations
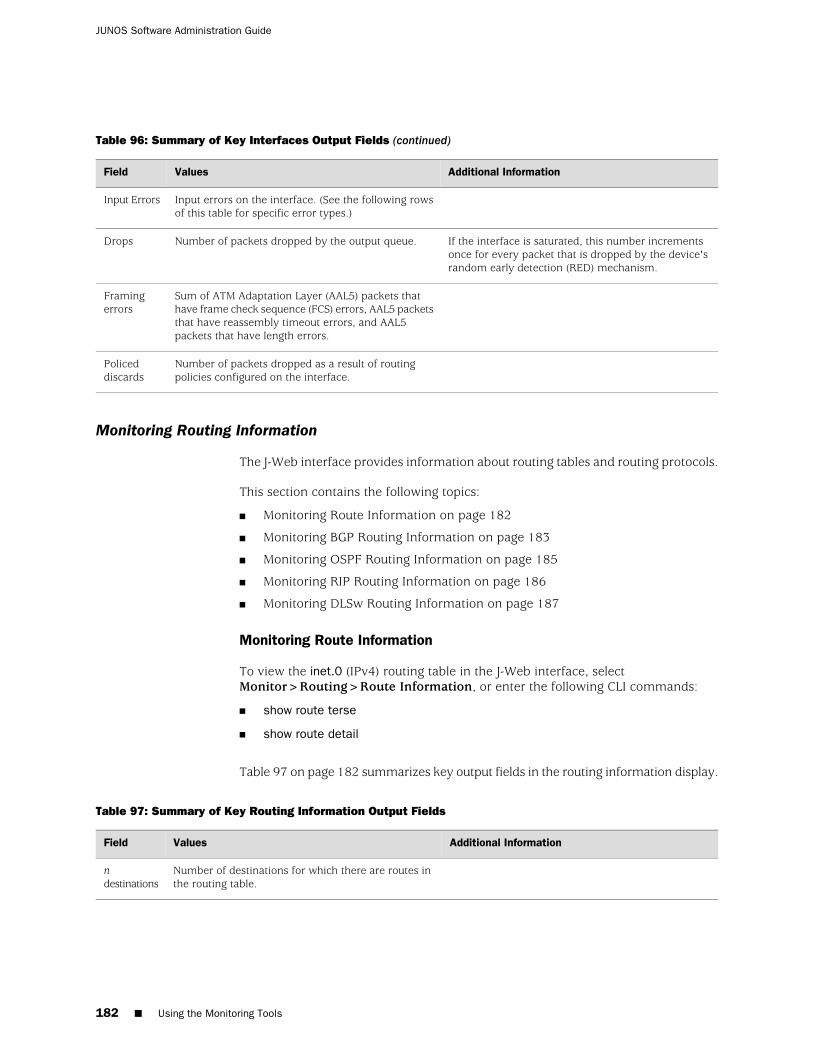
Table 96: Summary of Key Interfaces Output Fields (continued)
Additional InformationValuesField
Input errors on the interface. (See the following rowsof this table for specific error types.)
Input Errors
If the interface is saturated, this number incrementsonce for every packet that is dropped by the device'srandom early detection (RED) mechanism.
Number of packets dropped by the output queue.Drops
Sum of ATM Adaptation Layer (AAL5) packets thathave frame check sequence (FCS) errors, AAL5 packetsthat have reassembly timeout errors, and AAL5packets that have length errors.
Framingerrors
Number of packets dropped as a result of routingpolicies configured on the interface.
Policeddiscards
Monitoring Routing Information
The J-Web interface provides information about routing tables and routing protocols.
This section contains the following topics:
■ Monitoring Route Information on page 182
■ Monitoring BGP Routing Information on page 183
■ Monitoring OSPF Routing Information on page 185
■ Monitoring RIP Routing Information on page 186
■ Monitoring DLSw Routing Information on page 187
Monitoring Route Information
To view the inet.0 (IPv4) routing table in the J-Web interface, selectMonitor>Routing>Route Information, or enter the following CLI commands:
■ show route terse
■ show route detail
Table 97 on page 182 summarizes key output fields in the routing information display.
Table 97: Summary of Key Routing Information Output Fields
Additional InformationValuesField
Number of destinations for which there are routes inthe routing table.
ndestinations
182 ■ Using the Monitoring Tools
JUNOS Software Administration Guide
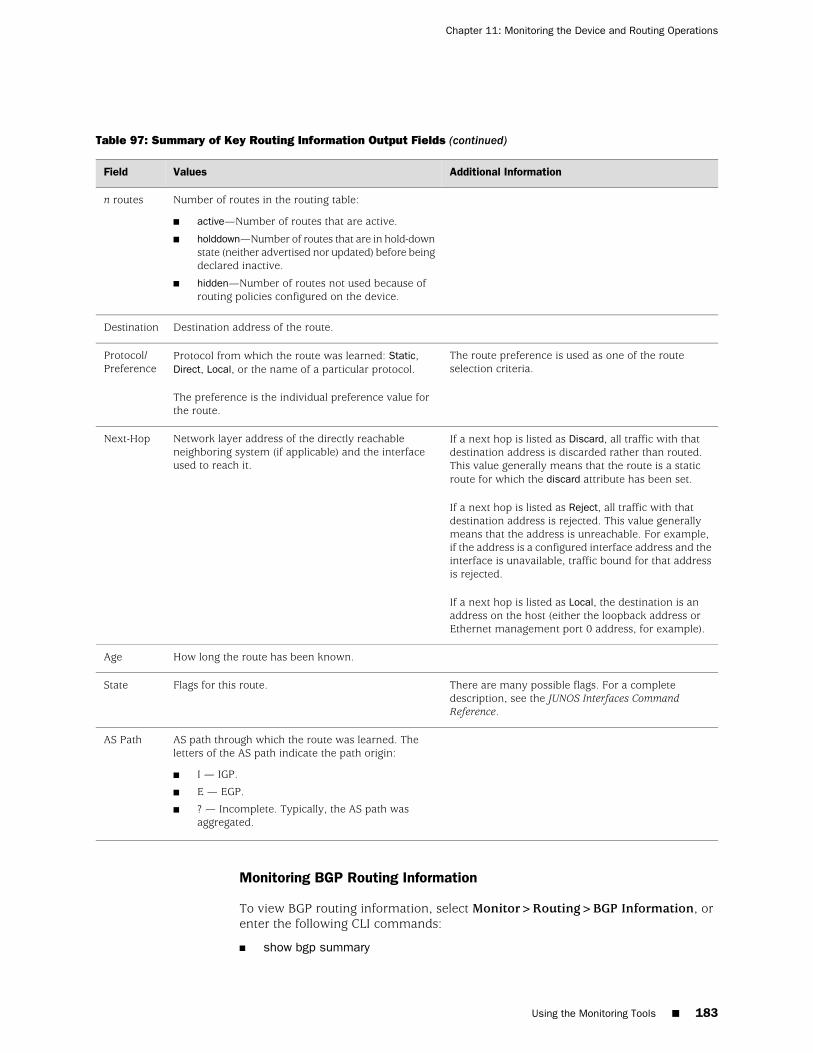
Table 97: Summary of Key Routing Information Output Fields (continued)
Additional InformationValuesField
Number of routes in the routing table:
■ active—Number of routes that are active.
■ holddown—Number of routes that are in hold-downstate (neither advertised nor updated) before beingdeclared inactive.
■ hidden—Number of routes not used because ofrouting policies configured on the device.
n routes
Destination address of the route.Destination
The route preference is used as one of the routeselection criteria.
Protocol from which the route was learned: Static,Direct, Local, or the name of a particular protocol.
The preference is the individual preference value forthe route.
Protocol/Preference
If a next hop is listed as Discard, all traffic with thatdestination address is discarded rather than routed.This value generally means that the route is a staticroute for which the discard attribute has been set.
If a next hop is listed as Reject, all traffic with thatdestination address is rejected. This value generallymeans that the address is unreachable. For example,if the address is a configured interface address and theinterface is unavailable, traffic bound for that addressis rejected.
If a next hop is listed as Local, the destination is anaddress on the host (either the loopback address orEthernet management port 0 address, for example).
Network layer address of the directly reachableneighboring system (if applicable) and the interfaceused to reach it.
Next-Hop
How long the route has been known.Age
There are many possible flags. For a completedescription, see the JUNOS Interfaces CommandReference.
Flags for this route.State
AS path through which the route was learned. Theletters of the AS path indicate the path origin:
■ I — IGP.
■ E — EGP.
■ ? — Incomplete. Typically, the AS path wasaggregated.
AS Path
Monitoring BGP Routing Information
To view BGP routing information, select Monitor>Routing>BGP Information, orenter the following CLI commands:
■ show bgp summary
Using the Monitoring Tools ■ 183
Chapter 11: Monitoring the Device and Routing Operations
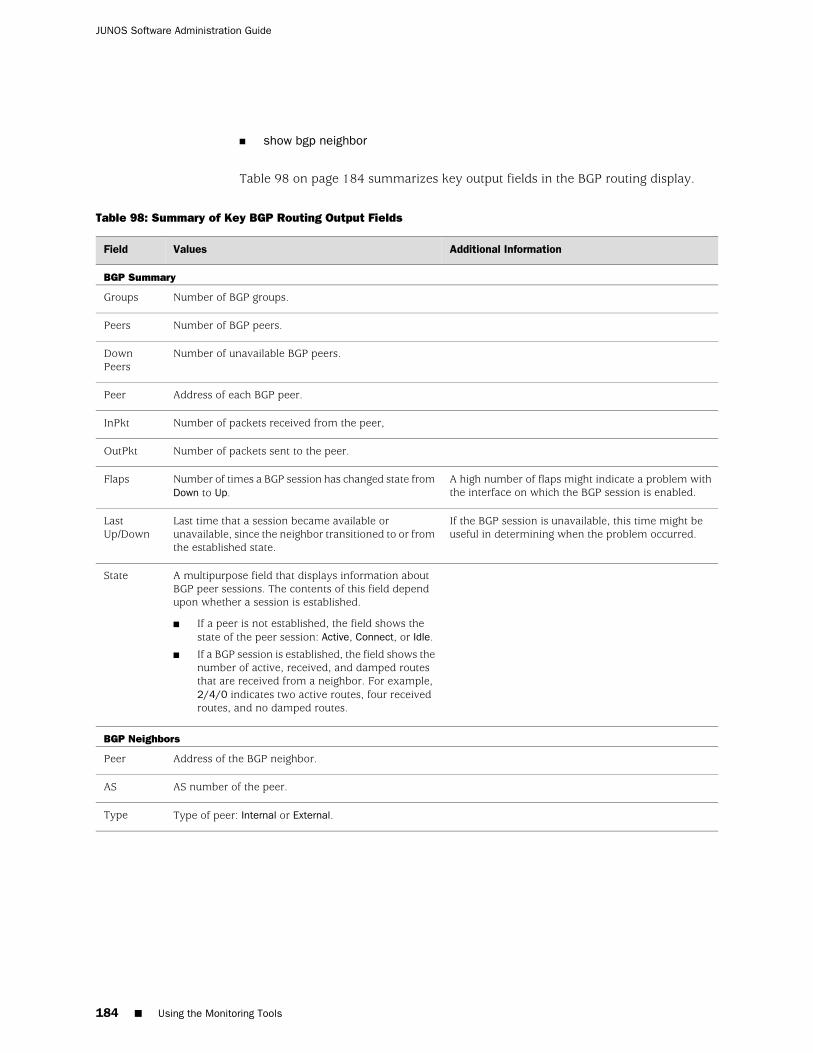
■ show bgp neighbor
Table 98 on page 184 summarizes key output fields in the BGP routing display.
Table 98: Summary of Key BGP Routing Output Fields
Additional InformationValuesField
BGP Summary
Number of BGP groups.Groups
Number of BGP peers.Peers
Number of unavailable BGP peers.DownPeers
Address of each BGP peer.Peer
Number of packets received from the peer,InPkt
Number of packets sent to the peer.OutPkt
A high number of flaps might indicate a problem withthe interface on which the BGP session is enabled.
Number of times a BGP session has changed state fromDown to Up.
Flaps
If the BGP session is unavailable, this time might beuseful in determining when the problem occurred.
Last time that a session became available orunavailable, since the neighbor transitioned to or fromthe established state.
LastUp/Down
A multipurpose field that displays information aboutBGP peer sessions. The contents of this field dependupon whether a session is established.
■ If a peer is not established, the field shows thestate of the peer session: Active, Connect, or Idle.
■ If a BGP session is established, the field shows thenumber of active, received, and damped routesthat are received from a neighbor. For example,2/4/0 indicates two active routes, four receivedroutes, and no damped routes.
State
BGP Neighbors
Address of the BGP neighbor.Peer
AS number of the peer.AS
Type of peer: Internal or External.Type
184 ■ Using the Monitoring Tools
JUNOS Software Administration Guide
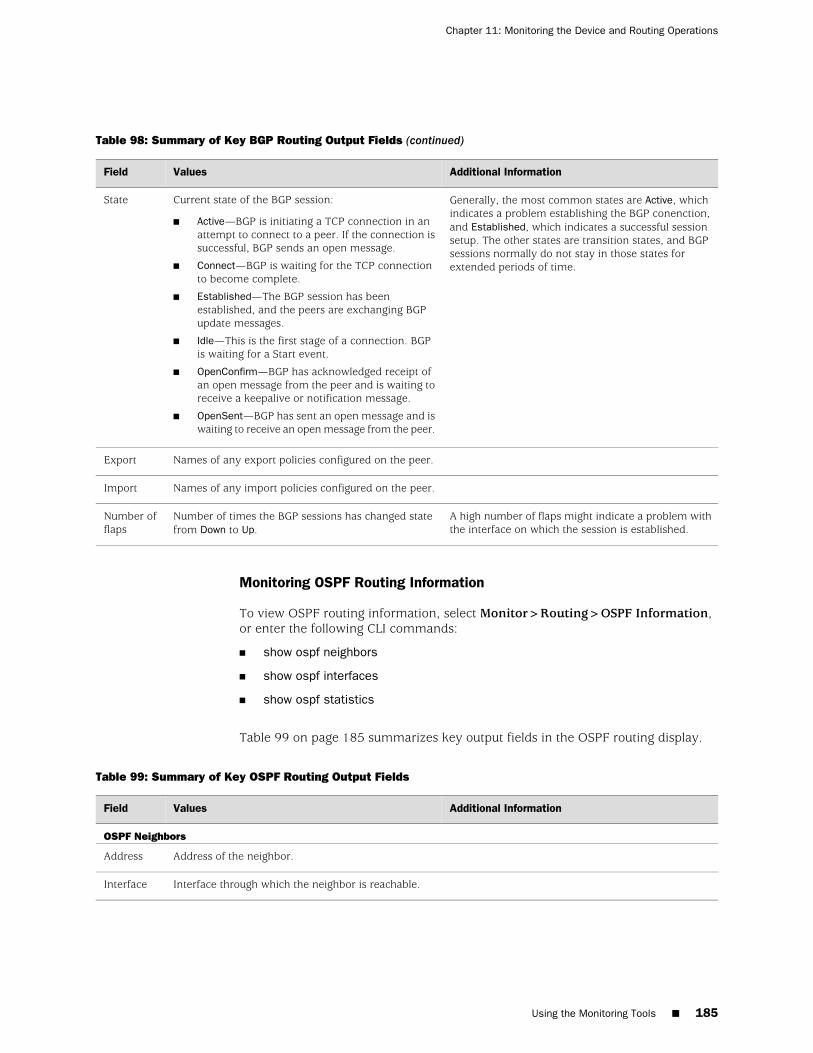
Table 98: Summary of Key BGP Routing Output Fields (continued)
Additional InformationValuesField
Generally, the most common states are Active, whichindicates a problem establishing the BGP conenction,and Established, which indicates a successful sessionsetup. The other states are transition states, and BGPsessions normally do not stay in those states forextended periods of time.
Current state of the BGP session:
■ Active—BGP is initiating a TCP connection in anattempt to connect to a peer. If the connection issuccessful, BGP sends an open message.
■ Connect—BGP is waiting for the TCP connectionto become complete.
■ Established—The BGP session has beenestablished, and the peers are exchanging BGPupdate messages.
■ Idle—This is the first stage of a connection. BGPis waiting for a Start event.
■ OpenConfirm—BGP has acknowledged receipt ofan open message from the peer and is waiting toreceive a keepalive or notification message.
■ OpenSent—BGP has sent an open message and iswaiting to receive an open message from the peer.
State
Names of any export policies configured on the peer.Export
Names of any import policies configured on the peer.Import
A high number of flaps might indicate a problem withthe interface on which the session is established.
Number of times the BGP sessions has changed statefrom Down to Up.
Number offlaps
Monitoring OSPF Routing Information
To view OSPF routing information, select Monitor>Routing>OSPF Information,or enter the following CLI commands:
■ show ospf neighbors
■ show ospf interfaces
■ show ospf statistics
Table 99 on page 185 summarizes key output fields in the OSPF routing display.
Table 99: Summary of Key OSPF Routing Output Fields
Additional InformationValuesField
OSPF Neighbors
Address of the neighbor.Address
Interface through which the neighbor is reachable.Interface
Using the Monitoring Tools ■ 185
Chapter 11: Monitoring the Device and Routing Operations
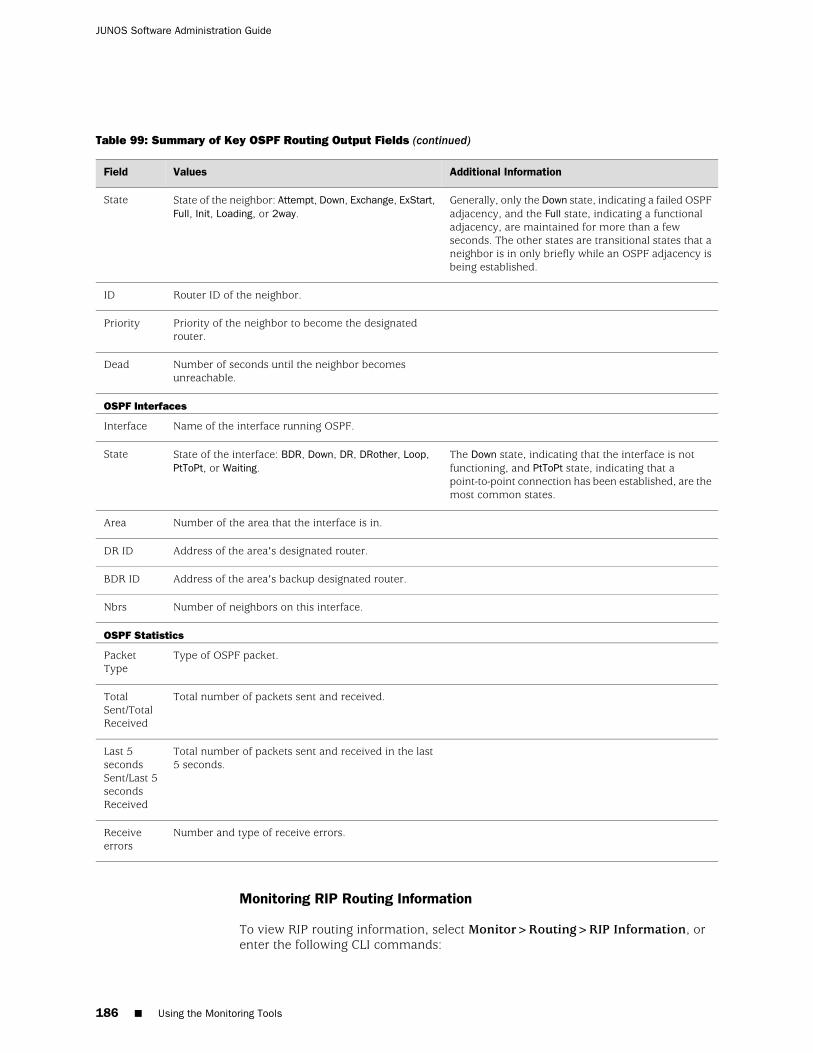
Table 99: Summary of Key OSPF Routing Output Fields (continued)
Additional InformationValuesField
Generally, only the Down state, indicating a failed OSPFadjacency, and the Full state, indicating a functionaladjacency, are maintained for more than a fewseconds. The other states are transitional states that aneighbor is in only briefly while an OSPF adjacency isbeing established.
State of the neighbor: Attempt, Down, Exchange, ExStart,Full, Init, Loading, or 2way.
State
Router ID of the neighbor.ID
Priority of the neighbor to become the designatedrouter.
Priority
Number of seconds until the neighbor becomesunreachable.
Dead
OSPF Interfaces
Name of the interface running OSPF.Interface
The Down state, indicating that the interface is notfunctioning, and PtToPt state, indicating that apoint-to-point connection has been established, are themost common states.
State of the interface: BDR, Down, DR, DRother, Loop,PtToPt, or Waiting.
State
Number of the area that the interface is in.Area
Address of the area's designated router.DR ID
Address of the area's backup designated router.BDR ID
Number of neighbors on this interface.Nbrs
OSPF Statistics
Type of OSPF packet.PacketType
Total number of packets sent and received.TotalSent/TotalReceived
Total number of packets sent and received in the last5 seconds.
Last 5secondsSent/Last 5secondsReceived
Number and type of receive errors.Receiveerrors
Monitoring RIP Routing Information
To view RIP routing information, select Monitor>Routing>RIP Information, orenter the following CLI commands:
186 ■ Using the Monitoring Tools
JUNOS Software Administration Guide
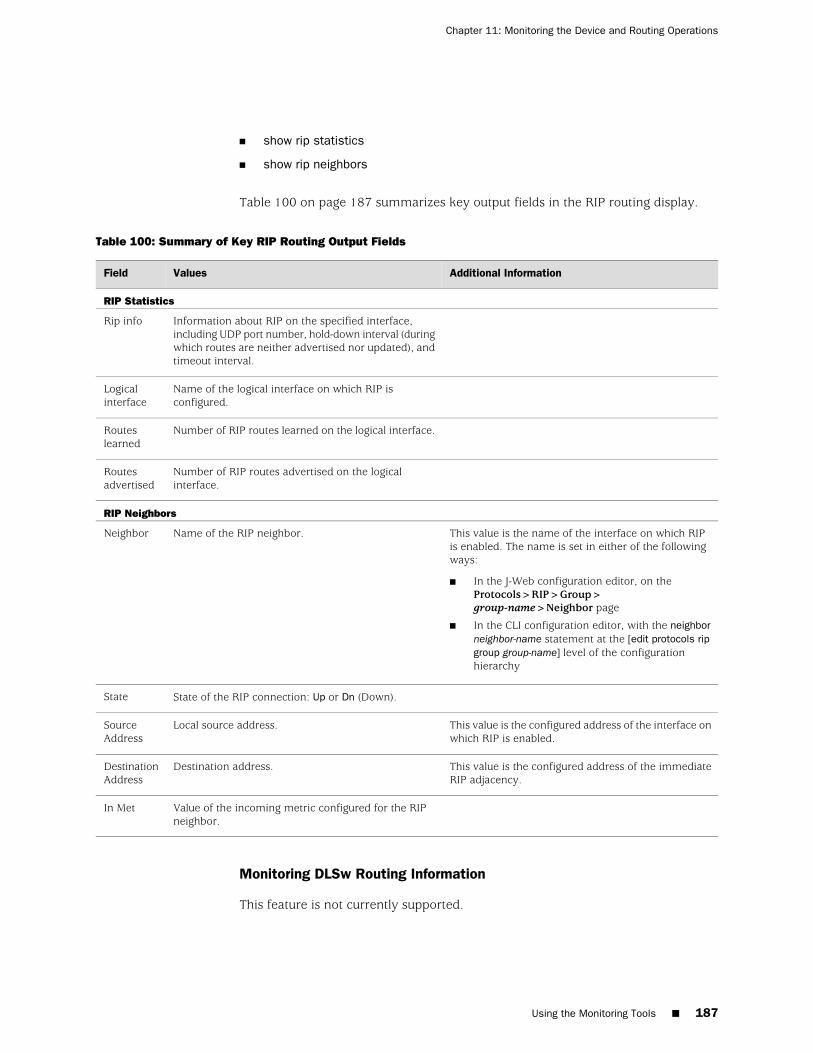
■ show rip statistics
■ show rip neighbors
Table 100 on page 187 summarizes key output fields in the RIP routing display.
Table 100: Summary of Key RIP Routing Output Fields
Additional InformationValuesField
RIP Statistics
Information about RIP on the specified interface,including UDP port number, hold-down interval (duringwhich routes are neither advertised nor updated), andtimeout interval.
Rip info
Name of the logical interface on which RIP isconfigured.
Logicalinterface
Number of RIP routes learned on the logical interface.Routeslearned
Number of RIP routes advertised on the logicalinterface.
Routesadvertised
RIP Neighbors
This value is the name of the interface on which RIPis enabled. The name is set in either of the followingways:
■ In the J-Web configuration editor, on theProtocols>RIP>Group>group-name>Neighbor page
■ In the CLI configuration editor, with the neighborneighbor-name statement at the [edit protocols ripgroup group-name] level of the configurationhierarchy
Name of the RIP neighbor.Neighbor
State of the RIP connection: Up or Dn (Down).State
This value is the configured address of the interface onwhich RIP is enabled.
Local source address.SourceAddress
This value is the configured address of the immediateRIP adjacency.
Destination address.DestinationAddress
Value of the incoming metric configured for the RIPneighbor.
In Met
Monitoring DLSw Routing Information
This feature is not currently supported.
Using the Monitoring Tools ■ 187
Chapter 11: Monitoring the Device and Routing Operations
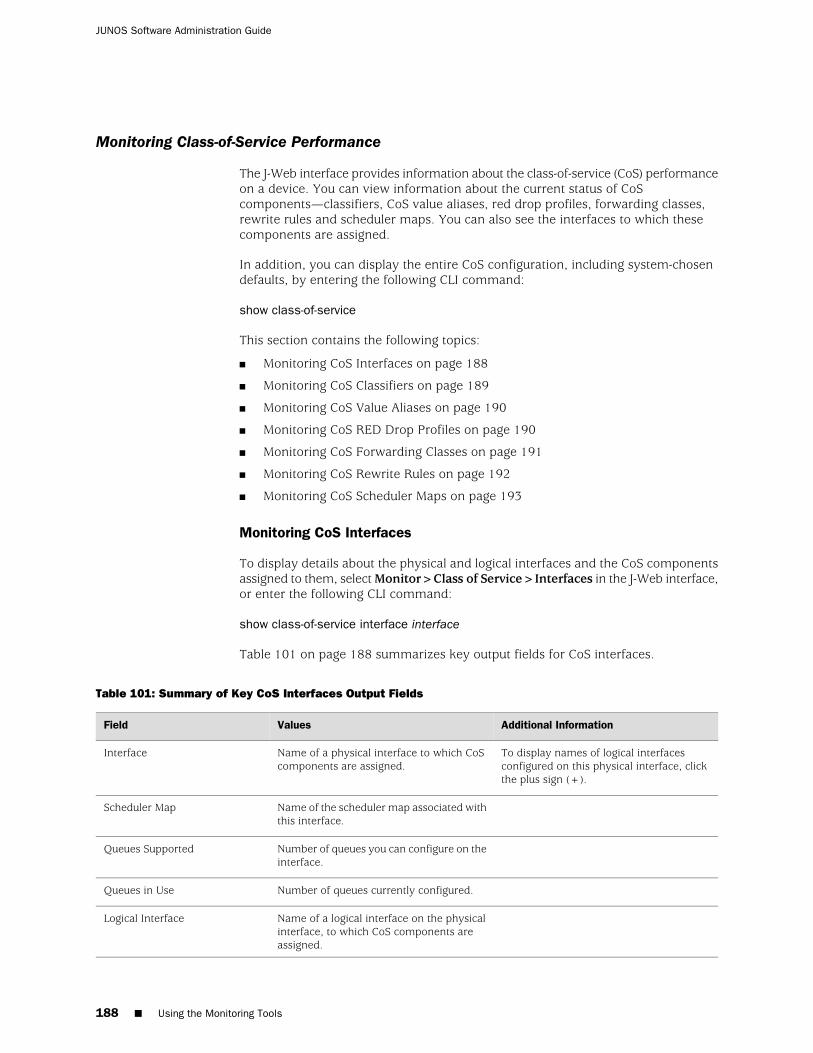
Monitoring Class-of-Service Performance
The J-Web interface provides information about the class-of-service (CoS) performanceon a device. You can view information about the current status of CoScomponents—classifiers, CoS value aliases, red drop profiles, forwarding classes,rewrite rules and scheduler maps. You can also see the interfaces to which thesecomponents are assigned.
In addition, you can display the entire CoS configuration, including system-chosendefaults, by entering the following CLI command:
show class-of-service
This section contains the following topics:
■ Monitoring CoS Interfaces on page 188
■ Monitoring CoS Classifiers on page 189
■ Monitoring CoS Value Aliases on page 190
■ Monitoring CoS RED Drop Profiles on page 190
■ Monitoring CoS Forwarding Classes on page 191
■ Monitoring CoS Rewrite Rules on page 192
■ Monitoring CoS Scheduler Maps on page 193
Monitoring CoS Interfaces
To display details about the physical and logical interfaces and the CoS componentsassigned to them, select Monitor>Class of Service>Interfaces in the J-Web interface,or enter the following CLI command:
show class-of-service interface interface
Table 101 on page 188 summarizes key output fields for CoS interfaces.
Table 101: Summary of Key CoS Interfaces Output Fields
Additional InformationValuesField
To display names of logical interfacesconfigured on this physical interface, clickthe plus sign (+).
Name of a physical interface to which CoScomponents are assigned.
Interface
Name of the scheduler map associated withthis interface.
Scheduler Map
Number of queues you can configure on theinterface.
Queues Supported
Number of queues currently configured.Queues in Use
Name of a logical interface on the physicalinterface, to which CoS components areassigned.
Logical Interface
188 ■ Using the Monitoring Tools
JUNOS Software Administration Guide
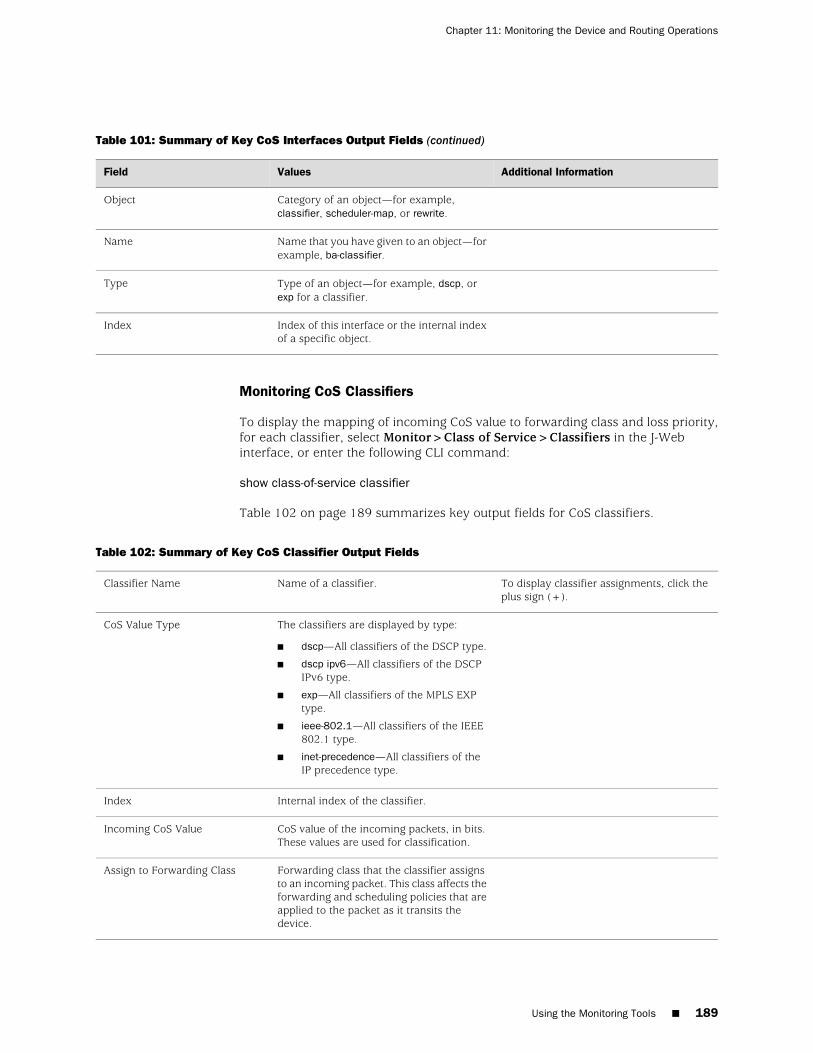
Table 101: Summary of Key CoS Interfaces Output Fields (continued)
Additional InformationValuesField
Category of an object—for example,classifier, scheduler-map, or rewrite.
Object
Name that you have given to an object—forexample, ba-classifier.
Name
Type of an object—for example, dscp, orexp for a classifier.
Type
Index of this interface or the internal indexof a specific object.
Index
Monitoring CoS Classifiers
To display the mapping of incoming CoS value to forwarding class and loss priority,for each classifier, select Monitor>Class of Service>Classifiers in the J-Webinterface, or enter the following CLI command:
show class-of-service classifier
Table 102 on page 189 summarizes key output fields for CoS classifiers.
Table 102: Summary of Key CoS Classifier Output Fields
To display classifier assignments, click theplus sign (+).
Name of a classifier.Classifier Name
The classifiers are displayed by type:
■ dscp—All classifiers of the DSCP type.
■ dscp ipv6—All classifiers of the DSCPIPv6 type.
■ exp—All classifiers of the MPLS EXPtype.
■ ieee-802.1—All classifiers of the IEEE802.1 type.
■ inet-precedence—All classifiers of theIP precedence type.
CoS Value Type
Internal index of the classifier.Index
CoS value of the incoming packets, in bits.These values are used for classification.
Incoming CoS Value
Forwarding class that the classifier assignsto an incoming packet. This class affects theforwarding and scheduling policies that areapplied to the packet as it transits thedevice.
Assign to Forwarding Class
Using the Monitoring Tools ■ 189
Chapter 11: Monitoring the Device and Routing Operations
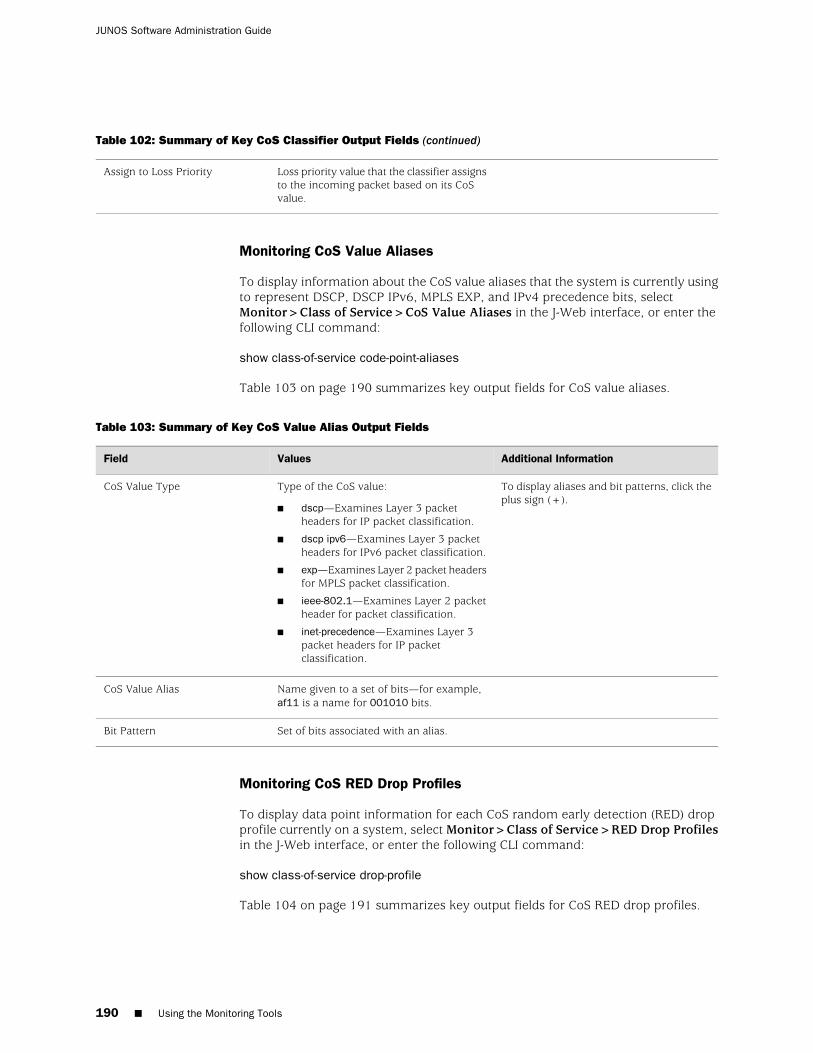
Table 102: Summary of Key CoS Classifier Output Fields (continued)
Loss priority value that the classifier assignsto the incoming packet based on its CoSvalue.
Assign to Loss Priority
Monitoring CoS Value Aliases
To display information about the CoS value aliases that the system is currently usingto represent DSCP, DSCP IPv6, MPLS EXP, and IPv4 precedence bits, selectMonitor>Class of Service>CoS Value Aliases in the J-Web interface, or enter thefollowing CLI command:
show class-of-service code-point-aliases
Table 103 on page 190 summarizes key output fields for CoS value aliases.
Table 103: Summary of Key CoS Value Alias Output Fields
Additional InformationValuesField
To display aliases and bit patterns, click theplus sign (+).
Type of the CoS value:
■ dscp—Examines Layer 3 packetheaders for IP packet classification.
■ dscp ipv6—Examines Layer 3 packetheaders for IPv6 packet classification.
■ exp—Examines Layer 2 packet headersfor MPLS packet classification.
■ ieee-802.1—Examines Layer 2 packetheader for packet classification.
■ inet-precedence—Examines Layer 3packet headers for IP packetclassification.
CoS Value Type
Name given to a set of bits—for example,af11 is a name for 001010 bits.
CoS Value Alias
Set of bits associated with an alias.Bit Pattern
Monitoring CoS RED Drop Profiles
To display data point information for each CoS random early detection (RED) dropprofile currently on a system, select Monitor>Class of Service>RED Drop Profilesin the J-Web interface, or enter the following CLI command:
show class-of-service drop-profile
Table 104 on page 191 summarizes key output fields for CoS RED drop profiles.
190 ■ Using the Monitoring Tools
JUNOS Software Administration Guide
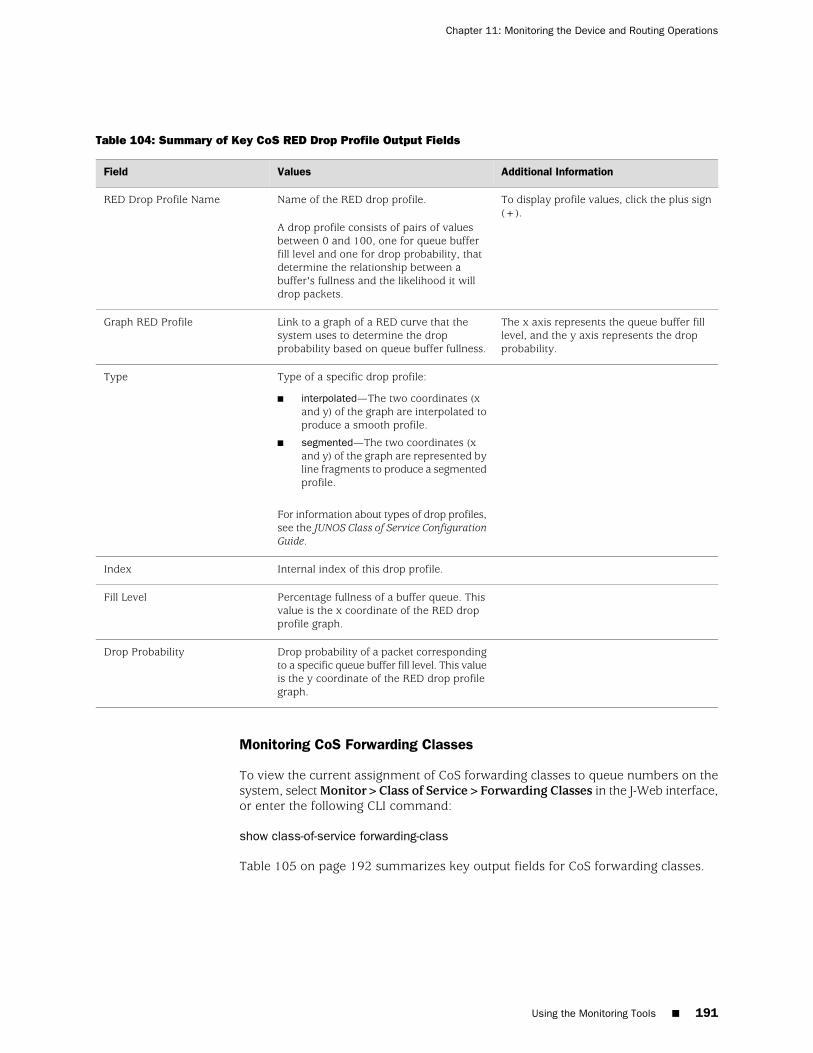
Table 104: Summary of Key CoS RED Drop Profile Output Fields
Additional InformationValuesField
To display profile values, click the plus sign(+).
Name of the RED drop profile.
A drop profile consists of pairs of valuesbetween 0 and 100, one for queue bufferfill level and one for drop probability, thatdetermine the relationship between abuffer's fullness and the likelihood it willdrop packets.
RED Drop Profile Name
The x axis represents the queue buffer filllevel, and the y axis represents the dropprobability.
Link to a graph of a RED curve that thesystem uses to determine the dropprobability based on queue buffer fullness.
Graph RED Profile
Type of a specific drop profile:
■ interpolated—The two coordinates (xand y) of the graph are interpolated toproduce a smooth profile.
■ segmented—The two coordinates (xand y) of the graph are represented byline fragments to produce a segmentedprofile.
For information about types of drop profiles,see the JUNOS Class of Service ConfigurationGuide.
Type
Internal index of this drop profile.Index
Percentage fullness of a buffer queue. Thisvalue is the x coordinate of the RED dropprofile graph.
Fill Level
Drop probability of a packet correspondingto a specific queue buffer fill level. This valueis the y coordinate of the RED drop profilegraph.
Drop Probability
Monitoring CoS Forwarding Classes
To view the current assignment of CoS forwarding classes to queue numbers on thesystem, select Monitor>Class of Service>Forwarding Classes in the J-Web interface,or enter the following CLI command:
show class-of-service forwarding-class
Table 105 on page 192 summarizes key output fields for CoS forwarding classes.
Using the Monitoring Tools ■ 191
Chapter 11: Monitoring the Device and Routing Operations
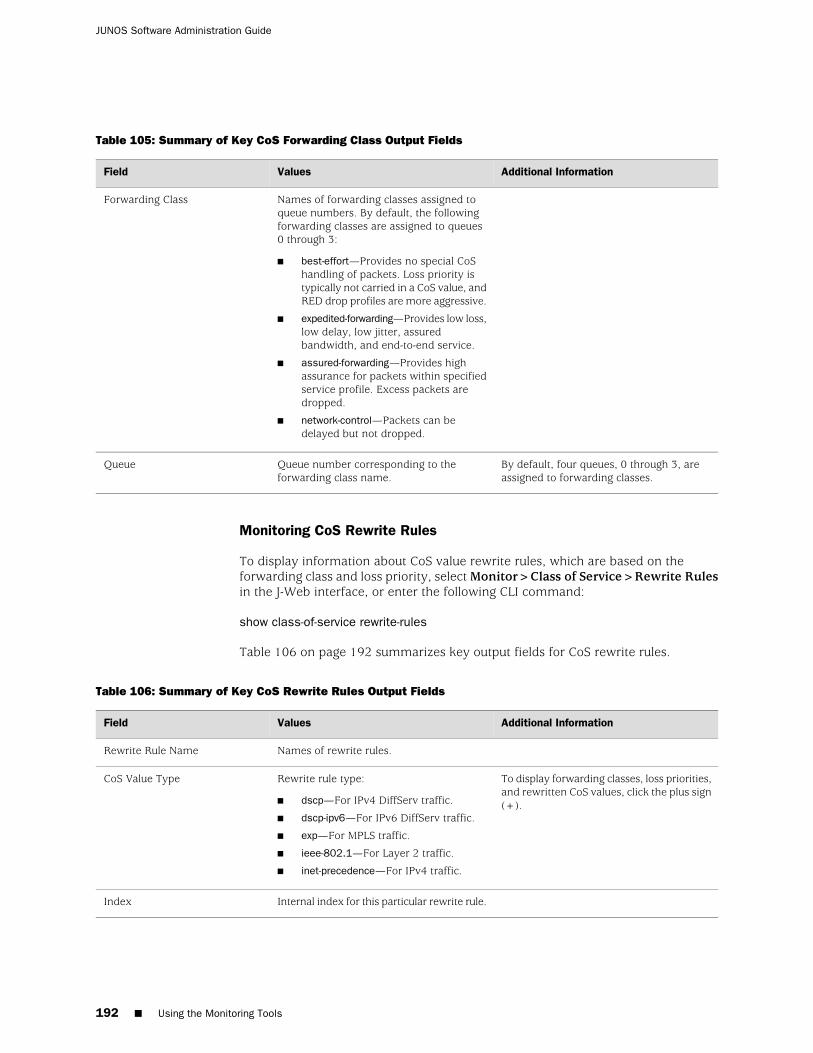
Table 105: Summary of Key CoS Forwarding Class Output Fields
Additional InformationValuesField
Names of forwarding classes assigned toqueue numbers. By default, the followingforwarding classes are assigned to queues0 through 3:
■ best-effort—Provides no special CoShandling of packets. Loss priority istypically not carried in a CoS value, andRED drop profiles are more aggressive.
■ expedited-forwarding—Provides low loss,low delay, low jitter, assuredbandwidth, and end-to-end service.
■ assured-forwarding—Provides highassurance for packets within specifiedservice profile. Excess packets aredropped.
■ network-control—Packets can bedelayed but not dropped.
Forwarding Class
By default, four queues, 0 through 3, areassigned to forwarding classes.
Queue number corresponding to theforwarding class name.
Queue
Monitoring CoS Rewrite Rules
To display information about CoS value rewrite rules, which are based on theforwarding class and loss priority, select Monitor>Class of Service>Rewrite Rulesin the J-Web interface, or enter the following CLI command:
show class-of-service rewrite-rules
Table 106 on page 192 summarizes key output fields for CoS rewrite rules.
Table 106: Summary of Key CoS Rewrite Rules Output Fields
Additional InformationValuesField
Names of rewrite rules.Rewrite Rule Name
To display forwarding classes, loss priorities,and rewritten CoS values, click the plus sign(+).
Rewrite rule type:
■ dscp—For IPv4 DiffServ traffic.
■ dscp-ipv6—For IPv6 DiffServ traffic.
■ exp—For MPLS traffic.
■ ieee-802.1—For Layer 2 traffic.
■ inet-precedence—For IPv4 traffic.
CoS Value Type
Internal index for this particular rewrite rule.Index
192 ■ Using the Monitoring Tools
JUNOS Software Administration Guide
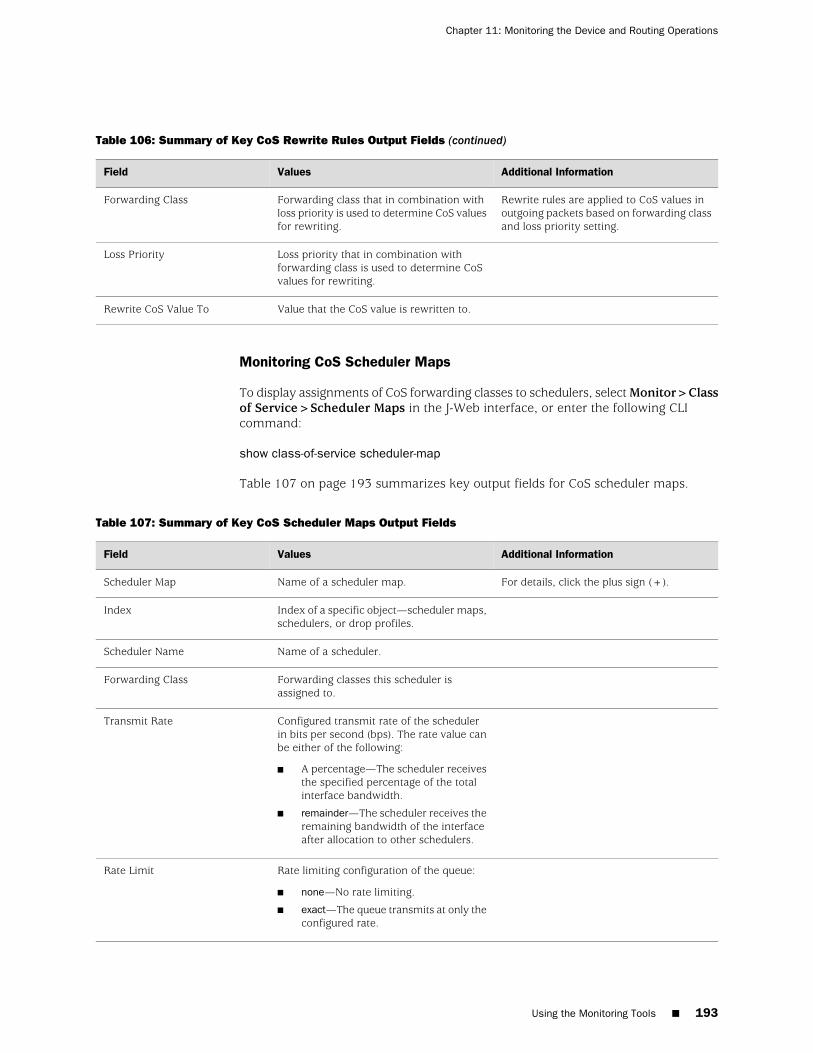
Table 106: Summary of Key CoS Rewrite Rules Output Fields (continued)
Additional InformationValuesField
Rewrite rules are applied to CoS values inoutgoing packets based on forwarding classand loss priority setting.
Forwarding class that in combination withloss priority is used to determine CoS valuesfor rewriting.
Forwarding Class
Loss priority that in combination withforwarding class is used to determine CoSvalues for rewriting.
Loss Priority
Value that the CoS value is rewritten to.Rewrite CoS Value To
Monitoring CoS Scheduler Maps
To display assignments of CoS forwarding classes to schedulers, select Monitor>Classof Service>Scheduler Maps in the J-Web interface, or enter the following CLIcommand:
show class-of-service scheduler-map
Table 107 on page 193 summarizes key output fields for CoS scheduler maps.
Table 107: Summary of Key CoS Scheduler Maps Output Fields
Additional InformationValuesField
For details, click the plus sign (+).Name of a scheduler map.Scheduler Map
Index of a specific object—scheduler maps,schedulers, or drop profiles.
Index
Name of a scheduler.Scheduler Name
Forwarding classes this scheduler isassigned to.
Forwarding Class
Configured transmit rate of the schedulerin bits per second (bps). The rate value canbe either of the following:
■ A percentage—The scheduler receivesthe specified percentage of the totalinterface bandwidth.
■ remainder—The scheduler receives theremaining bandwidth of the interfaceafter allocation to other schedulers.
Transmit Rate
Rate limiting configuration of the queue:
■ none—No rate limiting.
■ exact—The queue transmits at only theconfigured rate.
Rate Limit
Using the Monitoring Tools ■ 193
Chapter 11: Monitoring the Device and Routing Operations
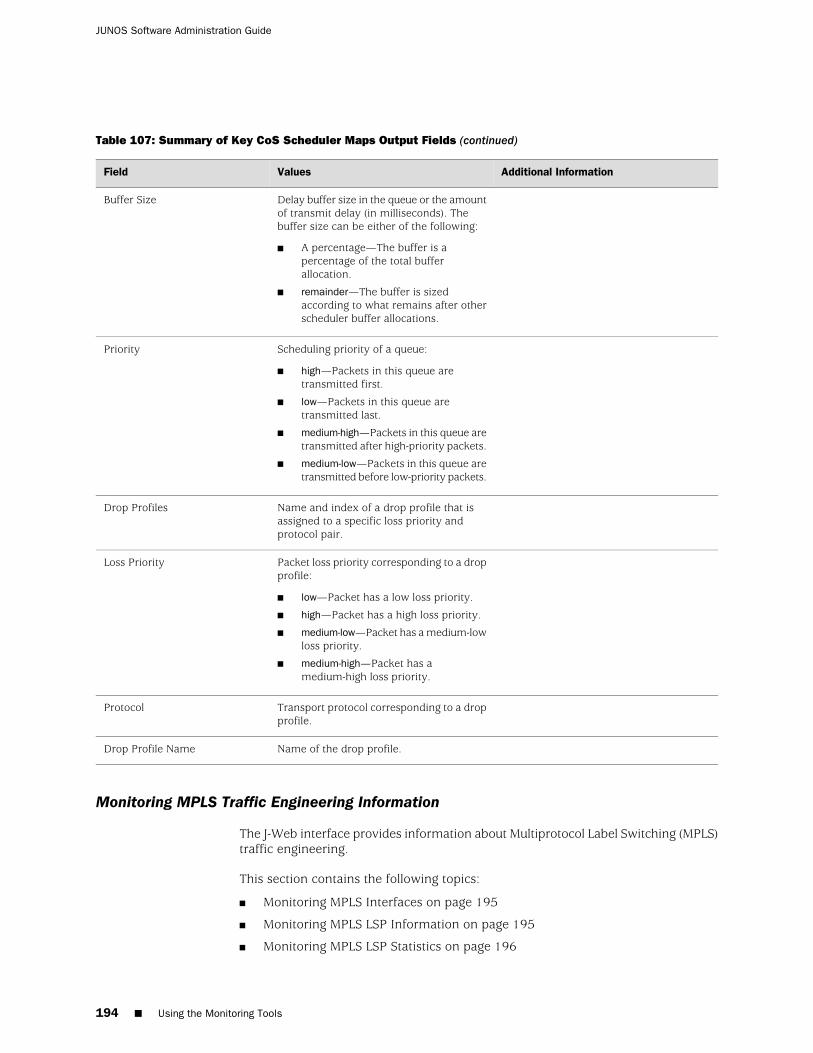
Table 107: Summary of Key CoS Scheduler Maps Output Fields (continued)
Additional InformationValuesField
Delay buffer size in the queue or the amountof transmit delay (in milliseconds). Thebuffer size can be either of the following:
■ A percentage—The buffer is apercentage of the total bufferallocation.
■ remainder—The buffer is sizedaccording to what remains after otherscheduler buffer allocations.
Buffer Size
Scheduling priority of a queue:
■ high—Packets in this queue aretransmitted first.
■ low—Packets in this queue aretransmitted last.
■ medium-high—Packets in this queue aretransmitted after high-priority packets.
■ medium-low—Packets in this queue aretransmitted before low-priority packets.
Priority
Name and index of a drop profile that isassigned to a specific loss priority andprotocol pair.
Drop Profiles
Packet loss priority corresponding to a dropprofile:
■ low—Packet has a low loss priority.
■ high—Packet has a high loss priority.
■ medium-low—Packet has a medium-lowloss priority.
■ medium-high—Packet has amedium-high loss priority.
Loss Priority
Transport protocol corresponding to a dropprofile.
Protocol
Name of the drop profile.Drop Profile Name
Monitoring MPLS Traffic Engineering Information
The J-Web interface provides information about Multiprotocol Label Switching (MPLS)traffic engineering.
This section contains the following topics:
■ Monitoring MPLS Interfaces on page 195
■ Monitoring MPLS LSP Information on page 195
■ Monitoring MPLS LSP Statistics on page 196
194 ■ Using the Monitoring Tools
JUNOS Software Administration Guide
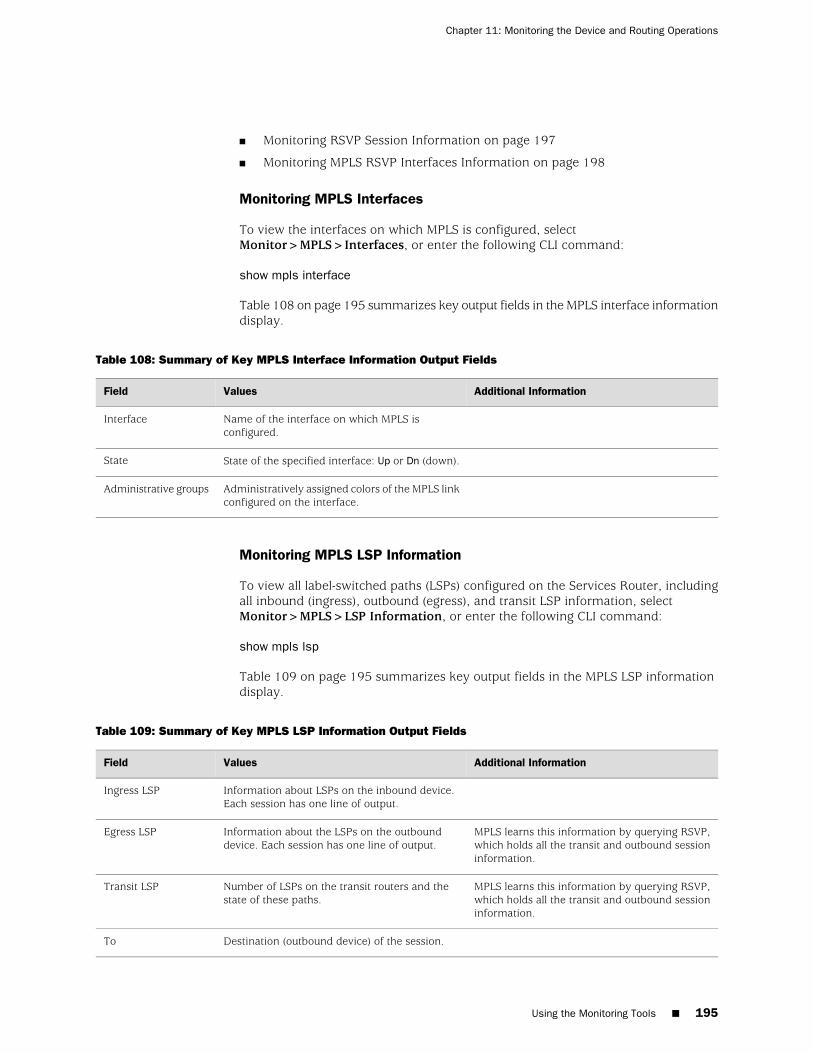
■ Monitoring RSVP Session Information on page 197
■ Monitoring MPLS RSVP Interfaces Information on page 198
Monitoring MPLS Interfaces
To view the interfaces on which MPLS is configured, selectMonitor>MPLS>Interfaces, or enter the following CLI command:
show mpls interface
Table 108 on page 195 summarizes key output fields in the MPLS interface informationdisplay.
Table 108: Summary of Key MPLS Interface Information Output Fields
Additional InformationValuesField
Name of the interface on which MPLS isconfigured.
Interface
State of the specified interface: Up or Dn (down).State
Administratively assigned colors of the MPLS linkconfigured on the interface.
Administrative groups
Monitoring MPLS LSP Information
To view all label-switched paths (LSPs) configured on the Services Router, includingall inbound (ingress), outbound (egress), and transit LSP information, selectMonitor>MPLS>LSP Information, or enter the following CLI command:
show mpls lsp
Table 109 on page 195 summarizes key output fields in the MPLS LSP informationdisplay.
Table 109: Summary of Key MPLS LSP Information Output Fields
Additional InformationValuesField
Information about LSPs on the inbound device.Each session has one line of output.
Ingress LSP
MPLS learns this information by querying RSVP,which holds all the transit and outbound sessioninformation.
Information about the LSPs on the outbounddevice. Each session has one line of output.
Egress LSP
MPLS learns this information by querying RSVP,which holds all the transit and outbound sessioninformation.
Number of LSPs on the transit routers and thestate of these paths.
Transit LSP
Destination (outbound device) of the session.To
Using the Monitoring Tools ■ 195
Chapter 11: Monitoring the Device and Routing Operations
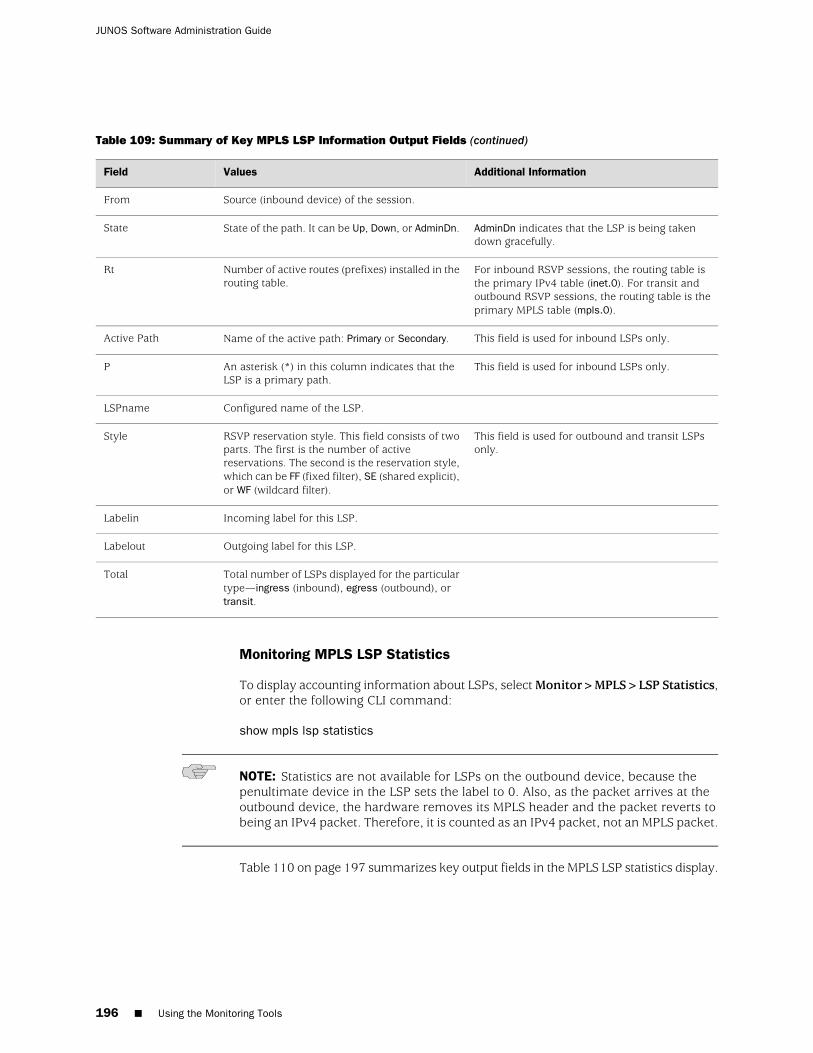
Table 109: Summary of Key MPLS LSP Information Output Fields (continued)
Additional InformationValuesField
Source (inbound device) of the session.From
AdminDn indicates that the LSP is being takendown gracefully.
State of the path. It can be Up, Down, or AdminDn.State
For inbound RSVP sessions, the routing table isthe primary IPv4 table (inet.0). For transit andoutbound RSVP sessions, the routing table is theprimary MPLS table (mpls.0).
Number of active routes (prefixes) installed in therouting table.
Rt
This field is used for inbound LSPs only.Name of the active path: Primary or Secondary.Active Path
This field is used for inbound LSPs only.An asterisk (*) in this column indicates that theLSP is a primary path.
P
Configured name of the LSP.LSPname
This field is used for outbound and transit LSPsonly.
RSVP reservation style. This field consists of twoparts. The first is the number of activereservations. The second is the reservation style,which can be FF (fixed filter), SE (shared explicit),or WF (wildcard filter).
Style
Incoming label for this LSP.Labelin
Outgoing label for this LSP.Labelout
Total number of LSPs displayed for the particulartype—ingress (inbound), egress (outbound), ortransit.
Total
Monitoring MPLS LSP Statistics
To display accounting information about LSPs, select Monitor>MPLS>LSP Statistics,or enter the following CLI command:
show mpls lsp statistics
NOTE: Statistics are not available for LSPs on the outbound device, because thepenultimate device in the LSP sets the label to 0. Also, as the packet arrives at theoutbound device, the hardware removes its MPLS header and the packet reverts tobeing an IPv4 packet. Therefore, it is counted as an IPv4 packet, not an MPLS packet.
Table 110 on page 197 summarizes key output fields in the MPLS LSP statistics display.
196 ■ Using the Monitoring Tools
JUNOS Software Administration Guide
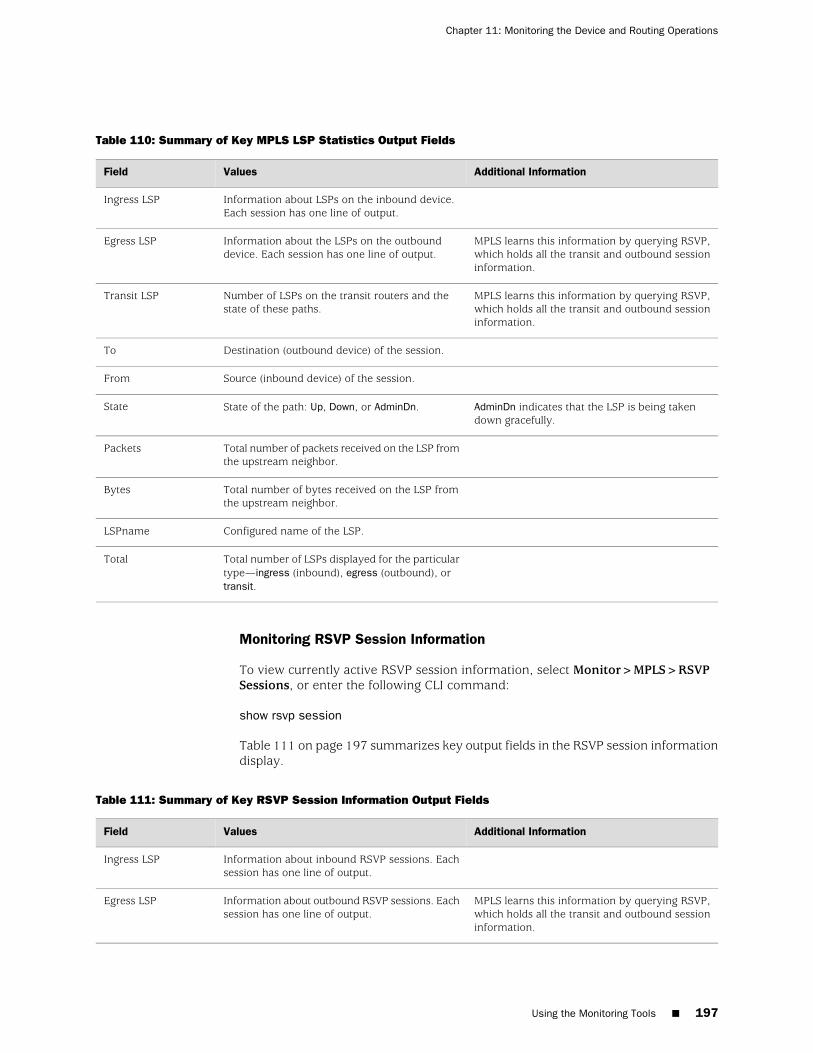
Table 110: Summary of Key MPLS LSP Statistics Output Fields
Additional InformationValuesField
Information about LSPs on the inbound device.Each session has one line of output.
Ingress LSP
MPLS learns this information by querying RSVP,which holds all the transit and outbound sessioninformation.
Information about the LSPs on the outbounddevice. Each session has one line of output.
Egress LSP
MPLS learns this information by querying RSVP,which holds all the transit and outbound sessioninformation.
Number of LSPs on the transit routers and thestate of these paths.
Transit LSP
Destination (outbound device) of the session.To
Source (inbound device) of the session.From
AdminDn indicates that the LSP is being takendown gracefully.
State of the path: Up, Down, or AdminDn.State
Total number of packets received on the LSP fromthe upstream neighbor.
Packets
Total number of bytes received on the LSP fromthe upstream neighbor.
Bytes
Configured name of the LSP.LSPname
Total number of LSPs displayed for the particulartype—ingress (inbound), egress (outbound), ortransit.
Total
Monitoring RSVP Session Information
To view currently active RSVP session information, select Monitor>MPLS>RSVPSessions, or enter the following CLI command:
show rsvp session
Table 111 on page 197 summarizes key output fields in the RSVP session informationdisplay.
Table 111: Summary of Key RSVP Session Information Output Fields
Additional InformationValuesField
Information about inbound RSVP sessions. Eachsession has one line of output.
Ingress LSP
MPLS learns this information by querying RSVP,which holds all the transit and outbound sessioninformation.
Information about outbound RSVP sessions. Eachsession has one line of output.
Egress LSP
Using the Monitoring Tools ■ 197
Chapter 11: Monitoring the Device and Routing Operations
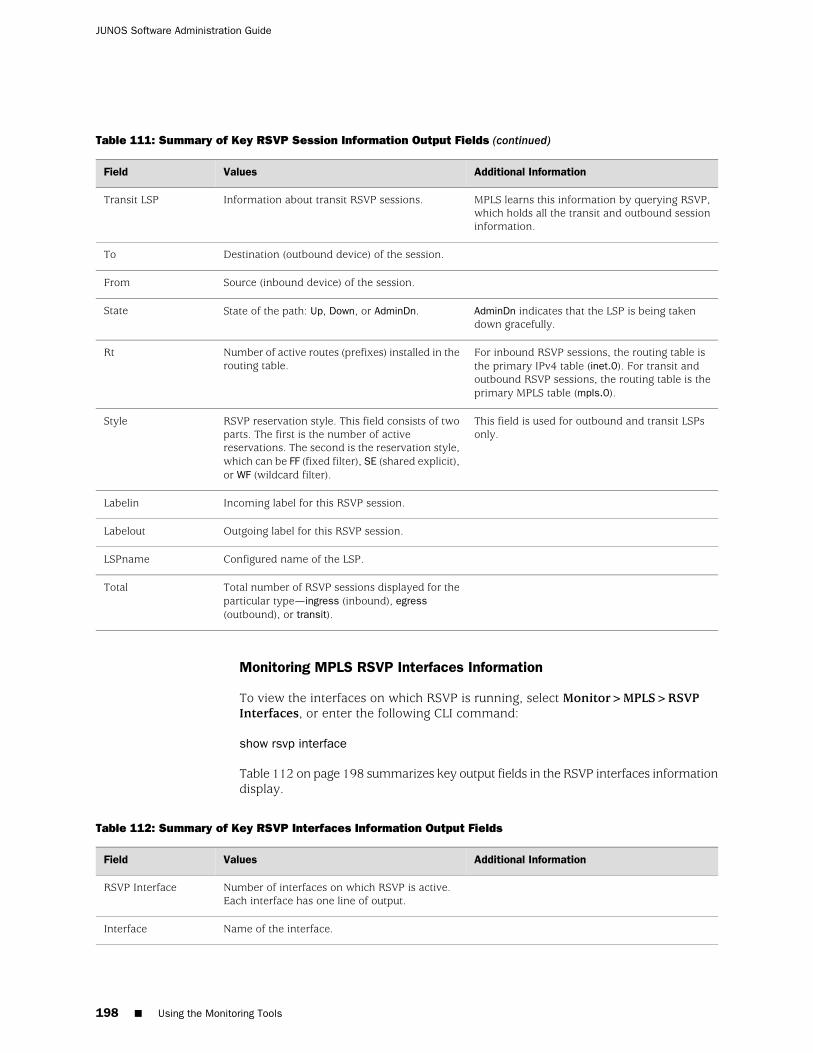
Table 111: Summary of Key RSVP Session Information Output Fields (continued)
Additional InformationValuesField
MPLS learns this information by querying RSVP,which holds all the transit and outbound sessioninformation.
Information about transit RSVP sessions.Transit LSP
Destination (outbound device) of the session.To
Source (inbound device) of the session.From
AdminDn indicates that the LSP is being takendown gracefully.
State of the path: Up, Down, or AdminDn.State
For inbound RSVP sessions, the routing table isthe primary IPv4 table (inet.0). For transit andoutbound RSVP sessions, the routing table is theprimary MPLS table (mpls.0).
Number of active routes (prefixes) installed in therouting table.
Rt
This field is used for outbound and transit LSPsonly.
RSVP reservation style. This field consists of twoparts. The first is the number of activereservations. The second is the reservation style,which can be FF (fixed filter), SE (shared explicit),or WF (wildcard filter).
Style
Incoming label for this RSVP session.Labelin
Outgoing label for this RSVP session.Labelout
Configured name of the LSP.LSPname
Total number of RSVP sessions displayed for theparticular type—ingress (inbound), egress(outbound), or transit).
Total
Monitoring MPLS RSVP Interfaces Information
To view the interfaces on which RSVP is running, select Monitor>MPLS>RSVPInterfaces, or enter the following CLI command:
show rsvp interface
Table 112 on page 198 summarizes key output fields in the RSVP interfaces informationdisplay.
Table 112: Summary of Key RSVP Interfaces Information Output Fields
Additional InformationValuesField
Number of interfaces on which RSVP is active.Each interface has one line of output.
RSVP Interface
Name of the interface.Interface
198 ■ Using the Monitoring Tools
JUNOS Software Administration Guide

Table 112: Summary of Key RSVP Interfaces Information Output Fields (continued)
Additional InformationValuesField
State of the interface:
■ Disabled—No traffic engineering informationis displayed.
■ Down—The interface is not operational.
■ Enabled—Displays traffic engineeringinformation.
■ Up—The interface is operational.
State
Number of reservations that are actively reservingbandwidth on the interface.
Active resv
User-configured subscription factor.Subscription
Total interface bandwidth, in bits per second(bps).
Static BW
Amount of bandwidth that RSVP is allowed toreserve, in bits per second (bps). It is equal to(static bandwidth X subscription factor).
Available BW
Currently reserved bandwidth, in bits per second(bps).
Reserved BW
Highest bandwidth that has ever been reservedon this interface, in bits per second (bps).
Highwater mark
Monitoring RPM Probes
The RPM information includes the round-trip time, jitter, and standard deviationvalues for each configured RPM test on the Services Router. To view these RPMproperties, select Monitor>RPM in the J-Web interface, or enter the following CLIshow command:
show services rpm probe-results
In addition to the RPM statistics for each RPM test, the J-Web interface displays theround-trip times and cumulative jitter graphically. Figure 21 on page 200 shows samplegraphs for an RPM test.
Using the Monitoring Tools ■ 199
Chapter 11: Monitoring the Device and Routing Operations
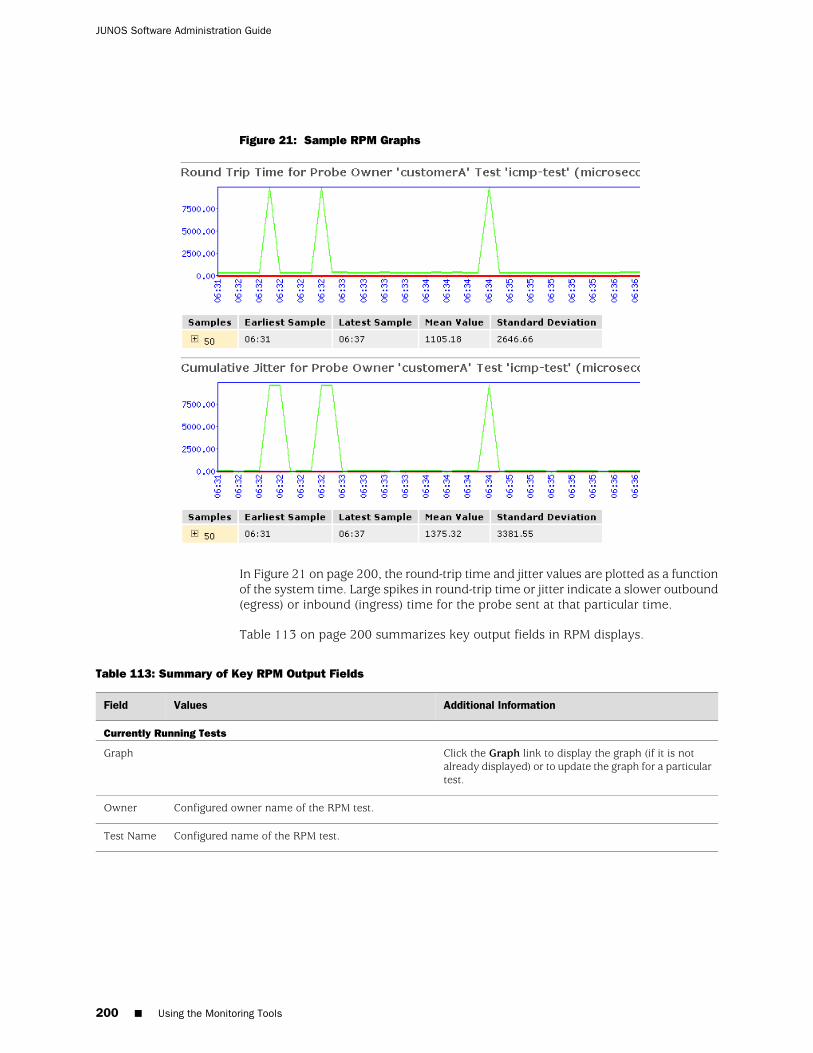
Figure 21: Sample RPM Graphs
In Figure 21 on page 200, the round-trip time and jitter values are plotted as a functionof the system time. Large spikes in round-trip time or jitter indicate a slower outbound(egress) or inbound (ingress) time for the probe sent at that particular time.
Table 113 on page 200 summarizes key output fields in RPM displays.
Table 113: Summary of Key RPM Output Fields
Additional InformationValuesField
Currently Running Tests
Click the Graph link to display the graph (if it is notalready displayed) or to update the graph for a particulartest.
Graph
Configured owner name of the RPM test.Owner
Configured name of the RPM test.Test Name
200 ■ Using the Monitoring Tools
JUNOS Software Administration Guide
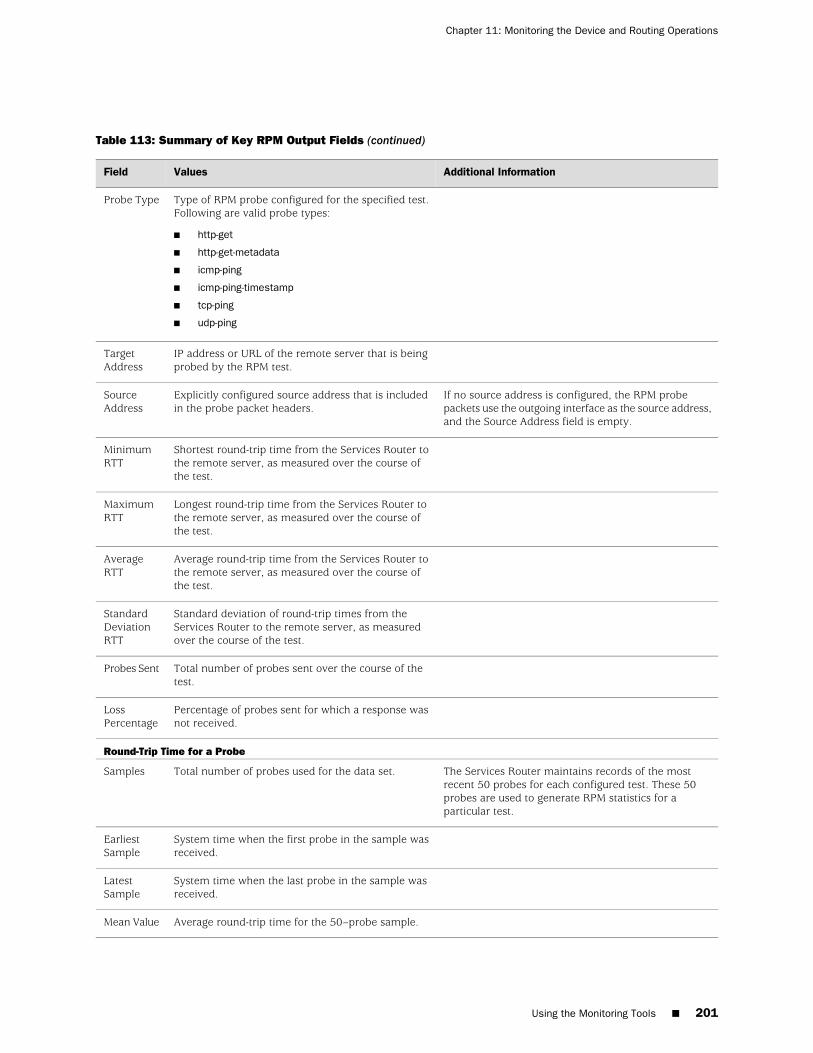
Table 113: Summary of Key RPM Output Fields (continued)
Additional InformationValuesField
Type of RPM probe configured for the specified test.Following are valid probe types:
■ http-get
■ http-get-metadata
■ icmp-ping
■ icmp-ping-timestamp
■ tcp-ping
■ udp-ping
Probe Type
IP address or URL of the remote server that is beingprobed by the RPM test.
TargetAddress
If no source address is configured, the RPM probepackets use the outgoing interface as the source address,and the Source Address field is empty.
Explicitly configured source address that is includedin the probe packet headers.
SourceAddress
Shortest round-trip time from the Services Router tothe remote server, as measured over the course ofthe test.
MinimumRTT
Longest round-trip time from the Services Router tothe remote server, as measured over the course ofthe test.
MaximumRTT
Average round-trip time from the Services Router tothe remote server, as measured over the course ofthe test.
AverageRTT
Standard deviation of round-trip times from theServices Router to the remote server, as measuredover the course of the test.
StandardDeviationRTT
Total number of probes sent over the course of thetest.
Probes Sent
Percentage of probes sent for which a response wasnot received.
LossPercentage
Round-Trip Time for a Probe
The Services Router maintains records of the mostrecent 50 probes for each configured test. These 50probes are used to generate RPM statistics for aparticular test.
Total number of probes used for the data set.Samples
System time when the first probe in the sample wasreceived.
EarliestSample
System time when the last probe in the sample wasreceived.
LatestSample
Average round-trip time for the 50–probe sample.Mean Value
Using the Monitoring Tools ■ 201
Chapter 11: Monitoring the Device and Routing Operations
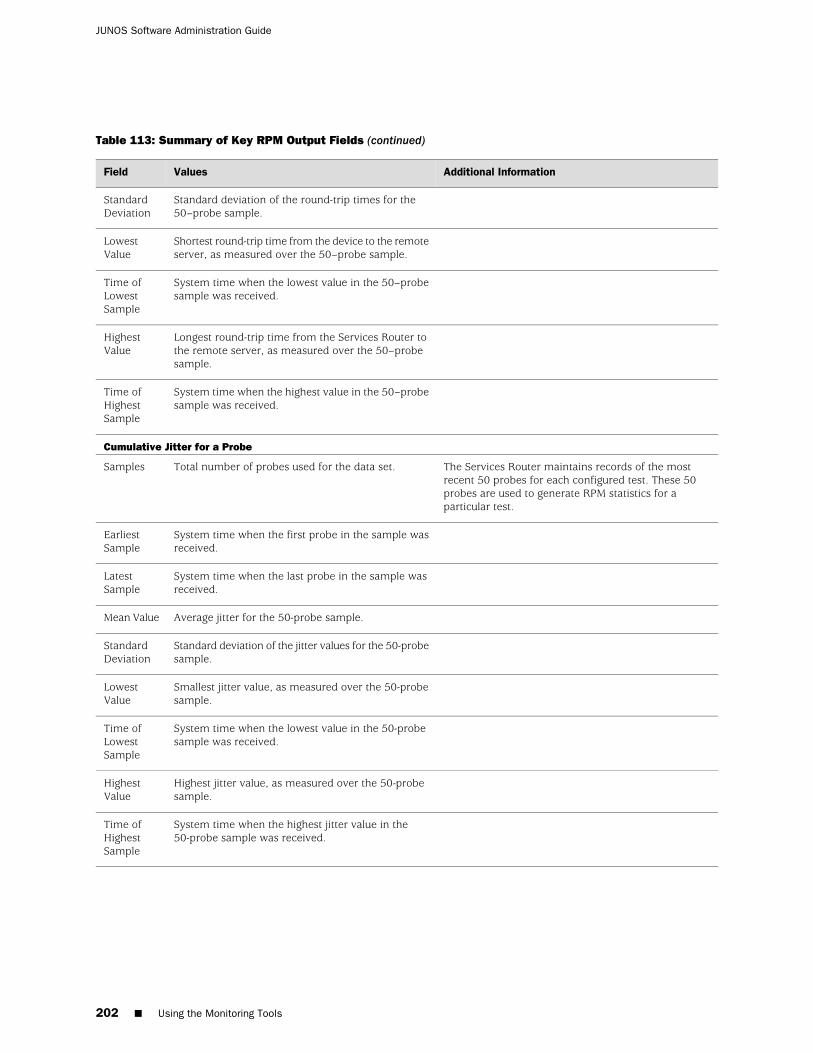
Table 113: Summary of Key RPM Output Fields (continued)
Additional InformationValuesField
Standard deviation of the round-trip times for the50–probe sample.
StandardDeviation
Shortest round-trip time from the device to the remoteserver, as measured over the 50–probe sample.
LowestValue
System time when the lowest value in the 50–probesample was received.
Time ofLowestSample
Longest round-trip time from the Services Router tothe remote server, as measured over the 50–probesample.
HighestValue
System time when the highest value in the 50–probesample was received.
Time ofHighestSample
Cumulative Jitter for a Probe
The Services Router maintains records of the mostrecent 50 probes for each configured test. These 50probes are used to generate RPM statistics for aparticular test.
Total number of probes used for the data set.Samples
System time when the first probe in the sample wasreceived.
EarliestSample
System time when the last probe in the sample wasreceived.
LatestSample
Average jitter for the 50-probe sample.Mean Value
Standard deviation of the jitter values for the 50-probesample.
StandardDeviation
Smallest jitter value, as measured over the 50-probesample.
LowestValue
System time when the lowest value in the 50-probesample was received.
Time ofLowestSample
Highest jitter value, as measured over the 50-probesample.
HighestValue
System time when the highest jitter value in the50-probe sample was received.
Time ofHighestSample
202 ■ Using the Monitoring Tools
JUNOS Software Administration Guide
Monitoring PPP
PPP monitoring information includes PPP address pool information, session statusfor PPP interfaces, cumulative statistics for all PPP interfaces, and a summary of PPPsessions.
NOTE: PPP monitoring information is available only in the CLI. The J-Web interfacedoes not include pages for displaying PPP monitoring information.
To display PPP monitoring information, enter the following CLI commands:
■ show ppp address-pool pool-name
■ show ppp interface interface-name
■ show ppp statistics
■ show ppp summary
For information about these CLI commands, see the JUNOS Interfaces CommandReference.
Monitoring PPPoE
The PPPoE monitoring information is displayed in multiple parts. To display thesession status for PPPoE interfaces, cumulative statistics for all PPPoE interfaces onthe device, and the PPPoE version configured on the device, select Monitor>PPPoEin the J-Web interface.
To view interface-specific properties in the J-Web interface, select the interface nameon the PPPoE page.
Alternatively, enter the following CLI commands:
■ show pppoe interfaces
■ show pppoe statistics
■ show pppoe version
Table 114 on page 203 summarizes key output fields in PPPoE displays.
You can also view status information about the PPPoE interface by selectingMonitor>Interfaces>pp0. Alternatively, enter the show interfaces pp0 command.For more information about key output fields, see “Monitoring theInterfaces” on page 180.
Table 114: Summary of Key PPPoE Output Fields
Additional InformationValuesField
PPPoE Interfaces
Using the Monitoring Tools ■ 203
Chapter 11: Monitoring the Device and Routing Operations
Table 114: Summary of Key PPPoE Output Fields (continued)
Additional InformationValuesField
Click the interface name to display PPPoEinformation for the interface.
Name of the PPPoE interface.
(See the interface naming conventions in theJUNOS Software Interfaces and RoutingConfiguration Guide.)
Interface
State of the PPPoE session on the interface.State
To establish a PPPoE session, first the device actingas a PPPoE client obtains the Ethernet address ofthe PPPoE server or access concentrator, and thenthe client and the server negotiate a unique sessionID. This process is refereed as PPPoE activediscovery and is made up of four steps: initiation,offer, request, and session confirmation. The accessconcentrator generates the session ID for sessionconfirmation and sends it to the PPPoE client in aPPPoE Active Discovery Session-Confirmation (PADS)packet.
Unique session identifier for the PPPoE session.Session ID
Service Name identifies the type of service providedby the access concentrator, such as the name of theInternet service provider (ISP), class, or quality ofservice.
Type of service required from the accessconcentrator.
Service Name
Configured access concentrator name.Configured ACName
Name of the access concentrator.Session AC Names
Media access control (MAC) address of the accessconcentrator.
AC MAC Address
Number of seconds the current PPPoE session hasbeen running.
Session Uptime
Number of seconds to wait before reconnectingafter a PPPoE session is terminated.
Auto-ReconnectTimeout
Number of seconds a PPPoE session can be idlewithout disconnecting.
Idle Timeout
Name of the underlying logical Ethernet or ATMinterface on which PPPoE is running—forexample, ge-0/0/0.1.
UnderlyingInterface
PPPoE Statistics
Total number of active PPPoE sessions.Active PPPoESessions
204 ■ Using the Monitoring Tools
JUNOS Software Administration Guide
Table 114: Summary of Key PPPoE Output Fields (continued)
Additional InformationValuesField
Packets sent and received during the PPPoEsession, categorized by packet type and packeterror:
■ PADI—PPPoE Active Discovery Initiationpackets.
■ PADO—PPPoE Active Discovery Offerpackets.
■ PADR—PPPoE Active Discovery Requestpackets.
■ PADS—PPPoE Active DiscoverySession-Confirmation packets.
■ PADT—PPPoE Active Discovery Terminatepackets.
■ Service Name Error—Packets for which theService-Name request could not be honored.
■ AC System Error—Packets for which theaccess concentrator experienced an error inprocessing the host request. For example,the host had insufficient resources to createa virtual circuit.
■ Generic Error—Packets that indicate anunrecoverable error occurred.
■ Malformed Packet—Malformed or shortpackets that caused the packet handler todisregard the frame as unreadable.
■ Unknown Packet—Unrecognized packets.
Packet Type
Number of the specific type of packet sent fromthe PPPoE client.
Sent
Number of the specific type of packet received bythe PPPoE client.
Received
Information about the timeouts that occurredduring the PPPoE session.
■ PADI—Number of timeouts that occurred forthe PADI packet.
■ PADO—Number of timeouts that occurredfor the PADO packet. (This value is always 0and is not supported.
■ PADR—Number of timeouts that occurredfor the PADR packet.
Timeout
Number of the timeouts that occurred for PADI,PADO, and PADR packets.
Sent
PPPoE Version
Maximum number of active PPPoE sessions thedevice can support. The default is 256 sessions.
Maximum Sessions
Using the Monitoring Tools ■ 205
Chapter 11: Monitoring the Device and Routing Operations
Table 114: Summary of Key PPPoE Output Fields (continued)
Additional InformationValuesField
The PPPoE Active Discovery Initiation (PADI) packetis sent to the access concentrator to initiate a PPPoEsession. Typically, the access concentrator respondsto a PADI packet with a PPPoE Active DiscoveryOffer (PADO) packet. If the access concentrator doesnot send a PADO packet, the device sends the PADIpacket again after timeout period is elapsed. ThePADI Resend Timeout doubles for each successivePADI packet sent. For example, if the PADI ResendTimeout is 2 seconds, the second PADI packet issent after 2 seconds, the third after 4 seconds, thefourth after 8 seconds, and so on.
Initial time, (in seconds) the device waits toreceive a PADO packet for the PADI packetsent—for example, 2 seconds. This timeoutdoubles for each successive PADI packet sent.
PADI ResendTimeout
The PPPoE Active Discovery Request (PADR) packetis sent to the access concentrator in response to aPADO packet, and to obtain the PPPoE session ID.Typically, the access concentrator responds to aPADR packet with a PPPoE Active DiscoverySession-Confirmation (PADS) packet, which containsthe session ID. If the access concentrator does notsend a PADS packet, the device sends the PADRpacket again after the PADR Resend Timeout periodis elapsed. The PADR Resend Timeout doubles foreach successive PADR packet sent.
Initial time (in seconds) the device waits to receivea PADS packet for the PADR packet sent. Thistimeout doubles for each successive PADR packetsent.
PADR ResendTimeout
Maximum value (in seconds) that the PADI orPADR resend timer can accept—for example, 64seconds. The maximum value is 64.
Maximum ResendTimeout
Time (in seconds), within which the configuredaccess concentrator must respond.
MaximumConfigured ACTimeout
Monitoring ALGs
The J-Web interface provides detailed information about the SIP, H.323, MGCP, andSCCP ALGs.
This section contains the following topics:
■ Monitoring SIP ALG Information on page 206
■ Monitoring H.323 ALG Information on page 211
■ Monitoring MGCP ALG Information on page 212
■ Monitoring SCCP ALG Information on page 215
Monitoring SIP ALG Information
The J-Web interface provides information for SIP ALG calls, counters, rates, andtransactions.
206 ■ Using the Monitoring Tools
JUNOS Software Administration Guide
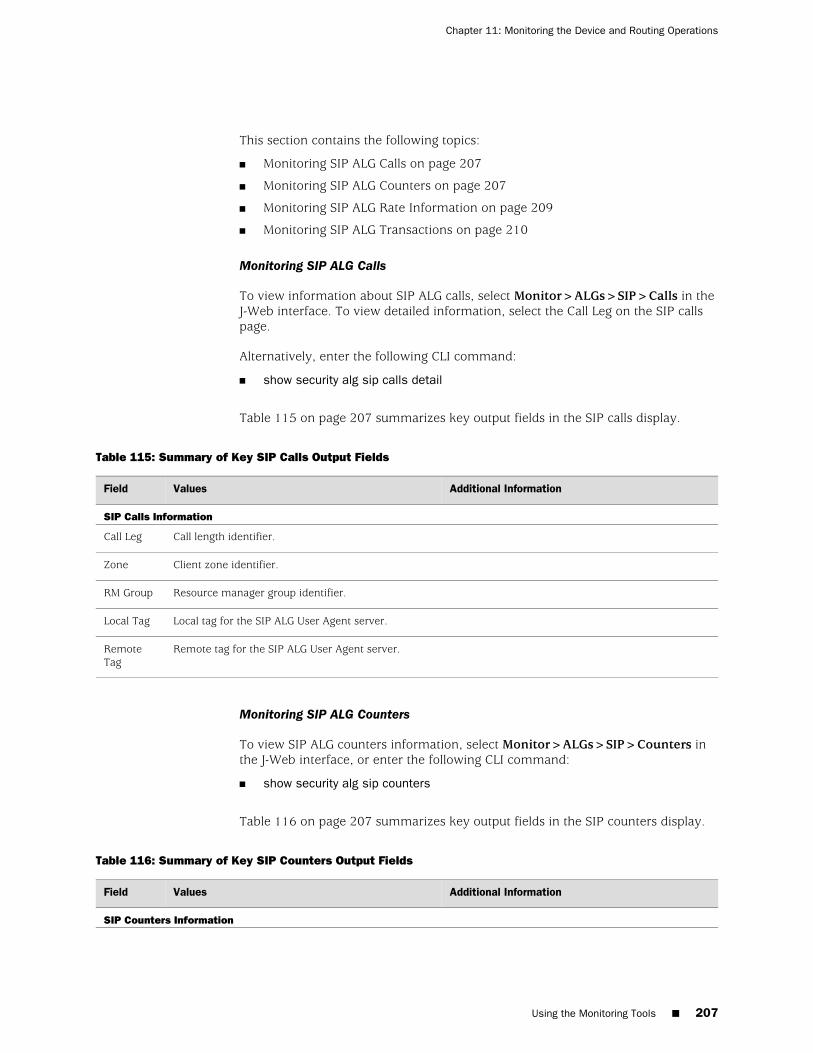
This section contains the following topics:
■ Monitoring SIP ALG Calls on page 207
■ Monitoring SIP ALG Counters on page 207
■ Monitoring SIP ALG Rate Information on page 209
■ Monitoring SIP ALG Transactions on page 210
Monitoring SIP ALG Calls
To view information about SIP ALG calls, select Monitor>ALGs>SIP>Calls in theJ-Web interface. To view detailed information, select the Call Leg on the SIP callspage.
Alternatively, enter the following CLI command:
■ show security alg sip calls detail
Table 115 on page 207 summarizes key output fields in the SIP calls display.
Table 115: Summary of Key SIP Calls Output Fields
Additional InformationValuesField
SIP Calls Information
Call length identifier.Call Leg
Client zone identifier.Zone
Resource manager group identifier.RM Group
Local tag for the SIP ALG User Agent server.Local Tag
Remote tag for the SIP ALG User Agent server.RemoteTag
Monitoring SIP ALG Counters
To view SIP ALG counters information, select Monitor>ALGs>SIP>Counters inthe J-Web interface, or enter the following CLI command:
■ show security alg sip counters
Table 116 on page 207 summarizes key output fields in the SIP counters display.
Table 116: Summary of Key SIP Counters Output Fields
Additional InformationValuesField
SIP Counters Information
Using the Monitoring Tools ■ 207
Chapter 11: Monitoring the Device and Routing Operations
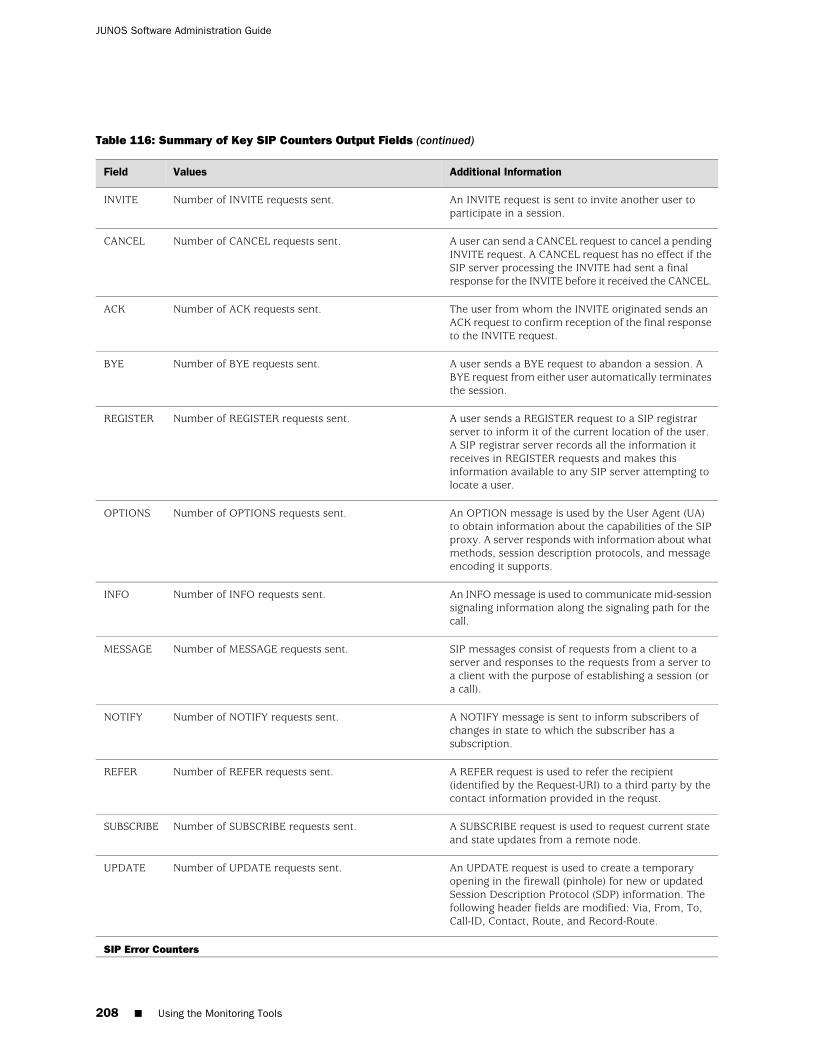
Table 116: Summary of Key SIP Counters Output Fields (continued)
Additional InformationValuesField
An INVITE request is sent to invite another user toparticipate in a session.
Number of INVITE requests sent.INVITE
A user can send a CANCEL request to cancel a pendingINVITE request. A CANCEL request has no effect if theSIP server processing the INVITE had sent a finalresponse for the INVITE before it received the CANCEL.
Number of CANCEL requests sent.CANCEL
The user from whom the INVITE originated sends anACK request to confirm reception of the final responseto the INVITE request.
Number of ACK requests sent.ACK
A user sends a BYE request to abandon a session. ABYE request from either user automatically terminatesthe session.
Number of BYE requests sent.BYE
A user sends a REGISTER request to a SIP registrarserver to inform it of the current location of the user.A SIP registrar server records all the information itreceives in REGISTER requests and makes thisinformation available to any SIP server attempting tolocate a user.
Number of REGISTER requests sent.REGISTER
An OPTION message is used by the User Agent (UA)to obtain information about the capabilities of the SIPproxy. A server responds with information about whatmethods, session description protocols, and messageencoding it supports.
Number of OPTIONS requests sent.OPTIONS
An INFO message is used to communicate mid-sessionsignaling information along the signaling path for thecall.
Number of INFO requests sent.INFO
SIP messages consist of requests from a client to aserver and responses to the requests from a server toa client with the purpose of establishing a session (ora call).
Number of MESSAGE requests sent.MESSAGE
A NOTIFY message is sent to inform subscribers ofchanges in state to which the subscriber has asubscription.
Number of NOTIFY requests sent.NOTIFY
A REFER request is used to refer the recipient(identified by the Request-URI) to a third party by thecontact information provided in the requst.
Number of REFER requests sent.REFER
A SUBSCRIBE request is used to request current stateand state updates from a remote node.
Number of SUBSCRIBE requests sent.SUBSCRIBE
An UPDATE request is used to create a temporaryopening in the firewall (pinhole) for new or updatedSession Description Protocol (SDP) information. Thefollowing header fields are modified: Via, From, To,Call-ID, Contact, Route, and Record-Route.
Number of UPDATE requests sent.UPDATE
SIP Error Counters
208 ■ Using the Monitoring Tools
JUNOS Software Administration Guide
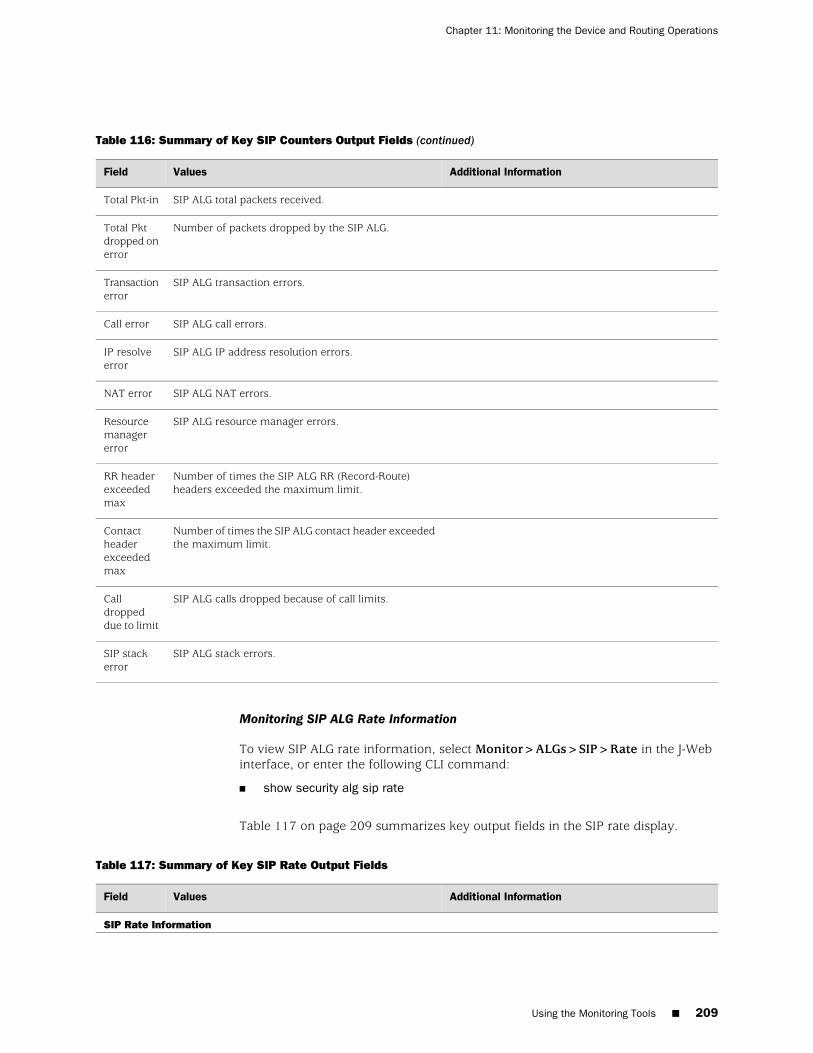
Table 116: Summary of Key SIP Counters Output Fields (continued)
Additional InformationValuesField
SIP ALG total packets received.Total Pkt-in
Number of packets dropped by the SIP ALG.Total Pktdropped onerror
SIP ALG transaction errors.Transactionerror
SIP ALG call errors.Call error
SIP ALG IP address resolution errors.IP resolveerror
SIP ALG NAT errors.NAT error
SIP ALG resource manager errors.Resourcemanagererror
Number of times the SIP ALG RR (Record-Route)headers exceeded the maximum limit.
RR headerexceededmax
Number of times the SIP ALG contact header exceededthe maximum limit.
Contactheaderexceededmax
SIP ALG calls dropped because of call limits.Calldroppeddue to limit
SIP ALG stack errors.SIP stackerror
Monitoring SIP ALG Rate Information
To view SIP ALG rate information, select Monitor>ALGs>SIP>Rate in the J-Webinterface, or enter the following CLI command:
■ show security alg sip rate
Table 117 on page 209 summarizes key output fields in the SIP rate display.
Table 117: Summary of Key SIP Rate Output Fields
Additional InformationValuesField
SIP Rate Information
Using the Monitoring Tools ■ 209
Chapter 11: Monitoring the Device and Routing Operations
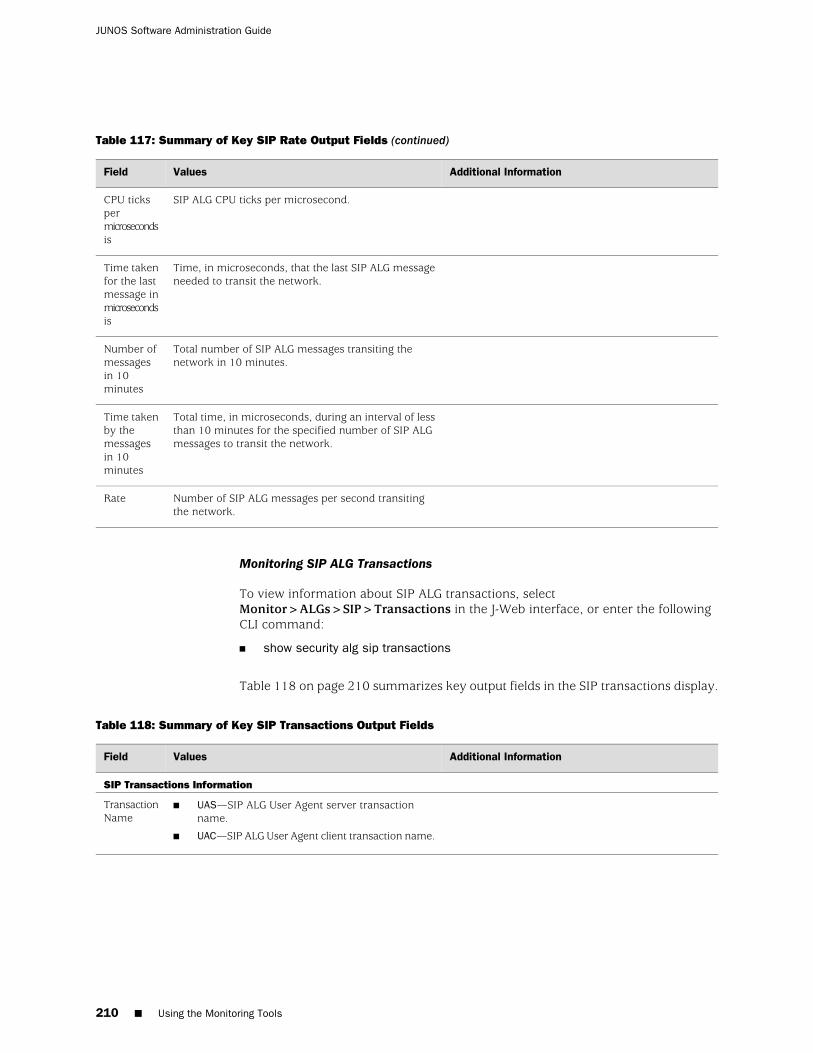
Table 117: Summary of Key SIP Rate Output Fields (continued)
Additional InformationValuesField
SIP ALG CPU ticks per microsecond.CPU tickspermicrosecondsis
Time, in microseconds, that the last SIP ALG messageneeded to transit the network.
Time takenfor the lastmessage inmicrosecondsis
Total number of SIP ALG messages transiting thenetwork in 10 minutes.
Number ofmessagesin 10minutes
Total time, in microseconds, during an interval of lessthan 10 minutes for the specified number of SIP ALGmessages to transit the network.
Time takenby themessagesin 10minutes
Number of SIP ALG messages per second transitingthe network.
Rate
Monitoring SIP ALG Transactions
To view information about SIP ALG transactions, selectMonitor>ALGs>SIP>Transactions in the J-Web interface, or enter the followingCLI command:
■ show security alg sip transactions
Table 118 on page 210 summarizes key output fields in the SIP transactions display.
Table 118: Summary of Key SIP Transactions Output Fields
Additional InformationValuesField
SIP Transactions Information
■ UAS—SIP ALG User Agent server transactionname.
■ UAC—SIP ALG User Agent client transaction name.
TransactionName
210 ■ Using the Monitoring Tools
JUNOS Software Administration Guide
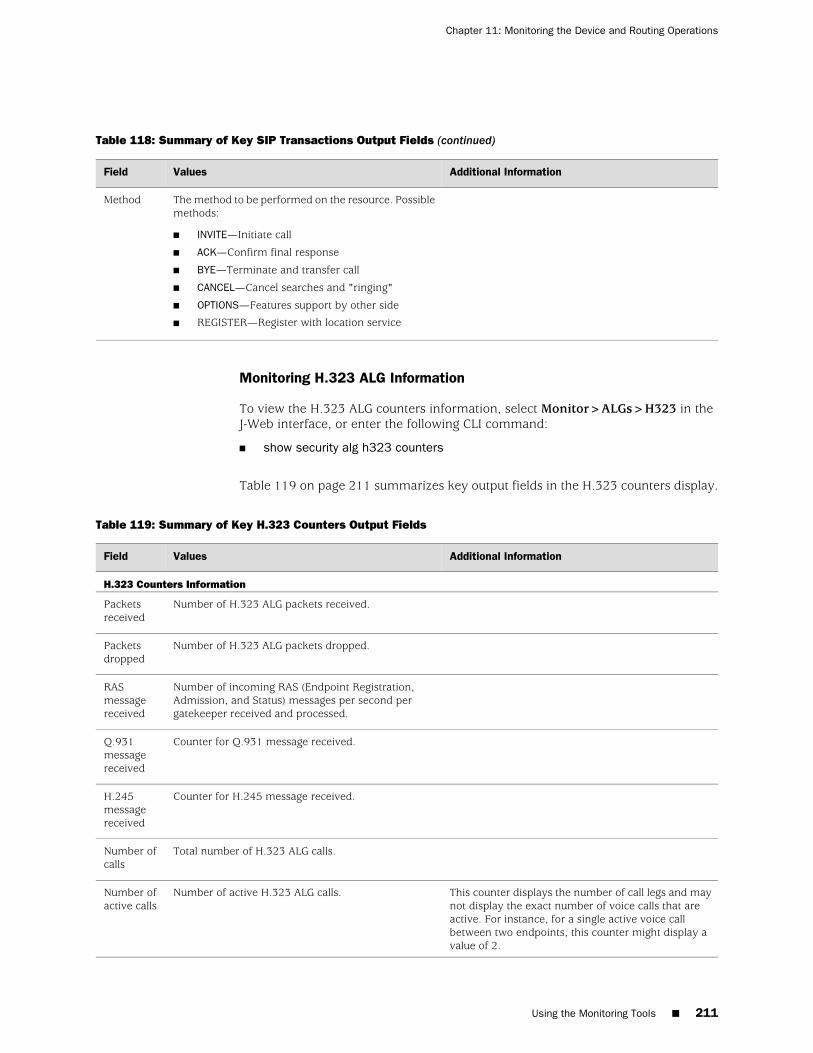
Table 118: Summary of Key SIP Transactions Output Fields (continued)
Additional InformationValuesField
The method to be performed on the resource. Possiblemethods:
■ INVITE—Initiate call
■ ACK—Confirm final response
■ BYE—Terminate and transfer call
■ CANCEL—Cancel searches and "ringing"
■ OPTIONS—Features support by other side
■ REGISTER—Register with location service
Method
Monitoring H.323 ALG Information
To view the H.323 ALG counters information, select Monitor>ALGs>H323 in theJ-Web interface, or enter the following CLI command:
■ show security alg h323 counters
Table 119 on page 211 summarizes key output fields in the H.323 counters display.
Table 119: Summary of Key H.323 Counters Output Fields
Additional InformationValuesField
H.323 Counters Information
Number of H.323 ALG packets received.Packetsreceived
Number of H.323 ALG packets dropped.Packetsdropped
Number of incoming RAS (Endpoint Registration,Admission, and Status) messages per second pergatekeeper received and processed.
RASmessagereceived
Counter for Q.931 message received.Q.931messagereceived
Counter for H.245 message received.H.245messagereceived
Total number of H.323 ALG calls.Number ofcalls
This counter displays the number of call legs and maynot display the exact number of voice calls that areactive. For instance, for a single active voice callbetween two endpoints, this counter might display avalue of 2.
Number of active H.323 ALG calls.Number ofactive calls
Using the Monitoring Tools ■ 211
Chapter 11: Monitoring the Device and Routing Operations
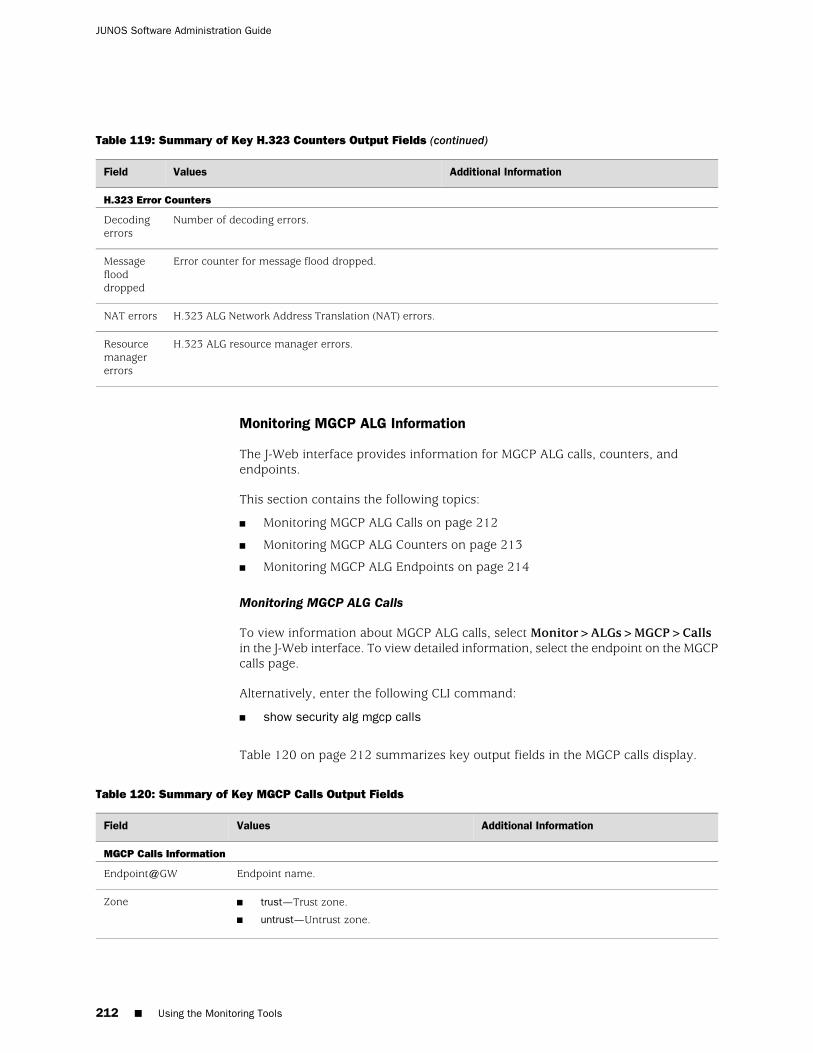
Table 119: Summary of Key H.323 Counters Output Fields (continued)
Additional InformationValuesField
H.323 Error Counters
Number of decoding errors.Decodingerrors
Error counter for message flood dropped.Messageflooddropped
H.323 ALG Network Address Translation (NAT) errors.NAT errors
H.323 ALG resource manager errors.Resourcemanagererrors
Monitoring MGCP ALG Information
The J-Web interface provides information for MGCP ALG calls, counters, andendpoints.
This section contains the following topics:
■ Monitoring MGCP ALG Calls on page 212
■ Monitoring MGCP ALG Counters on page 213
■ Monitoring MGCP ALG Endpoints on page 214
Monitoring MGCP ALG Calls
To view information about MGCP ALG calls, select Monitor>ALGs>MGCP>Callsin the J-Web interface. To view detailed information, select the endpoint on the MGCPcalls page.
Alternatively, enter the following CLI command:
■ show security alg mgcp calls
Table 120 on page 212 summarizes key output fields in the MGCP calls display.
Table 120: Summary of Key MGCP Calls Output Fields
Additional InformationValuesField
MGCP Calls Information
Endpoint name.Endpoint@GW
■ trust—Trust zone.
■ untrust—Untrust zone.
Zone
212 ■ Using the Monitoring Tools
JUNOS Software Administration Guide
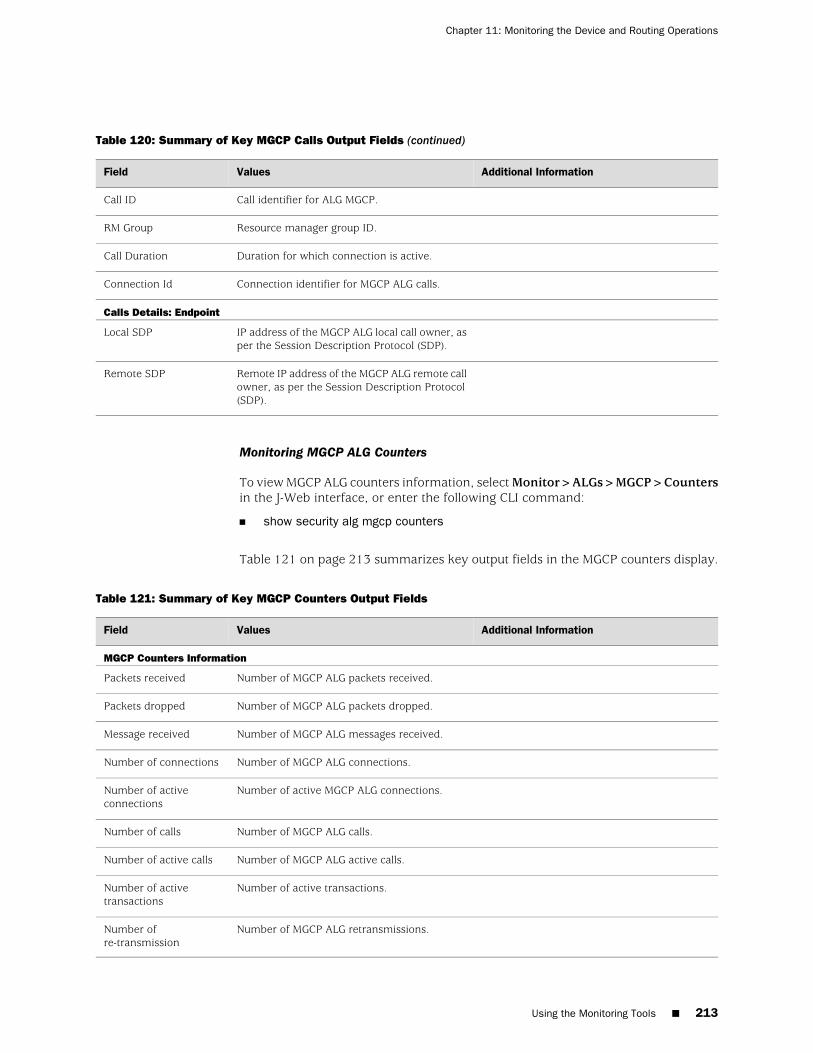
Table 120: Summary of Key MGCP Calls Output Fields (continued)
Additional InformationValuesField
Call identifier for ALG MGCP.Call ID
Resource manager group ID.RM Group
Duration for which connection is active.Call Duration
Connection identifier for MGCP ALG calls.Connection Id
Calls Details: Endpoint
IP address of the MGCP ALG local call owner, asper the Session Description Protocol (SDP).
Local SDP
Remote IP address of the MGCP ALG remote callowner, as per the Session Description Protocol(SDP).
Remote SDP
Monitoring MGCP ALG Counters
To view MGCP ALG counters information, select Monitor>ALGs>MGCP>Countersin the J-Web interface, or enter the following CLI command:
■ show security alg mgcp counters
Table 121 on page 213 summarizes key output fields in the MGCP counters display.
Table 121: Summary of Key MGCP Counters Output Fields
Additional InformationValuesField
MGCP Counters Information
Number of MGCP ALG packets received.Packets received
Number of MGCP ALG packets dropped.Packets dropped
Number of MGCP ALG messages received.Message received
Number of MGCP ALG connections.Number of connections
Number of active MGCP ALG connections.Number of activeconnections
Number of MGCP ALG calls.Number of calls
Number of MGCP ALG active calls.Number of active calls
Number of active transactions.Number of activetransactions
Number of MGCP ALG retransmissions.Number ofre-transmission
Using the Monitoring Tools ■ 213
Chapter 11: Monitoring the Device and Routing Operations
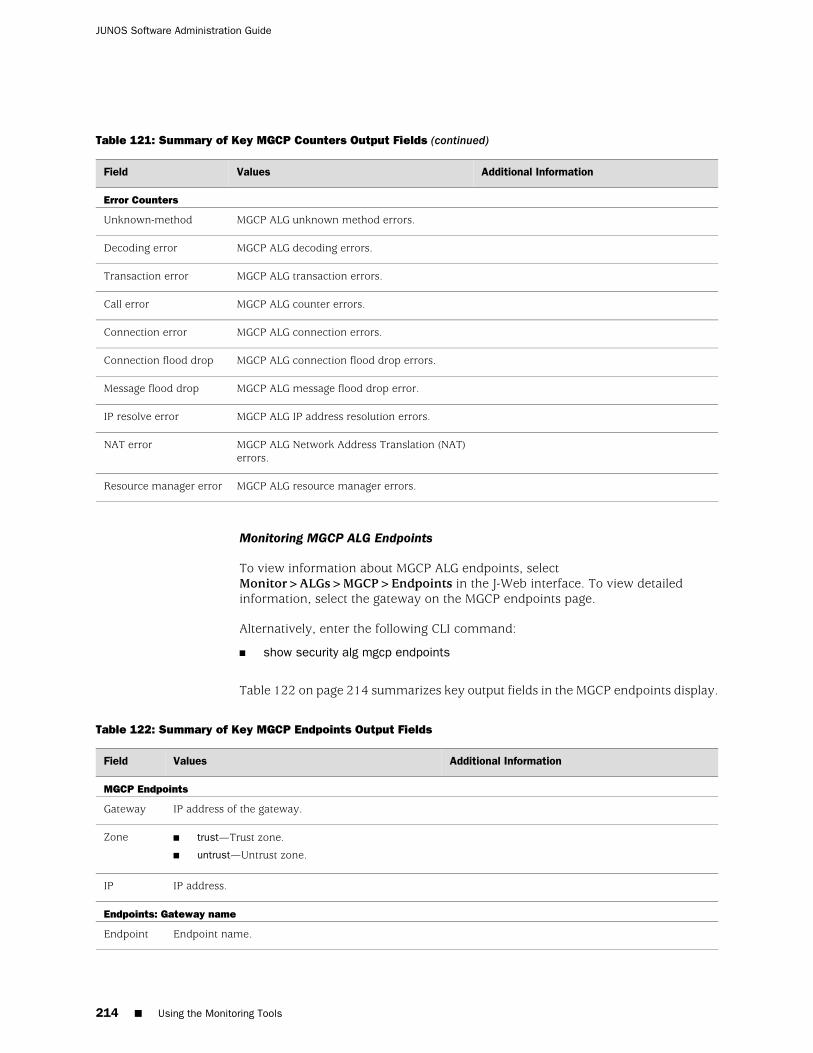
Table 121: Summary of Key MGCP Counters Output Fields (continued)
Additional InformationValuesField
Error Counters
MGCP ALG unknown method errors.Unknown-method
MGCP ALG decoding errors.Decoding error
MGCP ALG transaction errors.Transaction error
MGCP ALG counter errors.Call error
MGCP ALG connection errors.Connection error
MGCP ALG connection flood drop errors.Connection flood drop
MGCP ALG message flood drop error.Message flood drop
MGCP ALG IP address resolution errors.IP resolve error
MGCP ALG Network Address Translation (NAT)errors.
NAT error
MGCP ALG resource manager errors.Resource manager error
Monitoring MGCP ALG Endpoints
To view information about MGCP ALG endpoints, selectMonitor>ALGs>MGCP>Endpoints in the J-Web interface. To view detailedinformation, select the gateway on the MGCP endpoints page.
Alternatively, enter the following CLI command:
■ show security alg mgcp endpoints
Table 122 on page 214 summarizes key output fields in the MGCP endpoints display.
Table 122: Summary of Key MGCP Endpoints Output Fields
Additional InformationValuesField
MGCP Endpoints
IP address of the gateway.Gateway
■ trust—Trust zone.
■ untrust—Untrust zone.
Zone
IP address.IP
Endpoints: Gateway name
Endpoint name.Endpoint
214 ■ Using the Monitoring Tools
JUNOS Software Administration Guide
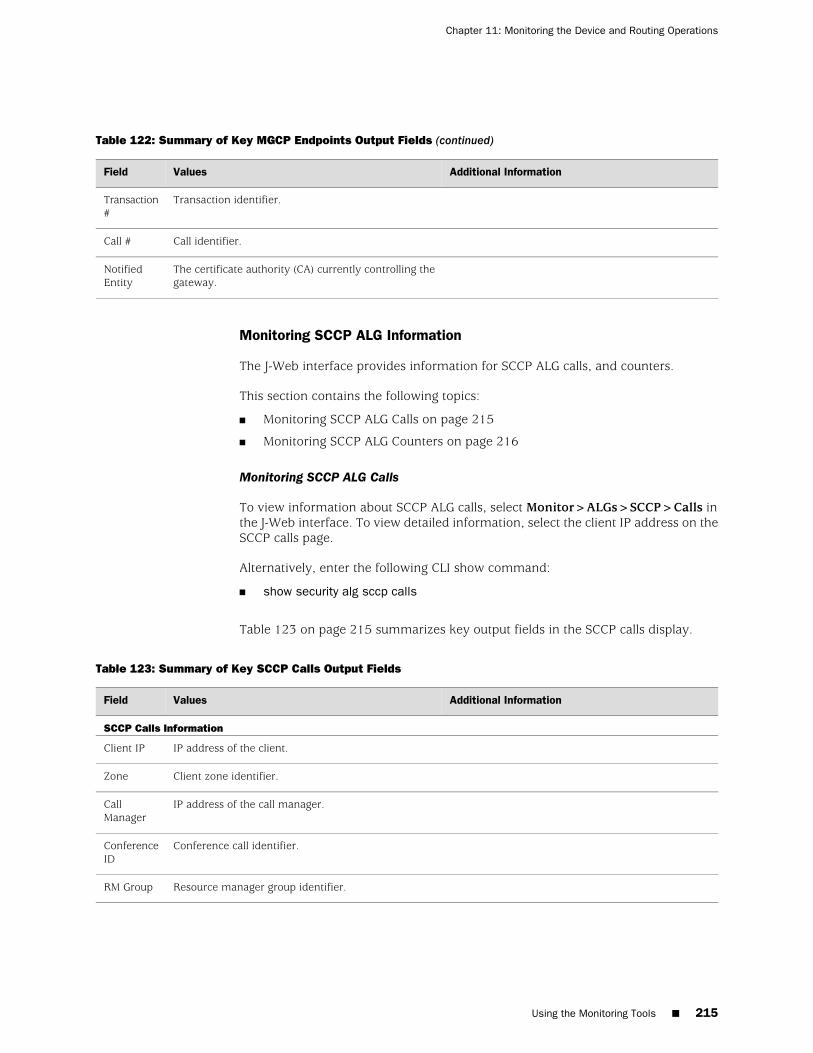
Table 122: Summary of Key MGCP Endpoints Output Fields (continued)
Additional InformationValuesField
Transaction identifier.Transaction#
Call identifier.Call #
The certificate authority (CA) currently controlling thegateway.
NotifiedEntity
Monitoring SCCP ALG Information
The J-Web interface provides information for SCCP ALG calls, and counters.
This section contains the following topics:
■ Monitoring SCCP ALG Calls on page 215
■ Monitoring SCCP ALG Counters on page 216
Monitoring SCCP ALG Calls
To view information about SCCP ALG calls, select Monitor>ALGs>SCCP>Calls inthe J-Web interface. To view detailed information, select the client IP address on theSCCP calls page.
Alternatively, enter the following CLI show command:
■ show security alg sccp calls
Table 123 on page 215 summarizes key output fields in the SCCP calls display.
Table 123: Summary of Key SCCP Calls Output Fields
Additional InformationValuesField
SCCP Calls Information
IP address of the client.Client IP
Client zone identifier.Zone
IP address of the call manager.CallManager
Conference call identifier.ConferenceID
Resource manager group identifier.RM Group
Using the Monitoring Tools ■ 215
Chapter 11: Monitoring the Device and Routing Operations
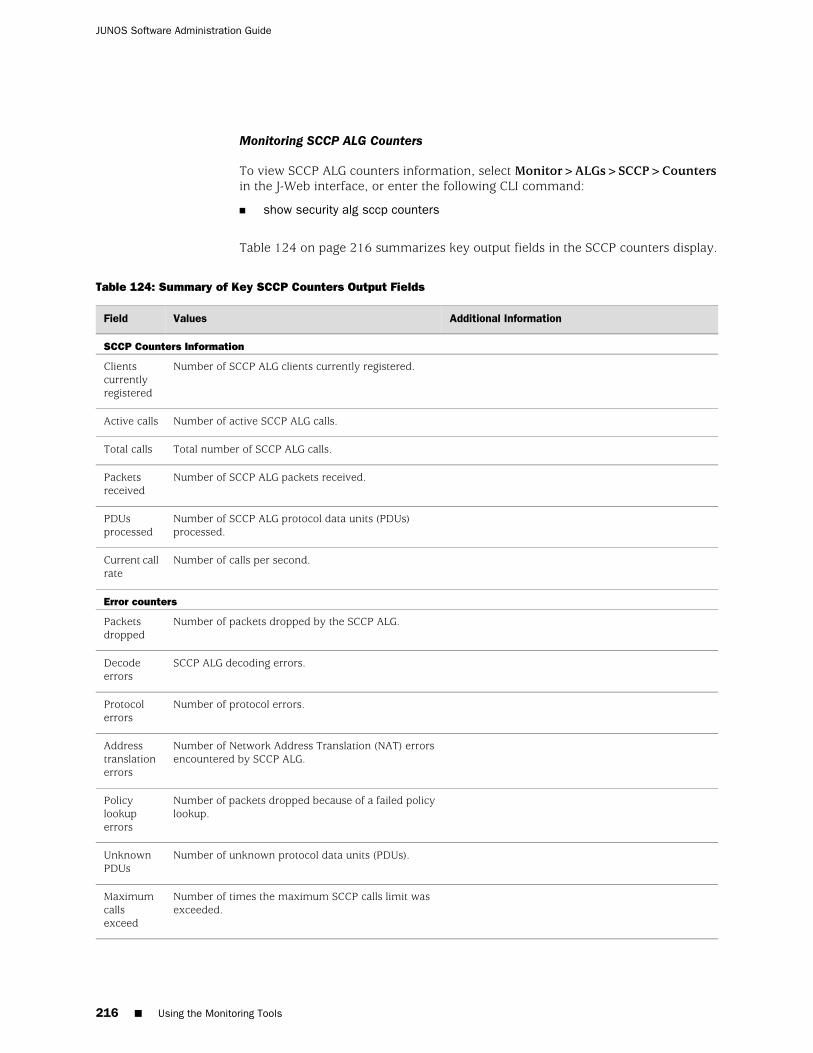
Monitoring SCCP ALG Counters
To view SCCP ALG counters information, select Monitor>ALGs>SCCP>Countersin the J-Web interface, or enter the following CLI command:
■ show security alg sccp counters
Table 124 on page 216 summarizes key output fields in the SCCP counters display.
Table 124: Summary of Key SCCP Counters Output Fields
Additional InformationValuesField
SCCP Counters Information
Number of SCCP ALG clients currently registered.Clientscurrentlyregistered
Number of active SCCP ALG calls.Active calls
Total number of SCCP ALG calls.Total calls
Number of SCCP ALG packets received.Packetsreceived
Number of SCCP ALG protocol data units (PDUs)processed.
PDUsprocessed
Number of calls per second.Current callrate
Error counters
Number of packets dropped by the SCCP ALG.Packetsdropped
SCCP ALG decoding errors.Decodeerrors
Number of protocol errors.Protocolerrors
Number of Network Address Translation (NAT) errorsencountered by SCCP ALG.
Addresstranslationerrors
Number of packets dropped because of a failed policylookup.
Policylookuperrors
Number of unknown protocol data units (PDUs).UnknownPDUs
Number of times the maximum SCCP calls limit wasexceeded.
Maximumcallsexceed
216 ■ Using the Monitoring Tools
JUNOS Software Administration Guide
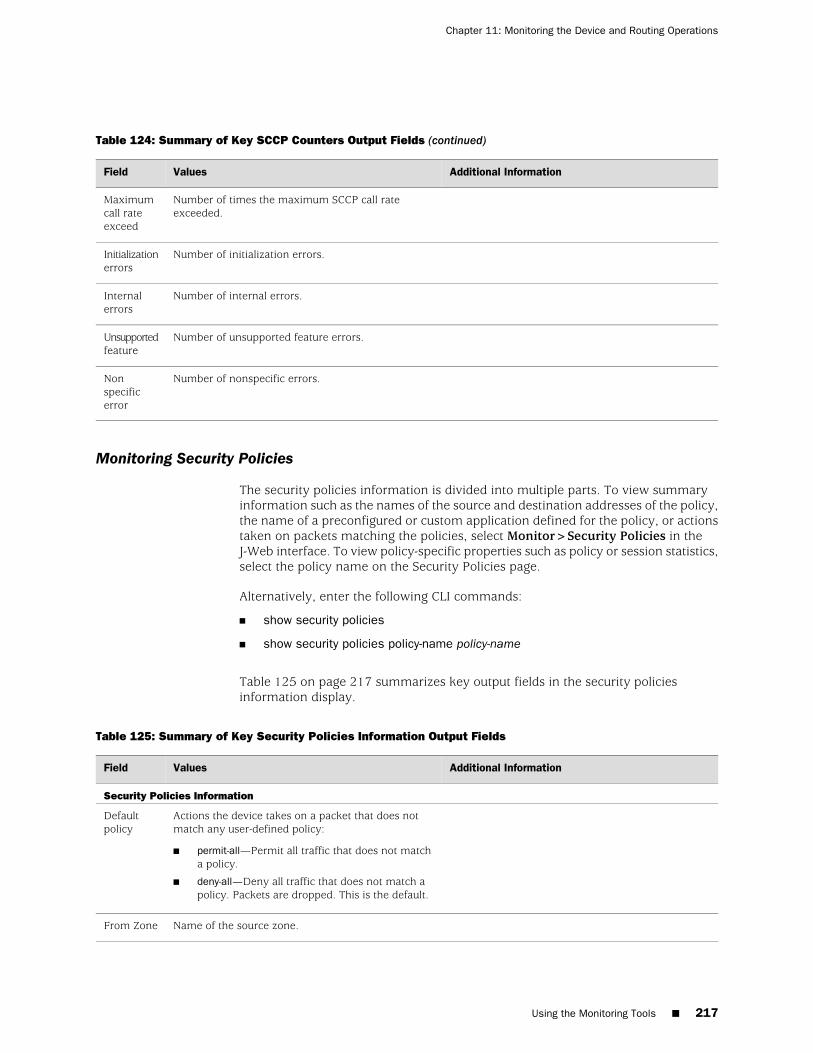
Table 124: Summary of Key SCCP Counters Output Fields (continued)
Additional InformationValuesField
Number of times the maximum SCCP call rateexceeded.
Maximumcall rateexceed
Number of initialization errors.Initializationerrors
Number of internal errors.Internalerrors
Number of unsupported feature errors.Unsupportedfeature
Number of nonspecific errors.Nonspecificerror
Monitoring Security Policies
The security policies information is divided into multiple parts. To view summaryinformation such as the names of the source and destination addresses of the policy,the name of a preconfigured or custom application defined for the policy, or actionstaken on packets matching the policies, select Monitor>Security Policies in theJ-Web interface. To view policy-specific properties such as policy or session statistics,select the policy name on the Security Policies page.
Alternatively, enter the following CLI commands:
■ show security policies
■ show security policies policy-name policy-name
Table 125 on page 217 summarizes key output fields in the security policiesinformation display.
Table 125: Summary of Key Security Policies Information Output Fields
Additional InformationValuesField
Security Policies Information
Actions the device takes on a packet that does notmatch any user-defined policy:
■ permit-all—Permit all traffic that does not matcha policy.
■ deny-all—Deny all traffic that does not match apolicy. Packets are dropped. This is the default.
Defaultpolicy
Name of the source zone.From Zone
Using the Monitoring Tools ■ 217
Chapter 11: Monitoring the Device and Routing Operations
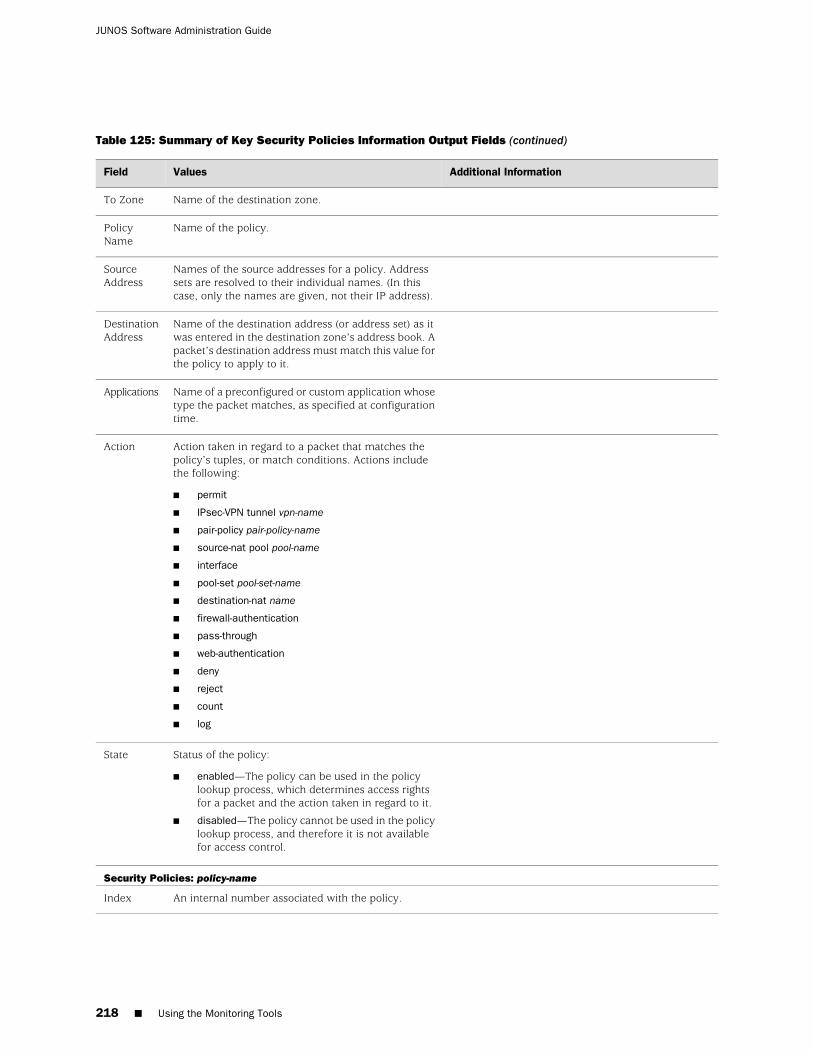
Table 125: Summary of Key Security Policies Information Output Fields (continued)
Additional InformationValuesField
Name of the destination zone.To Zone
Name of the policy.PolicyName
Names of the source addresses for a policy. Addresssets are resolved to their individual names. (In thiscase, only the names are given, not their IP address).
SourceAddress
Name of the destination address (or address set) as itwas entered in the destination zone’s address book. Apacket’s destination address must match this value forthe policy to apply to it.
DestinationAddress
Name of a preconfigured or custom application whosetype the packet matches, as specified at configurationtime.
Applications
Action taken in regard to a packet that matches thepolicy’s tuples, or match conditions. Actions includethe following:
■ permit
■ IPsec-VPN tunnel vpn-name
■ pair-policy pair-policy-name
■ source-nat pool pool-name
■ interface
■ pool-set pool-set-name
■ destination-nat name
■ firewall-authentication
■ pass-through
■ web-authentication
■ deny
■ reject
■ count
■ log
Action
Status of the policy:
■ enabled—The policy can be used in the policylookup process, which determines access rightsfor a packet and the action taken in regard to it.
■ disabled—The policy cannot be used in the policylookup process, and therefore it is not availablefor access control.
State
Security Policies: policy-name
An internal number associated with the policy.Index
218 ■ Using the Monitoring Tools
JUNOS Software Administration Guide
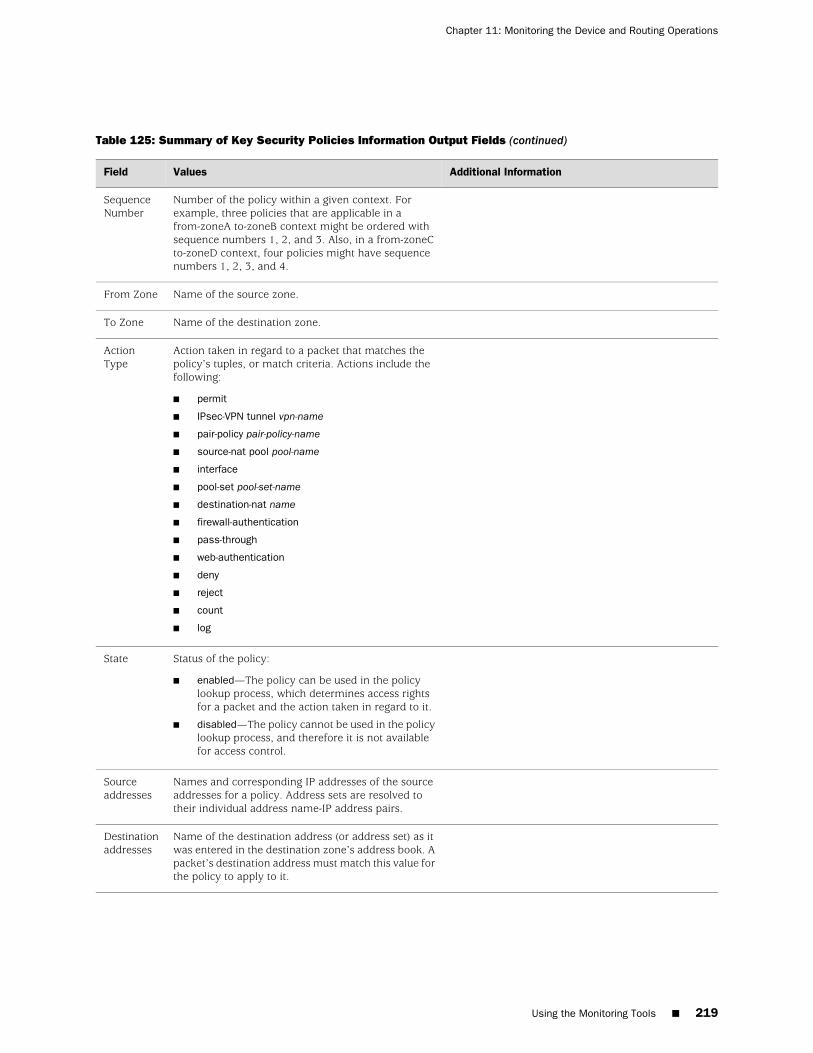
Table 125: Summary of Key Security Policies Information Output Fields (continued)
Additional InformationValuesField
Number of the policy within a given context. Forexample, three policies that are applicable in afrom-zoneA to-zoneB context might be ordered withsequence numbers 1, 2, and 3. Also, in a from-zoneCto-zoneD context, four policies might have sequencenumbers 1, 2, 3, and 4.
SequenceNumber
Name of the source zone.From Zone
Name of the destination zone.To Zone
Action taken in regard to a packet that matches thepolicy’s tuples, or match criteria. Actions include thefollowing:
■ permit
■ IPsec-VPN tunnel vpn-name
■ pair-policy pair-policy-name
■ source-nat pool pool-name
■ interface
■ pool-set pool-set-name
■ destination-nat name
■ firewall-authentication
■ pass-through
■ web-authentication
■ deny
■ reject
■ count
■ log
ActionType
Status of the policy:
■ enabled—The policy can be used in the policylookup process, which determines access rightsfor a packet and the action taken in regard to it.
■ disabled—The policy cannot be used in the policylookup process, and therefore it is not availablefor access control.
State
Names and corresponding IP addresses of the sourceaddresses for a policy. Address sets are resolved totheir individual address name-IP address pairs.
Sourceaddresses
Name of the destination address (or address set) as itwas entered in the destination zone’s address book. Apacket’s destination address must match this value forthe policy to apply to it.
Destinationaddresses
Using the Monitoring Tools ■ 219
Chapter 11: Monitoring the Device and Routing Operations
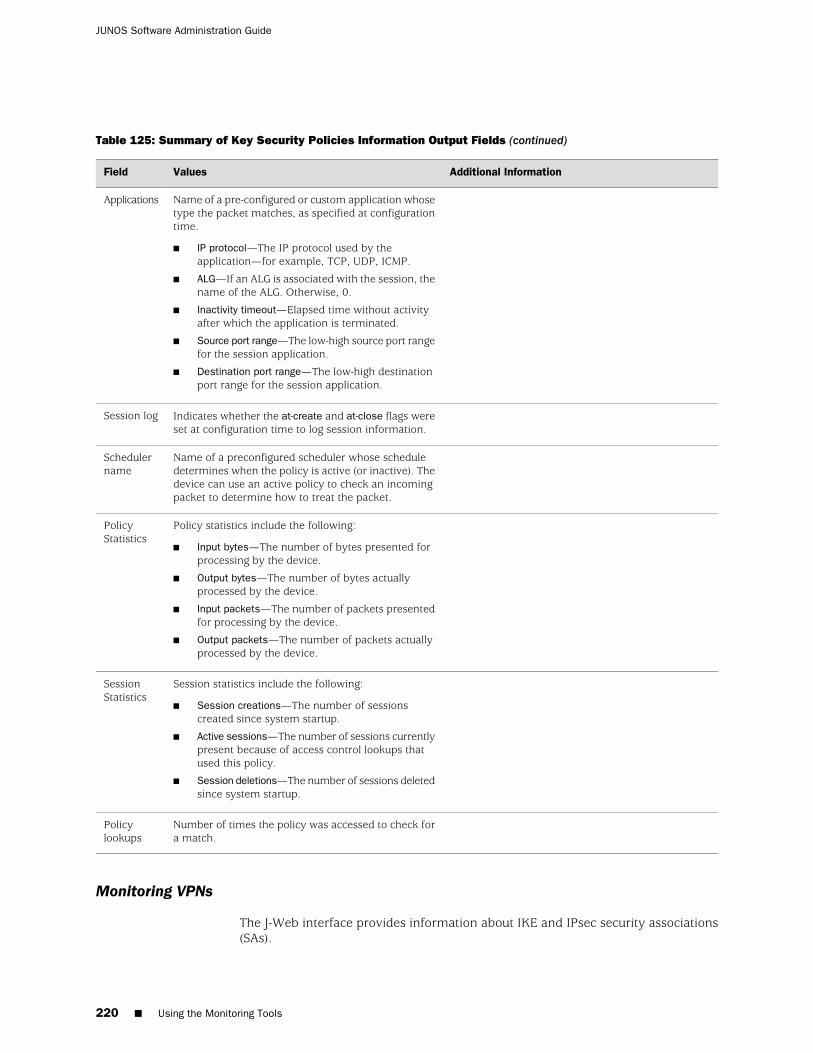
Table 125: Summary of Key Security Policies Information Output Fields (continued)
Additional InformationValuesField
Name of a pre-configured or custom application whosetype the packet matches, as specified at configurationtime.
■ IP protocol—The IP protocol used by theapplication—for example, TCP, UDP, ICMP.
■ ALG—If an ALG is associated with the session, thename of the ALG. Otherwise, 0.
■ Inactivity timeout—Elapsed time without activityafter which the application is terminated.
■ Source port range—The low-high source port rangefor the session application.
■ Destination port range—The low-high destinationport range for the session application.
Applications
Indicates whether the at-create and at-close flags wereset at configuration time to log session information.
Session log
Name of a preconfigured scheduler whose scheduledetermines when the policy is active (or inactive). Thedevice can use an active policy to check an incomingpacket to determine how to treat the packet.
Schedulername
Policy statistics include the following:
■ Input bytes—The number of bytes presented forprocessing by the device.
■ Output bytes—The number of bytes actuallyprocessed by the device.
■ Input packets—The number of packets presentedfor processing by the device.
■ Output packets—The number of packets actuallyprocessed by the device.
PolicyStatistics
Session statistics include the following:
■ Session creations—The number of sessionscreated since system startup.
■ Active sessions—The number of sessions currentlypresent because of access control lookups thatused this policy.
■ Session deletions—The number of sessions deletedsince system startup.
SessionStatistics
Number of times the policy was accessed to check fora match.
Policylookups
Monitoring VPNs
The J-Web interface provides information about IKE and IPsec security associations(SAs).
220 ■ Using the Monitoring Tools
JUNOS Software Administration Guide
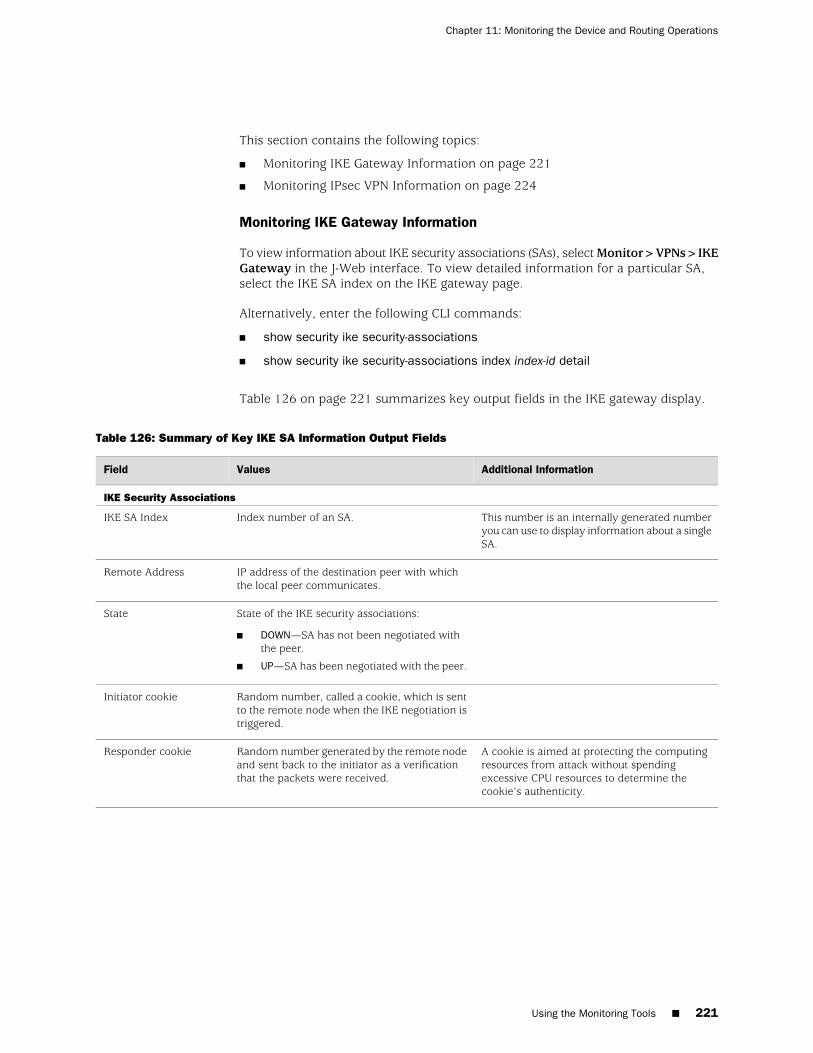
This section contains the following topics:
■ Monitoring IKE Gateway Information on page 221
■ Monitoring IPsec VPN Information on page 224
Monitoring IKE Gateway Information
To view information about IKE security associations (SAs), select Monitor>VPNs>IKEGateway in the J-Web interface. To view detailed information for a particular SA,select the IKE SA index on the IKE gateway page.
Alternatively, enter the following CLI commands:
■ show security ike security-associations
■ show security ike security-associations index index-id detail
Table 126 on page 221 summarizes key output fields in the IKE gateway display.
Table 126: Summary of Key IKE SA Information Output Fields
Additional InformationValuesField
IKE Security Associations
This number is an internally generated numberyou can use to display information about a singleSA.
Index number of an SA.IKE SA Index
IP address of the destination peer with whichthe local peer communicates.
Remote Address
State of the IKE security associations:
■ DOWN—SA has not been negotiated withthe peer.
■ UP—SA has been negotiated with the peer.
State
Random number, called a cookie, which is sentto the remote node when the IKE negotiation istriggered.
Initiator cookie
A cookie is aimed at protecting the computingresources from attack without spendingexcessive CPU resources to determine thecookie’s authenticity.
Random number generated by the remote nodeand sent back to the initiator as a verificationthat the packets were received.
Responder cookie
Using the Monitoring Tools ■ 221
Chapter 11: Monitoring the Device and Routing Operations
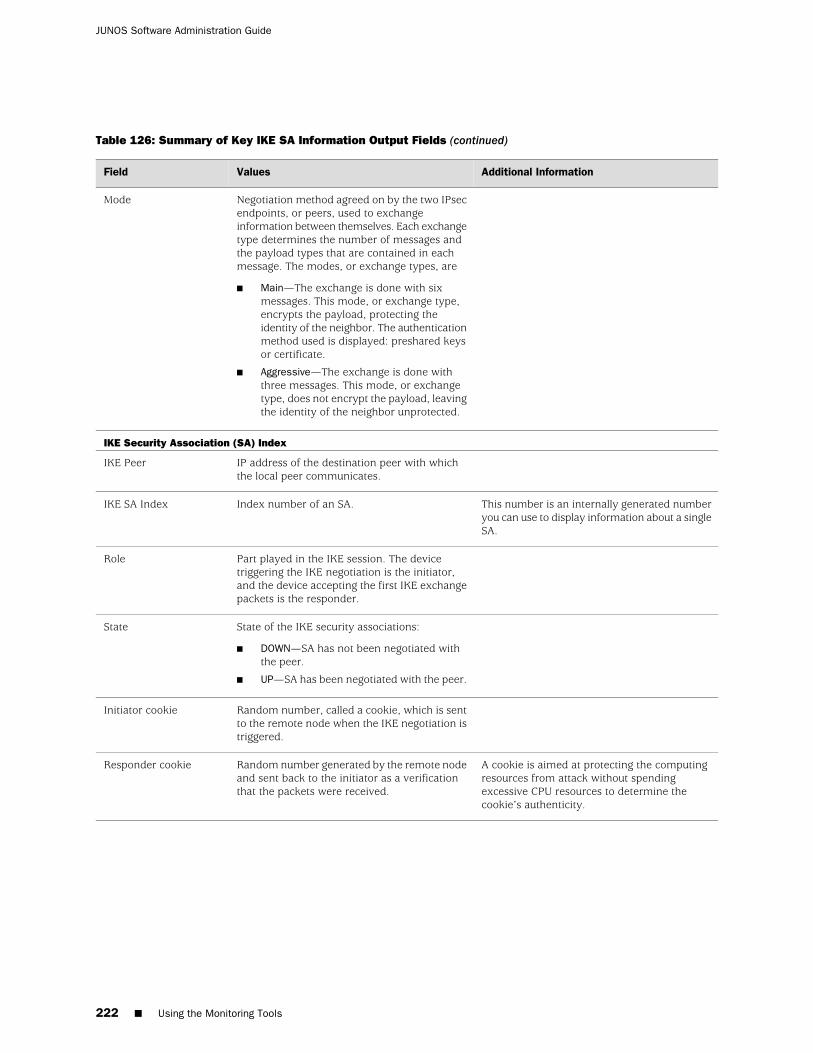
Table 126: Summary of Key IKE SA Information Output Fields (continued)
Additional InformationValuesField
Negotiation method agreed on by the two IPsecendpoints, or peers, used to exchangeinformation between themselves. Each exchangetype determines the number of messages andthe payload types that are contained in eachmessage. The modes, or exchange types, are
■ Main—The exchange is done with sixmessages. This mode, or exchange type,encrypts the payload, protecting theidentity of the neighbor. The authenticationmethod used is displayed: preshared keysor certificate.
■ Aggressive—The exchange is done withthree messages. This mode, or exchangetype, does not encrypt the payload, leavingthe identity of the neighbor unprotected.
Mode
IKE Security Association (SA) Index
IP address of the destination peer with whichthe local peer communicates.
IKE Peer
This number is an internally generated numberyou can use to display information about a singleSA.
Index number of an SA.IKE SA Index
Part played in the IKE session. The devicetriggering the IKE negotiation is the initiator,and the device accepting the first IKE exchangepackets is the responder.
Role
State of the IKE security associations:
■ DOWN—SA has not been negotiated withthe peer.
■ UP—SA has been negotiated with the peer.
State
Random number, called a cookie, which is sentto the remote node when the IKE negotiation istriggered.
Initiator cookie
A cookie is aimed at protecting the computingresources from attack without spendingexcessive CPU resources to determine thecookie’s authenticity.
Random number generated by the remote nodeand sent back to the initiator as a verificationthat the packets were received.
Responder cookie
222 ■ Using the Monitoring Tools
JUNOS Software Administration Guide
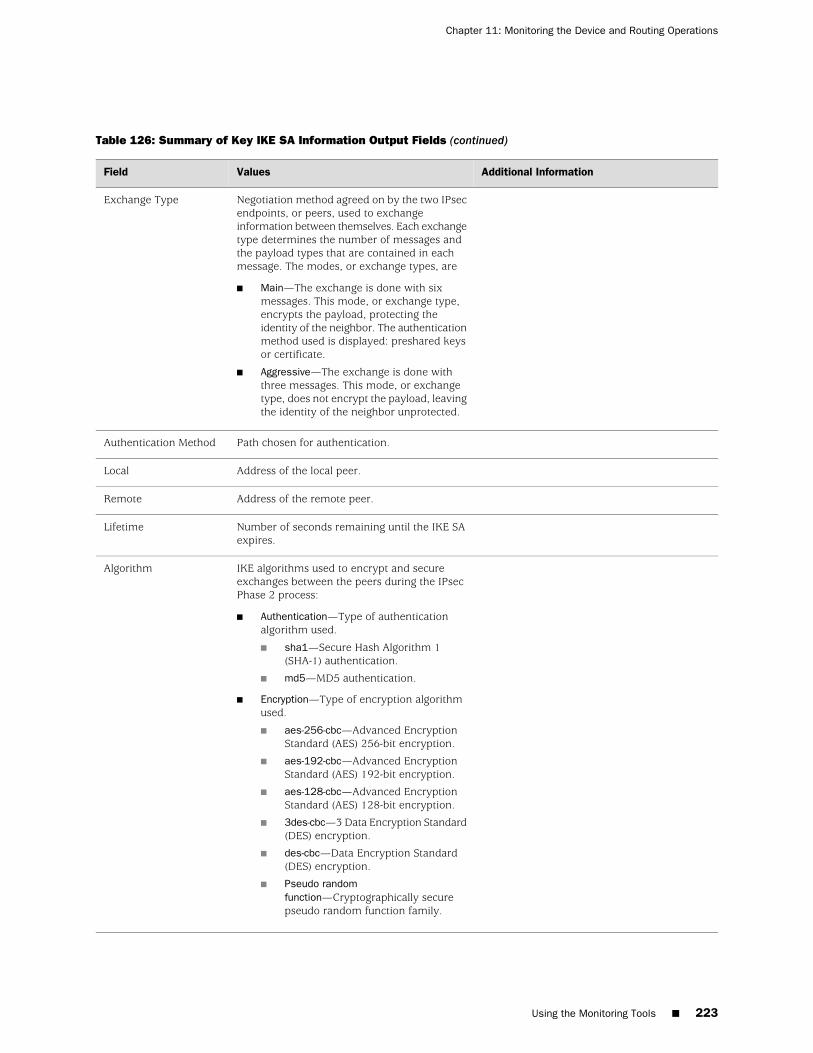
Table 126: Summary of Key IKE SA Information Output Fields (continued)
Additional InformationValuesField
Negotiation method agreed on by the two IPsecendpoints, or peers, used to exchangeinformation between themselves. Each exchangetype determines the number of messages andthe payload types that are contained in eachmessage. The modes, or exchange types, are
■ Main—The exchange is done with sixmessages. This mode, or exchange type,encrypts the payload, protecting theidentity of the neighbor. The authenticationmethod used is displayed: preshared keysor certificate.
■ Aggressive—The exchange is done withthree messages. This mode, or exchangetype, does not encrypt the payload, leavingthe identity of the neighbor unprotected.
Exchange Type
Path chosen for authentication.Authentication Method
Address of the local peer.Local
Address of the remote peer.Remote
Number of seconds remaining until the IKE SAexpires.
Lifetime
IKE algorithms used to encrypt and secureexchanges between the peers during the IPsecPhase 2 process:
■ Authentication—Type of authenticationalgorithm used.
■ sha1—Secure Hash Algorithm 1(SHA-1) authentication.
■ md5—MD5 authentication.
■ Encryption—Type of encryption algorithmused.
■ aes-256-cbc—Advanced EncryptionStandard (AES) 256-bit encryption.
■ aes-192-cbc—Advanced EncryptionStandard (AES) 192-bit encryption.
■ aes-128-cbc—Advanced EncryptionStandard (AES) 128-bit encryption.
■ 3des-cbc—3 Data Encryption Standard(DES) encryption.
■ des-cbc—Data Encryption Standard(DES) encryption.
■ Pseudo randomfunction—Cryptographically securepseudo random function family.
Algorithm
Using the Monitoring Tools ■ 223
Chapter 11: Monitoring the Device and Routing Operations

Table 126: Summary of Key IKE SA Information Output Fields (continued)
Additional InformationValuesField
Traffic statistics include the following:
■ Input bytes—The number of bytes presentedfor processing by the device.
■ Output bytes— The number of bytes actuallyprocessed by the device.
■ Input packets— The number of packetspresented for processing by the device.
■ Output packets— The number of packetsactually processed by the device.
Traffic Statistics
■ number created—The number of SAscreated.
■ number deleted—The number of SAsdeleted.
IPsec securityassociations
Part played in the IKE session. The devicetriggering the IKE negotiation is the initiator,and the device accepting the first IKE exchangepackets is the responder.
Role
Message identifier.Message ID
Specifies the identity of the local peer so that itspartner destination gateway can communicatewith it. The value is specified as any of thefollowing: IPv4 address, fully qualified domainname, e-mail address, or distinguished name.
Local identity
IPv4 address of the destination peer gateway.Remote identity
Monitoring IPsec VPN Information
To view information about IPsec security (SAs), select Monitor>VPNs>IPsec VPNin the J-Web interface. To view the IPsec statistics information for a particular SA,select the IPsec SA ID value on the IPsec VPN page.
Alternatively, enter the following CLI commands:
■ show security ipsec security-associations
■ show security ipsec statistics
Table 127 on page 224 summarizes key output fields in the IPsec VPN display.
Table 127: Summary of Key IPsec VPN Information Output Fields
Additional InformationValuesField
IPsec Security Associations
224 ■ Using the Monitoring Tools
JUNOS Software Administration Guide
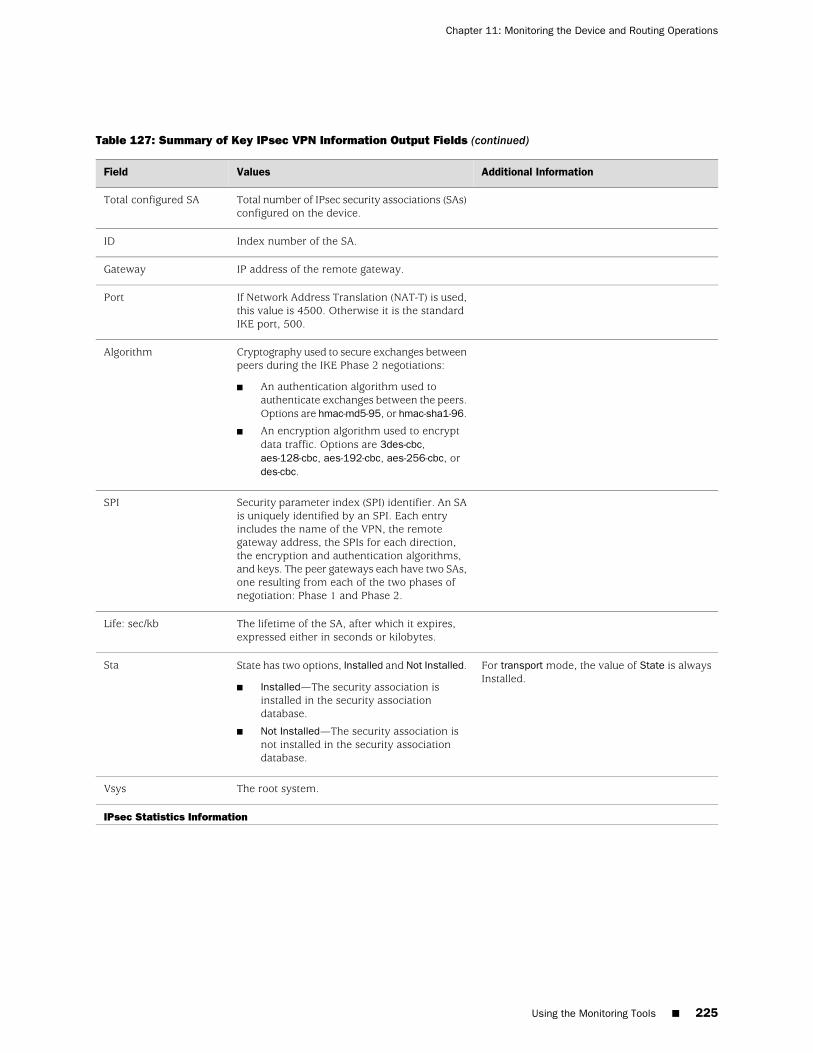
Table 127: Summary of Key IPsec VPN Information Output Fields (continued)
Additional InformationValuesField
Total number of IPsec security associations (SAs)configured on the device.
Total configured SA
Index number of the SA.ID
IP address of the remote gateway.Gateway
If Network Address Translation (NAT-T) is used,this value is 4500. Otherwise it is the standardIKE port, 500.
Port
Cryptography used to secure exchanges betweenpeers during the IKE Phase 2 negotiations:
■ An authentication algorithm used toauthenticate exchanges between the peers.Options are hmac-md5-95, or hmac-sha1-96.
■ An encryption algorithm used to encryptdata traffic. Options are 3des-cbc,aes-128-cbc, aes-192-cbc, aes-256-cbc, ordes-cbc.
Algorithm
Security parameter index (SPI) identifier. An SAis uniquely identified by an SPI. Each entryincludes the name of the VPN, the remotegateway address, the SPIs for each direction,the encryption and authentication algorithms,and keys. The peer gateways each have two SAs,one resulting from each of the two phases ofnegotiation: Phase 1 and Phase 2.
SPI
The lifetime of the SA, after which it expires,expressed either in seconds or kilobytes.
Life: sec/kb
For transport mode, the value of State is alwaysInstalled.
State has two options, Installed and Not Installed.
■ Installed—The security association isinstalled in the security associationdatabase.
■ Not Installed—The security association isnot installed in the security associationdatabase.
Sta
The root system.Vsys
IPsec Statistics Information
Using the Monitoring Tools ■ 225
Chapter 11: Monitoring the Device and Routing Operations
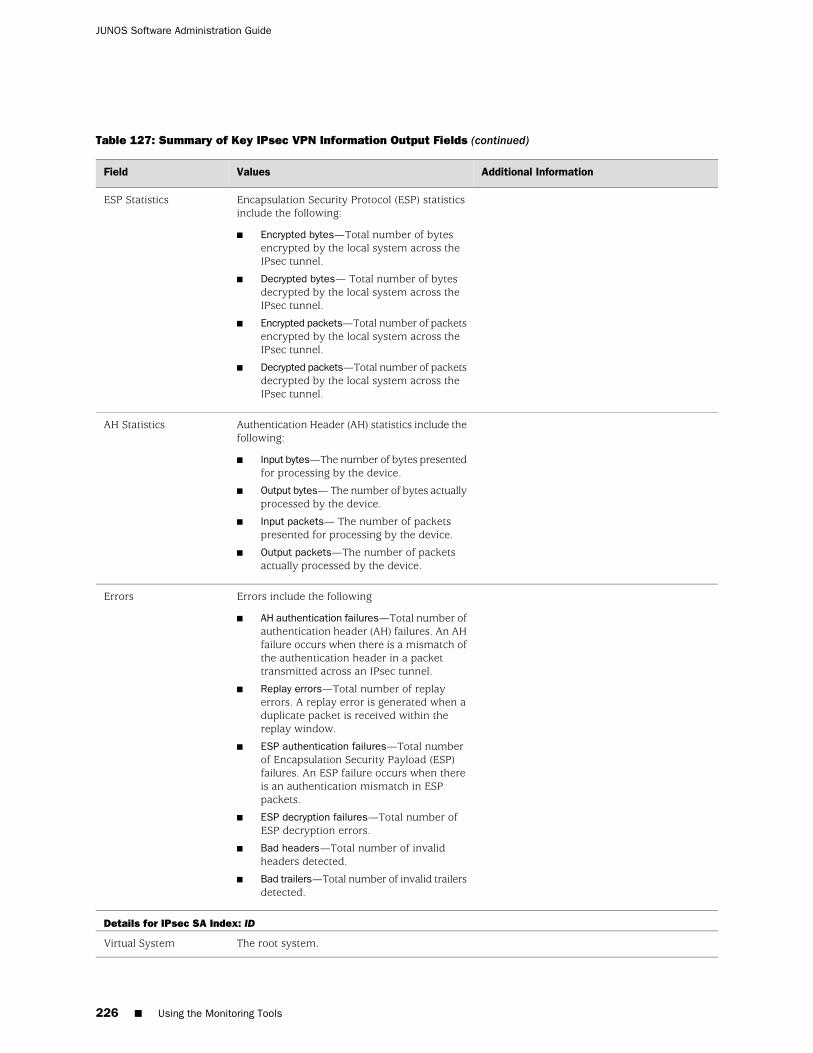
Table 127: Summary of Key IPsec VPN Information Output Fields (continued)
Additional InformationValuesField
Encapsulation Security Protocol (ESP) statisticsinclude the following:
■ Encrypted bytes—Total number of bytesencrypted by the local system across theIPsec tunnel.
■ Decrypted bytes— Total number of bytesdecrypted by the local system across theIPsec tunnel.
■ Encrypted packets—Total number of packetsencrypted by the local system across theIPsec tunnel.
■ Decrypted packets—Total number of packetsdecrypted by the local system across theIPsec tunnel.
ESP Statistics
Authentication Header (AH) statistics include thefollowing:
■ Input bytes—The number of bytes presentedfor processing by the device.
■ Output bytes— The number of bytes actuallyprocessed by the device.
■ Input packets— The number of packetspresented for processing by the device.
■ Output packets—The number of packetsactually processed by the device.
AH Statistics
Errors include the following
■ AH authentication failures—Total number ofauthentication header (AH) failures. An AHfailure occurs when there is a mismatch ofthe authentication header in a packettransmitted across an IPsec tunnel.
■ Replay errors—Total number of replayerrors. A replay error is generated when aduplicate packet is received within thereplay window.
■ ESP authentication failures—Total numberof Encapsulation Security Payload (ESP)failures. An ESP failure occurs when thereis an authentication mismatch in ESPpackets.
■ ESP decryption failures—Total number ofESP decryption errors.
■ Bad headers—Total number of invalidheaders detected.
■ Bad trailers—Total number of invalid trailersdetected.
Errors
Details for IPsec SA Index: ID
The root system.Virtual System
226 ■ Using the Monitoring Tools
JUNOS Software Administration Guide
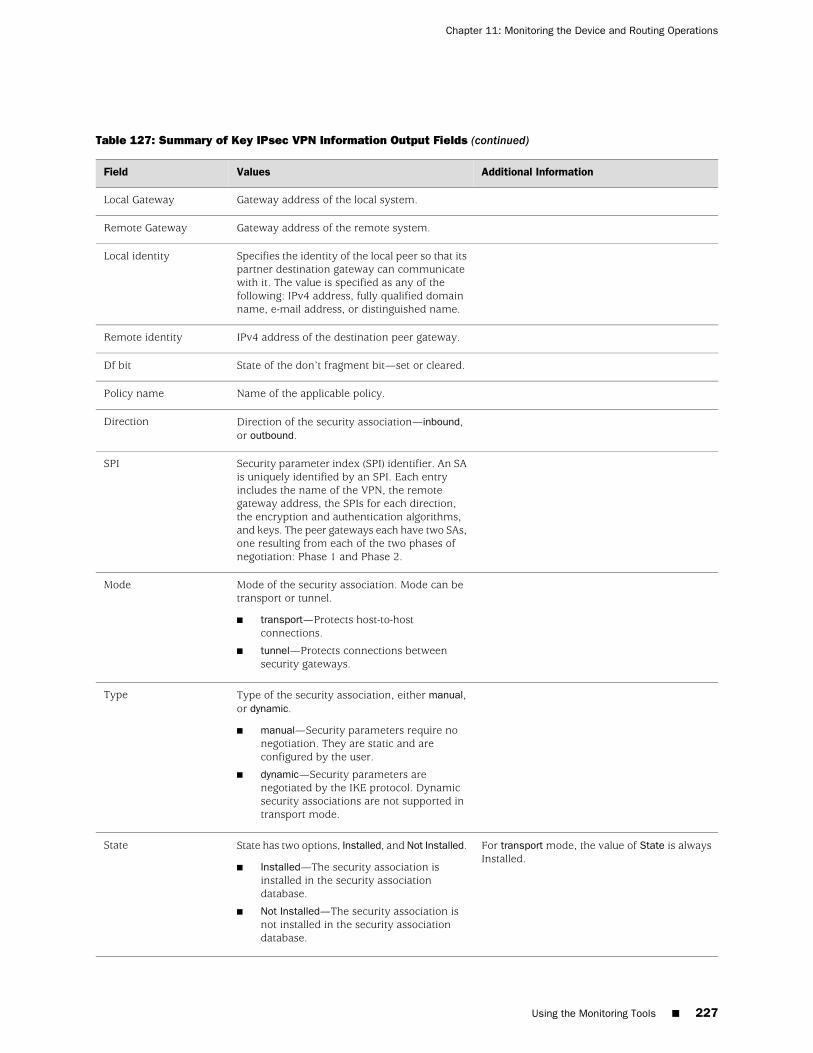
Table 127: Summary of Key IPsec VPN Information Output Fields (continued)
Additional InformationValuesField
Gateway address of the local system.Local Gateway
Gateway address of the remote system.Remote Gateway
Specifies the identity of the local peer so that itspartner destination gateway can communicatewith it. The value is specified as any of thefollowing: IPv4 address, fully qualified domainname, e-mail address, or distinguished name.
Local identity
IPv4 address of the destination peer gateway.Remote identity
State of the don’t fragment bit—set or cleared.Df bit
Name of the applicable policy.Policy name
Direction of the security association—inbound,or outbound.
Direction
Security parameter index (SPI) identifier. An SAis uniquely identified by an SPI. Each entryincludes the name of the VPN, the remotegateway address, the SPIs for each direction,the encryption and authentication algorithms,and keys. The peer gateways each have two SAs,one resulting from each of the two phases ofnegotiation: Phase 1 and Phase 2.
SPI
Mode of the security association. Mode can betransport or tunnel.
■ transport—Protects host-to-hostconnections.
■ tunnel—Protects connections betweensecurity gateways.
Mode
Type of the security association, either manual,or dynamic.
■ manual—Security parameters require nonegotiation. They are static and areconfigured by the user.
■ dynamic—Security parameters arenegotiated by the IKE protocol. Dynamicsecurity associations are not supported intransport mode.
Type
For transport mode, the value of State is alwaysInstalled.
State has two options, Installed, and Not Installed.
■ Installed—The security association isinstalled in the security associationdatabase.
■ Not Installed—The security association isnot installed in the security associationdatabase.
State
Using the Monitoring Tools ■ 227
Chapter 11: Monitoring the Device and Routing Operations
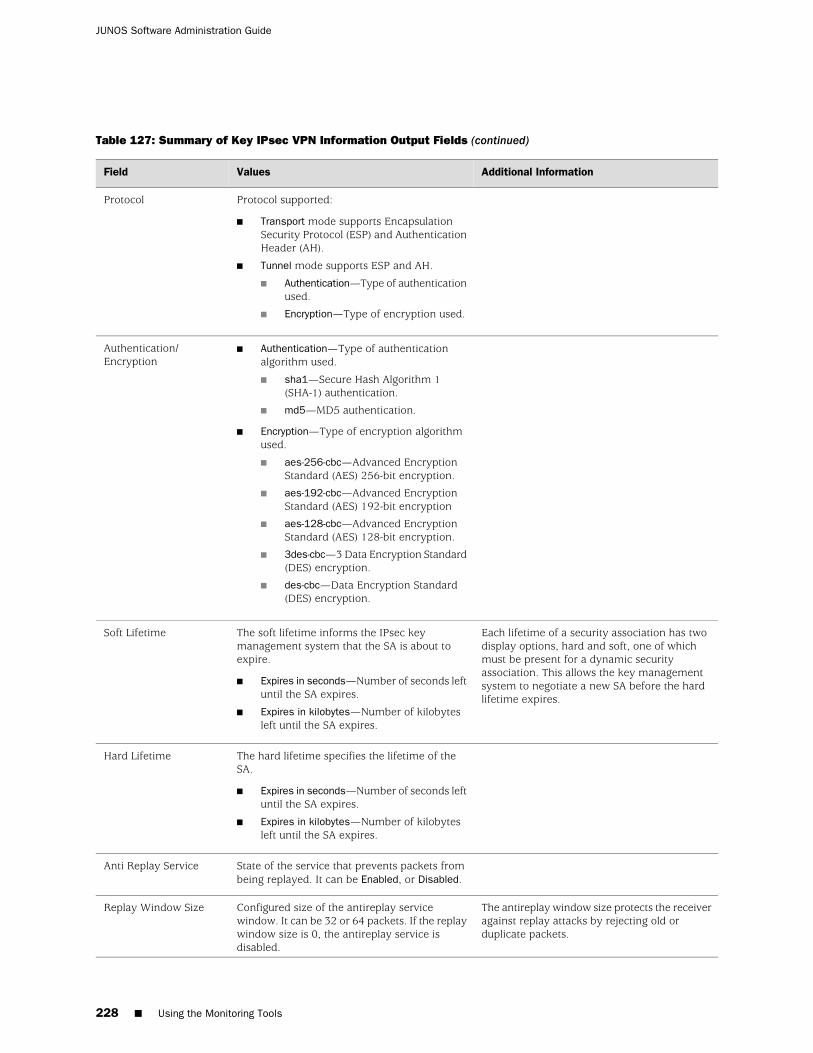
Table 127: Summary of Key IPsec VPN Information Output Fields (continued)
Additional InformationValuesField
Protocol supported:
■ Transport mode supports EncapsulationSecurity Protocol (ESP) and AuthenticationHeader (AH).
■ Tunnel mode supports ESP and AH.
■ Authentication—Type of authenticationused.
■ Encryption—Type of encryption used.
Protocol
■ Authentication—Type of authenticationalgorithm used.
■ sha1—Secure Hash Algorithm 1(SHA-1) authentication.
■ md5—MD5 authentication.
■ Encryption—Type of encryption algorithmused.
■ aes-256-cbc—Advanced EncryptionStandard (AES) 256-bit encryption.
■ aes-192-cbc—Advanced EncryptionStandard (AES) 192-bit encryption
■ aes-128-cbc—Advanced EncryptionStandard (AES) 128-bit encryption.
■ 3des-cbc—3 Data Encryption Standard(DES) encryption.
■ des-cbc—Data Encryption Standard(DES) encryption.
Authentication/Encryption
Each lifetime of a security association has twodisplay options, hard and soft, one of whichmust be present for a dynamic securityassociation. This allows the key managementsystem to negotiate a new SA before the hardlifetime expires.
The soft lifetime informs the IPsec keymanagement system that the SA is about toexpire.
■ Expires in seconds—Number of seconds leftuntil the SA expires.
■ Expires in kilobytes—Number of kilobytesleft until the SA expires.
Soft Lifetime
The hard lifetime specifies the lifetime of theSA.
■ Expires in seconds—Number of seconds leftuntil the SA expires.
■ Expires in kilobytes—Number of kilobytesleft until the SA expires.
Hard Lifetime
State of the service that prevents packets frombeing replayed. It can be Enabled, or Disabled.
Anti Replay Service
The antireplay window size protects the receiveragainst replay attacks by rejecting old orduplicate packets.
Configured size of the antireplay servicewindow. It can be 32 or 64 packets. If the replaywindow size is 0, the antireplay service isdisabled.
Replay Window Size
228 ■ Using the Monitoring Tools
JUNOS Software Administration Guide
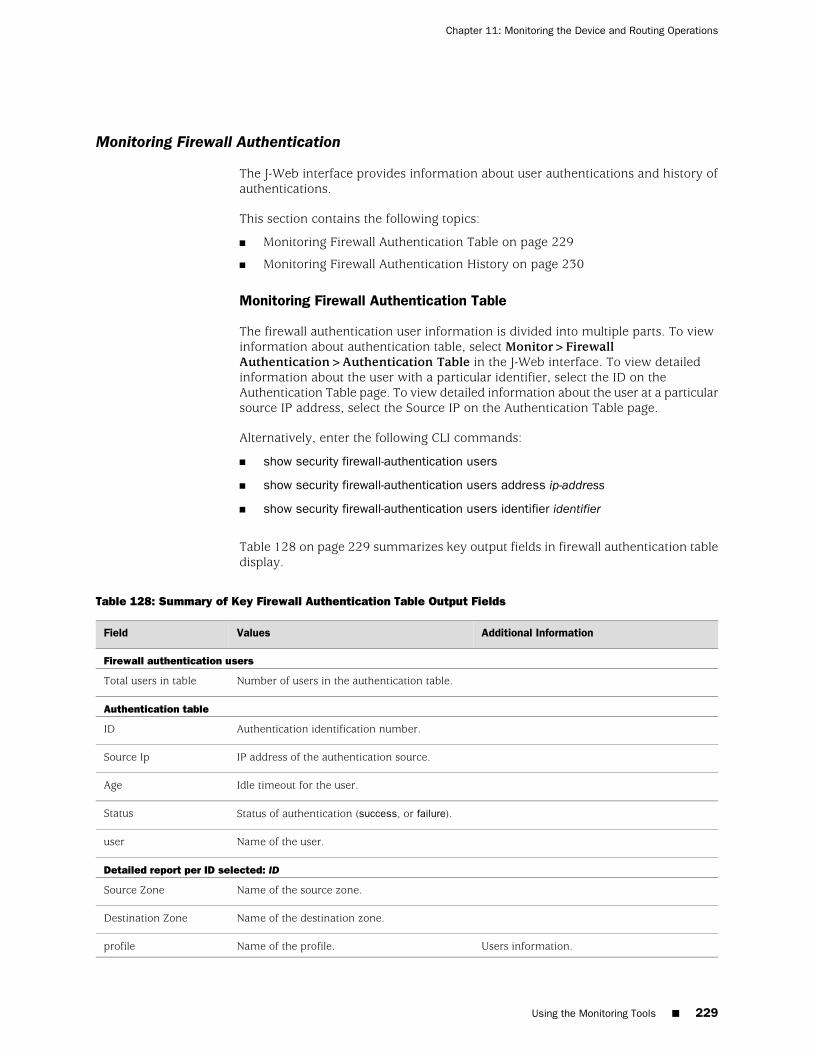
Monitoring Firewall Authentication
The J-Web interface provides information about user authentications and history ofauthentications.
This section contains the following topics:
■ Monitoring Firewall Authentication Table on page 229
■ Monitoring Firewall Authentication History on page 230
Monitoring Firewall Authentication Table
The firewall authentication user information is divided into multiple parts. To viewinformation about authentication table, select Monitor>FirewallAuthentication>Authentication Table in the J-Web interface. To view detailedinformation about the user with a particular identifier, select the ID on theAuthentication Table page. To view detailed information about the user at a particularsource IP address, select the Source IP on the Authentication Table page.
Alternatively, enter the following CLI commands:
■ show security firewall-authentication users
■ show security firewall-authentication users address ip-address
■ show security firewall-authentication users identifier identifier
Table 128 on page 229 summarizes key output fields in firewall authentication tabledisplay.
Table 128: Summary of Key Firewall Authentication Table Output Fields
Additional InformationValuesField
Firewall authentication users
Number of users in the authentication table.Total users in table
Authentication table
Authentication identification number.ID
IP address of the authentication source.Source Ip
Idle timeout for the user.Age
Status of authentication (success, or failure).Status
Name of the user.user
Detailed report per ID selected: ID
Name of the source zone.Source Zone
Name of the destination zone.Destination Zone
Users information.Name of the profile.profile
Using the Monitoring Tools ■ 229
Chapter 11: Monitoring the Device and Routing Operations
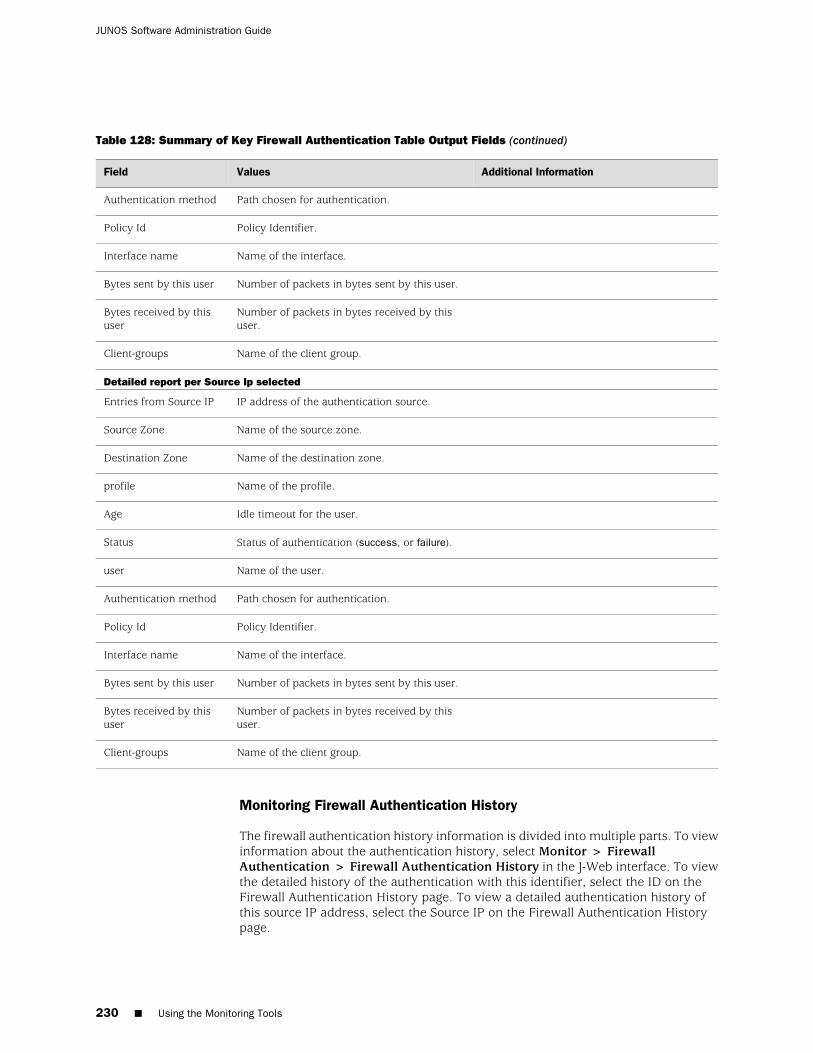
Table 128: Summary of Key Firewall Authentication Table Output Fields (continued)
Additional InformationValuesField
Path chosen for authentication.Authentication method
Policy Identifier.Policy Id
Name of the interface.Interface name
Number of packets in bytes sent by this user.Bytes sent by this user
Number of packets in bytes received by thisuser.
Bytes received by thisuser
Name of the client group.Client-groups
Detailed report per Source Ip selected
IP address of the authentication source.Entries from Source IP
Name of the source zone.Source Zone
Name of the destination zone.Destination Zone
Name of the profile.profile
Idle timeout for the user.Age
Status of authentication (success, or failure).Status
Name of the user.user
Path chosen for authentication.Authentication method
Policy Identifier.Policy Id
Name of the interface.Interface name
Number of packets in bytes sent by this user.Bytes sent by this user
Number of packets in bytes received by thisuser.
Bytes received by thisuser
Name of the client group.Client-groups
Monitoring Firewall Authentication History
The firewall authentication history information is divided into multiple parts. To viewinformation about the authentication history, select Monitor > FirewallAuthentication > Firewall Authentication History in the J-Web interface. To viewthe detailed history of the authentication with this identifier, select the ID on theFirewall Authentication History page. To view a detailed authentication history ofthis source IP address, select the Source IP on the Firewall Authentication Historypage.
230 ■ Using the Monitoring Tools
JUNOS Software Administration Guide
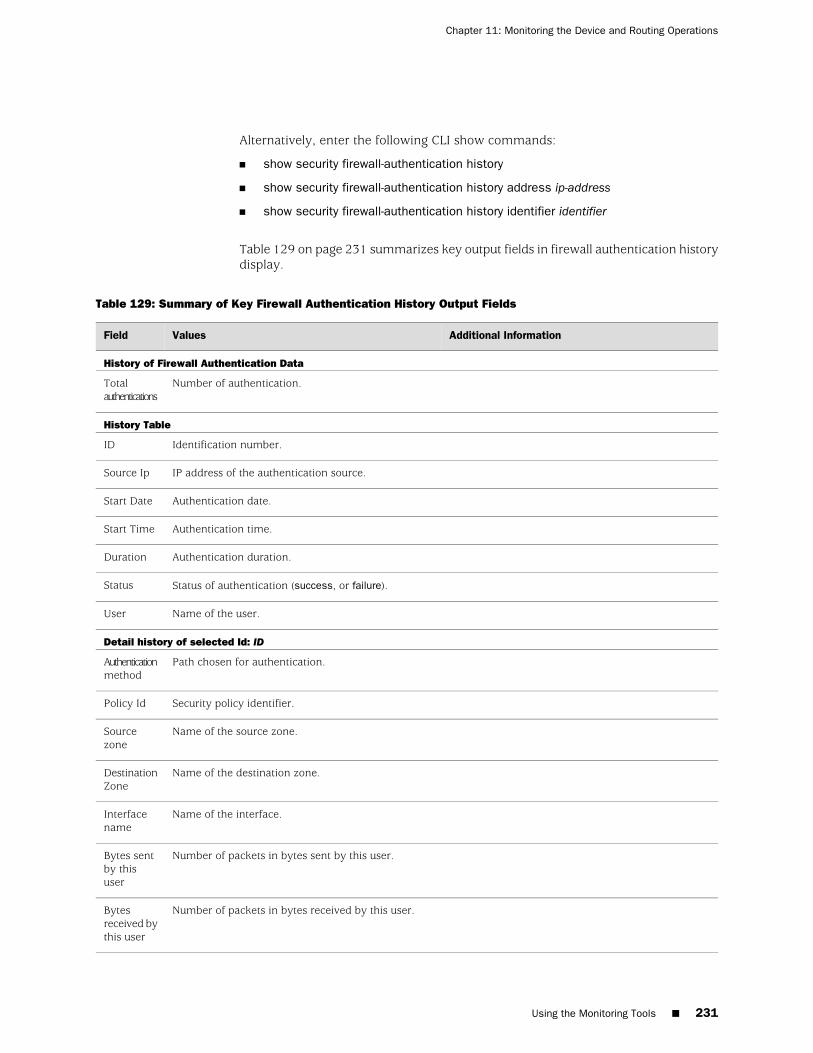
Alternatively, enter the following CLI show commands:
■ show security firewall-authentication history
■ show security firewall-authentication history address ip-address
■ show security firewall-authentication history identifier identifier
Table 129 on page 231 summarizes key output fields in firewall authentication historydisplay.
Table 129: Summary of Key Firewall Authentication History Output Fields
Additional InformationValuesField
History of Firewall Authentication Data
Number of authentication.Totalauthentications
History Table
Identification number.ID
IP address of the authentication source.Source Ip
Authentication date.Start Date
Authentication time.Start Time
Authentication duration.Duration
Status of authentication (success, or failure).Status
Name of the user.User
Detail history of selected Id: ID
Path chosen for authentication.Authenticationmethod
Security policy identifier.Policy Id
Name of the source zone.Sourcezone
Name of the destination zone.DestinationZone
Name of the interface.Interfacename
Number of packets in bytes sent by this user.Bytes sentby thisuser
Number of packets in bytes received by this user.Bytesreceived bythis user
Using the Monitoring Tools ■ 231
Chapter 11: Monitoring the Device and Routing Operations
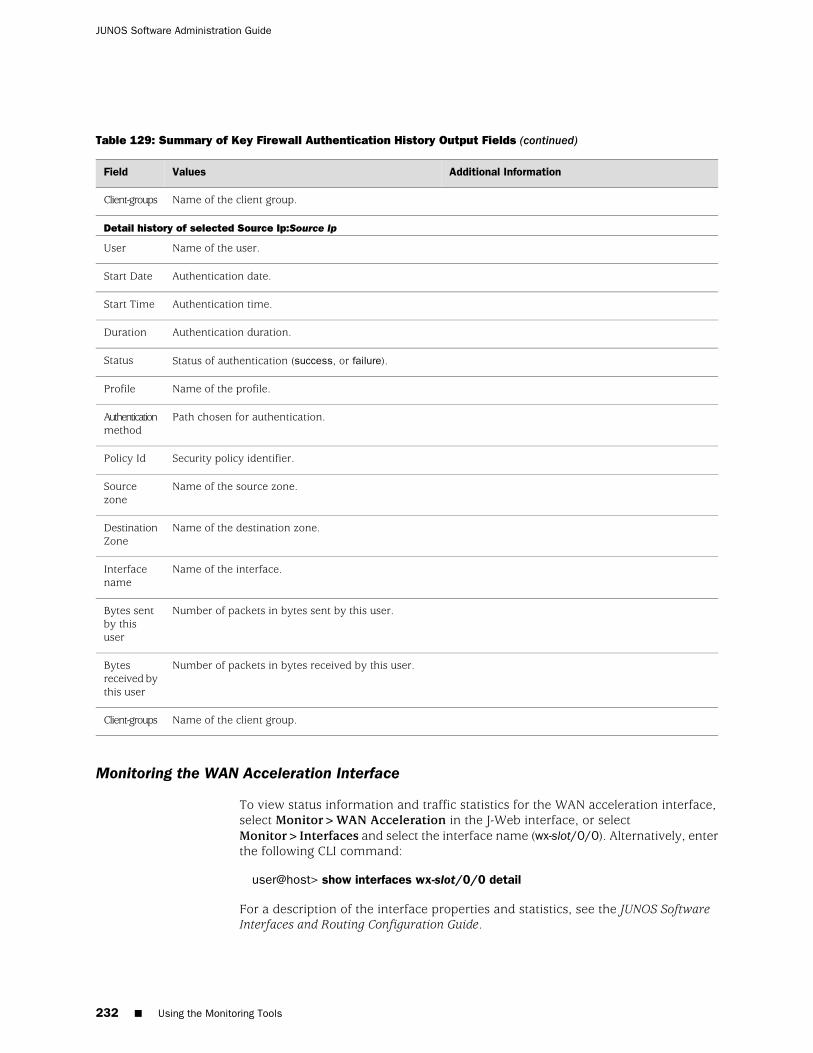
Table 129: Summary of Key Firewall Authentication History Output Fields (continued)
Additional InformationValuesField
Name of the client group.Client-groups
Detail history of selected Source Ip:Source Ip
Name of the user.User
Authentication date.Start Date
Authentication time.Start Time
Authentication duration.Duration
Status of authentication (success, or failure).Status
Name of the profile.Profile
Path chosen for authentication.Authenticationmethod
Security policy identifier.Policy Id
Name of the source zone.Sourcezone
Name of the destination zone.DestinationZone
Name of the interface.Interfacename
Number of packets in bytes sent by this user.Bytes sentby thisuser
Number of packets in bytes received by this user.Bytesreceived bythis user
Name of the client group.Client-groups
Monitoring the WAN Acceleration Interface
To view status information and traffic statistics for the WAN acceleration interface,select Monitor>WAN Acceleration in the J-Web interface, or selectMonitor>Interfaces and select the interface name (wx-slot/0/0). Alternatively, enterthe following CLI command:
user@host> show interfaces wx-slot/0/0 detail
For a description of the interface properties and statistics, see the JUNOS SoftwareInterfaces and Routing Configuration Guide.
232 ■ Using the Monitoring Tools
JUNOS Software Administration Guide
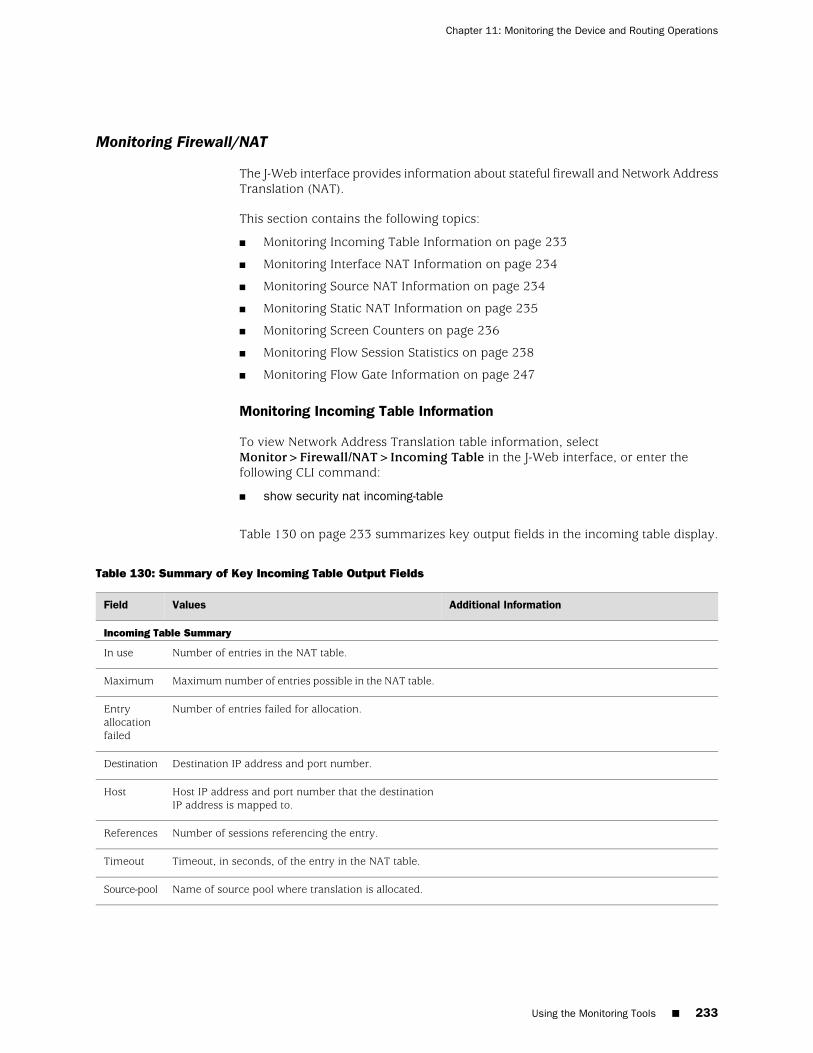
Monitoring Firewall/NAT
The J-Web interface provides information about stateful firewall and Network AddressTranslation (NAT).
This section contains the following topics:
■ Monitoring Incoming Table Information on page 233
■ Monitoring Interface NAT Information on page 234
■ Monitoring Source NAT Information on page 234
■ Monitoring Static NAT Information on page 235
■ Monitoring Screen Counters on page 236
■ Monitoring Flow Session Statistics on page 238
■ Monitoring Flow Gate Information on page 247
Monitoring Incoming Table Information
To view Network Address Translation table information, selectMonitor>Firewall/NAT>Incoming Table in the J-Web interface, or enter thefollowing CLI command:
■ show security nat incoming-table
Table 130 on page 233 summarizes key output fields in the incoming table display.
Table 130: Summary of Key Incoming Table Output Fields
Additional InformationValuesField
Incoming Table Summary
Number of entries in the NAT table.In use
Maximum number of entries possible in the NAT table.Maximum
Number of entries failed for allocation.Entryallocationfailed
Destination IP address and port number.Destination
Host IP address and port number that the destinationIP address is mapped to.
Host
Number of sessions referencing the entry.References
Timeout, in seconds, of the entry in the NAT table.Timeout
Name of source pool where translation is allocated.Source-pool
Using the Monitoring Tools ■ 233
Chapter 11: Monitoring the Device and Routing Operations
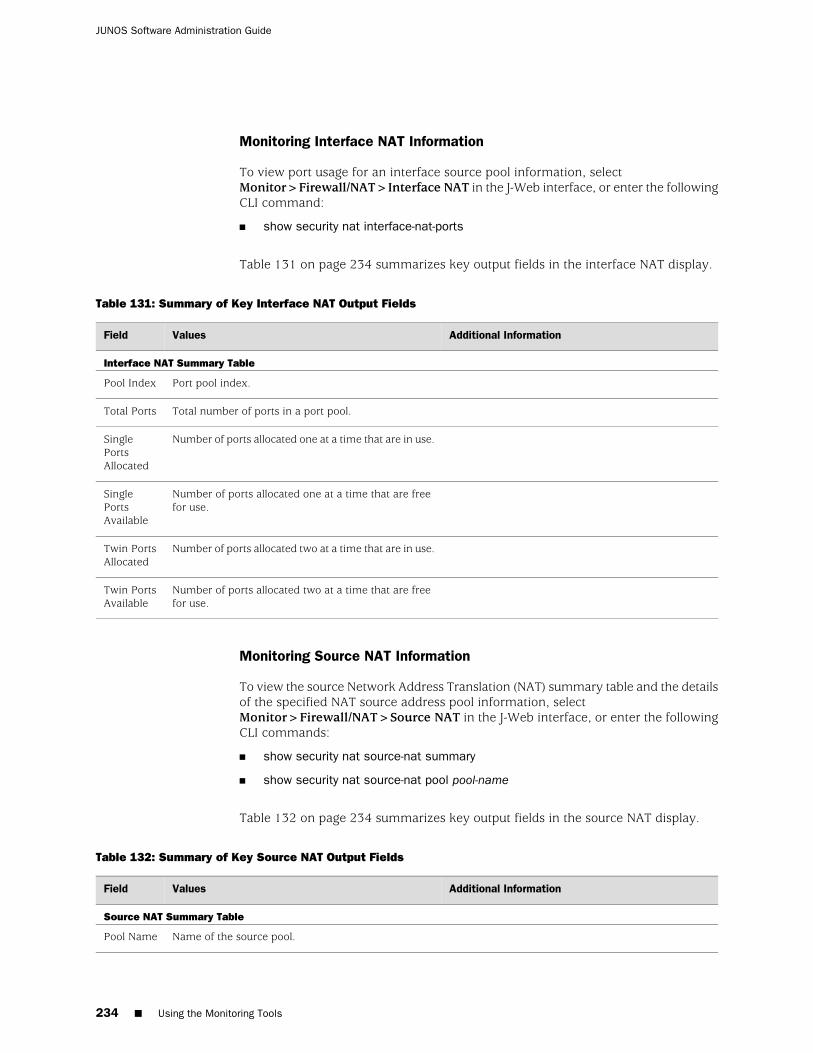
Monitoring Interface NAT Information
To view port usage for an interface source pool information, selectMonitor>Firewall/NAT>Interface NAT in the J-Web interface, or enter the followingCLI command:
■ show security nat interface-nat-ports
Table 131 on page 234 summarizes key output fields in the interface NAT display.
Table 131: Summary of Key Interface NAT Output Fields
Additional InformationValuesField
Interface NAT Summary Table
Port pool index.Pool Index
Total number of ports in a port pool.Total Ports
Number of ports allocated one at a time that are in use.SinglePortsAllocated
Number of ports allocated one at a time that are freefor use.
SinglePortsAvailable
Number of ports allocated two at a time that are in use.Twin PortsAllocated
Number of ports allocated two at a time that are freefor use.
Twin PortsAvailable
Monitoring Source NAT Information
To view the source Network Address Translation (NAT) summary table and the detailsof the specified NAT source address pool information, selectMonitor>Firewall/NAT>Source NAT in the J-Web interface, or enter the followingCLI commands:
■ show security nat source-nat summary
■ show security nat source-nat pool pool-name
Table 132 on page 234 summarizes key output fields in the source NAT display.
Table 132: Summary of Key Source NAT Output Fields
Additional InformationValuesField
Source NAT Summary Table
Name of the source pool.Pool Name
234 ■ Using the Monitoring Tools
JUNOS Software Administration Guide
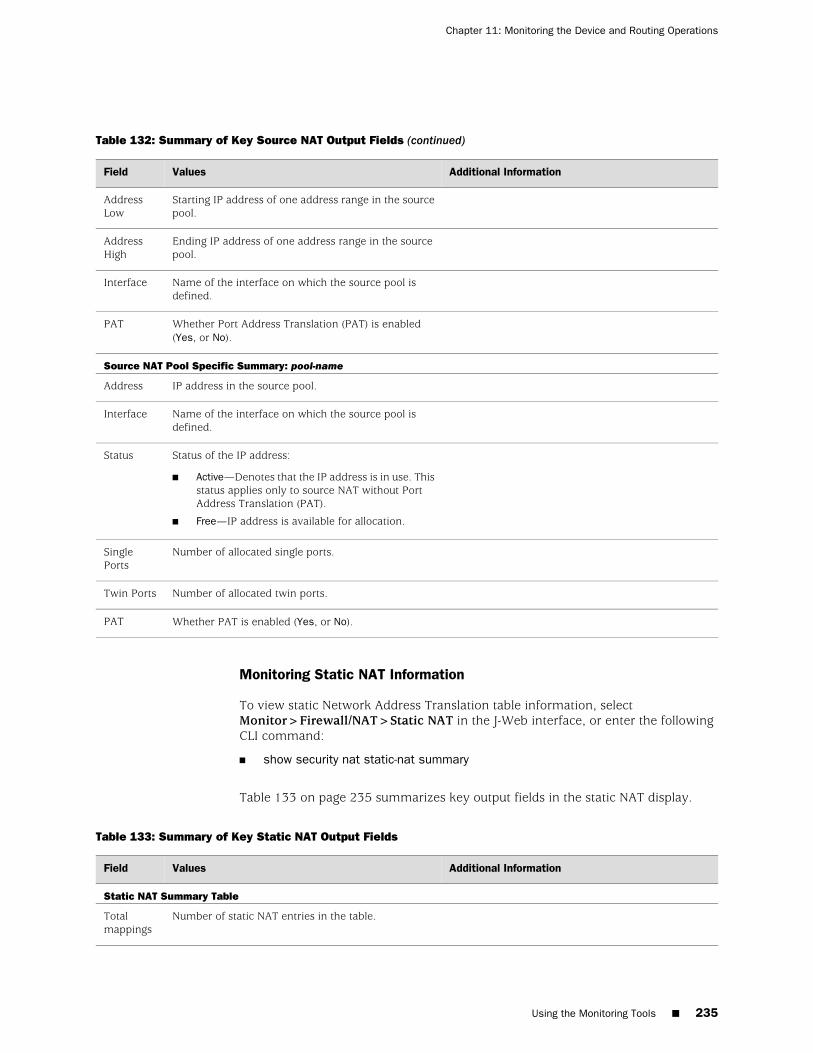
Table 132: Summary of Key Source NAT Output Fields (continued)
Additional InformationValuesField
Starting IP address of one address range in the sourcepool.
AddressLow
Ending IP address of one address range in the sourcepool.
AddressHigh
Name of the interface on which the source pool isdefined.
Interface
Whether Port Address Translation (PAT) is enabled(Yes, or No).
PAT
Source NAT Pool Specific Summary: pool-name
IP address in the source pool.Address
Name of the interface on which the source pool isdefined.
Interface
Status of the IP address:
■ Active—Denotes that the IP address is in use. Thisstatus applies only to source NAT without PortAddress Translation (PAT).
■ Free—IP address is available for allocation.
Status
Number of allocated single ports.SinglePorts
Number of allocated twin ports.Twin Ports
Whether PAT is enabled (Yes, or No).PAT
Monitoring Static NAT Information
To view static Network Address Translation table information, selectMonitor>Firewall/NAT>Static NAT in the J-Web interface, or enter the followingCLI command:
■ show security nat static-nat summary
Table 133 on page 235 summarizes key output fields in the static NAT display.
Table 133: Summary of Key Static NAT Output Fields
Additional InformationValuesField
Static NAT Summary Table
Number of static NAT entries in the table.Totalmappings
Using the Monitoring Tools ■ 235
Chapter 11: Monitoring the Device and Routing Operations
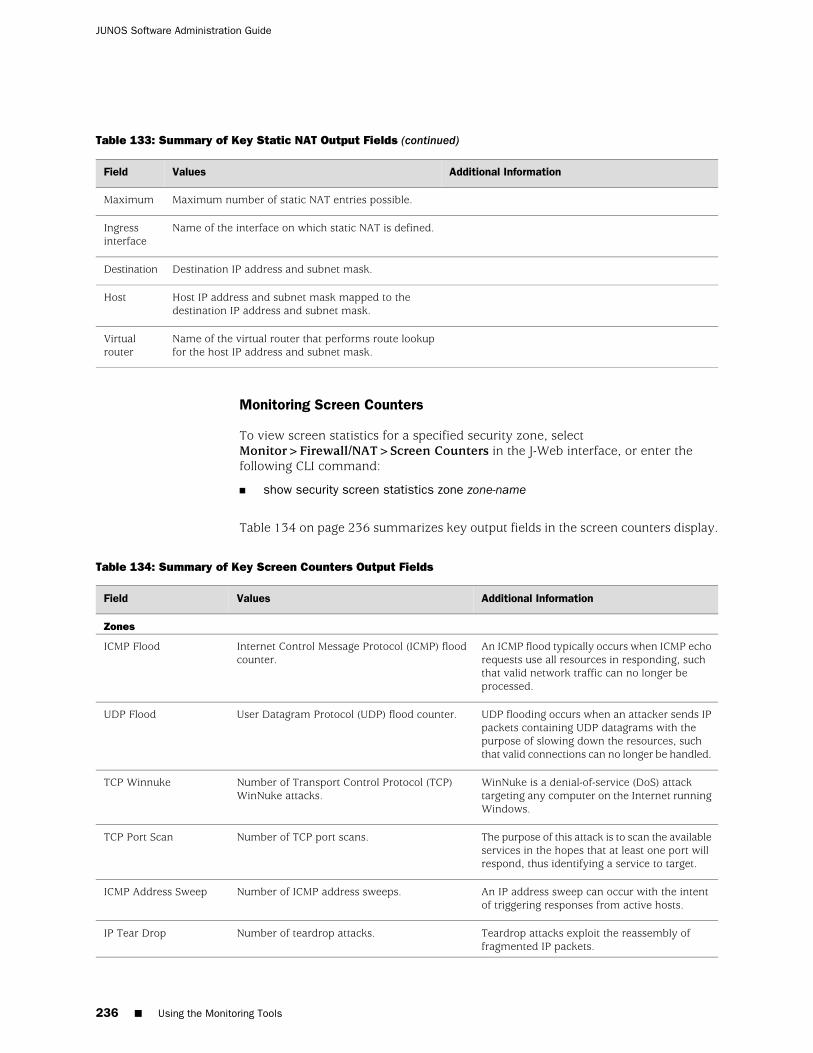
Table 133: Summary of Key Static NAT Output Fields (continued)
Additional InformationValuesField
Maximum number of static NAT entries possible.Maximum
Name of the interface on which static NAT is defined.Ingressinterface
Destination IP address and subnet mask.Destination
Host IP address and subnet mask mapped to thedestination IP address and subnet mask.
Host
Name of the virtual router that performs route lookupfor the host IP address and subnet mask.
Virtualrouter
Monitoring Screen Counters
To view screen statistics for a specified security zone, selectMonitor>Firewall/NAT>Screen Counters in the J-Web interface, or enter thefollowing CLI command:
■ show security screen statistics zone zone-name
Table 134 on page 236 summarizes key output fields in the screen counters display.
Table 134: Summary of Key Screen Counters Output Fields
Additional InformationValuesField
Zones
An ICMP flood typically occurs when ICMP echorequests use all resources in responding, suchthat valid network traffic can no longer beprocessed.
Internet Control Message Protocol (ICMP) floodcounter.
ICMP Flood
UDP flooding occurs when an attacker sends IPpackets containing UDP datagrams with thepurpose of slowing down the resources, suchthat valid connections can no longer be handled.
User Datagram Protocol (UDP) flood counter.UDP Flood
WinNuke is a denial-of-service (DoS) attacktargeting any computer on the Internet runningWindows.
Number of Transport Control Protocol (TCP)WinNuke attacks.
TCP Winnuke
The purpose of this attack is to scan the availableservices in the hopes that at least one port willrespond, thus identifying a service to target.
Number of TCP port scans.TCP Port Scan
An IP address sweep can occur with the intentof triggering responses from active hosts.
Number of ICMP address sweeps.ICMP Address Sweep
Teardrop attacks exploit the reassembly offragmented IP packets.
Number of teardrop attacks.IP Tear Drop
236 ■ Using the Monitoring Tools
JUNOS Software Administration Guide
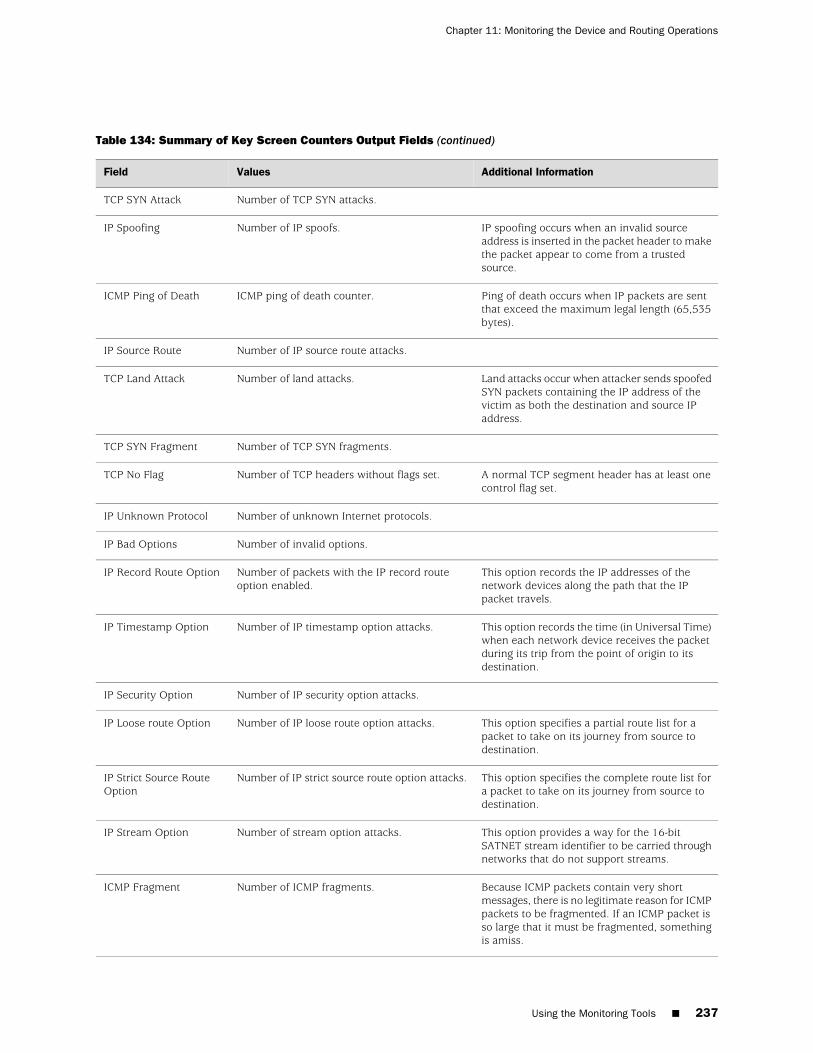
Table 134: Summary of Key Screen Counters Output Fields (continued)
Additional InformationValuesField
Number of TCP SYN attacks.TCP SYN Attack
IP spoofing occurs when an invalid sourceaddress is inserted in the packet header to makethe packet appear to come from a trustedsource.
Number of IP spoofs.IP Spoofing
Ping of death occurs when IP packets are sentthat exceed the maximum legal length (65,535bytes).
ICMP ping of death counter.ICMP Ping of Death
Number of IP source route attacks.IP Source Route
Land attacks occur when attacker sends spoofedSYN packets containing the IP address of thevictim as both the destination and source IPaddress.
Number of land attacks.TCP Land Attack
Number of TCP SYN fragments.TCP SYN Fragment
A normal TCP segment header has at least onecontrol flag set.
Number of TCP headers without flags set.TCP No Flag
Number of unknown Internet protocols.IP Unknown Protocol
Number of invalid options.IP Bad Options
This option records the IP addresses of thenetwork devices along the path that the IPpacket travels.
Number of packets with the IP record routeoption enabled.
IP Record Route Option
This option records the time (in Universal Time)when each network device receives the packetduring its trip from the point of origin to itsdestination.
Number of IP timestamp option attacks.IP Timestamp Option
Number of IP security option attacks.IP Security Option
This option specifies a partial route list for apacket to take on its journey from source todestination.
Number of IP loose route option attacks.IP Loose route Option
This option specifies the complete route list fora packet to take on its journey from source todestination.
Number of IP strict source route option attacks.IP Strict Source RouteOption
This option provides a way for the 16-bitSATNET stream identifier to be carried throughnetworks that do not support streams.
Number of stream option attacks.IP Stream Option
Because ICMP packets contain very shortmessages, there is no legitimate reason for ICMPpackets to be fragmented. If an ICMP packet isso large that it must be fragmented, somethingis amiss.
Number of ICMP fragments.ICMP Fragment
Using the Monitoring Tools ■ 237
Chapter 11: Monitoring the Device and Routing Operations
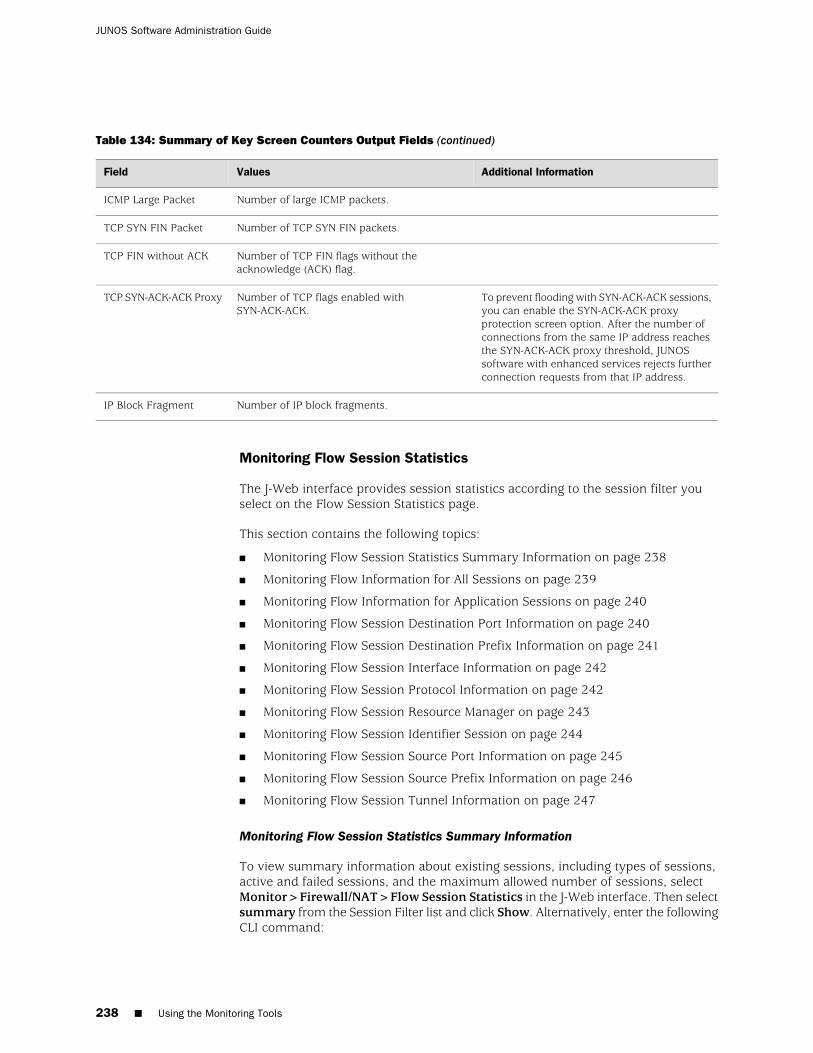
Table 134: Summary of Key Screen Counters Output Fields (continued)
Additional InformationValuesField
Number of large ICMP packets.ICMP Large Packet
Number of TCP SYN FIN packets.TCP SYN FIN Packet
Number of TCP FIN flags without theacknowledge (ACK) flag.
TCP FIN without ACK
To prevent flooding with SYN-ACK-ACK sessions,you can enable the SYN-ACK-ACK proxyprotection screen option. After the number ofconnections from the same IP address reachesthe SYN-ACK-ACK proxy threshold, JUNOSsoftware with enhanced services rejects furtherconnection requests from that IP address.
Number of TCP flags enabled withSYN-ACK-ACK.
TCP SYN-ACK-ACK Proxy
Number of IP block fragments.IP Block Fragment
Monitoring Flow Session Statistics
The J-Web interface provides session statistics according to the session filter youselect on the Flow Session Statistics page.
This section contains the following topics:
■ Monitoring Flow Session Statistics Summary Information on page 238
■ Monitoring Flow Information for All Sessions on page 239
■ Monitoring Flow Information for Application Sessions on page 240
■ Monitoring Flow Session Destination Port Information on page 240
■ Monitoring Flow Session Destination Prefix Information on page 241
■ Monitoring Flow Session Interface Information on page 242
■ Monitoring Flow Session Protocol Information on page 242
■ Monitoring Flow Session Resource Manager on page 243
■ Monitoring Flow Session Identifier Session on page 244
■ Monitoring Flow Session Source Port Information on page 245
■ Monitoring Flow Session Source Prefix Information on page 246
■ Monitoring Flow Session Tunnel Information on page 247
Monitoring Flow Session Statistics Summary Information
To view summary information about existing sessions, including types of sessions,active and failed sessions, and the maximum allowed number of sessions, selectMonitor>Firewall/NAT>Flow Session Statistics in the J-Web interface. Then selectsummary from the Session Filter list and click Show. Alternatively, enter the followingCLI command:
238 ■ Using the Monitoring Tools
JUNOS Software Administration Guide
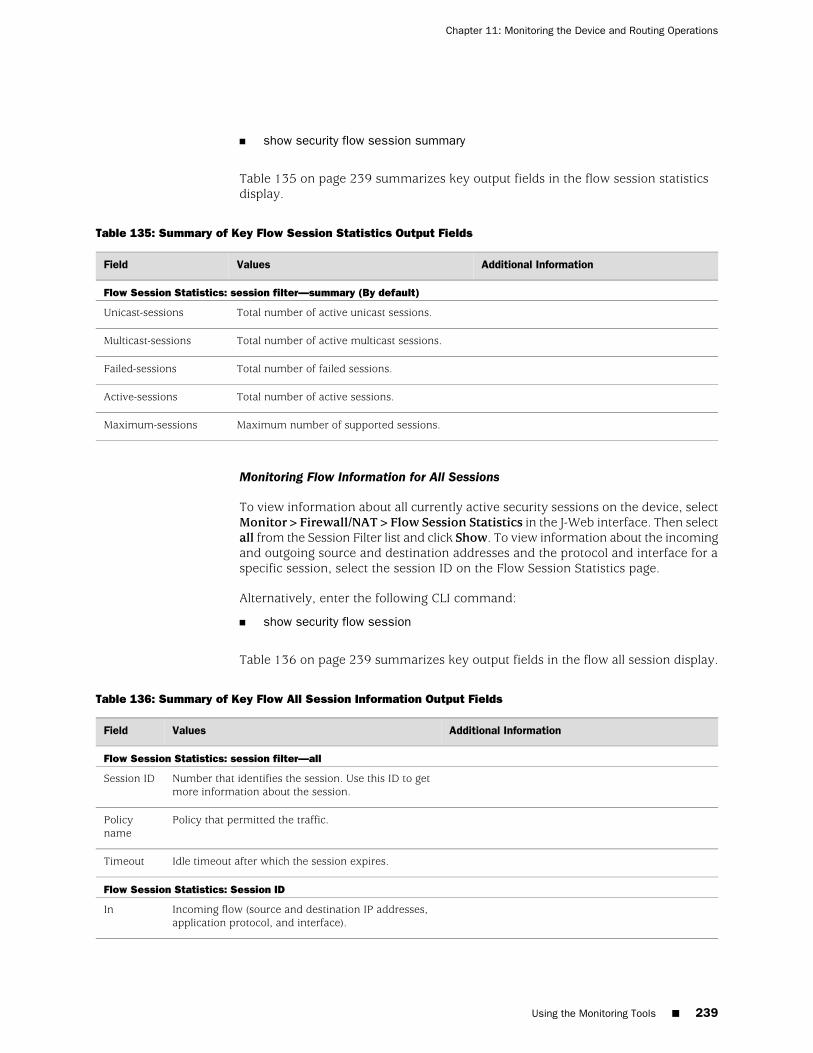
■ show security flow session summary
Table 135 on page 239 summarizes key output fields in the flow session statisticsdisplay.
Table 135: Summary of Key Flow Session Statistics Output Fields
Additional InformationValuesField
Flow Session Statistics: session filter—summary (By default)
Total number of active unicast sessions.Unicast-sessions
Total number of active multicast sessions.Multicast-sessions
Total number of failed sessions.Failed-sessions
Total number of active sessions.Active-sessions
Maximum number of supported sessions.Maximum-sessions
Monitoring Flow Information for All Sessions
To view information about all currently active security sessions on the device, selectMonitor>Firewall/NAT>Flow Session Statistics in the J-Web interface. Then selectall from the Session Filter list and click Show. To view information about the incomingand outgoing source and destination addresses and the protocol and interface for aspecific session, select the session ID on the Flow Session Statistics page.
Alternatively, enter the following CLI command:
■ show security flow session
Table 136 on page 239 summarizes key output fields in the flow all session display.
Table 136: Summary of Key Flow All Session Information Output Fields
Additional InformationValuesField
Flow Session Statistics: session filter—all
Number that identifies the session. Use this ID to getmore information about the session.
Session ID
Policy that permitted the traffic.Policyname
Idle timeout after which the session expires.Timeout
Flow Session Statistics: Session ID
Incoming flow (source and destination IP addresses,application protocol, and interface).
In
Using the Monitoring Tools ■ 239
Chapter 11: Monitoring the Device and Routing Operations
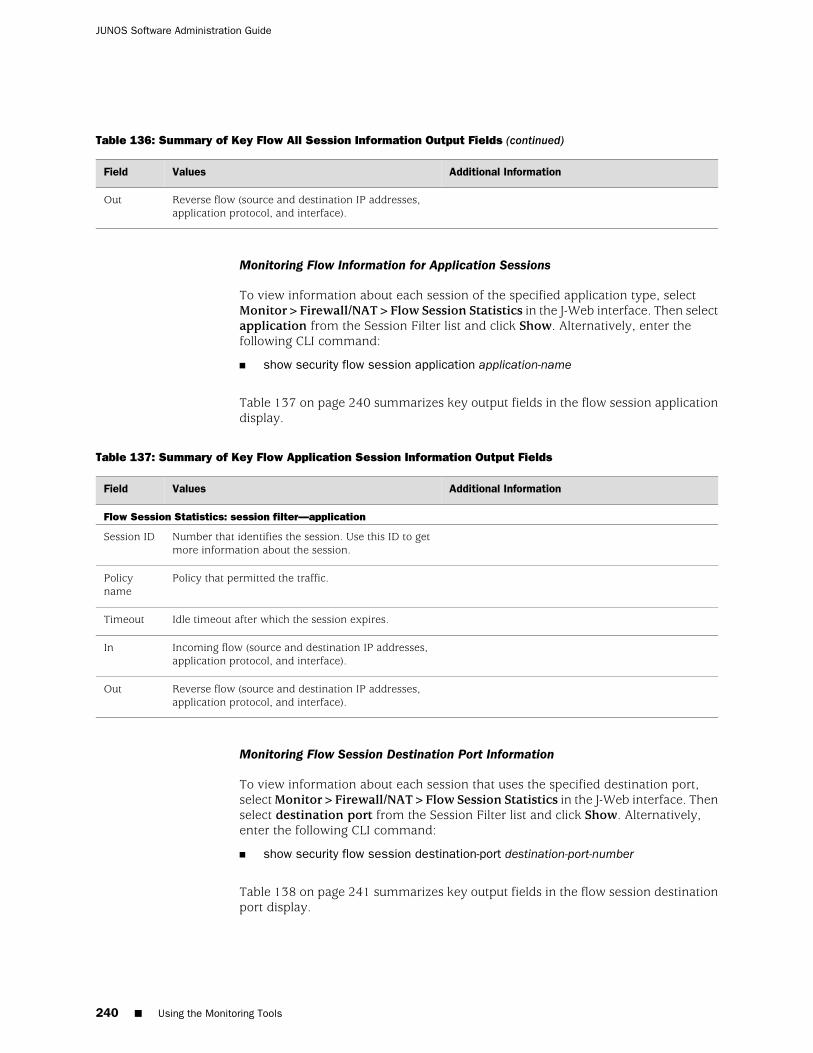
Table 136: Summary of Key Flow All Session Information Output Fields (continued)
Additional InformationValuesField
Reverse flow (source and destination IP addresses,application protocol, and interface).
Out
Monitoring Flow Information for Application Sessions
To view information about each session of the specified application type, selectMonitor>Firewall/NAT>Flow Session Statistics in the J-Web interface. Then selectapplication from the Session Filter list and click Show. Alternatively, enter thefollowing CLI command:
■ show security flow session application application-name
Table 137 on page 240 summarizes key output fields in the flow session applicationdisplay.
Table 137: Summary of Key Flow Application Session Information Output Fields
Additional InformationValuesField
Flow Session Statistics: session filter—application
Number that identifies the session. Use this ID to getmore information about the session.
Session ID
Policy that permitted the traffic.Policyname
Idle timeout after which the session expires.Timeout
Incoming flow (source and destination IP addresses,application protocol, and interface).
In
Reverse flow (source and destination IP addresses,application protocol, and interface).
Out
Monitoring Flow Session Destination Port Information
To view information about each session that uses the specified destination port,select Monitor>Firewall/NAT>Flow Session Statistics in the J-Web interface. Thenselect destination port from the Session Filter list and click Show. Alternatively,enter the following CLI command:
■ show security flow session destination-port destination-port-number
Table 138 on page 241 summarizes key output fields in the flow session destinationport display.
240 ■ Using the Monitoring Tools
JUNOS Software Administration Guide
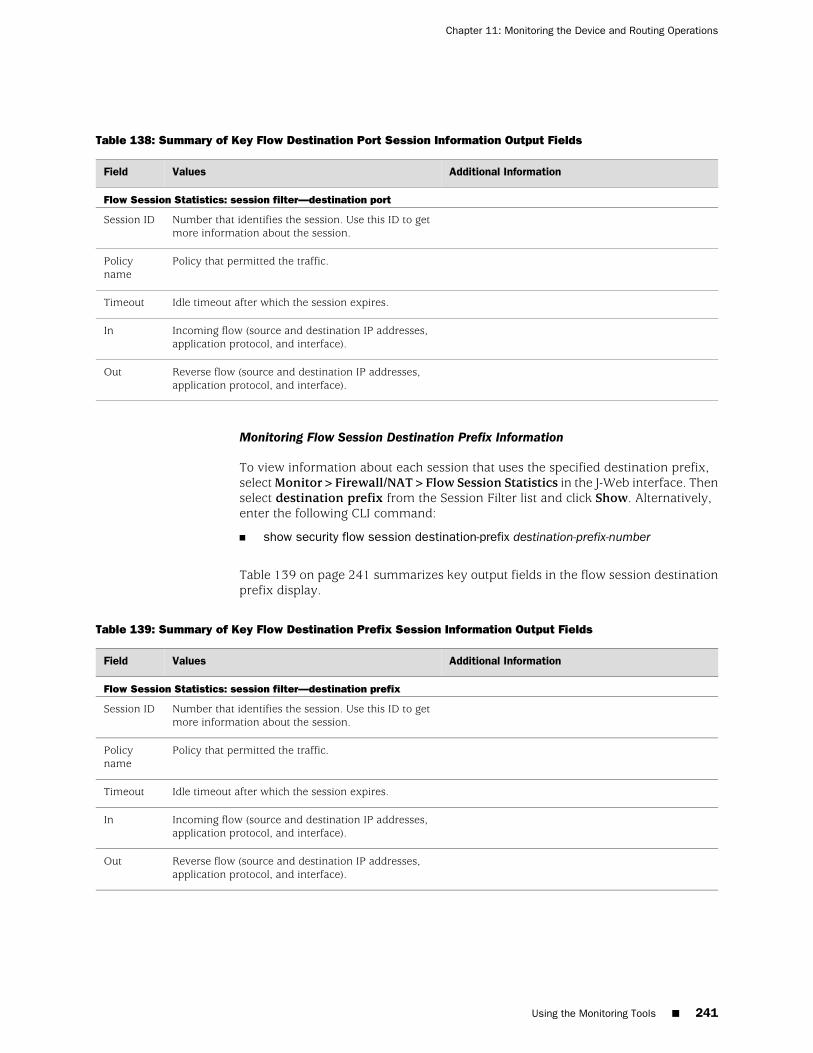
Table 138: Summary of Key Flow Destination Port Session Information Output Fields
Additional InformationValuesField
Flow Session Statistics: session filter—destination port
Number that identifies the session. Use this ID to getmore information about the session.
Session ID
Policy that permitted the traffic.Policyname
Idle timeout after which the session expires.Timeout
Incoming flow (source and destination IP addresses,application protocol, and interface).
In
Reverse flow (source and destination IP addresses,application protocol, and interface).
Out
Monitoring Flow Session Destination Prefix Information
To view information about each session that uses the specified destination prefix,select Monitor>Firewall/NAT>Flow Session Statistics in the J-Web interface. Thenselect destination prefix from the Session Filter list and click Show. Alternatively,enter the following CLI command:
■ show security flow session destination-prefix destination-prefix-number
Table 139 on page 241 summarizes key output fields in the flow session destinationprefix display.
Table 139: Summary of Key Flow Destination Prefix Session Information Output Fields
Additional InformationValuesField
Flow Session Statistics: session filter—destination prefix
Number that identifies the session. Use this ID to getmore information about the session.
Session ID
Policy that permitted the traffic.Policyname
Idle timeout after which the session expires.Timeout
Incoming flow (source and destination IP addresses,application protocol, and interface).
In
Reverse flow (source and destination IP addresses,application protocol, and interface).
Out
Using the Monitoring Tools ■ 241
Chapter 11: Monitoring the Device and Routing Operations
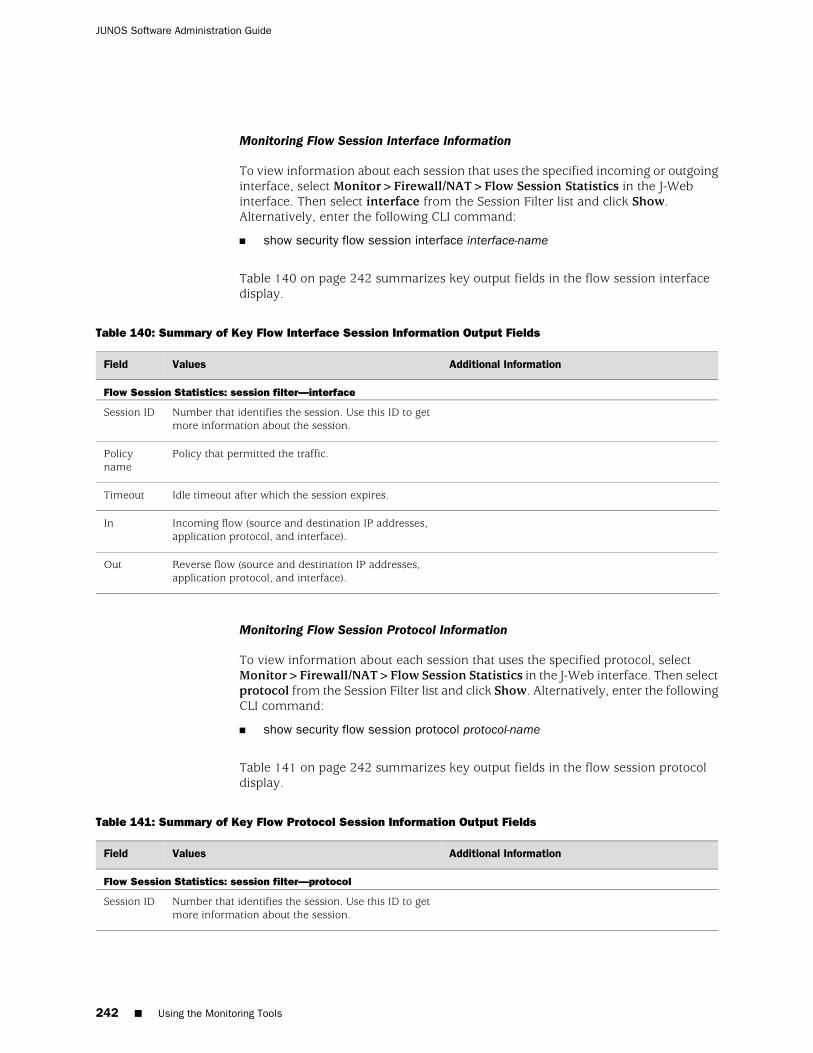
Monitoring Flow Session Interface Information
To view information about each session that uses the specified incoming or outgoinginterface, select Monitor>Firewall/NAT>Flow Session Statistics in the J-Webinterface. Then select interface from the Session Filter list and click Show.Alternatively, enter the following CLI command:
■ show security flow session interface interface-name
Table 140 on page 242 summarizes key output fields in the flow session interfacedisplay.
Table 140: Summary of Key Flow Interface Session Information Output Fields
Additional InformationValuesField
Flow Session Statistics: session filter—interface
Number that identifies the session. Use this ID to getmore information about the session.
Session ID
Policy that permitted the traffic.Policyname
Idle timeout after which the session expires.Timeout
Incoming flow (source and destination IP addresses,application protocol, and interface).
In
Reverse flow (source and destination IP addresses,application protocol, and interface).
Out
Monitoring Flow Session Protocol Information
To view information about each session that uses the specified protocol, selectMonitor>Firewall/NAT>Flow Session Statistics in the J-Web interface. Then selectprotocol from the Session Filter list and click Show. Alternatively, enter the followingCLI command:
■ show security flow session protocol protocol-name
Table 141 on page 242 summarizes key output fields in the flow session protocoldisplay.
Table 141: Summary of Key Flow Protocol Session Information Output Fields
Additional InformationValuesField
Flow Session Statistics: session filter—protocol
Number that identifies the session. Use this ID to getmore information about the session.
Session ID
242 ■ Using the Monitoring Tools
JUNOS Software Administration Guide
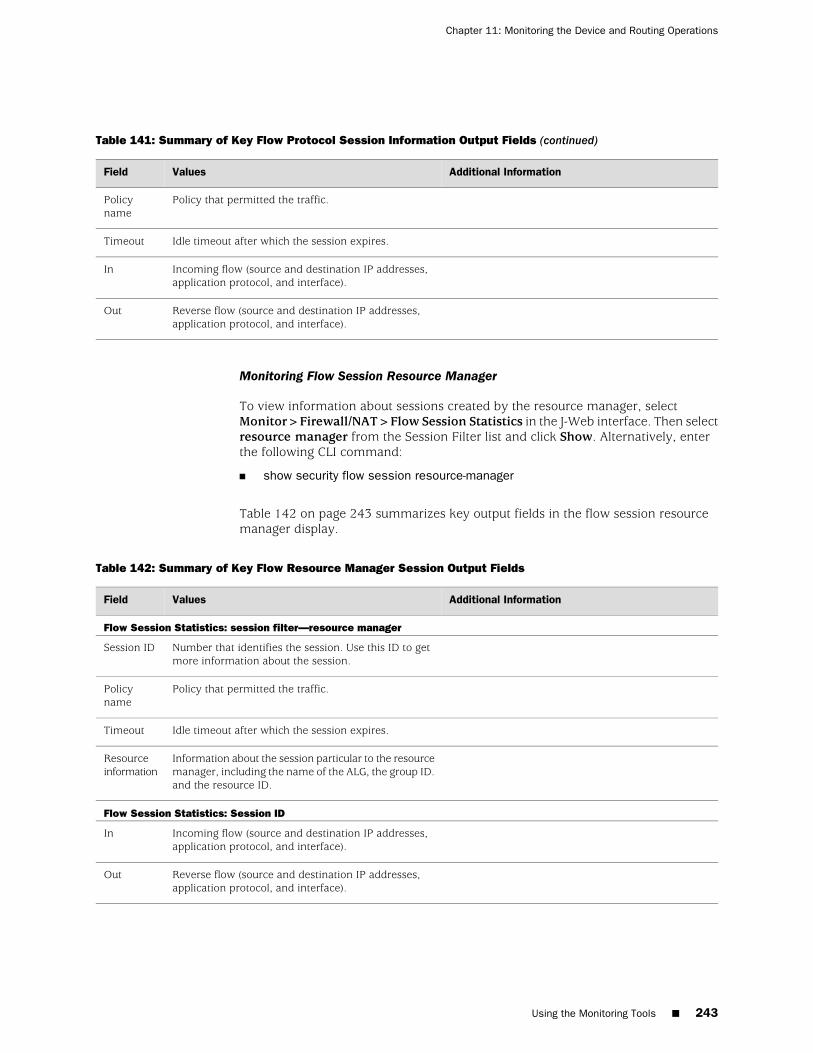
Table 141: Summary of Key Flow Protocol Session Information Output Fields (continued)
Additional InformationValuesField
Policy that permitted the traffic.Policyname
Idle timeout after which the session expires.Timeout
Incoming flow (source and destination IP addresses,application protocol, and interface).
In
Reverse flow (source and destination IP addresses,application protocol, and interface).
Out
Monitoring Flow Session Resource Manager
To view information about sessions created by the resource manager, selectMonitor>Firewall/NAT>Flow Session Statistics in the J-Web interface. Then selectresource manager from the Session Filter list and click Show. Alternatively, enterthe following CLI command:
■ show security flow session resource-manager
Table 142 on page 243 summarizes key output fields in the flow session resourcemanager display.
Table 142: Summary of Key Flow Resource Manager Session Output Fields
Additional InformationValuesField
Flow Session Statistics: session filter—resource manager
Number that identifies the session. Use this ID to getmore information about the session.
Session ID
Policy that permitted the traffic.Policyname
Idle timeout after which the session expires.Timeout
Information about the session particular to the resourcemanager, including the name of the ALG, the group ID.and the resource ID.
Resourceinformation
Flow Session Statistics: Session ID
Incoming flow (source and destination IP addresses,application protocol, and interface).
In
Reverse flow (source and destination IP addresses,application protocol, and interface).
Out
Using the Monitoring Tools ■ 243
Chapter 11: Monitoring the Device and Routing Operations
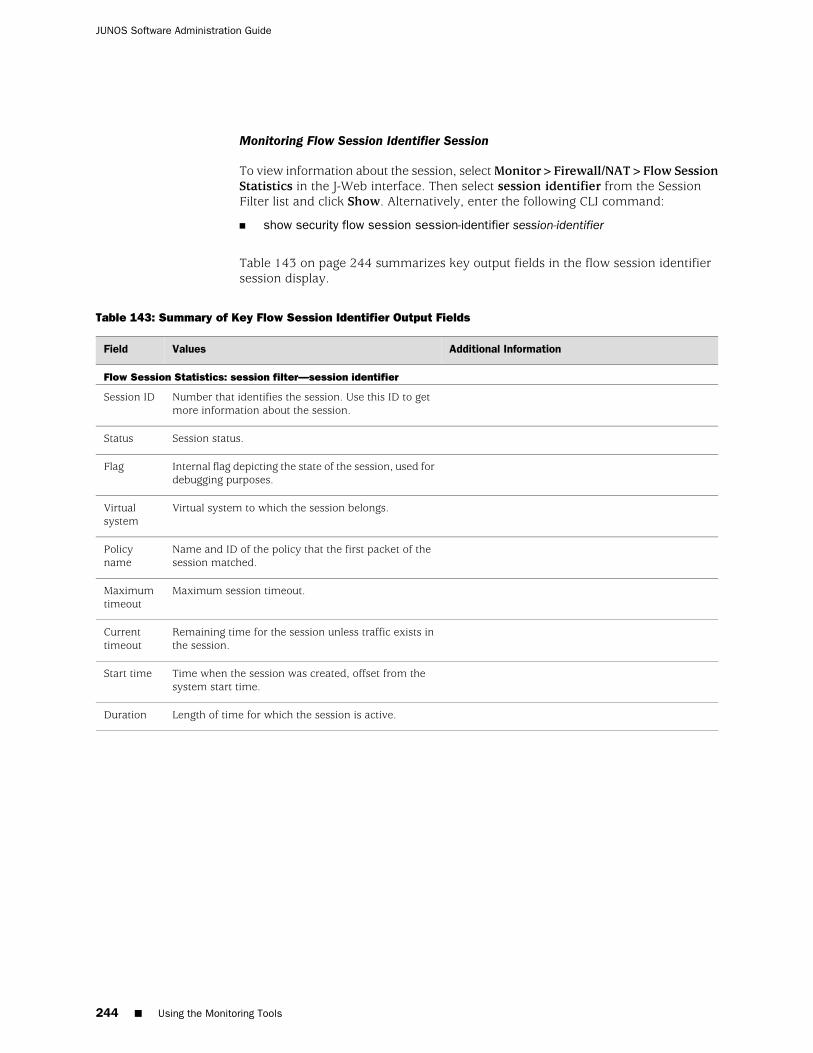
Monitoring Flow Session Identifier Session
To view information about the session, select Monitor>Firewall/NAT>Flow SessionStatistics in the J-Web interface. Then select session identifier from the SessionFilter list and click Show. Alternatively, enter the following CLI command:
■ show security flow session session-identifier session-identifier
Table 143 on page 244 summarizes key output fields in the flow session identifiersession display.
Table 143: Summary of Key Flow Session Identifier Output Fields
Additional InformationValuesField
Flow Session Statistics: session filter—session identifier
Number that identifies the session. Use this ID to getmore information about the session.
Session ID
Session status.Status
Internal flag depicting the state of the session, used fordebugging purposes.
Flag
Virtual system to which the session belongs.Virtualsystem
Name and ID of the policy that the first packet of thesession matched.
Policyname
Maximum session timeout.Maximumtimeout
Remaining time for the session unless traffic exists inthe session.
Currenttimeout
Time when the session was created, offset from thesystem start time.
Start time
Length of time for which the session is active.Duration
244 ■ Using the Monitoring Tools
JUNOS Software Administration Guide
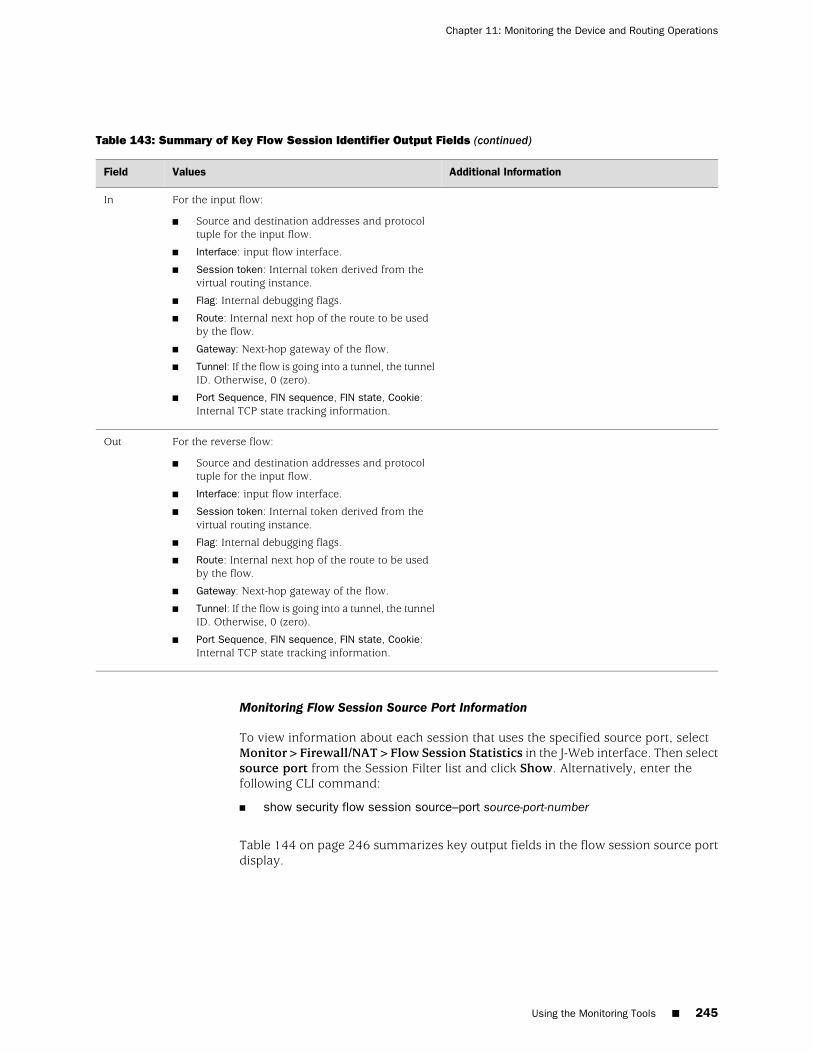
Table 143: Summary of Key Flow Session Identifier Output Fields (continued)
Additional InformationValuesField
For the input flow:
■ Source and destination addresses and protocoltuple for the input flow.
■ Interface: input flow interface.
■ Session token: Internal token derived from thevirtual routing instance.
■ Flag: Internal debugging flags.
■ Route: Internal next hop of the route to be usedby the flow.
■ Gateway: Next-hop gateway of the flow.
■ Tunnel: If the flow is going into a tunnel, the tunnelID. Otherwise, 0 (zero).
■ Port Sequence, FIN sequence, FIN state, Cookie:Internal TCP state tracking information.
In
For the reverse flow:
■ Source and destination addresses and protocoltuple for the input flow.
■ Interface: input flow interface.
■ Session token: Internal token derived from thevirtual routing instance.
■ Flag: Internal debugging flags.
■ Route: Internal next hop of the route to be usedby the flow.
■ Gateway: Next-hop gateway of the flow.
■ Tunnel: If the flow is going into a tunnel, the tunnelID. Otherwise, 0 (zero).
■ Port Sequence, FIN sequence, FIN state, Cookie:Internal TCP state tracking information.
Out
Monitoring Flow Session Source Port Information
To view information about each session that uses the specified source port, selectMonitor>Firewall/NAT>Flow Session Statistics in the J-Web interface. Then selectsource port from the Session Filter list and click Show. Alternatively, enter thefollowing CLI command:
■ show security flow session source–port source-port-number
Table 144 on page 246 summarizes key output fields in the flow session source portdisplay.
Using the Monitoring Tools ■ 245
Chapter 11: Monitoring the Device and Routing Operations
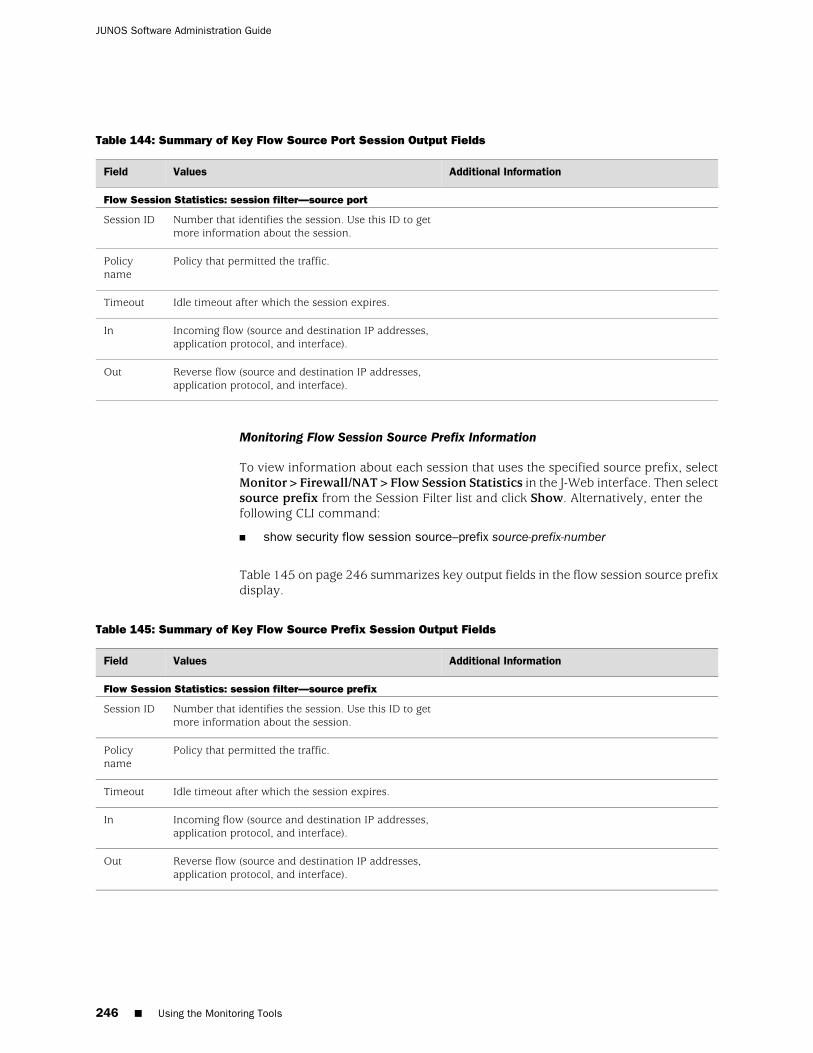
Table 144: Summary of Key Flow Source Port Session Output Fields
Additional InformationValuesField
Flow Session Statistics: session filter—source port
Number that identifies the session. Use this ID to getmore information about the session.
Session ID
Policy that permitted the traffic.Policyname
Idle timeout after which the session expires.Timeout
Incoming flow (source and destination IP addresses,application protocol, and interface).
In
Reverse flow (source and destination IP addresses,application protocol, and interface).
Out
Monitoring Flow Session Source Prefix Information
To view information about each session that uses the specified source prefix, selectMonitor>Firewall/NAT>Flow Session Statistics in the J-Web interface. Then selectsource prefix from the Session Filter list and click Show. Alternatively, enter thefollowing CLI command:
■ show security flow session source–prefix source-prefix-number
Table 145 on page 246 summarizes key output fields in the flow session source prefixdisplay.
Table 145: Summary of Key Flow Source Prefix Session Output Fields
Additional InformationValuesField
Flow Session Statistics: session filter—source prefix
Number that identifies the session. Use this ID to getmore information about the session.
Session ID
Policy that permitted the traffic.Policyname
Idle timeout after which the session expires.Timeout
Incoming flow (source and destination IP addresses,application protocol, and interface).
In
Reverse flow (source and destination IP addresses,application protocol, and interface).
Out
246 ■ Using the Monitoring Tools
JUNOS Software Administration Guide
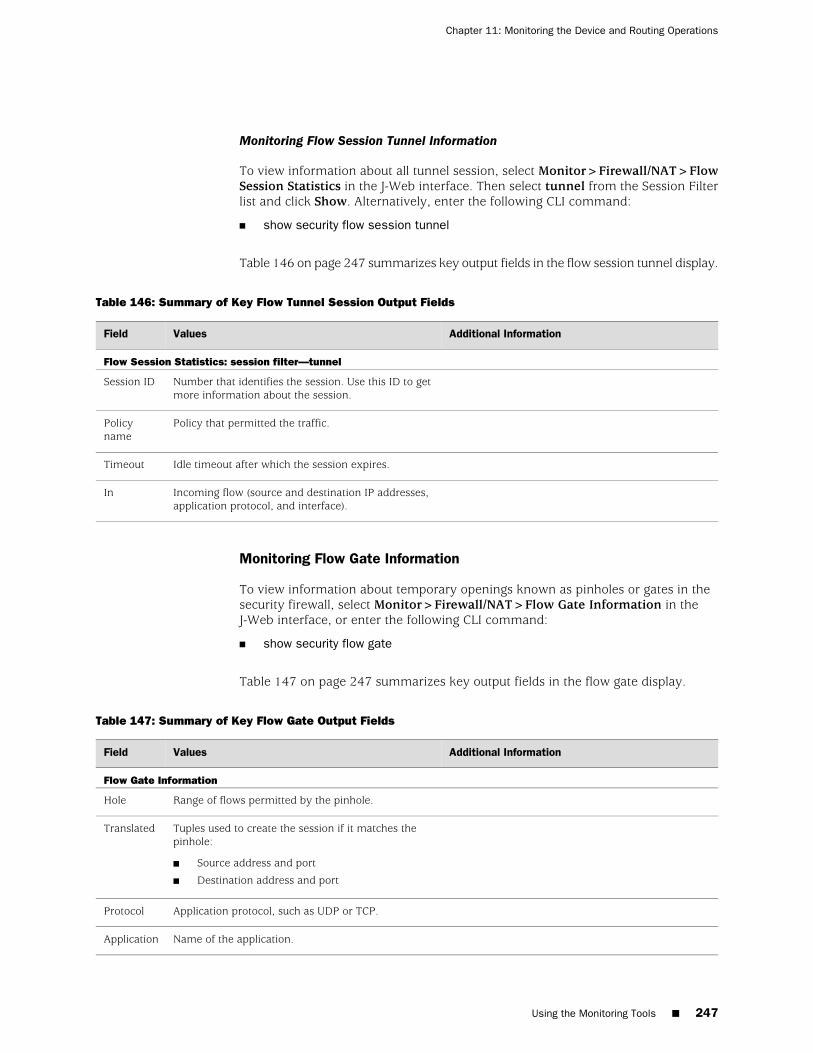
Monitoring Flow Session Tunnel Information
To view information about all tunnel session, select Monitor>Firewall/NAT>FlowSession Statistics in the J-Web interface. Then select tunnel from the Session Filterlist and click Show. Alternatively, enter the following CLI command:
■ show security flow session tunnel
Table 146 on page 247 summarizes key output fields in the flow session tunnel display.
Table 146: Summary of Key Flow Tunnel Session Output Fields
Additional InformationValuesField
Flow Session Statistics: session filter—tunnel
Number that identifies the session. Use this ID to getmore information about the session.
Session ID
Policy that permitted the traffic.Policyname
Idle timeout after which the session expires.Timeout
Incoming flow (source and destination IP addresses,application protocol, and interface).
In
Monitoring Flow Gate Information
To view information about temporary openings known as pinholes or gates in thesecurity firewall, select Monitor>Firewall/NAT>Flow Gate Information in theJ-Web interface, or enter the following CLI command:
■ show security flow gate
Table 147 on page 247 summarizes key output fields in the flow gate display.
Table 147: Summary of Key Flow Gate Output Fields
Additional InformationValuesField
Flow Gate Information
Range of flows permitted by the pinhole.Hole
Tuples used to create the session if it matches thepinhole:
■ Source address and port
■ Destination address and port
Translated
Application protocol, such as UDP or TCP.Protocol
Name of the application.Application
Using the Monitoring Tools ■ 247
Chapter 11: Monitoring the Device and Routing Operations
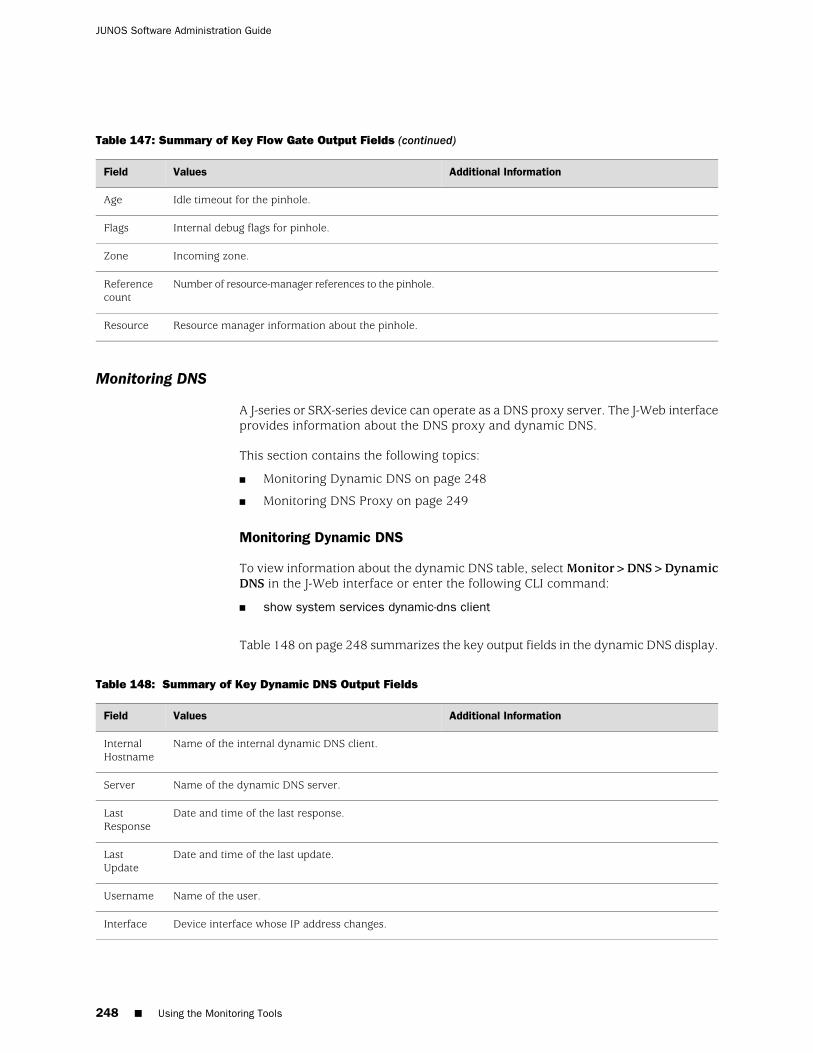
Table 147: Summary of Key Flow Gate Output Fields (continued)
Additional InformationValuesField
Idle timeout for the pinhole.Age
Internal debug flags for pinhole.Flags
Incoming zone.Zone
Number of resource-manager references to the pinhole.Referencecount
Resource manager information about the pinhole.Resource
Monitoring DNS
A J-series or SRX-series device can operate as a DNS proxy server. The J-Web interfaceprovides information about the DNS proxy and dynamic DNS.
This section contains the following topics:
■ Monitoring Dynamic DNS on page 248
■ Monitoring DNS Proxy on page 249
Monitoring Dynamic DNS
To view information about the dynamic DNS table, select Monitor>DNS>DynamicDNS in the J-Web interface or enter the following CLI command:
■ show system services dynamic-dns client
Table 148 on page 248 summarizes the key output fields in the dynamic DNS display.
Table 148: Summary of Key Dynamic DNS Output Fields
Additional InformationValuesField
Name of the internal dynamic DNS client.InternalHostname
Name of the dynamic DNS server.Server
Date and time of the last response.LastResponse
Date and time of the last update.LastUpdate
Name of the user.Username
Device interface whose IP address changes.Interface
248 ■ Using the Monitoring Tools
JUNOS Software Administration Guide
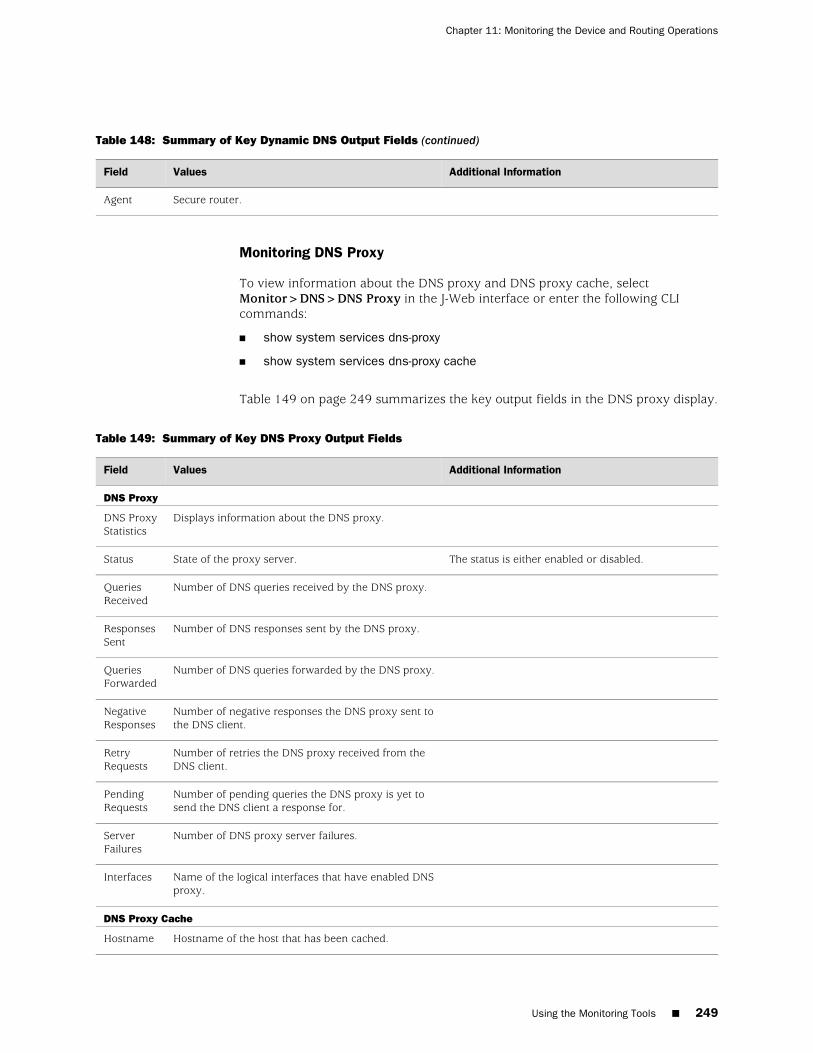
Table 148: Summary of Key Dynamic DNS Output Fields (continued)
Additional InformationValuesField
Secure router.Agent
Monitoring DNS Proxy
To view information about the DNS proxy and DNS proxy cache, selectMonitor>DNS>DNS Proxy in the J-Web interface or enter the following CLIcommands:
■ show system services dns-proxy
■ show system services dns-proxy cache
Table 149 on page 249 summarizes the key output fields in the DNS proxy display.
Table 149: Summary of Key DNS Proxy Output Fields
Additional InformationValuesField
DNS Proxy
Displays information about the DNS proxy.DNS ProxyStatistics
The status is either enabled or disabled.State of the proxy server.Status
Number of DNS queries received by the DNS proxy.QueriesReceived
Number of DNS responses sent by the DNS proxy.ResponsesSent
Number of DNS queries forwarded by the DNS proxy.QueriesForwarded
Number of negative responses the DNS proxy sent tothe DNS client.
NegativeResponses
Number of retries the DNS proxy received from theDNS client.
RetryRequests
Number of pending queries the DNS proxy is yet tosend the DNS client a response for.
PendingRequests
Number of DNS proxy server failures.ServerFailures
Name of the logical interfaces that have enabled DNSproxy.
Interfaces
DNS Proxy Cache
Hostname of the host that has been cached.Hostname
Using the Monitoring Tools ■ 249
Chapter 11: Monitoring the Device and Routing Operations
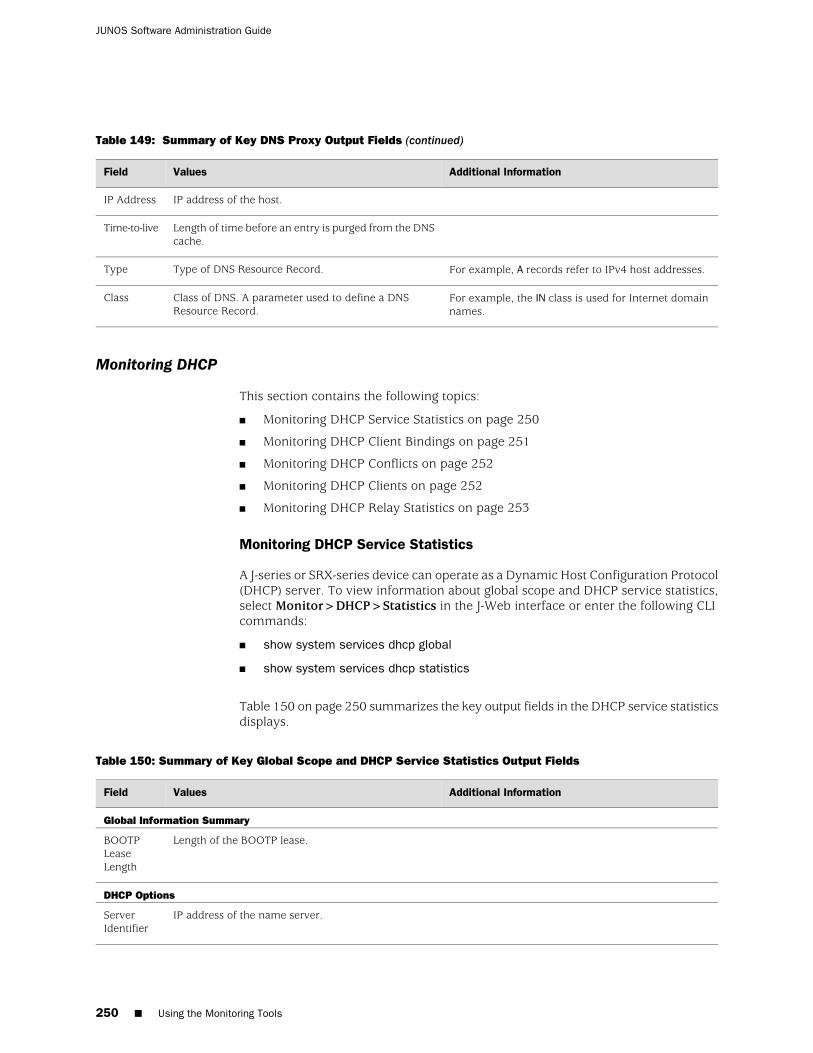
Table 149: Summary of Key DNS Proxy Output Fields (continued)
Additional InformationValuesField
IP address of the host.IP Address
Length of time before an entry is purged from the DNScache.
Time-to-live
For example, A records refer to IPv4 host addresses.Type of DNS Resource Record.Type
For example, the IN class is used for Internet domainnames.
Class of DNS. A parameter used to define a DNSResource Record.
Class
Monitoring DHCP
This section contains the following topics:
■ Monitoring DHCP Service Statistics on page 250
■ Monitoring DHCP Client Bindings on page 251
■ Monitoring DHCP Conflicts on page 252
■ Monitoring DHCP Clients on page 252
■ Monitoring DHCP Relay Statistics on page 253
Monitoring DHCP Service Statistics
A J-series or SRX-series device can operate as a Dynamic Host Configuration Protocol(DHCP) server. To view information about global scope and DHCP service statistics,select Monitor>DHCP>Statistics in the J-Web interface or enter the following CLIcommands:
■ show system services dhcp global
■ show system services dhcp statistics
Table 150 on page 250 summarizes the key output fields in the DHCP service statisticsdisplays.
Table 150: Summary of Key Global Scope and DHCP Service Statistics Output Fields
Additional InformationValuesField
Global Information Summary
Length of the BOOTP lease.BOOTPLeaseLength
DHCP Options
IP address of the name server.ServerIdentifier
250 ■ Using the Monitoring Tools
JUNOS Software Administration Guide
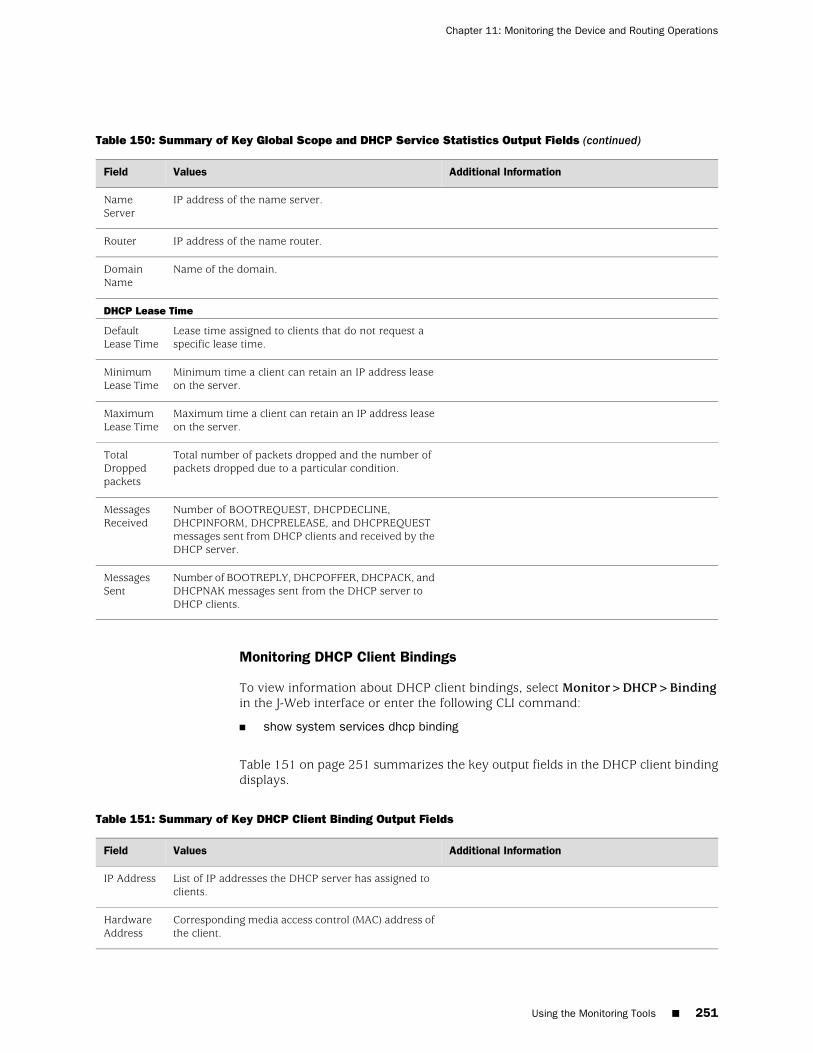
Table 150: Summary of Key Global Scope and DHCP Service Statistics Output Fields (continued)
Additional InformationValuesField
IP address of the name server.NameServer
IP address of the name router.Router
Name of the domain.DomainName
DHCP Lease Time
Lease time assigned to clients that do not request aspecific lease time.
DefaultLease Time
Minimum time a client can retain an IP address leaseon the server.
MinimumLease Time
Maximum time a client can retain an IP address leaseon the server.
MaximumLease Time
Total number of packets dropped and the number ofpackets dropped due to a particular condition.
TotalDroppedpackets
Number of BOOTREQUEST, DHCPDECLINE,DHCPINFORM, DHCPRELEASE, and DHCPREQUESTmessages sent from DHCP clients and received by theDHCP server.
MessagesReceived
Number of BOOTREPLY, DHCPOFFER, DHCPACK, andDHCPNAK messages sent from the DHCP server toDHCP clients.
MessagesSent
Monitoring DHCP Client Bindings
To view information about DHCP client bindings, select Monitor>DHCP>Bindingin the J-Web interface or enter the following CLI command:
■ show system services dhcp binding
Table 151 on page 251 summarizes the key output fields in the DHCP client bindingdisplays.
Table 151: Summary of Key DHCP Client Binding Output Fields
Additional InformationValuesField
List of IP addresses the DHCP server has assigned toclients.
IP Address
Corresponding media access control (MAC) address ofthe client.
HardwareAddress
Using the Monitoring Tools ■ 251
Chapter 11: Monitoring the Device and Routing Operations
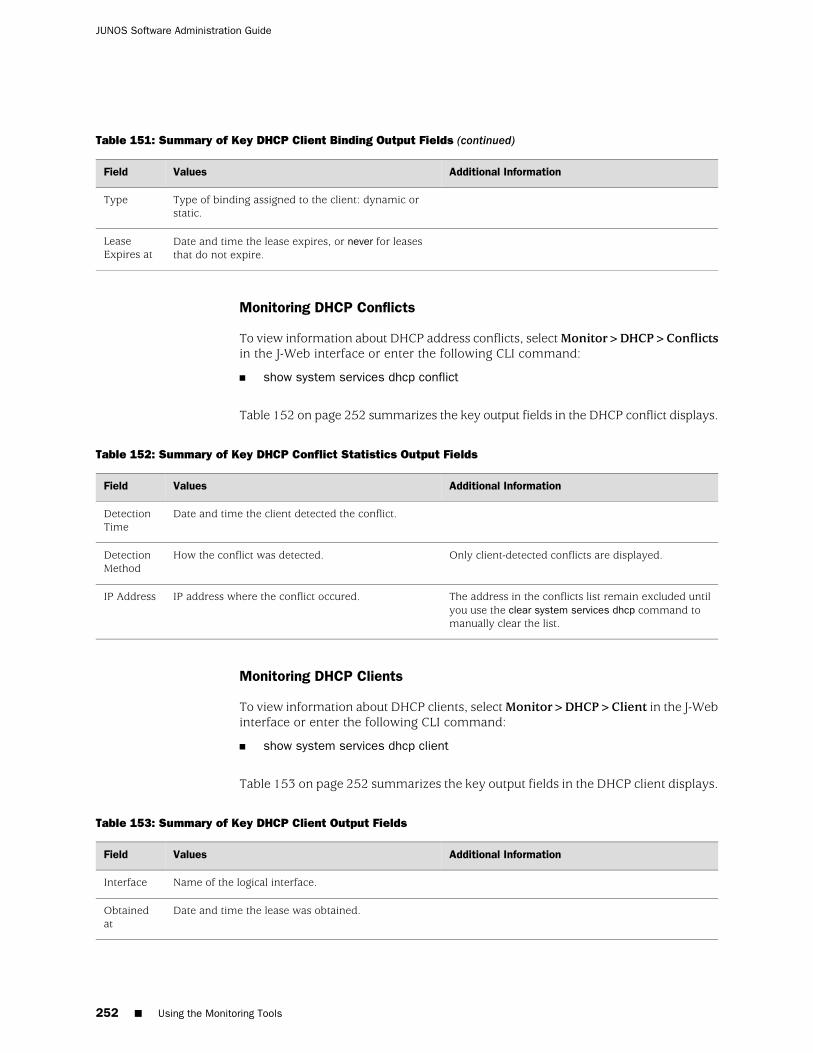
Table 151: Summary of Key DHCP Client Binding Output Fields (continued)
Additional InformationValuesField
Type of binding assigned to the client: dynamic orstatic.
Type
Date and time the lease expires, or never for leasesthat do not expire.
LeaseExpires at
Monitoring DHCP Conflicts
To view information about DHCP address conflicts, select Monitor>DHCP>Conflictsin the J-Web interface or enter the following CLI command:
■ show system services dhcp conflict
Table 152 on page 252 summarizes the key output fields in the DHCP conflict displays.
Table 152: Summary of Key DHCP Conflict Statistics Output Fields
Additional InformationValuesField
Date and time the client detected the conflict.DetectionTime
Only client-detected conflicts are displayed.How the conflict was detected.DetectionMethod
The address in the conflicts list remain excluded untilyou use the clear system services dhcp command tomanually clear the list.
IP address where the conflict occured.IP Address
Monitoring DHCP Clients
To view information about DHCP clients, select Monitor>DHCP>Client in the J-Webinterface or enter the following CLI command:
■ show system services dhcp client
Table 153 on page 252 summarizes the key output fields in the DHCP client displays.
Table 153: Summary of Key DHCP Client Output Fields
Additional InformationValuesField
Name of the logical interface.Interface
Date and time the lease was obtained.Obtainedat
252 ■ Using the Monitoring Tools
JUNOS Software Administration Guide
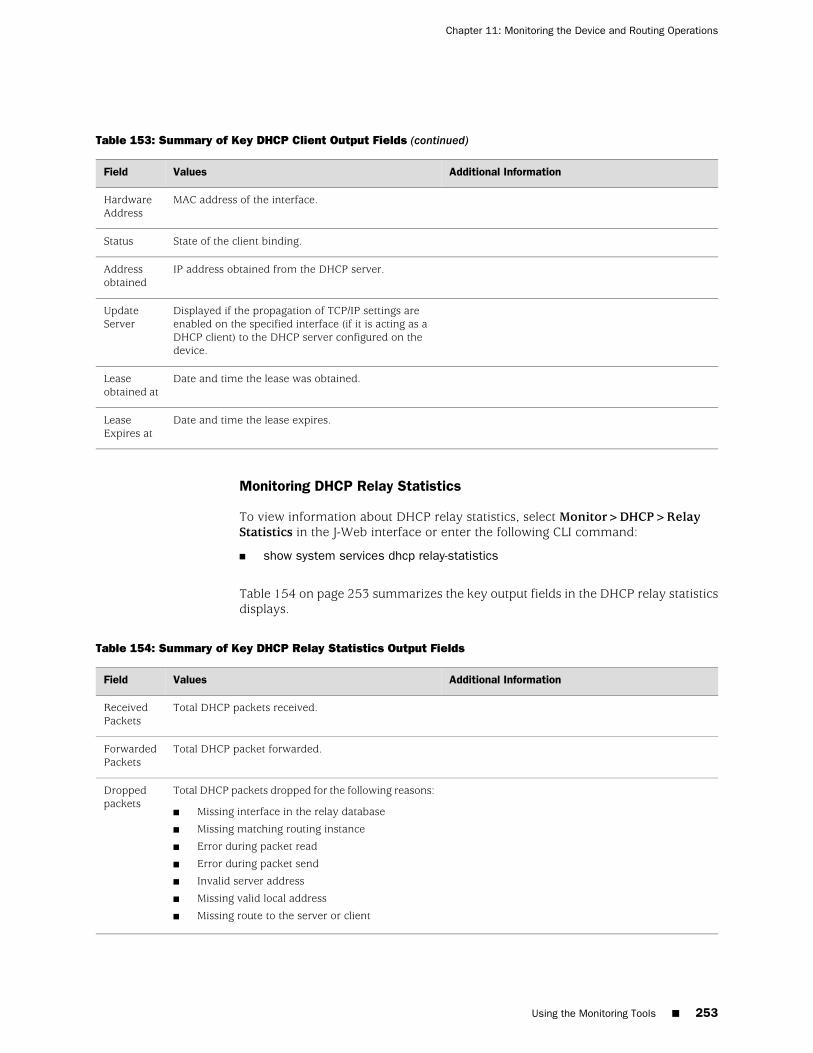
Table 153: Summary of Key DHCP Client Output Fields (continued)
Additional InformationValuesField
MAC address of the interface.HardwareAddress
State of the client binding.Status
IP address obtained from the DHCP server.Addressobtained
Displayed if the propagation of TCP/IP settings areenabled on the specified interface (if it is acting as aDHCP client) to the DHCP server configured on thedevice.
UpdateServer
Date and time the lease was obtained.Leaseobtained at
Date and time the lease expires.LeaseExpires at
Monitoring DHCP Relay Statistics
To view information about DHCP relay statistics, select Monitor>DHCP>RelayStatistics in the J-Web interface or enter the following CLI command:
■ show system services dhcp relay-statistics
Table 154 on page 253 summarizes the key output fields in the DHCP relay statisticsdisplays.
Table 154: Summary of Key DHCP Relay Statistics Output Fields
Additional InformationValuesField
Total DHCP packets received.ReceivedPackets
Total DHCP packet forwarded.ForwardedPackets
Total DHCP packets dropped for the following reasons:
■ Missing interface in the relay database
■ Missing matching routing instance
■ Error during packet read
■ Error during packet send
■ Invalid server address
■ Missing valid local address
■ Missing route to the server or client
Droppedpackets
Using the Monitoring Tools ■ 253
Chapter 11: Monitoring the Device and Routing Operations
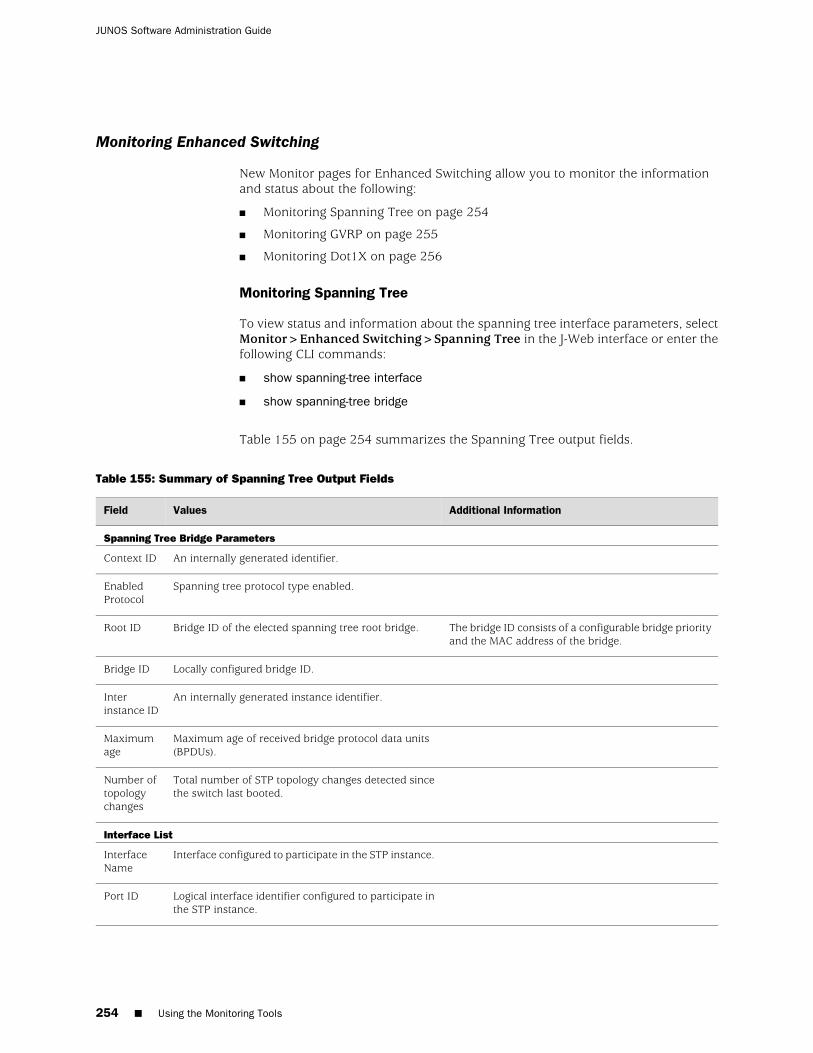
Monitoring Enhanced Switching
New Monitor pages for Enhanced Switching allow you to monitor the informationand status about the following:
■ Monitoring Spanning Tree on page 254
■ Monitoring GVRP on page 255
■ Monitoring Dot1X on page 256
Monitoring Spanning Tree
To view status and information about the spanning tree interface parameters, selectMonitor>Enhanced Switching>Spanning Tree in the J-Web interface or enter thefollowing CLI commands:
■ show spanning-tree interface
■ show spanning-tree bridge
Table 155 on page 254 summarizes the Spanning Tree output fields.
Table 155: Summary of Spanning Tree Output Fields
Additional InformationValuesField
Spanning Tree Bridge Parameters
An internally generated identifier.Context ID
Spanning tree protocol type enabled.EnabledProtocol
The bridge ID consists of a configurable bridge priorityand the MAC address of the bridge.
Bridge ID of the elected spanning tree root bridge.Root ID
Locally configured bridge ID.Bridge ID
An internally generated instance identifier.Interinstance ID
Maximum age of received bridge protocol data units(BPDUs).
Maximumage
Total number of STP topology changes detected sincethe switch last booted.
Number oftopologychanges
Interface List
Interface configured to participate in the STP instance.InterfaceName
Logical interface identifier configured to participate inthe STP instance.
Port ID
254 ■ Using the Monitoring Tools
JUNOS Software Administration Guide
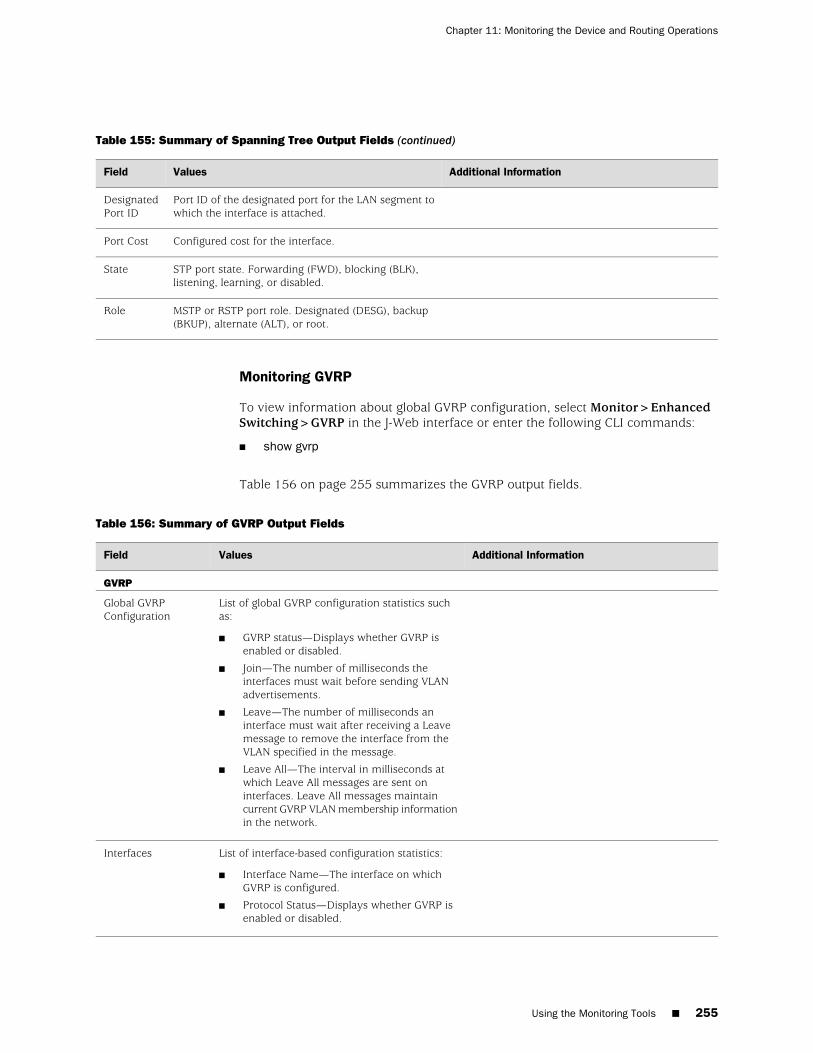
Table 155: Summary of Spanning Tree Output Fields (continued)
Additional InformationValuesField
Port ID of the designated port for the LAN segment towhich the interface is attached.
DesignatedPort ID
Configured cost for the interface.Port Cost
STP port state. Forwarding (FWD), blocking (BLK),listening, learning, or disabled.
State
MSTP or RSTP port role. Designated (DESG), backup(BKUP), alternate (ALT), or root.
Role
Monitoring GVRP
To view information about global GVRP configuration, select Monitor>EnhancedSwitching>GVRP in the J-Web interface or enter the following CLI commands:
■ show gvrp
Table 156 on page 255 summarizes the GVRP output fields.
Table 156: Summary of GVRP Output Fields
Additional InformationValuesField
GVRP
List of global GVRP configuration statistics suchas:
■ GVRP status—Displays whether GVRP isenabled or disabled.
■ Join—The number of milliseconds theinterfaces must wait before sending VLANadvertisements.
■ Leave—The number of milliseconds aninterface must wait after receiving a Leavemessage to remove the interface from theVLAN specified in the message.
■ Leave All—The interval in milliseconds atwhich Leave All messages are sent oninterfaces. Leave All messages maintaincurrent GVRP VLAN membership informationin the network.
Global GVRPConfiguration
List of interface-based configuration statistics:
■ Interface Name—The interface on whichGVRP is configured.
■ Protocol Status—Displays whether GVRP isenabled or disabled.
Interfaces
Using the Monitoring Tools ■ 255
Chapter 11: Monitoring the Device and Routing Operations
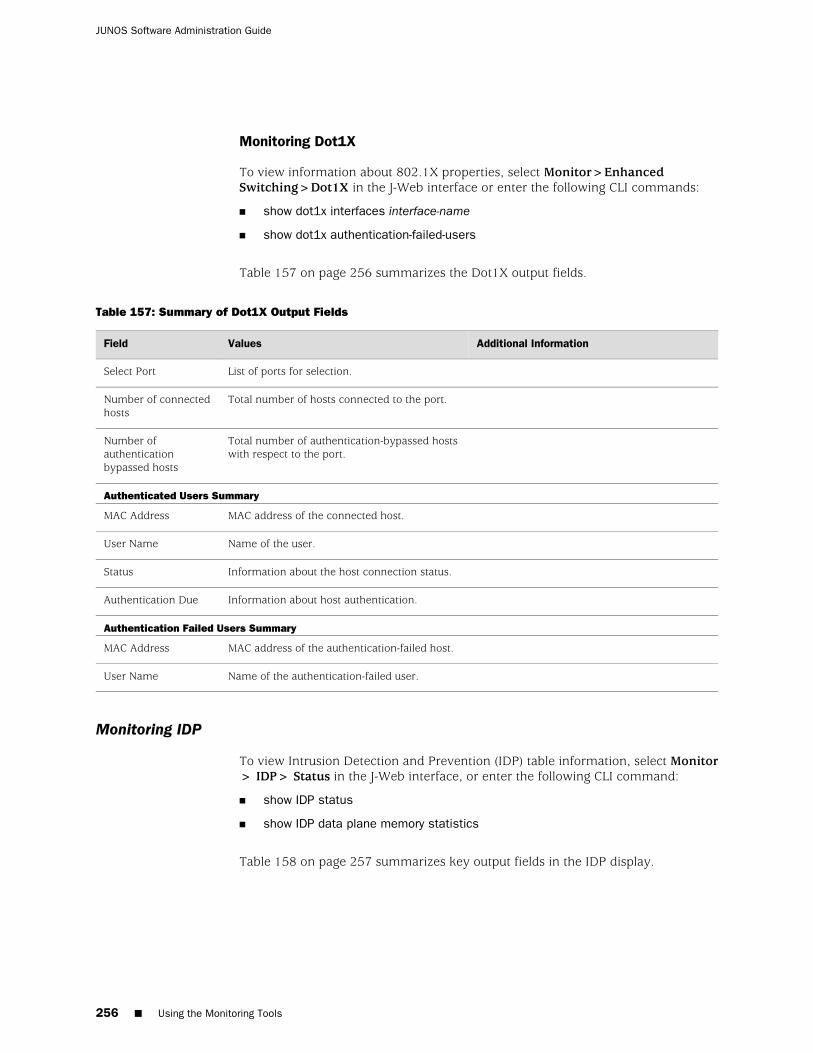
Monitoring Dot1X
To view information about 802.1X properties, select Monitor>EnhancedSwitching>Dot1X in the J-Web interface or enter the following CLI commands:
■ show dot1x interfaces interface-name
■ show dot1x authentication-failed-users
Table 157 on page 256 summarizes the Dot1X output fields.
Table 157: Summary of Dot1X Output Fields
Additional InformationValuesField
List of ports for selection.Select Port
Total number of hosts connected to the port.Number of connectedhosts
Total number of authentication-bypassed hostswith respect to the port.
Number ofauthenticationbypassed hosts
Authenticated Users Summary
MAC address of the connected host.MAC Address
Name of the user.User Name
Information about the host connection status.Status
Information about host authentication.Authentication Due
Authentication Failed Users Summary
MAC address of the authentication-failed host.MAC Address
Name of the authentication-failed user.User Name
Monitoring IDP
To view Intrusion Detection and Prevention (IDP) table information, select Monitor> IDP> Status in the J-Web interface, or enter the following CLI command:
■ show IDP status
■ show IDP data plane memory statistics
Table 158 on page 257 summarizes key output fields in the IDP display.
256 ■ Using the Monitoring Tools
JUNOS Software Administration Guide
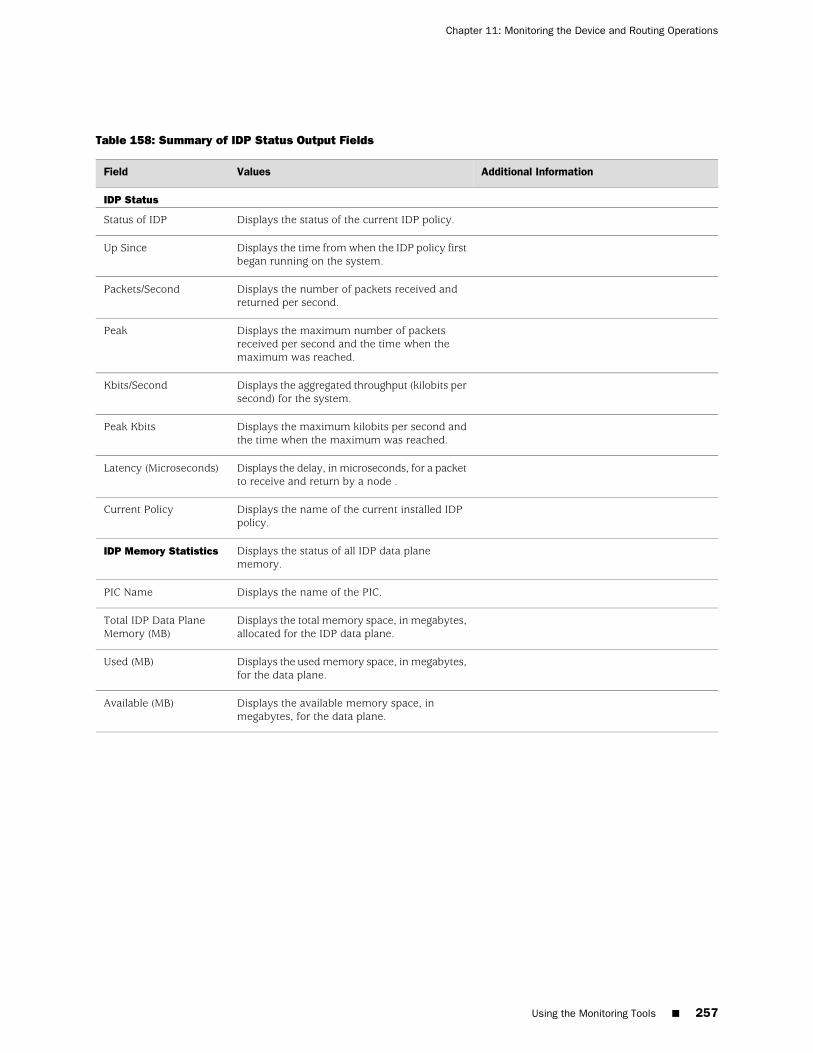
Table 158: Summary of IDP Status Output Fields
Additional InformationValuesField
IDP Status
Displays the status of the current IDP policy.Status of IDP
Displays the time from when the IDP policy firstbegan running on the system.
Up Since
Displays the number of packets received andreturned per second.
Packets/Second
Displays the maximum number of packetsreceived per second and the time when themaximum was reached.
Peak
Displays the aggregated throughput (kilobits persecond) for the system.
Kbits/Second
Displays the maximum kilobits per second andthe time when the maximum was reached.
Peak Kbits
Displays the delay, in microseconds, for a packetto receive and return by a node .
Latency (Microseconds)
Displays the name of the current installed IDPpolicy.
Current Policy
Displays the status of all IDP data planememory.
IDP Memory Statistics
Displays the name of the PIC.PIC Name
Displays the total memory space, in megabytes,allocated for the IDP data plane.
Total IDP Data PlaneMemory (MB)
Displays the used memory space, in megabytes,for the data plane.
Used (MB)
Displays the available memory space, inmegabytes, for the data plane.
Available (MB)
Using the Monitoring Tools ■ 257
Chapter 11: Monitoring the Device and Routing Operations

258 ■ Using the Monitoring Tools
JUNOS Software Administration Guide
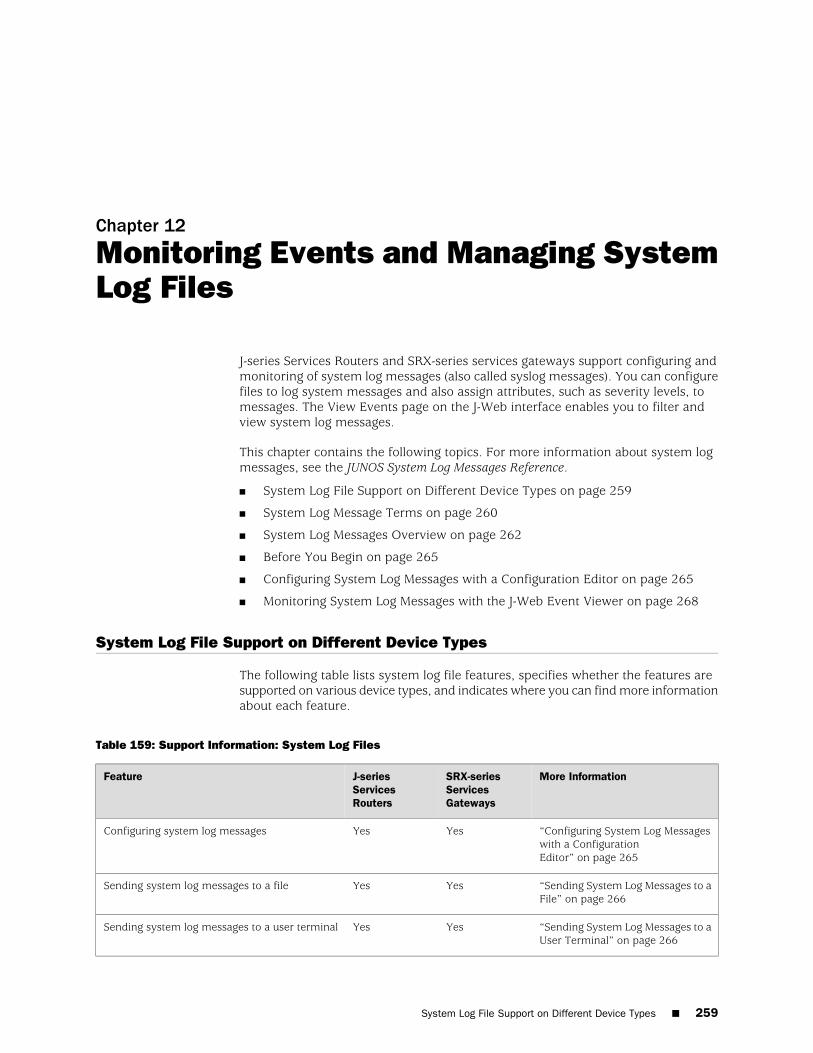
Chapter 12
Monitoring Events and Managing SystemLog Files
J-series Services Routers and SRX-series services gateways support configuring andmonitoring of system log messages (also called syslog messages). You can configurefiles to log system messages and also assign attributes, such as severity levels, tomessages. The View Events page on the J-Web interface enables you to filter andview system log messages.
This chapter contains the following topics. For more information about system logmessages, see the JUNOS System Log Messages Reference.
■ System Log File Support on Different Device Types on page 259
■ System Log Message Terms on page 260
■ System Log Messages Overview on page 262
■ Before You Begin on page 265
■ Configuring System Log Messages with a Configuration Editor on page 265
■ Monitoring System Log Messages with the J-Web Event Viewer on page 268
System Log File Support on Different Device Types
The following table lists system log file features, specifies whether the features aresupported on various device types, and indicates where you can find more informationabout each feature.
Table 159: Support Information: System Log Files
More InformationSRX-seriesServicesGateways
J-seriesServicesRouters
Feature
“Configuring System Log Messageswith a ConfigurationEditor” on page 265
YesYesConfiguring system log messages
“Sending System Log Messages to aFile” on page 266
YesYesSending system log messages to a file
“Sending System Log Messages to aUser Terminal” on page 266
YesYesSending system log messages to a user terminal
System Log File Support on Different Device Types ■ 259
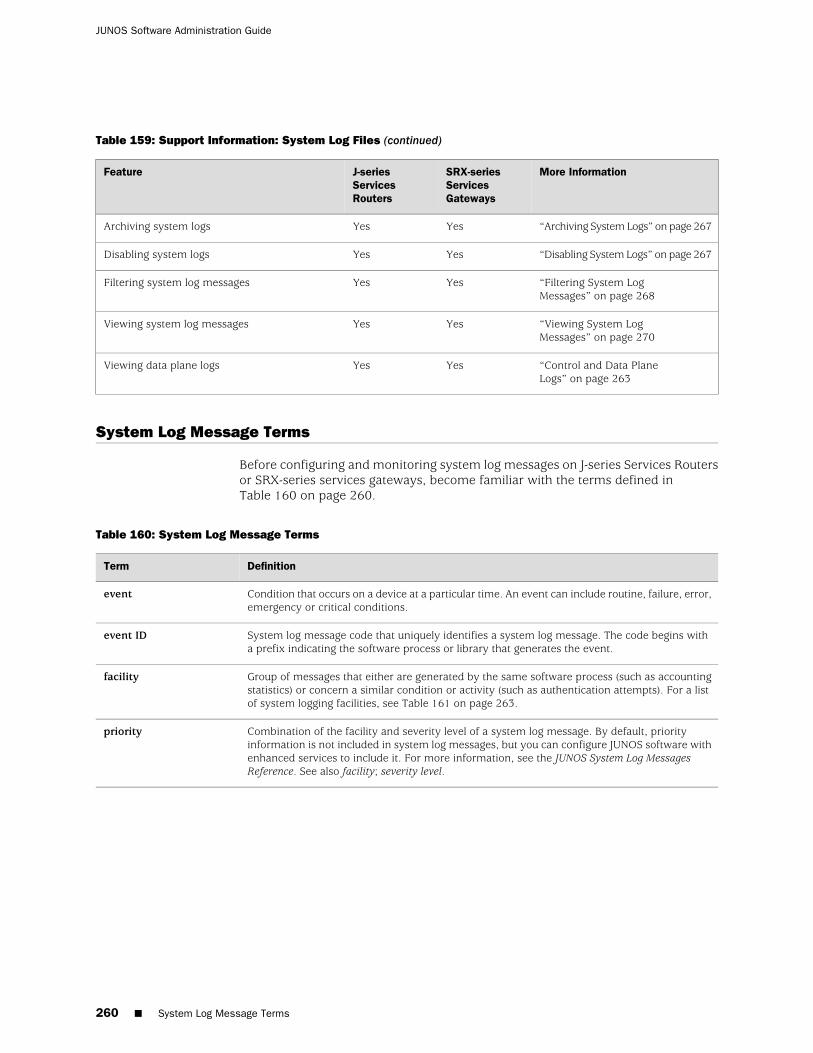
Table 159: Support Information: System Log Files (continued)
More InformationSRX-seriesServicesGateways
J-seriesServicesRouters
Feature
“Archiving System Logs” on page 267YesYesArchiving system logs
“Disabling System Logs” on page 267YesYesDisabling system logs
“Filtering System LogMessages” on page 268
YesYesFiltering system log messages
“Viewing System LogMessages” on page 270
YesYesViewing system log messages
“Control and Data PlaneLogs” on page 263
YesYesViewing data plane logs
System Log Message Terms
Before configuring and monitoring system log messages on J-series Services Routersor SRX-series services gateways, become familiar with the terms defined inTable 160 on page 260.
Table 160: System Log Message Terms
DefinitionTerm
Condition that occurs on a device at a particular time. An event can include routine, failure, error,emergency or critical conditions.
event
System log message code that uniquely identifies a system log message. The code begins witha prefix indicating the software process or library that generates the event.
event ID
Group of messages that either are generated by the same software process (such as accountingstatistics) or concern a similar condition or activity (such as authentication attempts). For a listof system logging facilities, see Table 161 on page 263.
facility
Combination of the facility and severity level of a system log message. By default, priorityinformation is not included in system log messages, but you can configure JUNOS software withenhanced services to include it. For more information, see the JUNOS System Log MessagesReference. See also facility; severity level.
priority
260 ■ System Log Message Terms
JUNOS Software Administration Guide
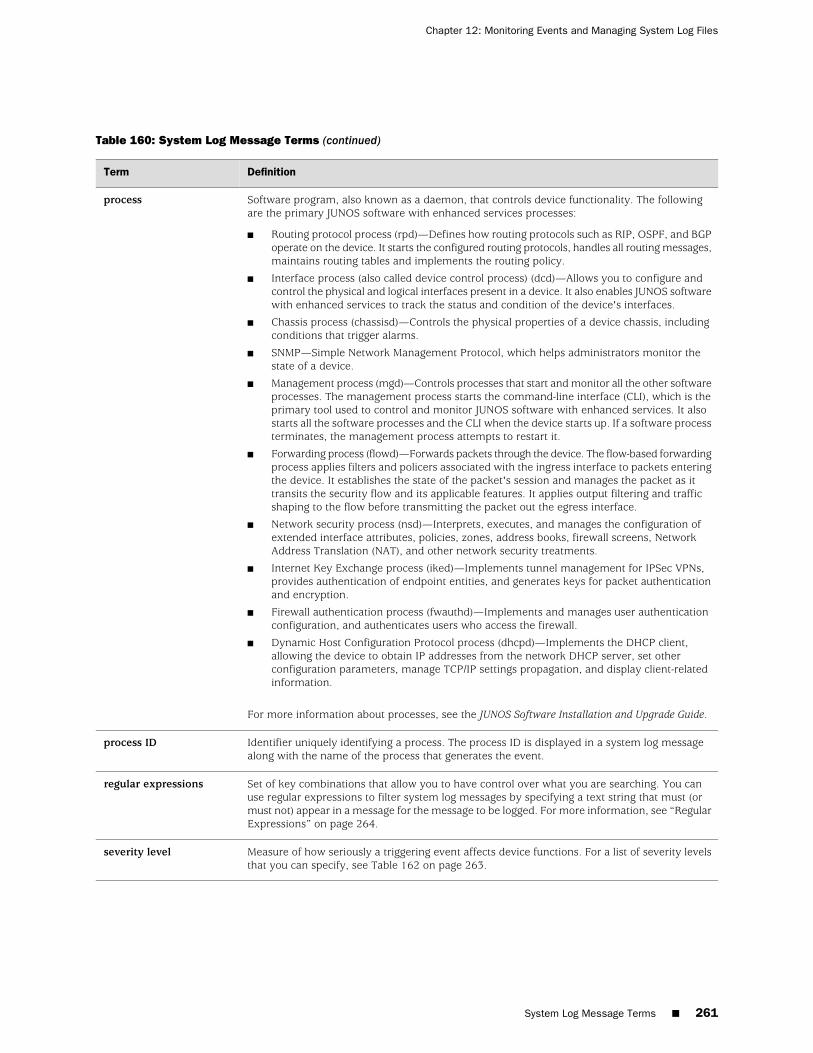
Table 160: System Log Message Terms (continued)
DefinitionTerm
Software program, also known as a daemon, that controls device functionality. The followingare the primary JUNOS software with enhanced services processes:
■ Routing protocol process (rpd)—Defines how routing protocols such as RIP, OSPF, and BGPoperate on the device. It starts the configured routing protocols, handles all routing messages,maintains routing tables and implements the routing policy.
■ Interface process (also called device control process) (dcd)—Allows you to configure andcontrol the physical and logical interfaces present in a device. It also enables JUNOS softwarewith enhanced services to track the status and condition of the device's interfaces.
■ Chassis process (chassisd)—Controls the physical properties of a device chassis, includingconditions that trigger alarms.
■ SNMP—Simple Network Management Protocol, which helps administrators monitor thestate of a device.
■ Management process (mgd)—Controls processes that start and monitor all the other softwareprocesses. The management process starts the command-line interface (CLI), which is theprimary tool used to control and monitor JUNOS software with enhanced services. It alsostarts all the software processes and the CLI when the device starts up. If a software processterminates, the management process attempts to restart it.
■ Forwarding process (flowd)—Forwards packets through the device. The flow-based forwardingprocess applies filters and policers associated with the ingress interface to packets enteringthe device. It establishes the state of the packet's session and manages the packet as ittransits the security flow and its applicable features. It applies output filtering and trafficshaping to the flow before transmitting the packet out the egress interface.
■ Network security process (nsd)—Interprets, executes, and manages the configuration ofextended interface attributes, policies, zones, address books, firewall screens, NetworkAddress Translation (NAT), and other network security treatments.
■ Internet Key Exchange process (iked)—Implements tunnel management for IPSec VPNs,provides authentication of endpoint entities, and generates keys for packet authenticationand encryption.
■ Firewall authentication process (fwauthd)—Implements and manages user authenticationconfiguration, and authenticates users who access the firewall.
■ Dynamic Host Configuration Protocol process (dhcpd)—Implements the DHCP client,allowing the device to obtain IP addresses from the network DHCP server, set otherconfiguration parameters, manage TCP/IP settings propagation, and display client-relatedinformation.
For more information about processes, see the JUNOS Software Installation and Upgrade Guide.
process
Identifier uniquely identifying a process. The process ID is displayed in a system log messagealong with the name of the process that generates the event.
process ID
Set of key combinations that allow you to have control over what you are searching. You canuse regular expressions to filter system log messages by specifying a text string that must (ormust not) appear in a message for the message to be logged. For more information, see “RegularExpressions” on page 264.
regular expressions
Measure of how seriously a triggering event affects device functions. For a list of severity levelsthat you can specify, see Table 162 on page 263.
severity level
System Log Message Terms ■ 261
Chapter 12: Monitoring Events and Managing System Log Files
System Log Messages Overview
JUNOS software with enhanced services generates system log messages (also calledsyslog messages) to record events that occur on the device, including the following:
■ Routine operations, such as creation of an Open Shortest Path First (OSPF)protocol adjacency or a user login into the configuration database
■ Failure and error conditions, such as failure to access a configuration file orunexpected closure of a connection to a child or peer process
■ Emergency or critical conditions, such as device power-off due to excessivetemperature
The JUNOS system logging utility is similar to the UNIX syslogd utility. Each systemlog message identifies the software process that generated the message and brieflydescribes the operation or error that occurred.
Reboot requests are recorded to the system log files, which you can view with theshow log command. Also, you can view the names of any processes running on yoursystem with the show system processes command.
System Log Message Destinations
You can send system logging information to one or more destinations. Thedestinations can be one or more files, one or more remote hosts, the terminals ofone or more users if they are logged in, and the system console.
■ To direct messages to a named file in a local file system, see “Sending SystemLog Messages to a File” on page 266.
■ To direct messages to the terminal session of one or more specific users (or allusers) when they are logged into the device, see “Sending System Log Messagesto a User Terminal” on page 266.
■ To direct messages to the device console, see the JUNOS System Log MessagesReference.
■ To direct messages to a remote machine that is running the UNIX syslogd utility,see the JUNOS System Log Messages Reference.
System Log Facilities and Severity Levels
When specifying the destination for system log messages, you can specify the class(facility) of messages to log and the minimum severity level (level) of the messagefor each location.
Each system log message belongs to a facility, which is a group of messages that areeither generated by the same software process or concern a similar condition oractivity.
Table 161 on page 263 lists the system logging facilities, and Table 162 on page 263lists the system logging severity levels. For more information about system logmessages, see the JUNOS System Log Messages Reference.
262 ■ System Log Messages Overview
JUNOS Software Administration Guide
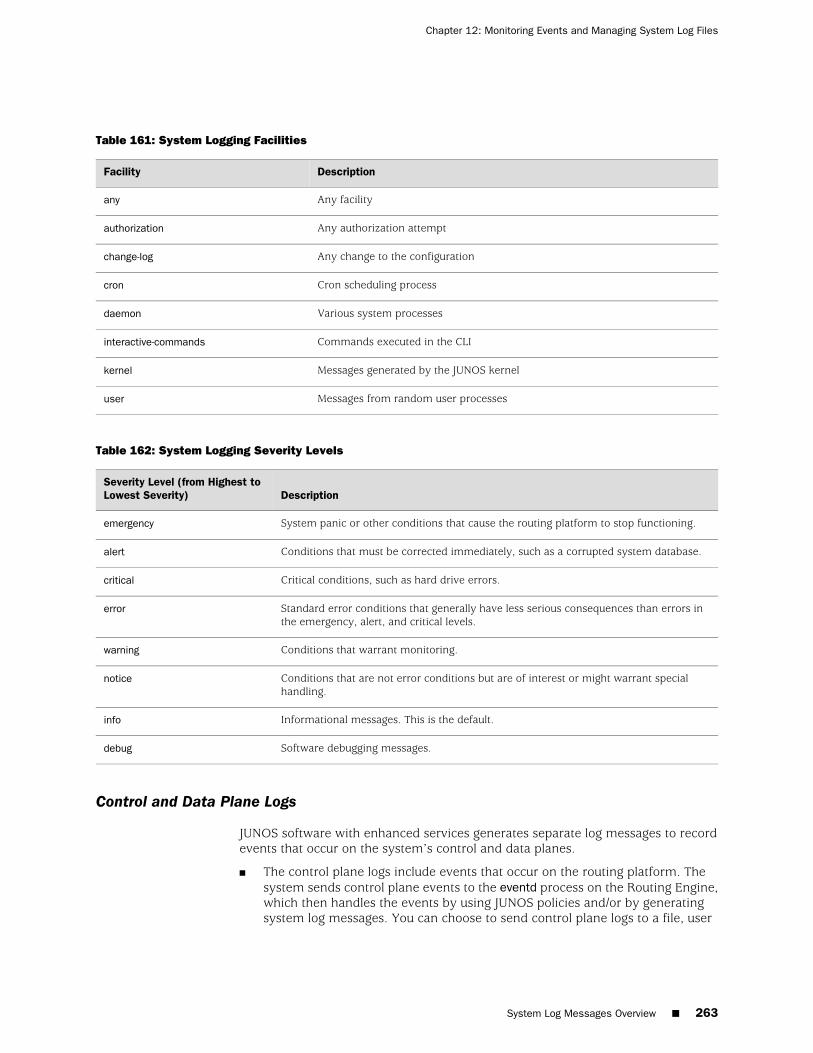
Table 161: System Logging Facilities
DescriptionFacility
Any facilityany
Any authorization attemptauthorization
Any change to the configurationchange-log
Cron scheduling processcron
Various system processesdaemon
Commands executed in the CLIinteractive-commands
Messages generated by the JUNOS kernelkernel
Messages from random user processesuser
Table 162: System Logging Severity Levels
DescriptionSeverity Level (from Highest toLowest Severity)
System panic or other conditions that cause the routing platform to stop functioning.emergency
Conditions that must be corrected immediately, such as a corrupted system database.alert
Critical conditions, such as hard drive errors.critical
Standard error conditions that generally have less serious consequences than errors inthe emergency, alert, and critical levels.
error
Conditions that warrant monitoring.warning
Conditions that are not error conditions but are of interest or might warrant specialhandling.
notice
Informational messages. This is the default.info
Software debugging messages.debug
Control and Data Plane Logs
JUNOS software with enhanced services generates separate log messages to recordevents that occur on the system’s control and data planes.
■ The control plane logs include events that occur on the routing platform. Thesystem sends control plane events to the eventd process on the Routing Engine,which then handles the events by using JUNOS policies and/or by generatingsystem log messages. You can choose to send control plane logs to a file, user
System Log Messages Overview ■ 263
Chapter 12: Monitoring Events and Managing System Log Files
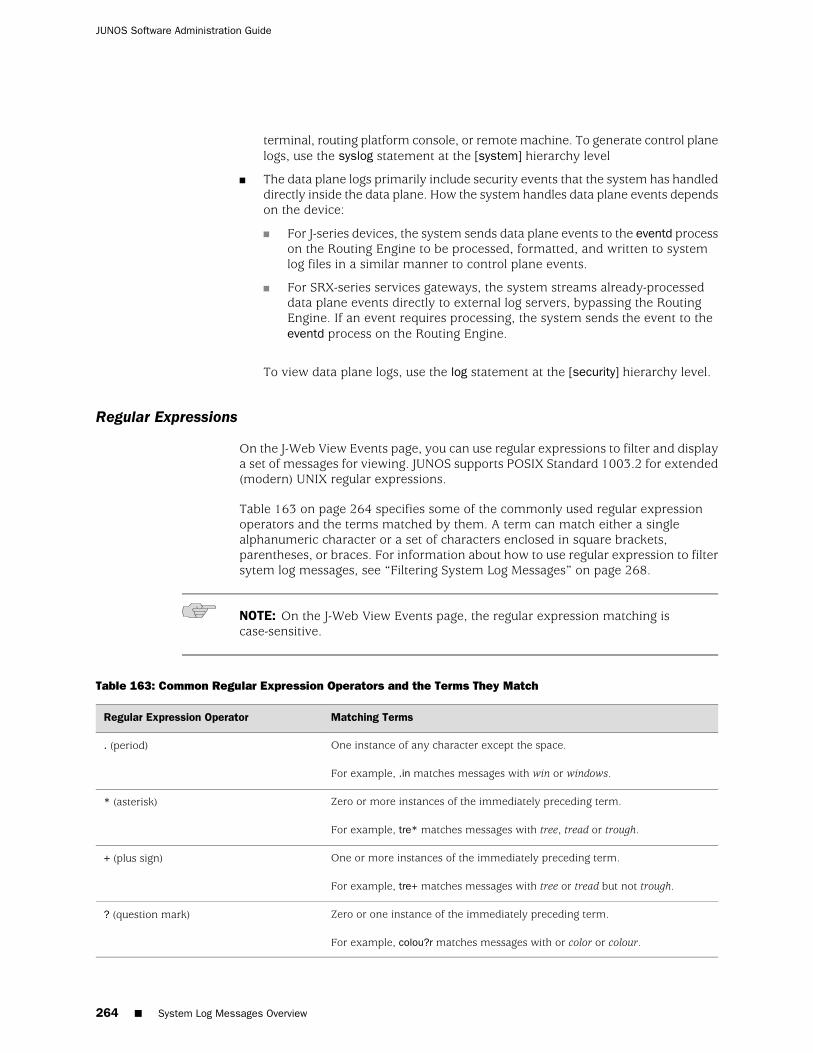
terminal, routing platform console, or remote machine. To generate control planelogs, use the syslog statement at the [system] hierarchy level
■ The data plane logs primarily include security events that the system has handleddirectly inside the data plane. How the system handles data plane events dependson the device:
■ For J-series devices, the system sends data plane events to the eventd processon the Routing Engine to be processed, formatted, and written to systemlog files in a similar manner to control plane events.
■ For SRX-series services gateways, the system streams already-processeddata plane events directly to external log servers, bypassing the RoutingEngine. If an event requires processing, the system sends the event to theeventd process on the Routing Engine.
To view data plane logs, use the log statement at the [security] hierarchy level.
Regular Expressions
On the J-Web View Events page, you can use regular expressions to filter and displaya set of messages for viewing. JUNOS supports POSIX Standard 1003.2 for extended(modern) UNIX regular expressions.
Table 163 on page 264 specifies some of the commonly used regular expressionoperators and the terms matched by them. A term can match either a singlealphanumeric character or a set of characters enclosed in square brackets,parentheses, or braces. For information about how to use regular expression to filtersytem log messages, see “Filtering System Log Messages” on page 268.
NOTE: On the J-Web View Events page, the regular expression matching iscase-sensitive.
Table 163: Common Regular Expression Operators and the Terms They Match
Matching TermsRegular Expression Operator
One instance of any character except the space.
For example, .in matches messages with win or windows.
. (period)
Zero or more instances of the immediately preceding term.
For example, tre* matches messages with tree, tread or trough.
* (asterisk)
One or more instances of the immediately preceding term.
For example, tre+ matches messages with tree or tread but not trough.
+ (plus sign)
Zero or one instance of the immediately preceding term.
For example, colou?r matches messages with or color or colour.
? (question mark)
264 ■ System Log Messages Overview
JUNOS Software Administration Guide
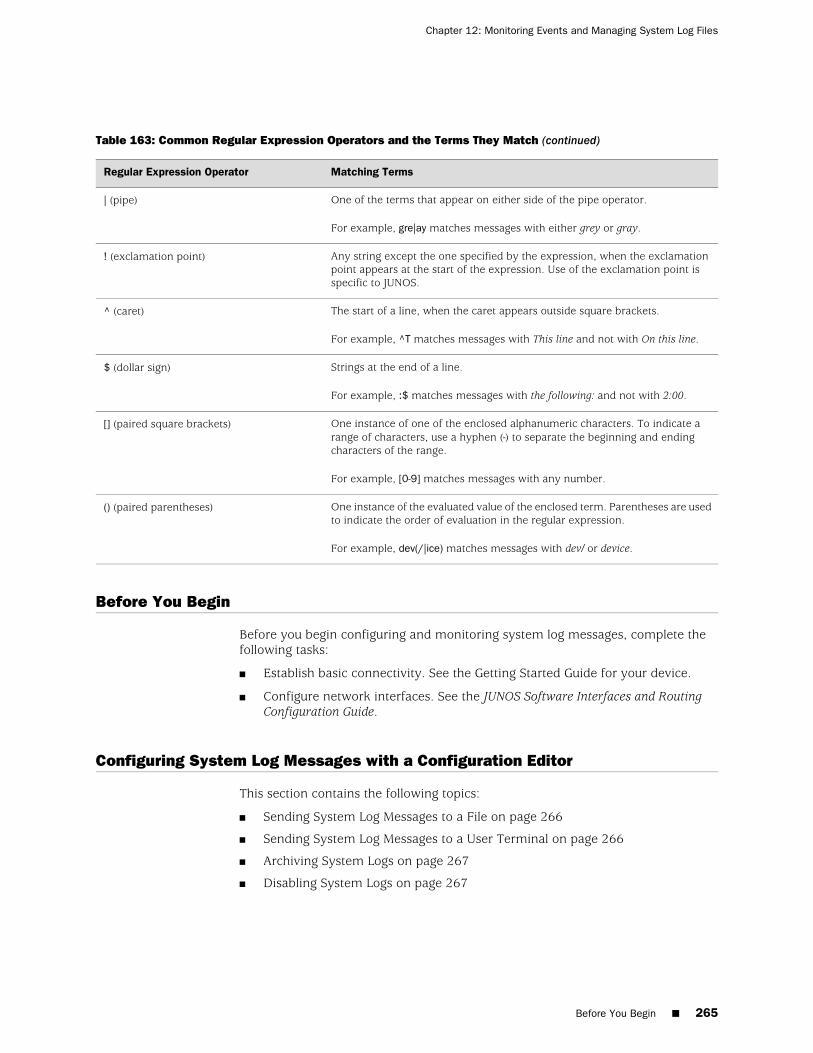
Table 163: Common Regular Expression Operators and the Terms They Match (continued)
Matching TermsRegular Expression Operator
One of the terms that appear on either side of the pipe operator.
For example, gre|ay matches messages with either grey or gray.
| (pipe)
Any string except the one specified by the expression, when the exclamationpoint appears at the start of the expression. Use of the exclamation point isspecific to JUNOS.
! (exclamation point)
The start of a line, when the caret appears outside square brackets.
For example, ^T matches messages with This line and not with On this line.
^ (caret)
Strings at the end of a line.
For example, :$ matches messages with the following: and not with 2:00.
$ (dollar sign)
One instance of one of the enclosed alphanumeric characters. To indicate arange of characters, use a hyphen (-) to separate the beginning and endingcharacters of the range.
For example, [0-9] matches messages with any number.
[] (paired square brackets)
One instance of the evaluated value of the enclosed term. Parentheses are usedto indicate the order of evaluation in the regular expression.
For example, dev(/|ice) matches messages with dev/ or device.
() (paired parentheses)
Before You Begin
Before you begin configuring and monitoring system log messages, complete thefollowing tasks:
■ Establish basic connectivity. See the Getting Started Guide for your device.
■ Configure network interfaces. See the JUNOS Software Interfaces and RoutingConfiguration Guide.
Configuring System Log Messages with a Configuration Editor
This section contains the following topics:
■ Sending System Log Messages to a File on page 266
■ Sending System Log Messages to a User Terminal on page 266
■ Archiving System Logs on page 267
■ Disabling System Logs on page 267
Before You Begin ■ 265
Chapter 12: Monitoring Events and Managing System Log Files
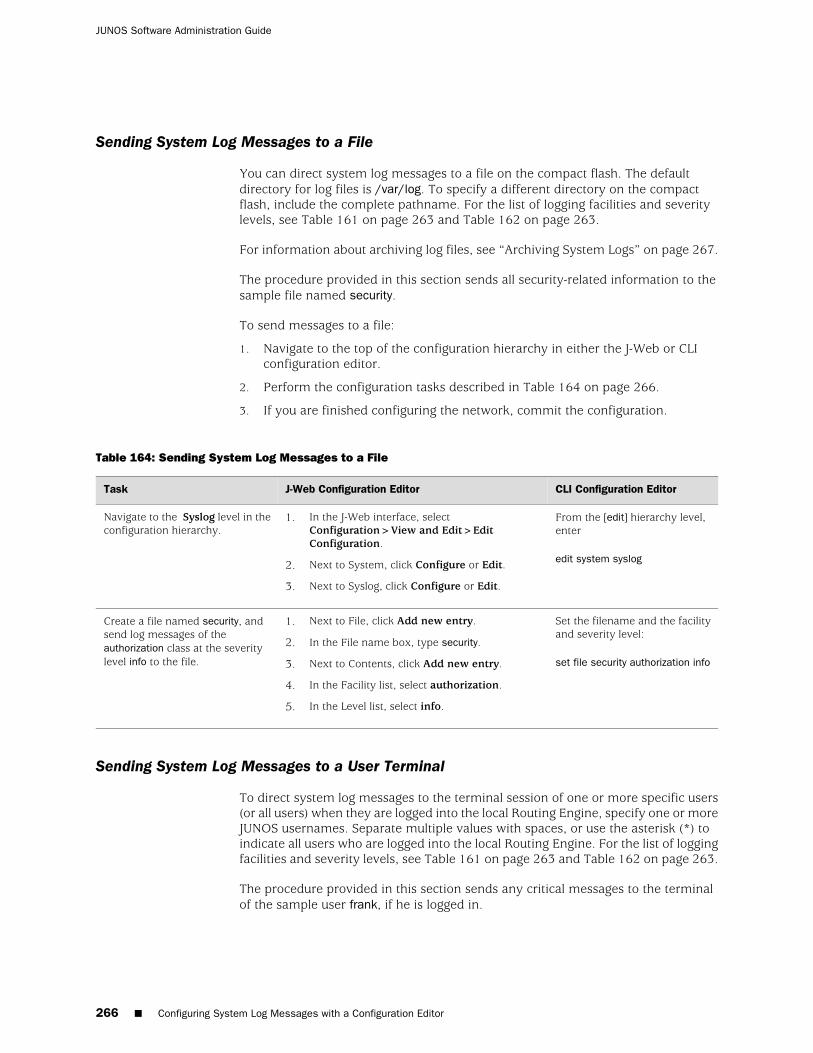
Sending System Log Messages to a File
You can direct system log messages to a file on the compact flash. The defaultdirectory for log files is /var/log. To specify a different directory on the compactflash, include the complete pathname. For the list of logging facilities and severitylevels, see Table 161 on page 263 and Table 162 on page 263.
For information about archiving log files, see “Archiving System Logs” on page 267.
The procedure provided in this section sends all security-related information to thesample file named security.
To send messages to a file:
1. Navigate to the top of the configuration hierarchy in either the J-Web or CLIconfiguration editor.
2. Perform the configuration tasks described in Table 164 on page 266.
3. If you are finished configuring the network, commit the configuration.
Table 164: Sending System Log Messages to a File
CLI Configuration EditorJ-Web Configuration EditorTask
From the [edit] hierarchy level,enter
edit system syslog
1. In the J-Web interface, selectConfiguration>View and Edit>EditConfiguration.
2. Next to System, click Configure or Edit.
3. Next to Syslog, click Configure or Edit.
Navigate to the Syslog level in theconfiguration hierarchy.
Set the filename and the facilityand severity level:
set file security authorization info
1. Next to File, click Add new entry.
2. In the File name box, type security.
3. Next to Contents, click Add new entry.
4. In the Facility list, select authorization.
5. In the Level list, select info.
Create a file named security, andsend log messages of theauthorization class at the severitylevel info to the file.
Sending System Log Messages to a User Terminal
To direct system log messages to the terminal session of one or more specific users(or all users) when they are logged into the local Routing Engine, specify one or moreJUNOS usernames. Separate multiple values with spaces, or use the asterisk (*) toindicate all users who are logged into the local Routing Engine. For the list of loggingfacilities and severity levels, see Table 161 on page 263 and Table 162 on page 263.
The procedure provided in this section sends any critical messages to the terminalof the sample user frank, if he is logged in.
266 ■ Configuring System Log Messages with a Configuration Editor
JUNOS Software Administration Guide
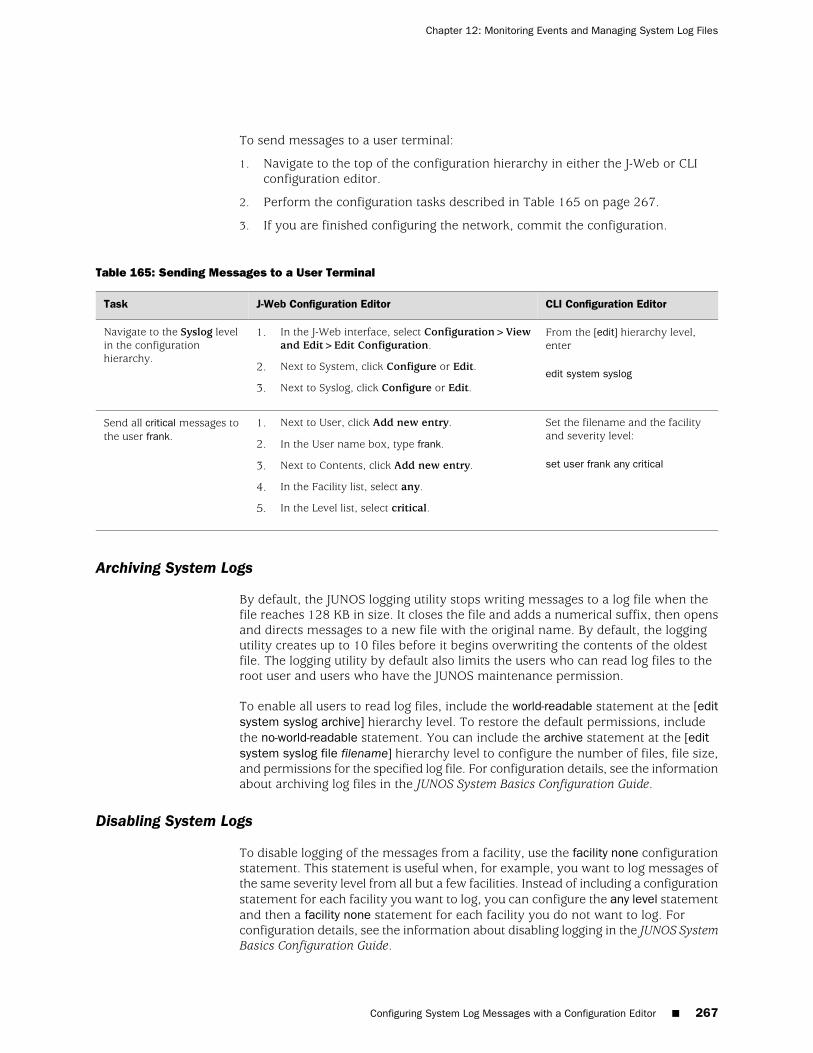
To send messages to a user terminal:
1. Navigate to the top of the configuration hierarchy in either the J-Web or CLIconfiguration editor.
2. Perform the configuration tasks described in Table 165 on page 267.
3. If you are finished configuring the network, commit the configuration.
Table 165: Sending Messages to a User Terminal
CLI Configuration EditorJ-Web Configuration EditorTask
From the [edit] hierarchy level,enter
edit system syslog
1. In the J-Web interface, select Configuration>Viewand Edit>Edit Configuration.
2. Next to System, click Configure or Edit.
3. Next to Syslog, click Configure or Edit.
Navigate to the Syslog levelin the configurationhierarchy.
Set the filename and the facilityand severity level:
set user frank any critical
1. Next to User, click Add new entry.
2. In the User name box, type frank.
3. Next to Contents, click Add new entry.
4. In the Facility list, select any.
5. In the Level list, select critical.
Send all critical messages tothe user frank.
Archiving System Logs
By default, the JUNOS logging utility stops writing messages to a log file when thefile reaches 128 KB in size. It closes the file and adds a numerical suffix, then opensand directs messages to a new file with the original name. By default, the loggingutility creates up to 10 files before it begins overwriting the contents of the oldestfile. The logging utility by default also limits the users who can read log files to theroot user and users who have the JUNOS maintenance permission.
To enable all users to read log files, include the world-readable statement at the [editsystem syslog archive] hierarchy level. To restore the default permissions, includethe no-world-readable statement. You can include the archive statement at the [editsystem syslog file filename] hierarchy level to configure the number of files, file size,and permissions for the specified log file. For configuration details, see the informationabout archiving log files in the JUNOS System Basics Configuration Guide.
Disabling System Logs
To disable logging of the messages from a facility, use the facility none configurationstatement. This statement is useful when, for example, you want to log messages ofthe same severity level from all but a few facilities. Instead of including a configurationstatement for each facility you want to log, you can configure the any level statementand then a facility none statement for each facility you do not want to log. Forconfiguration details, see the information about disabling logging in the JUNOS SystemBasics Configuration Guide.
Configuring System Log Messages with a Configuration Editor ■ 267
Chapter 12: Monitoring Events and Managing System Log Files
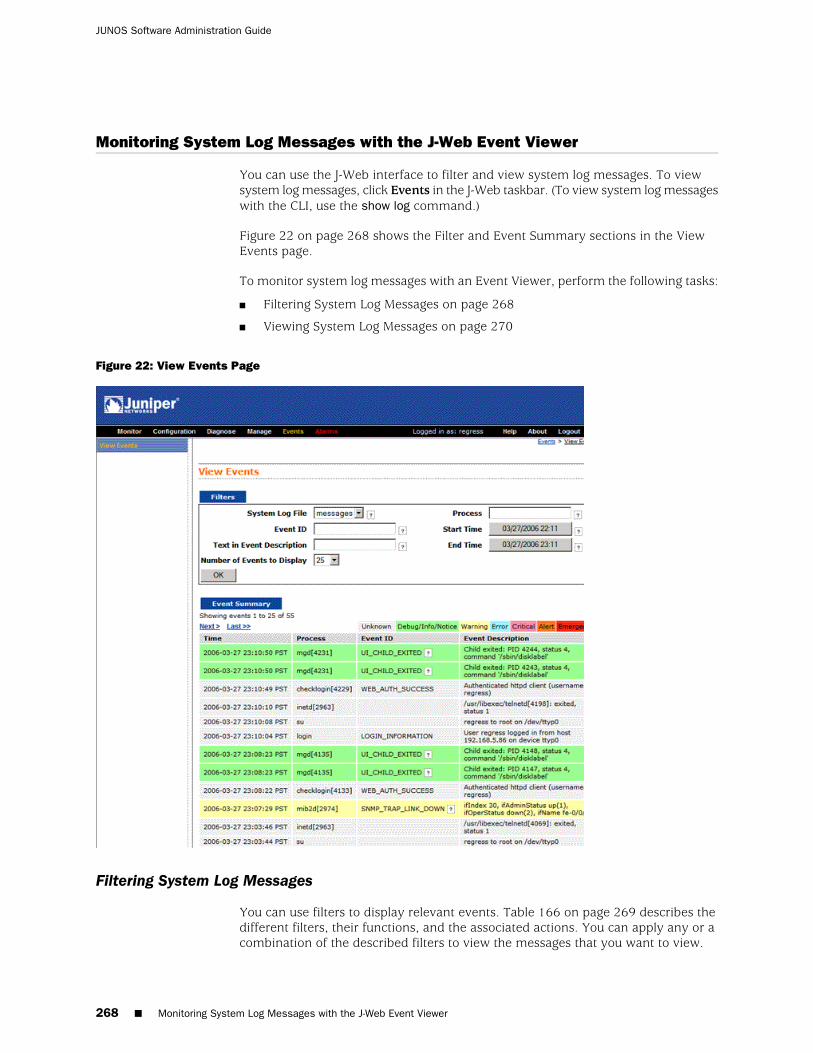
Monitoring System Log Messages with the J-Web Event Viewer
You can use the J-Web interface to filter and view system log messages. To viewsystem log messages, click Events in the J-Web taskbar. (To view system log messageswith the CLI, use the show log command.)
Figure 22 on page 268 shows the Filter and Event Summary sections in the ViewEvents page.
To monitor system log messages with an Event Viewer, perform the following tasks:
■ Filtering System Log Messages on page 268
■ Viewing System Log Messages on page 270
Figure 22: View Events Page
Filtering System Log Messages
You can use filters to display relevant events. Table 166 on page 269 describes thedifferent filters, their functions, and the associated actions. You can apply any or acombination of the described filters to view the messages that you want to view.
268 ■ Monitoring System Log Messages with the J-Web Event Viewer
JUNOS Software Administration Guide

Table 166: Filtering System Log Messages
Your ActionFunctionField
To specify events recorded in a particular file,select the system log filename from thelist—for example, messages.
Specifies the name of a system log file for which you want todisplay the recorded events.
Lists the names of all the system log files that you configure.
By default, a log file, messages, is included in the /var/log/directory.
For information about how to configure system log files, see“Sending System Log Messages to a File” on page 266.
System LogFile
To specify events with a specific ID, type itspartial or complete ID—for example,TFTPD_AF_ERR.
Specifies the Event ID for which you want to display themessages.
Allows you to type part of the ID and completes the remainingautomatically.
An event ID, also known as system log message code, uniquelyidentifies a system log message. It begins with a prefix thatindicates the generating software process or library.
Event ID
To specify events with a specific description,type a text string from the description withregular expression.
For example, type ^Initial* to display allmessages with lines beginning with the termInitial.
Specifies text from the description of events that you want todisplay.
Allows you to use regular expression to match text from theevent description.
NOTE: The regular expression matching is case sensitive.
For more information about using regular expressions, see“Regular Expressions” on page 264.
Text in EventDescription
To specify events generated by a process, typethe name of the process.
For example, type mgd to list all messagesgenerated by the management process.
Specifies the name of the process generating the events youwant to display.
To view all the processes running on your system, enter theCLI command—show system processes.
For more information about processes, see the JUNOS SoftwareInstallation and Upgrade Guide.
Process
To specify the time period:
■ Click the box next to Start Time andselect the year, month, date, andtime—for example, 02/10/2006 11:32.
■ Click the box next to End Time andselect the year, month, date, andtime—for example, 02/10/2006 3:32.
To select the current time as the start time,select local time.
Specifies the time period in which the events you wantdisplayed are generated.
Displays a calendar that allows you to select the year, month,day, and time. It also allows you to select the local time.
By default, the messages generated in the last one hour aredisplayed—End Time shows the current time and Start Timeshows the time one hour before end time.
Start Time
End Time
Monitoring System Log Messages with the J-Web Event Viewer ■ 269
Chapter 12: Monitoring Events and Managing System Log Files
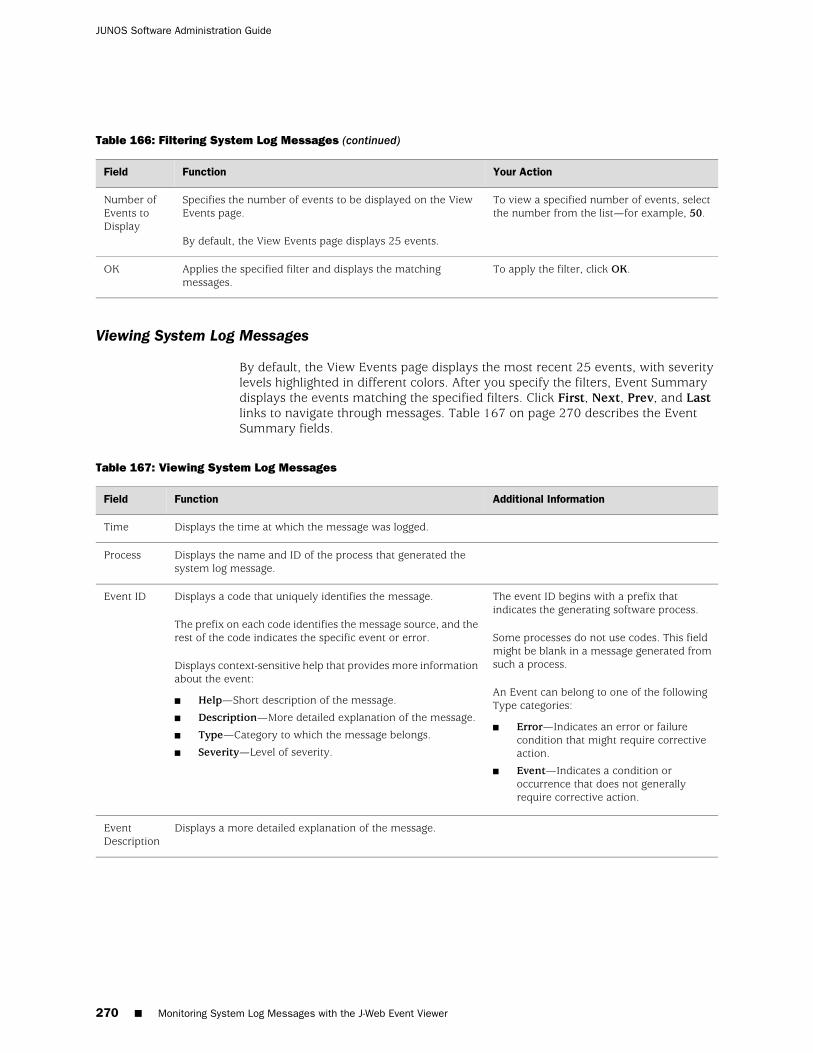
Table 166: Filtering System Log Messages (continued)
Your ActionFunctionField
To view a specified number of events, selectthe number from the list—for example, 50.
Specifies the number of events to be displayed on the ViewEvents page.
By default, the View Events page displays 25 events.
Number ofEvents toDisplay
To apply the filter, click OK.Applies the specified filter and displays the matchingmessages.
OK
Viewing System Log Messages
By default, the View Events page displays the most recent 25 events, with severitylevels highlighted in different colors. After you specify the filters, Event Summarydisplays the events matching the specified filters. Click First, Next, Prev, and Lastlinks to navigate through messages. Table 167 on page 270 describes the EventSummary fields.
Table 167: Viewing System Log Messages
Additional InformationFunctionField
Displays the time at which the message was logged.Time
Displays the name and ID of the process that generated thesystem log message.
Process
The event ID begins with a prefix thatindicates the generating software process.
Some processes do not use codes. This fieldmight be blank in a message generated fromsuch a process.
An Event can belong to one of the followingType categories:
■ Error—Indicates an error or failurecondition that might require correctiveaction.
■ Event—Indicates a condition oroccurrence that does not generallyrequire corrective action.
Displays a code that uniquely identifies the message.
The prefix on each code identifies the message source, and therest of the code indicates the specific event or error.
Displays context-sensitive help that provides more informationabout the event:
■ Help—Short description of the message.
■ Description—More detailed explanation of the message.
■ Type—Category to which the message belongs.
■ Severity—Level of severity.
Event ID
Displays a more detailed explanation of the message.EventDescription
270 ■ Monitoring System Log Messages with the J-Web Event Viewer
JUNOS Software Administration Guide
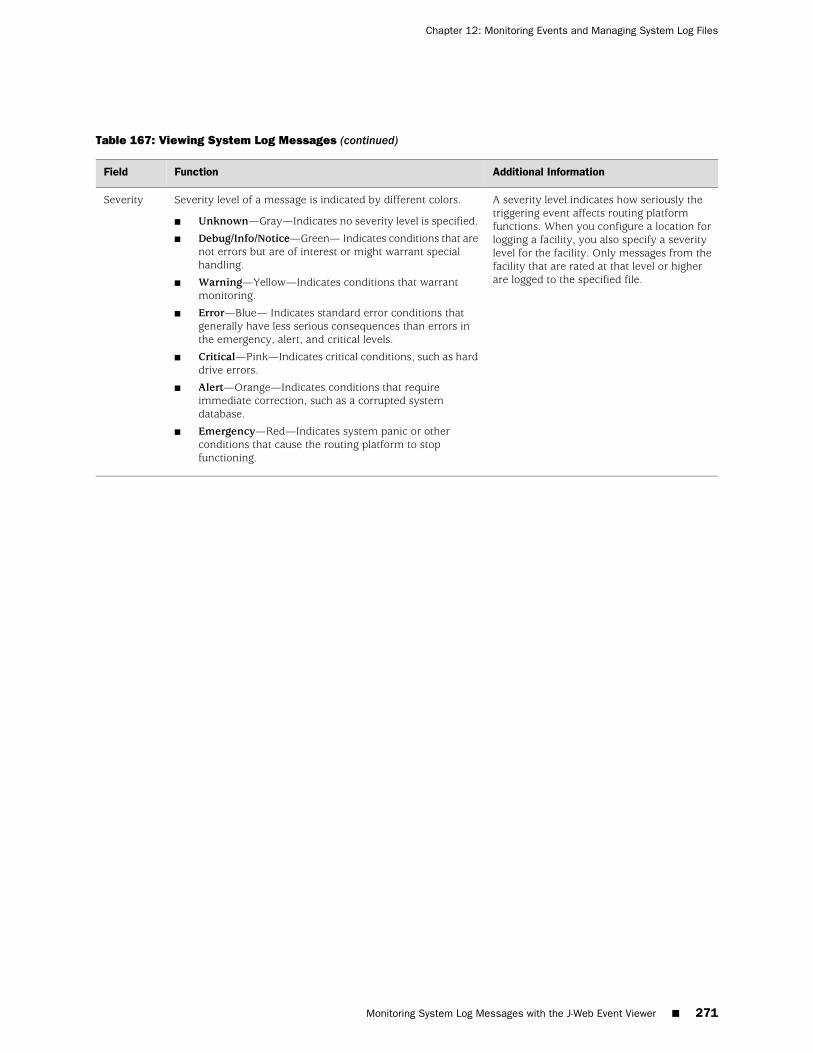
Table 167: Viewing System Log Messages (continued)
Additional InformationFunctionField
A severity level indicates how seriously thetriggering event affects routing platformfunctions. When you configure a location forlogging a facility, you also specify a severitylevel for the facility. Only messages from thefacility that are rated at that level or higherare logged to the specified file.
Severity level of a message is indicated by different colors.
■ Unknown—Gray—Indicates no severity level is specified.
■ Debug/Info/Notice—Green— Indicates conditions that arenot errors but are of interest or might warrant specialhandling.
■ Warning—Yellow—Indicates conditions that warrantmonitoring.
■ Error—Blue— Indicates standard error conditions thatgenerally have less serious consequences than errors inthe emergency, alert, and critical levels.
■ Critical—Pink—Indicates critical conditions, such as harddrive errors.
■ Alert—Orange—Indicates conditions that requireimmediate correction, such as a corrupted systemdatabase.
■ Emergency—Red—Indicates system panic or otherconditions that cause the routing platform to stopfunctioning.
Severity
Monitoring System Log Messages with the J-Web Event Viewer ■ 271
Chapter 12: Monitoring Events and Managing System Log Files

272 ■ Monitoring System Log Messages with the J-Web Event Viewer
JUNOS Software Administration Guide
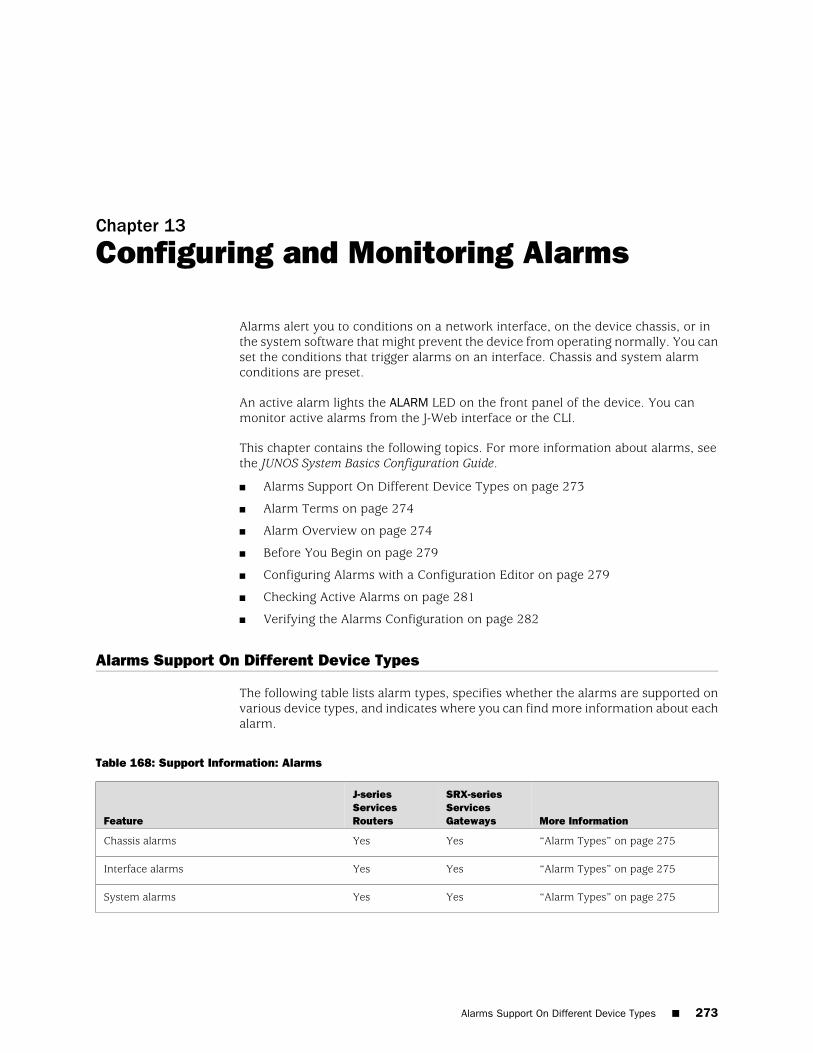
Chapter 13
Configuring and Monitoring Alarms
Alarms alert you to conditions on a network interface, on the device chassis, or inthe system software that might prevent the device from operating normally. You canset the conditions that trigger alarms on an interface. Chassis and system alarmconditions are preset.
An active alarm lights the ALARM LED on the front panel of the device. You canmonitor active alarms from the J-Web interface or the CLI.
This chapter contains the following topics. For more information about alarms, seethe JUNOS System Basics Configuration Guide.
■ Alarms Support On Different Device Types on page 273
■ Alarm Terms on page 274
■ Alarm Overview on page 274
■ Before You Begin on page 279
■ Configuring Alarms with a Configuration Editor on page 279
■ Checking Active Alarms on page 281
■ Verifying the Alarms Configuration on page 282
Alarms Support On Different Device Types
The following table lists alarm types, specifies whether the alarms are supported onvarious device types, and indicates where you can find more information about eachalarm.
Table 168: Support Information: Alarms
More Information
SRX-seriesServicesGateways
J-seriesServicesRoutersFeature
“Alarm Types” on page 275YesYesChassis alarms
“Alarm Types” on page 275YesYesInterface alarms
“Alarm Types” on page 275YesYesSystem alarms
Alarms Support On Different Device Types ■ 273
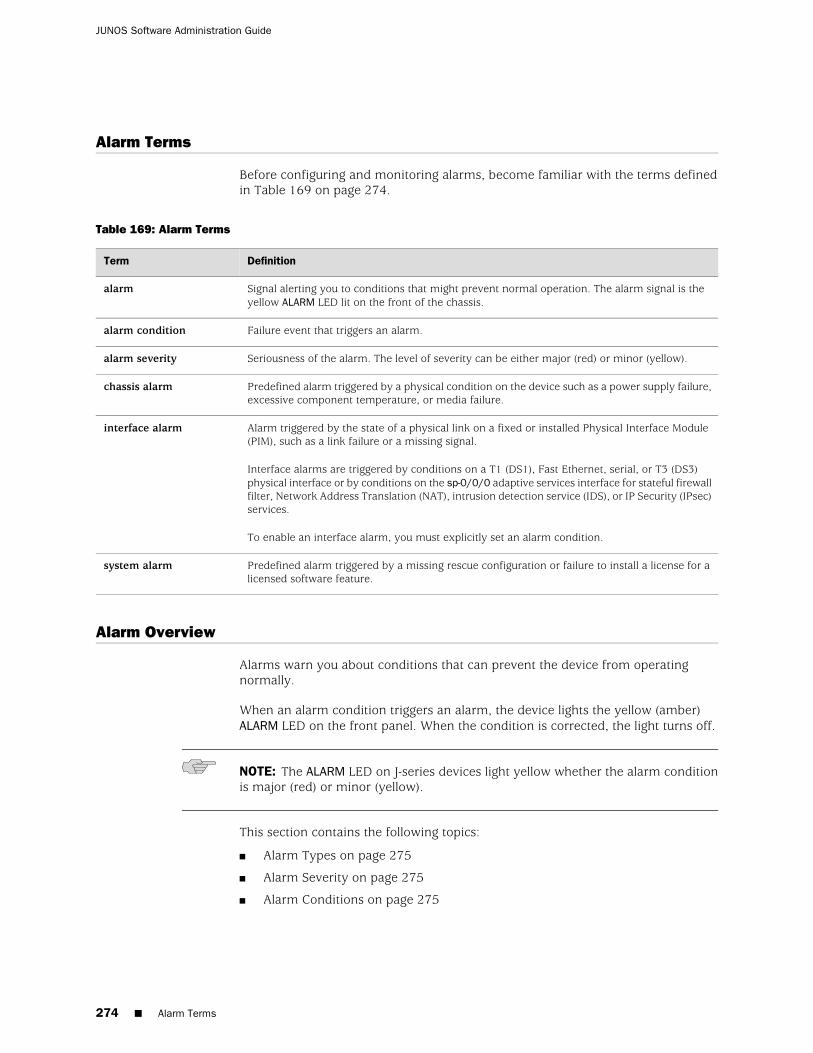
Alarm Terms
Before configuring and monitoring alarms, become familiar with the terms definedin Table 169 on page 274.
Table 169: Alarm Terms
DefinitionTerm
Signal alerting you to conditions that might prevent normal operation. The alarm signal is theyellow ALARM LED lit on the front of the chassis.
alarm
Failure event that triggers an alarm.alarm condition
Seriousness of the alarm. The level of severity can be either major (red) or minor (yellow).alarm severity
Predefined alarm triggered by a physical condition on the device such as a power supply failure,excessive component temperature, or media failure.
chassis alarm
Alarm triggered by the state of a physical link on a fixed or installed Physical Interface Module(PIM), such as a link failure or a missing signal.
Interface alarms are triggered by conditions on a T1 (DS1), Fast Ethernet, serial, or T3 (DS3)physical interface or by conditions on the sp-0/0/0 adaptive services interface for stateful firewallfilter, Network Address Translation (NAT), intrusion detection service (IDS), or IP Security (IPsec)services.
To enable an interface alarm, you must explicitly set an alarm condition.
interface alarm
Predefined alarm triggered by a missing rescue configuration or failure to install a license for alicensed software feature.
system alarm
Alarm Overview
Alarms warn you about conditions that can prevent the device from operatingnormally.
When an alarm condition triggers an alarm, the device lights the yellow (amber)ALARM LED on the front panel. When the condition is corrected, the light turns off.
NOTE: The ALARM LED on J-series devices light yellow whether the alarm conditionis major (red) or minor (yellow).
This section contains the following topics:
■ Alarm Types on page 275
■ Alarm Severity on page 275
■ Alarm Conditions on page 275
274 ■ Alarm Terms
JUNOS Software Administration Guide
Alarm Types
The device supports three types of alarms:
■ Interface alarms indicate a problem in the state of the physical links on fixed orinstalled PIMs. To enable interface alarms, you must configure them.
■ Chassis alarms indicate a failure on the device or one of its components. Chassisalarms are preset and cannot be modified.
■ System alarms indicate a missing rescue configuration or software license, wherevalid. System alarms are preset and cannot be modified, although you canconfigure them to appear automatically in the J-Web or CLI display.
Alarm Severity
Alarms have two severity levels:
■ Major (red)—Indicates a critical situation on the device that has resulted fromone of the following conditions. A red alarm condition requires immediate action.
■ One or more hardware components have failed.
■ One or more hardware components have exceeded temperature thresholds.
■ An alarm condition configured on an interface has triggered a critical warning.
■ Minor (yellow)—Indicates a noncritical condition on the device that, if leftunchecked, might cause an interruption in service or degradation in performance.A yellow alarm condition requires monitoring or maintenance.
A missing rescue configuration or software license generates a yellow systemalarm.
Alarm Conditions
To enable alarms on a device interface, you must select an alarm condition and analarm severity. In contrast, alarm conditions and severity are preconfigured forchassis alarms and system alarms.
NOTE: For information about chassis alarms for your device, see the Hardware Guidefor your device.
This section contains the following topics:
■ Interface Alarm Conditions on page 275
■ System Alarm Conditions and Corrective Actions on page 278
Interface Alarm Conditions
Table 170 on page 276 lists the interface conditions, sorted by interface type, thatyou can configure for an alarm. Each alarm condition can be configured to trigger
Alarm Overview ■ 275
Chapter 13: Configuring and Monitoring Alarms
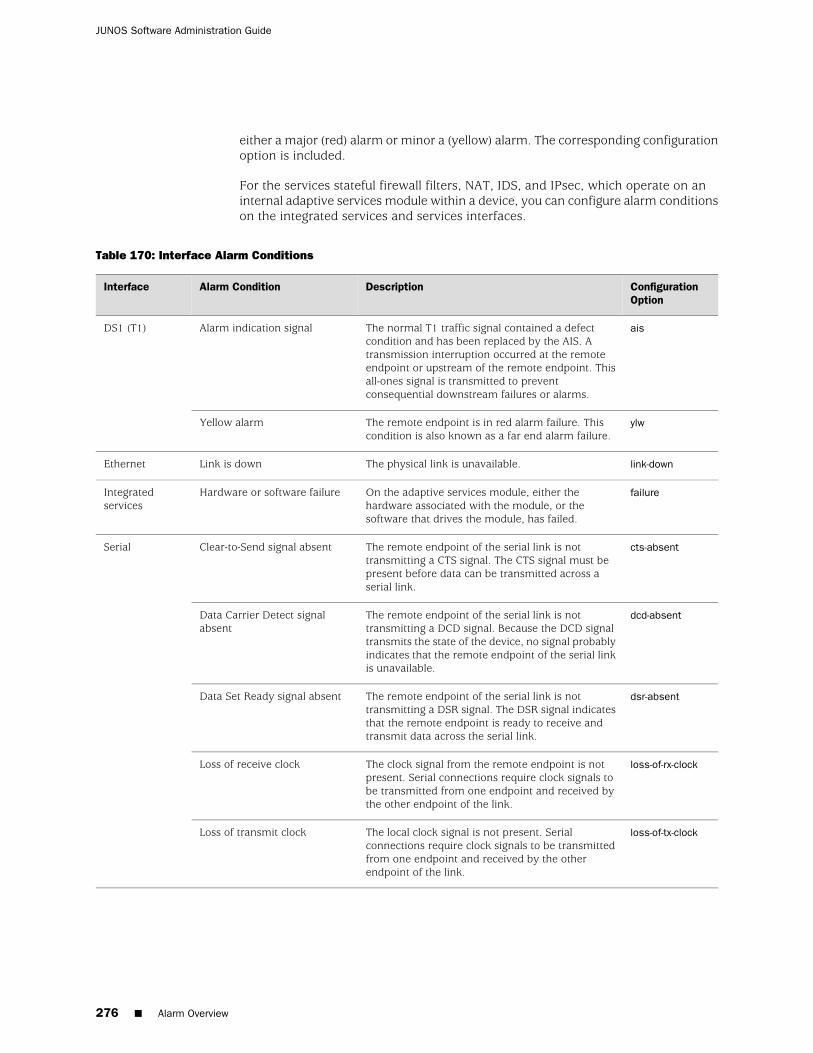
either a major (red) alarm or minor a (yellow) alarm. The corresponding configurationoption is included.
For the services stateful firewall filters, NAT, IDS, and IPsec, which operate on aninternal adaptive services module within a device, you can configure alarm conditionson the integrated services and services interfaces.
Table 170: Interface Alarm Conditions
ConfigurationOption
DescriptionAlarm ConditionInterface
aisThe normal T1 traffic signal contained a defectcondition and has been replaced by the AIS. Atransmission interruption occurred at the remoteendpoint or upstream of the remote endpoint. Thisall-ones signal is transmitted to preventconsequential downstream failures or alarms.
Alarm indication signalDS1 (T1)
ylwThe remote endpoint is in red alarm failure. Thiscondition is also known as a far end alarm failure.
Yellow alarm
link-downThe physical link is unavailable.Link is downEthernet
failureOn the adaptive services module, either thehardware associated with the module, or thesoftware that drives the module, has failed.
Hardware or software failureIntegratedservices
cts-absentThe remote endpoint of the serial link is nottransmitting a CTS signal. The CTS signal must bepresent before data can be transmitted across aserial link.
Clear-to-Send signal absentSerial
dcd-absentThe remote endpoint of the serial link is nottransmitting a DCD signal. Because the DCD signaltransmits the state of the device, no signal probablyindicates that the remote endpoint of the serial linkis unavailable.
Data Carrier Detect signalabsent
dsr-absentThe remote endpoint of the serial link is nottransmitting a DSR signal. The DSR signal indicatesthat the remote endpoint is ready to receive andtransmit data across the serial link.
Data Set Ready signal absent
loss-of-rx-clockThe clock signal from the remote endpoint is notpresent. Serial connections require clock signals tobe transmitted from one endpoint and received bythe other endpoint of the link.
Loss of receive clock
loss-of-tx-clockThe local clock signal is not present. Serialconnections require clock signals to be transmittedfrom one endpoint and received by the otherendpoint of the link.
Loss of transmit clock
276 ■ Alarm Overview
JUNOS Software Administration Guide
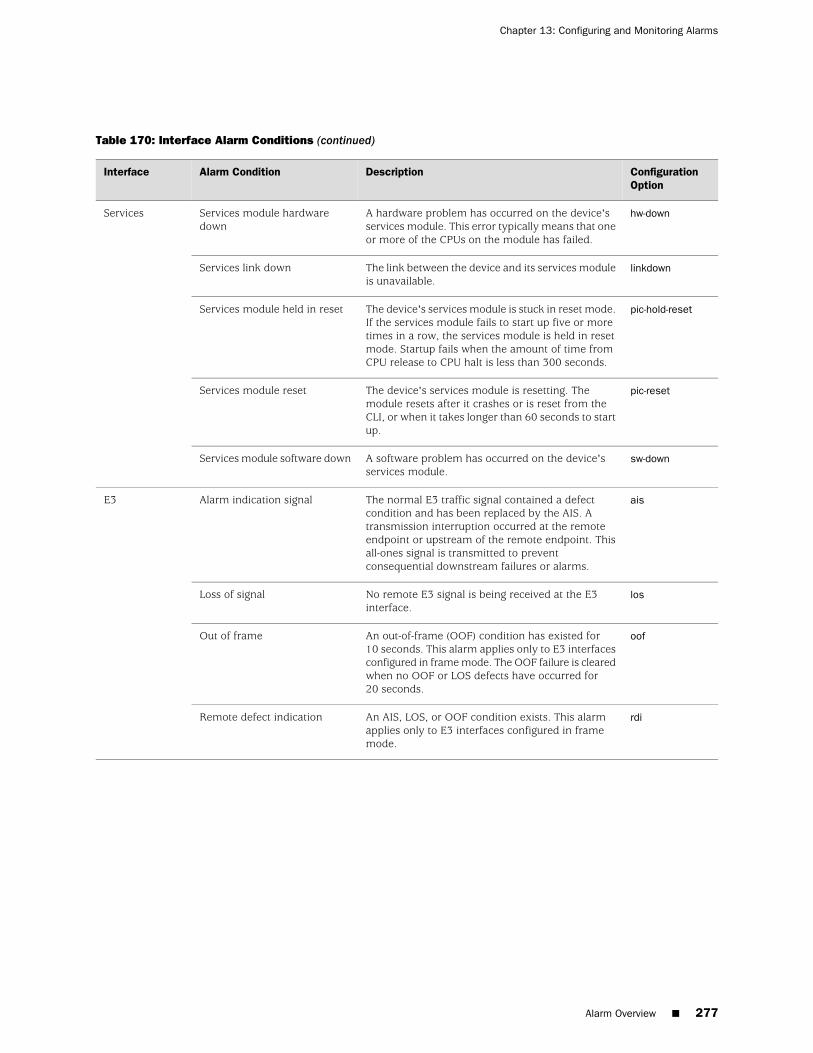
Table 170: Interface Alarm Conditions (continued)
ConfigurationOption
DescriptionAlarm ConditionInterface
hw-downA hardware problem has occurred on the device'sservices module. This error typically means that oneor more of the CPUs on the module has failed.
Services module hardwaredown
Services
linkdownThe link between the device and its services moduleis unavailable.
Services link down
pic-hold-resetThe device's services module is stuck in reset mode.If the services module fails to start up five or moretimes in a row, the services module is held in resetmode. Startup fails when the amount of time fromCPU release to CPU halt is less than 300 seconds.
Services module held in reset
pic-resetThe device's services module is resetting. Themodule resets after it crashes or is reset from theCLI, or when it takes longer than 60 seconds to startup.
Services module reset
sw-downA software problem has occurred on the device'sservices module.
Services module software down
aisThe normal E3 traffic signal contained a defectcondition and has been replaced by the AIS. Atransmission interruption occurred at the remoteendpoint or upstream of the remote endpoint. Thisall-ones signal is transmitted to preventconsequential downstream failures or alarms.
Alarm indication signalE3
losNo remote E3 signal is being received at the E3interface.
Loss of signal
oofAn out-of-frame (OOF) condition has existed for10 seconds. This alarm applies only to E3 interfacesconfigured in frame mode. The OOF failure is clearedwhen no OOF or LOS defects have occurred for20 seconds.
Out of frame
rdiAn AIS, LOS, or OOF condition exists. This alarmapplies only to E3 interfaces configured in framemode.
Remote defect indication
Alarm Overview ■ 277
Chapter 13: Configuring and Monitoring Alarms
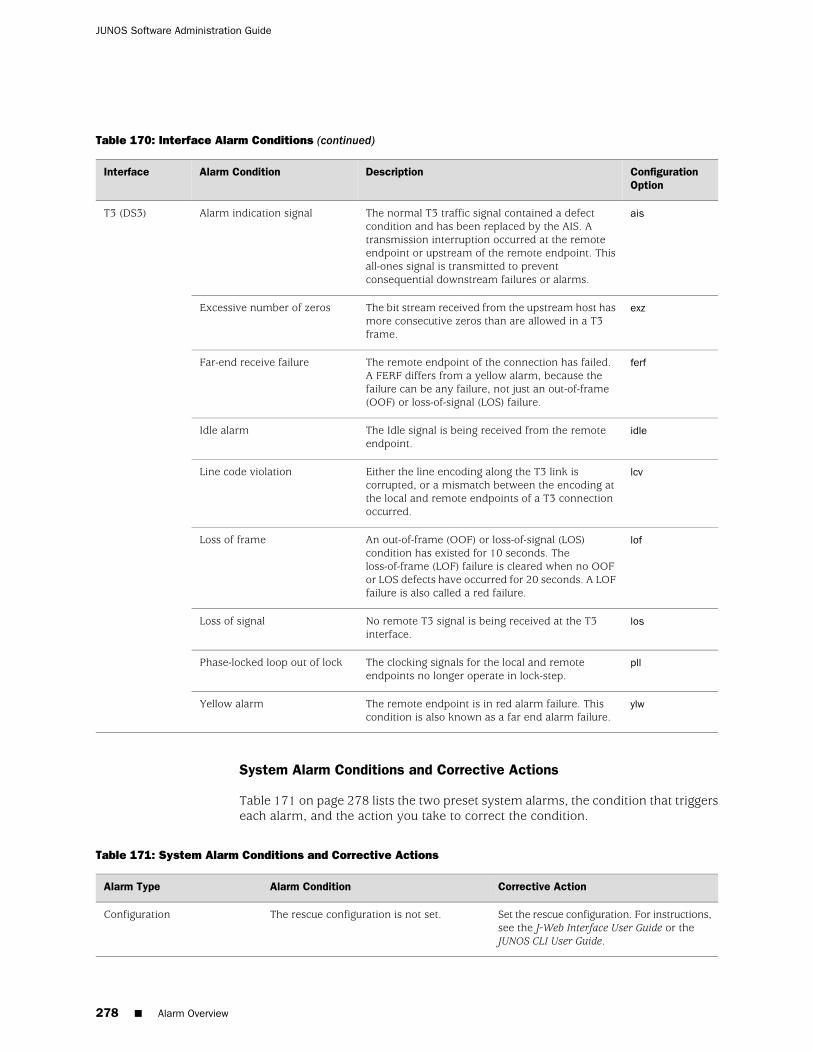
Table 170: Interface Alarm Conditions (continued)
ConfigurationOption
DescriptionAlarm ConditionInterface
aisThe normal T3 traffic signal contained a defectcondition and has been replaced by the AIS. Atransmission interruption occurred at the remoteendpoint or upstream of the remote endpoint. Thisall-ones signal is transmitted to preventconsequential downstream failures or alarms.
Alarm indication signalT3 (DS3)
exzThe bit stream received from the upstream host hasmore consecutive zeros than are allowed in a T3frame.
Excessive number of zeros
ferfThe remote endpoint of the connection has failed.A FERF differs from a yellow alarm, because thefailure can be any failure, not just an out-of-frame(OOF) or loss-of-signal (LOS) failure.
Far-end receive failure
idleThe Idle signal is being received from the remoteendpoint.
Idle alarm
lcvEither the line encoding along the T3 link iscorrupted, or a mismatch between the encoding atthe local and remote endpoints of a T3 connectionoccurred.
Line code violation
lofAn out-of-frame (OOF) or loss-of-signal (LOS)condition has existed for 10 seconds. Theloss-of-frame (LOF) failure is cleared when no OOFor LOS defects have occurred for 20 seconds. A LOFfailure is also called a red failure.
Loss of frame
losNo remote T3 signal is being received at the T3interface.
Loss of signal
pllThe clocking signals for the local and remoteendpoints no longer operate in lock-step.
Phase-locked loop out of lock
ylwThe remote endpoint is in red alarm failure. Thiscondition is also known as a far end alarm failure.
Yellow alarm
System Alarm Conditions and Corrective Actions
Table 171 on page 278 lists the two preset system alarms, the condition that triggerseach alarm, and the action you take to correct the condition.
Table 171: System Alarm Conditions and Corrective Actions
Corrective ActionAlarm ConditionAlarm Type
Set the rescue configuration. For instructions,see the J-Web Interface User Guide or theJUNOS CLI User Guide.
The rescue configuration is not set.Configuration
278 ■ Alarm Overview
JUNOS Software Administration Guide
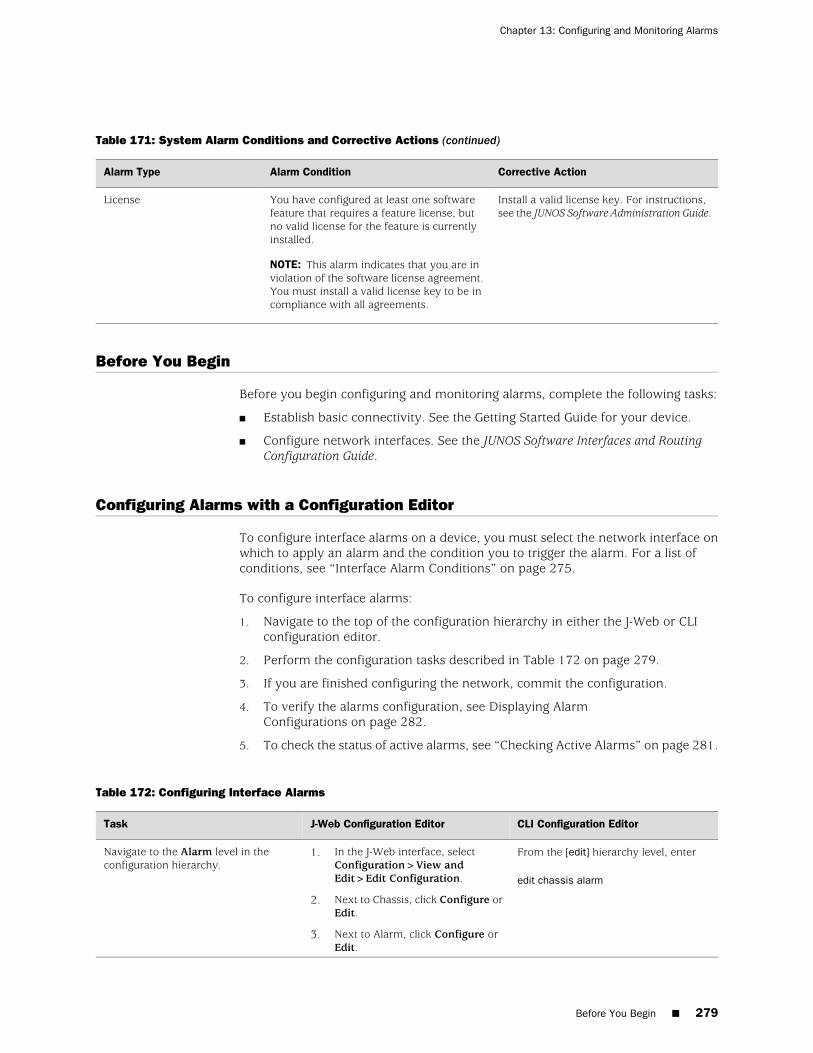
Table 171: System Alarm Conditions and Corrective Actions (continued)
Corrective ActionAlarm ConditionAlarm Type
Install a valid license key. For instructions,see the JUNOS Software Administration Guide.
You have configured at least one softwarefeature that requires a feature license, butno valid license for the feature is currentlyinstalled.
NOTE: This alarm indicates that you are inviolation of the software license agreement.You must install a valid license key to be incompliance with all agreements.
License
Before You Begin
Before you begin configuring and monitoring alarms, complete the following tasks:
■ Establish basic connectivity. See the Getting Started Guide for your device.
■ Configure network interfaces. See the JUNOS Software Interfaces and RoutingConfiguration Guide.
Configuring Alarms with a Configuration Editor
To configure interface alarms on a device, you must select the network interface onwhich to apply an alarm and the condition you to trigger the alarm. For a list ofconditions, see “Interface Alarm Conditions” on page 275.
To configure interface alarms:
1. Navigate to the top of the configuration hierarchy in either the J-Web or CLIconfiguration editor.
2. Perform the configuration tasks described in Table 172 on page 279.
3. If you are finished configuring the network, commit the configuration.
4. To verify the alarms configuration, see Displaying AlarmConfigurations on page 282.
5. To check the status of active alarms, see “Checking Active Alarms” on page 281.
Table 172: Configuring Interface Alarms
CLI Configuration EditorJ-Web Configuration EditorTask
From the [edit] hierarchy level, enter
edit chassis alarm
1. In the J-Web interface, selectConfiguration>View andEdit>Edit Configuration.
2. Next to Chassis, click Configure orEdit.
3. Next to Alarm, click Configure orEdit.
Navigate to the Alarm level in theconfiguration hierarchy.
Before You Begin ■ 279
Chapter 13: Configuring and Monitoring Alarms
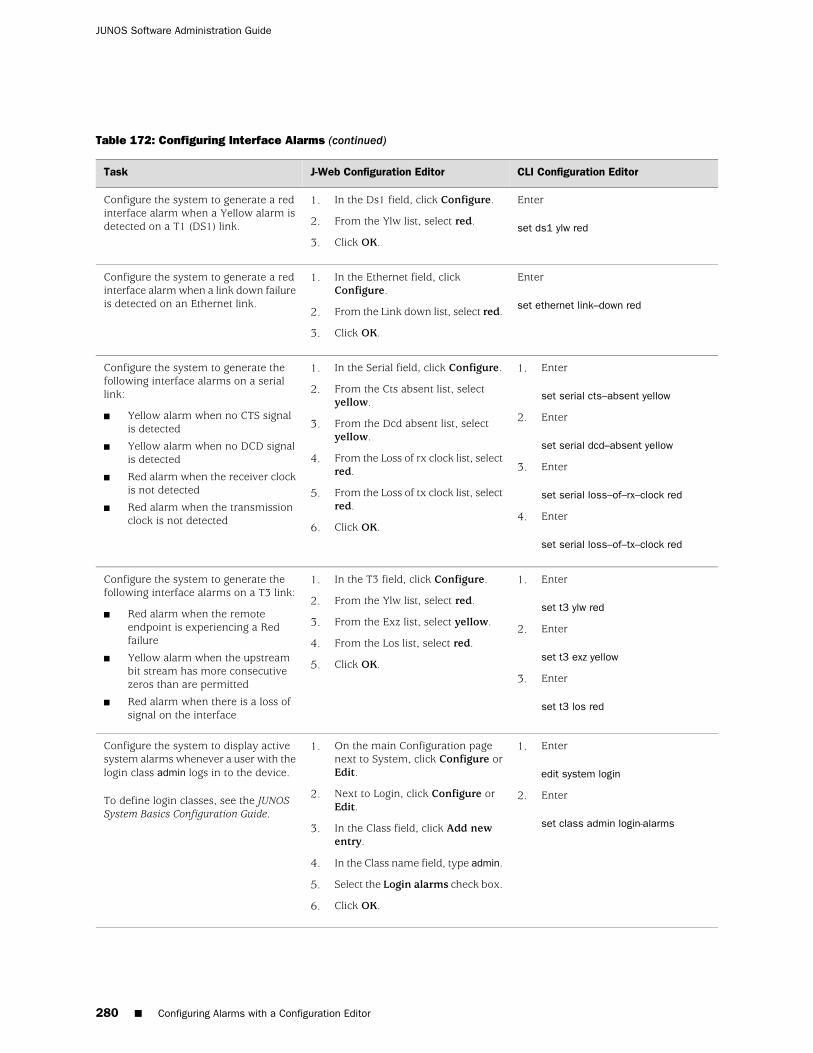
Table 172: Configuring Interface Alarms (continued)
CLI Configuration EditorJ-Web Configuration EditorTask
Enter
set ds1 ylw red
1. In the Ds1 field, click Configure.
2. From the Ylw list, select red.
3. Click OK.
Configure the system to generate a redinterface alarm when a Yellow alarm isdetected on a T1 (DS1) link.
Enter
set ethernet link–down red
1. In the Ethernet field, clickConfigure.
2. From the Link down list, select red.
3. Click OK.
Configure the system to generate a redinterface alarm when a link down failureis detected on an Ethernet link.
1. Enter
set serial cts–absent yellow
2. Enter
set serial dcd–absent yellow
3. Enter
set serial loss–of–rx–clock red
4. Enter
set serial loss–of–tx–clock red
1. In the Serial field, click Configure.
2. From the Cts absent list, selectyellow.
3. From the Dcd absent list, selectyellow.
4. From the Loss of rx clock list, selectred.
5. From the Loss of tx clock list, selectred.
6. Click OK.
Configure the system to generate thefollowing interface alarms on a seriallink:
■ Yellow alarm when no CTS signalis detected
■ Yellow alarm when no DCD signalis detected
■ Red alarm when the receiver clockis not detected
■ Red alarm when the transmissionclock is not detected
1. Enter
set t3 ylw red
2. Enter
set t3 exz yellow
3. Enter
set t3 los red
1. In the T3 field, click Configure.
2. From the Ylw list, select red.
3. From the Exz list, select yellow.
4. From the Los list, select red.
5. Click OK.
Configure the system to generate thefollowing interface alarms on a T3 link:
■ Red alarm when the remoteendpoint is experiencing a Redfailure
■ Yellow alarm when the upstreambit stream has more consecutivezeros than are permitted
■ Red alarm when there is a loss ofsignal on the interface
1. Enter
edit system login
2. Enter
set class admin login-alarms
1. On the main Configuration pagenext to System, click Configure orEdit.
2. Next to Login, click Configure orEdit.
3. In the Class field, click Add newentry.
4. In the Class name field, type admin.
5. Select the Login alarms check box.
6. Click OK.
Configure the system to display activesystem alarms whenever a user with thelogin class admin logs in to the device.
To define login classes, see the JUNOSSystem Basics Configuration Guide.
280 ■ Configuring Alarms with a Configuration Editor
JUNOS Software Administration Guide
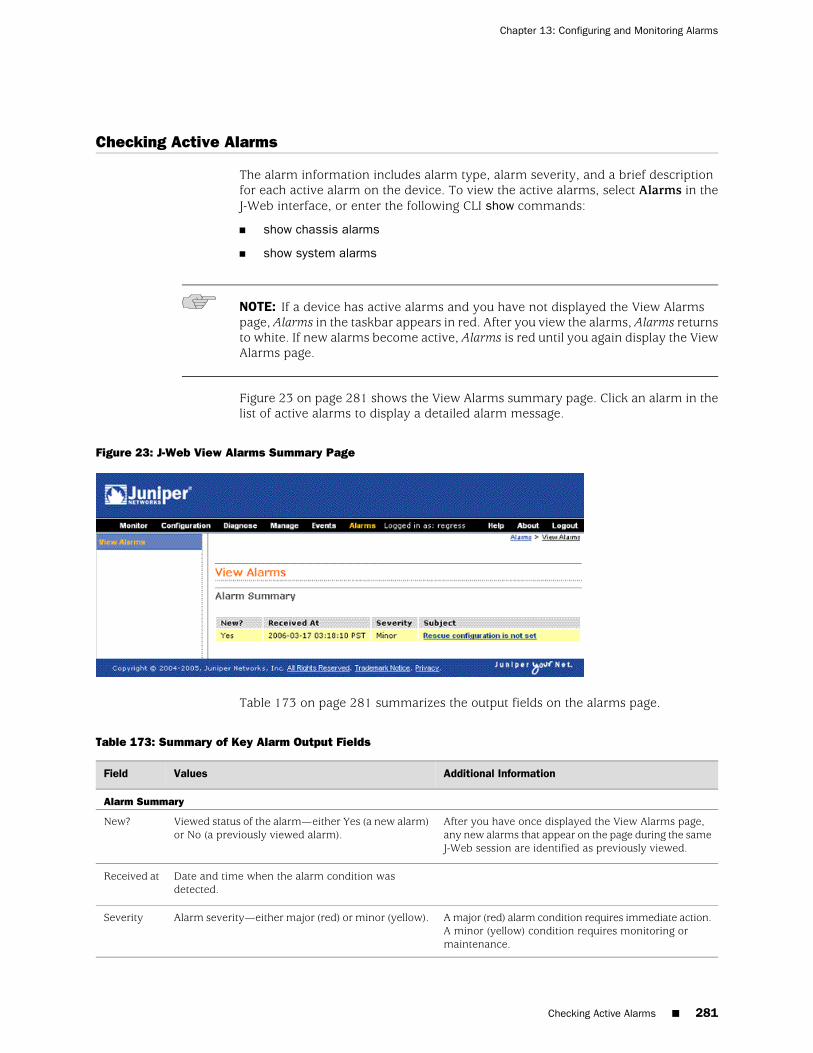
Checking Active Alarms
The alarm information includes alarm type, alarm severity, and a brief descriptionfor each active alarm on the device. To view the active alarms, select Alarms in theJ-Web interface, or enter the following CLI show commands:
■ show chassis alarms
■ show system alarms
NOTE: If a device has active alarms and you have not displayed the View Alarmspage, Alarms in the taskbar appears in red. After you view the alarms, Alarms returnsto white. If new alarms become active, Alarms is red until you again display the ViewAlarms page.
Figure 23 on page 281 shows the View Alarms summary page. Click an alarm in thelist of active alarms to display a detailed alarm message.
Figure 23: J-Web View Alarms Summary Page
Table 173 on page 281 summarizes the output fields on the alarms page.
Table 173: Summary of Key Alarm Output Fields
Additional InformationValuesField
Alarm Summary
After you have once displayed the View Alarms page,any new alarms that appear on the page during the sameJ-Web session are identified as previously viewed.
Viewed status of the alarm—either Yes (a new alarm)or No (a previously viewed alarm).
New?
Date and time when the alarm condition wasdetected.
Received at
A major (red) alarm condition requires immediate action.A minor (yellow) condition requires monitoring ormaintenance.
Alarm severity—either major (red) or minor (yellow).Severity
Checking Active Alarms ■ 281
Chapter 13: Configuring and Monitoring Alarms
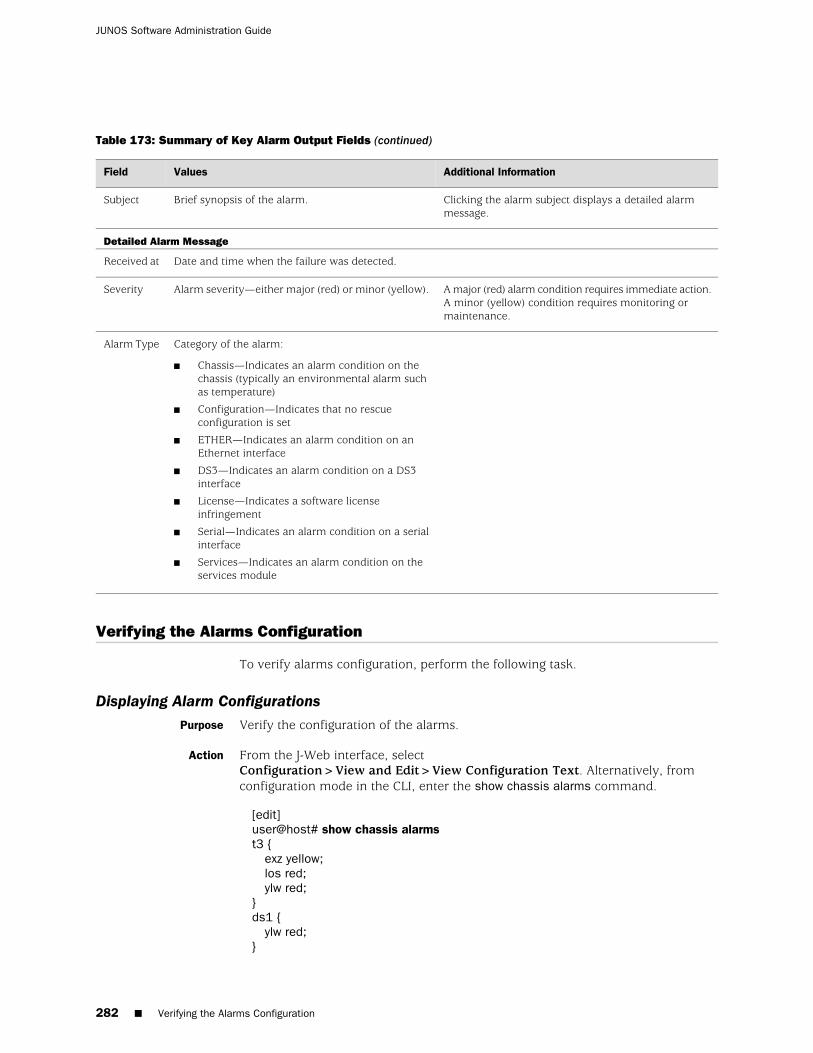
Table 173: Summary of Key Alarm Output Fields (continued)
Additional InformationValuesField
Clicking the alarm subject displays a detailed alarmmessage.
Brief synopsis of the alarm.Subject
Detailed Alarm Message
Date and time when the failure was detected.Received at
A major (red) alarm condition requires immediate action.A minor (yellow) condition requires monitoring ormaintenance.
Alarm severity—either major (red) or minor (yellow).Severity
Category of the alarm:
■ Chassis—Indicates an alarm condition on thechassis (typically an environmental alarm suchas temperature)
■ Configuration—Indicates that no rescueconfiguration is set
■ ETHER—Indicates an alarm condition on anEthernet interface
■ DS3—Indicates an alarm condition on a DS3interface
■ License—Indicates a software licenseinfringement
■ Serial—Indicates an alarm condition on a serialinterface
■ Services—Indicates an alarm condition on theservices module
Alarm Type
Verifying the Alarms Configuration
To verify alarms configuration, perform the following task.
Displaying Alarm ConfigurationsPurpose Verify the configuration of the alarms.
Action From the J-Web interface, selectConfiguration>View and Edit>View Configuration Text. Alternatively, fromconfiguration mode in the CLI, enter the show chassis alarms command.
[edit]user@host# show chassis alarmst3 {
exz yellow;los red;ylw red;
}ds1 {
ylw red;}
282 ■ Verifying the Alarms Configuration
JUNOS Software Administration Guide

ethernet {link-down red;
}serial {
loss-of-rx-clock red;loss-of-tx-clock red;dcd-absent yellow;cts-absent yellow;
}
Meaning The sample output in this section displays the following alarm settings (in order).Verify that the output shows the intended configuration of the alarms.
■ T3 alarms
■ DS1 alarms
■ Ethernet alarms
■ Serial alarms
Related Topics For more information about the format of a configuration file, see the J-Web InterfaceUser Guide or the JUNOS CLI User Guide.
Displaying Alarm Configurations ■ 283
Chapter 13: Configuring and Monitoring Alarms

284 ■ Displaying Alarm Configurations
JUNOS Software Administration Guide

Part 4
Managing Device Software
■ Performing Software Upgrades and Reboots on page 287
■ Understanding and Changing Secure and Router Contexts on page 309
■ Installing and Managing Licenses on page 323
■ Managing Files on page 329
Managing Device Software ■ 285

286 ■ Managing Device Software
JUNOS Software Administration Guide
Chapter 14
Performing Software Upgrades andReboots
J-series Services Routers are delivered with JUNOS software with enhanced servicespreinstalled and SRX-series services gateways are delivered with JUNOS softwarepreinstalled. When you power on the device, it starts (boots) up using its primaryboot device. These devices also support secondary boot devices allowing you to backup your primary boot device and configuration.
As new features and software fixes become available, you must upgrade your softwareto use them. Before an upgrade, we recommend that you back up your primary bootdevice.
On a Services Router you can configure the primary or secondary boot device witha “snapshot” of the current configuration, default factory configuration, or rescueconfiguration. You can also replicate the configuration for use on another device, orconfigure a boot device to receive core dumps for troubleshooting.
If the J-series or SRX-series device does not have a secondary boot device configuredand the primary boot device becomes corrupted, you can reload the JUNOS recoverysoftware package onto the corrupted compact flash with either a UNIX or MicrosoftWindows computer.
This chapter contains the following topics.
■ Upgrade and Reboot Support On Different Device Types on page 288
■ Upgrade and Downgrade Overview on page 288
■ Before You Begin on page 289
■ Downloading Software Upgrades from Juniper Networks on page 290
■ Installing Software Upgrades on page 290
■ Downgrading the Software on page 295
■ Configuring Boot Devices on page 297
■ Rebooting or Halting the Device on page 303
■ Bringing Chassis Components Online and Offline on page 307
■ Chassis Control Restart Options on page 308
■ 287
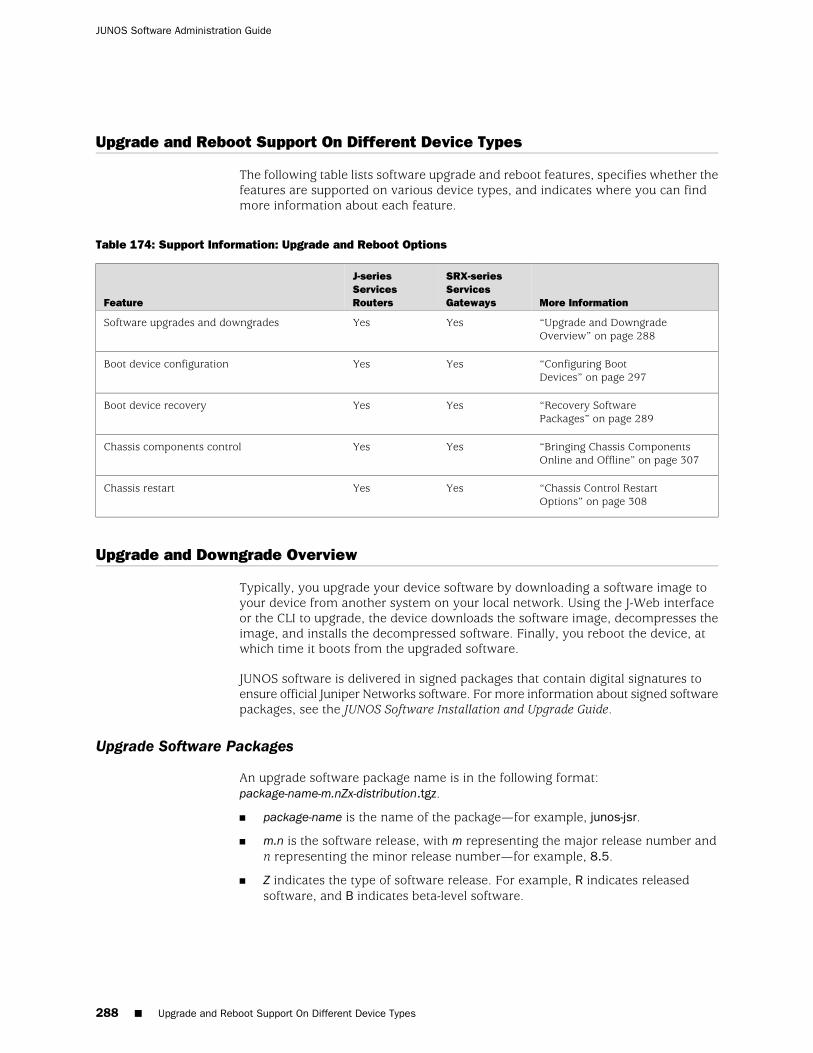
Upgrade and Reboot Support On Different Device Types
The following table lists software upgrade and reboot features, specifies whether thefeatures are supported on various device types, and indicates where you can findmore information about each feature.
Table 174: Support Information: Upgrade and Reboot Options
More Information
SRX-seriesServicesGateways
J-seriesServicesRoutersFeature
“Upgrade and DowngradeOverview” on page 288
YesYesSoftware upgrades and downgrades
“Configuring BootDevices” on page 297
YesYesBoot device configuration
“Recovery SoftwarePackages” on page 289
YesYesBoot device recovery
“Bringing Chassis ComponentsOnline and Offline” on page 307
YesYesChassis components control
“Chassis Control RestartOptions” on page 308
YesYesChassis restart
Upgrade and Downgrade Overview
Typically, you upgrade your device software by downloading a software image toyour device from another system on your local network. Using the J-Web interfaceor the CLI to upgrade, the device downloads the software image, decompresses theimage, and installs the decompressed software. Finally, you reboot the device, atwhich time it boots from the upgraded software.
JUNOS software is delivered in signed packages that contain digital signatures toensure official Juniper Networks software. For more information about signed softwarepackages, see the JUNOS Software Installation and Upgrade Guide.
Upgrade Software Packages
An upgrade software package name is in the following format:package-name-m.nZx-distribution.tgz.
■ package-name is the name of the package—for example, junos-jsr.
■ m.n is the software release, with m representing the major release number andn representing the minor release number—for example, 8.5.
■ Z indicates the type of software release. For example, R indicates releasedsoftware, and B indicates beta-level software.
288 ■ Upgrade and Reboot Support On Different Device Types
JUNOS Software Administration Guide
■ x.y represents the software build number and spin number—for example, 1.1.
■ distribution indicates the area for which the software package isprovided—domestic for the United States and Canada and export for worldwidedistribution.
A sample J-series upgrade software package name is junos-jsr-8.5R1.1-domestic.tgz.
Recovery Software Packages
Download a recovery software package, also known as an install media package, torecover a primary compact flash.
A recovery software package name is in the following format:package-name-m.nZx-export-cfnnn.gz.
■ package-name is the name of the package—for example, junos-jsr.
■ m.n is the software release, with m representing the major release number—forexample, 8.5.
■ Z indicates the type of software release. For example, R indicates releasedsoftware, and B indicates beta-level software.
■ x.y represents the software build number and spin number—for example, 1.1.
■ export indicates that the recovery software package is the exported worldwidesoftware package version.
■ cfnnn indicates the size of the target compact flash in megabytes—for example,cf256.
The following compact flash sizes are supported:
■ 256 MB
■ 512 MB
■ 1024 MB
Compact flash cards with 128 MB of storage capacity are not supported.
A sample J-series recovery software package name is junos-jsr-8.5R1.1-export-cf256.gz.
Before You Begin
To download software upgrades, you must have a Juniper Networks Web accountand a valid support contract. To obtain an account, complete the registration format the Juniper Networks Web site: https://www.juniper.net/registration/Register.jsp.
Before an upgrade, back up your primary boot device onto a secondary storagedevice. If you have a power failure during an upgrade, the primary boot device canfail or become corrupted. In either case, if a backup device is not available, the devicemight be unable to boot and come back online. Creating a backup also stores your
Before You Begin ■ 289
Chapter 14: Performing Software Upgrades and Reboots
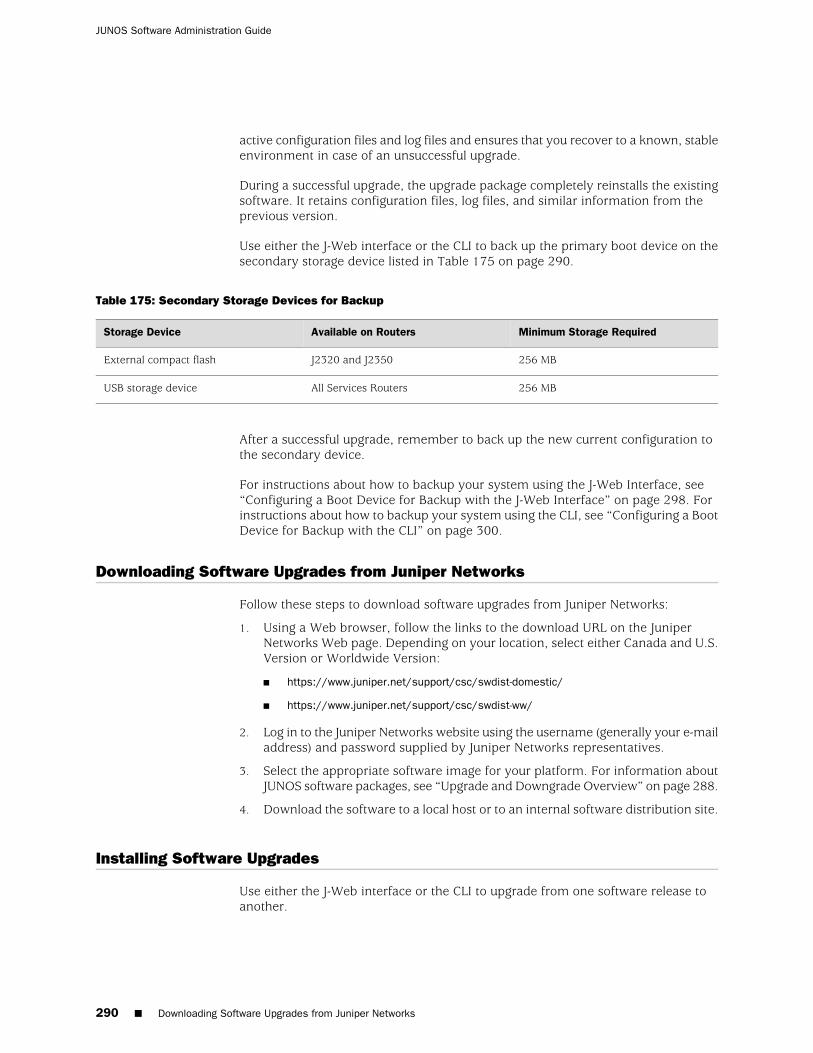
active configuration files and log files and ensures that you recover to a known, stableenvironment in case of an unsuccessful upgrade.
During a successful upgrade, the upgrade package completely reinstalls the existingsoftware. It retains configuration files, log files, and similar information from theprevious version.
Use either the J-Web interface or the CLI to back up the primary boot device on thesecondary storage device listed in Table 175 on page 290.
Table 175: Secondary Storage Devices for Backup
Minimum Storage RequiredAvailable on RoutersStorage Device
256 MBJ2320 and J2350External compact flash
256 MBAll Services RoutersUSB storage device
After a successful upgrade, remember to back up the new current configuration tothe secondary device.
For instructions about how to backup your system using the J-Web Interface, see“Configuring a Boot Device for Backup with the J-Web Interface” on page 298. Forinstructions about how to backup your system using the CLI, see “Configuring a BootDevice for Backup with the CLI” on page 300.
Downloading Software Upgrades from Juniper Networks
Follow these steps to download software upgrades from Juniper Networks:
1. Using a Web browser, follow the links to the download URL on the JuniperNetworks Web page. Depending on your location, select either Canada and U.S.Version or Worldwide Version:
■ https://www.juniper.net/support/csc/swdist-domestic/
■ https://www.juniper.net/support/csc/swdist-ww/
2. Log in to the Juniper Networks website using the username (generally your e-mailaddress) and password supplied by Juniper Networks representatives.
3. Select the appropriate software image for your platform. For information aboutJUNOS software packages, see “Upgrade and Downgrade Overview” on page 288.
4. Download the software to a local host or to an internal software distribution site.
Installing Software Upgrades
Use either the J-Web interface or the CLI to upgrade from one software release toanother.
290 ■ Downloading Software Upgrades from Juniper Networks
JUNOS Software Administration Guide
NOTE: To upgrade from the JUNOS software to JUNOS software with enhancedservices, see the JUNOS Software with Enhanced Services Migration Guide.
NOTE: Previously, upgrading images on J-series devices with 256 MB compact flashfrom Release 8.5 onward involved removing unwanted files in the images andremoving the Swap Partition. From 9.2 Release onwards, as an alternative, thesoftware accomplishes the upgrade efficiently to take another snapshot of the compactflash, install the image, and restore configurations.
This section contains the following topics:
■ Installing Software Upgrades with the J-Web Interface on page 291
■ Installing Software Upgrades Using the CLI on page 294
Installing Software Upgrades with the J-Web Interface
You can use the J-Web interface to install software upgrades from a remote serverusing FTP or HTTP, or, if necessary, by uploading the software image to the device.This section contains the following topics:
■ Installing Software Upgrades from a Remote Server on page 291
■ Installing Software Upgrades by Uploading Files on page 293
Installing Software Upgrades from a Remote Server
You can use the J-Web interface to install software packages that are retrieved withFTP or HTTP from the specified location.
NOTE: This procedure applies only to upgrading one JUNOS software release toanother or one JUNOS software with enhanced services release to another. To upgradefrom the JUNOS software to JUNOS software with enhanced services, see the JUNOSSoftware with Enhanced Services Migration Guide.
Figure 24 on page 292 shows the Install Remote page for the device.
Installing Software Upgrades ■ 291
Chapter 14: Performing Software Upgrades and Reboots
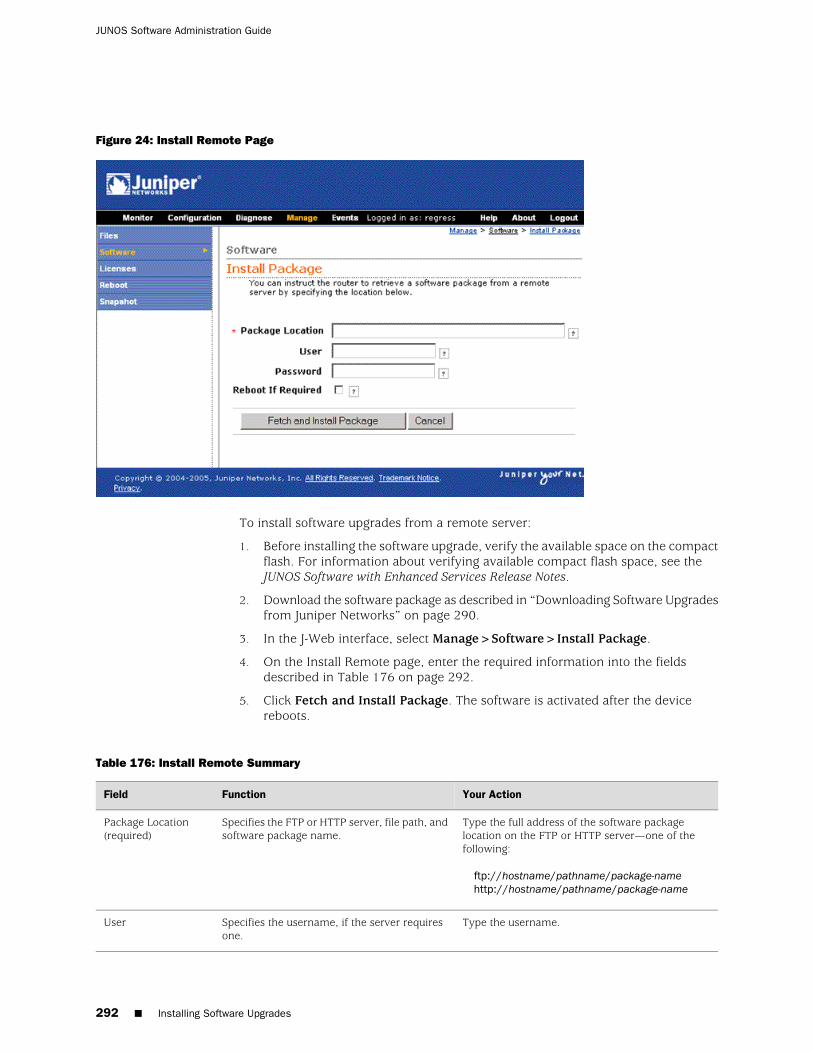
Figure 24: Install Remote Page
To install software upgrades from a remote server:
1. Before installing the software upgrade, verify the available space on the compactflash. For information about verifying available compact flash space, see theJUNOS Software with Enhanced Services Release Notes.
2. Download the software package as described in “Downloading Software Upgradesfrom Juniper Networks” on page 290.
3. In the J-Web interface, select Manage>Software>Install Package.
4. On the Install Remote page, enter the required information into the fieldsdescribed in Table 176 on page 292.
5. Click Fetch and Install Package. The software is activated after the devicereboots.
Table 176: Install Remote Summary
Your ActionFunctionField
Type the full address of the software packagelocation on the FTP or HTTP server—one of thefollowing:
ftp://hostname/pathname/package-namehttp://hostname/pathname/package-name
Specifies the FTP or HTTP server, file path, andsoftware package name.
Package Location(required)
Type the username.Specifies the username, if the server requiresone.
User
292 ■ Installing Software Upgrades
JUNOS Software Administration Guide
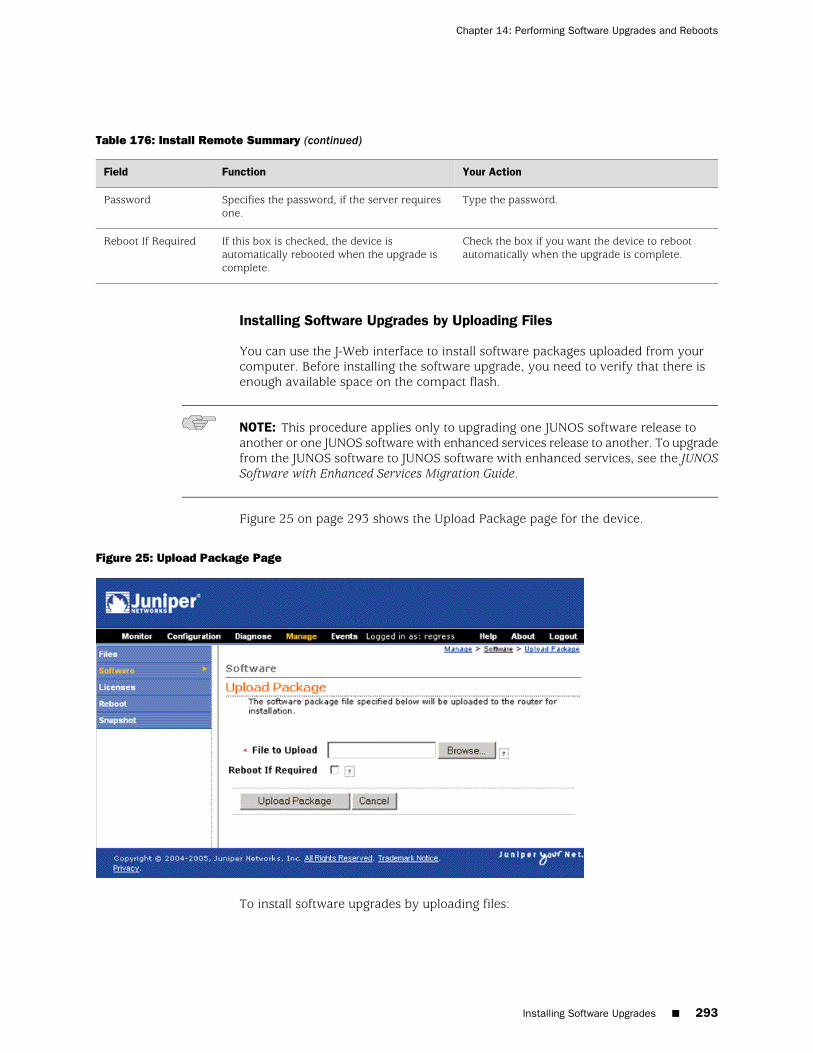
Table 176: Install Remote Summary (continued)
Your ActionFunctionField
Type the password.Specifies the password, if the server requiresone.
Password
Check the box if you want the device to rebootautomatically when the upgrade is complete.
If this box is checked, the device isautomatically rebooted when the upgrade iscomplete.
Reboot If Required
Installing Software Upgrades by Uploading Files
You can use the J-Web interface to install software packages uploaded from yourcomputer. Before installing the software upgrade, you need to verify that there isenough available space on the compact flash.
NOTE: This procedure applies only to upgrading one JUNOS software release toanother or one JUNOS software with enhanced services release to another. To upgradefrom the JUNOS software to JUNOS software with enhanced services, see the JUNOSSoftware with Enhanced Services Migration Guide.
Figure 25 on page 293 shows the Upload Package page for the device.
Figure 25: Upload Package Page
To install software upgrades by uploading files:
Installing Software Upgrades ■ 293
Chapter 14: Performing Software Upgrades and Reboots
1. Before installing the software upgrade, verify the available space on the compactflash. For information about verifying available compact flash space, see theJUNOS Software with Enhanced Services Release Notes.
2. Download the software package as described in “Downloading Software Upgradesfrom Juniper Networks” on page 290.
3. In the J-Web interface, select Manage>Software>Upload Package.
4. On the Upload Package page, enter information into the fields described inTable 177 on page 294.
5. Click Upload Package. The software is activated after the device has rebooted.
Table 177: Upload Package Summary
Your ActionFunctionField
Type the location of the software package, or clickBrowse to navigate to the location.
Specifies the location of the software packageon the local system.
File to Upload(required)
Select the check box if you want the device toreboot automatically when the upgrade is complete.
If this box is checked the device isautomatically rebooted when the upgrade iscomplete.
Reboot If Required
Installing Software Upgrades Using the CLI
NOTE: This procedure applies only to upgrading one JUNOS software release toanother or one JUNOS software with enhanced services release to another. To upgradefrom the JUNOS software to JUNOS software with enhanced services, see the JUNOSSoftware with Enhanced Services Migration Guide.
To install software upgrades on a device with the CLI:
1. Before installing the software upgrade, verify the available space on the compactflash. For information about verifying available compact flash space, see theJUNOS Software with Enhanced Services Release Notes.
2. Download the software package as described in “Downloading Software Upgradesfrom Juniper Networks” on page 290.
3. If you are installing the software package from a local directory on the device,copy the software package to the device. We recommend that you copy it to the/var/tmp directory.
4. To install the new package on the device, enter the following command inoperational mode in the CLI:
user@host> request system software add unlink no-copy source
Replace source with one of the following paths:
294 ■ Installing Software Upgrades
JUNOS Software Administration Guide

■ For a software package that is installed from a local directory on thedevice—/pathname/package-name (for example,/var/tmp/junos-jsr-8.5R1.1.domestic.tgz)
■ For software packages that are downloaded and installed from a remotelocation:
■ ftp://hostname/pathname/package-name
or
■ http://hostname/pathname/package-name
By default, the request system software add command uses the validate optionto validate the software package against the current configuration as a prerequisiteto adding the software package. This validation ensures that the device can rebootsuccessfully after the software package is installed. This is the default behaviorwhen you are adding a software package.
The unlink option removes the package at the earliest opportunity so that thedevice has enough storage capacity to complete the installation.
(Optional) The no-copy option specifies that a software package is installed, buta copy of the package is not saved. Include this option if you do not have enoughspace on the compact flash to perform an upgrade that keeps a copy of thepackage on the device.
5. After the software package is installed, reboot the device:
user@host> request system reboot
When the reboot is complete, the device displays the login prompt.
Downgrading the Software
When you upgrade your software, the device creates a backup image of the softwarethat was previously installed, as well as installs the requested software upgrade.
To downgrade the software, you can use the backup image of the software that waspreviously installed, which is saved on the device. If you revert to the previous image,this backup image is used, and the image of the running software is deleted. Youcan downgrade to only the software release that was installed on the device beforethe current release with this method.
Use the procedures as described in “Installing Software Upgrades with the J-WebInterface” on page 291 and “Installing Software Upgrades Using the CLI” on page 294and specify an older software image as the source image to be upgraded.
Downgrade your software with either the J-Web interface or the CLI.
Downgrading the Software ■ 295
Chapter 14: Performing Software Upgrades and Reboots
NOTE: To downgrade JUNOS software with enhanced services to the JUNOS software,see the JUNOS Software with Enhanced Services Migration Guide.
This section contains the following topics:
■ Downgrading the Software with the J-Web Interface on page 296
■ Downgrading the Software with the CLI on page 296
Downgrading the Software with the J-Web Interface
You can downgrade the software from the J-Web interface. For your changes to takeeffect, you must reboot the device.
NOTE: This procedure applies only to downgrading one JUNOS software release toanother or one JUNOS software with enhanced services release to another. Todowngrade JUNOS software with enhanced services to the JUNOS software, see theJUNOS Software with Enhanced Services Migration Guide.
To downgrade software with the J-Web interface:
1. In the J-Web interface, select Manage>Software>Downgrade. The image ofthe previous version (if any) is displayed on this page.
NOTE: After you perform this operation, you cannot undo it.
2. Select Downgrade to downgrade to the previous version of the software or Cancelto cancel the downgrade process.
3. When the downgrade process is complete, for the new software to take effect,click Manage>Reboot from the J-Web interface to reboot the device.
After you downgrade the software, the previous release is loaded, and you cannotreload the running version of software again. To downgrade to an earlier version ofsoftware, follow the procedure for upgrading, using the software image labeled withthe appropriate release.
Downgrading the Software with the CLI
You can revert to the previous version of software using the request system softwarerollback command in the CLI. For the changes to take effect, you must reboot thedevice. To downgrade to an earlier version of software, follow the procedure forupgrading, using the software image labeled with the appropriate release.
296 ■ Downgrading the Software
JUNOS Software Administration Guide
NOTE: This procedure applies only to downgrading one JUNOS software release toanother or one JUNOS software with enhanced services release to another. Todowngrade JUNOS software with enhanced services to the JUNOS software, see theJUNOS Software with Enhanced Services Migration Guide.
To downgrade software with the CLI:
1. Enter the request system software rollback command to return to the previousJUNOS software version:
user@host> request system software rollback
The previous software version is now ready to become active when you nextreboot the device.
2. Reboot the device:
user@host> request system reboot
The device is now running the previous version of the software. To downgrade toan earlier version of software, follow the procedure for upgrading, using the softwareimage labeled with the appropriate release.
Configuring Boot Devices
You can configure a boot device to replace the primary boot device on your J-seriesor SRX-series device, or to act as a backup boot device. The backup device musthave a storage capacity of at least 256 MB. Use either the J-Web interface or the CLIto take a snapshot of the configuration currently running on the device, or of theoriginal factory configuration and a rescue configuration, and save it to an alternatemedium.
NOTE: For media redundancy, we recommend that you keep a secondary storagemedium attached to the J-series or SRX-series device and updated at all times.
If the primary storage medium becomes corrupted and no backup medium is inplace, you can recover the primary compact flash from a special software image.You can also configure a boot device to store snapshots of software failures, for usein troubleshooting.
For information about installing boot devices, see the JUNOS Software with EnhancedServices Hardware Guide.
This section contains the following topics:
■ Configuring a Boot Device for Backup with the J-Web Interface on page 298
■ Configuring a Boot Device for Backup with the CLI on page 300
■ Configuring a Boot Device to Receive Software Failure MemorySnapshots on page 302
Configuring Boot Devices ■ 297
Chapter 14: Performing Software Upgrades and Reboots
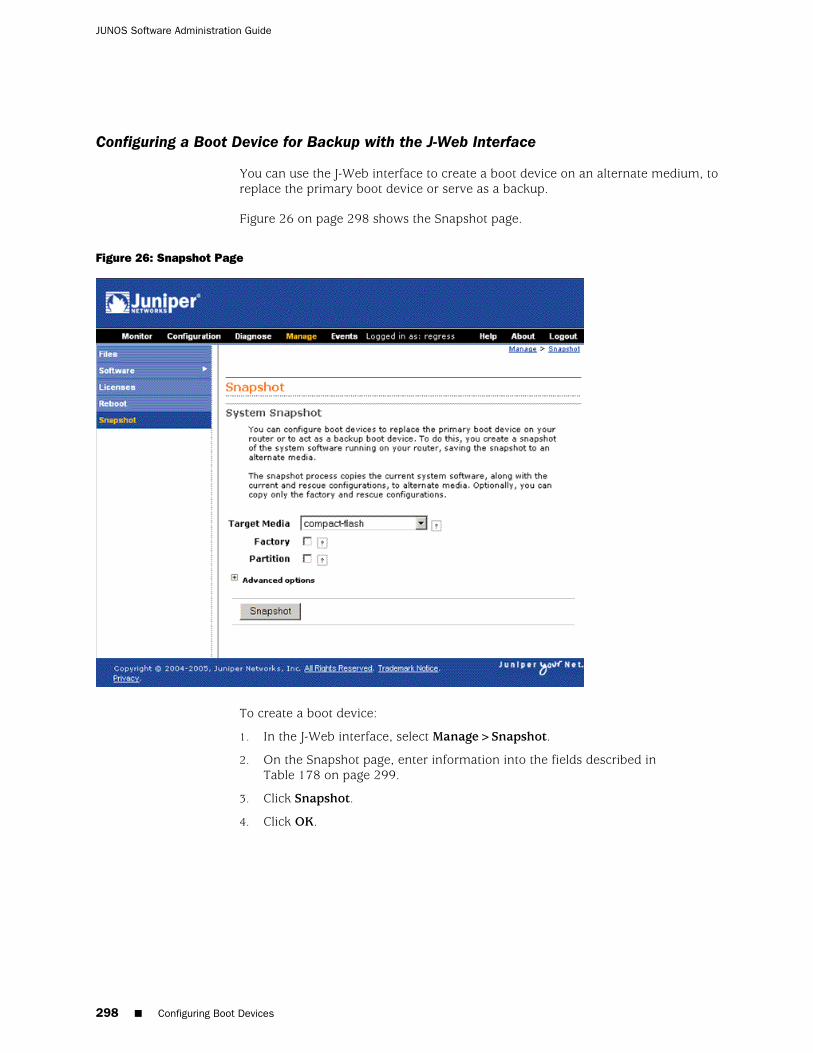
Configuring a Boot Device for Backup with the J-Web Interface
You can use the J-Web interface to create a boot device on an alternate medium, toreplace the primary boot device or serve as a backup.
Figure 26 on page 298 shows the Snapshot page.
Figure 26: Snapshot Page
To create a boot device:
1. In the J-Web interface, select Manage>Snapshot.
2. On the Snapshot page, enter information into the fields described inTable 178 on page 299.
3. Click Snapshot.
4. Click OK.
298 ■ Configuring Boot Devices
JUNOS Software Administration Guide
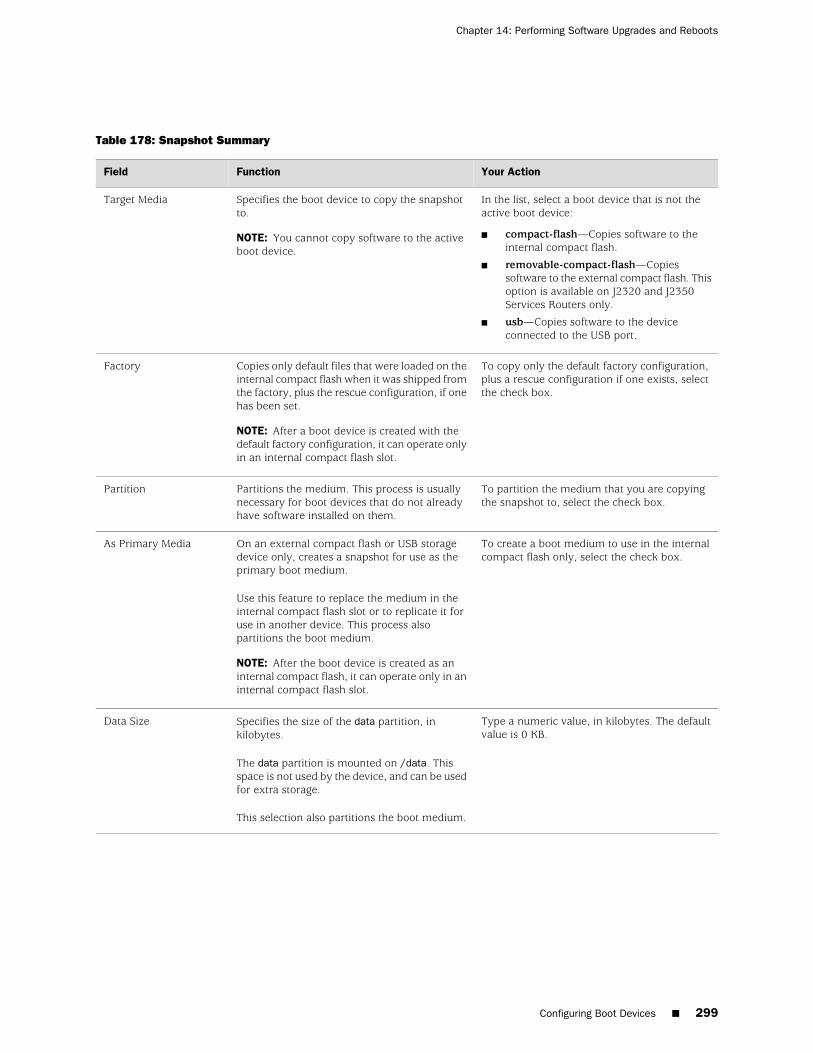
Table 178: Snapshot Summary
Your ActionFunctionField
In the list, select a boot device that is not theactive boot device:
■ compact-flash—Copies software to theinternal compact flash.
■ removable-compact-flash—Copiessoftware to the external compact flash. Thisoption is available on J2320 and J2350Services Routers only.
■ usb—Copies software to the deviceconnected to the USB port.
Specifies the boot device to copy the snapshotto.
NOTE: You cannot copy software to the activeboot device.
Target Media
To copy only the default factory configuration,plus a rescue configuration if one exists, selectthe check box.
Copies only default files that were loaded on theinternal compact flash when it was shipped fromthe factory, plus the rescue configuration, if onehas been set.
NOTE: After a boot device is created with thedefault factory configuration, it can operate onlyin an internal compact flash slot.
Factory
To partition the medium that you are copyingthe snapshot to, select the check box.
Partitions the medium. This process is usuallynecessary for boot devices that do not alreadyhave software installed on them.
Partition
To create a boot medium to use in the internalcompact flash only, select the check box.
On an external compact flash or USB storagedevice only, creates a snapshot for use as theprimary boot medium.
Use this feature to replace the medium in theinternal compact flash slot or to replicate it foruse in another device. This process alsopartitions the boot medium.
NOTE: After the boot device is created as aninternal compact flash, it can operate only in aninternal compact flash slot.
As Primary Media
Type a numeric value, in kilobytes. The defaultvalue is 0 KB.
Specifies the size of the data partition, inkilobytes.
The data partition is mounted on /data. Thisspace is not used by the device, and can be usedfor extra storage.
This selection also partitions the boot medium.
Data Size
Configuring Boot Devices ■ 299
Chapter 14: Performing Software Upgrades and Reboots
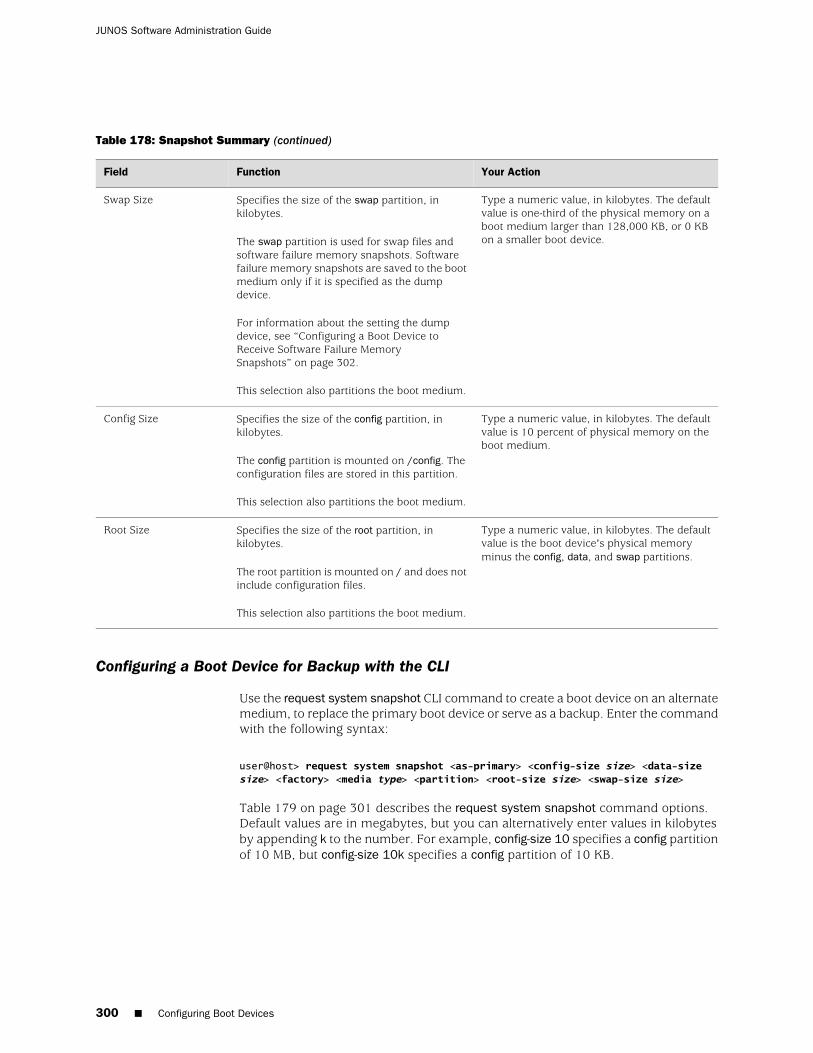
Table 178: Snapshot Summary (continued)
Your ActionFunctionField
Type a numeric value, in kilobytes. The defaultvalue is one-third of the physical memory on aboot medium larger than 128,000 KB, or 0 KBon a smaller boot device.
Specifies the size of the swap partition, inkilobytes.
The swap partition is used for swap files andsoftware failure memory snapshots. Softwarefailure memory snapshots are saved to the bootmedium only if it is specified as the dumpdevice.
For information about the setting the dumpdevice, see “Configuring a Boot Device toReceive Software Failure MemorySnapshots” on page 302.
This selection also partitions the boot medium.
Swap Size
Type a numeric value, in kilobytes. The defaultvalue is 10 percent of physical memory on theboot medium.
Specifies the size of the config partition, inkilobytes.
The config partition is mounted on /config. Theconfiguration files are stored in this partition.
This selection also partitions the boot medium.
Config Size
Type a numeric value, in kilobytes. The defaultvalue is the boot device's physical memoryminus the config, data, and swap partitions.
Specifies the size of the root partition, inkilobytes.
The root partition is mounted on / and does notinclude configuration files.
This selection also partitions the boot medium.
Root Size
Configuring a Boot Device for Backup with the CLI
Use the request system snapshot CLI command to create a boot device on an alternatemedium, to replace the primary boot device or serve as a backup. Enter the commandwith the following syntax:
user@host> request system snapshot <as-primary> <config-size size> <data-sizesize> <factory> <media type> <partition> <root-size size> <swap-size size>
Table 179 on page 301 describes the request system snapshot command options.Default values are in megabytes, but you can alternatively enter values in kilobytesby appending k to the number. For example, config-size 10 specifies a config partitionof 10 MB, but config-size 10k specifies a config partition of 10 KB.
300 ■ Configuring Boot Devices
JUNOS Software Administration Guide
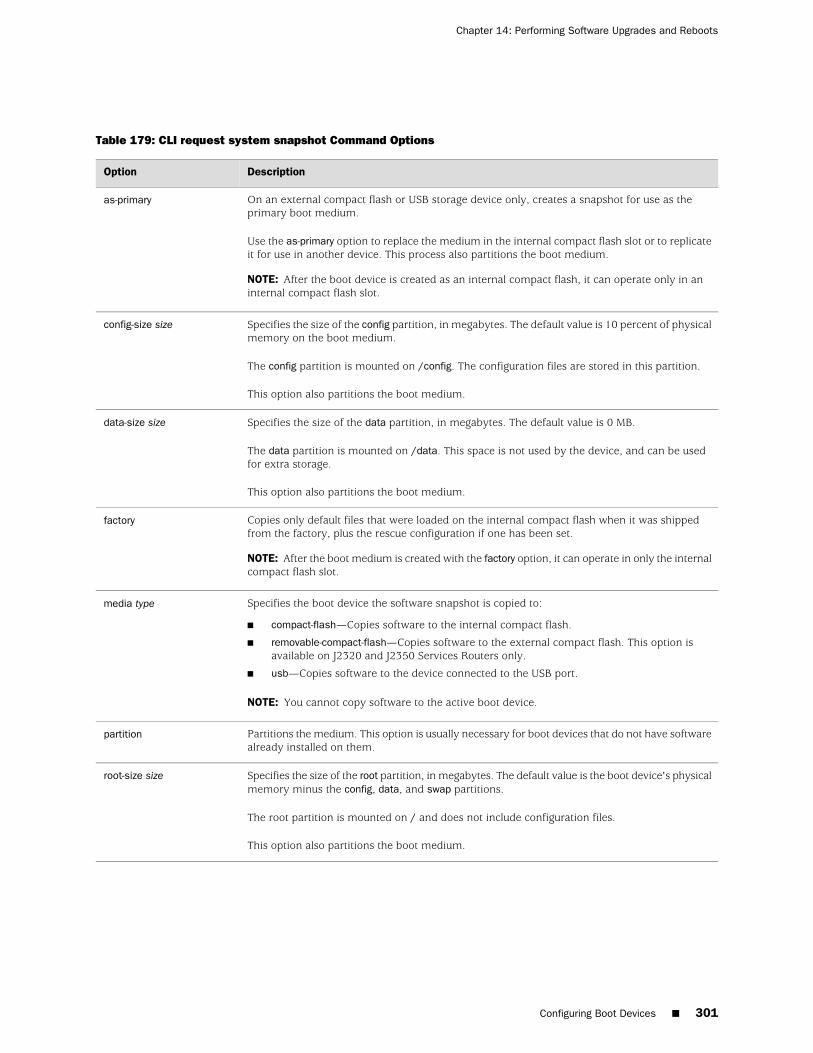
Table 179: CLI request system snapshot Command Options
DescriptionOption
On an external compact flash or USB storage device only, creates a snapshot for use as theprimary boot medium.
Use the as-primary option to replace the medium in the internal compact flash slot or to replicateit for use in another device. This process also partitions the boot medium.
NOTE: After the boot device is created as an internal compact flash, it can operate only in aninternal compact flash slot.
as-primary
Specifies the size of the config partition, in megabytes. The default value is 10 percent of physicalmemory on the boot medium.
The config partition is mounted on /config. The configuration files are stored in this partition.
This option also partitions the boot medium.
config-size size
Specifies the size of the data partition, in megabytes. The default value is 0 MB.
The data partition is mounted on /data. This space is not used by the device, and can be usedfor extra storage.
This option also partitions the boot medium.
data-size size
Copies only default files that were loaded on the internal compact flash when it was shippedfrom the factory, plus the rescue configuration if one has been set.
NOTE: After the boot medium is created with the factory option, it can operate in only the internalcompact flash slot.
factory
Specifies the boot device the software snapshot is copied to:
■ compact-flash—Copies software to the internal compact flash.
■ removable-compact-flash—Copies software to the external compact flash. This option isavailable on J2320 and J2350 Services Routers only.
■ usb—Copies software to the device connected to the USB port.
NOTE: You cannot copy software to the active boot device.
media type
Partitions the medium. This option is usually necessary for boot devices that do not have softwarealready installed on them.
partition
Specifies the size of the root partition, in megabytes. The default value is the boot device's physicalmemory minus the config, data, and swap partitions.
The root partition is mounted on / and does not include configuration files.
This option also partitions the boot medium.
root-size size
Configuring Boot Devices ■ 301
Chapter 14: Performing Software Upgrades and Reboots
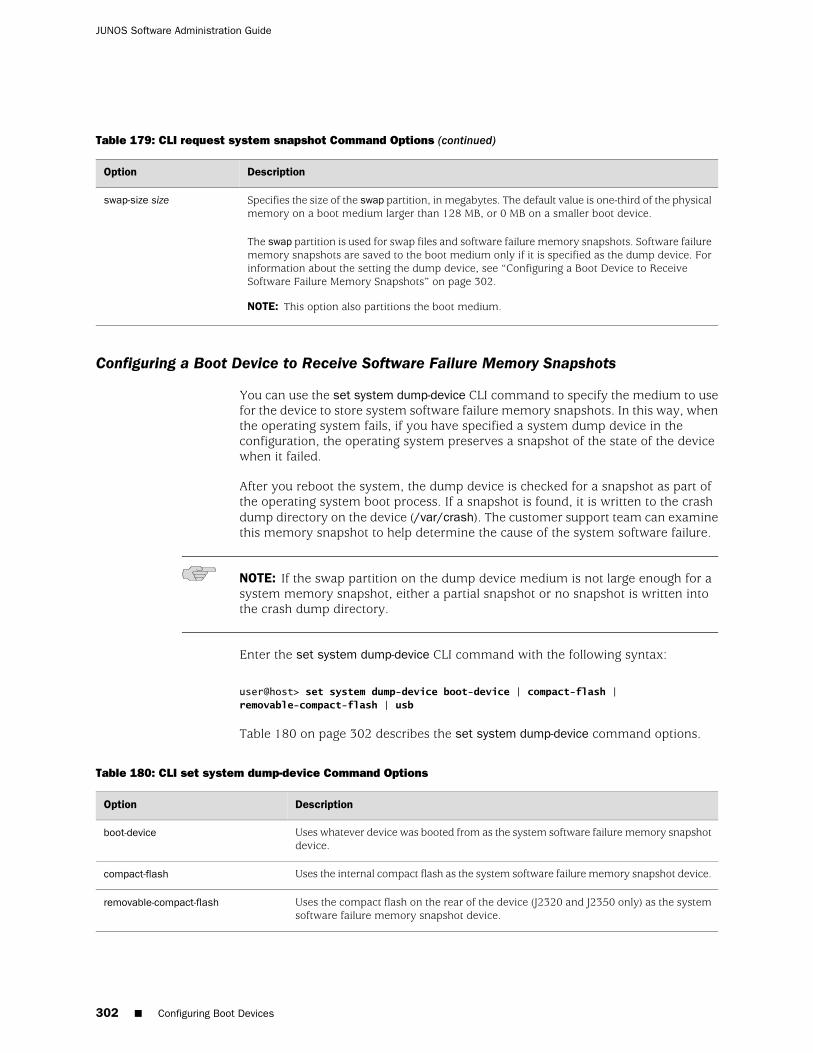
Table 179: CLI request system snapshot Command Options (continued)
DescriptionOption
Specifies the size of the swap partition, in megabytes. The default value is one-third of the physicalmemory on a boot medium larger than 128 MB, or 0 MB on a smaller boot device.
The swap partition is used for swap files and software failure memory snapshots. Software failurememory snapshots are saved to the boot medium only if it is specified as the dump device. Forinformation about the setting the dump device, see “Configuring a Boot Device to ReceiveSoftware Failure Memory Snapshots” on page 302.
NOTE: This option also partitions the boot medium.
swap-size size
Configuring a Boot Device to Receive Software Failure Memory Snapshots
You can use the set system dump-device CLI command to specify the medium to usefor the device to store system software failure memory snapshots. In this way, whenthe operating system fails, if you have specified a system dump device in theconfiguration, the operating system preserves a snapshot of the state of the devicewhen it failed.
After you reboot the system, the dump device is checked for a snapshot as part ofthe operating system boot process. If a snapshot is found, it is written to the crashdump directory on the device (/var/crash). The customer support team can examinethis memory snapshot to help determine the cause of the system software failure.
NOTE: If the swap partition on the dump device medium is not large enough for asystem memory snapshot, either a partial snapshot or no snapshot is written intothe crash dump directory.
Enter the set system dump-device CLI command with the following syntax:
user@host> set system dump-device boot-device | compact-flash |removable-compact-flash | usb
Table 180 on page 302 describes the set system dump-device command options.
Table 180: CLI set system dump-device Command Options
DescriptionOption
Uses whatever device was booted from as the system software failure memory snapshotdevice.
boot-device
Uses the internal compact flash as the system software failure memory snapshot device.compact-flash
Uses the compact flash on the rear of the device (J2320 and J2350 only) as the systemsoftware failure memory snapshot device.
removable-compact-flash
302 ■ Configuring Boot Devices
JUNOS Software Administration Guide
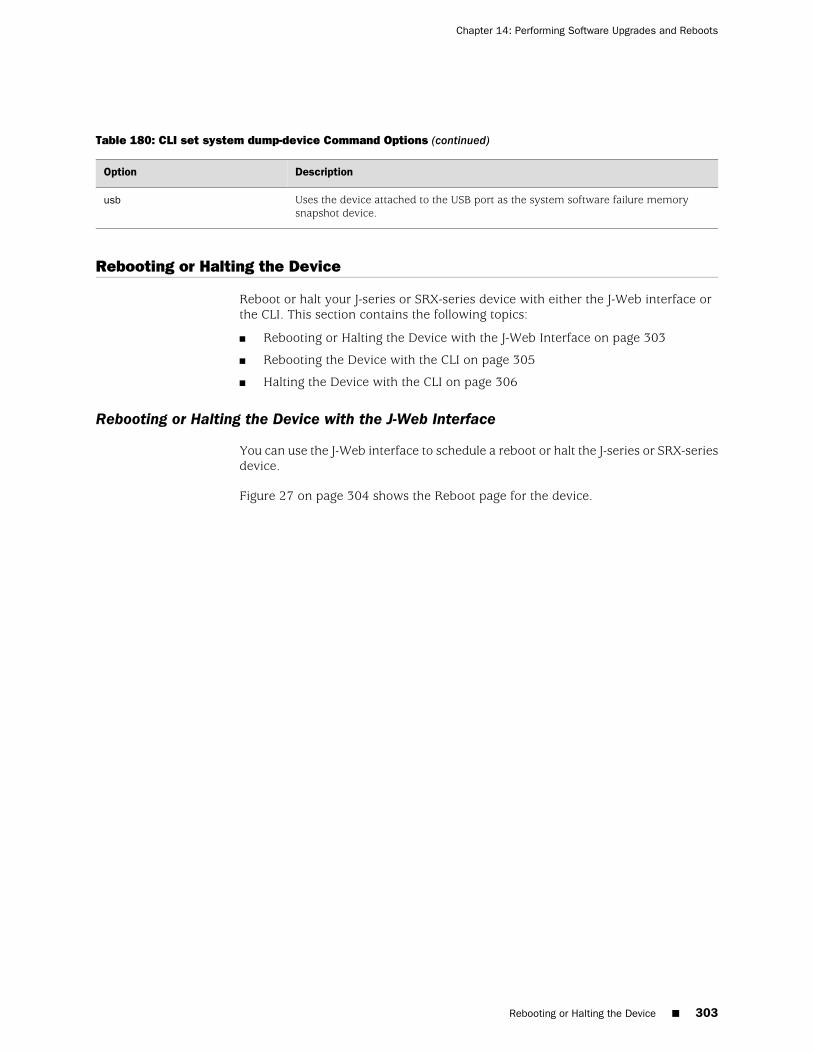
Table 180: CLI set system dump-device Command Options (continued)
DescriptionOption
Uses the device attached to the USB port as the system software failure memorysnapshot device.
usb
Rebooting or Halting the Device
Reboot or halt your J-series or SRX-series device with either the J-Web interface orthe CLI. This section contains the following topics:
■ Rebooting or Halting the Device with the J-Web Interface on page 303
■ Rebooting the Device with the CLI on page 305
■ Halting the Device with the CLI on page 306
Rebooting or Halting the Device with the J-Web Interface
You can use the J-Web interface to schedule a reboot or halt the J-series or SRX-seriesdevice.
Figure 27 on page 304 shows the Reboot page for the device.
Rebooting or Halting the Device ■ 303
Chapter 14: Performing Software Upgrades and Reboots
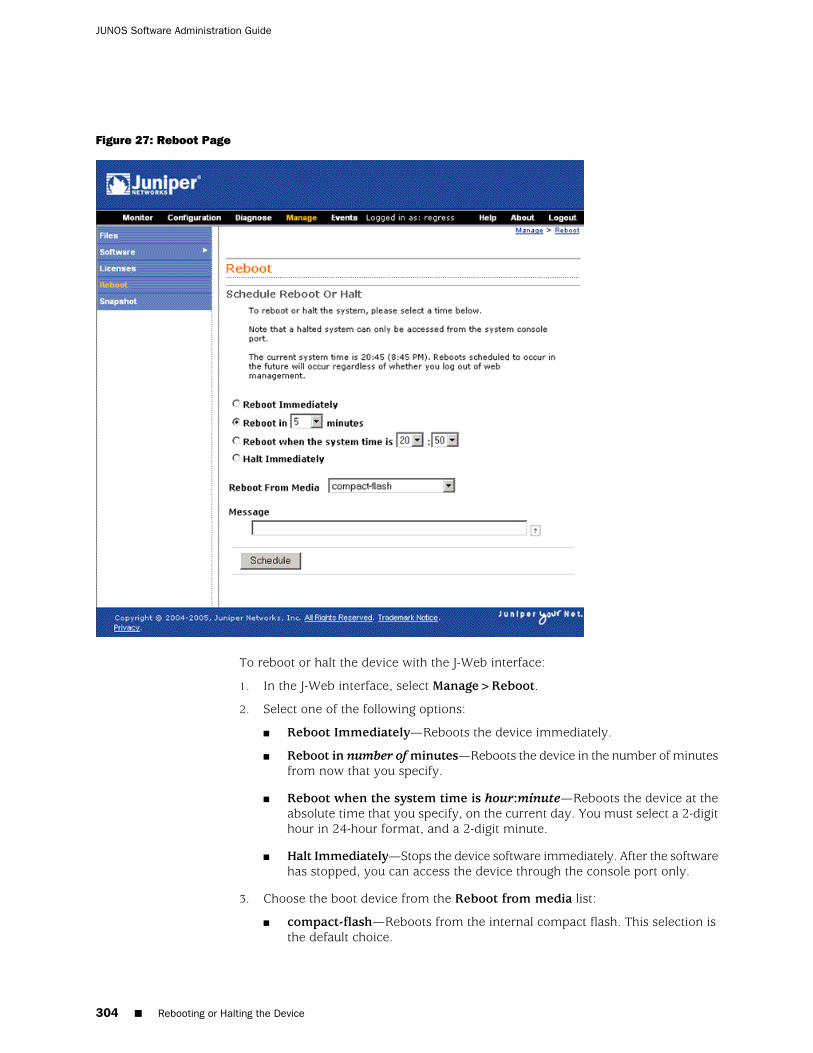
Figure 27: Reboot Page
To reboot or halt the device with the J-Web interface:
1. In the J-Web interface, select Manage>Reboot.
2. Select one of the following options:
■ Reboot Immediately—Reboots the device immediately.
■ Reboot in number of minutes—Reboots the device in the number of minutesfrom now that you specify.
■ Reboot when the system time is hour:minute—Reboots the device at theabsolute time that you specify, on the current day. You must select a 2-digithour in 24-hour format, and a 2-digit minute.
■ Halt Immediately—Stops the device software immediately. After the softwarehas stopped, you can access the device through the console port only.
3. Choose the boot device from the Reboot from media list:
■ compact-flash—Reboots from the internal compact flash. This selection isthe default choice.
304 ■ Rebooting or Halting the Device
JUNOS Software Administration Guide
■ removable-compact-flash—Reboots from the optional external compactflash. This selection is available on J2320 and J2350 Services Routers only.
■ usb—Reboots from the USB storage device.
4. (Optional) In the Message box, type a message to be displayed to any users onthe device before the reboot occurs.
5. Click Schedule. The J-Web interface requests confirmation to perform the rebootor halt.
6. Click OK to confirm the operation.
■ If the reboot is scheduled to occur immediately, the device reboots. Youcannot access the J-Web interface until the device has restarted and the bootsequence is complete. After the reboot is complete, refresh the browserwindow to display the J-Web interface login page.
■ If the reboot is scheduled to occur in the future, the Reboot page displaysthe time until reboot. You have the option to cancel the request by clickingCancel Reboot on the J-Web interface Reboot page.
■ If the device is halted, all software processes stop and you can access thedevice through the console port only. Reboot the device by pressing any keyon the keyboard.
NOTE: If you cannot connect to the device through the console port, shut down thedevice by pressing and holding the power button on the front panel until the POWERLED turns off. After the device has shut down, you can power on the device bypressing the power button again. The POWER LED lights during startup and remainssteadily green when the device is operating normally.
Rebooting the Device with the CLI
You can use the request system reboot CLI command to schedule a reboot the J-seriesor SRX-series device:
user@host> request system reboot <at time> <in minutes> <media type> <message“text”>
Table 181 on page 305 describes the request system reboot command options.
Table 181: CLI Request System Reboot Command Options
DescriptionOption
Same as at now (reboots the device immediately).none
Rebooting or Halting the Device ■ 305
Chapter 14: Performing Software Upgrades and Reboots
Table 181: CLI Request System Reboot Command Options (continued)
DescriptionOption
Specifies the time at which to reboot the device. You can specify time in one of thefollowing ways:
■ now—Reboots the device immediately. This is the default.
■ +minutes—Reboots the device in the number of minutes from now that you specify.
■ yymmddhhmm—Reboots the device at the absolute time on the date you specify.Enter the year, month, day, hour (in 24-hour format), and minute.
■ hh:mm—Reboots the device at the absolute time you specify, on the current day.Enter the time in 24-hour format, using a colon (:) to separate hours from minutes.
at time
Specifies the number of minutes from now to reboot the device. This option is asynonym for the at +minutes option.
in minutes
Specifies the boot device to boot the router from:
■ compact-flash—Reboots from the internal compact flash. This is the default.
■ removable-compact-flash—Reboots from the optional external compact flash. Thisoption is available on J2320 and J2350 Services Routers only.
■ usb—Reboots from the USB storage device.
media type
Provides a message to display to all system users before the device reboots.message "text"
Halting the Device with the CLI
You can use the request system halt CLI command to halt the J-series or SRX-seriesdevice:
user@host> request system halt <at time> <in minutes> <media type> <message “text”>
When the device is halted, all software processes stop and you can access the devicethrough the console port only. Reboot the device by pressing any key on the keyboard.
NOTE: If you cannot connect to the device through the console port, shut down thedevice by pressing and holding the power button on the front panel until the POWERLED turns off. After the device has shut down, you can power on the device bypressing the power button again. The POWER LED lights during startup and remainssteadily green when the device is operating normally.
Table 182 on page 306 describes the request system halt command options.
Table 182: CLI Request System Halt Command Options
DescriptionOption
Same as at now (stops software processes on the device immediately).none
306 ■ Rebooting or Halting the Device
JUNOS Software Administration Guide
Table 182: CLI Request System Halt Command Options (continued)
DescriptionOption
Time at which to stop the software processes on the device. You can specify time inone of the following ways:
■ now—Stops the software processes immediately. This is the default.
■ +minutes—Stops the software processes in the number of minutes from now thatyou specify.
■ yymmddhhmm—Stops the software processes at the absolute time you specify.Enter the year, month, day, hour (in 24-hour format), and minute.
■ hh:mm—Stops the software processes at the absolute time that you specify, onthe current day. Enter the time in 24-hour format, using a colon (:) to separatehours from minutes.
at time
Specifies the number of minutes from now to stop the software processes on the device.This option is a synonym for the at +minutes option.
in minutes
Specifies the boot device to boot the router from after the halt:
■ compact-flash—Reboots from the internal compact flash. This is the default.
■ removable-compact-flash—Reboots from the optional external compact flash. Thisoption is available on J2320 and J2350 Services Routers only.
■ usb—Reboots from the USB storage device.
media type
Provides a message to display to all system users before the software processes on thedevice are stopped.
message "text"
Bringing Chassis Components Online and Offline
You can use the CLI request commands to bring all chassis components (exceptPower Entry Modules and fans) online and offline.
To bring chassis components online and offline, enter the following from the requestchassis CLI command.
user@host> request chassis <fru> slot <slot#> pic <pic#> offlineuser@host> request chassis <fru> slot <slot#> pic <pic#> online
<fru> in the request chassis command can be any of the following:
■ cb — This changes the control board status.
■ cluster — This changes the flexible PIC concentrator status.
■ fabric — This changes the fabric status.
■ fpc — This changes the flexible PIC concentrator status.
■ fpm — This changes the craft interface status.
■ pic — This changes the physical interface card status.
■ routing-engine — This changes the routing engine status.
Bringing Chassis Components Online and Offline ■ 307
Chapter 14: Performing Software Upgrades and Reboots

For example, to bring specific pic and corresponding fpc slot online, the CLI requestmight appear as follows:
user@host> request chassis pic pic-slot 1 fpc-slot 1 online
Chassis Control Restart Options
Using the CLI restart chassis-control commands, you have the following chassis restartoptions.
■ Restart the process gracefully.
user@host> restart chassis-control gracefully
■ Restart the process immediately (SIGKILL).
user@host> restart chassis-control immediately
■ Restart the process softly (SIGHUP).
user@host> restart chassis-control soft
■ Restart the process.
user@host> restart chassis-control |
308 ■ Chassis Control Restart Options
JUNOS Software Administration Guide
Chapter 15
Understanding and Changing Secure andRouter Contexts
A J-series Services Router running JUNOS software with enhanced services includestwo configurations that allow the router to operate as either a stateful firewall or arouter. When a Services Router is initially configured as a firewall, it operates insecure context. When a Services Router is initially configured as a router, it operatesin router context. Use either of the configurations as a starting point from which youcan customize the configuration for your network requirements.
This chapter contains the following topics.
■ Secure and Router Context Support On Different Device Types on page 309
■ Understanding Secure and Router Contexts on page 310
■ Secure Context Configuration Settings on page 311
■ Router Context Configuration Settings on page 314
■ Changing from Secure Context to Router Context on page 315
■ Changing from Router Context to Secure Context on page 319
Secure and Router Context Support On Different Device Types
The following table lists secure and router context features, specifies whether thefeatures are supported on various device types, and indicates where you can findmore information about each feature.
Table 183: Support Information: Secure and Router Context Options
More Information
SRX-seriesServicesGateways
J-seriesServicesRoutersFeature
“Secure Context” on page 310YesYesSecure context
“Router Context” on page 310NoYesRouter context
Secure and Router Context Support On Different Device Types ■ 309
Understanding Secure and Router Contexts
As shipped from the factory, a Services Router running JUNOS software with enhancedservices initially starts up and uses a configuration that places the router in securecontext. You can change the context in which the Services Router is running fromsecure context to router context. To do so, use a predefined template configurationfile. If you plan to use the Services Router primarily as a router, change to routercontext, using this configuration as your starting point.
CAUTION: If you plan to change contexts, do so before you configure anything elseon the Services Router. If you change contexts after you have configured the ServicesRouter, your configuration is overwritten by the default configuration for the newcontext.
Secure Context
Secure context allows a Services Router to act as a stateful firewall with onlymanagement access. To allow traffic to pass through a Services Router, you mustexplicitly configure a security policy for that purpose. In secure context, a ServicesRouter forwards packets only if a security policy permits it. Certain services are alsoconfigured (in the host-inbound-traffic statement at the [edit security zones] hierarchylevel) to allow host-inbound traffic for management of a Services Router. A ServicesRouter running in secure context is a secure routing device with predefinedconfiguration values.
For secure context configuration details, see “Secure Context ConfigurationSettings” on page 311. For information about how to change from router context tosecure context, see “Changing from Router Context to Secure Context” on page 319.
Router Context
Router context allows a Services Router to act as a router, in which all managementand transit traffic is allowed. All interfaces are bound to the trust zone, and hostinbound traffic from all predefined services is allowed. In router context, the ServicesRouter forwards all packets unless you configure a security policy that denies specifictraffic.
JUNOS software with enhanced services is a hardened operating system. You canuse JUNOS software with enhanced services with more relaxed checks forhost-inbound traffic and configure the dataplane with default transit policies to permitall traffic. In this scenario, the Services Router operates in a router context.
You load a predefined template configuration, jsr-series-routermode-factory.conf, tochange to router context. In router context, the Services Router remains flow-enabled.All security features are available, but they are explicitly denied.
For router context configuration details, see “Router Context ConfigurationSettings” on page 314. For information about how to change from secure context torouter context, see “Changing from Secure Context to Router Context” on page 315.
310 ■ Understanding Secure and Router Contexts
JUNOS Software Administration Guide

Secure Context Configuration Settings
The following factory configuration settings are defined for secure context:
■ The built-in Gigabit Ethernet interface ge-0/0/0 is bound to a preconfigured zonecalled “trust.” All other interfaces are bound to a preconfigured zone named“untrust.”
The ge-0/0/0 interface is configured to allow management access with SSH andHTTP services enabled. The following host-inbound services are configured forthe ge-0/0/0 interface in the trust zone:
■ HTTP
■ HTTPS
■ SSH
■ DHCP
■ For the trust zone, TCP reset is enabled. The default policy for the trust zoneallows transmission of traffic from the trust zone to the untrust zone. All trafficwithin the trust zone is allowed.
■ A screen is applied to a zone to protect against attacks launched from within thezone. The following screens are enabled for the untrust zone:
■ ICMP ping-of-death
■ IP source route options
■ IP teardrop
■ TCP land attack
■ TCP SYN flood with the following settings:
■ Alarm threshold of 1024 half-complete proxy connections per second
■ Attack threshold of 200 SYN packets per second
■ Source threshold of 1024 SYN segments the router can receive persecond
■ Destination threshold of 2048 SYN segments received per second
■ Queue size of 2000 proxy connection requests
■ Timeout of 20 seconds
■ The default policy for the untrust zone is to deny all traffic.
Secure context configuration values are defined as follows:
system {autoinstallation {
delete-upon-commit;traceoptions {
level verbose;
Secure Context Configuration Settings ■ 311
Chapter 15: Understanding and Changing Secure and Router Contexts
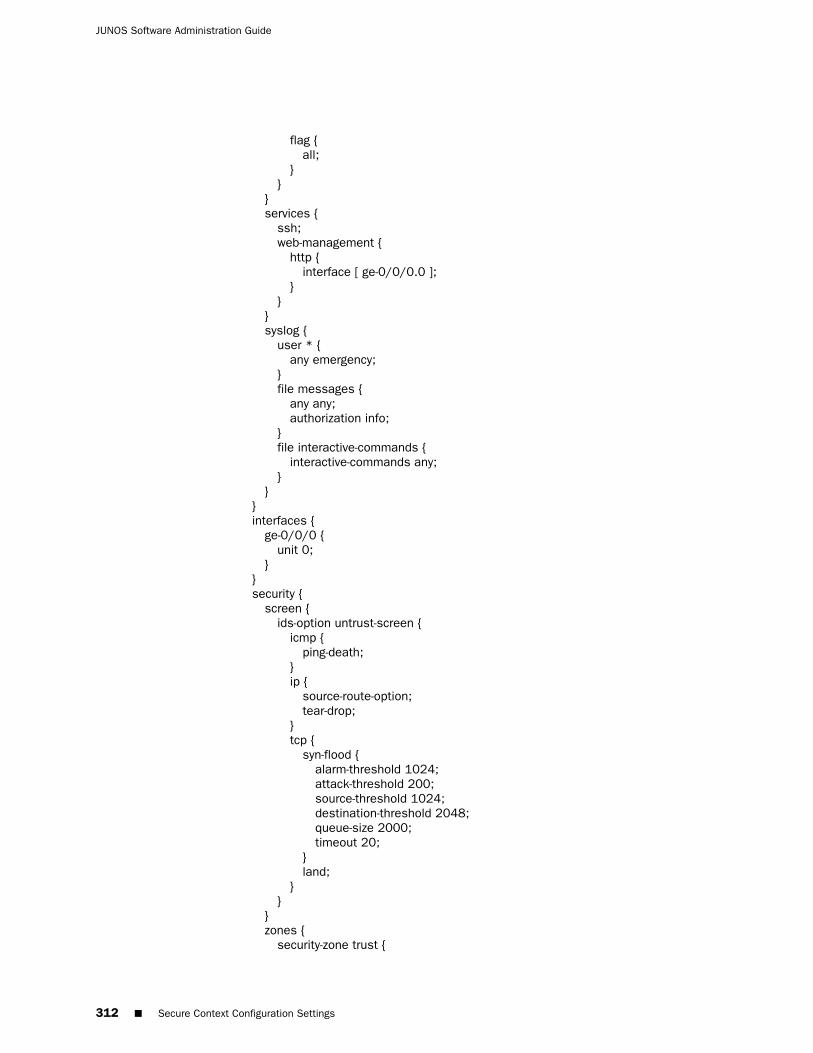
flag {all;
}}
}services {
ssh;web-management {
http {interface [ ge-0/0/0.0 ];
}}
}syslog {
user * {any emergency;
}file messages {
any any;authorization info;
}file interactive-commands {
interactive-commands any;}
}}interfaces {
ge-0/0/0 {unit 0;
}}security {
screen {ids-option untrust-screen {
icmp {ping-death;
}ip {
source-route-option;tear-drop;
}tcp {
syn-flood {alarm-threshold 1024;attack-threshold 200;source-threshold 1024;destination-threshold 2048;queue-size 2000;timeout 20;
}land;
}}
}zones {
security-zone trust {
312 ■ Secure Context Configuration Settings
JUNOS Software Administration Guide

tcp-rst;interfaces {
ge-0/0/0.0 {host-inbound-traffic {
system-services {http;https;ssh;dhcp;
}}
}}
}security-zone untrust {
screen untrust-screen;}
}policies {
from-zone trust to-zone trust {policy default-permit {
match {source-address any;destination-address any;application any;
}then {
permit;}
}}from-zone trust to-zone untrust {
policy default-permit {match {
source-address any;destination-address any;application any;
}then {
permit;}
}}from-zone untrust to-zone trust {
policy default-deny {match {
source-address any;destination-address any;application any;
}then {
deny;}
}}
}
Secure Context Configuration Settings ■ 313
Chapter 15: Understanding and Changing Secure and Router Contexts
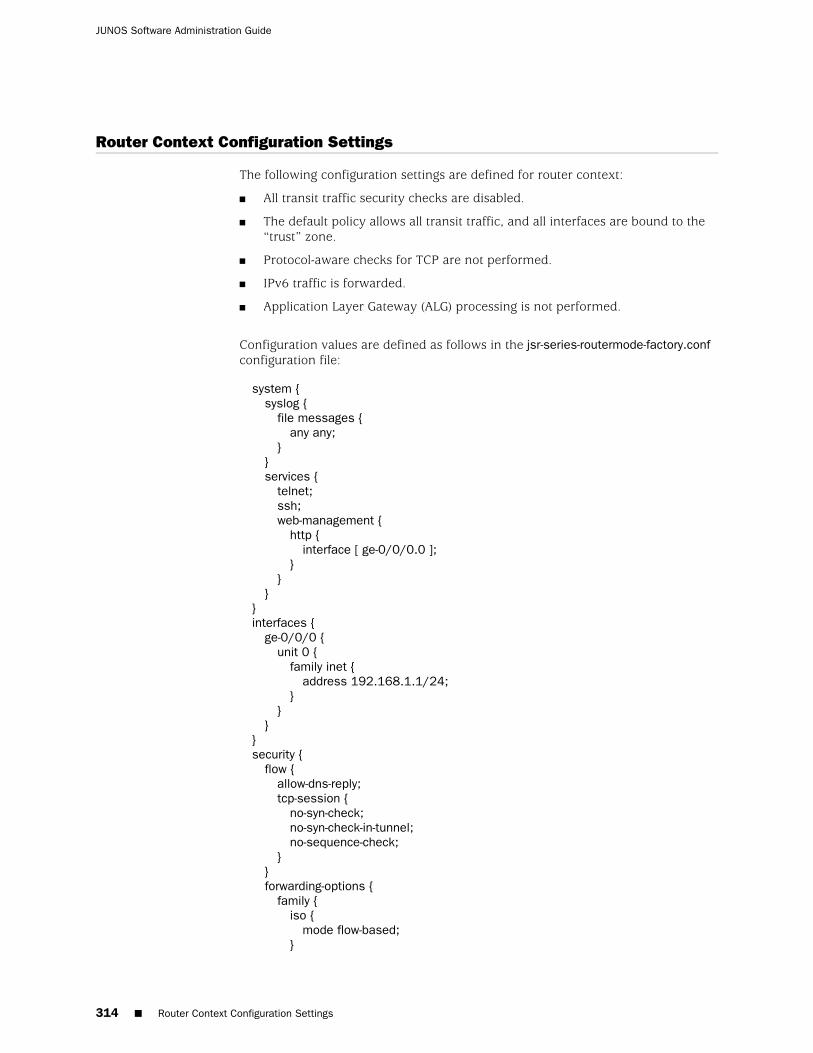
Router Context Configuration Settings
The following configuration settings are defined for router context:
■ All transit traffic security checks are disabled.
■ The default policy allows all transit traffic, and all interfaces are bound to the“trust” zone.
■ Protocol-aware checks for TCP are not performed.
■ IPv6 traffic is forwarded.
■ Application Layer Gateway (ALG) processing is not performed.
Configuration values are defined as follows in the jsr-series-routermode-factory.confconfiguration file:
system {syslog {
file messages {any any;
}}services {
telnet;ssh;web-management {
http {interface [ ge-0/0/0.0 ];
}}
}}interfaces {
ge-0/0/0 {unit 0 {
family inet {address 192.168.1.1/24;
}}
}}security {
flow {allow-dns-reply;tcp-session {
no-syn-check;no-syn-check-in-tunnel;no-sequence-check;
}}forwarding-options {
family {iso {
mode flow-based;}
314 ■ Router Context Configuration Settings
JUNOS Software Administration Guide
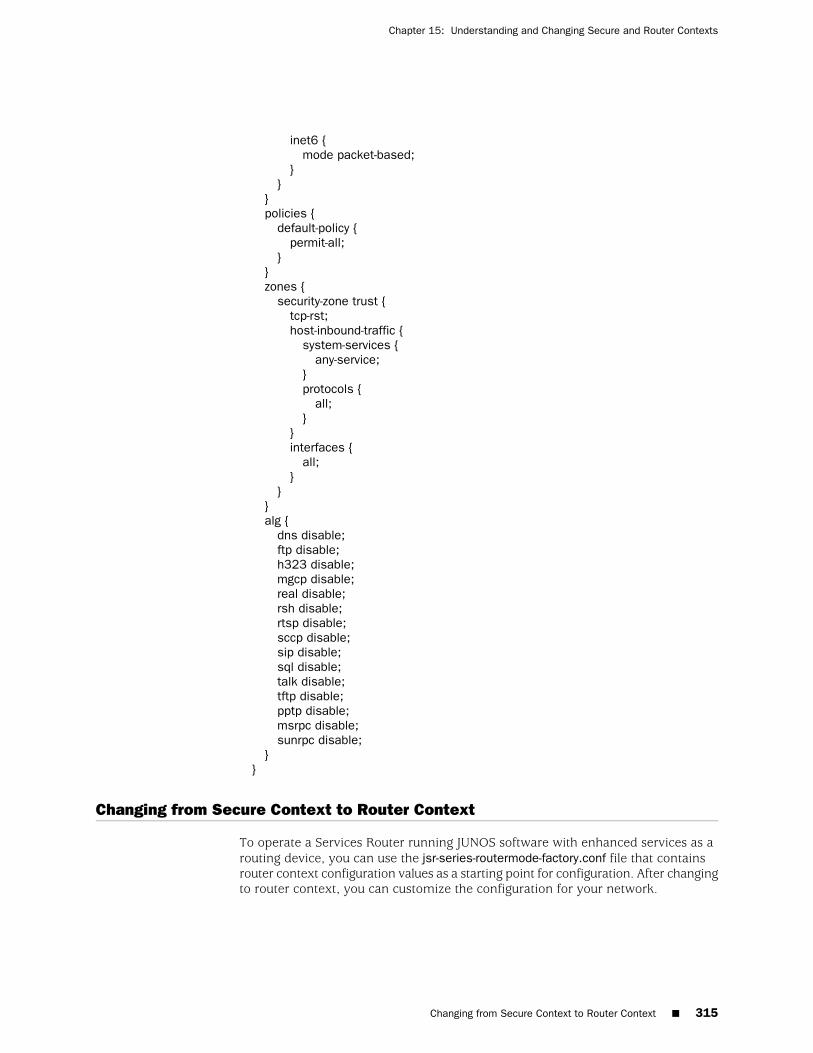
inet6 {mode packet-based;
}}
}policies {
default-policy {permit-all;
}}zones {
security-zone trust {tcp-rst;host-inbound-traffic {
system-services {any-service;
}protocols {
all;}
}interfaces {
all;}
}}alg {
dns disable;ftp disable;h323 disable;mgcp disable;real disable;rsh disable;rtsp disable;sccp disable;sip disable;sql disable;talk disable;tftp disable;pptp disable;msrpc disable;sunrpc disable;
}}
Changing from Secure Context to Router Context
To operate a Services Router running JUNOS software with enhanced services as arouting device, you can use the jsr-series-routermode-factory.conf file that containsrouter context configuration values as a starting point for configuration. After changingto router context, you can customize the configuration for your network.
Changing from Secure Context to Router Context ■ 315
Chapter 15: Understanding and Changing Secure and Router Contexts
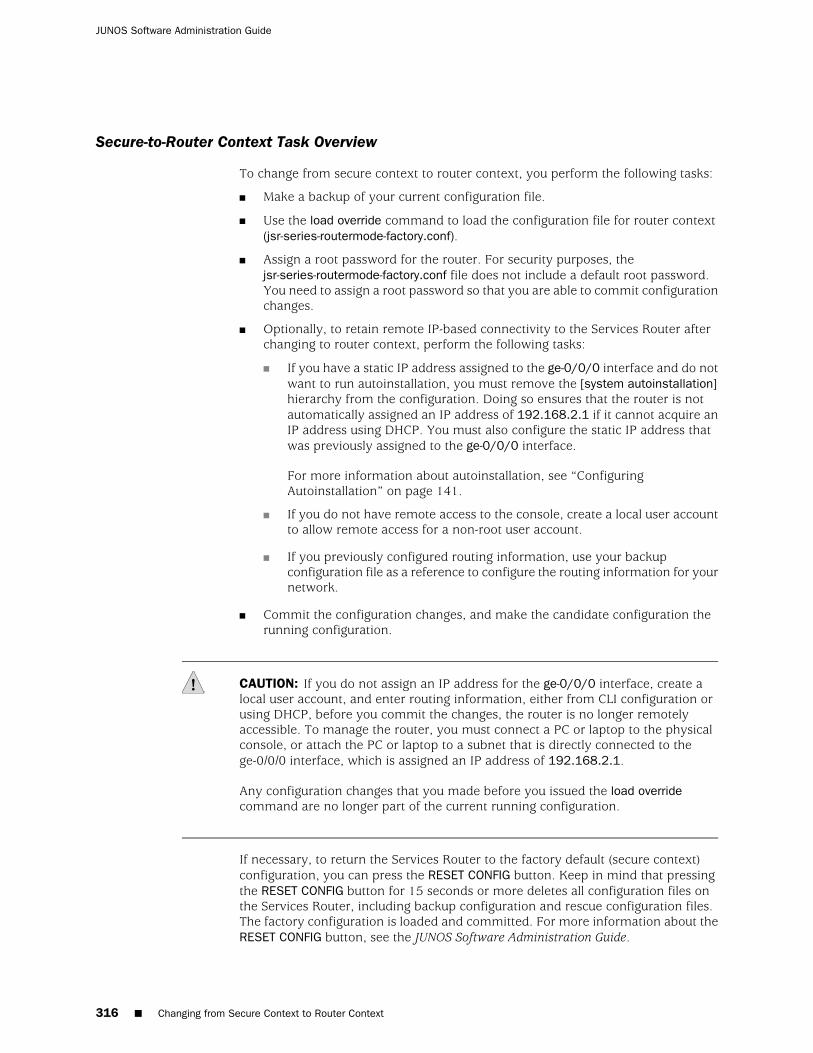
Secure-to-Router Context Task Overview
To change from secure context to router context, you perform the following tasks:
■ Make a backup of your current configuration file.
■ Use the load override command to load the configuration file for router context(jsr-series-routermode-factory.conf).
■ Assign a root password for the router. For security purposes, thejsr-series-routermode-factory.conf file does not include a default root password.You need to assign a root password so that you are able to commit configurationchanges.
■ Optionally, to retain remote IP-based connectivity to the Services Router afterchanging to router context, perform the following tasks:
■ If you have a static IP address assigned to the ge-0/0/0 interface and do notwant to run autoinstallation, you must remove the [system autoinstallation]hierarchy from the configuration. Doing so ensures that the router is notautomatically assigned an IP address of 192.168.2.1 if it cannot acquire anIP address using DHCP. You must also configure the static IP address thatwas previously assigned to the ge-0/0/0 interface.
For more information about autoinstallation, see “ConfiguringAutoinstallation” on page 141.
■ If you do not have remote access to the console, create a local user accountto allow remote access for a non-root user account.
■ If you previously configured routing information, use your backupconfiguration file as a reference to configure the routing information for yournetwork.
■ Commit the configuration changes, and make the candidate configuration therunning configuration.
CAUTION: If you do not assign an IP address for the ge-0/0/0 interface, create alocal user account, and enter routing information, either from CLI configuration orusing DHCP, before you commit the changes, the router is no longer remotelyaccessible. To manage the router, you must connect a PC or laptop to the physicalconsole, or attach the PC or laptop to a subnet that is directly connected to thege-0/0/0 interface, which is assigned an IP address of 192.168.2.1.
Any configuration changes that you made before you issued the load overridecommand are no longer part of the current running configuration.
If necessary, to return the Services Router to the factory default (secure context)configuration, you can press the RESET CONFIG button. Keep in mind that pressingthe RESET CONFIG button for 15 seconds or more deletes all configuration files onthe Services Router, including backup configuration and rescue configuration files.The factory configuration is loaded and committed. For more information about theRESET CONFIG button, see the JUNOS Software Administration Guide.
316 ■ Changing from Secure Context to Router Context
JUNOS Software Administration Guide
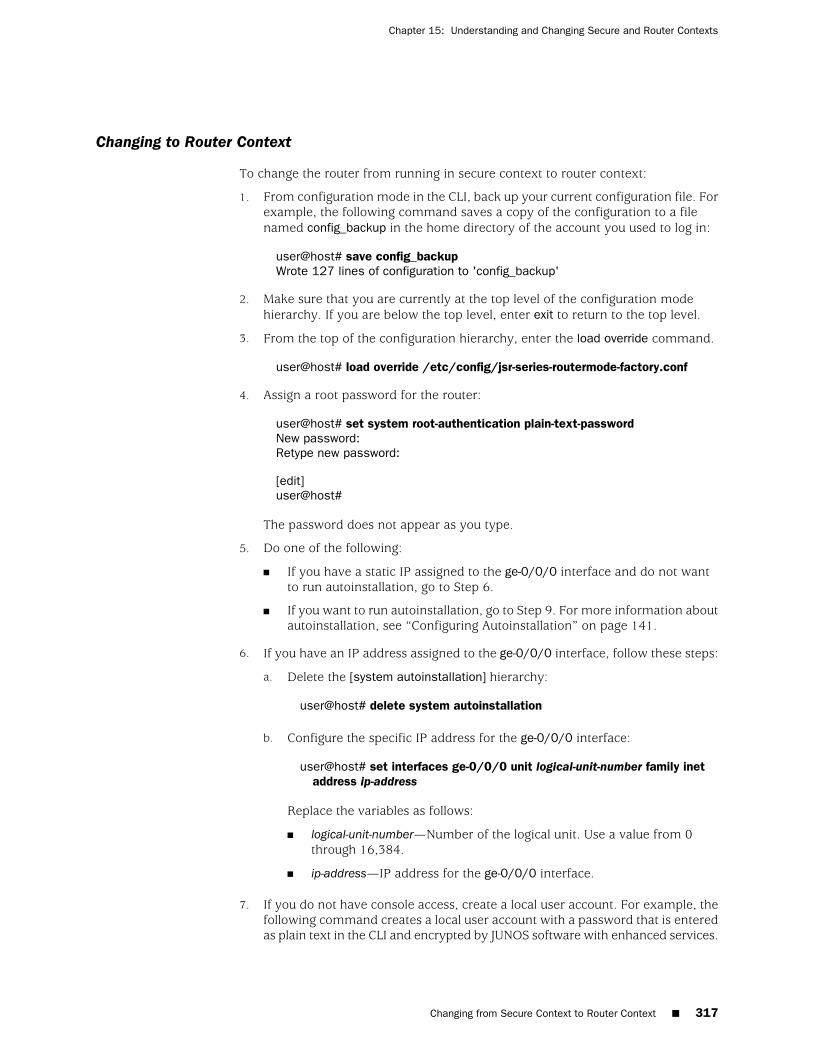
Changing to Router Context
To change the router from running in secure context to router context:
1. From configuration mode in the CLI, back up your current configuration file. Forexample, the following command saves a copy of the configuration to a filenamed config_backup in the home directory of the account you used to log in:
user@host# save config_backupWrote 127 lines of configuration to 'config_backup'
2. Make sure that you are currently at the top level of the configuration modehierarchy. If you are below the top level, enter exit to return to the top level.
3. From the top of the configuration hierarchy, enter the load override command.
user@host# load override /etc/config/jsr-series-routermode-factory.conf
4. Assign a root password for the router:
user@host# set system root-authentication plain-text-passwordNew password:Retype new password:
[edit]user@host#
The password does not appear as you type.
5. Do one of the following:
■ If you have a static IP assigned to the ge-0/0/0 interface and do not wantto run autoinstallation, go to Step 6.
■ If you want to run autoinstallation, go to Step 9. For more information aboutautoinstallation, see “Configuring Autoinstallation” on page 141.
6. If you have an IP address assigned to the ge-0/0/0 interface, follow these steps:
a. Delete the [system autoinstallation] hierarchy:
user@host# delete system autoinstallation
b. Configure the specific IP address for the ge-0/0/0 interface:
user@host# set interfaces ge-0/0/0 unit logical-unit-number family inetaddress ip-address
Replace the variables as follows:
■ logical-unit-number—Number of the logical unit. Use a value from 0through 16,384.
■ ip-address—IP address for the ge-0/0/0 interface.
7. If you do not have console access, create a local user account. For example, thefollowing command creates a local user account with a password that is enteredas plain text in the CLI and encrypted by JUNOS software with enhanced services.
Changing from Secure Context to Router Context ■ 317
Chapter 15: Understanding and Changing Secure and Router Contexts
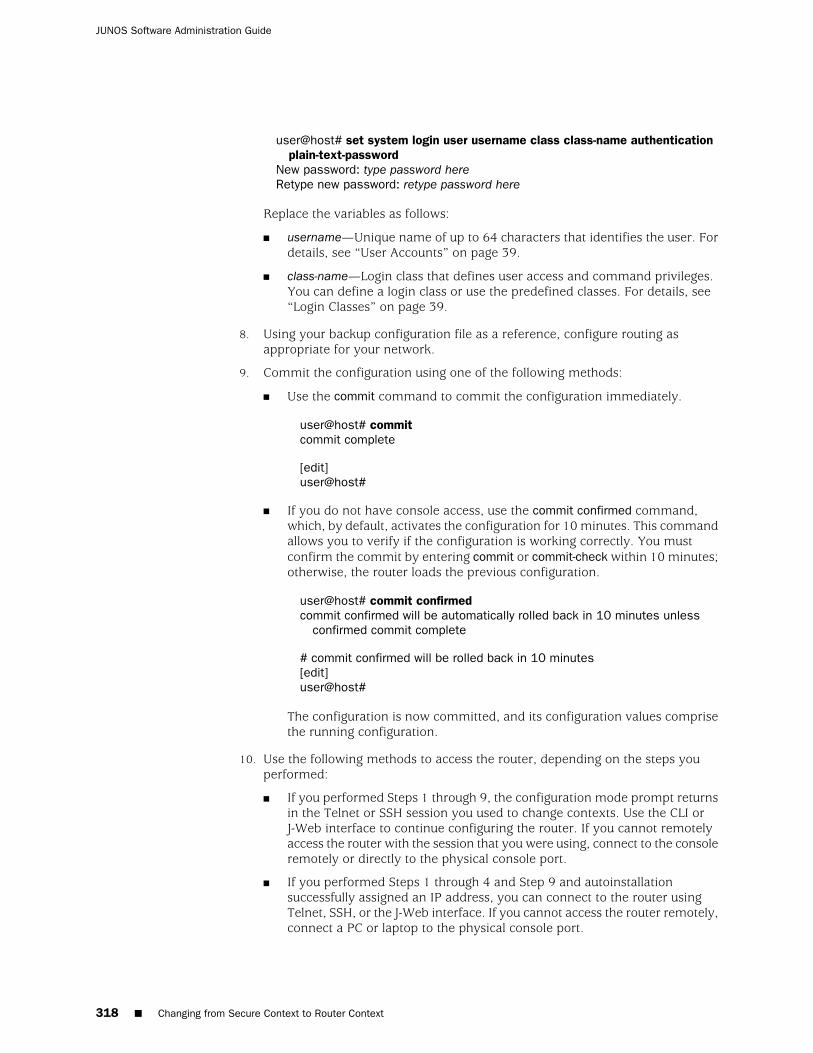
user@host# set system login user username class class-name authenticationplain-text-password
New password: type password hereRetype new password: retype password here
Replace the variables as follows:
■ username—Unique name of up to 64 characters that identifies the user. Fordetails, see “User Accounts” on page 39.
■ class-name—Login class that defines user access and command privileges.You can define a login class or use the predefined classes. For details, see“Login Classes” on page 39.
8. Using your backup configuration file as a reference, configure routing asappropriate for your network.
9. Commit the configuration using one of the following methods:
■ Use the commit command to commit the configuration immediately.
user@host# commitcommit complete
[edit]user@host#
■ If you do not have console access, use the commit confirmed command,which, by default, activates the configuration for 10 minutes. This commandallows you to verify if the configuration is working correctly. You mustconfirm the commit by entering commit or commit-check within 10 minutes;otherwise, the router loads the previous configuration.
user@host# commit confirmedcommit confirmed will be automatically rolled back in 10 minutes unless
confirmed commit complete
# commit confirmed will be rolled back in 10 minutes[edit]user@host#
The configuration is now committed, and its configuration values comprisethe running configuration.
10. Use the following methods to access the router, depending on the steps youperformed:
■ If you performed Steps 1 through 9, the configuration mode prompt returnsin the Telnet or SSH session you used to change contexts. Use the CLI orJ-Web interface to continue configuring the router. If you cannot remotelyaccess the router with the session that you were using, connect to the consoleremotely or directly to the physical console port.
■ If you performed Steps 1 through 4 and Step 9 and autoinstallationsuccessfully assigned an IP address, you can connect to the router usingTelnet, SSH, or the J-Web interface. If you cannot access the router remotely,connect a PC or laptop to the physical console port.
318 ■ Changing from Secure Context to Router Context
JUNOS Software Administration Guide
For information about autoinstallation, see “ConfiguringAutoinstallation” on page 141. For information about connecting to the consolelocally or remotely, see the JUNOS Software with Enhanced Services HardwareGuide.
Changing from Router Context to Secure Context
To change a Services Router running JUNOS software with enhanced services froma router to a secure router, use the load factory-default configuration command toload the factory configuration. The factory configuration contains the default securecontext configuration values. After changing to secure context, you can customizethe configuration to suit your network.
Router-to-Secure Context Task Overview
To change from router context to secure context, you perform the following tasks:
■ Make a backup of your current configuration file.
■ Use the load factory-default command to load the factory configuration file forsecure context.
■ Assign a root password for the router. For security purposes, the factoryconfiguration does not include a default root password. You need to assign aroot password so that you are able to commit configuration changes.
■ Optionally, if you want to retain remote IP-based connectivity to the ServicesRouter after changing to router context, perform the following tasks:
■ If you have a static IP address assigned to the ge-0/0/0 interface and do notwant to run autoinstallation, you must remove the system autoinstallationhierarchy from the configuration. Doing so ensures that the router is notautomatically assigned an IP address of 192.168.2.1 if it cannot acquire anIP address using DHCP. You must also assign the IP address previously usedto the ge-0/0/0 interface.
For more information about autoinstallation, see “ConfiguringAutoinstallation” on page 141.
■ If you do not have remote access to the console, create a local user accountto allow remote access for a non-root user account.
■ If you previously configured routing information, use your backupconfiguration file as a reference to configure the routing information for yournetwork.
■ Commit the configuration changes, and make the candidate configuration therunning configuration.
CAUTION: If you do not assign an IP address for the ge-0/0/0 interface, create alocal user account, and enter routing information, either from CLI configuration orusing DHCP, before you commit the changes, the router is no longer remotely
Changing from Router Context to Secure Context ■ 319
Chapter 15: Understanding and Changing Secure and Router Contexts
accessible. To manage the router, you must connect a PC or laptop to the physicalconsole, or attach the PC or laptop to a subnet that is directly connected to thege-0/0/0 interface, which is assigned an IP address of 192.168.2.1.
Any configuration changes that you made before you issued the load overridecommand are no longer part of the current running configuration.
Alternatively, to return the Services Router to the factory default (secure context)configuration, you can press the RESET CONFIG button. Keep in mind that pressingthe RESET CONFIG button for 15 seconds or more deletes all configuration files onthe Services Router, including backup configuration and rescue configuration files.The factory configuration is loaded and committed. Using the load factory-defaultcommand does not delete all configuration files. For more information about theRESET CONFIG button, see the JUNOS Software Administration Guide.
To change the router from running in router context to secure context:
1. From configuration mode in the CLI, back up your current configuration file. Forexample, the following command saves a copy of the configuration to a filenamed config_backup in the home directory of the account you used to log in:
user@host# save config_backupWrote 127 lines of configuration to 'config_backup'
2. In configuration mode, enter the load factory-default command.
user@host# load factory-defaultwarning: activating factory configuration
[edit]user@host#
3. Assign a root password for the router:
user@host# set system root-authentication plain-text-passwordNew password:Retype new password:
[edit]user@host#
The password does not appear as you type.
4. Do one of the following:
■ If you have a static IP assigned to the ge-0/0/0 interface and do not wantto run autoinstallation, go to Step 5.
■ If you want to run autoinstallation, go to Step 8. For more information aboutautoinstallation, see “Configuring Autoinstallation” on page 141.
5. If you have an IP address assigned to the ge-0/0/0 interface, follow these steps:
a. Delete the [system autoinstallation] hierarchy:
320 ■ Changing from Router Context to Secure Context
JUNOS Software Administration Guide

user@host# delete system autoinstallation
b. Configure the specific IP address for the ge-0/0/0 interface:
user@host# set interfaces ge-0/0/0 unit logical-unit-number family inetaddress IP-address
Replace the variables as follows:
■ logical-unit-number—Number of the logical unit. Use a value from 0through 16,384.
■ IP-address—IP address for the ge-0/0/0 interface.
6. If you do not have console access, create a local user account. For example, thefollowing command creates a local user account with a password that is enteredas plain text in the CLI and is encrypted by JUNOS software with enhancedservices.
user@host# set system login user username class class-name authenticationplain-text-password
New password: type password hereRetype new password: retype password here
Replace the variables as follows:
■ username—Unique name of up to 64 characters that identifies the user. Fordetails, see “User Accounts” on page 39.
■ class-name—Login class that defines user access and command privileges.You can define a login class or use the predefined classes. For details, see“Login Classes” on page 39.
7. Using your backup configuration file as a reference, configure routing asappropriate for your network.
8. Commit the configuration using one of the following methods:
■ Use the commit command to commit the configuration immediately.
user@host# commitcommit complete
[edit]user@host#
■ If you do not have console access, use the commit confirmed command,which, by default, activates the configuration for 10 minutes. This commandallows you to verify if the configuration is working correctly. You mustconfirm the commit by entering commit or commit-check within 10 minutes;otherwise, the router loads the previous configuration.
user@host# commit confirmedcommit confirmed will be automatically rolled back in 10 minutes unless
confirmedcommit complete
# commit confirmed will be rolled back in 10 minutes
Changing from Router Context to Secure Context ■ 321
Chapter 15: Understanding and Changing Secure and Router Contexts
[edit]user@host#
The configuration is now committed, and its configuration values comprisethe running configuration.
9. Use the following methods to access the router, depending on the steps youperformed:
■ If you performed Steps 1 through 8, the configuration mode prompt returnsin the SSH session you used to change contexts. Use the CLI or J-Webinterface to continue configuring the router. If you cannot remotely accessthe router with the session that you were using, connect to the consoleremotely or directly to the physical console port.
■ If you performed Steps 1 through 3 and Step 8, and autoinstallationsuccessfully assigned an IP address, you can connect to the router using SSHor the J-Web interface. If you cannot access the router remotely, connect aPC or laptop to the physical console port.
For information about autoinstallation, see “ConfiguringAutoinstallation” on page 141. For information about connecting to the CLIlocally or remotely, see the JUNOS Software with Enhanced Services HardwareGuide.
322 ■ Changing from Router Context to Secure Context
JUNOS Software Administration Guide
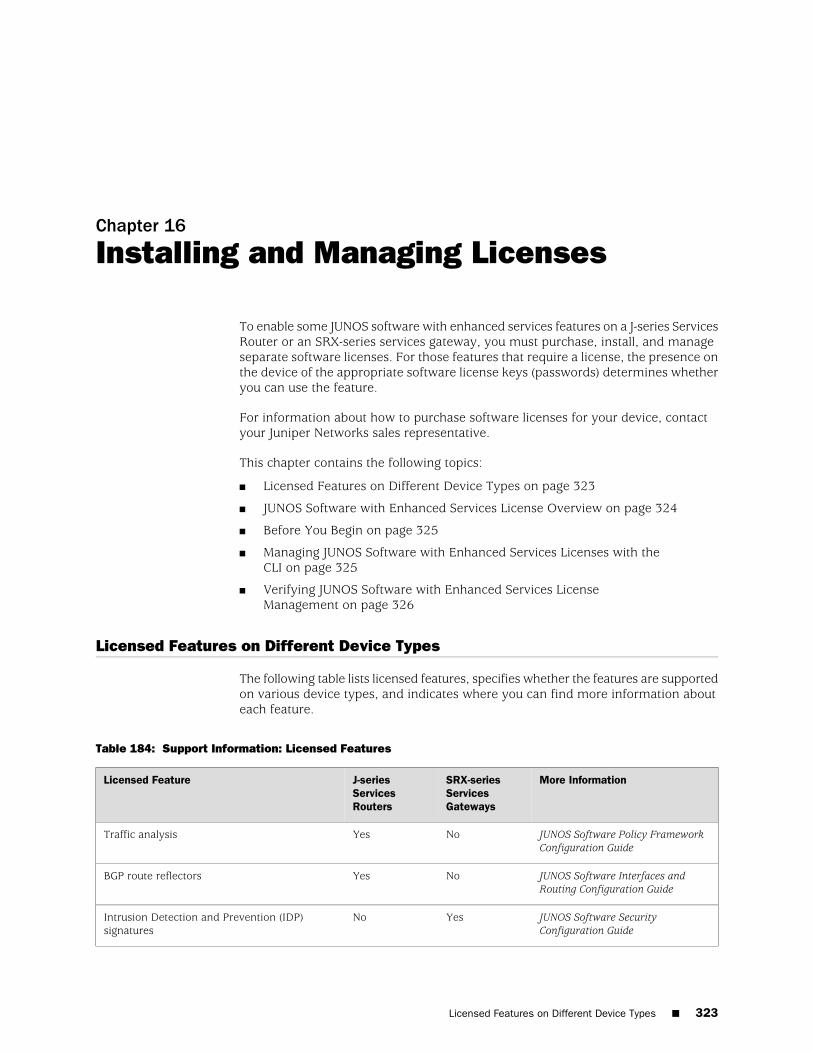
Chapter 16
Installing and Managing Licenses
To enable some JUNOS software with enhanced services features on a J-series ServicesRouter or an SRX-series services gateway, you must purchase, install, and manageseparate software licenses. For those features that require a license, the presence onthe device of the appropriate software license keys (passwords) determines whetheryou can use the feature.
For information about how to purchase software licenses for your device, contactyour Juniper Networks sales representative.
This chapter contains the following topics:
■ Licensed Features on Different Device Types on page 323
■ JUNOS Software with Enhanced Services License Overview on page 324
■ Before You Begin on page 325
■ Managing JUNOS Software with Enhanced Services Licenses with theCLI on page 325
■ Verifying JUNOS Software with Enhanced Services LicenseManagement on page 326
Licensed Features on Different Device Types
The following table lists licensed features, specifies whether the features are supportedon various device types, and indicates where you can find more information abouteach feature.
Table 184: Support Information: Licensed Features
More InformationSRX-seriesServicesGateways
J-seriesServicesRouters
Licensed Feature
JUNOS Software Policy FrameworkConfiguration Guide
NoYesTraffic analysis
JUNOS Software Interfaces andRouting Configuration Guide
NoYesBGP route reflectors
JUNOS Software SecurityConfiguration Guide
YesNoIntrusion Detection and Prevention (IDP)signatures
Licensed Features on Different Device Types ■ 323
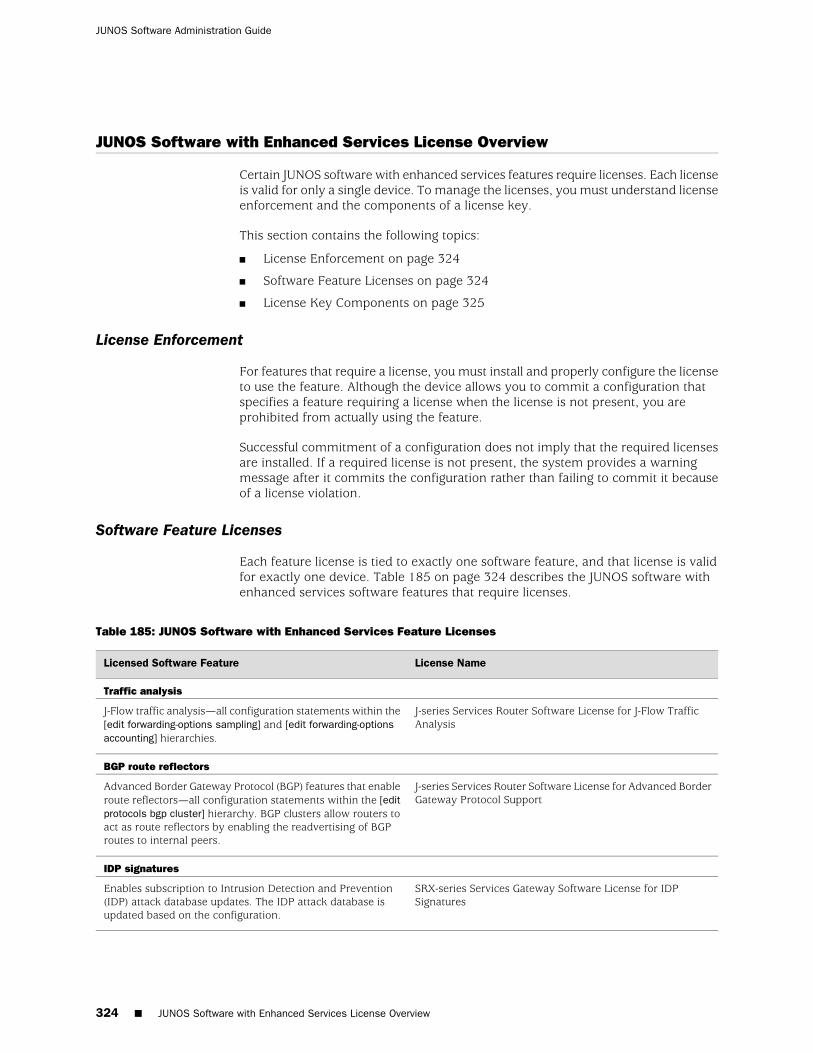
JUNOS Software with Enhanced Services License Overview
Certain JUNOS software with enhanced services features require licenses. Each licenseis valid for only a single device. To manage the licenses, you must understand licenseenforcement and the components of a license key.
This section contains the following topics:
■ License Enforcement on page 324
■ Software Feature Licenses on page 324
■ License Key Components on page 325
License Enforcement
For features that require a license, you must install and properly configure the licenseto use the feature. Although the device allows you to commit a configuration thatspecifies a feature requiring a license when the license is not present, you areprohibited from actually using the feature.
Successful commitment of a configuration does not imply that the required licensesare installed. If a required license is not present, the system provides a warningmessage after it commits the configuration rather than failing to commit it becauseof a license violation.
Software Feature Licenses
Each feature license is tied to exactly one software feature, and that license is validfor exactly one device. Table 185 on page 324 describes the JUNOS software withenhanced services software features that require licenses.
Table 185: JUNOS Software with Enhanced Services Feature Licenses
License NameLicensed Software Feature
Traffic analysis
J-series Services Router Software License for J-Flow TrafficAnalysis
J-Flow traffic analysis—all configuration statements within the[edit forwarding-options sampling] and [edit forwarding-optionsaccounting] hierarchies.
BGP route reflectors
J-series Services Router Software License for Advanced BorderGateway Protocol Support
Advanced Border Gateway Protocol (BGP) features that enableroute reflectors—all configuration statements within the [editprotocols bgp cluster] hierarchy. BGP clusters allow routers toact as route reflectors by enabling the readvertising of BGProutes to internal peers.
IDP signatures
SRX-series Services Gateway Software License for IDPSignatures
Enables subscription to Intrusion Detection and Prevention(IDP) attack database updates. The IDP attack database isupdated based on the configuration.
324 ■ JUNOS Software with Enhanced Services License Overview
JUNOS Software Administration Guide

License Key Components
A license key consists of two parts:
■ License ID—Alphanumeric string that uniquely identifies the license key. Whena license is generated, it is given a license ID.
■ License data—Block of binary data that defines and stores all license key objects.
For example, in the following typical license key, the string li29183743 is the licenseID, and the trailing block of data is the license data:
li29183743 4ky27y acasck 82fsj6 jzsn4q ix8i8d adj7kr 8uq38t ix8i8d jzsn4q ix8i8d 4ky27y acasck 82fsj6 ii8i7e adj7kr 8uq38t ks2923 a9382e
The license data defines the device ID for which the license is valid and the versionof the license.
Before You Begin
Before you begin managing licenses, complete the following tasks:
■ Purchase the licenses you require.
■ Establish basic connectivity. See the Getting Started Guide for your device.
Managing JUNOS Software with Enhanced Services Licenses with the CLI
To manage JUNOS software with enhanced services licenses with the CLI, performthe following tasks.
■ Adding New Licenses with the CLI on page 325
■ Deleting a License with the CLI on page 326
■ Saving License Keys with the CLI on page 326
Adding New Licenses with the CLI
To add a new license key to the device with the CLI:
1. Enter operational mode in the CLI.
2. Enter one of the following CLI commands:
■ To add a license key from a file or URL, enter the following command,specifying the filename or the URL where the key is located:
request system license add filename | url
■ To add a license key from the terminal, enter the following command:
request system license add terminal
Before You Begin ■ 325
Chapter 16: Installing and Managing Licenses
3. When prompted, enter the license key, separating multiple license keys with ablank line.
If the license key you enter is invalid, an error is generated when you press Ctrl-Dto exit license entry mode.
4. Go on to “Verifying JUNOS Software with Enhanced Services LicenseManagement” on page 326.
Deleting a License with the CLI
To delete a license key from the device with the CLI:
1. Enter operational mode in the CLI.
2. Enter the following command for each license, specifying the license ID. Youcan delete only one license at a time.
request system license delete license-id
3. Go on to “Verifying JUNOS Software with Enhanced Services LicenseManagement” on page 326.
Saving License Keys with the CLI
To save the licenses installed on thedevice to a file with the CLI:
1. Enter operational mode in the CLI.
2. To save the installed license keys to a file or URL, enter the following command:
request system license save filename | url
For example, the following command saves the installed license keys to a filenamed license.config:
request system license save ftp://user@host/license.conf
3. Go on to “Verifying JUNOS Software with Enhanced Services LicenseManagement” on page 326.
Verifying JUNOS Software with Enhanced Services License Management
To verify license management, perform the tasks explained in these sections:
■ Displaying Installed Licenses on page 326
■ Displaying License Usage on page 327
■ Displaying Installed License Keys on page 328
Displaying Installed LicensesPurpose Verify that the expected licenses are installed and active on the device.
326 ■ Verifying JUNOS Software with Enhanced Services License Management
JUNOS Software Administration Guide
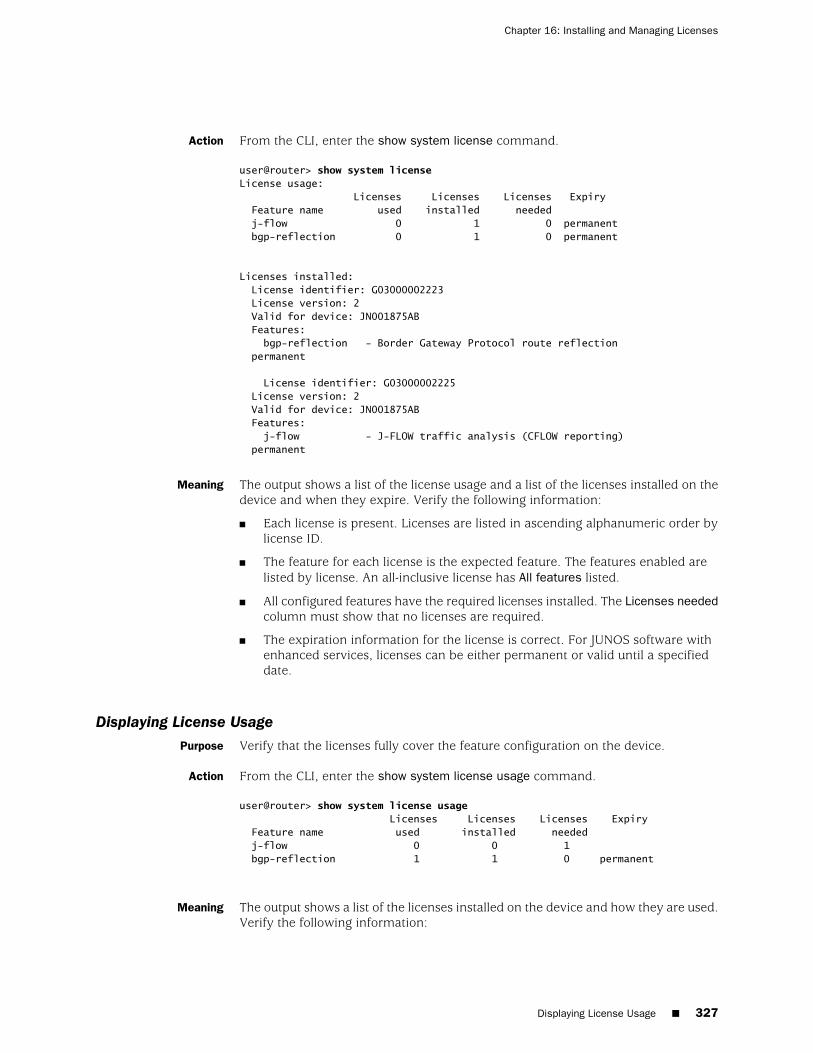
Action From the CLI, enter the show system license command.
user@router> show system licenseLicense usage: Licenses Licenses Licenses Expiry Feature name used installed needed j-flow 0 1 0 permanent bgp-reflection 0 1 0 permanent
Licenses installed: License identifier: G03000002223 License version: 2 Valid for device: JN001875AB Features: bgp-reflection - Border Gateway Protocol route reflection permanent
License identifier: G03000002225 License version: 2 Valid for device: JN001875AB Features: j-flow - J-FLOW traffic analysis (CFLOW reporting) permanent
Meaning The output shows a list of the license usage and a list of the licenses installed on thedevice and when they expire. Verify the following information:
■ Each license is present. Licenses are listed in ascending alphanumeric order bylicense ID.
■ The feature for each license is the expected feature. The features enabled arelisted by license. An all-inclusive license has All features listed.
■ All configured features have the required licenses installed. The Licenses neededcolumn must show that no licenses are required.
■ The expiration information for the license is correct. For JUNOS software withenhanced services, licenses can be either permanent or valid until a specifieddate.
Displaying License UsagePurpose Verify that the licenses fully cover the feature configuration on the device.
Action From the CLI, enter the show system license usage command.
user@router> show system license usage Licenses Licenses Licenses Expiry Feature name used installed needed j-flow 0 0 1 bgp-reflection 1 1 0 permanent
Meaning The output shows a list of the licenses installed on the device and how they are used.Verify the following information:
Displaying License Usage ■ 327
Chapter 16: Installing and Managing Licenses
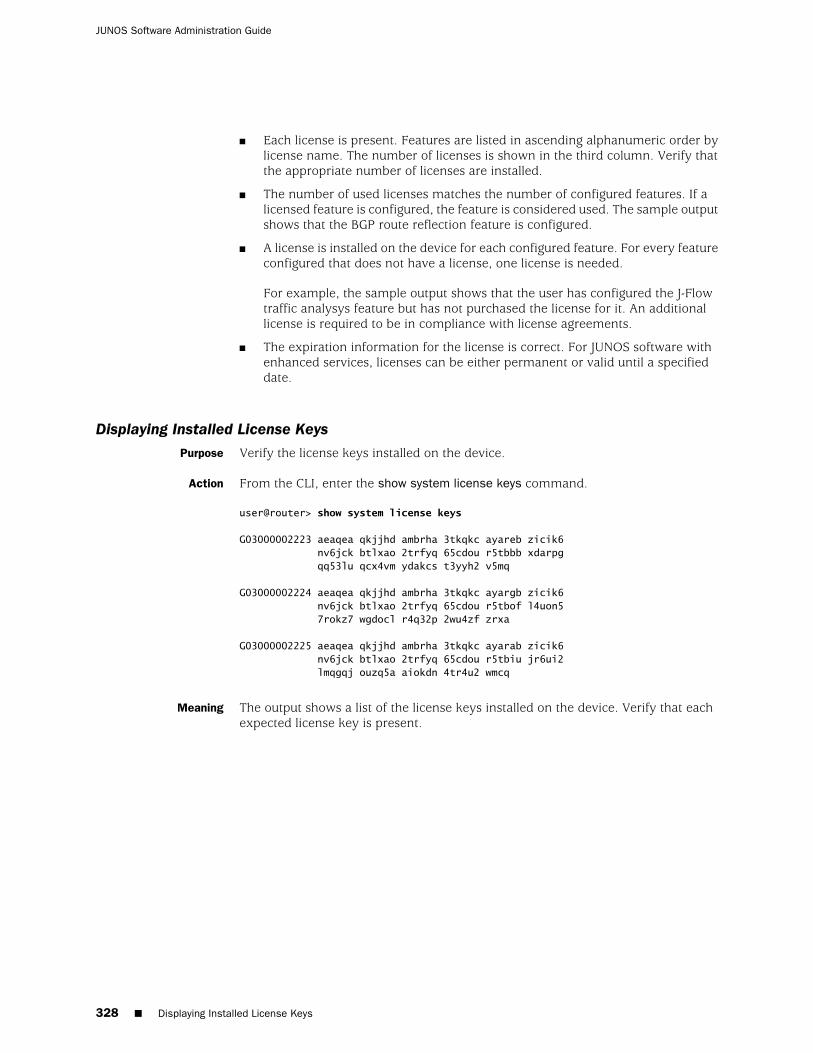
■ Each license is present. Features are listed in ascending alphanumeric order bylicense name. The number of licenses is shown in the third column. Verify thatthe appropriate number of licenses are installed.
■ The number of used licenses matches the number of configured features. If alicensed feature is configured, the feature is considered used. The sample outputshows that the BGP route reflection feature is configured.
■ A license is installed on the device for each configured feature. For every featureconfigured that does not have a license, one license is needed.
For example, the sample output shows that the user has configured the J-Flowtraffic analysys feature but has not purchased the license for it. An additionallicense is required to be in compliance with license agreements.
■ The expiration information for the license is correct. For JUNOS software withenhanced services, licenses can be either permanent or valid until a specifieddate.
Displaying Installed License KeysPurpose Verify the license keys installed on the device.
Action From the CLI, enter the show system license keys command.
user@router> show system license keys
G03000002223 aeaqea qkjjhd ambrha 3tkqkc ayareb zicik6 nv6jck btlxao 2trfyq 65cdou r5tbbb xdarpg qq53lu qcx4vm ydakcs t3yyh2 v5mq
G03000002224 aeaqea qkjjhd ambrha 3tkqkc ayargb zicik6 nv6jck btlxao 2trfyq 65cdou r5tbof l4uon5 7rokz7 wgdocl r4q32p 2wu4zf zrxa
G03000002225 aeaqea qkjjhd ambrha 3tkqkc ayarab zicik6 nv6jck btlxao 2trfyq 65cdou r5tbiu jr6ui2 lmqgqj ouzq5a aiokdn 4tr4u2 wmcq
Meaning The output shows a list of the license keys installed on the device. Verify that eachexpected license key is present.
328 ■ Displaying Installed License Keys
JUNOS Software Administration Guide
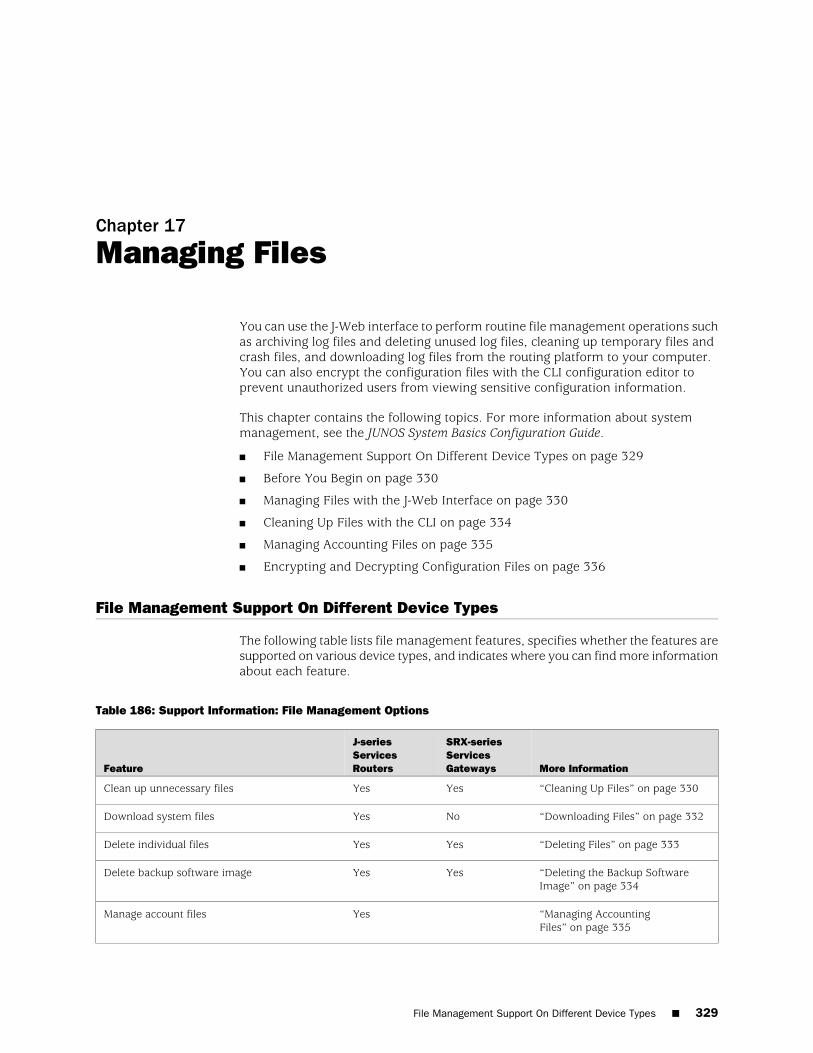
Chapter 17
Managing Files
You can use the J-Web interface to perform routine file management operations suchas archiving log files and deleting unused log files, cleaning up temporary files andcrash files, and downloading log files from the routing platform to your computer.You can also encrypt the configuration files with the CLI configuration editor toprevent unauthorized users from viewing sensitive configuration information.
This chapter contains the following topics. For more information about systemmanagement, see the JUNOS System Basics Configuration Guide.
■ File Management Support On Different Device Types on page 329
■ Before You Begin on page 330
■ Managing Files with the J-Web Interface on page 330
■ Cleaning Up Files with the CLI on page 334
■ Managing Accounting Files on page 335
■ Encrypting and Decrypting Configuration Files on page 336
File Management Support On Different Device Types
The following table lists file management features, specifies whether the features aresupported on various device types, and indicates where you can find more informationabout each feature.
Table 186: Support Information: File Management Options
More Information
SRX-seriesServicesGateways
J-seriesServicesRoutersFeature
“Cleaning Up Files” on page 330YesYesClean up unnecessary files
“Downloading Files” on page 332NoYesDownload system files
“Deleting Files” on page 333YesYesDelete individual files
“Deleting the Backup SoftwareImage” on page 334
YesYesDelete backup software image
“Managing AccountingFiles” on page 335
YesManage account files
File Management Support On Different Device Types ■ 329
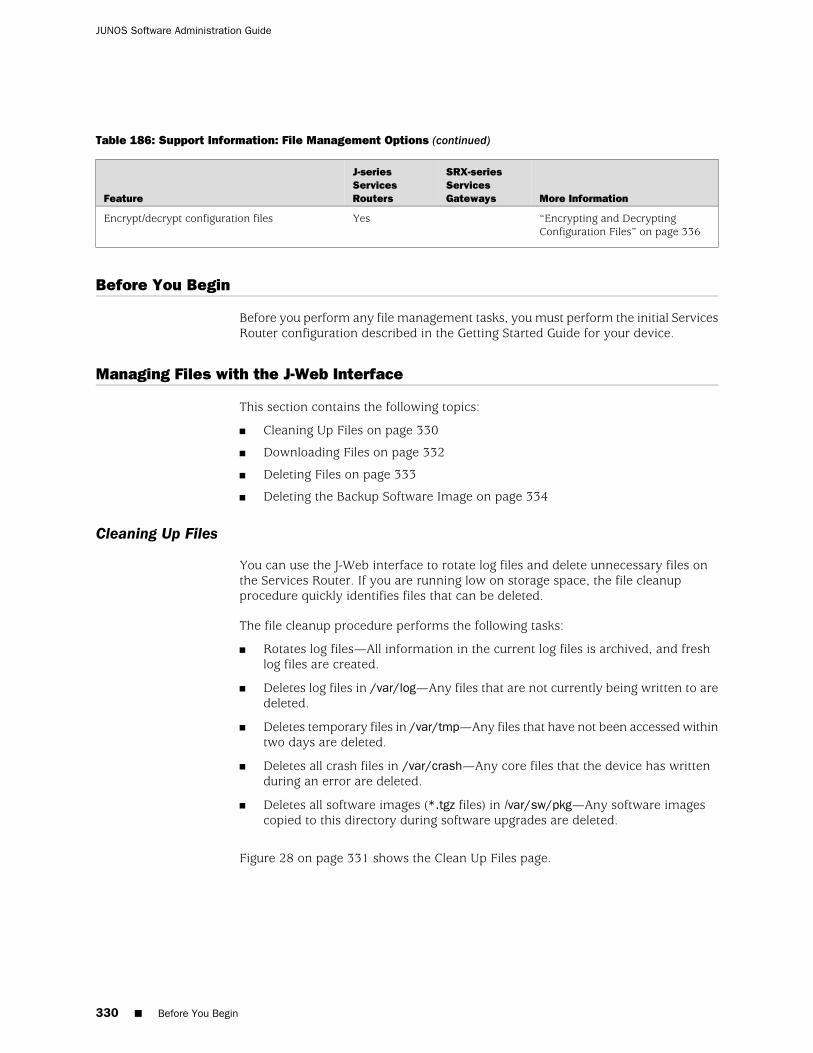
Table 186: Support Information: File Management Options (continued)
More Information
SRX-seriesServicesGateways
J-seriesServicesRoutersFeature
“Encrypting and DecryptingConfiguration Files” on page 336
YesEncrypt/decrypt configuration files
Before You Begin
Before you perform any file management tasks, you must perform the initial ServicesRouter configuration described in the Getting Started Guide for your device.
Managing Files with the J-Web Interface
This section contains the following topics:
■ Cleaning Up Files on page 330
■ Downloading Files on page 332
■ Deleting Files on page 333
■ Deleting the Backup Software Image on page 334
Cleaning Up Files
You can use the J-Web interface to rotate log files and delete unnecessary files onthe Services Router. If you are running low on storage space, the file cleanupprocedure quickly identifies files that can be deleted.
The file cleanup procedure performs the following tasks:
■ Rotates log files—All information in the current log files is archived, and freshlog files are created.
■ Deletes log files in /var/log—Any files that are not currently being written to aredeleted.
■ Deletes temporary files in /var/tmp—Any files that have not been accessed withintwo days are deleted.
■ Deletes all crash files in /var/crash—Any core files that the device has writtenduring an error are deleted.
■ Deletes all software images (*.tgz files) in /var/sw/pkg—Any software imagescopied to this directory during software upgrades are deleted.
Figure 28 on page 331 shows the Clean Up Files page.
330 ■ Before You Begin
JUNOS Software Administration Guide
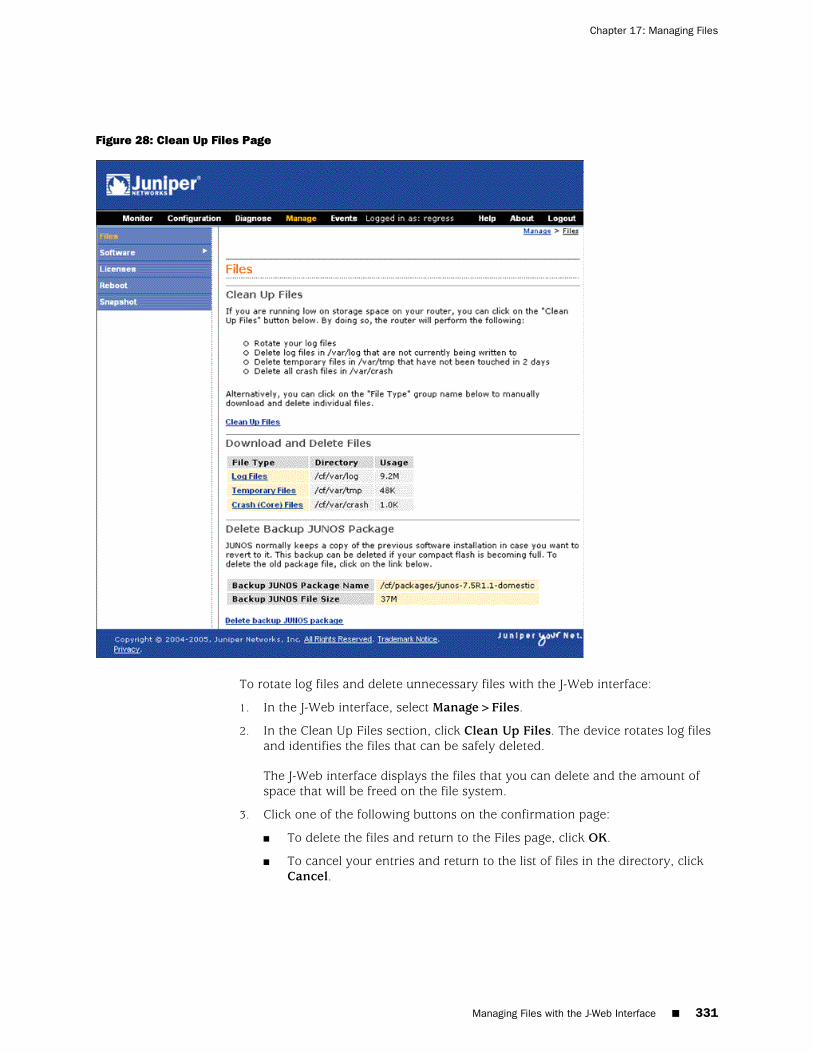
Figure 28: Clean Up Files Page
To rotate log files and delete unnecessary files with the J-Web interface:
1. In the J-Web interface, select Manage>Files.
2. In the Clean Up Files section, click Clean Up Files. The device rotates log filesand identifies the files that can be safely deleted.
The J-Web interface displays the files that you can delete and the amount ofspace that will be freed on the file system.
3. Click one of the following buttons on the confirmation page:
■ To delete the files and return to the Files page, click OK.
■ To cancel your entries and return to the list of files in the directory, clickCancel.
Managing Files with the J-Web Interface ■ 331
Chapter 17: Managing Files
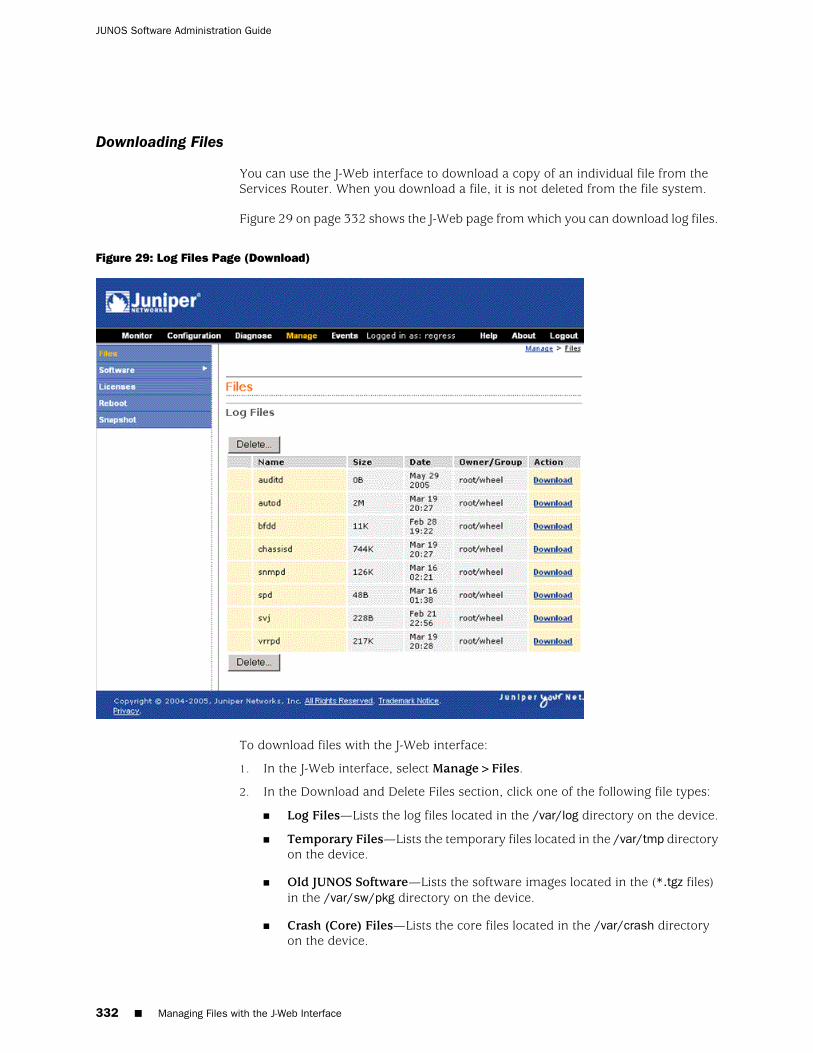
Downloading Files
You can use the J-Web interface to download a copy of an individual file from theServices Router. When you download a file, it is not deleted from the file system.
Figure 29 on page 332 shows the J-Web page from which you can download log files.
Figure 29: Log Files Page (Download)
To download files with the J-Web interface:
1. In the J-Web interface, select Manage>Files.
2. In the Download and Delete Files section, click one of the following file types:
■ Log Files—Lists the log files located in the /var/log directory on the device.
■ Temporary Files—Lists the temporary files located in the /var/tmp directoryon the device.
■ Old JUNOS Software—Lists the software images located in the (*.tgz files)in the /var/sw/pkg directory on the device.
■ Crash (Core) Files—Lists the core files located in the /var/crash directoryon the device.
332 ■ Managing Files with the J-Web Interface
JUNOS Software Administration Guide
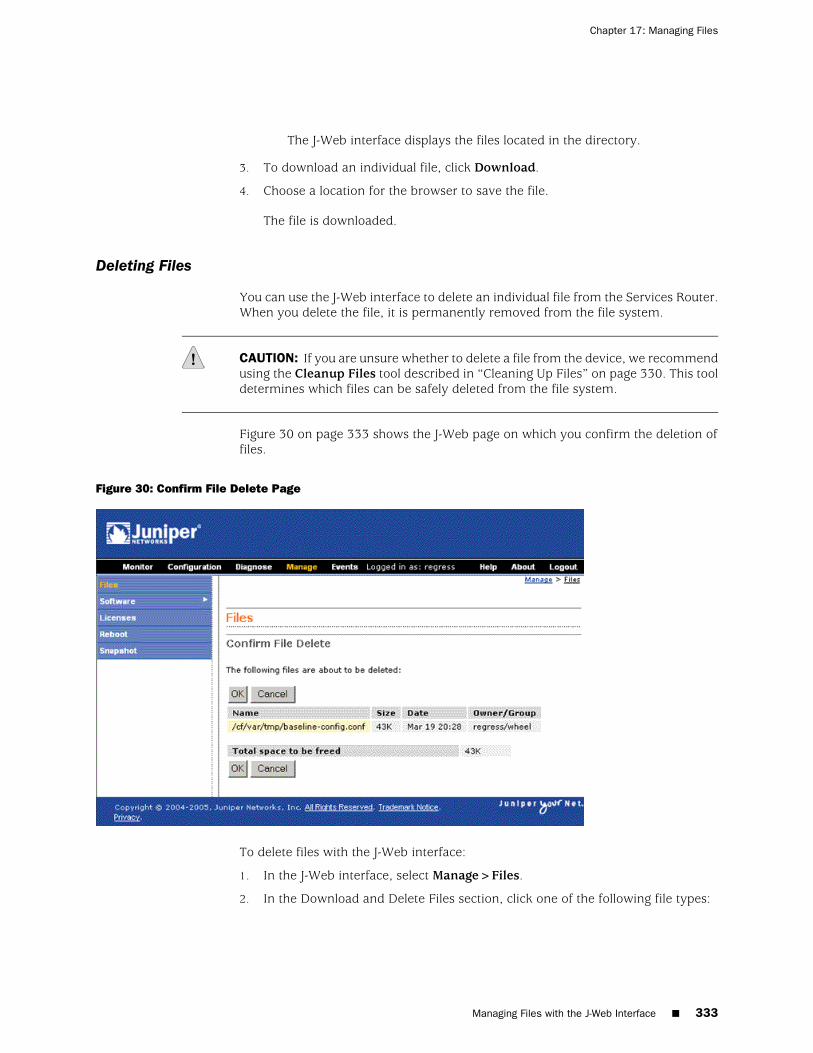
The J-Web interface displays the files located in the directory.
3. To download an individual file, click Download.
4. Choose a location for the browser to save the file.
The file is downloaded.
Deleting Files
You can use the J-Web interface to delete an individual file from the Services Router.When you delete the file, it is permanently removed from the file system.
CAUTION: If you are unsure whether to delete a file from the device, we recommendusing the Cleanup Files tool described in “Cleaning Up Files” on page 330. This tooldetermines which files can be safely deleted from the file system.
Figure 30 on page 333 shows the J-Web page on which you confirm the deletion offiles.
Figure 30: Confirm File Delete Page
To delete files with the J-Web interface:
1. In the J-Web interface, select Manage>Files.
2. In the Download and Delete Files section, click one of the following file types:
Managing Files with the J-Web Interface ■ 333
Chapter 17: Managing Files

■ Log Files—Lists the log files located in the /var/log directory on the device.
■ Temporary Files—Lists the temporary files located in the /var/tmp directoryon the device.
■ Old JUNOS Software—Lists the software images in the (*.tgz files) in the/var/sw/pkg directory on the device.
■ Crash (Core) Files—Lists the core files located in the /var/crash directoryon the device.
The J-Web interface displays the files located in the directory.
3. Check the box next to each file you plan to delete.
4. Click Delete.
The J-Web interface displays the files you can delete and the amount of spacethat will be freed on the file system.
5. Click one of the following buttons on the confirmation page:
■ To delete the files and return to the Files page, click OK.
■ To cancel your entries and return to the list of files in the directory, clickCancel.
Deleting the Backup Software Image
JUNOS software with enhanced services keeps a backup image of the software thatwas previously installed so that you can downgrade to that version of the softwareif necessary. You can use the J-Web interface to delete this backup image. If youdelete this image, you cannot downgrade to this particular version of the software.
To delete the backup software image:
1. In the J-Web interface, select Manage>Files.
2. In the Delete Backup JUNOS Package section, review the backup imageinformation listed.
3. To delete the backup image, click the Delete backup JUNOS package link.
4. Click one of the following buttons on the confirmation page:
■ To delete the backup image and return to the Files page, click OK.
■ To cancel the deletion of the backup image and return to the Files page, clickCancel.
Cleaning Up Files with the CLI
You can use the CLI request system storage cleanup command to rotate log files anddelete unnecessary files on the Services Router. If you are running low on storagespace, the file cleanup procedure quickly identifies files that can be deleted.
334 ■ Cleaning Up Files with the CLI
JUNOS Software Administration Guide

The file cleanup procedure performs the following tasks:
■ Rotates log files—All information in the current log files is archived, old archivesare deleted, and fresh log files are created.
■ Deletes log files in /var/log—Any files that are not currently being written to aredeleted.
■ Deletes temporary files in /var/tmp—Any files that have not been accessed withintwo days are deleted.
■ Deletes all crash files in /var/crash—Any core files that the device has writtenduring an error are deleted.
■ Deletes all software images (*.tgz files) in /var/sw/pkg—Any software imagescopied to this directory during software upgrades are deleted.
To rotate log files and delete unnecessary files with the CLI:
1. Enter operational mode in the CLI.
2. To rotate log files and identify the files that can be safely deleted, enter thefollowing command:
user@host> request system storage cleanup
The device rotates log files and displays the files that you can delete.
3. Enter yes at the prompt to delete the files.
NOTE: You can issue the request system storage cleanup dry-run command to reviewthe list of files that can be deleted with the request system storage cleanup command,without actually deleting the files.
Managing Accounting Files
If you configure your system to capture accounting data in log files, set the locationfor accounting files to the DRAM.
The default location for accounting files is the cfs/var/log directory on the compactflash. The nonpersistent option minimizes the read/write traffic to your compactflash. We recommend that you use the nonpersistent option for all accounting filesconfigured on your system.
To store accounting log files in DRAM instead of the compact flash:
1. Enter the configuration mode in the CLI.
2. To create an accounting data log file in DRAM, enter the following command,replacing filename with the name of the file:
user@host> edit accounting-options file filename
Managing Accounting Files ■ 335
Chapter 17: Managing Files
3. To store accounting log files in the DRAM file, enter the following command:
user@host> set file filename nonpersistent
For more information about the nonpersistent option, see the JUNOS NetworkManagement Configuration Guide.
CAUTION: If log files for accounting data are stored on DRAM, these files are lostwhen the device reboots. Therefore, we recommend that you back up these filesperiodically.
Encrypting and Decrypting Configuration Files
Configuration files contain sensitive information such as IP addresses. By default,the device stores configuration files in unencrypted format on an external compactflash. This storage method is considered a security risk because the compact flashcan easily be removed from the device. To prevent unauthorized users from viewingsensitive information in configuration files, you can encrypt them.
If your device runs the Canada and U.S. version of JUNOS software with enhancedservices, the configuration files can be encrypted with the Advanced EncryptionStandard (AES) or Data Encryption Standard (DES) encryption algorithms. If yourdevice runs the international version of JUNOS software with enhanced services, thefiles can be encrypted only with DES.
To prevent unauthorized access, the encryption key is stored in the device's EEPROM.You can copy the encrypted configuration files to another device and decrypt themif that device has the same encryption key. To prevent encrypted configuration filesfrom being copied to another device and decrypted, you can set a unique encryptionkey that contains the chassis serial number of your device. Configuration files thatare encrypted with a unique encryption key cannot be decrypted on any other device.
The encryption process encrypts only the configuration files in the /config and/var/db/config directories. Files in subdirectories under these directories are notencrypted. The filenames of encrypted configuration files have the extension.gz.jc—for example, juniper.conf.gz.jc.
NOTE: You must have superuser privileges to encrypt or decrypt configuration files.
This section contains the following topics:
■ Encrypting Configuration Files on page 337
■ Decrypting Configuration Files on page 338
■ Modifying the Encryption Key on page 338
336 ■ Encrypting and Decrypting Configuration Files
JUNOS Software Administration Guide
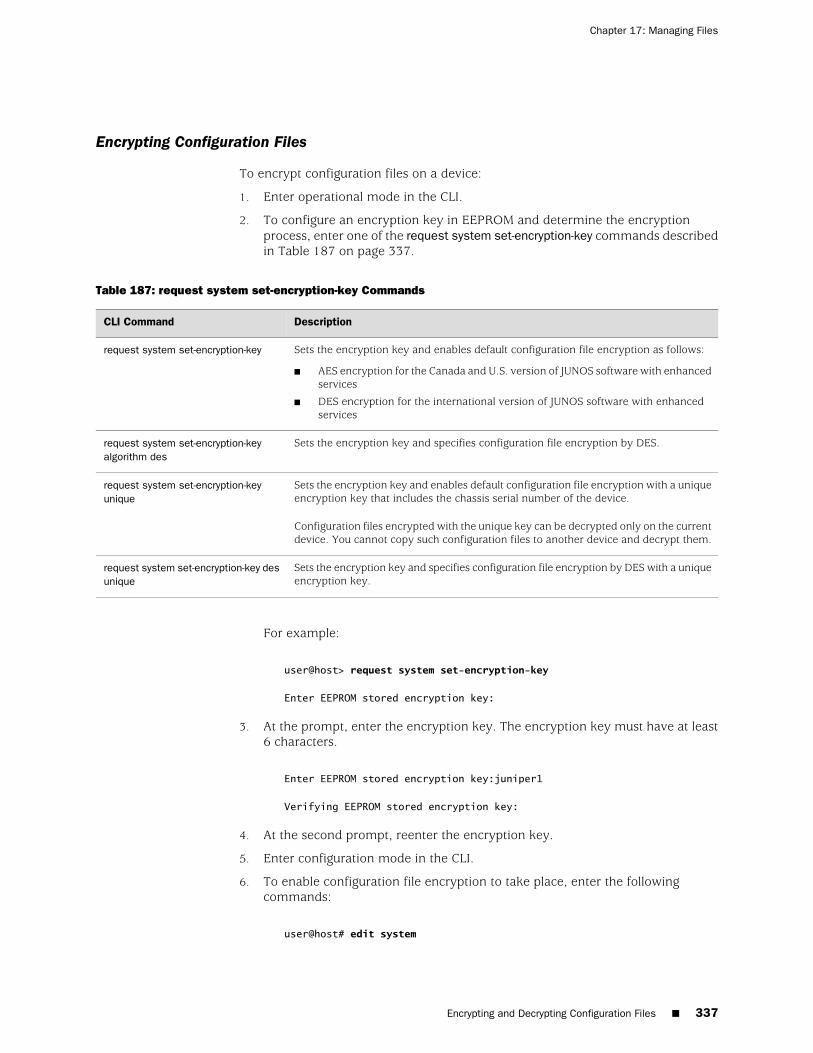
Encrypting Configuration Files
To encrypt configuration files on a device:
1. Enter operational mode in the CLI.
2. To configure an encryption key in EEPROM and determine the encryptionprocess, enter one of the request system set-encryption-key commands describedin Table 187 on page 337.
Table 187: request system set-encryption-key Commands
DescriptionCLI Command
Sets the encryption key and enables default configuration file encryption as follows:
■ AES encryption for the Canada and U.S. version of JUNOS software with enhancedservices
■ DES encryption for the international version of JUNOS software with enhancedservices
request system set-encryption-key
Sets the encryption key and specifies configuration file encryption by DES.request system set-encryption-keyalgorithm des
Sets the encryption key and enables default configuration file encryption with a uniqueencryption key that includes the chassis serial number of the device.
Configuration files encrypted with the unique key can be decrypted only on the currentdevice. You cannot copy such configuration files to another device and decrypt them.
request system set-encryption-keyunique
Sets the encryption key and specifies configuration file encryption by DES with a uniqueencryption key.
request system set-encryption-key desunique
For example:
user@host> request system set-encryption-key
Enter EEPROM stored encryption key:
3. At the prompt, enter the encryption key. The encryption key must have at least6 characters.
Enter EEPROM stored encryption key:juniper1
Verifying EEPROM stored encryption key:
4. At the second prompt, reenter the encryption key.
5. Enter configuration mode in the CLI.
6. To enable configuration file encryption to take place, enter the followingcommands:
user@host# edit system
Encrypting and Decrypting Configuration Files ■ 337
Chapter 17: Managing Files
user@host# set encrypt-configuration-files
7. To begin the encryption process, commit the configuration.
user@host# commit
commit complete
Decrypting Configuration Files
To disable the encryption of configuration files on a device and make them readableto all:
1. Enter operational mode in the CLI.
2. To verify your permission to decrypt configuration files on this device, enter thefollowing command and the encryption key for the device:
user@host> request system set-encryption-key
Enter EEPROM stored encryption key:
Verifying EEPROM stored encryption key:
3. At the second prompt, reenter the encryption key.
4. Enter configuration mode in the CLI.
5. To enable configuration file decryption, enter the following commands:
user@host# edit system
user@host# set no-encrypt-configuration-files
6. To begin the decryption process, commit the configuration.
user@host# commit
commit complete
Modifying the Encryption Key
When you modify the encryption key, the configuration files are decrypted and thenreencrypted with the new encryption key.
338 ■ Encrypting and Decrypting Configuration Files
JUNOS Software Administration Guide

To modify the encryption key:
1. Enter operational mode in the CLI.
2. To configure a new encryption key in EEPROM and determine the encryptionprocess, enter one of the request system set-encryption-key commands describedin Table 187 on page 337. For example:
user@host> request system set-encryption-key
Enter EEPROM stored encryption key:
3. At the prompt, enter the new encryption key. The encryption key must have atleast 6 characters.
Enter EEPROM stored encryption key:juniperone
Verifying EEPROM stored encryption key:
4. At the second prompt, reenter the new encryption key.
Encrypting and Decrypting Configuration Files ■ 339
Chapter 17: Managing Files

340 ■ Encrypting and Decrypting Configuration Files
JUNOS Software Administration Guide

Part 5
Diagnosing Performance and NetworkProblems
■ Using Diagnostic Tools on page 343
■ Configuring Packet Capture on page 389
■ Configuring RPM Probes on page 403
Diagnosing Performance and Network Problems ■ 341

342 ■ Diagnosing Performance and Network Problems
JUNOS Software Administration Guide

Chapter 18
Using Diagnostic Tools
J-series Services Routers and SRX-series services gateways support a suite of J-Webtools and CLI operational mode commands for evaluating system health andperformance. Diagnostic tools and commands test the connectivity and reachabilityof hosts in the network.
This chapter contains the following topics. For complete descriptions of CLI operationalmode commands, see the JUNOS System Basics and Services Command Reference, theJUNOS Interfaces Command Reference, and the JUNOS Routing Protocols and PoliciesCommand Reference.
■ Diagnostic Tools Support On Different Device Types on page 343
■ Diagnostic Terms on page 344
■ Diagnostic Tools Overview on page 344
■ Before You Begin on page 349
■ Pinging Hosts from the J-Web Interface on page 350
■ Checking MPLS Connections from the J-Web Interface on page 354
■ Tracing Unicast Routes from the J-Web Interface on page 359
■ Capturing and Viewing Packets with the J-Web Interface on page 362
■ Using CLI Diagnostic Commands on page 367
Diagnostic Tools Support On Different Device Types
The following table lists diagnostic tools, specifies whether the tools are supportedon various device types, and indicates where you can find more information abouteach tool.
Table 188: Support Information: Diagnostic Tools
More Information
SRX-seriesServicesGateways
J-seriesServicesRoutersFeature
“J-Web Diagnostic ToolsOverview” on page 345
YesYesPing host
“J-Web Diagnostic ToolsOverview” on page 345
NoYesPing MPLS
Diagnostic Tools Support On Different Device Types ■ 343
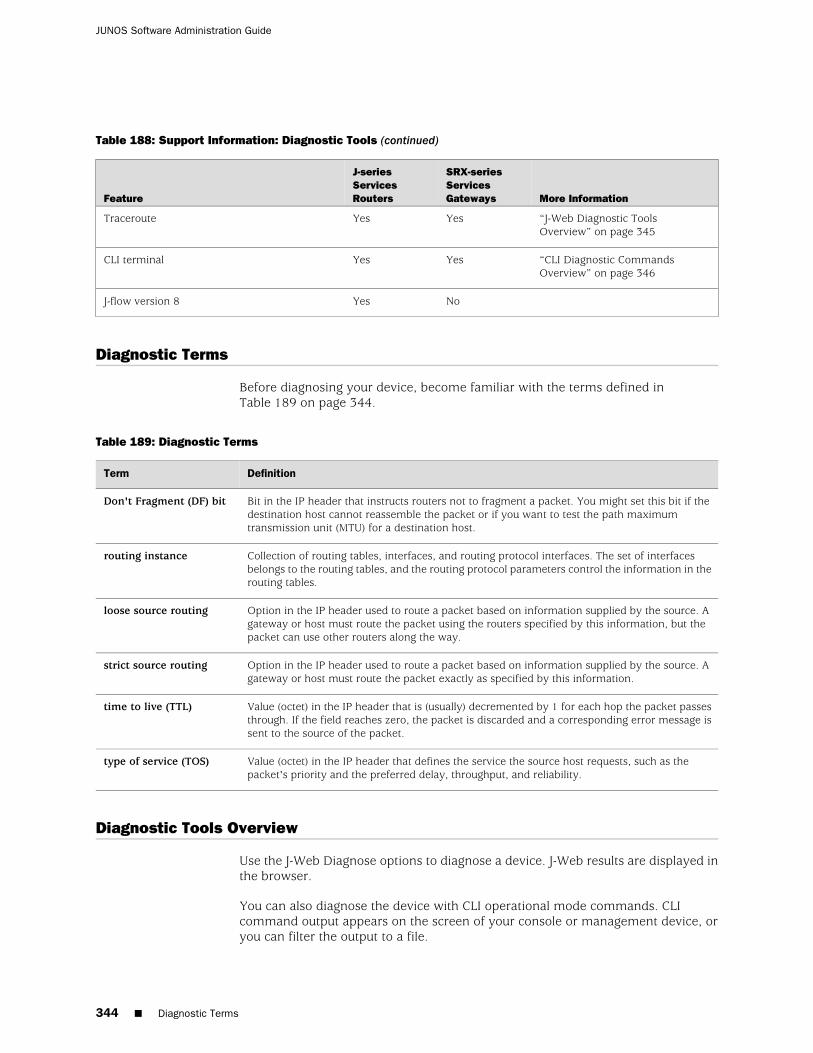
Table 188: Support Information: Diagnostic Tools (continued)
More Information
SRX-seriesServicesGateways
J-seriesServicesRoutersFeature
“J-Web Diagnostic ToolsOverview” on page 345
YesYesTraceroute
“CLI Diagnostic CommandsOverview” on page 346
YesYesCLI terminal
NoYesJ-flow version 8
Diagnostic Terms
Before diagnosing your device, become familiar with the terms defined inTable 189 on page 344.
Table 189: Diagnostic Terms
DefinitionTerm
Bit in the IP header that instructs routers not to fragment a packet. You might set this bit if thedestination host cannot reassemble the packet or if you want to test the path maximumtransmission unit (MTU) for a destination host.
Don't Fragment (DF) bit
Collection of routing tables, interfaces, and routing protocol interfaces. The set of interfacesbelongs to the routing tables, and the routing protocol parameters control the information in therouting tables.
routing instance
Option in the IP header used to route a packet based on information supplied by the source. Agateway or host must route the packet using the routers specified by this information, but thepacket can use other routers along the way.
loose source routing
Option in the IP header used to route a packet based on information supplied by the source. Agateway or host must route the packet exactly as specified by this information.
strict source routing
Value (octet) in the IP header that is (usually) decremented by 1 for each hop the packet passesthrough. If the field reaches zero, the packet is discarded and a corresponding error message issent to the source of the packet.
time to live (TTL)
Value (octet) in the IP header that defines the service the source host requests, such as thepacket's priority and the preferred delay, throughput, and reliability.
type of service (TOS)
Diagnostic Tools Overview
Use the J-Web Diagnose options to diagnose a device. J-Web results are displayed inthe browser.
You can also diagnose the device with CLI operational mode commands. CLIcommand output appears on the screen of your console or management device, oryou can filter the output to a file.
344 ■ Diagnostic Terms
JUNOS Software Administration Guide

This section contains the following topics. To filter output to a file, see “FilteringCommand Output” on page 169.
■ J-Web Diagnostic Tools Overview on page 345
■ CLI Diagnostic Commands Overview on page 346
■ MPLS Connection Checking on page 347
J-Web Diagnostic Tools Overview
The J-Web diagnostic tools consist of the options that appear when you selectDiagnose and Manage in the task bar. Table 190 on page 345 describes the functionsof the Diagnose and Manage options.
Table 190: J-Web Interface Diagnose and Manage Options
FunctionOption
Diagnose Options
Allows you to ping a remote host. You can configure advanced options for the ping operation.
For details, see “Using the J-Web Ping Host Tool” on page 350.
Ping Host
Allows you to ping an MPLS endpoint using various options.
For details, see “MPLS Connection Checking” on page 347.
Ping MPLS
Allows you to trace a route between the device and a remote host. You can configure advanced optionsfor the traceroute operation.
For details, see “Tracing Unicast Routes from the J-Web Interface” on page 359.
Traceroute
Allows you to capture and analyze router control traffic.
For details, see “Capturing and Viewing Packets with the J-Web Interface” on page 362.
Packet Capture
Manage Options
Allows you manage log, temporary, and core files on the device.
For details, see “Managing Files with the J-Web Interface” on page 330.
Files
Allows you to upgrade and manage device software packages.
For details, see “Performing Software Upgrades and Reboots” on page 287.
Upgrade
Displays a summary of the licenses needed and used for each feature that requires a license. Allows youto add licenses.
For details, see the JUNOS Software Administration Guide.
Licenses
Allows you to reboot the device at a specified time.
For details, see “Rebooting or Halting the Device with the J-Web Interface” on page 303.
Reboot
Diagnostic Tools Overview ■ 345
Chapter 18: Using Diagnostic Tools

CLI Diagnostic Commands Overview
The CLI commands available in operational mode allow you to perform the samemonitoring, troubleshooting, and management tasks you can perform with the J-Webinterface. Instead of invoking the tools through a graphical interface, you useoperational mode commands to perform the tasks.
Because the CLI is a superset of the J-Web interface, you can perform certain tasksonly through the CLI. For example, you can use the mtrace command to display traceinformation about a multicast path from a source to a receiver, which is a featureavailable only through the CLI.
To view a list of top-level operational mode commands, type a question mark (?) atthe command-line prompt.
At the top level of operational mode are the broad groups of CLI diagnostic commandslisted in Table 191 on page 346.
Table 191: CLI Diagnostic Command Summary
FunctionCommand
Controlling the CLI Environment
Configures the CLI display.set option
Diagnosis and Troubleshooting
Clears statistics and protocol database information.clear
Traces information about multicast paths from source to receiver.
For details, see “Tracing Multicast Routes from the CLI” on page 377.
mtrace
Performs real-time debugging of various software components, including therouting protocols and interfaces.
For details, see the following sections:
■ Using the monitor interface Command on page 381
■ Using the monitor traffic Command on page 383
■ Displaying Log and Trace Files from the CLI on page 381
monitor
Determines the reachability of a remote network host.
For details, see “Pinging Hosts from the CLI” on page 367.
ping
Determines the reachability of an MPLS endpoint using various options.
For details, see “MPLS Connection Checking” on page 347.
ping mpls
Tests the configuration and application of policy filters and AS path regularexpressions.
test
Traces the route to a remote network host.
For details, see “Tracing Unicast Routes from the CLI” on page 374.
traceroute
346 ■ Diagnostic Tools Overview
JUNOS Software Administration Guide
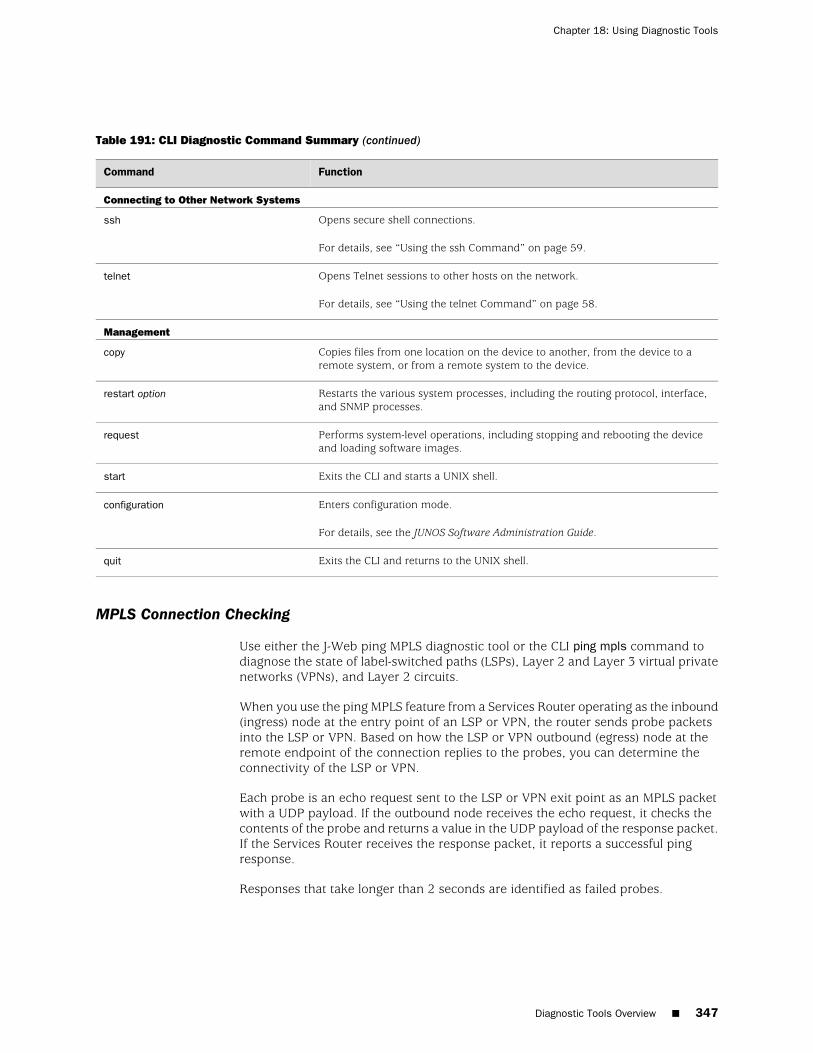
Table 191: CLI Diagnostic Command Summary (continued)
FunctionCommand
Connecting to Other Network Systems
Opens secure shell connections.
For details, see “Using the ssh Command” on page 59.
ssh
Opens Telnet sessions to other hosts on the network.
For details, see “Using the telnet Command” on page 58.
telnet
Management
Copies files from one location on the device to another, from the device to aremote system, or from a remote system to the device.
copy
Restarts the various system processes, including the routing protocol, interface,and SNMP processes.
restart option
Performs system-level operations, including stopping and rebooting the deviceand loading software images.
request
Exits the CLI and starts a UNIX shell.start
Enters configuration mode.
For details, see the JUNOS Software Administration Guide.
configuration
Exits the CLI and returns to the UNIX shell.quit
MPLS Connection Checking
Use either the J-Web ping MPLS diagnostic tool or the CLI ping mpls command todiagnose the state of label-switched paths (LSPs), Layer 2 and Layer 3 virtual privatenetworks (VPNs), and Layer 2 circuits.
When you use the ping MPLS feature from a Services Router operating as the inbound(ingress) node at the entry point of an LSP or VPN, the router sends probe packetsinto the LSP or VPN. Based on how the LSP or VPN outbound (egress) node at theremote endpoint of the connection replies to the probes, you can determine theconnectivity of the LSP or VPN.
Each probe is an echo request sent to the LSP or VPN exit point as an MPLS packetwith a UDP payload. If the outbound node receives the echo request, it checks thecontents of the probe and returns a value in the UDP payload of the response packet.If the Services Router receives the response packet, it reports a successful pingresponse.
Responses that take longer than 2 seconds are identified as failed probes.
Diagnostic Tools Overview ■ 347
Chapter 18: Using Diagnostic Tools
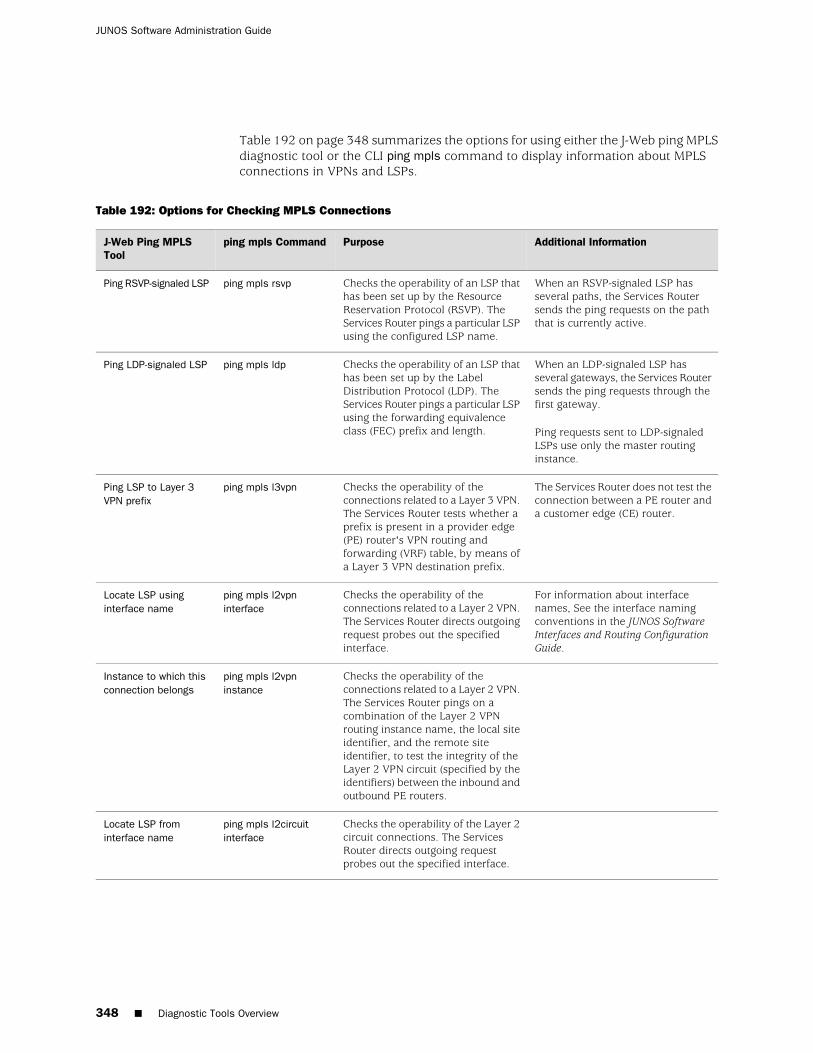
Table 192 on page 348 summarizes the options for using either the J-Web ping MPLSdiagnostic tool or the CLI ping mpls command to display information about MPLSconnections in VPNs and LSPs.
Table 192: Options for Checking MPLS Connections
Additional InformationPurposeping mpls CommandJ-Web Ping MPLSTool
When an RSVP-signaled LSP hasseveral paths, the Services Routersends the ping requests on the paththat is currently active.
Checks the operability of an LSP thathas been set up by the ResourceReservation Protocol (RSVP). TheServices Router pings a particular LSPusing the configured LSP name.
ping mpls rsvpPing RSVP-signaled LSP
When an LDP-signaled LSP hasseveral gateways, the Services Routersends the ping requests through thefirst gateway.
Ping requests sent to LDP-signaledLSPs use only the master routinginstance.
Checks the operability of an LSP thathas been set up by the LabelDistribution Protocol (LDP). TheServices Router pings a particular LSPusing the forwarding equivalenceclass (FEC) prefix and length.
ping mpls ldpPing LDP-signaled LSP
The Services Router does not test theconnection between a PE router anda customer edge (CE) router.
Checks the operability of theconnections related to a Layer 3 VPN.The Services Router tests whether aprefix is present in a provider edge(PE) router's VPN routing andforwarding (VRF) table, by means ofa Layer 3 VPN destination prefix.
ping mpls l3vpnPing LSP to Layer 3VPN prefix
For information about interfacenames, See the interface namingconventions in the JUNOS SoftwareInterfaces and Routing ConfigurationGuide.
Checks the operability of theconnections related to a Layer 2 VPN.The Services Router directs outgoingrequest probes out the specifiedinterface.
ping mpls l2vpninterface
Locate LSP usinginterface name
Checks the operability of theconnections related to a Layer 2 VPN.The Services Router pings on acombination of the Layer 2 VPNrouting instance name, the local siteidentifier, and the remote siteidentifier, to test the integrity of theLayer 2 VPN circuit (specified by theidentifiers) between the inbound andoutbound PE routers.
ping mpls l2vpninstance
Instance to which thisconnection belongs
Checks the operability of the Layer 2circuit connections. The ServicesRouter directs outgoing requestprobes out the specified interface.
ping mpls l2circuitinterface
Locate LSP frominterface name
348 ■ Diagnostic Tools Overview
JUNOS Software Administration Guide
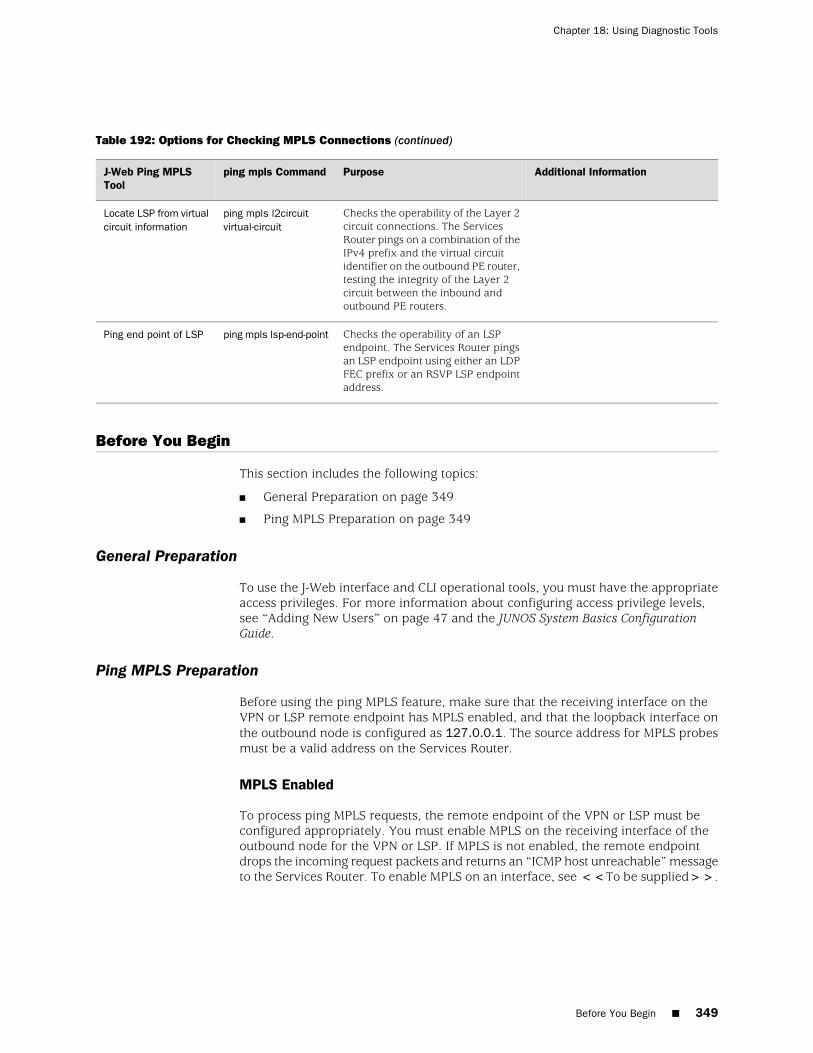
Table 192: Options for Checking MPLS Connections (continued)
Additional InformationPurposeping mpls CommandJ-Web Ping MPLSTool
Checks the operability of the Layer 2circuit connections. The ServicesRouter pings on a combination of theIPv4 prefix and the virtual circuitidentifier on the outbound PE router,testing the integrity of the Layer 2circuit between the inbound andoutbound PE routers.
ping mpls l2circuitvirtual-circuit
Locate LSP from virtualcircuit information
Checks the operability of an LSPendpoint. The Services Router pingsan LSP endpoint using either an LDPFEC prefix or an RSVP LSP endpointaddress.
ping mpls lsp-end-pointPing end point of LSP
Before You Begin
This section includes the following topics:
■ General Preparation on page 349
■ Ping MPLS Preparation on page 349
General Preparation
To use the J-Web interface and CLI operational tools, you must have the appropriateaccess privileges. For more information about configuring access privilege levels,see “Adding New Users” on page 47 and the JUNOS System Basics ConfigurationGuide.
Ping MPLS Preparation
Before using the ping MPLS feature, make sure that the receiving interface on theVPN or LSP remote endpoint has MPLS enabled, and that the loopback interface onthe outbound node is configured as 127.0.0.1. The source address for MPLS probesmust be a valid address on the Services Router.
MPLS Enabled
To process ping MPLS requests, the remote endpoint of the VPN or LSP must beconfigured appropriately. You must enable MPLS on the receiving interface of theoutbound node for the VPN or LSP. If MPLS is not enabled, the remote endpointdrops the incoming request packets and returns an “ICMP host unreachable” messageto the Services Router. To enable MPLS on an interface, see <<To be supplied>>.
Before You Begin ■ 349
Chapter 18: Using Diagnostic Tools

Loopback Address
The loopback address (lo0) on the outbound node must be configured as 127.0.0.1.If this interface address is not configured correctly, the outbound node does not havethis forwarding entry. It drops the incoming request packets and returns a “hostunreachable” message to the Services Router. If the outbound node is a ServicesRouter, see <<To be supplied>> to configure the loopback address.
Source Address for Probes
The source IP address you specify for a set of probes must be an address configuredon one of the Services Router interfaces. If it is not a valid Services Router address,the ping request fails with the error message “Can't assign requested address.”
Pinging Hosts from the J-Web Interface
This section contains the following topics:
■ Using the J-Web Ping Host Tool on page 350
■ Ping Host Results and Output Summary on page 353
Using the J-Web Ping Host Tool
You can ping a host to verify that the host can be reached over the network. Theoutput is useful for diagnosing host and network connectivity problems. The ServicesRouter sends a series of ICMP echo (ping) requests to a specified host and receivesICMP echo responses.
Alternatively, you can use the CLI ping command. (See “Pinging Hosts from theCLI” on page 367.)
To use the ping host tool:
1. Select Diagnose>Ping Host from the task bar.
2. Next to Advanced options, click the expand icon (see Figure 31 on page 351).
3. Enter information into the Ping Host page, as described in Table 193 on page 351.
The Remote Host field is the only required field.
4. Click Start.
The results of the ping operation are displayed in the main pane (seeFigure 32 on page 353). If no options are specified, each ping response is in thefollowing format:
bytes bytes from ip-address: icmp_seq=number ttl=number time=time
Table 194 on page 353 summarizes the output fields of the display.
5. To stop the ping operation before it is complete, click OK.
350 ■ Pinging Hosts from the J-Web Interface
JUNOS Software Administration Guide
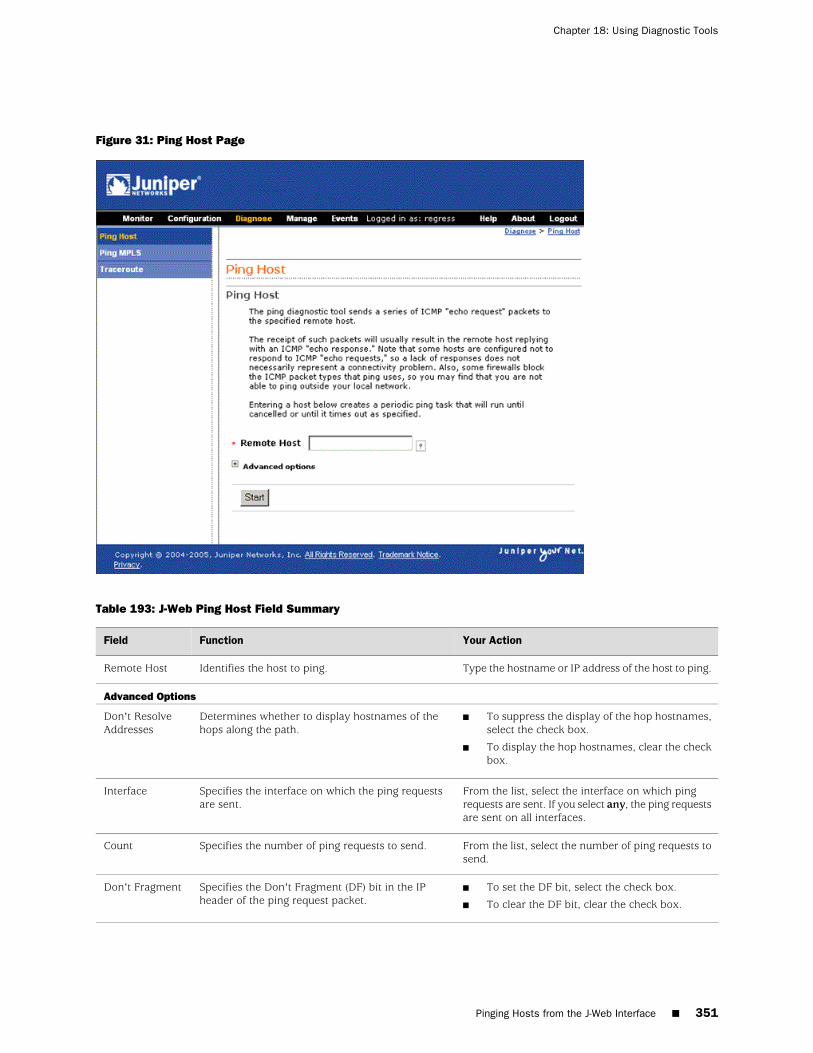
Figure 31: Ping Host Page
Table 193: J-Web Ping Host Field Summary
Your ActionFunctionField
Type the hostname or IP address of the host to ping.Identifies the host to ping.Remote Host
Advanced Options
■ To suppress the display of the hop hostnames,select the check box.
■ To display the hop hostnames, clear the checkbox.
Determines whether to display hostnames of thehops along the path.
Don't ResolveAddresses
From the list, select the interface on which pingrequests are sent. If you select any, the ping requestsare sent on all interfaces.
Specifies the interface on which the ping requestsare sent.
Interface
From the list, select the number of ping requests tosend.
Specifies the number of ping requests to send.Count
■ To set the DF bit, select the check box.
■ To clear the DF bit, clear the check box.
Specifies the Don't Fragment (DF) bit in the IPheader of the ping request packet.
Don't Fragment
Pinging Hosts from the J-Web Interface ■ 351
Chapter 18: Using Diagnostic Tools

Table 193: J-Web Ping Host Field Summary (continued)
Your ActionFunctionField
■ To record and display the path of the packet,select the check box.
■ To suppress the recording and display of thepath of the packet, clear the check box.
Sets the record route option in the IP header of theping request packet. The path of the ping requestpacket is recorded within the packet and displayedin the main pane.
Record Route
From the list, select the decimal value of the TOSfield.
Specifies the type-of-service (TOS) value in the IPheader of the ping request packet.
Type-of-Service
From the list, select the routing instance name.Name of the routing instance for the ping attempt.Routing Instance
From the list, select the interval.Specifies the interval, in seconds, between thetransmission of each ping request.
Interval
Type the size, in bytes, of the packet. The size canbe from 0 through 65468. The device adds 8 bytesof ICMP header to the size.
Specifies the size of the ping request packet.Packet Size
Type the source IP address.Specifies the source address of the ping requestpacket.
Source Address
From the list, select the TTL.Specifies the time-to-live (TTL) hop count for theping request packet.
Time-to-Live
■ To bypass the routing table and send the pingrequests to hosts on the specified interfaceonly, select the check box.
■ To route the ping requests using the routingtable, clear the check box.
Determines whether ping requests are routed bymeans of the routing table.
If the routing table is not used, ping requests aresent only to hosts on the interface specified in theInterface box. If the host is not on that interface,ping responses are not sent.
Bypass Routing
352 ■ Pinging Hosts from the J-Web Interface
JUNOS Software Administration Guide
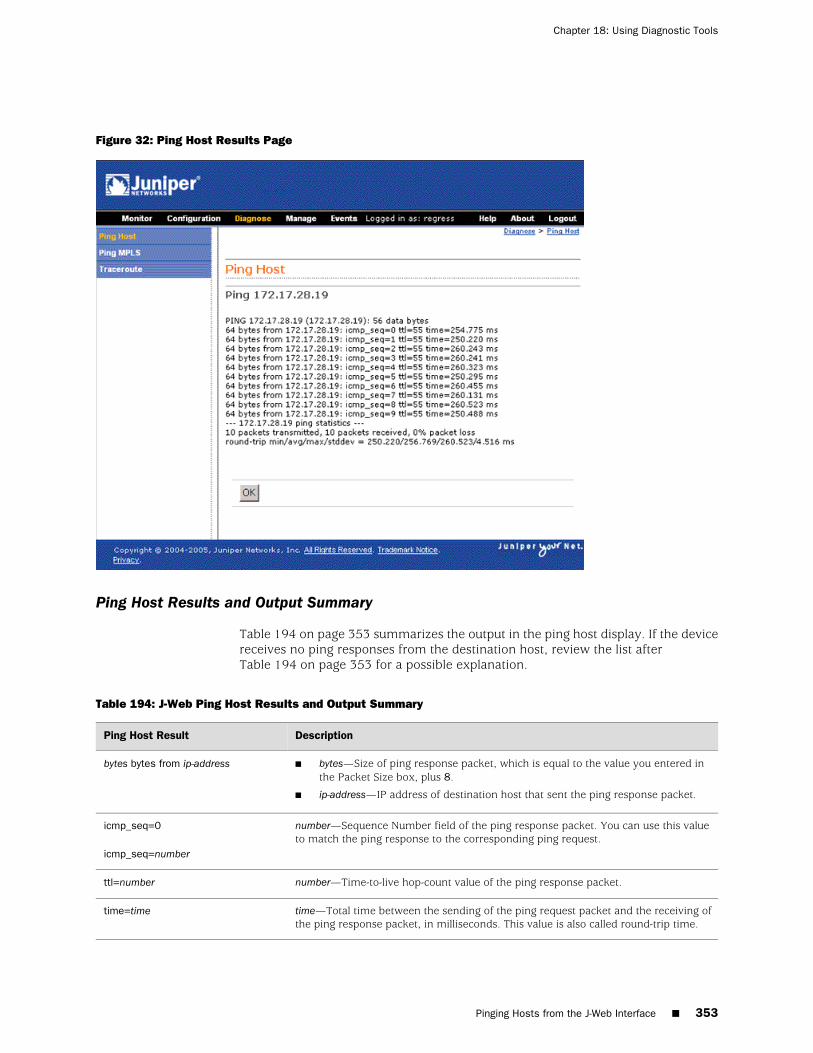
Figure 32: Ping Host Results Page
Ping Host Results and Output Summary
Table 194 on page 353 summarizes the output in the ping host display. If the devicereceives no ping responses from the destination host, review the list afterTable 194 on page 353 for a possible explanation.
Table 194: J-Web Ping Host Results and Output Summary
DescriptionPing Host Result
■ bytes—Size of ping response packet, which is equal to the value you entered inthe Packet Size box, plus 8.
■ ip-address—IP address of destination host that sent the ping response packet.
bytes bytes from ip-address
number—Sequence Number field of the ping response packet. You can use this valueto match the ping response to the corresponding ping request.
icmp_seq=0
icmp_seq=number
number—Time-to-live hop-count value of the ping response packet.ttl=number
time—Total time between the sending of the ping request packet and the receiving ofthe ping response packet, in milliseconds. This value is also called round-trip time.
time=time
Pinging Hosts from the J-Web Interface ■ 353
Chapter 18: Using Diagnostic Tools
Table 194: J-Web Ping Host Results and Output Summary (continued)
DescriptionPing Host Result
number—Number of ping requests (probes) sent to host.number packets transmitted
number—Number of ping responses received from host.number packets received
percentage—Number of ping responses divided by the number of ping requests,specified as a percentage.
percentage packet loss
■ min-time—Minimum round-trip time (see time=time field in this table).
■ avg-time—Average round-trip time.
■ max-time—Maximum round-trip time.
■ std-dev—Standard deviation of the round-trip times.
round-trip min/avg/max/stddev =min-time/avg-time/max-time/std-devms
If the device does not receive ping responses from the destination host (the outputshows a packet loss of 100 percent), one of the following explanations might apply:
■ The host is not operational.
■ There are network connectivity problems between the device and the host.
■ The host might be configured to ignore ICMP echo requests.
■ The host might be configured with a firewall filter that blocks ICMP echo requestsor ICMP echo responses.
■ The size of the ICMP echo request packet exceeds the MTU of a host along thepath.
■ The value you selected in the Time-to-Live box was less than the number of hopsin the path to the host, in which case the host might reply with an ICMP errormessage.
For more information about ICMP, see RFC 792, Internet Control Message Protocol.
Checking MPLS Connections from the J-Web Interface
Use the J-Web ping MPLS diagnostic tool to diagnose the state of label-switched paths(LSPs), Layer 2 and Layer 3 VPNs, and Layer 2 circuits.
Alternatively, you can use the CLI commands ping mpls, ping mpls l2circuit, ping mplsl2vpn, and ping mpls l3vpn. For more information, see “Pinging Hosts from theCLI” on page 367.
Before using the J-Web ping MPLS tool in your network, read “Ping MPLSPreparation” on page 349.
This section contains the following topics:
■ Using the J-Web Ping MPLS Tool on page 355
■ Ping MPLS Results and Output on page 358
354 ■ Checking MPLS Connections from the J-Web Interface
JUNOS Software Administration Guide
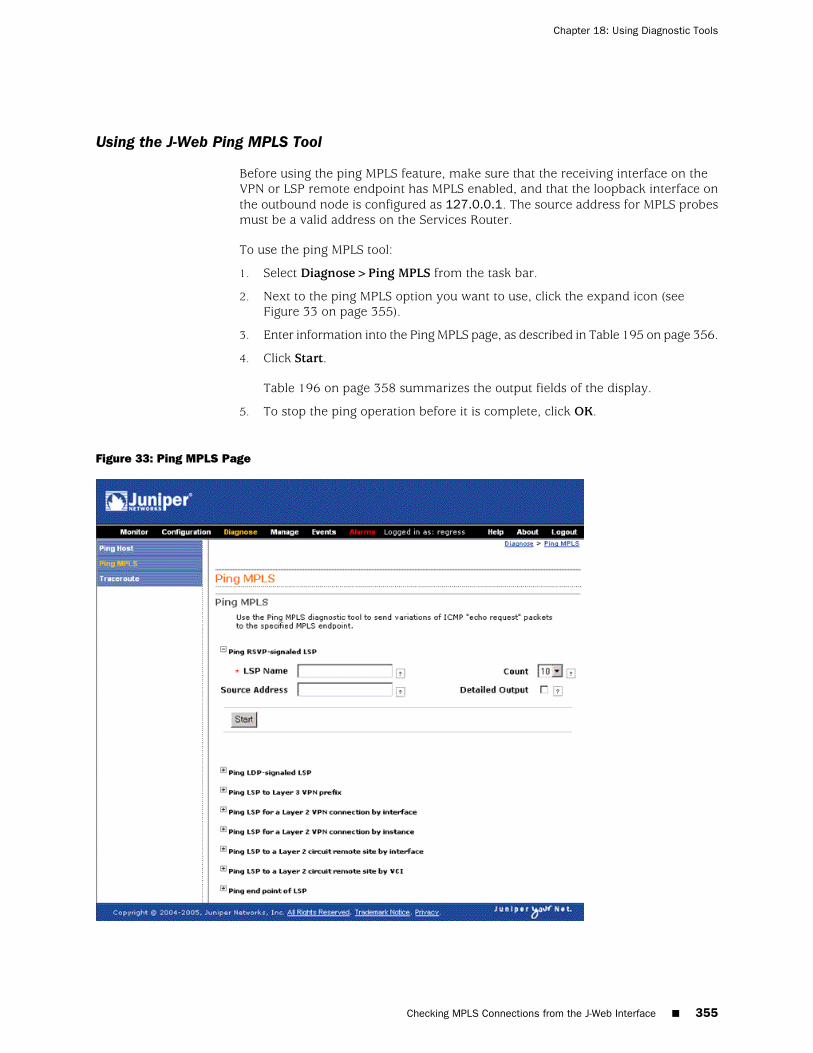
Using the J-Web Ping MPLS Tool
Before using the ping MPLS feature, make sure that the receiving interface on theVPN or LSP remote endpoint has MPLS enabled, and that the loopback interface onthe outbound node is configured as 127.0.0.1. The source address for MPLS probesmust be a valid address on the Services Router.
To use the ping MPLS tool:
1. Select Diagnose>Ping MPLS from the task bar.
2. Next to the ping MPLS option you want to use, click the expand icon (seeFigure 33 on page 355).
3. Enter information into the Ping MPLS page, as described in Table 195 on page 356.
4. Click Start.
Table 196 on page 358 summarizes the output fields of the display.
5. To stop the ping operation before it is complete, click OK.
Figure 33: Ping MPLS Page
Checking MPLS Connections from the J-Web Interface ■ 355
Chapter 18: Using Diagnostic Tools

Table 195: J-Web Ping MPLS Field Summary
Your ActionFunctionField
Ping RSVP-signaled LSP
Type the name of the LSP to ping.Identifies the LSP to ping.LSP Name
Type the source IP address—a valid addressconfigured on a Services Router interface.
Specifies the source address of the ping requestpacket.
Source Address
From the list, select the number of ping requests tosend. The default is 5 requests.
Specifies the number of ping requests to send.Count
Select the check box to display detailed output.Requests the display of extensive rather than briefping output.
Detailed Output
Ping LDP-signaled LSP
Type the forwarding equivalence class (FEC) prefixand length of the LSP to ping.
Identifies the LSP to ping.FEC Prefix
Type the source IP address—a valid addressconfigured on a Services Router interface.
Specifies the source address of the ping requestpacket.
Source Address
From the list, select the number of ping requests tosend. The default is 5 requests.
Specifies the number of ping requests to send.Count
Select the check box to display detailed output.Requests the display of extensive rather than briefping output.
Detailed Output
Ping LSP to Layer 3 VPN prefix
Type the name of the VPN to ping.Identifies the Layer 3 VPN to ping.Layer 3 VPNName
From the list, select the number of ping requests tosend. The default is 5 requests.
Specifies the number of ping requests to send.Count
Select the check box to display detailed output.Requests the display of extensive rather than briefping output.
Detailed Output
Type the IP address prefix and length of the VPN toping.
Identifies the IP address prefix and length of theLayer 3 VPN to ping.
VPN Prefix
Type the source IP address—a valid addressconfigured on a Services Router interface.
Specifies the source address of the ping requestpacket.
Source Address
Locate LSP using interface name
From the list, select the Services Router interfaceon which ping requests are sent. If you select any,the ping requests are sent on all interfaces.
Specifies the interface on which the ping requestsare sent.
(See the interface naming conventions in the JUNOSSoftware Interfaces and Routing Configuration Guide.)
Interface
Type the source IP address—a valid addressconfigured on a Services Router interface.
Specifies the source address of the ping requestpacket.
Source Address
From the list, select the number of ping requests tosend. The default is 5 requests.
Specifies the number of ping requests to send.Count
356 ■ Checking MPLS Connections from the J-Web Interface
JUNOS Software Administration Guide

Table 195: J-Web Ping MPLS Field Summary (continued)
Your ActionFunctionField
Select the check box to display detailed output.Requests the display of extensive rather than briefping output.
Detailed Output
Instance to which this connection belongs
Type the name of the VPN to ping.Identifies the Layer 2 VPN to ping.Layer 2VPNName
Type the remote site identifier for the VPN.Specifies the remote site identifier of the Layer 2VPN to ping.
Remote SiteIdentifier
Type the source IP address—a valid addressconfigured on a Services Router interface.
Specifies the source address of the ping requestpacket.
Source Address
Type the local site identifier for the VPN.Specifies the local site identifier of the Layer 2 VPNto ping.
Local SiteIdentifier
From the list, select the number of ping requests tosend. The default is 5 requests.
Specifies the number of ping requests to send.Count
Select the check box to display detailed output.Requests the display of extensive rather than briefping output.
Detailed Output
Locate LSP from interface name
From the list, select the Services Router interfaceon which ping requests are sent. If you select any,the ping requests are sent on all interfaces.
Specifies the interface on which the ping requestsare sent.
Interface
Type the source IP address—a valid addressconfigured on a Services Router interface.
Specifies the source address of the ping requestpacket.
Source Address
From the list, select the number of ping requests tosend. The default is 5 requests.
Specifies the number of ping requests to send.Count
Select the check box to display detailed output.Requests the display of extensive rather than briefping output.
Detailed Output
Locate LSP from virtual circuit information
Type the IP address of the remote neighbor withinthe virtual circuit.
Identifies the remote neighbor (PE router) withinthe virtual circuit to ping.
RemoteNeighbor
Type the virtual circuit identifier for the Layer 2circuit.
Specifies the virtual circuit identifier for the Layer 2circuit to ping.
Circuit Identifier
Type the source IP address—a valid addressconfigured on a Services Router interface.
Specifies the source address of the ping requestpacket.
Source Address
From the list, select the number of ping requests tosend.
Specifies the number of ping requests to send.Count
Select the check box to display detailed output.Requests the display of extensive rather than briefping output.
Detailed Output
Ping end point of LSP
Checking MPLS Connections from the J-Web Interface ■ 357
Chapter 18: Using Diagnostic Tools
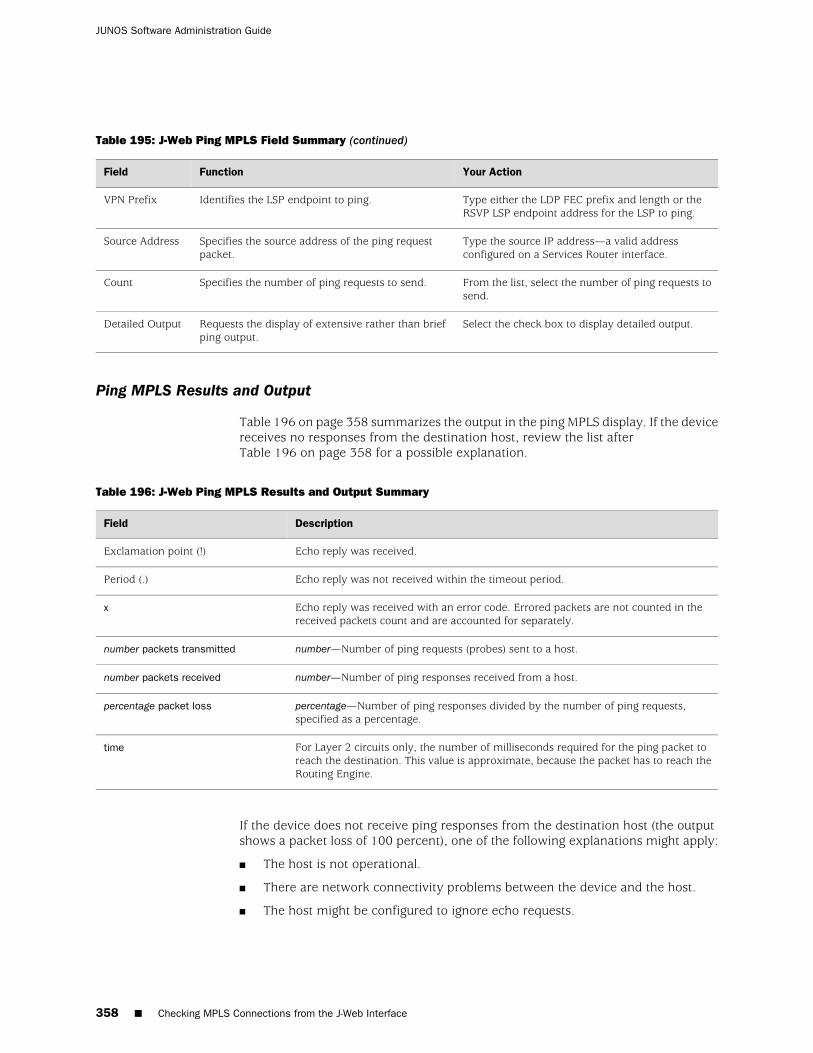
Table 195: J-Web Ping MPLS Field Summary (continued)
Your ActionFunctionField
Type either the LDP FEC prefix and length or theRSVP LSP endpoint address for the LSP to ping.
Identifies the LSP endpoint to ping.VPN Prefix
Type the source IP address—a valid addressconfigured on a Services Router interface.
Specifies the source address of the ping requestpacket.
Source Address
From the list, select the number of ping requests tosend.
Specifies the number of ping requests to send.Count
Select the check box to display detailed output.Requests the display of extensive rather than briefping output.
Detailed Output
Ping MPLS Results and Output
Table 196 on page 358 summarizes the output in the ping MPLS display. If the devicereceives no responses from the destination host, review the list afterTable 196 on page 358 for a possible explanation.
Table 196: J-Web Ping MPLS Results and Output Summary
DescriptionField
Echo reply was received.Exclamation point (!)
Echo reply was not received within the timeout period.Period (.)
Echo reply was received with an error code. Errored packets are not counted in thereceived packets count and are accounted for separately.
x
number—Number of ping requests (probes) sent to a host.number packets transmitted
number—Number of ping responses received from a host.number packets received
percentage—Number of ping responses divided by the number of ping requests,specified as a percentage.
percentage packet loss
For Layer 2 circuits only, the number of milliseconds required for the ping packet toreach the destination. This value is approximate, because the packet has to reach theRouting Engine.
time
If the device does not receive ping responses from the destination host (the outputshows a packet loss of 100 percent), one of the following explanations might apply:
■ The host is not operational.
■ There are network connectivity problems between the device and the host.
■ The host might be configured to ignore echo requests.
358 ■ Checking MPLS Connections from the J-Web Interface
JUNOS Software Administration Guide

■ The host might be configured with a firewall filter that blocks echo requests orecho responses.
■ The size of the echo request packet exceeds the MTU of a host along the path.
■ The outbound node at the remote endpoint is not configured to handle MPLSpackets.
■ The remote endpoint's loopback address is not configured to 127.0.0.1.
Tracing Unicast Routes from the J-Web Interface
You can use the traceroute diagnostic tool to display a list of routers between thedevice and a specified destination host. The output is useful for diagnosing a pointof failure in the path from the device to the destination host, and addressing networktraffic latency and throughput problems.
The device generates the list of routers by sending a series of ICMP traceroute packetsin which the time-to-live (TTL) value in the messages sent to each successive routeris incremented by 1. (The TTL value of the first traceroute packet is set to 1.) In thismanner, each router along the path to the destination host replies with a TimeExceeded packet from which the source IP address can be obtained.
Alternatively, you can use the CLI traceroute command to generate the list.
This section contains the following topics:
■ Using the J-Web Traceroute Tool on page 359
■ Traceroute Results and Output Summary on page 361
Using the J-Web Traceroute Tool
To use the traceroute tool:
1. Select Diagnose>Traceroute.
2. Next to Advanced options, click the expand icon (see Figure 34 on page 360).
3. Enter information into the Traceroute page, as described in Table 197 on page 360.
The Remote Host field is the only required field.
4. Click Start.
The results of the traceroute operation are displayed in the main pane. If nooptions are specified, each line of the traceroute display is in the following format:
hop-number host (ip-address) [as-number]time1 time2 time3
The device sends a total of three traceroute packets to each router along the pathand displays the round-trip time for each traceroute operation. If the device timesout before receiving a Time Exceeded message, an asterisk (*) is displayed forthat round-trip time.
Tracing Unicast Routes from the J-Web Interface ■ 359
Chapter 18: Using Diagnostic Tools
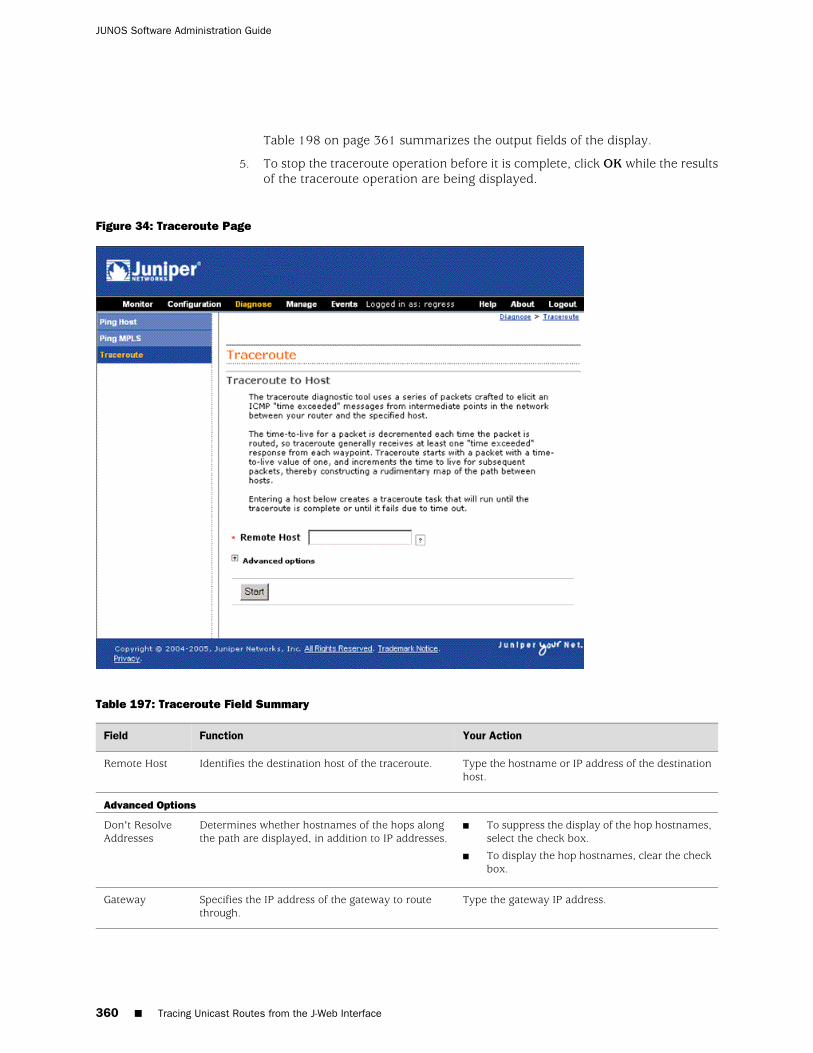
Table 198 on page 361 summarizes the output fields of the display.
5. To stop the traceroute operation before it is complete, click OK while the resultsof the traceroute operation are being displayed.
Figure 34: Traceroute Page
Table 197: Traceroute Field Summary
Your ActionFunctionField
Type the hostname or IP address of the destinationhost.
Identifies the destination host of the traceroute.Remote Host
Advanced Options
■ To suppress the display of the hop hostnames,select the check box.
■ To display the hop hostnames, clear the checkbox.
Determines whether hostnames of the hops alongthe path are displayed, in addition to IP addresses.
Don't ResolveAddresses
Type the gateway IP address.Specifies the IP address of the gateway to routethrough.
Gateway
360 ■ Tracing Unicast Routes from the J-Web Interface
JUNOS Software Administration Guide
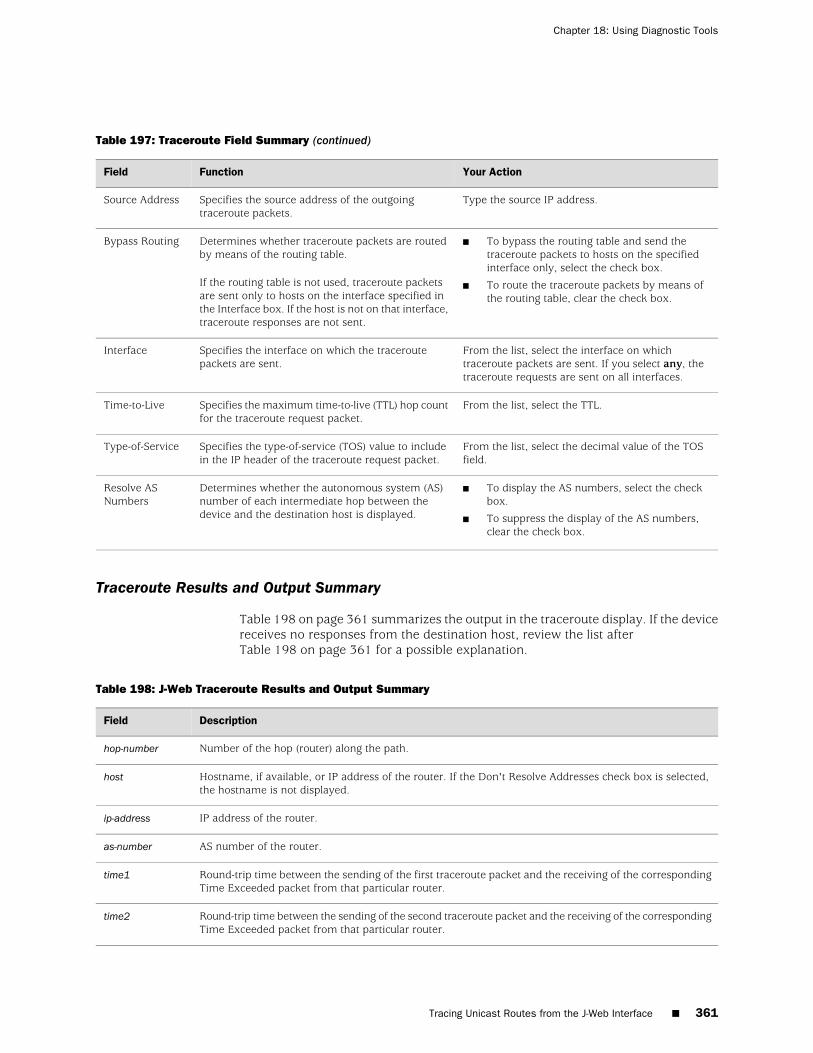
Table 197: Traceroute Field Summary (continued)
Your ActionFunctionField
Type the source IP address.Specifies the source address of the outgoingtraceroute packets.
Source Address
■ To bypass the routing table and send thetraceroute packets to hosts on the specifiedinterface only, select the check box.
■ To route the traceroute packets by means ofthe routing table, clear the check box.
Determines whether traceroute packets are routedby means of the routing table.
If the routing table is not used, traceroute packetsare sent only to hosts on the interface specified inthe Interface box. If the host is not on that interface,traceroute responses are not sent.
Bypass Routing
From the list, select the interface on whichtraceroute packets are sent. If you select any, thetraceroute requests are sent on all interfaces.
Specifies the interface on which the traceroutepackets are sent.
Interface
From the list, select the TTL.Specifies the maximum time-to-live (TTL) hop countfor the traceroute request packet.
Time-to-Live
From the list, select the decimal value of the TOSfield.
Specifies the type-of-service (TOS) value to includein the IP header of the traceroute request packet.
Type-of-Service
■ To display the AS numbers, select the checkbox.
■ To suppress the display of the AS numbers,clear the check box.
Determines whether the autonomous system (AS)number of each intermediate hop between thedevice and the destination host is displayed.
Resolve ASNumbers
Traceroute Results and Output Summary
Table 198 on page 361 summarizes the output in the traceroute display. If the devicereceives no responses from the destination host, review the list afterTable 198 on page 361 for a possible explanation.
Table 198: J-Web Traceroute Results and Output Summary
DescriptionField
Number of the hop (router) along the path.hop-number
Hostname, if available, or IP address of the router. If the Don't Resolve Addresses check box is selected,the hostname is not displayed.
host
IP address of the router.ip-address
AS number of the router.as-number
Round-trip time between the sending of the first traceroute packet and the receiving of the correspondingTime Exceeded packet from that particular router.
time1
Round-trip time between the sending of the second traceroute packet and the receiving of the correspondingTime Exceeded packet from that particular router.
time2
Tracing Unicast Routes from the J-Web Interface ■ 361
Chapter 18: Using Diagnostic Tools

Table 198: J-Web Traceroute Results and Output Summary (continued)
DescriptionField
Round-trip time between the sending of the third traceroute packet and the receiving of the correspondingTime Exceeded packet from that particular router.
time3
If the device does not display the complete path to the destination host, one of thefollowing explanations might apply:
■ The host is not operational.
■ There are network connectivity problems between the device and the host.
■ The host, or a router along the path, might be configured to ignore ICMPtraceroute messages.
■ The host, or a router along the path, might be configured with a firewall filterthat blocks ICMP traceroute requests or ICMP time exceeded responses.
■ The value you selected in the Time Exceeded box was less than the number ofhops in the path to the host. In this case, the host might reply with an ICMP errormessage.
For more information about ICMP, see RFC 792, Internet Control Message Protocol.
Capturing and Viewing Packets with the J-Web Interface
You can use the J-Web packet capture diagnostic tool when you need to quicklycapture and analyze router control traffic on a device. Packet capture on the J-Webinterface allows you to capture traffic destined for or originating from the RoutingEngine. You can use J-Web packet capture to compose expressions with variousmatching criteria to specify the packets that you want to capture. You can eitherchoose to decode and view the captured packets in the J-Web interface as they arecaptured, or save the captured packets to a file and analyze them offline using packetanalyzers such as Ethereal. J-Web packet capture does not capture transient traffic.
Alternatively you can use the CLI monitor traffic command to capture and displaypackets matching a specific criteria. For details, see “Using the monitor trafficCommand” on page 383.
To capture transient traffic and entire IPv4 data packets for offline analysis, you mustconfigure packet capture with the J-Web or CLI configuration editor. For details, see“Configuring Packet Capture” on page 389.
This section contains the following topics:
■ Using J-Web Packet Capture on page 362
■ Packet Capture Results and Output Summary on page 366
Using J-Web Packet Capture
To use J-Web packet capture:
362 ■ Capturing and Viewing Packets with the J-Web Interface
JUNOS Software Administration Guide

1. Select Diagnose>Packet Capture.
2. Enter information into the Packet Capture page (Figure 35 on page 363) asdescribed in Table 199 on page 364.
The sample configuration in Table 199 on page 364 captures the next 10 TCPpackets originating from the IP address 10.1.40.48 on port 23 and passingthrough the Gigabit Ethernet interface ge-0/0/0.
3. To save the captured packets to a file, or specify other advanced options, clickthe expand icon next to Advanced options, and enter information as describedin Table 199 on page 364.
4. Click Start.
The captured packet headers are decoded and displayed in the Packet Capturedisplay (see Figure 36 on page 366).
Table 200 on page 366 summarizes the output fields of the display.
5. Do one of the following:
■ To stop capturing the packets and stay on the same page while the decodedpacket headers are being displayed, click Stop Capturing.
■ To stop capturing packets and return to the Packet Capture page, click OK.
Figure 35: Packet Capture Page
Capturing and Viewing Packets with the J-Web Interface ■ 363
Chapter 18: Using Diagnostic Tools
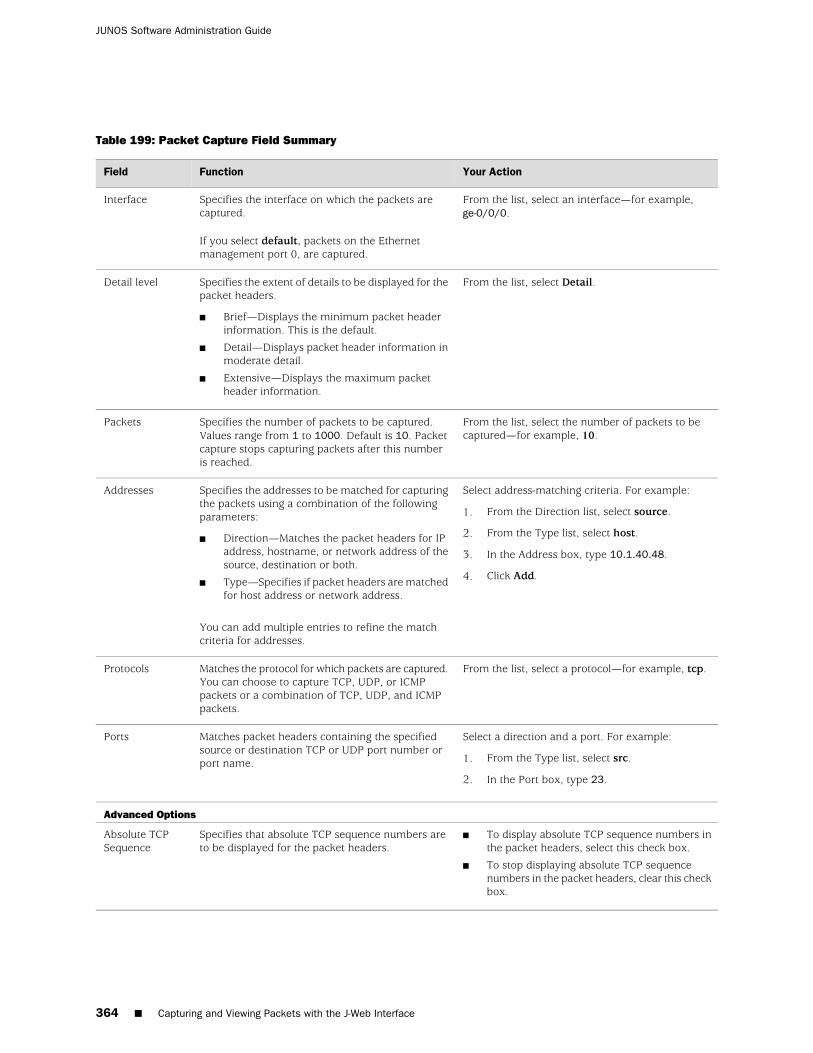
Table 199: Packet Capture Field Summary
Your ActionFunctionField
From the list, select an interface—for example,ge-0/0/0.
Specifies the interface on which the packets arecaptured.
If you select default, packets on the Ethernetmanagement port 0, are captured.
Interface
From the list, select Detail.Specifies the extent of details to be displayed for thepacket headers.
■ Brief—Displays the minimum packet headerinformation. This is the default.
■ Detail—Displays packet header information inmoderate detail.
■ Extensive—Displays the maximum packetheader information.
Detail level
From the list, select the number of packets to becaptured—for example, 10.
Specifies the number of packets to be captured.Values range from 1 to 1000. Default is 10. Packetcapture stops capturing packets after this numberis reached.
Packets
Select address-matching criteria. For example:
1. From the Direction list, select source.
2. From the Type list, select host.
3. In the Address box, type 10.1.40.48.
4. Click Add.
Specifies the addresses to be matched for capturingthe packets using a combination of the followingparameters:
■ Direction—Matches the packet headers for IPaddress, hostname, or network address of thesource, destination or both.
■ Type—Specifies if packet headers are matchedfor host address or network address.
You can add multiple entries to refine the matchcriteria for addresses.
Addresses
From the list, select a protocol—for example, tcp.Matches the protocol for which packets are captured.You can choose to capture TCP, UDP, or ICMPpackets or a combination of TCP, UDP, and ICMPpackets.
Protocols
Select a direction and a port. For example:
1. From the Type list, select src.
2. In the Port box, type 23.
Matches packet headers containing the specifiedsource or destination TCP or UDP port number orport name.
Ports
Advanced Options
■ To display absolute TCP sequence numbers inthe packet headers, select this check box.
■ To stop displaying absolute TCP sequencenumbers in the packet headers, clear this checkbox.
Specifies that absolute TCP sequence numbers areto be displayed for the packet headers.
Absolute TCPSequence
364 ■ Capturing and Viewing Packets with the J-Web Interface
JUNOS Software Administration Guide
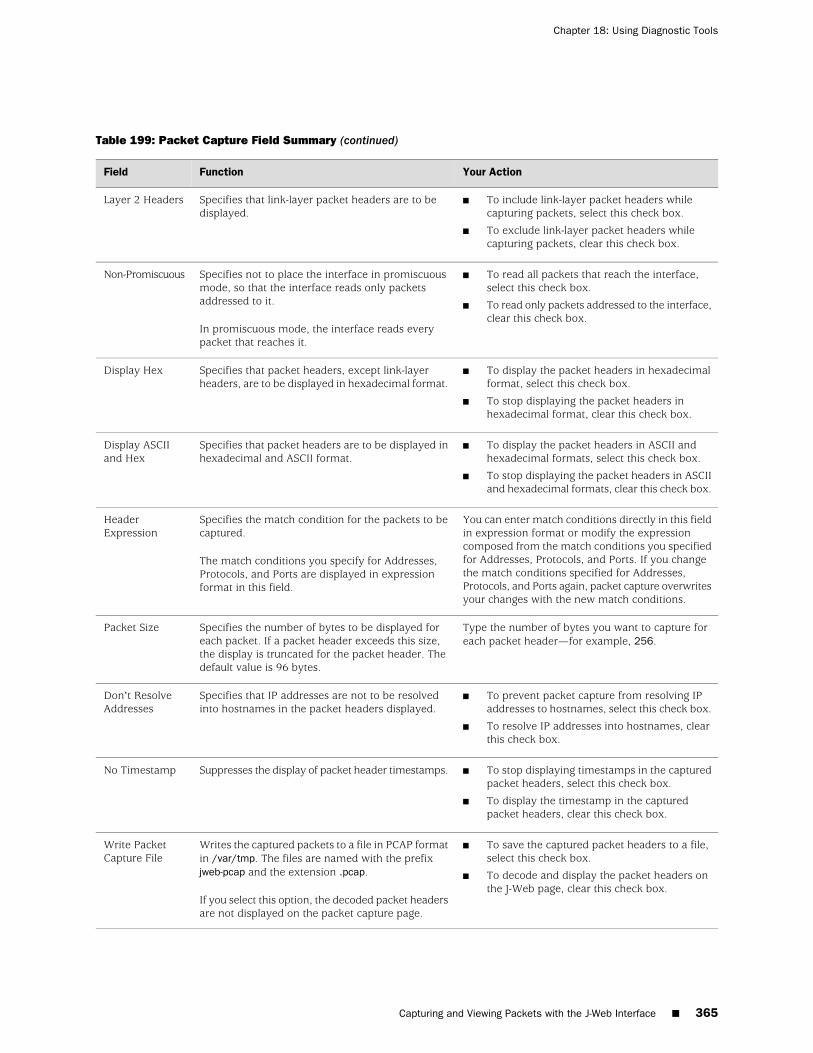
Table 199: Packet Capture Field Summary (continued)
Your ActionFunctionField
■ To include link-layer packet headers whilecapturing packets, select this check box.
■ To exclude link-layer packet headers whilecapturing packets, clear this check box.
Specifies that link-layer packet headers are to bedisplayed.
Layer 2 Headers
■ To read all packets that reach the interface,select this check box.
■ To read only packets addressed to the interface,clear this check box.
Specifies not to place the interface in promiscuousmode, so that the interface reads only packetsaddressed to it.
In promiscuous mode, the interface reads everypacket that reaches it.
Non-Promiscuous
■ To display the packet headers in hexadecimalformat, select this check box.
■ To stop displaying the packet headers inhexadecimal format, clear this check box.
Specifies that packet headers, except link-layerheaders, are to be displayed in hexadecimal format.
Display Hex
■ To display the packet headers in ASCII andhexadecimal formats, select this check box.
■ To stop displaying the packet headers in ASCIIand hexadecimal formats, clear this check box.
Specifies that packet headers are to be displayed inhexadecimal and ASCII format.
Display ASCIIand Hex
You can enter match conditions directly in this fieldin expression format or modify the expressioncomposed from the match conditions you specifiedfor Addresses, Protocols, and Ports. If you changethe match conditions specified for Addresses,Protocols, and Ports again, packet capture overwritesyour changes with the new match conditions.
Specifies the match condition for the packets to becaptured.
The match conditions you specify for Addresses,Protocols, and Ports are displayed in expressionformat in this field.
HeaderExpression
Type the number of bytes you want to capture foreach packet header—for example, 256.
Specifies the number of bytes to be displayed foreach packet. If a packet header exceeds this size,the display is truncated for the packet header. Thedefault value is 96 bytes.
Packet Size
■ To prevent packet capture from resolving IPaddresses to hostnames, select this check box.
■ To resolve IP addresses into hostnames, clearthis check box.
Specifies that IP addresses are not to be resolvedinto hostnames in the packet headers displayed.
Don't ResolveAddresses
■ To stop displaying timestamps in the capturedpacket headers, select this check box.
■ To display the timestamp in the capturedpacket headers, clear this check box.
Suppresses the display of packet header timestamps.No Timestamp
■ To save the captured packet headers to a file,select this check box.
■ To decode and display the packet headers onthe J-Web page, clear this check box.
Writes the captured packets to a file in PCAP formatin /var/tmp. The files are named with the prefixjweb-pcap and the extension .pcap.
If you select this option, the decoded packet headersare not displayed on the packet capture page.
Write PacketCapture File
Capturing and Viewing Packets with the J-Web Interface ■ 365
Chapter 18: Using Diagnostic Tools
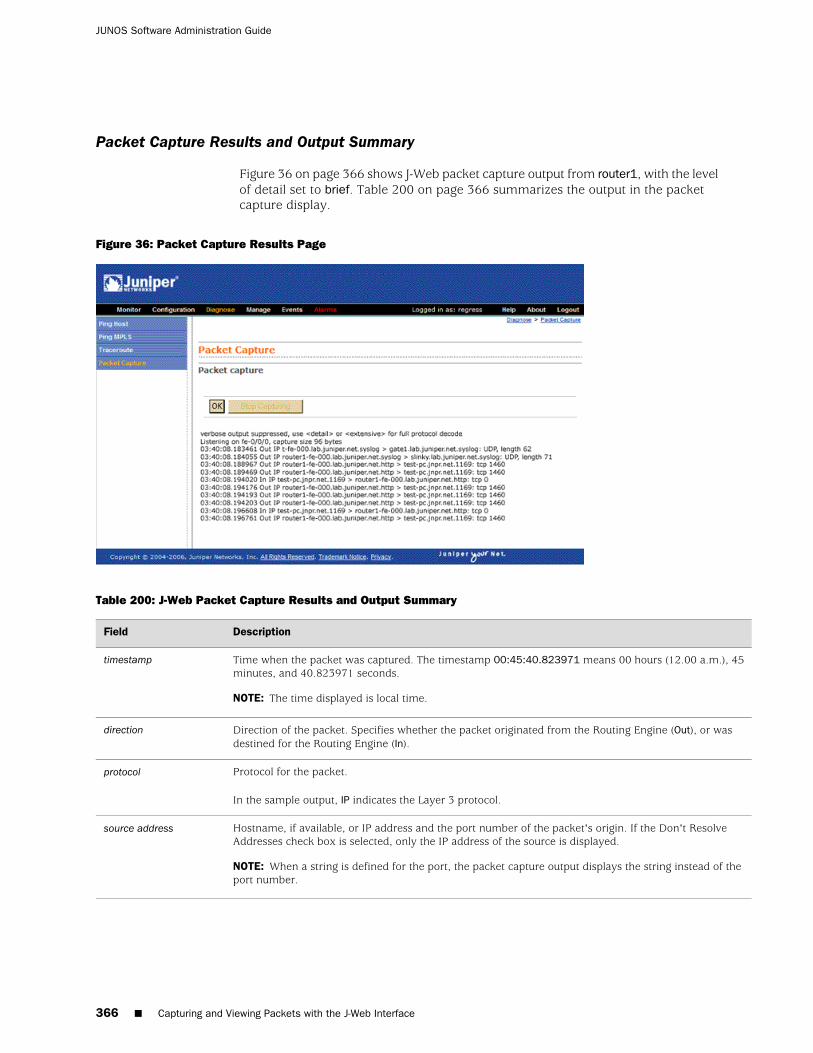
Packet Capture Results and Output Summary
Figure 36 on page 366 shows J-Web packet capture output from router1, with the levelof detail set to brief. Table 200 on page 366 summarizes the output in the packetcapture display.
Figure 36: Packet Capture Results Page
Table 200: J-Web Packet Capture Results and Output Summary
DescriptionField
Time when the packet was captured. The timestamp 00:45:40.823971 means 00 hours (12.00 a.m.), 45minutes, and 40.823971 seconds.
NOTE: The time displayed is local time.
timestamp
Direction of the packet. Specifies whether the packet originated from the Routing Engine (Out), or wasdestined for the Routing Engine (In).
direction
Protocol for the packet.
In the sample output, IP indicates the Layer 3 protocol.
protocol
Hostname, if available, or IP address and the port number of the packet's origin. If the Don't ResolveAddresses check box is selected, only the IP address of the source is displayed.
NOTE: When a string is defined for the port, the packet capture output displays the string instead of theport number.
source address
366 ■ Capturing and Viewing Packets with the J-Web Interface
JUNOS Software Administration Guide
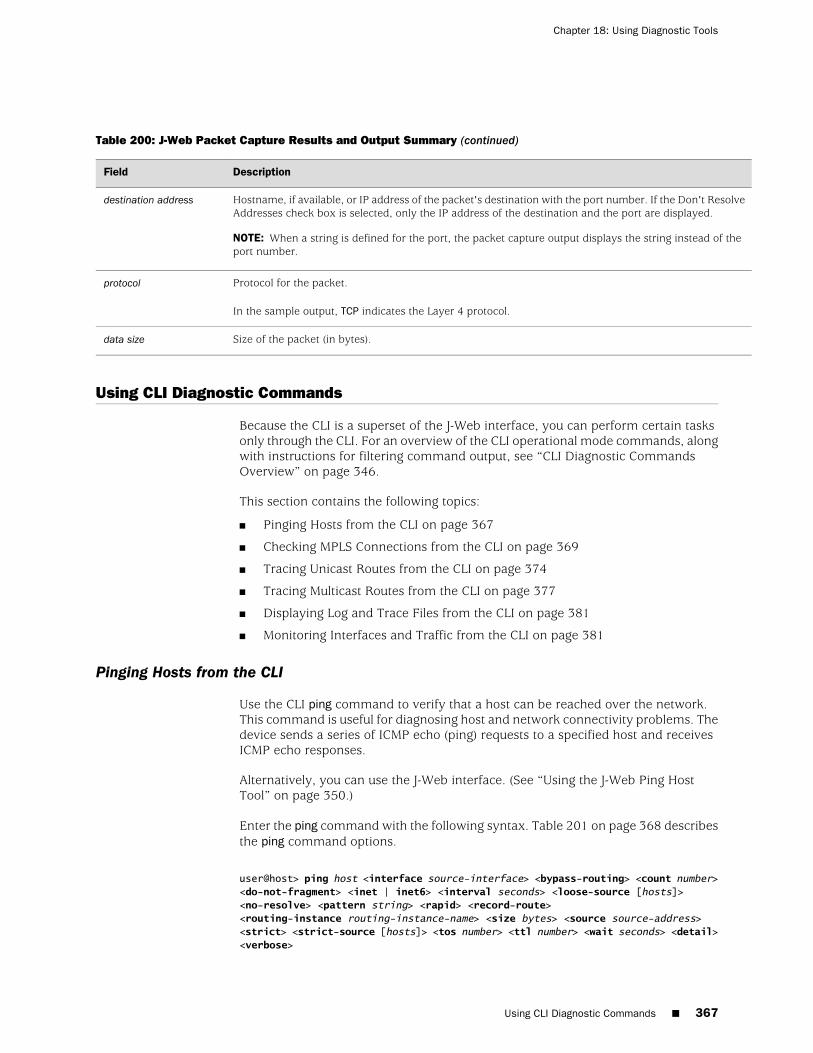
Table 200: J-Web Packet Capture Results and Output Summary (continued)
DescriptionField
Hostname, if available, or IP address of the packet's destination with the port number. If the Don't ResolveAddresses check box is selected, only the IP address of the destination and the port are displayed.
NOTE: When a string is defined for the port, the packet capture output displays the string instead of theport number.
destination address
Protocol for the packet.
In the sample output, TCP indicates the Layer 4 protocol.
protocol
Size of the packet (in bytes).data size
Using CLI Diagnostic Commands
Because the CLI is a superset of the J-Web interface, you can perform certain tasksonly through the CLI. For an overview of the CLI operational mode commands, alongwith instructions for filtering command output, see “CLI Diagnostic CommandsOverview” on page 346.
This section contains the following topics:
■ Pinging Hosts from the CLI on page 367
■ Checking MPLS Connections from the CLI on page 369
■ Tracing Unicast Routes from the CLI on page 374
■ Tracing Multicast Routes from the CLI on page 377
■ Displaying Log and Trace Files from the CLI on page 381
■ Monitoring Interfaces and Traffic from the CLI on page 381
Pinging Hosts from the CLI
Use the CLI ping command to verify that a host can be reached over the network.This command is useful for diagnosing host and network connectivity problems. Thedevice sends a series of ICMP echo (ping) requests to a specified host and receivesICMP echo responses.
Alternatively, you can use the J-Web interface. (See “Using the J-Web Ping HostTool” on page 350.)
Enter the ping command with the following syntax. Table 201 on page 368 describesthe ping command options.
user@host> ping host <interface source-interface> <bypass-routing> <count number><do-not-fragment> <inet | inet6> <interval seconds> <loose-source [hosts]><no-resolve> <pattern string> <rapid> <record-route><routing-instance routing-instance-name> <size bytes> <source source-address><strict> <strict-source [hosts]> <tos number> <ttl number> <wait seconds> <detail><verbose>
Using CLI Diagnostic Commands ■ 367
Chapter 18: Using Diagnostic Tools
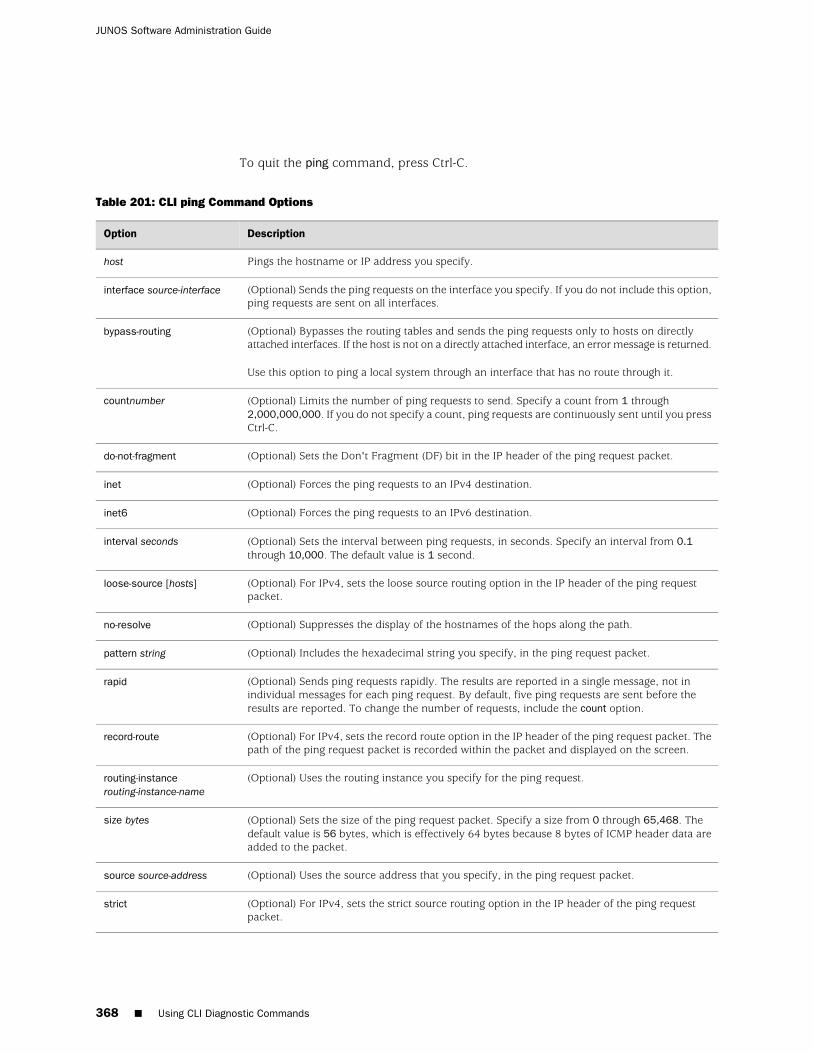
To quit the ping command, press Ctrl-C.
Table 201: CLI ping Command Options
DescriptionOption
Pings the hostname or IP address you specify.host
(Optional) Sends the ping requests on the interface you specify. If you do not include this option,ping requests are sent on all interfaces.
interface source-interface
(Optional) Bypasses the routing tables and sends the ping requests only to hosts on directlyattached interfaces. If the host is not on a directly attached interface, an error message is returned.
Use this option to ping a local system through an interface that has no route through it.
bypass-routing
(Optional) Limits the number of ping requests to send. Specify a count from 1 through2,000,000,000. If you do not specify a count, ping requests are continuously sent until you pressCtrl-C.
countnumber
(Optional) Sets the Don't Fragment (DF) bit in the IP header of the ping request packet.do-not-fragment
(Optional) Forces the ping requests to an IPv4 destination.inet
(Optional) Forces the ping requests to an IPv6 destination.inet6
(Optional) Sets the interval between ping requests, in seconds. Specify an interval from 0.1through 10,000. The default value is 1 second.
interval seconds
(Optional) For IPv4, sets the loose source routing option in the IP header of the ping requestpacket.
loose-source [hosts]
(Optional) Suppresses the display of the hostnames of the hops along the path.no-resolve
(Optional) Includes the hexadecimal string you specify, in the ping request packet.pattern string
(Optional) Sends ping requests rapidly. The results are reported in a single message, not inindividual messages for each ping request. By default, five ping requests are sent before theresults are reported. To change the number of requests, include the count option.
rapid
(Optional) For IPv4, sets the record route option in the IP header of the ping request packet. Thepath of the ping request packet is recorded within the packet and displayed on the screen.
record-route
(Optional) Uses the routing instance you specify for the ping request.routing-instancerouting-instance-name
(Optional) Sets the size of the ping request packet. Specify a size from 0 through 65,468. Thedefault value is 56 bytes, which is effectively 64 bytes because 8 bytes of ICMP header data areadded to the packet.
size bytes
(Optional) Uses the source address that you specify, in the ping request packet.source source-address
(Optional) For IPv4, sets the strict source routing option in the IP header of the ping requestpacket.
strict
368 ■ Using CLI Diagnostic Commands
JUNOS Software Administration Guide
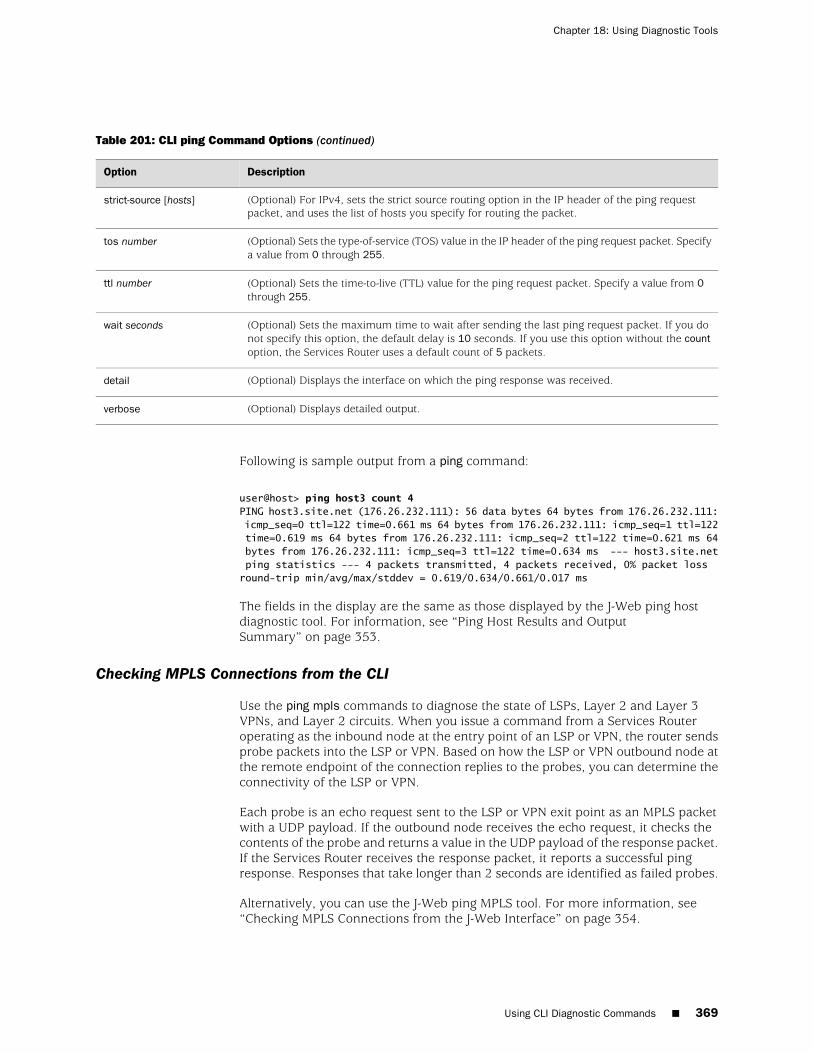
Table 201: CLI ping Command Options (continued)
DescriptionOption
(Optional) For IPv4, sets the strict source routing option in the IP header of the ping requestpacket, and uses the list of hosts you specify for routing the packet.
strict-source [hosts]
(Optional) Sets the type-of-service (TOS) value in the IP header of the ping request packet. Specifya value from 0 through 255.
tos number
(Optional) Sets the time-to-live (TTL) value for the ping request packet. Specify a value from 0through 255.
ttl number
(Optional) Sets the maximum time to wait after sending the last ping request packet. If you donot specify this option, the default delay is 10 seconds. If you use this option without the countoption, the Services Router uses a default count of 5 packets.
wait seconds
(Optional) Displays the interface on which the ping response was received.detail
(Optional) Displays detailed output.verbose
Following is sample output from a ping command:
user@host> ping host3 count 4PING host3.site.net (176.26.232.111): 56 data bytes 64 bytes from 176.26.232.111: icmp_seq=0 ttl=122 time=0.661 ms 64 bytes from 176.26.232.111: icmp_seq=1 ttl=122 time=0.619 ms 64 bytes from 176.26.232.111: icmp_seq=2 ttl=122 time=0.621 ms 64 bytes from 176.26.232.111: icmp_seq=3 ttl=122 time=0.634 ms --- host3.site.net ping statistics --- 4 packets transmitted, 4 packets received, 0% packet loss round-trip min/avg/max/stddev = 0.619/0.634/0.661/0.017 ms
The fields in the display are the same as those displayed by the J-Web ping hostdiagnostic tool. For information, see “Ping Host Results and OutputSummary” on page 353.
Checking MPLS Connections from the CLI
Use the ping mpls commands to diagnose the state of LSPs, Layer 2 and Layer 3VPNs, and Layer 2 circuits. When you issue a command from a Services Routeroperating as the inbound node at the entry point of an LSP or VPN, the router sendsprobe packets into the LSP or VPN. Based on how the LSP or VPN outbound node atthe remote endpoint of the connection replies to the probes, you can determine theconnectivity of the LSP or VPN.
Each probe is an echo request sent to the LSP or VPN exit point as an MPLS packetwith a UDP payload. If the outbound node receives the echo request, it checks thecontents of the probe and returns a value in the UDP payload of the response packet.If the Services Router receives the response packet, it reports a successful pingresponse. Responses that take longer than 2 seconds are identified as failed probes.
Alternatively, you can use the J-Web ping MPLS tool. For more information, see“Checking MPLS Connections from the J-Web Interface” on page 354.
Using CLI Diagnostic Commands ■ 369
Chapter 18: Using Diagnostic Tools
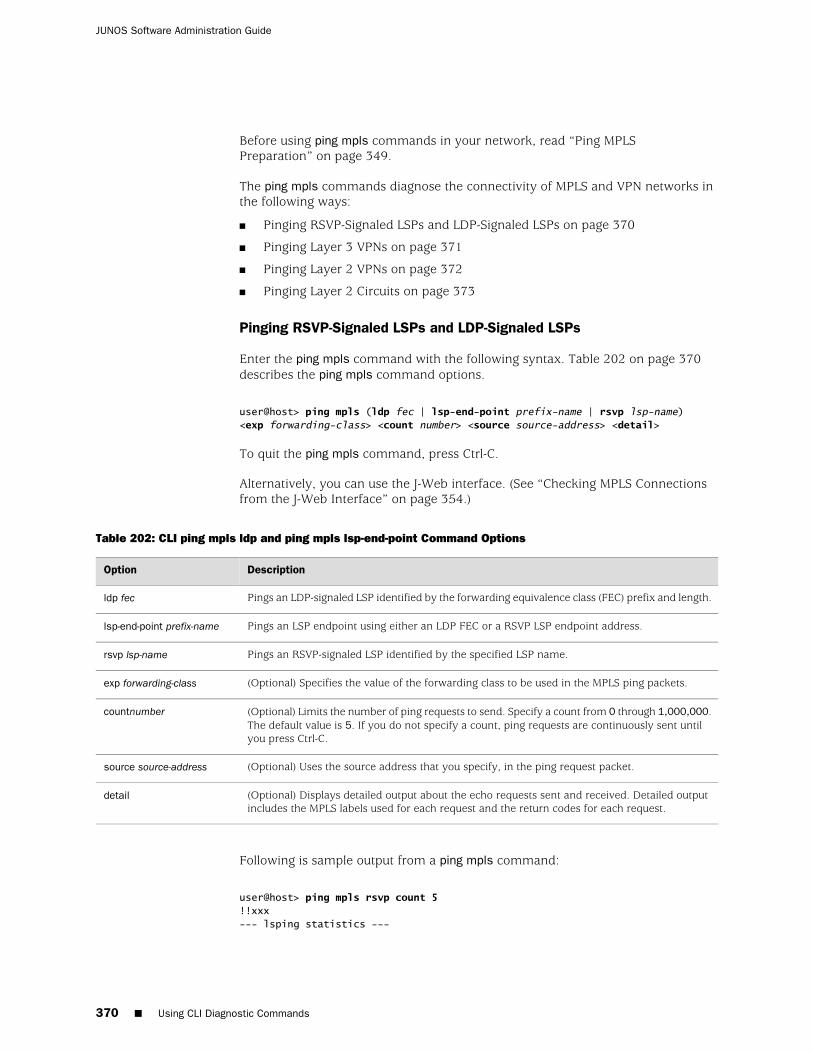
Before using ping mpls commands in your network, read “Ping MPLSPreparation” on page 349.
The ping mpls commands diagnose the connectivity of MPLS and VPN networks inthe following ways:
■ Pinging RSVP-Signaled LSPs and LDP-Signaled LSPs on page 370
■ Pinging Layer 3 VPNs on page 371
■ Pinging Layer 2 VPNs on page 372
■ Pinging Layer 2 Circuits on page 373
Pinging RSVP-Signaled LSPs and LDP-Signaled LSPs
Enter the ping mpls command with the following syntax. Table 202 on page 370describes the ping mpls command options.
user@host> ping mpls (ldp fec | lsp-end-point prefix-name | rsvp lsp-name)<exp forwarding-class> <count number> <source source-address> <detail>
To quit the ping mpls command, press Ctrl-C.
Alternatively, you can use the J-Web interface. (See “Checking MPLS Connectionsfrom the J-Web Interface” on page 354.)
Table 202: CLI ping mpls ldp and ping mpls lsp-end-point Command Options
DescriptionOption
Pings an LDP-signaled LSP identified by the forwarding equivalence class (FEC) prefix and length.ldp fec
Pings an LSP endpoint using either an LDP FEC or a RSVP LSP endpoint address.lsp-end-point prefix-name
Pings an RSVP-signaled LSP identified by the specified LSP name.rsvp lsp-name
(Optional) Specifies the value of the forwarding class to be used in the MPLS ping packets.exp forwarding-class
(Optional) Limits the number of ping requests to send. Specify a count from 0 through 1,000,000.The default value is 5. If you do not specify a count, ping requests are continuously sent untilyou press Ctrl-C.
countnumber
(Optional) Uses the source address that you specify, in the ping request packet.source source-address
(Optional) Displays detailed output about the echo requests sent and received. Detailed outputincludes the MPLS labels used for each request and the return codes for each request.
detail
Following is sample output from a ping mpls command:
user@host> ping mpls rsvp count 5!!xxx--- lsping statistics ---
370 ■ Using CLI Diagnostic Commands
JUNOS Software Administration Guide
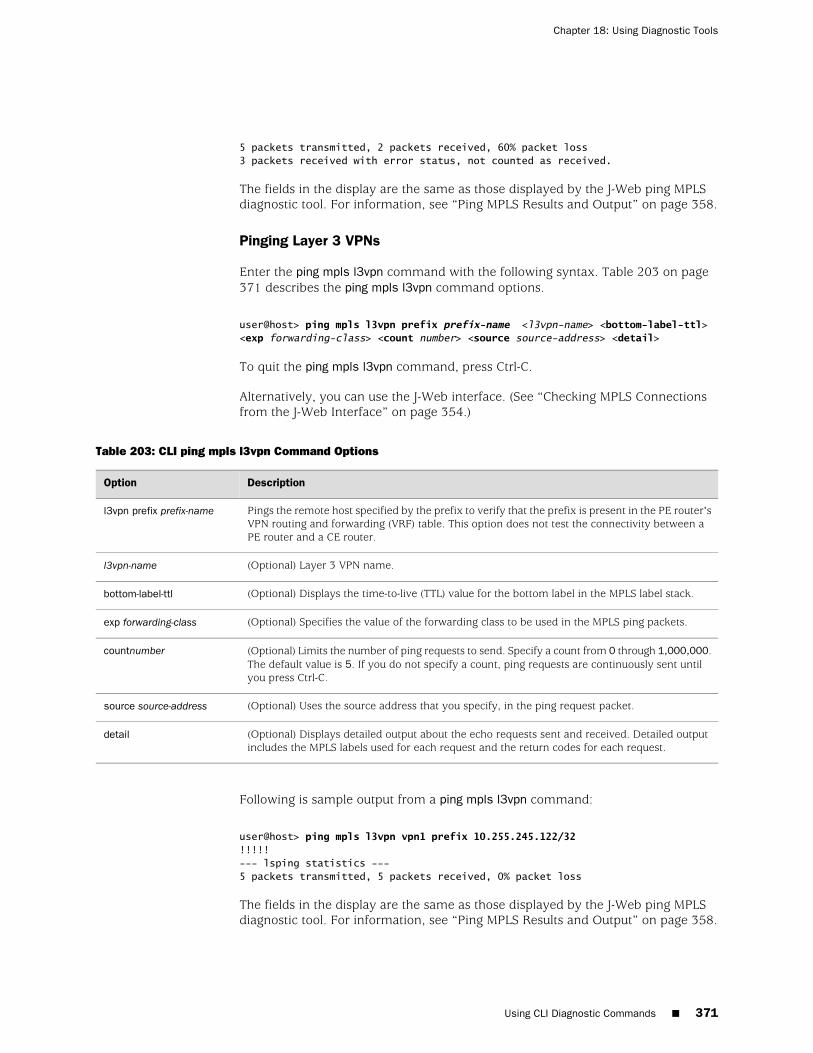
5 packets transmitted, 2 packets received, 60% packet loss3 packets received with error status, not counted as received.
The fields in the display are the same as those displayed by the J-Web ping MPLSdiagnostic tool. For information, see “Ping MPLS Results and Output” on page 358.
Pinging Layer 3 VPNs
Enter the ping mpls l3vpn command with the following syntax. Table 203 on page 371 describes the ping mpls l3vpn command options.
user@host> ping mpls l3vpn prefix prefix-name <l3vpn-name> <bottom-label-ttl><exp forwarding-class> <count number> <source source-address> <detail>
To quit the ping mpls l3vpn command, press Ctrl-C.
Alternatively, you can use the J-Web interface. (See “Checking MPLS Connectionsfrom the J-Web Interface” on page 354.)
Table 203: CLI ping mpls l3vpn Command Options
DescriptionOption
Pings the remote host specified by the prefix to verify that the prefix is present in the PE router'sVPN routing and forwarding (VRF) table. This option does not test the connectivity between aPE router and a CE router.
l3vpn prefix prefix-name
(Optional) Layer 3 VPN name.l3vpn-name
(Optional) Displays the time-to-live (TTL) value for the bottom label in the MPLS label stack.bottom-label-ttl
(Optional) Specifies the value of the forwarding class to be used in the MPLS ping packets.exp forwarding-class
(Optional) Limits the number of ping requests to send. Specify a count from 0 through 1,000,000.The default value is 5. If you do not specify a count, ping requests are continuously sent untilyou press Ctrl-C.
countnumber
(Optional) Uses the source address that you specify, in the ping request packet.source source-address
(Optional) Displays detailed output about the echo requests sent and received. Detailed outputincludes the MPLS labels used for each request and the return codes for each request.
detail
Following is sample output from a ping mpls l3vpn command:
user@host> ping mpls l3vpn vpn1 prefix 10.255.245.122/32!!!!!--- lsping statistics ---5 packets transmitted, 5 packets received, 0% packet loss
The fields in the display are the same as those displayed by the J-Web ping MPLSdiagnostic tool. For information, see “Ping MPLS Results and Output” on page 358.
Using CLI Diagnostic Commands ■ 371
Chapter 18: Using Diagnostic Tools
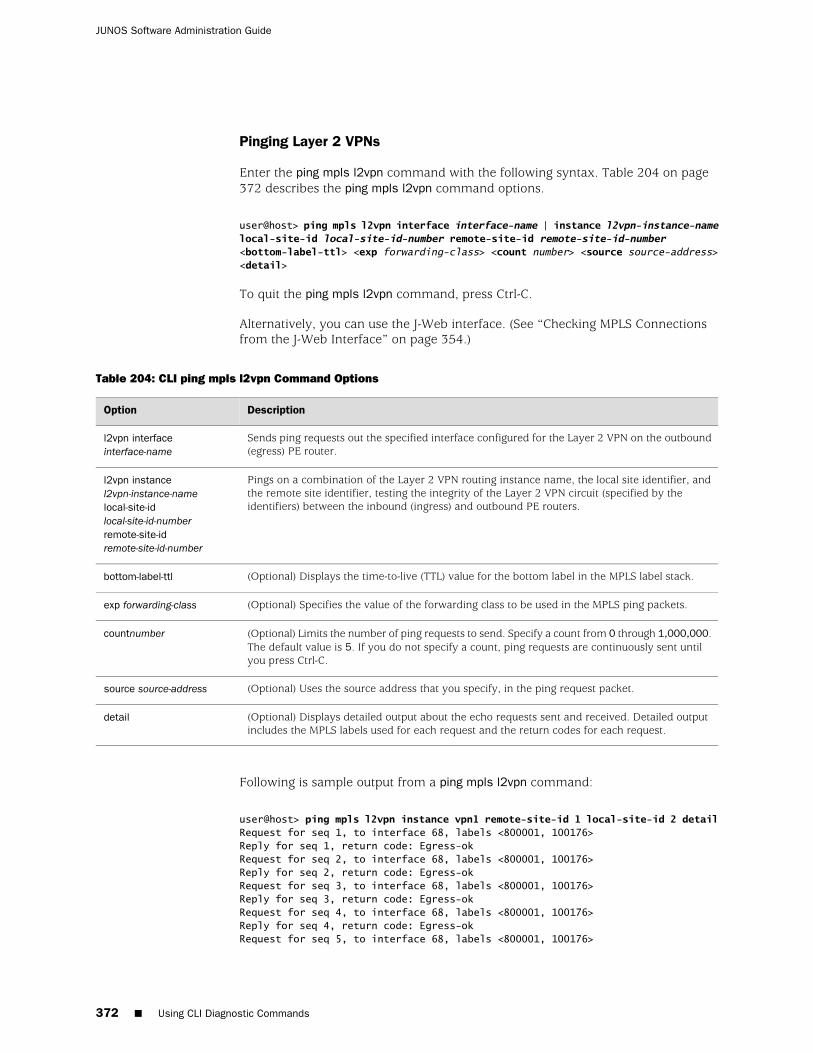
Pinging Layer 2 VPNs
Enter the ping mpls l2vpn command with the following syntax. Table 204 on page 372 describes the ping mpls l2vpn command options.
user@host> ping mpls l2vpn interface interface-name | instance l2vpn-instance-namelocal-site-id local-site-id-number remote-site-id remote-site-id-number<bottom-label-ttl> <exp forwarding-class> <count number> <source source-address><detail>
To quit the ping mpls l2vpn command, press Ctrl-C.
Alternatively, you can use the J-Web interface. (See “Checking MPLS Connectionsfrom the J-Web Interface” on page 354.)
Table 204: CLI ping mpls l2vpn Command Options
DescriptionOption
Sends ping requests out the specified interface configured for the Layer 2 VPN on the outbound(egress) PE router.
l2vpn interfaceinterface-name
Pings on a combination of the Layer 2 VPN routing instance name, the local site identifier, andthe remote site identifier, testing the integrity of the Layer 2 VPN circuit (specified by theidentifiers) between the inbound (ingress) and outbound PE routers.
l2vpn instancel2vpn-instance-namelocal-site-idlocal-site-id-numberremote-site-idremote-site-id-number
(Optional) Displays the time-to-live (TTL) value for the bottom label in the MPLS label stack.bottom-label-ttl
(Optional) Specifies the value of the forwarding class to be used in the MPLS ping packets.exp forwarding-class
(Optional) Limits the number of ping requests to send. Specify a count from 0 through 1,000,000.The default value is 5. If you do not specify a count, ping requests are continuously sent untilyou press Ctrl-C.
countnumber
(Optional) Uses the source address that you specify, in the ping request packet.source source-address
(Optional) Displays detailed output about the echo requests sent and received. Detailed outputincludes the MPLS labels used for each request and the return codes for each request.
detail
Following is sample output from a ping mpls l2vpn command:
user@host> ping mpls l2vpn instance vpn1 remote-site-id 1 local-site-id 2 detailRequest for seq 1, to interface 68, labels <800001, 100176>Reply for seq 1, return code: Egress-okRequest for seq 2, to interface 68, labels <800001, 100176>Reply for seq 2, return code: Egress-okRequest for seq 3, to interface 68, labels <800001, 100176>Reply for seq 3, return code: Egress-okRequest for seq 4, to interface 68, labels <800001, 100176>Reply for seq 4, return code: Egress-okRequest for seq 5, to interface 68, labels <800001, 100176>
372 ■ Using CLI Diagnostic Commands
JUNOS Software Administration Guide
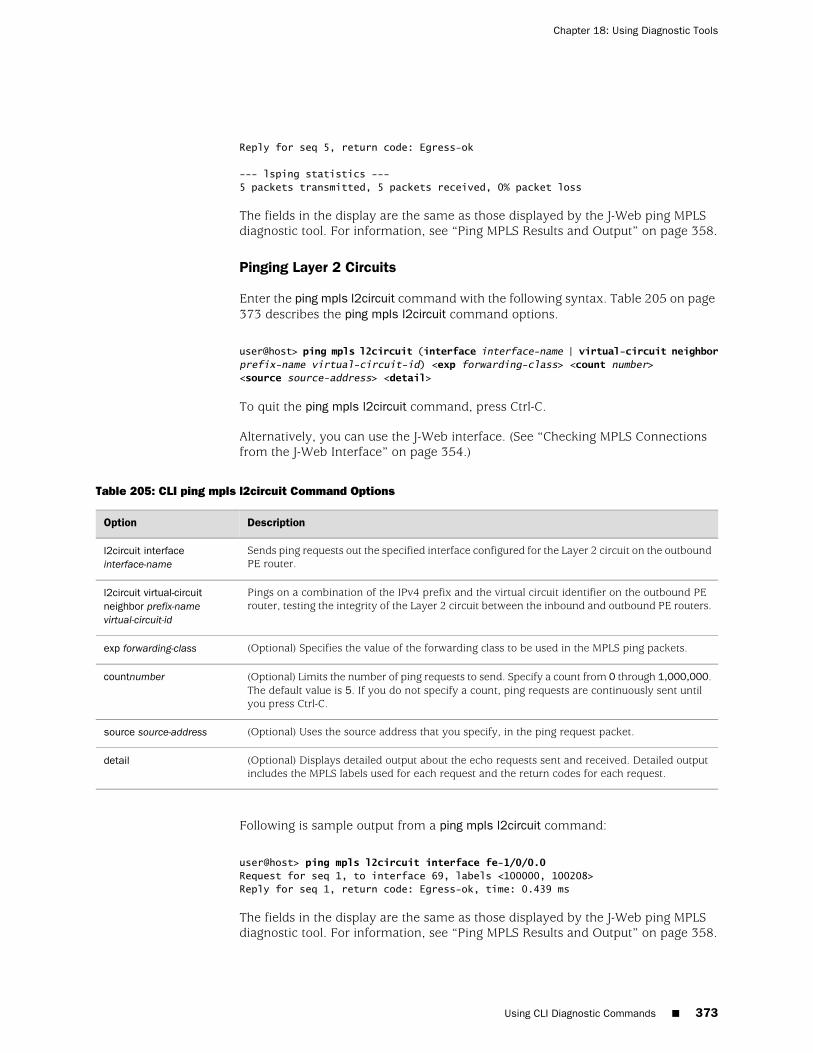
Reply for seq 5, return code: Egress-ok
--- lsping statistics ---5 packets transmitted, 5 packets received, 0% packet loss
The fields in the display are the same as those displayed by the J-Web ping MPLSdiagnostic tool. For information, see “Ping MPLS Results and Output” on page 358.
Pinging Layer 2 Circuits
Enter the ping mpls l2circuit command with the following syntax. Table 205 on page 373 describes the ping mpls l2circuit command options.
user@host> ping mpls l2circuit (interface interface-name | virtual-circuit neighborprefix-name virtual-circuit-id) <exp forwarding-class> <count number><source source-address> <detail>
To quit the ping mpls l2circuit command, press Ctrl-C.
Alternatively, you can use the J-Web interface. (See “Checking MPLS Connectionsfrom the J-Web Interface” on page 354.)
Table 205: CLI ping mpls l2circuit Command Options
DescriptionOption
Sends ping requests out the specified interface configured for the Layer 2 circuit on the outboundPE router.
l2circuit interfaceinterface-name
Pings on a combination of the IPv4 prefix and the virtual circuit identifier on the outbound PErouter, testing the integrity of the Layer 2 circuit between the inbound and outbound PE routers.
l2circuit virtual-circuitneighbor prefix-namevirtual-circuit-id
(Optional) Specifies the value of the forwarding class to be used in the MPLS ping packets.exp forwarding-class
(Optional) Limits the number of ping requests to send. Specify a count from 0 through 1,000,000.The default value is 5. If you do not specify a count, ping requests are continuously sent untilyou press Ctrl-C.
countnumber
(Optional) Uses the source address that you specify, in the ping request packet.source source-address
(Optional) Displays detailed output about the echo requests sent and received. Detailed outputincludes the MPLS labels used for each request and the return codes for each request.
detail
Following is sample output from a ping mpls l2circuit command:
user@host> ping mpls l2circuit interface fe-1/0/0.0Request for seq 1, to interface 69, labels <100000, 100208>Reply for seq 1, return code: Egress-ok, time: 0.439 ms
The fields in the display are the same as those displayed by the J-Web ping MPLSdiagnostic tool. For information, see “Ping MPLS Results and Output” on page 358.
Using CLI Diagnostic Commands ■ 373
Chapter 18: Using Diagnostic Tools
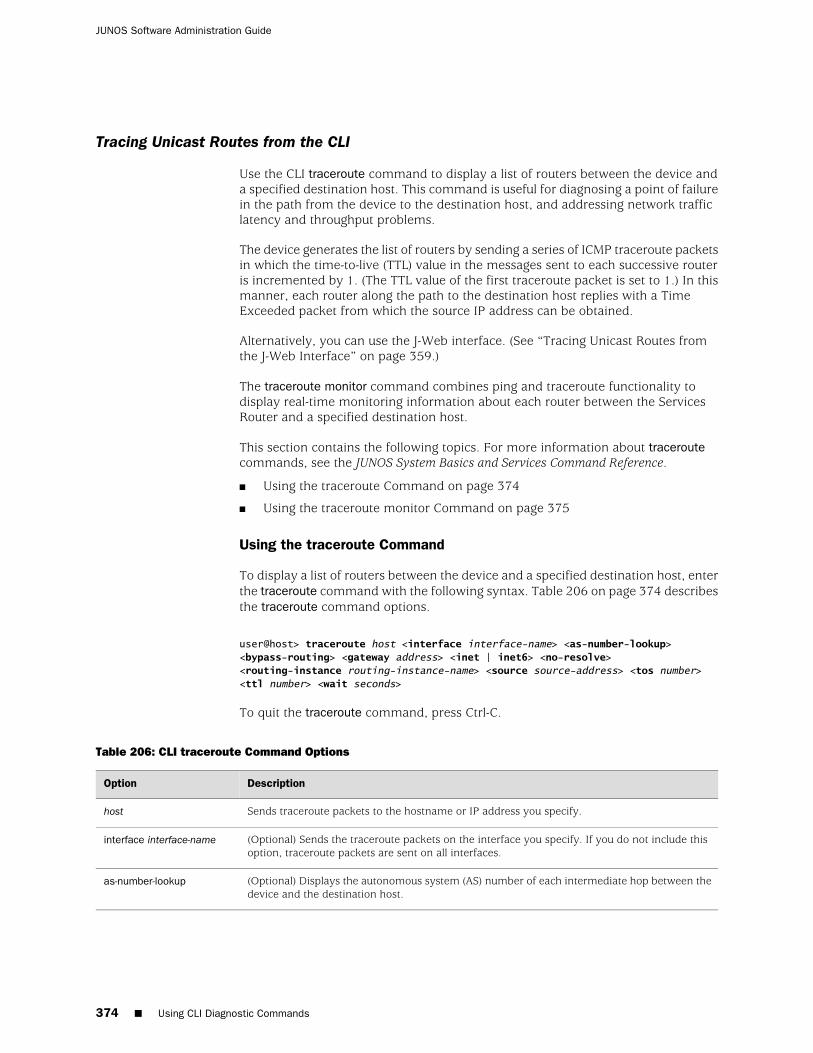
Tracing Unicast Routes from the CLI
Use the CLI traceroute command to display a list of routers between the device anda specified destination host. This command is useful for diagnosing a point of failurein the path from the device to the destination host, and addressing network trafficlatency and throughput problems.
The device generates the list of routers by sending a series of ICMP traceroute packetsin which the time-to-live (TTL) value in the messages sent to each successive routeris incremented by 1. (The TTL value of the first traceroute packet is set to 1.) In thismanner, each router along the path to the destination host replies with a TimeExceeded packet from which the source IP address can be obtained.
Alternatively, you can use the J-Web interface. (See “Tracing Unicast Routes fromthe J-Web Interface” on page 359.)
The traceroute monitor command combines ping and traceroute functionality todisplay real-time monitoring information about each router between the ServicesRouter and a specified destination host.
This section contains the following topics. For more information about traceroutecommands, see the JUNOS System Basics and Services Command Reference.
■ Using the traceroute Command on page 374
■ Using the traceroute monitor Command on page 375
Using the traceroute Command
To display a list of routers between the device and a specified destination host, enterthe traceroute command with the following syntax. Table 206 on page 374 describesthe traceroute command options.
user@host> traceroute host <interface interface-name> <as-number-lookup><bypass-routing> <gateway address> <inet | inet6> <no-resolve><routing-instance routing-instance-name> <source source-address> <tos number><ttl number> <wait seconds>
To quit the traceroute command, press Ctrl-C.
Table 206: CLI traceroute Command Options
DescriptionOption
Sends traceroute packets to the hostname or IP address you specify.host
(Optional) Sends the traceroute packets on the interface you specify. If you do not include thisoption, traceroute packets are sent on all interfaces.
interface interface-name
(Optional) Displays the autonomous system (AS) number of each intermediate hop between thedevice and the destination host.
as-number-lookup
374 ■ Using CLI Diagnostic Commands
JUNOS Software Administration Guide
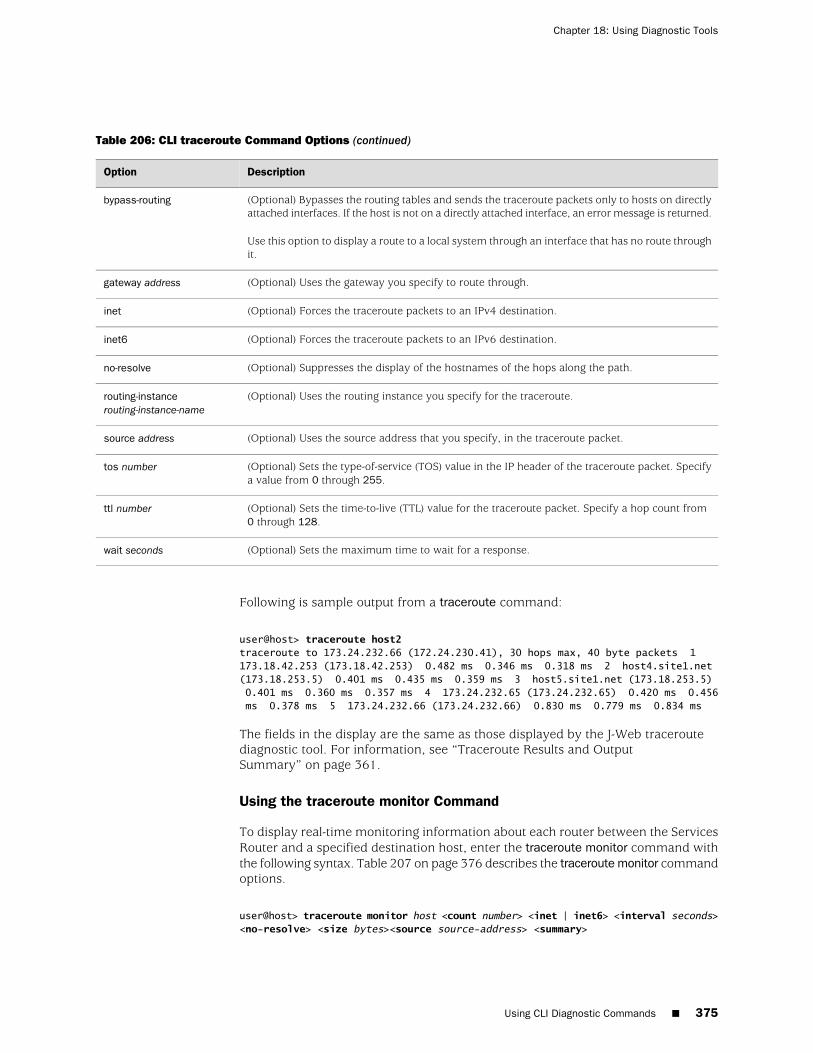
Table 206: CLI traceroute Command Options (continued)
DescriptionOption
(Optional) Bypasses the routing tables and sends the traceroute packets only to hosts on directlyattached interfaces. If the host is not on a directly attached interface, an error message is returned.
Use this option to display a route to a local system through an interface that has no route throughit.
bypass-routing
(Optional) Uses the gateway you specify to route through.gateway address
(Optional) Forces the traceroute packets to an IPv4 destination.inet
(Optional) Forces the traceroute packets to an IPv6 destination.inet6
(Optional) Suppresses the display of the hostnames of the hops along the path.no-resolve
(Optional) Uses the routing instance you specify for the traceroute.routing-instancerouting-instance-name
(Optional) Uses the source address that you specify, in the traceroute packet.source address
(Optional) Sets the type-of-service (TOS) value in the IP header of the traceroute packet. Specifya value from 0 through 255.
tos number
(Optional) Sets the time-to-live (TTL) value for the traceroute packet. Specify a hop count from0 through 128.
ttl number
(Optional) Sets the maximum time to wait for a response.wait seconds
Following is sample output from a traceroute command:
user@host> traceroute host2traceroute to 173.24.232.66 (172.24.230.41), 30 hops max, 40 byte packets 1 173.18.42.253 (173.18.42.253) 0.482 ms 0.346 ms 0.318 ms 2 host4.site1.net (173.18.253.5) 0.401 ms 0.435 ms 0.359 ms 3 host5.site1.net (173.18.253.5) 0.401 ms 0.360 ms 0.357 ms 4 173.24.232.65 (173.24.232.65) 0.420 ms 0.456 ms 0.378 ms 5 173.24.232.66 (173.24.232.66) 0.830 ms 0.779 ms 0.834 ms
The fields in the display are the same as those displayed by the J-Web traceroutediagnostic tool. For information, see “Traceroute Results and OutputSummary” on page 361.
Using the traceroute monitor Command
To display real-time monitoring information about each router between the ServicesRouter and a specified destination host, enter the traceroute monitor command withthe following syntax. Table 207 on page 376 describes the traceroute monitor commandoptions.
user@host> traceroute monitor host <count number> <inet | inet6> <interval seconds><no-resolve> <size bytes><source source-address> <summary>
Using CLI Diagnostic Commands ■ 375
Chapter 18: Using Diagnostic Tools
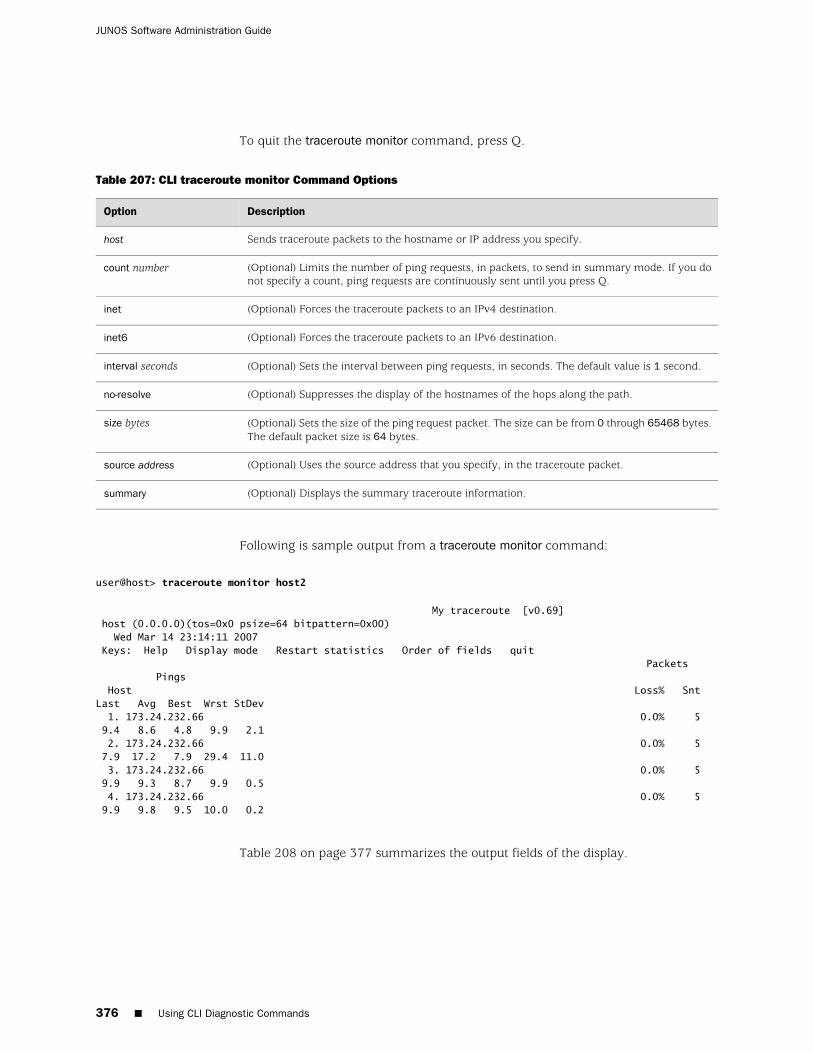
To quit the traceroute monitor command, press Q.
Table 207: CLI traceroute monitor Command Options
DescriptionOption
Sends traceroute packets to the hostname or IP address you specify.host
(Optional) Limits the number of ping requests, in packets, to send in summary mode. If you donot specify a count, ping requests are continuously sent until you press Q.
count number
(Optional) Forces the traceroute packets to an IPv4 destination.inet
(Optional) Forces the traceroute packets to an IPv6 destination.inet6
(Optional) Sets the interval between ping requests, in seconds. The default value is 1 second.interval seconds
(Optional) Suppresses the display of the hostnames of the hops along the path.no-resolve
(Optional) Sets the size of the ping request packet. The size can be from 0 through 65468 bytes.The default packet size is 64 bytes.
size bytes
(Optional) Uses the source address that you specify, in the traceroute packet.source address
(Optional) Displays the summary traceroute information.summary
Following is sample output from a traceroute monitor command:
user@host> traceroute monitor host2
My traceroute [v0.69] host (0.0.0.0)(tos=0x0 psize=64 bitpattern=0x00) Wed Mar 14 23:14:11 2007 Keys: Help Display mode Restart statistics Order of fields quit Packets Pings Host Loss% Snt Last Avg Best Wrst StDev 1. 173.24.232.66 0.0% 5 9.4 8.6 4.8 9.9 2.1 2. 173.24.232.66 0.0% 5 7.9 17.2 7.9 29.4 11.0 3. 173.24.232.66 0.0% 5 9.9 9.3 8.7 9.9 0.5 4. 173.24.232.66 0.0% 5 9.9 9.8 9.5 10.0 0.2
Table 208 on page 377 summarizes the output fields of the display.
376 ■ Using CLI Diagnostic Commands
JUNOS Software Administration Guide
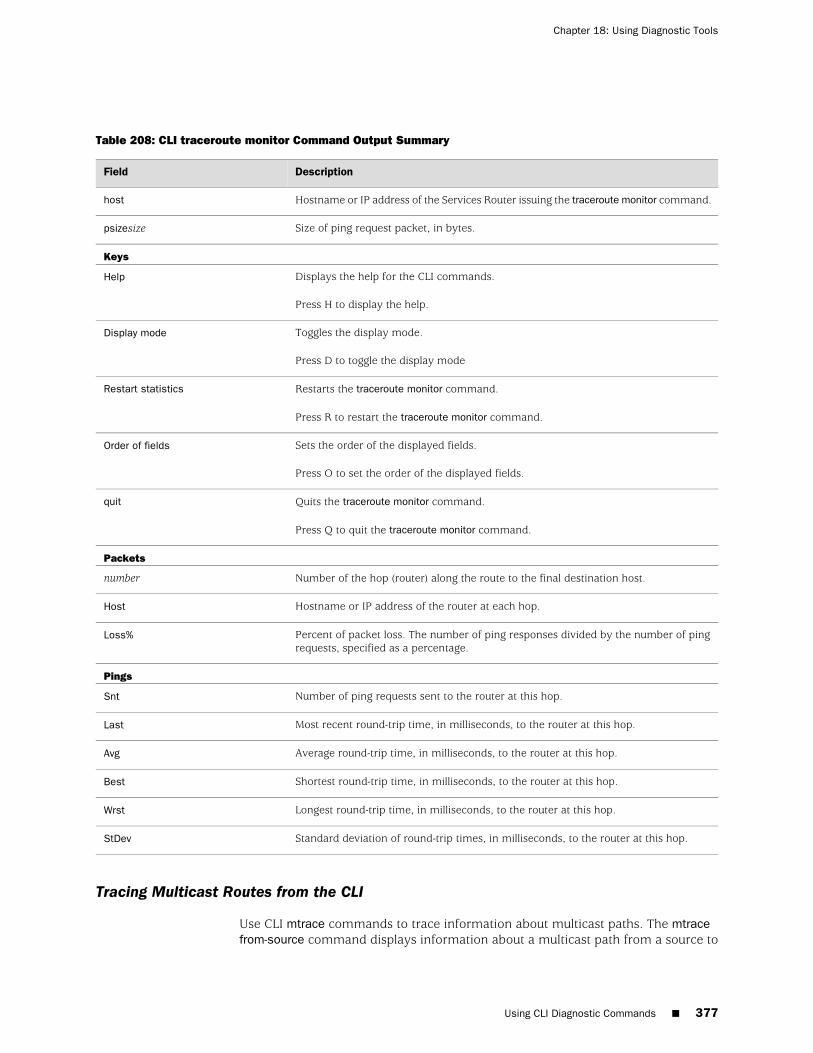
Table 208: CLI traceroute monitor Command Output Summary
DescriptionField
Hostname or IP address of the Services Router issuing the traceroute monitor command.host
Size of ping request packet, in bytes.psizesize
Keys
Displays the help for the CLI commands.
Press H to display the help.
Help
Toggles the display mode.
Press D to toggle the display mode
Display mode
Restarts the traceroute monitor command.
Press R to restart the traceroute monitor command.
Restart statistics
Sets the order of the displayed fields.
Press O to set the order of the displayed fields.
Order of fields
Quits the traceroute monitor command.
Press Q to quit the traceroute monitor command.
quit
Packets
Number of the hop (router) along the route to the final destination host.number
Hostname or IP address of the router at each hop.Host
Percent of packet loss. The number of ping responses divided by the number of pingrequests, specified as a percentage.
Loss%
Pings
Number of ping requests sent to the router at this hop.Snt
Most recent round-trip time, in milliseconds, to the router at this hop.Last
Average round-trip time, in milliseconds, to the router at this hop.Avg
Shortest round-trip time, in milliseconds, to the router at this hop.Best
Longest round-trip time, in milliseconds, to the router at this hop.Wrst
Standard deviation of round-trip times, in milliseconds, to the router at this hop.StDev
Tracing Multicast Routes from the CLI
Use CLI mtrace commands to trace information about multicast paths. The mtracefrom-source command displays information about a multicast path from a source to
Using CLI Diagnostic Commands ■ 377
Chapter 18: Using Diagnostic Tools
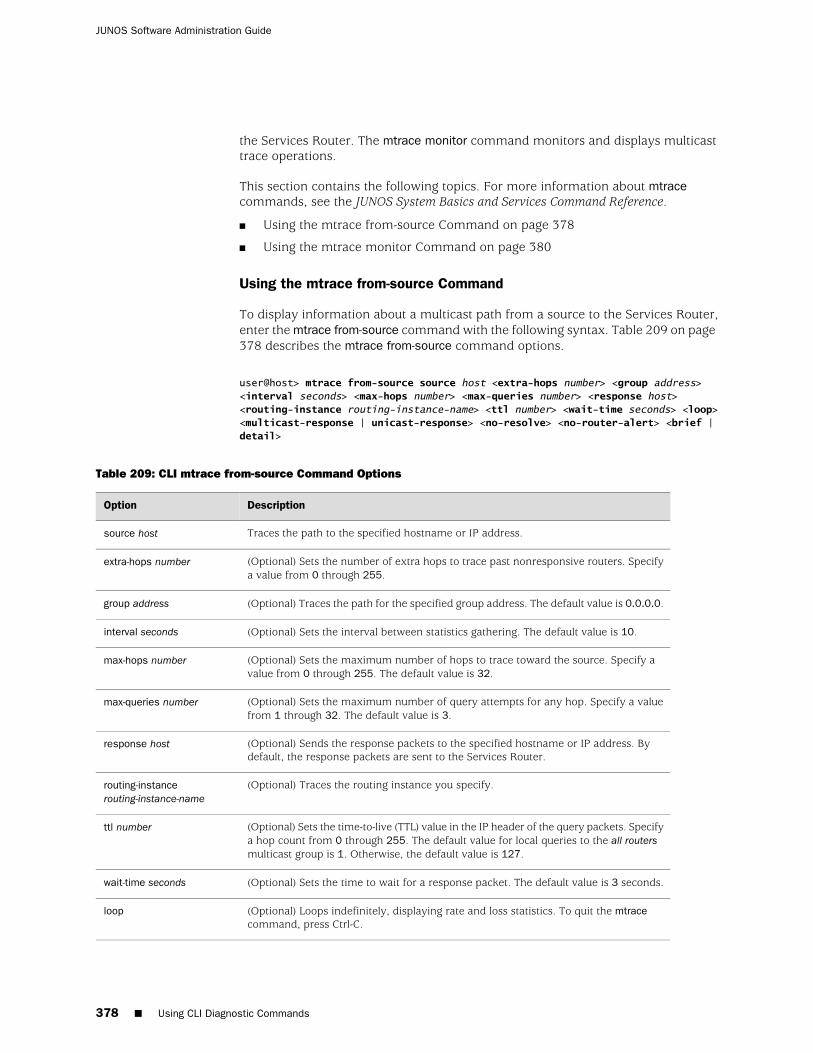
the Services Router. The mtrace monitor command monitors and displays multicasttrace operations.
This section contains the following topics. For more information about mtracecommands, see the JUNOS System Basics and Services Command Reference.
■ Using the mtrace from-source Command on page 378
■ Using the mtrace monitor Command on page 380
Using the mtrace from-source Command
To display information about a multicast path from a source to the Services Router,enter the mtrace from-source command with the following syntax. Table 209 on page 378 describes the mtrace from-source command options.
user@host> mtrace from-source source host <extra-hops number> <group address><interval seconds> <max-hops number> <max-queries number> <response host><routing-instance routing-instance-name> <ttl number> <wait-time seconds> <loop><multicast-response | unicast-response> <no-resolve> <no-router-alert> <brief |detail>
Table 209: CLI mtrace from-source Command Options
DescriptionOption
Traces the path to the specified hostname or IP address.source host
(Optional) Sets the number of extra hops to trace past nonresponsive routers. Specifya value from 0 through 255.
extra-hops number
(Optional) Traces the path for the specified group address. The default value is 0.0.0.0.group address
(Optional) Sets the interval between statistics gathering. The default value is 10.interval seconds
(Optional) Sets the maximum number of hops to trace toward the source. Specify avalue from 0 through 255. The default value is 32.
max-hops number
(Optional) Sets the maximum number of query attempts for any hop. Specify a valuefrom 1 through 32. The default value is 3.
max-queries number
(Optional) Sends the response packets to the specified hostname or IP address. Bydefault, the response packets are sent to the Services Router.
response host
(Optional) Traces the routing instance you specify.routing-instancerouting-instance-name
(Optional) Sets the time-to-live (TTL) value in the IP header of the query packets. Specifya hop count from 0 through 255. The default value for local queries to the all routersmulticast group is 1. Otherwise, the default value is 127.
ttl number
(Optional) Sets the time to wait for a response packet. The default value is 3 seconds.wait-time seconds
(Optional) Loops indefinitely, displaying rate and loss statistics. To quit the mtracecommand, press Ctrl-C.
loop
378 ■ Using CLI Diagnostic Commands
JUNOS Software Administration Guide
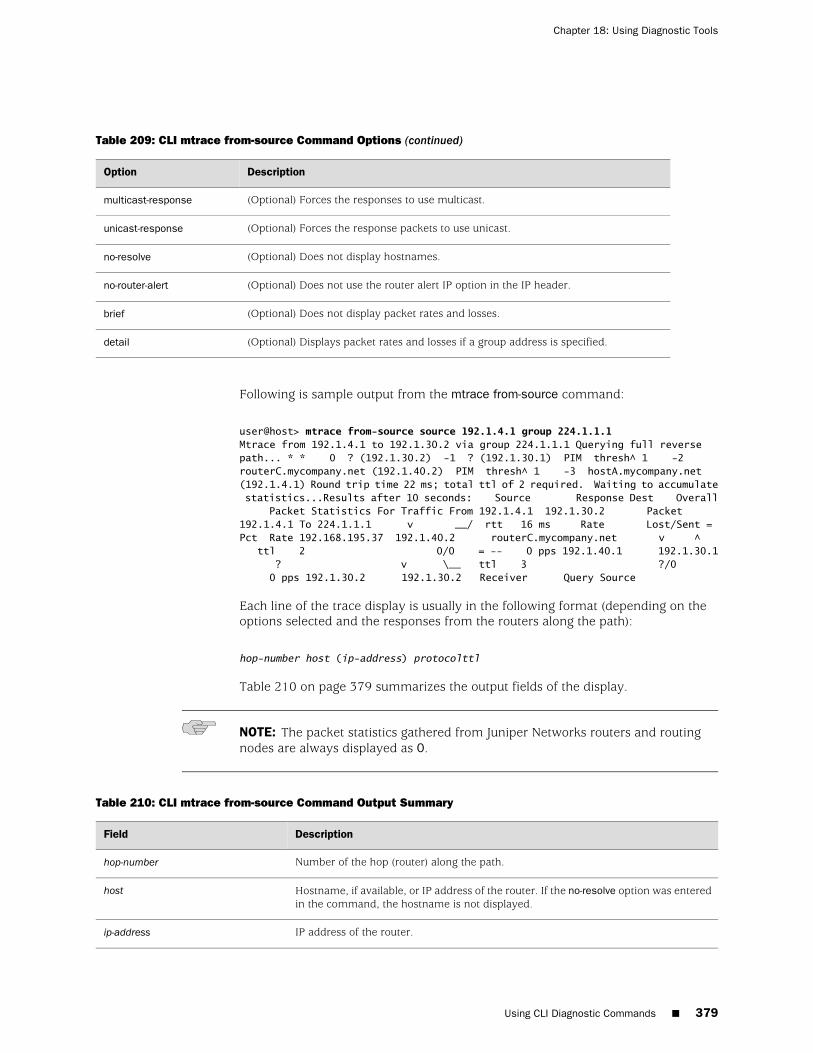
Table 209: CLI mtrace from-source Command Options (continued)
DescriptionOption
(Optional) Forces the responses to use multicast.multicast-response
(Optional) Forces the response packets to use unicast.unicast-response
(Optional) Does not display hostnames.no-resolve
(Optional) Does not use the router alert IP option in the IP header.no-router-alert
(Optional) Does not display packet rates and losses.brief
(Optional) Displays packet rates and losses if a group address is specified.detail
Following is sample output from the mtrace from-source command:
user@host> mtrace from-source source 192.1.4.1 group 224.1.1.1Mtrace from 192.1.4.1 to 192.1.30.2 via group 224.1.1.1 Querying full reverse path... * * 0 ? (192.1.30.2) -1 ? (192.1.30.1) PIM thresh^ 1 -2 routerC.mycompany.net (192.1.40.2) PIM thresh^ 1 -3 hostA.mycompany.net (192.1.4.1) Round trip time 22 ms; total ttl of 2 required. Waiting to accumulate statistics...Results after 10 seconds: Source Response Dest Overall Packet Statistics For Traffic From 192.1.4.1 192.1.30.2 Packet 192.1.4.1 To 224.1.1.1 v __/ rtt 16 ms Rate Lost/Sent = Pct Rate 192.168.195.37 192.1.40.2 routerC.mycompany.net v ^ ttl 2 0/0 = -- 0 pps 192.1.40.1 192.1.30.1 ? v \__ ttl 3 ?/0 0 pps 192.1.30.2 192.1.30.2 Receiver Query Source
Each line of the trace display is usually in the following format (depending on theoptions selected and the responses from the routers along the path):
hop-number host (ip-address) protocolttl
Table 210 on page 379 summarizes the output fields of the display.
NOTE: The packet statistics gathered from Juniper Networks routers and routingnodes are always displayed as 0.
Table 210: CLI mtrace from-source Command Output Summary
DescriptionField
Number of the hop (router) along the path.hop-number
Hostname, if available, or IP address of the router. If the no-resolve option was enteredin the command, the hostname is not displayed.
host
IP address of the router.ip-address
Using CLI Diagnostic Commands ■ 379
Chapter 18: Using Diagnostic Tools
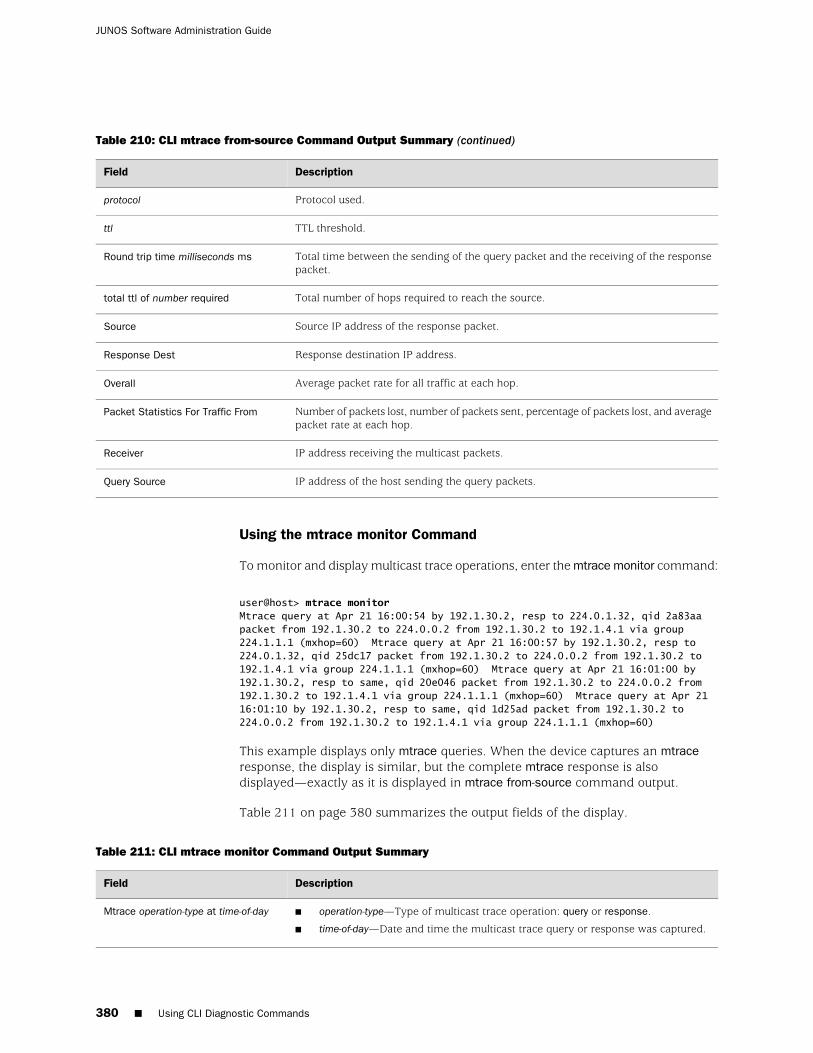
Table 210: CLI mtrace from-source Command Output Summary (continued)
DescriptionField
Protocol used.protocol
TTL threshold.ttl
Total time between the sending of the query packet and the receiving of the responsepacket.
Round trip time milliseconds ms
Total number of hops required to reach the source.total ttl of number required
Source IP address of the response packet.Source
Response destination IP address.Response Dest
Average packet rate for all traffic at each hop.Overall
Number of packets lost, number of packets sent, percentage of packets lost, and averagepacket rate at each hop.
Packet Statistics For Traffic From
IP address receiving the multicast packets.Receiver
IP address of the host sending the query packets.Query Source
Using the mtrace monitor Command
To monitor and display multicast trace operations, enter the mtrace monitor command:
user@host> mtrace monitorMtrace query at Apr 21 16:00:54 by 192.1.30.2, resp to 224.0.1.32, qid 2a83aa packet from 192.1.30.2 to 224.0.0.2 from 192.1.30.2 to 192.1.4.1 via group 224.1.1.1 (mxhop=60) Mtrace query at Apr 21 16:00:57 by 192.1.30.2, resp to 224.0.1.32, qid 25dc17 packet from 192.1.30.2 to 224.0.0.2 from 192.1.30.2 to 192.1.4.1 via group 224.1.1.1 (mxhop=60) Mtrace query at Apr 21 16:01:00 by 192.1.30.2, resp to same, qid 20e046 packet from 192.1.30.2 to 224.0.0.2 from 192.1.30.2 to 192.1.4.1 via group 224.1.1.1 (mxhop=60) Mtrace query at Apr 21 16:01:10 by 192.1.30.2, resp to same, qid 1d25ad packet from 192.1.30.2 to 224.0.0.2 from 192.1.30.2 to 192.1.4.1 via group 224.1.1.1 (mxhop=60)
This example displays only mtrace queries. When the device captures an mtraceresponse, the display is similar, but the complete mtrace response is alsodisplayed—exactly as it is displayed in mtrace from-source command output.
Table 211 on page 380 summarizes the output fields of the display.
Table 211: CLI mtrace monitor Command Output Summary
DescriptionField
■ operation-type—Type of multicast trace operation: query or response.
■ time-of-day—Date and time the multicast trace query or response was captured.
Mtrace operation-type at time-of-day
380 ■ Using CLI Diagnostic Commands
JUNOS Software Administration Guide
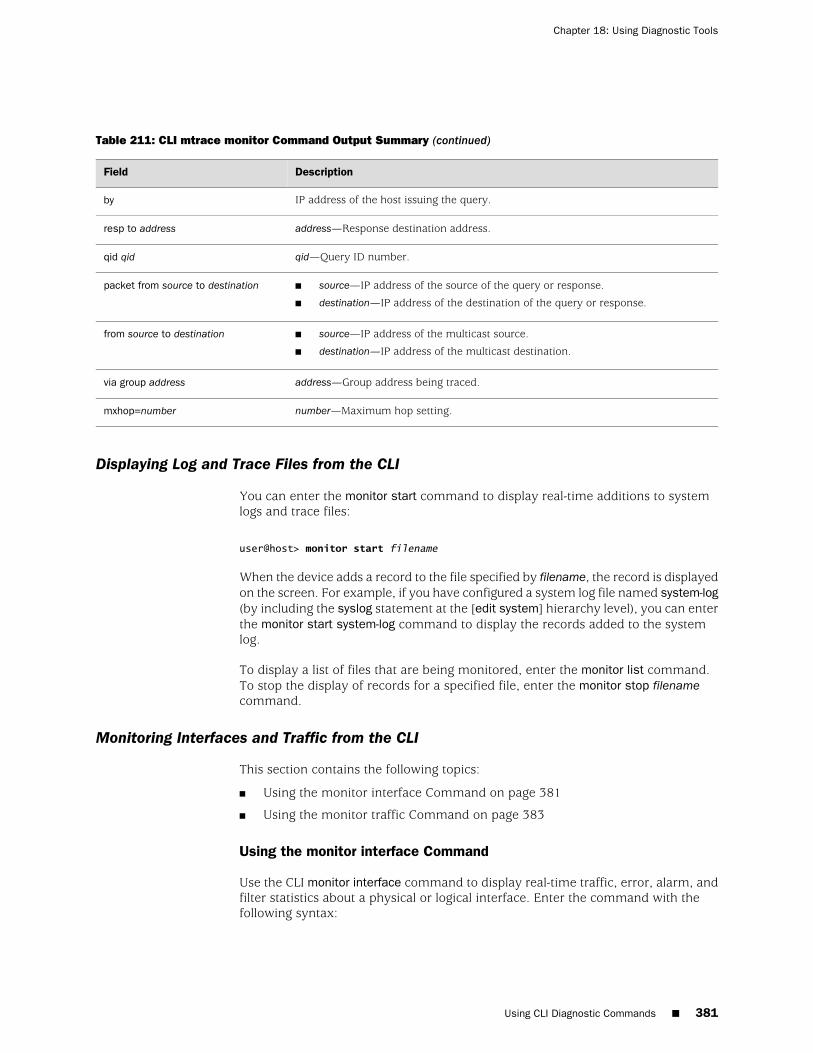
Table 211: CLI mtrace monitor Command Output Summary (continued)
DescriptionField
IP address of the host issuing the query.by
address—Response destination address.resp to address
qid—Query ID number.qid qid
■ source—IP address of the source of the query or response.
■ destination—IP address of the destination of the query or response.
packet from source to destination
■ source—IP address of the multicast source.
■ destination—IP address of the multicast destination.
from source to destination
address—Group address being traced.via group address
number—Maximum hop setting.mxhop=number
Displaying Log and Trace Files from the CLI
You can enter the monitor start command to display real-time additions to systemlogs and trace files:
user@host> monitor start filename
When the device adds a record to the file specified by filename, the record is displayedon the screen. For example, if you have configured a system log file named system-log(by including the syslog statement at the [edit system] hierarchy level), you can enterthe monitor start system-log command to display the records added to the systemlog.
To display a list of files that are being monitored, enter the monitor list command.To stop the display of records for a specified file, enter the monitor stop filenamecommand.
Monitoring Interfaces and Traffic from the CLI
This section contains the following topics:
■ Using the monitor interface Command on page 381
■ Using the monitor traffic Command on page 383
Using the monitor interface Command
Use the CLI monitor interface command to display real-time traffic, error, alarm, andfilter statistics about a physical or logical interface. Enter the command with thefollowing syntax:
Using CLI Diagnostic Commands ■ 381
Chapter 18: Using Diagnostic Tools
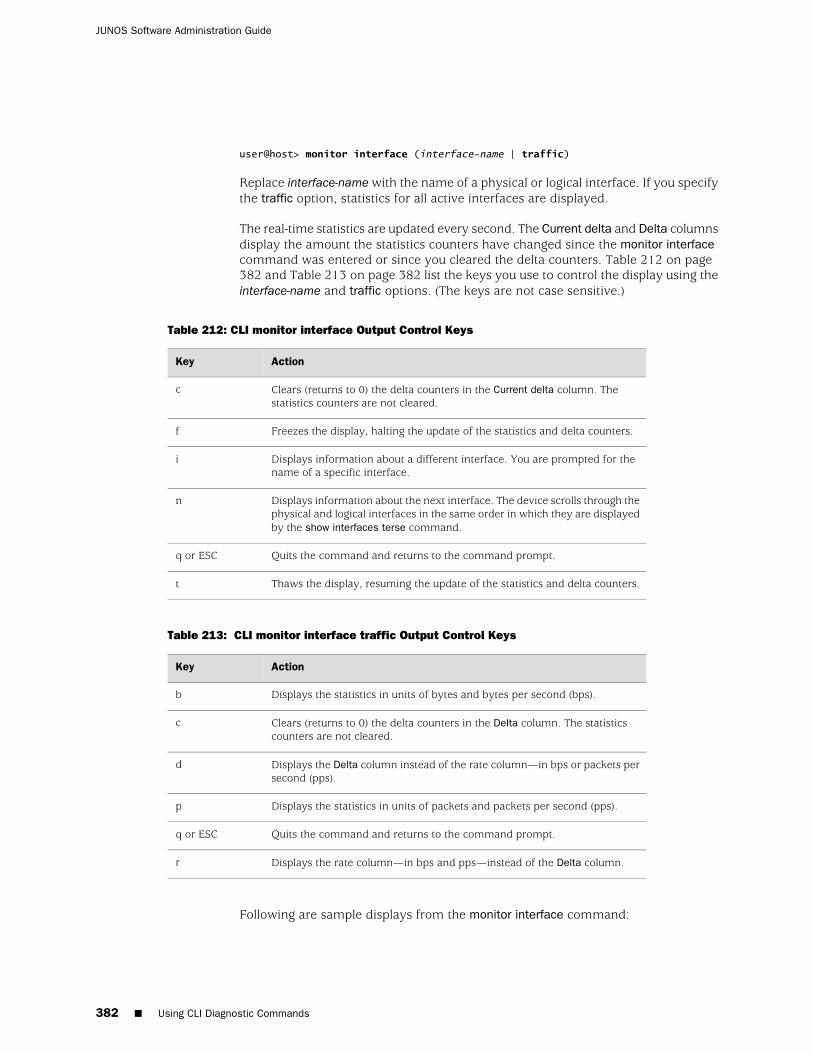
user@host> monitor interface (interface-name | traffic)
Replace interface-name with the name of a physical or logical interface. If you specifythe traffic option, statistics for all active interfaces are displayed.
The real-time statistics are updated every second. The Current delta and Delta columnsdisplay the amount the statistics counters have changed since the monitor interfacecommand was entered or since you cleared the delta counters. Table 212 on page 382 and Table 213 on page 382 list the keys you use to control the display using theinterface-name and traffic options. (The keys are not case sensitive.)
Table 212: CLI monitor interface Output Control Keys
ActionKey
Clears (returns to 0) the delta counters in the Current delta column. Thestatistics counters are not cleared.
c
Freezes the display, halting the update of the statistics and delta counters.f
Displays information about a different interface. You are prompted for thename of a specific interface.
i
Displays information about the next interface. The device scrolls through thephysical and logical interfaces in the same order in which they are displayedby the show interfaces terse command.
n
Quits the command and returns to the command prompt.q or ESC
Thaws the display, resuming the update of the statistics and delta counters.t
Table 213: CLI monitor interface traffic Output Control Keys
ActionKey
Displays the statistics in units of bytes and bytes per second (bps).b
Clears (returns to 0) the delta counters in the Delta column. The statisticscounters are not cleared.
c
Displays the Delta column instead of the rate column—in bps or packets persecond (pps).
d
Displays the statistics in units of packets and packets per second (pps).p
Quits the command and returns to the command prompt.q or ESC
Displays the rate column—in bps and pps—instead of the Delta column.r
Following are sample displays from the monitor interface command:
382 ■ Using CLI Diagnostic Commands
JUNOS Software Administration Guide

user@host> monitor interface fe-0/0/0host1 Seconds: 11 Time: 16:47:49 Delay: 0/0/0 Interface: fe-0/0/0, Enabled, Link is Up Encapsulation: Ethernet, Speed: 100mbps Traffic statistics: Current delta Input bytes: 381588589 [11583] Output bytes: 9707279 [6542] Input packets: 4064553 [145] Output packets: 66683 [25] Error statistics: Input errors: 0 [0] Input drops: 0 [0] Input framing errors: 0 [0] Carrier transitions: 0 [0] Output errors: 0 [0] Output drops: 0 [0]
NOTE: The output fields displayed when you enter the monitor interface interface-namecommand are determined by the interface you specify.
user@host> monitor interface trafficInterface Link Input packets (pps) Output packets (pps) fe-0/0/0 Up 42334 (5) 23306 (3) fe-0/0/1 Up 587525876 (12252) 589621478 (12891)
Using the monitor traffic Command
Use the CLI monitor traffic command to display packet headers transmitted throughnetwork interfaces.
NOTE: Using the monitor traffic command can degrade system performance. Werecommend that you use filtering options—such as count and matching—to minimizethe impact to packet throughput on the system.
Enter the monitor traffic command with the following syntax. Table 214 on page 384describes the monitor traffic command options.
user@host> monitor traffic <absolute-sequence> <count number><interface interface-name> <layer2-headers> <matching "expression"><no-domain-names> <no-promiscuous> <no-resolve> <no-timestamp> <print-ascii><print-hex> <size bytes> <brief | detail | extensive>
To quit the monitor traffic command and return to the command prompt, press Ctrl-C.
If you want to capture and view packet headers using the J-Web interface, see“Capturing and Viewing Packets with the J-Web Interface” on page 362.
Using CLI Diagnostic Commands ■ 383
Chapter 18: Using Diagnostic Tools
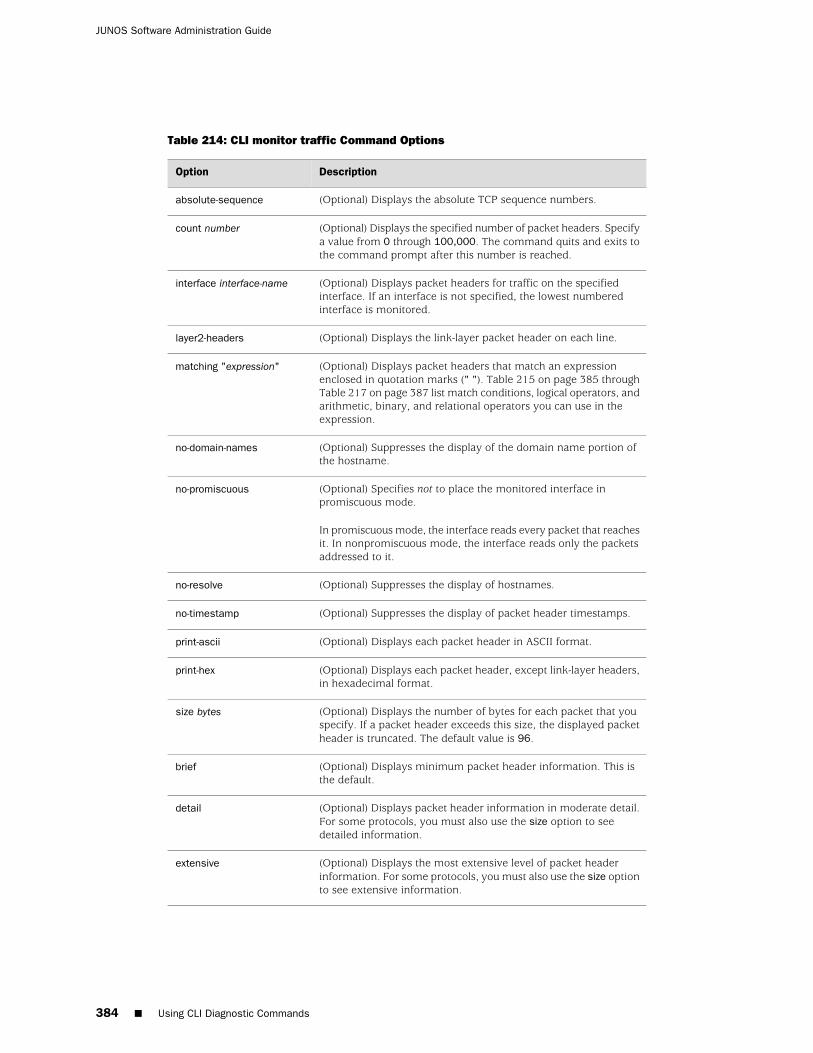
Table 214: CLI monitor traffic Command Options
DescriptionOption
(Optional) Displays the absolute TCP sequence numbers.absolute-sequence
(Optional) Displays the specified number of packet headers. Specifya value from 0 through 100,000. The command quits and exits tothe command prompt after this number is reached.
count number
(Optional) Displays packet headers for traffic on the specifiedinterface. If an interface is not specified, the lowest numberedinterface is monitored.
interface interface-name
(Optional) Displays the link-layer packet header on each line.layer2-headers
(Optional) Displays packet headers that match an expressionenclosed in quotation marks (" "). Table 215 on page 385 throughTable 217 on page 387 list match conditions, logical operators, andarithmetic, binary, and relational operators you can use in theexpression.
matching "expression"
(Optional) Suppresses the display of the domain name portion ofthe hostname.
no-domain-names
(Optional) Specifies not to place the monitored interface inpromiscuous mode.
In promiscuous mode, the interface reads every packet that reachesit. In nonpromiscuous mode, the interface reads only the packetsaddressed to it.
no-promiscuous
(Optional) Suppresses the display of hostnames.no-resolve
(Optional) Suppresses the display of packet header timestamps.no-timestamp
(Optional) Displays each packet header in ASCII format.print-ascii
(Optional) Displays each packet header, except link-layer headers,in hexadecimal format.
print-hex
(Optional) Displays the number of bytes for each packet that youspecify. If a packet header exceeds this size, the displayed packetheader is truncated. The default value is 96.
size bytes
(Optional) Displays minimum packet header information. This isthe default.
brief
(Optional) Displays packet header information in moderate detail.For some protocols, you must also use the size option to seedetailed information.
detail
(Optional) Displays the most extensive level of packet headerinformation. For some protocols, you must also use the size optionto see extensive information.
extensive
384 ■ Using CLI Diagnostic Commands
JUNOS Software Administration Guide
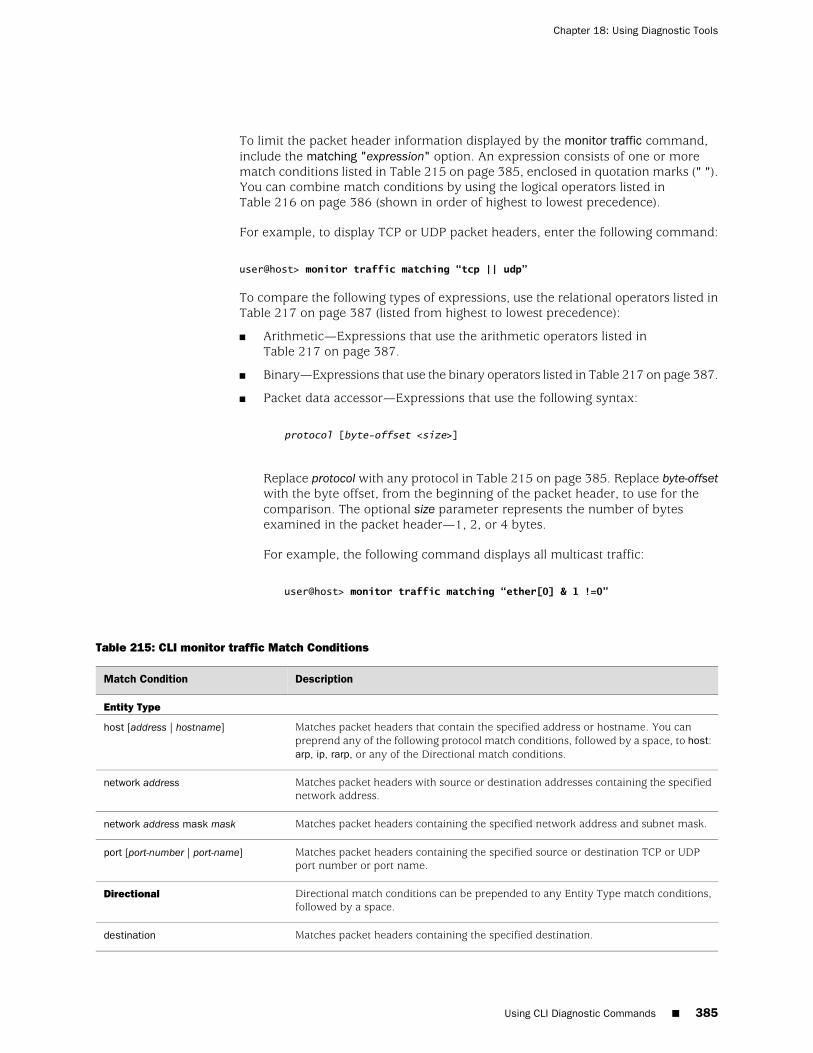
To limit the packet header information displayed by the monitor traffic command,include the matching "expression" option. An expression consists of one or morematch conditions listed in Table 215 on page 385, enclosed in quotation marks (" ").You can combine match conditions by using the logical operators listed inTable 216 on page 386 (shown in order of highest to lowest precedence).
For example, to display TCP or UDP packet headers, enter the following command:
user@host> monitor traffic matching “tcp || udp”
To compare the following types of expressions, use the relational operators listed inTable 217 on page 387 (listed from highest to lowest precedence):
■ Arithmetic—Expressions that use the arithmetic operators listed inTable 217 on page 387.
■ Binary—Expressions that use the binary operators listed in Table 217 on page 387.
■ Packet data accessor—Expressions that use the following syntax:
protocol [byte-offset <size>]
Replace protocol with any protocol in Table 215 on page 385. Replace byte-offsetwith the byte offset, from the beginning of the packet header, to use for thecomparison. The optional size parameter represents the number of bytesexamined in the packet header—1, 2, or 4 bytes.
For example, the following command displays all multicast traffic:
user@host> monitor traffic matching “ether[0] & 1 !=0”
Table 215: CLI monitor traffic Match Conditions
DescriptionMatch Condition
Entity Type
Matches packet headers that contain the specified address or hostname. You canpreprend any of the following protocol match conditions, followed by a space, to host:arp, ip, rarp, or any of the Directional match conditions.
host [address | hostname]
Matches packet headers with source or destination addresses containing the specifiednetwork address.
network address
Matches packet headers containing the specified network address and subnet mask.network address mask mask
Matches packet headers containing the specified source or destination TCP or UDPport number or port name.
port [port-number | port-name]
Directional match conditions can be prepended to any Entity Type match conditions,followed by a space.
Directional
Matches packet headers containing the specified destination.destination
Using CLI Diagnostic Commands ■ 385
Chapter 18: Using Diagnostic Tools
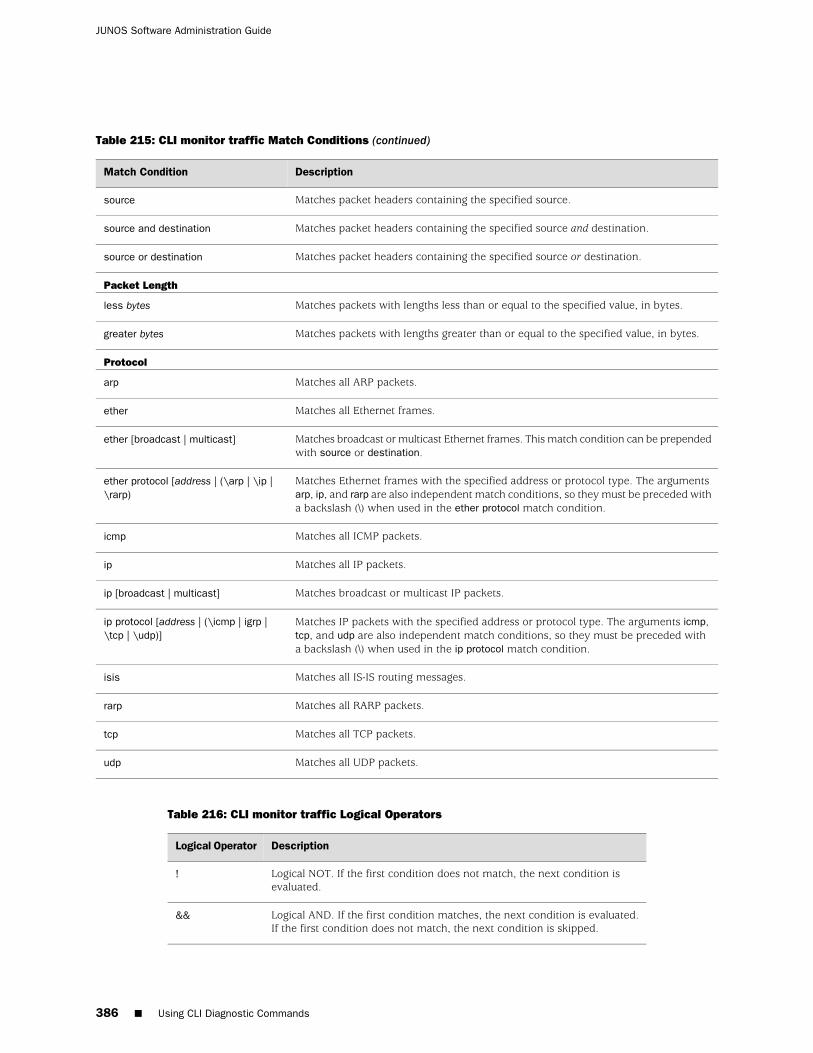
Table 215: CLI monitor traffic Match Conditions (continued)
DescriptionMatch Condition
Matches packet headers containing the specified source.source
Matches packet headers containing the specified source and destination.source and destination
Matches packet headers containing the specified source or destination.source or destination
Packet Length
Matches packets with lengths less than or equal to the specified value, in bytes.less bytes
Matches packets with lengths greater than or equal to the specified value, in bytes.greater bytes
Protocol
Matches all ARP packets.arp
Matches all Ethernet frames.ether
Matches broadcast or multicast Ethernet frames. This match condition can be prependedwith source or destination.
ether [broadcast | multicast]
Matches Ethernet frames with the specified address or protocol type. The argumentsarp, ip, and rarp are also independent match conditions, so they must be preceded witha backslash (\) when used in the ether protocol match condition.
ether protocol [address | (\arp | \ip |\rarp)
Matches all ICMP packets.icmp
Matches all IP packets.ip
Matches broadcast or multicast IP packets.ip [broadcast | multicast]
Matches IP packets with the specified address or protocol type. The arguments icmp,tcp, and udp are also independent match conditions, so they must be preceded witha backslash (\) when used in the ip protocol match condition.
ip protocol [address | (\icmp | igrp |\tcp | \udp)]
Matches all IS-IS routing messages.isis
Matches all RARP packets.rarp
Matches all TCP packets.tcp
Matches all UDP packets.udp
Table 216: CLI monitor traffic Logical Operators
DescriptionLogical Operator
Logical NOT. If the first condition does not match, the next condition isevaluated.
!
Logical AND. If the first condition matches, the next condition is evaluated.If the first condition does not match, the next condition is skipped.
&&
386 ■ Using CLI Diagnostic Commands
JUNOS Software Administration Guide
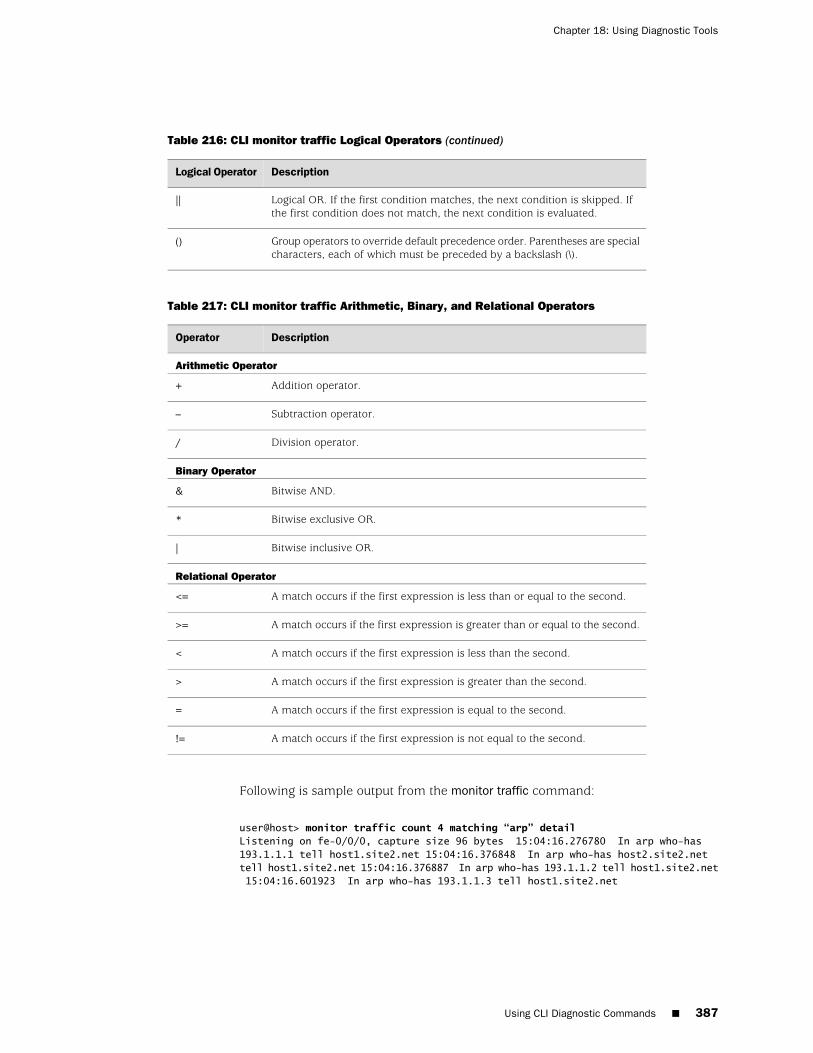
Table 216: CLI monitor traffic Logical Operators (continued)
DescriptionLogical Operator
Logical OR. If the first condition matches, the next condition is skipped. Ifthe first condition does not match, the next condition is evaluated.
||
Group operators to override default precedence order. Parentheses are specialcharacters, each of which must be preceded by a backslash (\).
()
Table 217: CLI monitor traffic Arithmetic, Binary, and Relational Operators
DescriptionOperator
Arithmetic Operator
Addition operator.+
Subtraction operator.–
Division operator./
Binary Operator
Bitwise AND.&
Bitwise exclusive OR.*
Bitwise inclusive OR.|
Relational Operator
A match occurs if the first expression is less than or equal to the second.<=
A match occurs if the first expression is greater than or equal to the second.>=
A match occurs if the first expression is less than the second.<
A match occurs if the first expression is greater than the second.>
A match occurs if the first expression is equal to the second.=
A match occurs if the first expression is not equal to the second.!=
Following is sample output from the monitor traffic command:
user@host> monitor traffic count 4 matching “arp” detailListening on fe-0/0/0, capture size 96 bytes 15:04:16.276780 In arp who-has 193.1.1.1 tell host1.site2.net 15:04:16.376848 In arp who-has host2.site2.net tell host1.site2.net 15:04:16.376887 In arp who-has 193.1.1.2 tell host1.site2.net 15:04:16.601923 In arp who-has 193.1.1.3 tell host1.site2.net
Using CLI Diagnostic Commands ■ 387
Chapter 18: Using Diagnostic Tools

388 ■ Using CLI Diagnostic Commands
JUNOS Software Administration Guide
Chapter 19
Configuring Packet Capture
Packet capture is a tool that helps you to analyze network traffic and troubleshootnetwork problems. The packet capture tool captures real-time data packets travelingover the network, for monitoring and logging.
Packets are captured as binary data, without modification. You can read the packetinformation offline with a packet analyzer such as Ethereal or tcpdump.
If you need to quickly capture packets destined for or originating from the RoutingEngine and analyze them online, you can use the J-Web packet capture diagnostictool. For more information, see “Capturing and Viewing Packets with the J-WebInterface” on page 362.
NOTE: The packet capture tool does not support IPv6 packet capture.
You can use either the J-Web configuration editor or CLI configuration editor toconfigure packet capture. For more information about packet capture, see the JUNOSPolicy Framework Configuration Guide.
This chapter contains the following topics.
■ Packet Capture Support On Different Device Types on page 389
■ Packet Capture Terms on page 390
■ Packet Capture Overview on page 391
■ Before You Begin on page 393
■ Configuring Packet Capture with a Configuration Editor on page 393
■ Changing Encapsulation on Interfaces with Packet Capture Configured on page 398
■ Verifying Packet Capture on page 399
Packet Capture Support On Different Device Types
The following table lists packet capture features, specifies whether the features aresupported on various device types, and indicates where you can find more informationabout each feature.
Packet Capture Support On Different Device Types ■ 389
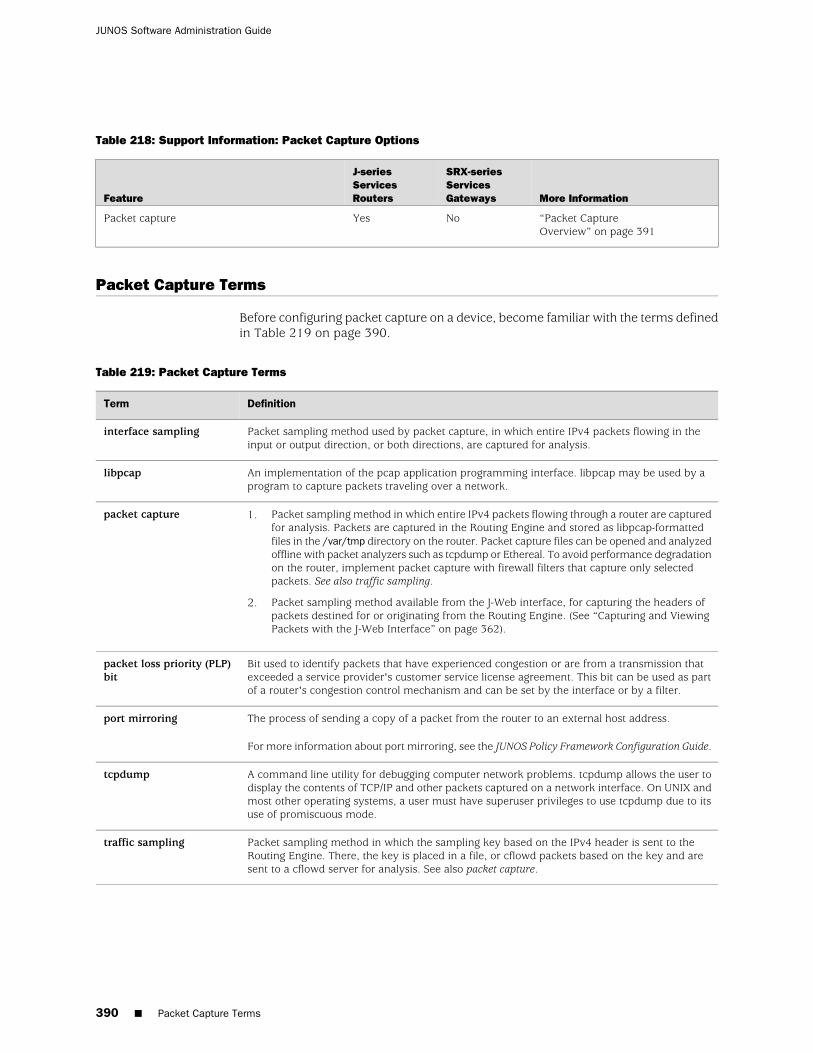
Table 218: Support Information: Packet Capture Options
More Information
SRX-seriesServicesGateways
J-seriesServicesRoutersFeature
“Packet CaptureOverview” on page 391
NoYesPacket capture
Packet Capture Terms
Before configuring packet capture on a device, become familiar with the terms definedin Table 219 on page 390.
Table 219: Packet Capture Terms
DefinitionTerm
Packet sampling method used by packet capture, in which entire IPv4 packets flowing in theinput or output direction, or both directions, are captured for analysis.
interface sampling
An implementation of the pcap application programming interface. libpcap may be used by aprogram to capture packets traveling over a network.
libpcap
1. Packet sampling method in which entire IPv4 packets flowing through a router are capturedfor analysis. Packets are captured in the Routing Engine and stored as libpcap-formattedfiles in the /var/tmp directory on the router. Packet capture files can be opened and analyzedoffline with packet analyzers such as tcpdump or Ethereal. To avoid performance degradationon the router, implement packet capture with firewall filters that capture only selectedpackets. See also traffic sampling.
2. Packet sampling method available from the J-Web interface, for capturing the headers ofpackets destined for or originating from the Routing Engine. (See “Capturing and ViewingPackets with the J-Web Interface” on page 362).
packet capture
Bit used to identify packets that have experienced congestion or are from a transmission thatexceeded a service provider's customer service license agreement. This bit can be used as partof a router's congestion control mechanism and can be set by the interface or by a filter.
packet loss priority (PLP)bit
The process of sending a copy of a packet from the router to an external host address.
For more information about port mirroring, see the JUNOS Policy Framework Configuration Guide.
port mirroring
A command line utility for debugging computer network problems. tcpdump allows the user todisplay the contents of TCP/IP and other packets captured on a network interface. On UNIX andmost other operating systems, a user must have superuser privileges to use tcpdump due to itsuse of promiscuous mode.
tcpdump
Packet sampling method in which the sampling key based on the IPv4 header is sent to theRouting Engine. There, the key is placed in a file, or cflowd packets based on the key and aresent to a cflowd server for analysis. See also packet capture.
traffic sampling
390 ■ Packet Capture Terms
JUNOS Software Administration Guide
Packet Capture Overview
Packet capture is used by network administrators and security engineers for thefollowing purposes:
■ Monitor network traffic and analyze traffic patterns.
■ Identify and troubleshoot network problems.
■ Detect security breaches in the network, such as unauthorized intrusions, spywareactivity, or ping scans.
Packet capture operates like traffic sampling on the device, except that it capturesentire packets including the Layer 2 header rather than packet headers and savesthe contents to a file in the libpcap format. Packet capture also captures IP fragments.You cannot enable packet capture and traffic sampling on the device at the sametime. Unlike traffic sampling, there are no tracing operations for packet capture.
NOTE: You can enable packet capture and port mirroring simultaneously on a device.
For more information about traffic sampling, see the JUNOS Policy FrameworkConfiguration Guide.
This overview contains the following topics:
■ Packet Capture on Device Interfaces on page 391
■ Firewall Filters for Packet Capture on page 392
■ Packet Capture Files on page 392
■ Analysis of Packet Capture Files on page 393
Packet Capture on Device Interfaces
Packet capture is supported on the T1, T3, E1, E3, serial, Fast Ethernet, ADSL,G.SHDSL, PPPoE, and ISDN interfaces.
To capture packets on an ISDN interface, configure packet capture on the dialerinterface. To capture packets on a PPPoE interface, configure packet capture on thePPPoE logical interface.
Packet capture supports PPP, Cisco HDLC, Frame Relay, and other ATMencapsulations. Packet capture also supports Multilink PPP (MLPPP), Multilink FrameRelay end-to-end (MLFR), and Multilink Frame Relay UNI/NNI (MFR) encapsulations.
You can capture all IPv4 packets flowing on an interface in the inbound (ingress) oroutbound (egress) direction or in both directions. Tunnel interfaces can supportpacket capture in the outbound direction only.
Use the J-Web configuration editor or CLI configuration editor to specify maximumpacket size, the filename to be used for storing the captured packets, maximum filesize, maximum number of packet capture files, and the file permissions. See“Configuring Packet Capture on an Interface (Required)” on page 395.
Packet Capture Overview ■ 391
Chapter 19: Configuring Packet Capture
NOTE: For packets captured on T1, T3, E1, E3, serial, and ISDN interfaces in theoutbound (egress) direction, the size of the packet captured might be 1 byte less thanthe maximum packet size configured because of the packet loss priority (PLP) bit.
To modify encapsulation on an interface that has packet capture configured, youmust first disable packet capture. For more information, see “Changing Encapsulationon Interfaces with Packet Capture Configured” on page 398.
Firewall Filters for Packet Capture
When you enable packet capture on a device, all packets flowing in the directionspecified in packet capture configuration (inbound, outbound, or both) are capturedand stored. Configuring an interface to capture all packets might degrade theperformance of the device. You can control the number of packets captured on aninterface with firewall filters and specify various criteria to capture packets for specifictraffic flows.
You must also configure and apply appropriate firewall filters on the interface if youneed to capture packets generated by the host router, because interface samplingdoes not capture packets originating from the host router.
To configure firewall filters for packet capture, see “Configuring a Firewall Filter forPacket Capture (Optional)” on page 395.
For more information about firewall filters, see the JUNOS Software Interfaces andRouting Configuration Guide.
Packet Capture Files
When packet capture is enabled on an interface, the entire packet including theLayer 2 header is captured and stored in a file. You can specify the maximum sizeof the packet to be captured, up to 1500 bytes. Packet capture creates one file foreach physical interface. You can specify the target filename, maximum size of thefile, and maximum number of files.
File creation and storage take place in the following way. Suppose you name thepacket capture file pcap-file. Packet capture creates multiple files (one per physicalinterface), suffixing each file with the name of the physical interface—for example,pcap-file.fe–0.0.1 for the Fast Ethernet interface fe–0.0.1. When the file namedpcap-file.fe-0.0.1 reaches the maximum size, the file is renamed pcap-file.fe-0.0.1.0.When the file named pcap-file.fe-0.0.1 reaches the maximum size again, the filenamed pcap-file.fe-0.0.1.0 is renamed pcap-file.fe-0.0.1.1 and pcap-file.fe-0.0.1 isrenamed pcap-file.fe-0.0.1.0. This process continues until the maximum number offiles is exceeded and the oldest file is overwritten. The pcap-file.fe-0.0.1 file is alwaysthe latest file.
Packet capture files are not removed even after you disable packet capture on aninterface.
392 ■ Packet Capture Overview
JUNOS Software Administration Guide
Analysis of Packet Capture Files
Packet capture files are stored in libpcap format in the /var/tmp directory. You canspecify user or administrator privileges for the files.
Packet capture files can be opened and analyzed offline with tcpdump or any packetanalyzer that recognizes the libpcap format. You can also use FTP or the SessionControl Protocol (SCP) to transfer the packet capture files to an external device.
NOTE: Disable packet capture before opening the file for analysis or transferring thefile to an external device with FTP or SCP. Disabling packet capture ensures that theinternal file buffer is flushed and all the captured packets are written to the file. Todisable packet capture on an interface, see “Disabling Packet Capture” on page 397.
For more details about analyzing packet capture files, see Verifying CapturedPackets on page 400.
Before You Begin
Before you begin configuring packet capture, complete the following tasks:
■ Establish basic connectivity. See the Getting Started Guide for your device.
■ Configure network interfaces. See the JUNOS Software Interfaces and RoutingConfiguration Guide.
■ If you do not already have an understanding of the packet capture feature, see“Packet Capture Overview” on page 391.
Configuring Packet Capture with a Configuration Editor
To configure packet capture on a device, you must perform the following tasksmarked (Required):
■ Enabling Packet Capture (Required) on page 393
■ Configuring Packet Capture on an Interface (Required) on page 395
■ Configuring a Firewall Filter for Packet Capture (Optional) on page 395
■ Disabling Packet Capture on page 397
■ Deleting Packet Capture Files on page 397
Enabling Packet Capture (Required)
To enable packet capture on the device:
1. Navigate to the top of the configuration hierarchy in either the J-Web or CLIconfiguration editor.
2. Perform the configuration tasks described in Table 220 on page 394.
3. Go on to “Configuring Packet Capture on an Interface (Required)” on page 395.
Before You Begin ■ 393
Chapter 19: Configuring Packet Capture
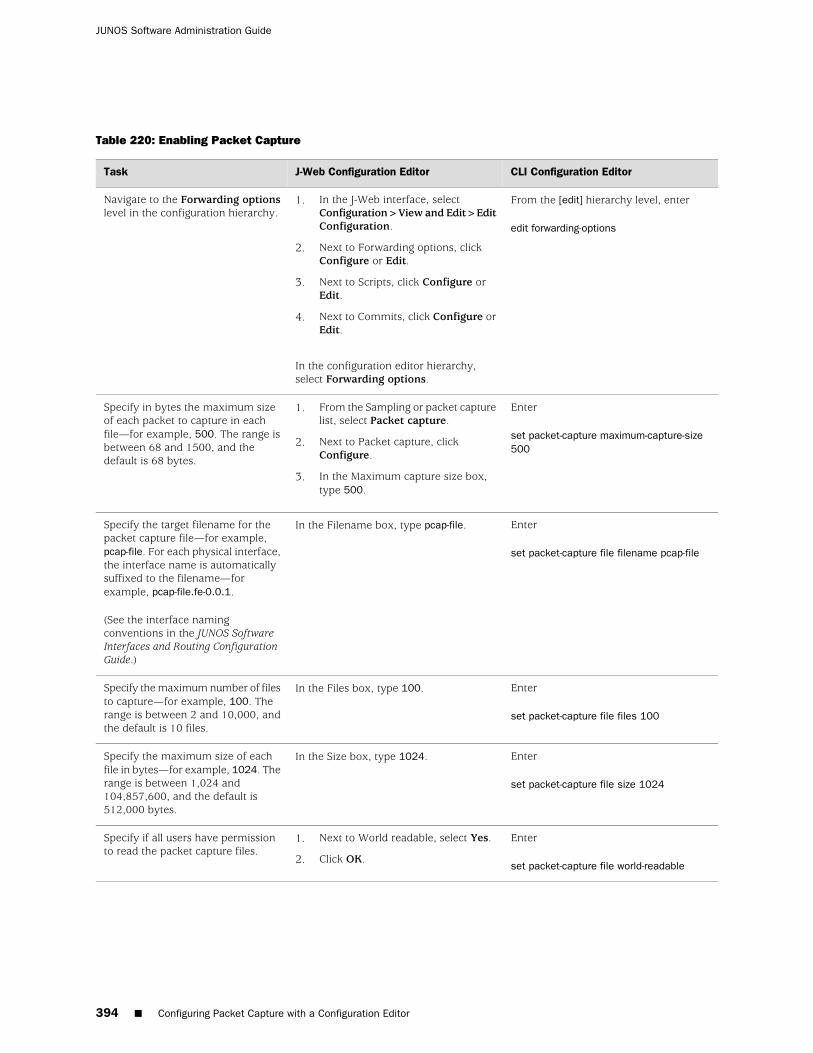
Table 220: Enabling Packet Capture
CLI Configuration EditorJ-Web Configuration EditorTask
From the [edit] hierarchy level, enter
edit forwarding-options
1. In the J-Web interface, selectConfiguration>View and Edit>EditConfiguration.
2. Next to Forwarding options, clickConfigure or Edit.
3. Next to Scripts, click Configure orEdit.
4. Next to Commits, click Configure orEdit.
In the configuration editor hierarchy,select Forwarding options.
Navigate to the Forwarding optionslevel in the configuration hierarchy.
Enter
set packet-capture maximum-capture-size500
1. From the Sampling or packet capturelist, select Packet capture.
2. Next to Packet capture, clickConfigure.
3. In the Maximum capture size box,type 500.
Specify in bytes the maximum sizeof each packet to capture in eachfile—for example, 500. The range isbetween 68 and 1500, and thedefault is 68 bytes.
Enter
set packet-capture file filename pcap-file
In the Filename box, type pcap-file.Specify the target filename for thepacket capture file—for example,pcap-file. For each physical interface,the interface name is automaticallysuffixed to the filename—forexample, pcap-file.fe-0.0.1.
(See the interface namingconventions in the JUNOS SoftwareInterfaces and Routing ConfigurationGuide.)
Enter
set packet-capture file files 100
In the Files box, type 100.Specify the maximum number of filesto capture—for example, 100. Therange is between 2 and 10,000, andthe default is 10 files.
Enter
set packet-capture file size 1024
In the Size box, type 1024.Specify the maximum size of eachfile in bytes—for example, 1024. Therange is between 1,024 and104,857,600, and the default is512,000 bytes.
Enter
set packet-capture file world-readable
1. Next to World readable, select Yes.
2. Click OK.
Specify if all users have permissionto read the packet capture files.
394 ■ Configuring Packet Capture with a Configuration Editor
JUNOS Software Administration Guide
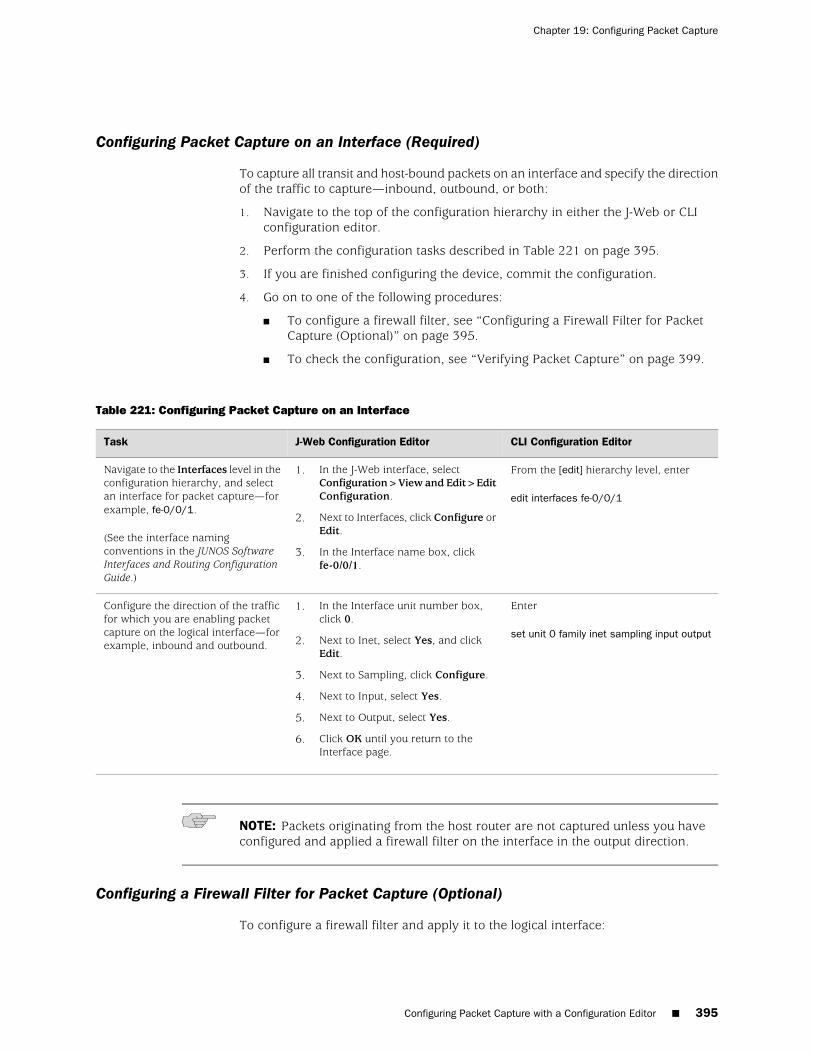
Configuring Packet Capture on an Interface (Required)
To capture all transit and host-bound packets on an interface and specify the directionof the traffic to capture—inbound, outbound, or both:
1. Navigate to the top of the configuration hierarchy in either the J-Web or CLIconfiguration editor.
2. Perform the configuration tasks described in Table 221 on page 395.
3. If you are finished configuring the device, commit the configuration.
4. Go on to one of the following procedures:
■ To configure a firewall filter, see “Configuring a Firewall Filter for PacketCapture (Optional)” on page 395.
■ To check the configuration, see “Verifying Packet Capture” on page 399.
Table 221: Configuring Packet Capture on an Interface
CLI Configuration EditorJ-Web Configuration EditorTask
From the [edit] hierarchy level, enter
edit interfaces fe-0/0/1
1. In the J-Web interface, selectConfiguration>View and Edit>EditConfiguration.
2. Next to Interfaces, click Configure orEdit.
3. In the Interface name box, clickfe-0/0/1.
Navigate to the Interfaces level in theconfiguration hierarchy, and selectan interface for packet capture—forexample, fe-0/0/1.
(See the interface namingconventions in the JUNOS SoftwareInterfaces and Routing ConfigurationGuide.)
Enter
set unit 0 family inet sampling input output
1. In the Interface unit number box,click 0.
2. Next to Inet, select Yes, and clickEdit.
3. Next to Sampling, click Configure.
4. Next to Input, select Yes.
5. Next to Output, select Yes.
6. Click OK until you return to theInterface page.
Configure the direction of the trafficfor which you are enabling packetcapture on the logical interface—forexample, inbound and outbound.
NOTE: Packets originating from the host router are not captured unless you haveconfigured and applied a firewall filter on the interface in the output direction.
Configuring a Firewall Filter for Packet Capture (Optional)
To configure a firewall filter and apply it to the logical interface:
Configuring Packet Capture with a Configuration Editor ■ 395
Chapter 19: Configuring Packet Capture
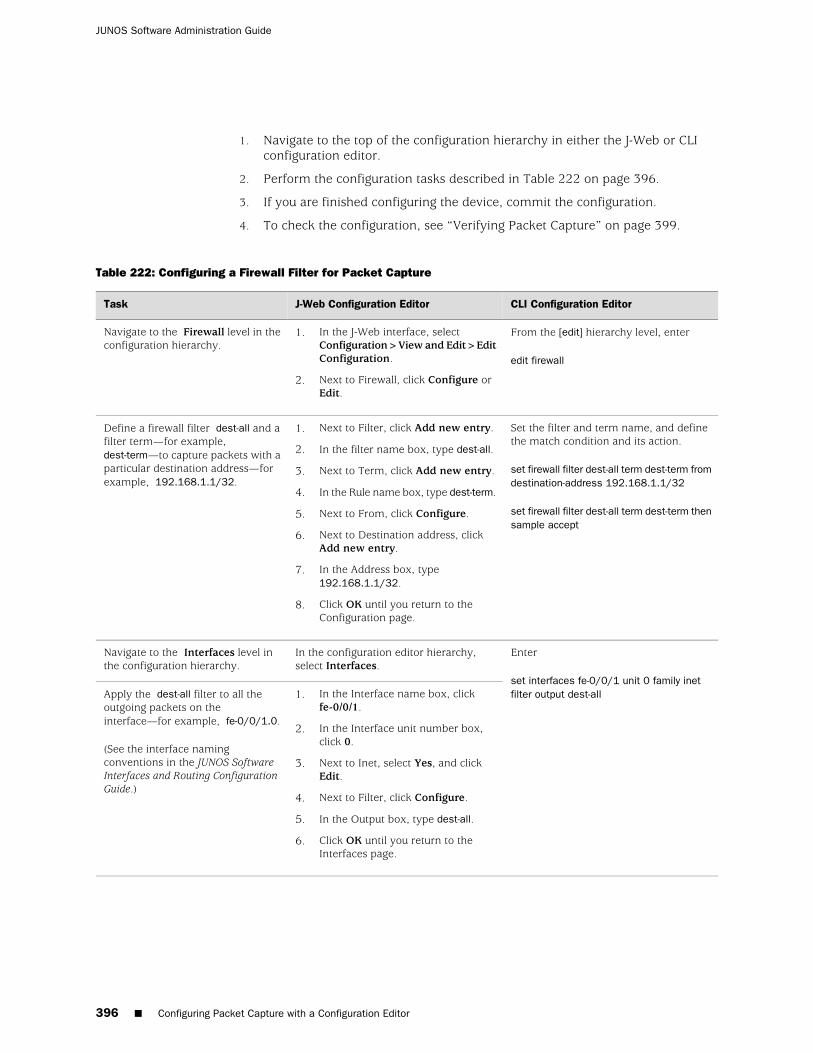
1. Navigate to the top of the configuration hierarchy in either the J-Web or CLIconfiguration editor.
2. Perform the configuration tasks described in Table 222 on page 396.
3. If you are finished configuring the device, commit the configuration.
4. To check the configuration, see “Verifying Packet Capture” on page 399.
Table 222: Configuring a Firewall Filter for Packet Capture
CLI Configuration EditorJ-Web Configuration EditorTask
From the [edit] hierarchy level, enter
edit firewall
1. In the J-Web interface, selectConfiguration>View and Edit>EditConfiguration.
2. Next to Firewall, click Configure orEdit.
Navigate to the Firewall level in theconfiguration hierarchy.
Set the filter and term name, and definethe match condition and its action.
set firewall filter dest-all term dest-term fromdestination-address 192.168.1.1/32
set firewall filter dest-all term dest-term thensample accept
1. Next to Filter, click Add new entry.
2. In the filter name box, type dest-all.
3. Next to Term, click Add new entry.
4. In the Rule name box, type dest-term.
5. Next to From, click Configure.
6. Next to Destination address, clickAdd new entry.
7. In the Address box, type192.168.1.1/32.
8. Click OK until you return to theConfiguration page.
Define a firewall filter dest-all and afilter term—for example,dest-term—to capture packets with aparticular destination address—forexample, 192.168.1.1/32.
Enter
set interfaces fe-0/0/1 unit 0 family inetfilter output dest-all
In the configuration editor hierarchy,select Interfaces.
Navigate to the Interfaces level inthe configuration hierarchy.
1. In the Interface name box, clickfe-0/0/1.
2. In the Interface unit number box,click 0.
3. Next to Inet, select Yes, and clickEdit.
4. Next to Filter, click Configure.
5. In the Output box, type dest-all.
6. Click OK until you return to theInterfaces page.
Apply the dest-all filter to all theoutgoing packets on theinterface—for example, fe-0/0/1.0.
(See the interface namingconventions in the JUNOS SoftwareInterfaces and Routing ConfigurationGuide.)
396 ■ Configuring Packet Capture with a Configuration Editor
JUNOS Software Administration Guide
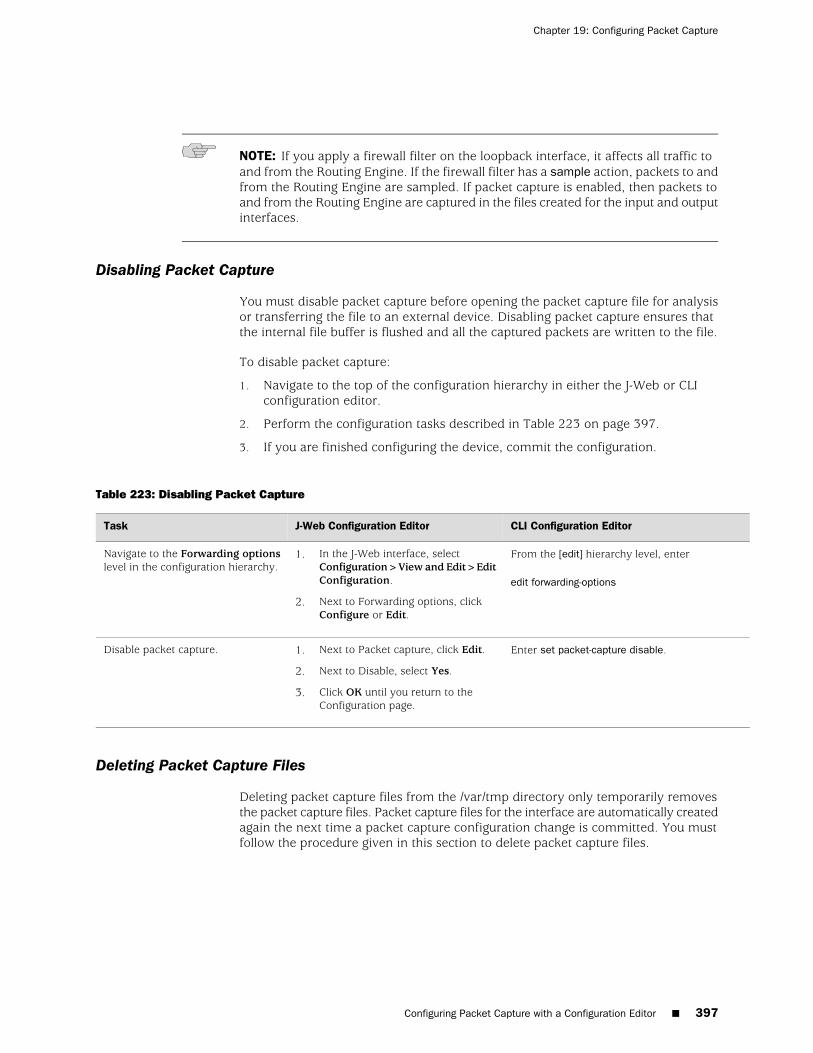
NOTE: If you apply a firewall filter on the loopback interface, it affects all traffic toand from the Routing Engine. If the firewall filter has a sample action, packets to andfrom the Routing Engine are sampled. If packet capture is enabled, then packets toand from the Routing Engine are captured in the files created for the input and outputinterfaces.
Disabling Packet Capture
You must disable packet capture before opening the packet capture file for analysisor transferring the file to an external device. Disabling packet capture ensures thatthe internal file buffer is flushed and all the captured packets are written to the file.
To disable packet capture:
1. Navigate to the top of the configuration hierarchy in either the J-Web or CLIconfiguration editor.
2. Perform the configuration tasks described in Table 223 on page 397.
3. If you are finished configuring the device, commit the configuration.
Table 223: Disabling Packet Capture
CLI Configuration EditorJ-Web Configuration EditorTask
From the [edit] hierarchy level, enter
edit forwarding-options
1. In the J-Web interface, selectConfiguration>View and Edit>EditConfiguration.
2. Next to Forwarding options, clickConfigure or Edit.
Navigate to the Forwarding optionslevel in the configuration hierarchy.
Enter set packet-capture disable.1. Next to Packet capture, click Edit.
2. Next to Disable, select Yes.
3. Click OK until you return to theConfiguration page.
Disable packet capture.
Deleting Packet Capture Files
Deleting packet capture files from the /var/tmp directory only temporarily removesthe packet capture files. Packet capture files for the interface are automatically createdagain the next time a packet capture configuration change is committed. You mustfollow the procedure given in this section to delete packet capture files.
Configuring Packet Capture with a Configuration Editor ■ 397
Chapter 19: Configuring Packet Capture
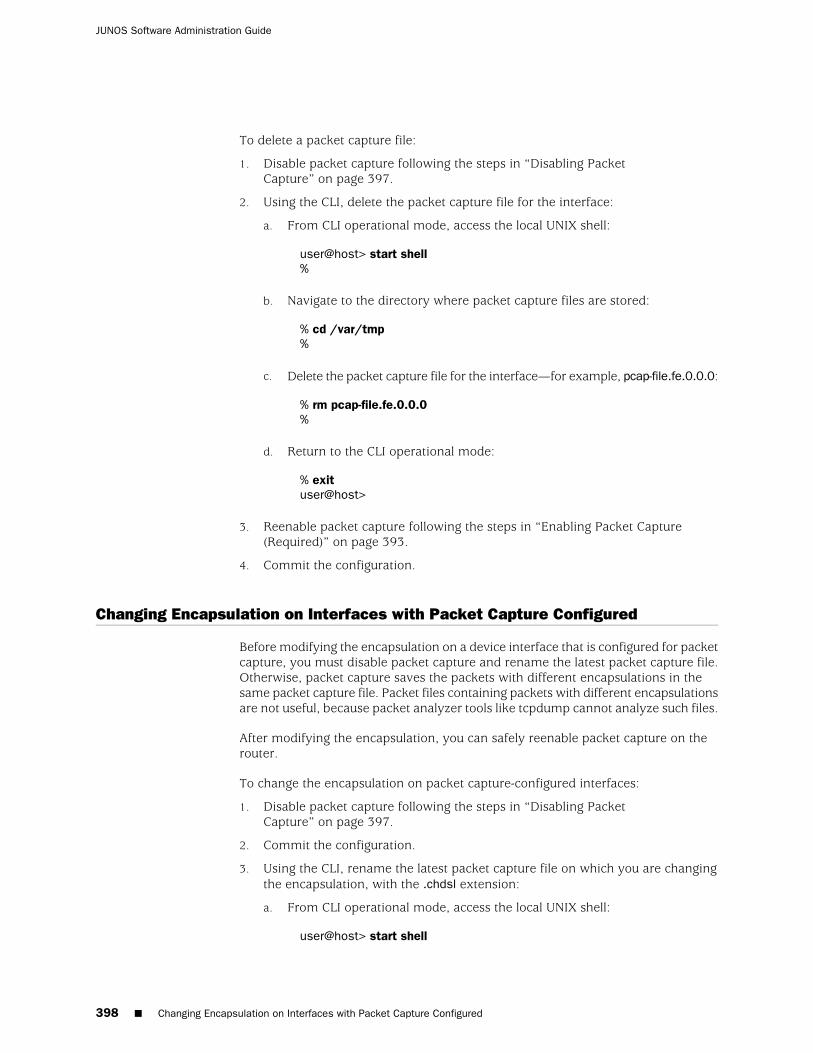
To delete a packet capture file:
1. Disable packet capture following the steps in “Disabling PacketCapture” on page 397.
2. Using the CLI, delete the packet capture file for the interface:
a. From CLI operational mode, access the local UNIX shell:
user@host> start shell%
b. Navigate to the directory where packet capture files are stored:
% cd /var/tmp%
c. Delete the packet capture file for the interface—for example, pcap-file.fe.0.0.0:
% rm pcap-file.fe.0.0.0%
d. Return to the CLI operational mode:
% exituser@host>
3. Reenable packet capture following the steps in “Enabling Packet Capture(Required)” on page 393.
4. Commit the configuration.
Changing Encapsulation on Interfaces with Packet Capture Configured
Before modifying the encapsulation on a device interface that is configured for packetcapture, you must disable packet capture and rename the latest packet capture file.Otherwise, packet capture saves the packets with different encapsulations in thesame packet capture file. Packet files containing packets with different encapsulationsare not useful, because packet analyzer tools like tcpdump cannot analyze such files.
After modifying the encapsulation, you can safely reenable packet capture on therouter.
To change the encapsulation on packet capture-configured interfaces:
1. Disable packet capture following the steps in “Disabling PacketCapture” on page 397.
2. Commit the configuration.
3. Using the CLI, rename the latest packet capture file on which you are changingthe encapsulation, with the .chdsl extension:
a. From CLI operational mode, access the local UNIX shell:
user@host> start shell
398 ■ Changing Encapsulation on Interfaces with Packet Capture Configured
JUNOS Software Administration Guide
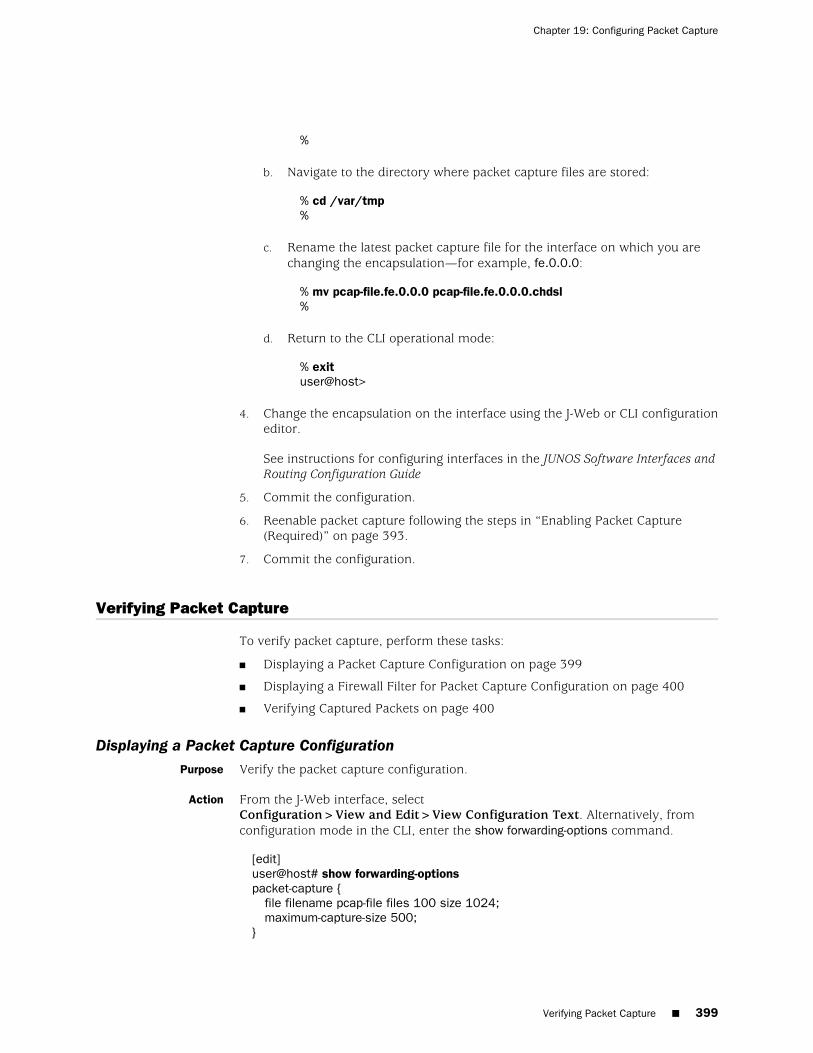
%
b. Navigate to the directory where packet capture files are stored:
% cd /var/tmp%
c. Rename the latest packet capture file for the interface on which you arechanging the encapsulation—for example, fe.0.0.0:
% mv pcap-file.fe.0.0.0 pcap-file.fe.0.0.0.chdsl%
d. Return to the CLI operational mode:
% exituser@host>
4. Change the encapsulation on the interface using the J-Web or CLI configurationeditor.
See instructions for configuring interfaces in the JUNOS Software Interfaces andRouting Configuration Guide
5. Commit the configuration.
6. Reenable packet capture following the steps in “Enabling Packet Capture(Required)” on page 393.
7. Commit the configuration.
Verifying Packet Capture
To verify packet capture, perform these tasks:
■ Displaying a Packet Capture Configuration on page 399
■ Displaying a Firewall Filter for Packet Capture Configuration on page 400
■ Verifying Captured Packets on page 400
Displaying a Packet Capture ConfigurationPurpose Verify the packet capture configuration.
Action From the J-Web interface, selectConfiguration>View and Edit>View Configuration Text. Alternatively, fromconfiguration mode in the CLI, enter the show forwarding-options command.
[edit]user@host# show forwarding-optionspacket-capture {
file filename pcap-file files 100 size 1024;maximum-capture-size 500;
}
Verifying Packet Capture ■ 399
Chapter 19: Configuring Packet Capture
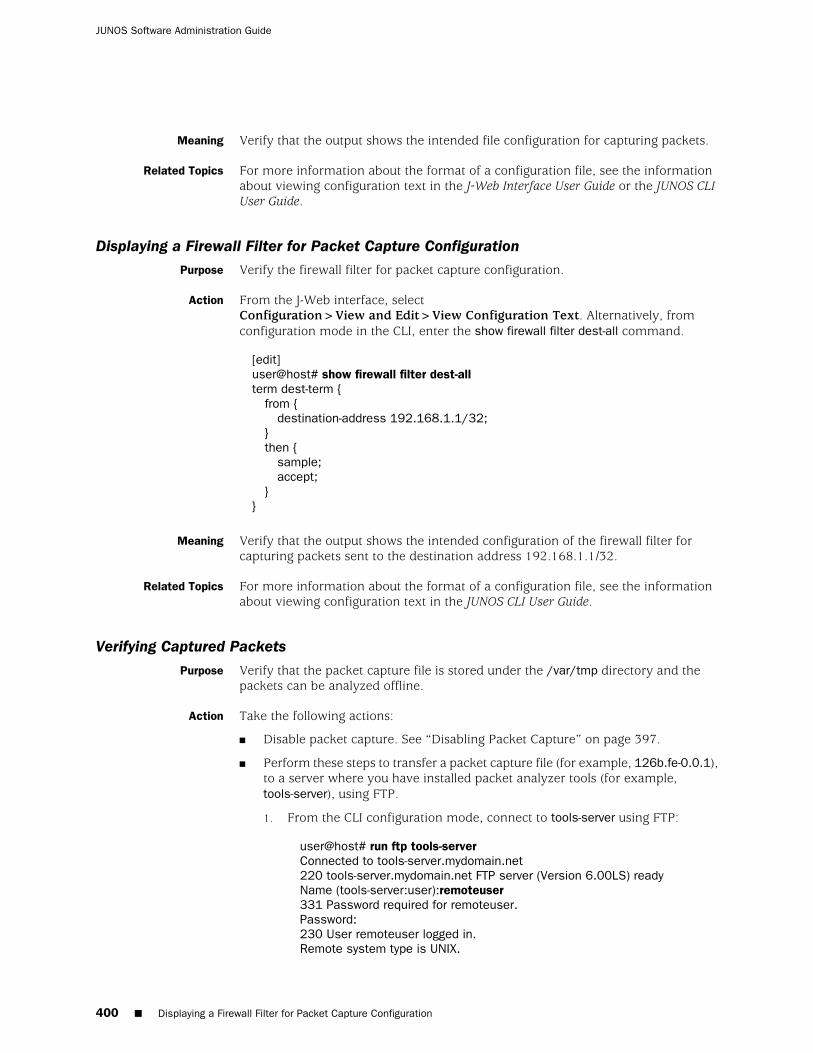
Meaning Verify that the output shows the intended file configuration for capturing packets.
Related Topics For more information about the format of a configuration file, see the informationabout viewing configuration text in the J-Web Interface User Guide or the JUNOS CLIUser Guide.
Displaying a Firewall Filter for Packet Capture ConfigurationPurpose Verify the firewall filter for packet capture configuration.
Action From the J-Web interface, selectConfiguration>View and Edit>View Configuration Text. Alternatively, fromconfiguration mode in the CLI, enter the show firewall filter dest-all command.
[edit]user@host# show firewall filter dest-allterm dest-term {
from {destination-address 192.168.1.1/32;
}then {
sample;accept;
}}
Meaning Verify that the output shows the intended configuration of the firewall filter forcapturing packets sent to the destination address 192.168.1.1/32.
Related Topics For more information about the format of a configuration file, see the informationabout viewing configuration text in the JUNOS CLI User Guide.
Verifying Captured Packets
Purpose Verify that the packet capture file is stored under the /var/tmp directory and thepackets can be analyzed offline.
Action Take the following actions:
■ Disable packet capture. See “Disabling Packet Capture” on page 397.
■ Perform these steps to transfer a packet capture file (for example, 126b.fe-0.0.1),to a server where you have installed packet analyzer tools (for example,tools-server), using FTP.
1. From the CLI configuration mode, connect to tools-server using FTP:
user@host# run ftp tools-serverConnected to tools-server.mydomain.net220 tools-server.mydomain.net FTP server (Version 6.00LS) readyName (tools-server:user):remoteuser331 Password required for remoteuser.Password:230 User remoteuser logged in.Remote system type is UNIX.
400 ■ Displaying a Firewall Filter for Packet Capture Configuration
JUNOS Software Administration Guide
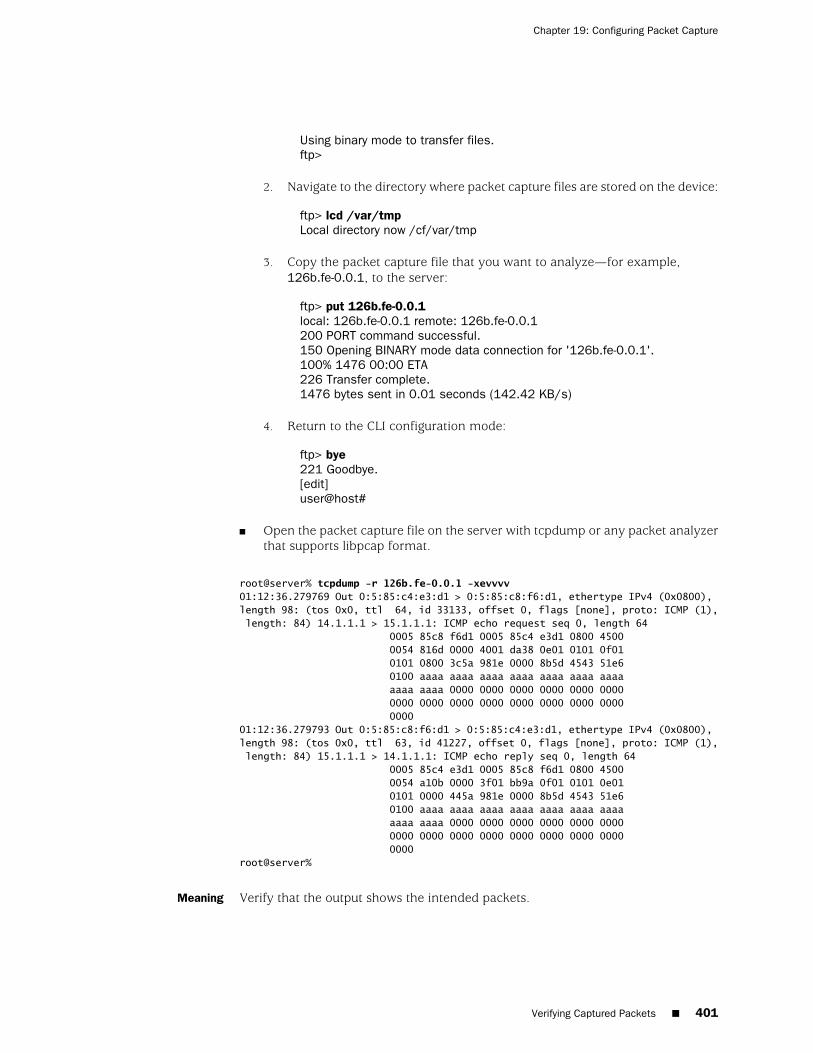
Using binary mode to transfer files.ftp>
2. Navigate to the directory where packet capture files are stored on the device:
ftp> lcd /var/tmpLocal directory now /cf/var/tmp
3. Copy the packet capture file that you want to analyze—for example,126b.fe-0.0.1, to the server:
ftp> put 126b.fe-0.0.1local: 126b.fe-0.0.1 remote: 126b.fe-0.0.1200 PORT command successful.150 Opening BINARY mode data connection for '126b.fe-0.0.1'.100% 1476 00:00 ETA226 Transfer complete.1476 bytes sent in 0.01 seconds (142.42 KB/s)
4. Return to the CLI configuration mode:
ftp> bye221 Goodbye.[edit]user@host#
■ Open the packet capture file on the server with tcpdump or any packet analyzerthat supports libpcap format.
root@server% tcpdump -r 126b.fe-0.0.1 -xevvvv01:12:36.279769 Out 0:5:85:c4:e3:d1 > 0:5:85:c8:f6:d1, ethertype IPv4 (0x0800), length 98: (tos 0x0, ttl 64, id 33133, offset 0, flags [none], proto: ICMP (1), length: 84) 14.1.1.1 > 15.1.1.1: ICMP echo request seq 0, length 64 0005 85c8 f6d1 0005 85c4 e3d1 0800 4500 0054 816d 0000 4001 da38 0e01 0101 0f01 0101 0800 3c5a 981e 0000 8b5d 4543 51e6 0100 aaaa aaaa aaaa aaaa aaaa aaaa aaaa aaaa aaaa 0000 0000 0000 0000 0000 0000 0000 0000 0000 0000 0000 0000 0000 0000 000001:12:36.279793 Out 0:5:85:c8:f6:d1 > 0:5:85:c4:e3:d1, ethertype IPv4 (0x0800), length 98: (tos 0x0, ttl 63, id 41227, offset 0, flags [none], proto: ICMP (1), length: 84) 15.1.1.1 > 14.1.1.1: ICMP echo reply seq 0, length 64 0005 85c4 e3d1 0005 85c8 f6d1 0800 4500 0054 a10b 0000 3f01 bb9a 0f01 0101 0e01 0101 0000 445a 981e 0000 8b5d 4543 51e6 0100 aaaa aaaa aaaa aaaa aaaa aaaa aaaa aaaa aaaa 0000 0000 0000 0000 0000 0000 0000 0000 0000 0000 0000 0000 0000 0000 0000root@server%
Meaning Verify that the output shows the intended packets.
Verifying Captured Packets ■ 401
Chapter 19: Configuring Packet Capture

402 ■ Verifying Captured Packets
JUNOS Software Administration Guide
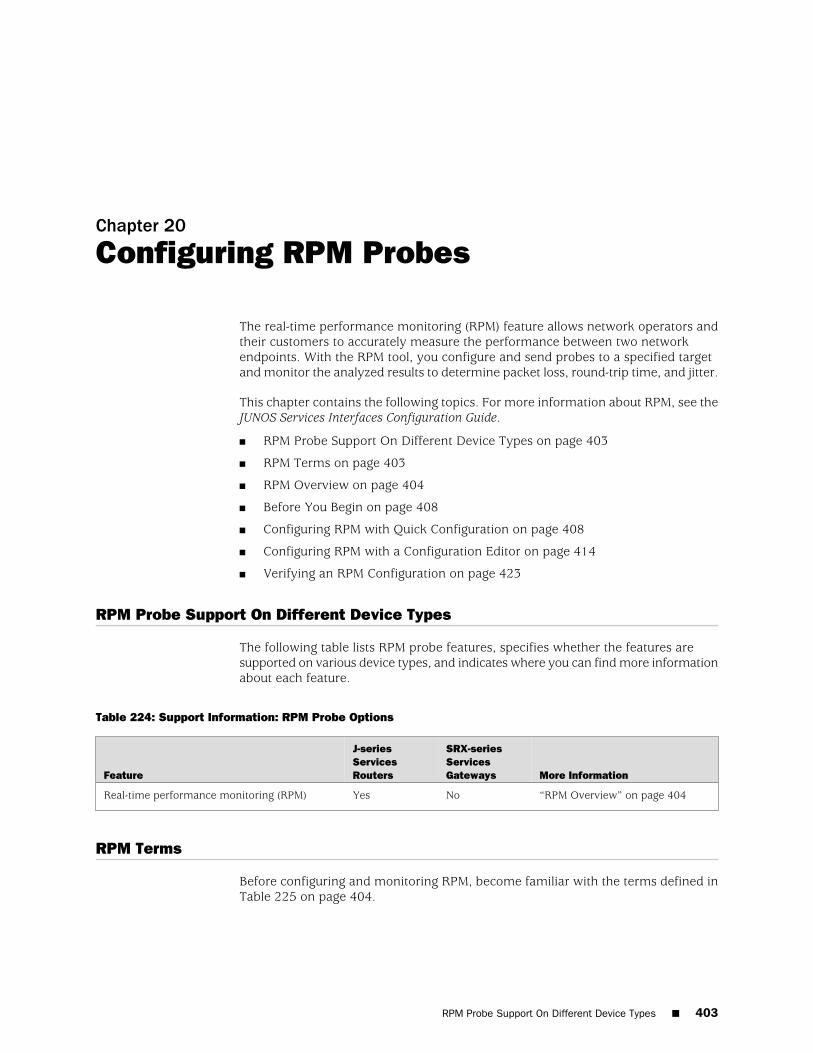
Chapter 20
Configuring RPM Probes
The real-time performance monitoring (RPM) feature allows network operators andtheir customers to accurately measure the performance between two networkendpoints. With the RPM tool, you configure and send probes to a specified targetand monitor the analyzed results to determine packet loss, round-trip time, and jitter.
This chapter contains the following topics. For more information about RPM, see theJUNOS Services Interfaces Configuration Guide.
■ RPM Probe Support On Different Device Types on page 403
■ RPM Terms on page 403
■ RPM Overview on page 404
■ Before You Begin on page 408
■ Configuring RPM with Quick Configuration on page 408
■ Configuring RPM with a Configuration Editor on page 414
■ Verifying an RPM Configuration on page 423
RPM Probe Support On Different Device Types
The following table lists RPM probe features, specifies whether the features aresupported on various device types, and indicates where you can find more informationabout each feature.
Table 224: Support Information: RPM Probe Options
More Information
SRX-seriesServicesGateways
J-seriesServicesRoutersFeature
“RPM Overview” on page 404NoYesReal-time performance monitoring (RPM)
RPM Terms
Before configuring and monitoring RPM, become familiar with the terms defined inTable 225 on page 404.
RPM Probe Support On Different Device Types ■ 403
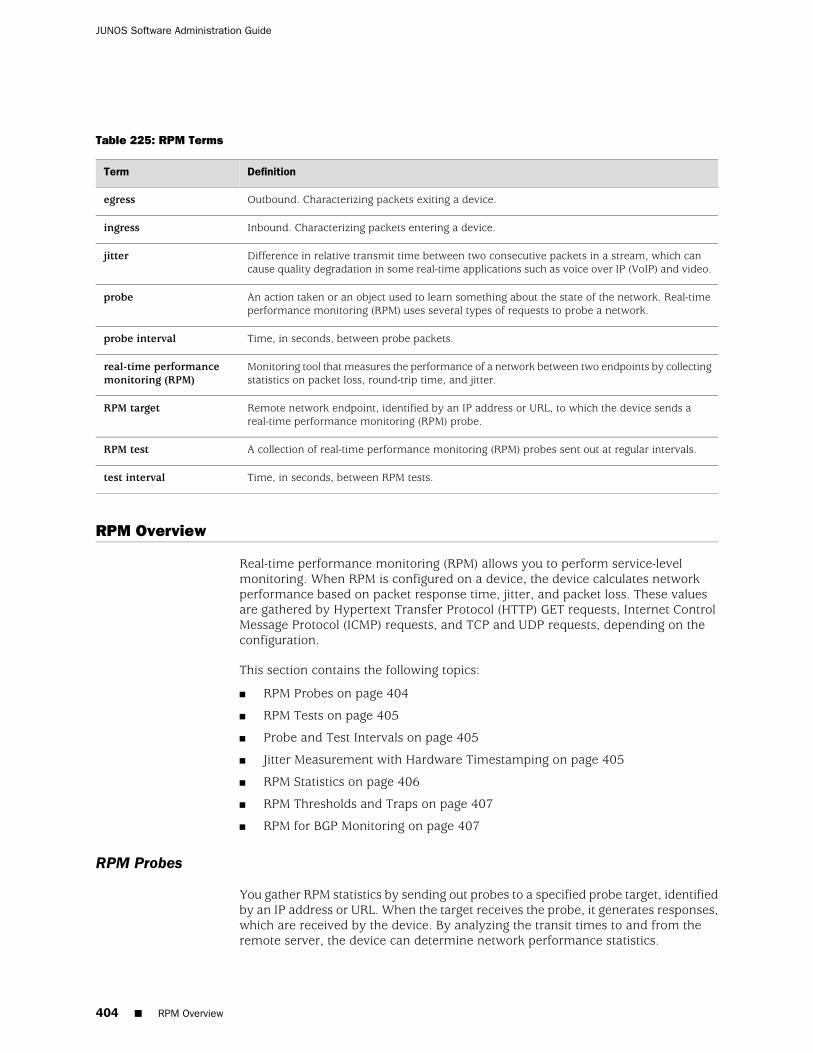
Table 225: RPM Terms
DefinitionTerm
Outbound. Characterizing packets exiting a device.egress
Inbound. Characterizing packets entering a device.ingress
Difference in relative transmit time between two consecutive packets in a stream, which cancause quality degradation in some real-time applications such as voice over IP (VoIP) and video.
jitter
An action taken or an object used to learn something about the state of the network. Real-timeperformance monitoring (RPM) uses several types of requests to probe a network.
probe
Time, in seconds, between probe packets.probe interval
Monitoring tool that measures the performance of a network between two endpoints by collectingstatistics on packet loss, round-trip time, and jitter.
real-time performancemonitoring (RPM)
Remote network endpoint, identified by an IP address or URL, to which the device sends areal-time performance monitoring (RPM) probe.
RPM target
A collection of real-time performance monitoring (RPM) probes sent out at regular intervals.RPM test
Time, in seconds, between RPM tests.test interval
RPM Overview
Real-time performance monitoring (RPM) allows you to perform service-levelmonitoring. When RPM is configured on a device, the device calculates networkperformance based on packet response time, jitter, and packet loss. These valuesare gathered by Hypertext Transfer Protocol (HTTP) GET requests, Internet ControlMessage Protocol (ICMP) requests, and TCP and UDP requests, depending on theconfiguration.
This section contains the following topics:
■ RPM Probes on page 404
■ RPM Tests on page 405
■ Probe and Test Intervals on page 405
■ Jitter Measurement with Hardware Timestamping on page 405
■ RPM Statistics on page 406
■ RPM Thresholds and Traps on page 407
■ RPM for BGP Monitoring on page 407
RPM Probes
You gather RPM statistics by sending out probes to a specified probe target, identifiedby an IP address or URL. When the target receives the probe, it generates responses,which are received by the device. By analyzing the transit times to and from theremote server, the device can determine network performance statistics.
404 ■ RPM Overview
JUNOS Software Administration Guide
The device sends out the following probe types:
■ HTTP GET request at a target URL
■ HTTP GET request for metadata at a target URL
■ ICMP echo request to a target address (the default)
■ ICMP timestamp request to a target address
■ UDP ping packets to a target device
■ UDP timestamp requests to a target address
■ TCP ping packets to a target device
UDP and TCP probe types require that the remote server be configured as an RPMreceiver so that it generates responses to the probes.
The RPM probe results are also available in the form of MIB objects through the SNMPprotocol. To configure SNMP, see “Configuring SNMP for NetworkManagement” on page 83.
RPM Tests
Each probed target is monitored over the course of a test. A test represents a collectionof probes, sent out at regular intervals, as defined in the configuration. Statistics arethen returned for each test. Because a test is a collection of probes that have beenmonitored over some amount of time, test statistics such as standard deviation andjitter can be calculated and included with the average probe statistics.
Probe and Test Intervals
Within a test, RPM probes are sent at regular intervals, configured in seconds. Whenthe total number of probes has been sent and the corresponding responses received,the test is complete. You can manually set the probe interval for each test to controlhow the RPM test is conducted.
After all the probes for a particular test have been sent, the test begins again. Thetime between tests is the test interval. You can manually set the test interval to tuneRPM performance.
Jitter Measurement with Hardware Timestamping
Jitter is the difference in relative transit time between two consecutive probes.
You can timestamp the following RPM probes to improve the measurement of latencyor jitter:
■ ICMP ping
■ ICMP ping timestamp
■ UDP ping
■ UDP ping timestamp
RPM Overview ■ 405
Chapter 20: Configuring RPM Probes
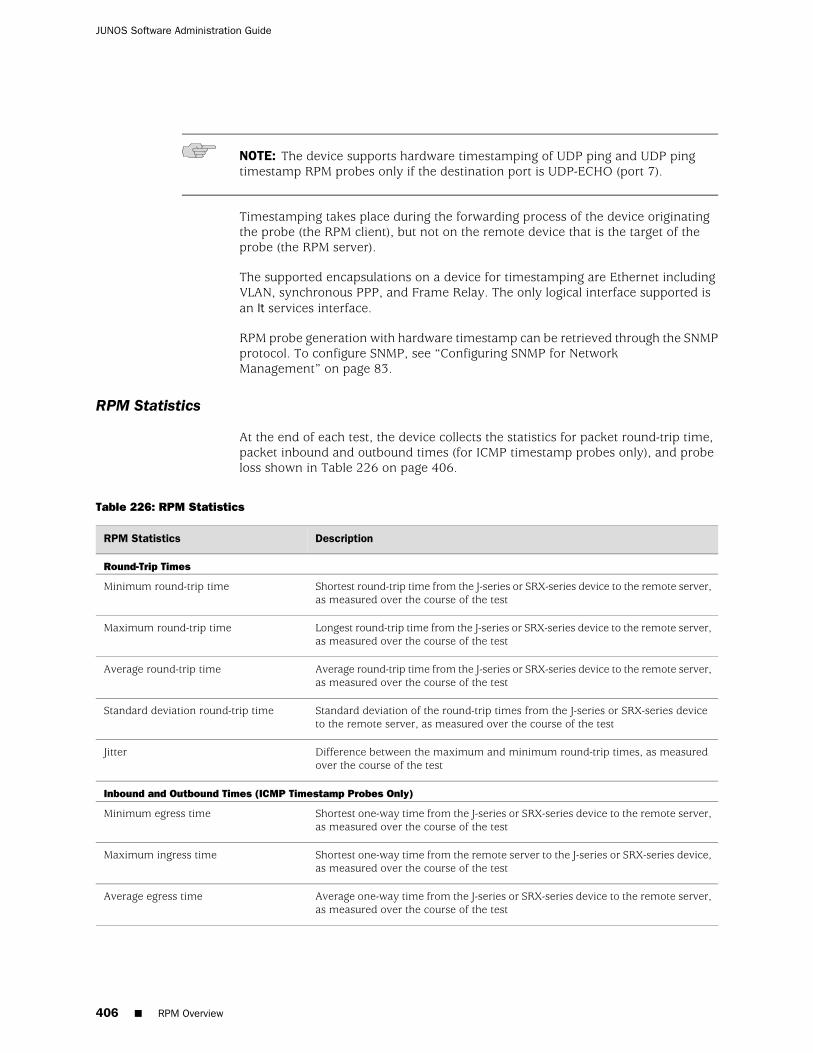
NOTE: The device supports hardware timestamping of UDP ping and UDP pingtimestamp RPM probes only if the destination port is UDP-ECHO (port 7).
Timestamping takes place during the forwarding process of the device originatingthe probe (the RPM client), but not on the remote device that is the target of theprobe (the RPM server).
The supported encapsulations on a device for timestamping are Ethernet includingVLAN, synchronous PPP, and Frame Relay. The only logical interface supported isan lt services interface.
RPM probe generation with hardware timestamp can be retrieved through the SNMPprotocol. To configure SNMP, see “Configuring SNMP for NetworkManagement” on page 83.
RPM Statistics
At the end of each test, the device collects the statistics for packet round-trip time,packet inbound and outbound times (for ICMP timestamp probes only), and probeloss shown in Table 226 on page 406.
Table 226: RPM Statistics
DescriptionRPM Statistics
Round-Trip Times
Shortest round-trip time from the J-series or SRX-series device to the remote server,as measured over the course of the test
Minimum round-trip time
Longest round-trip time from the J-series or SRX-series device to the remote server,as measured over the course of the test
Maximum round-trip time
Average round-trip time from the J-series or SRX-series device to the remote server,as measured over the course of the test
Average round-trip time
Standard deviation of the round-trip times from the J-series or SRX-series deviceto the remote server, as measured over the course of the test
Standard deviation round-trip time
Difference between the maximum and minimum round-trip times, as measuredover the course of the test
Jitter
Inbound and Outbound Times (ICMP Timestamp Probes Only)
Shortest one-way time from the J-series or SRX-series device to the remote server,as measured over the course of the test
Minimum egress time
Shortest one-way time from the remote server to the J-series or SRX-series device,as measured over the course of the test
Maximum ingress time
Average one-way time from the J-series or SRX-series device to the remote server,as measured over the course of the test
Average egress time
406 ■ RPM Overview
JUNOS Software Administration Guide
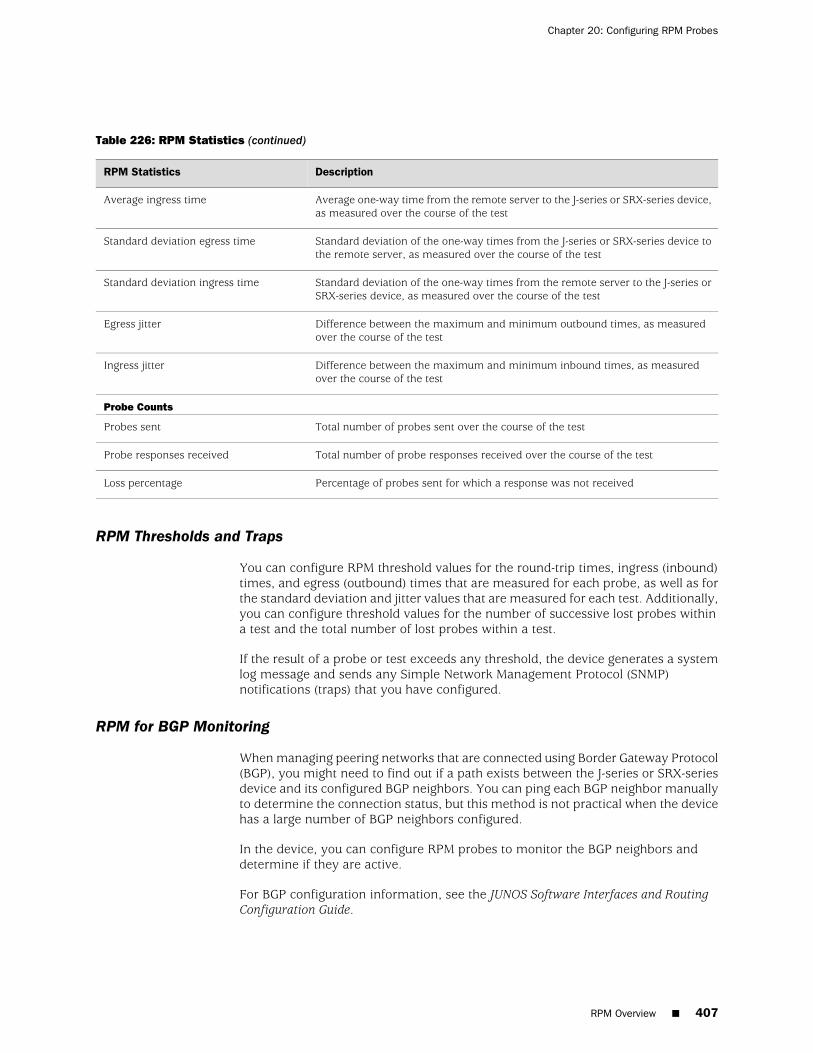
Table 226: RPM Statistics (continued)
DescriptionRPM Statistics
Average one-way time from the remote server to the J-series or SRX-series device,as measured over the course of the test
Average ingress time
Standard deviation of the one-way times from the J-series or SRX-series device tothe remote server, as measured over the course of the test
Standard deviation egress time
Standard deviation of the one-way times from the remote server to the J-series orSRX-series device, as measured over the course of the test
Standard deviation ingress time
Difference between the maximum and minimum outbound times, as measuredover the course of the test
Egress jitter
Difference between the maximum and minimum inbound times, as measuredover the course of the test
Ingress jitter
Probe Counts
Total number of probes sent over the course of the testProbes sent
Total number of probe responses received over the course of the testProbe responses received
Percentage of probes sent for which a response was not receivedLoss percentage
RPM Thresholds and Traps
You can configure RPM threshold values for the round-trip times, ingress (inbound)times, and egress (outbound) times that are measured for each probe, as well as forthe standard deviation and jitter values that are measured for each test. Additionally,you can configure threshold values for the number of successive lost probes withina test and the total number of lost probes within a test.
If the result of a probe or test exceeds any threshold, the device generates a systemlog message and sends any Simple Network Management Protocol (SNMP)notifications (traps) that you have configured.
RPM for BGP Monitoring
When managing peering networks that are connected using Border Gateway Protocol(BGP), you might need to find out if a path exists between the J-series or SRX-seriesdevice and its configured BGP neighbors. You can ping each BGP neighbor manuallyto determine the connection status, but this method is not practical when the devicehas a large number of BGP neighbors configured.
In the device, you can configure RPM probes to monitor the BGP neighbors anddetermine if they are active.
For BGP configuration information, see the JUNOS Software Interfaces and RoutingConfiguration Guide.
RPM Overview ■ 407
Chapter 20: Configuring RPM Probes
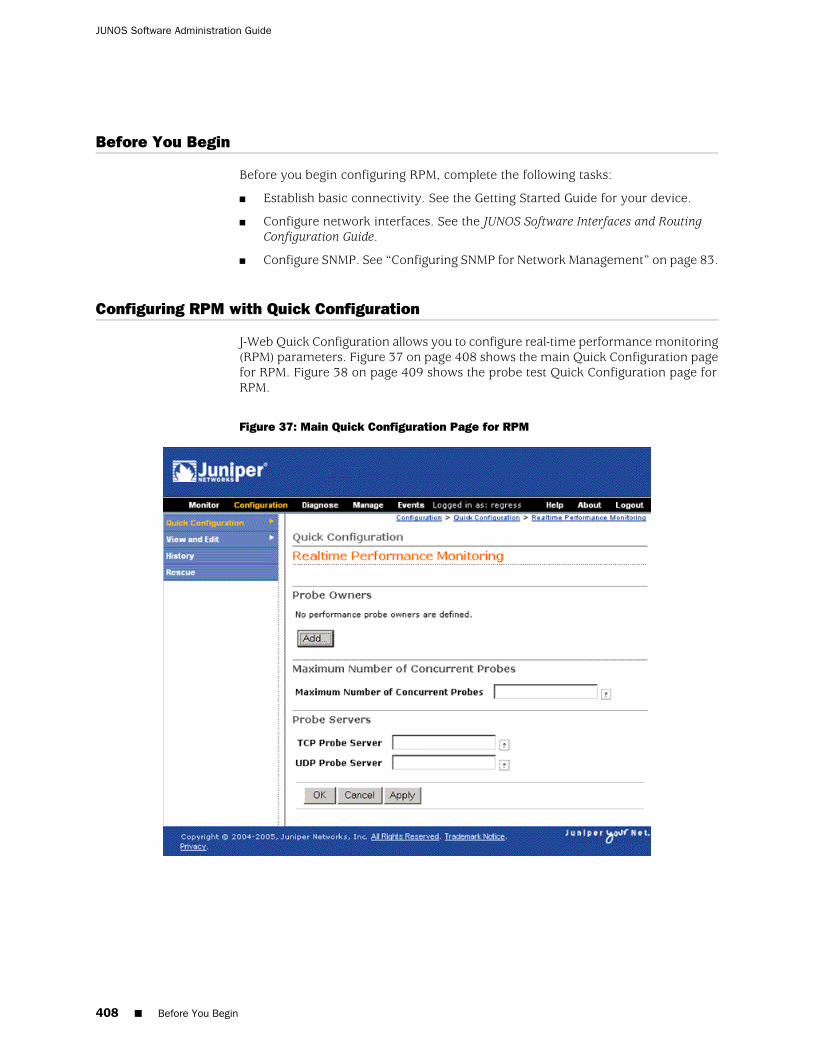
Before You Begin
Before you begin configuring RPM, complete the following tasks:
■ Establish basic connectivity. See the Getting Started Guide for your device.
■ Configure network interfaces. See the JUNOS Software Interfaces and RoutingConfiguration Guide.
■ Configure SNMP. See “Configuring SNMP for Network Management” on page 83.
Configuring RPM with Quick Configuration
J-Web Quick Configuration allows you to configure real-time performance monitoring(RPM) parameters. Figure 37 on page 408 shows the main Quick Configuration pagefor RPM. Figure 38 on page 409 shows the probe test Quick Configuration page forRPM.
Figure 37: Main Quick Configuration Page for RPM
408 ■ Before You Begin
JUNOS Software Administration Guide
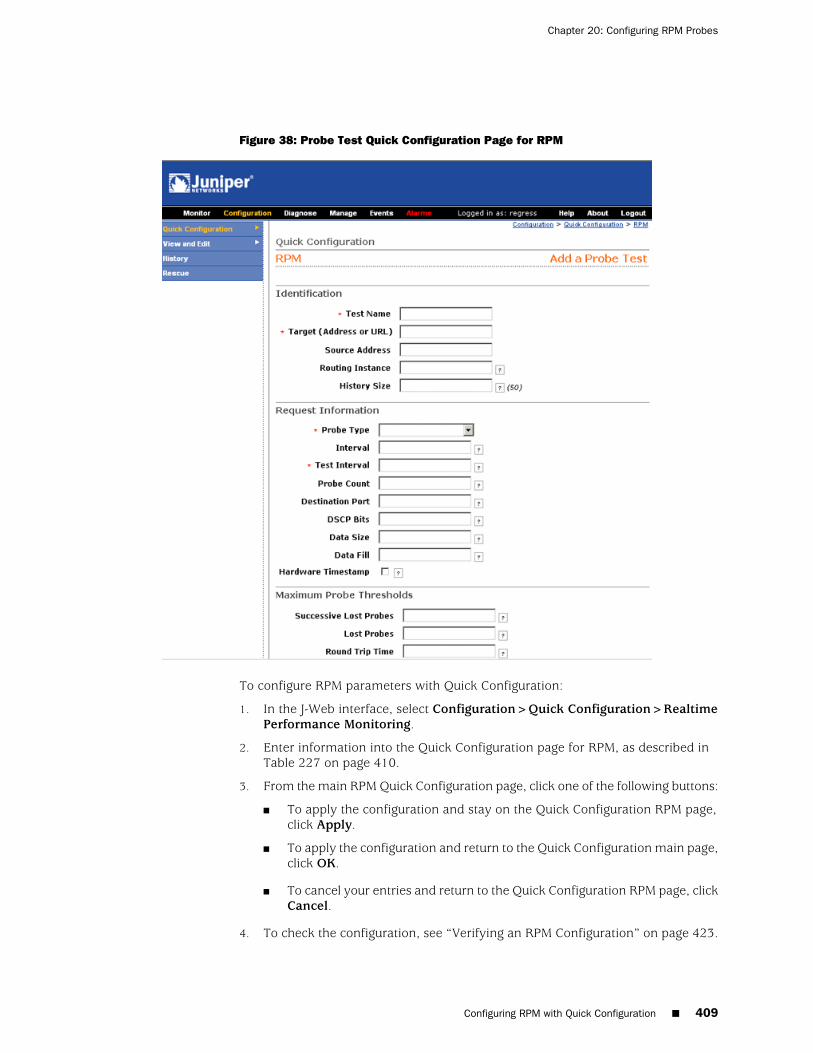
Figure 38: Probe Test Quick Configuration Page for RPM
To configure RPM parameters with Quick Configuration:
1. In the J-Web interface, select Configuration>Quick Configuration>RealtimePerformance Monitoring.
2. Enter information into the Quick Configuration page for RPM, as described inTable 227 on page 410.
3. From the main RPM Quick Configuration page, click one of the following buttons:
■ To apply the configuration and stay on the Quick Configuration RPM page,click Apply.
■ To apply the configuration and return to the Quick Configuration main page,click OK.
■ To cancel your entries and return to the Quick Configuration RPM page, clickCancel.
4. To check the configuration, see “Verifying an RPM Configuration” on page 423.
Configuring RPM with Quick Configuration ■ 409
Chapter 20: Configuring RPM Probes
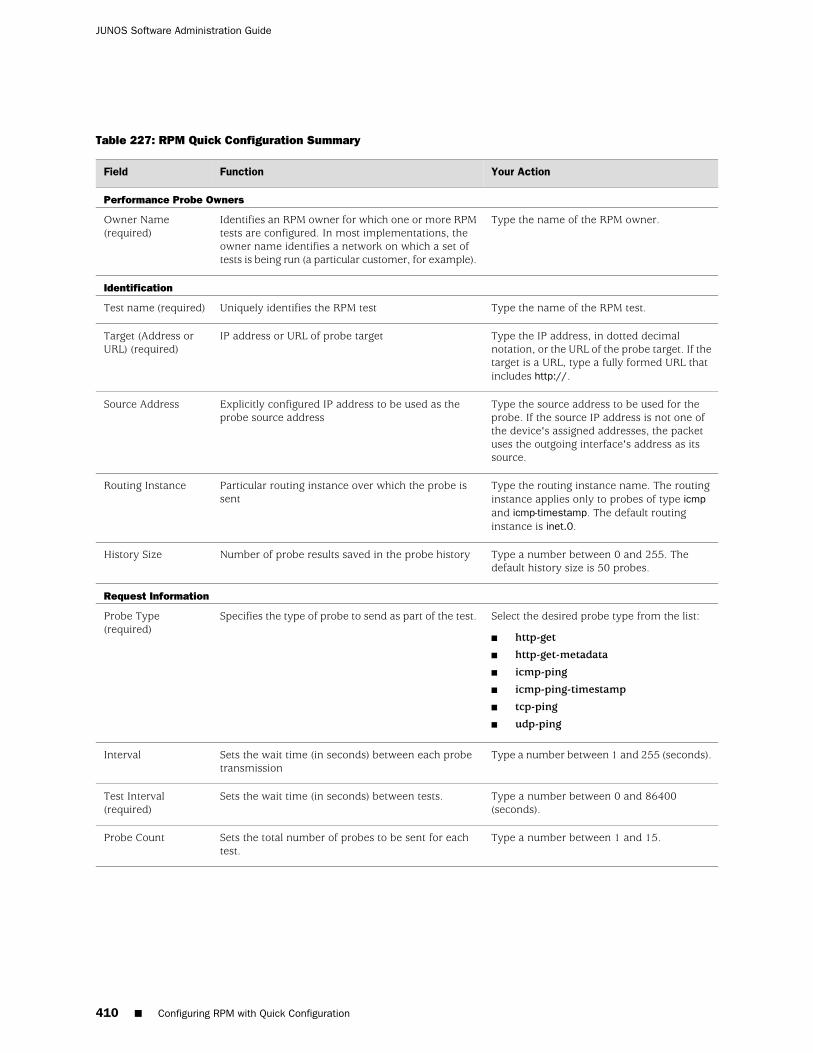
Table 227: RPM Quick Configuration Summary
Your ActionFunctionField
Performance Probe Owners
Type the name of the RPM owner.Identifies an RPM owner for which one or more RPMtests are configured. In most implementations, theowner name identifies a network on which a set oftests is being run (a particular customer, for example).
Owner Name(required)
Identification
Type the name of the RPM test.Uniquely identifies the RPM testTest name (required)
Type the IP address, in dotted decimalnotation, or the URL of the probe target. If thetarget is a URL, type a fully formed URL thatincludes http://.
IP address or URL of probe targetTarget (Address orURL) (required)
Type the source address to be used for theprobe. If the source IP address is not one ofthe device's assigned addresses, the packetuses the outgoing interface's address as itssource.
Explicitly configured IP address to be used as theprobe source address
Source Address
Type the routing instance name. The routinginstance applies only to probes of type icmpand icmp-timestamp. The default routinginstance is inet.0.
Particular routing instance over which the probe issent
Routing Instance
Type a number between 0 and 255. Thedefault history size is 50 probes.
Number of probe results saved in the probe historyHistory Size
Request Information
Select the desired probe type from the list:
■ http-get
■ http-get-metadata
■ icmp-ping
■ icmp-ping-timestamp
■ tcp-ping
■ udp-ping
Specifies the type of probe to send as part of the test.Probe Type(required)
Type a number between 1 and 255 (seconds).Sets the wait time (in seconds) between each probetransmission
Interval
Type a number between 0 and 86400(seconds).
Sets the wait time (in seconds) between tests.Test Interval(required)
Type a number between 1 and 15.Sets the total number of probes to be sent for eachtest.
Probe Count
410 ■ Configuring RPM with Quick Configuration
JUNOS Software Administration Guide
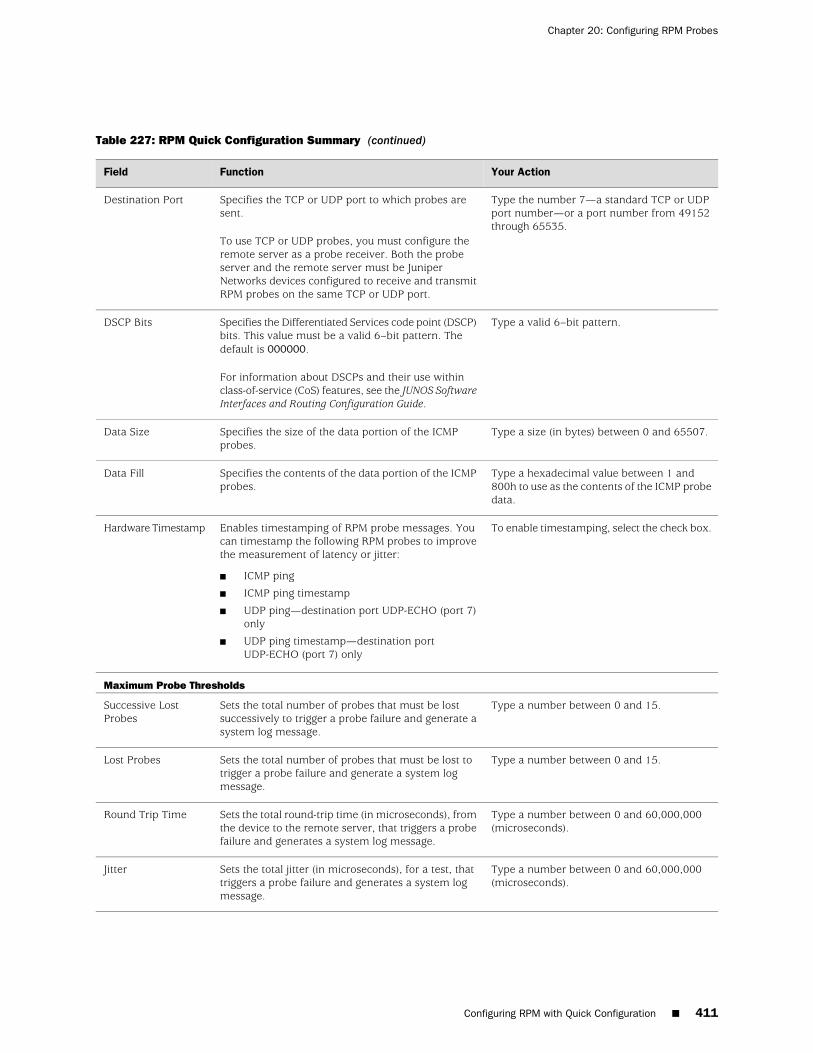
Table 227: RPM Quick Configuration Summary (continued)
Your ActionFunctionField
Type the number 7—a standard TCP or UDPport number—or a port number from 49152through 65535.
Specifies the TCP or UDP port to which probes aresent.
To use TCP or UDP probes, you must configure theremote server as a probe receiver. Both the probeserver and the remote server must be JuniperNetworks devices configured to receive and transmitRPM probes on the same TCP or UDP port.
Destination Port
Type a valid 6–bit pattern.Specifies the Differentiated Services code point (DSCP)bits. This value must be a valid 6–bit pattern. Thedefault is 000000.
For information about DSCPs and their use withinclass-of-service (CoS) features, see the JUNOS SoftwareInterfaces and Routing Configuration Guide.
DSCP Bits
Type a size (in bytes) between 0 and 65507.Specifies the size of the data portion of the ICMPprobes.
Data Size
Type a hexadecimal value between 1 and800h to use as the contents of the ICMP probedata.
Specifies the contents of the data portion of the ICMPprobes.
Data Fill
To enable timestamping, select the check box.Enables timestamping of RPM probe messages. Youcan timestamp the following RPM probes to improvethe measurement of latency or jitter:
■ ICMP ping
■ ICMP ping timestamp
■ UDP ping—destination port UDP-ECHO (port 7)only
■ UDP ping timestamp—destination portUDP-ECHO (port 7) only
Hardware Timestamp
Maximum Probe Thresholds
Type a number between 0 and 15.Sets the total number of probes that must be lostsuccessively to trigger a probe failure and generate asystem log message.
Successive LostProbes
Type a number between 0 and 15.Sets the total number of probes that must be lost totrigger a probe failure and generate a system logmessage.
Lost Probes
Type a number between 0 and 60,000,000(microseconds).
Sets the total round-trip time (in microseconds), fromthe device to the remote server, that triggers a probefailure and generates a system log message.
Round Trip Time
Type a number between 0 and 60,000,000(microseconds).
Sets the total jitter (in microseconds), for a test, thattriggers a probe failure and generates a system logmessage.
Jitter
Configuring RPM with Quick Configuration ■ 411
Chapter 20: Configuring RPM Probes
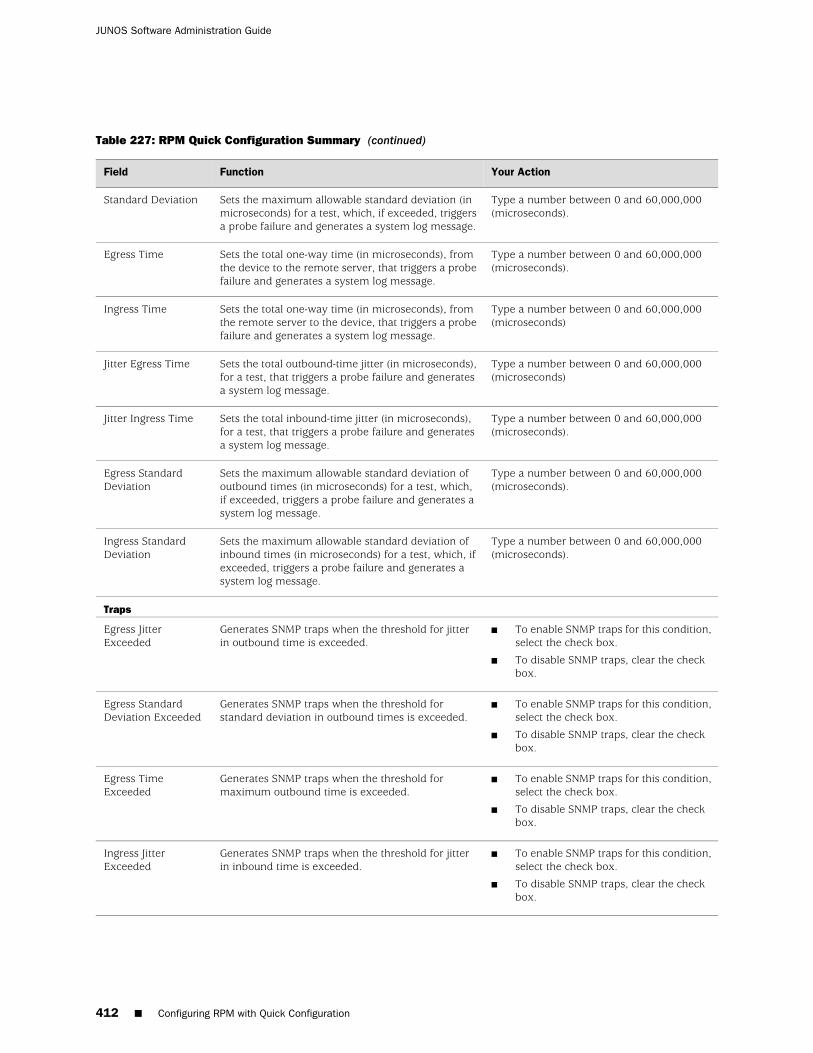
Table 227: RPM Quick Configuration Summary (continued)
Your ActionFunctionField
Type a number between 0 and 60,000,000(microseconds).
Sets the maximum allowable standard deviation (inmicroseconds) for a test, which, if exceeded, triggersa probe failure and generates a system log message.
Standard Deviation
Type a number between 0 and 60,000,000(microseconds).
Sets the total one-way time (in microseconds), fromthe device to the remote server, that triggers a probefailure and generates a system log message.
Egress Time
Type a number between 0 and 60,000,000(microseconds)
Sets the total one-way time (in microseconds), fromthe remote server to the device, that triggers a probefailure and generates a system log message.
Ingress Time
Type a number between 0 and 60,000,000(microseconds)
Sets the total outbound-time jitter (in microseconds),for a test, that triggers a probe failure and generatesa system log message.
Jitter Egress Time
Type a number between 0 and 60,000,000(microseconds).
Sets the total inbound-time jitter (in microseconds),for a test, that triggers a probe failure and generatesa system log message.
Jitter Ingress Time
Type a number between 0 and 60,000,000(microseconds).
Sets the maximum allowable standard deviation ofoutbound times (in microseconds) for a test, which,if exceeded, triggers a probe failure and generates asystem log message.
Egress StandardDeviation
Type a number between 0 and 60,000,000(microseconds).
Sets the maximum allowable standard deviation ofinbound times (in microseconds) for a test, which, ifexceeded, triggers a probe failure and generates asystem log message.
Ingress StandardDeviation
Traps
■ To enable SNMP traps for this condition,select the check box.
■ To disable SNMP traps, clear the checkbox.
Generates SNMP traps when the threshold for jitterin outbound time is exceeded.
Egress JitterExceeded
■ To enable SNMP traps for this condition,select the check box.
■ To disable SNMP traps, clear the checkbox.
Generates SNMP traps when the threshold forstandard deviation in outbound times is exceeded.
Egress StandardDeviation Exceeded
■ To enable SNMP traps for this condition,select the check box.
■ To disable SNMP traps, clear the checkbox.
Generates SNMP traps when the threshold formaximum outbound time is exceeded.
Egress TimeExceeded
■ To enable SNMP traps for this condition,select the check box.
■ To disable SNMP traps, clear the checkbox.
Generates SNMP traps when the threshold for jitterin inbound time is exceeded.
Ingress JitterExceeded
412 ■ Configuring RPM with Quick Configuration
JUNOS Software Administration Guide
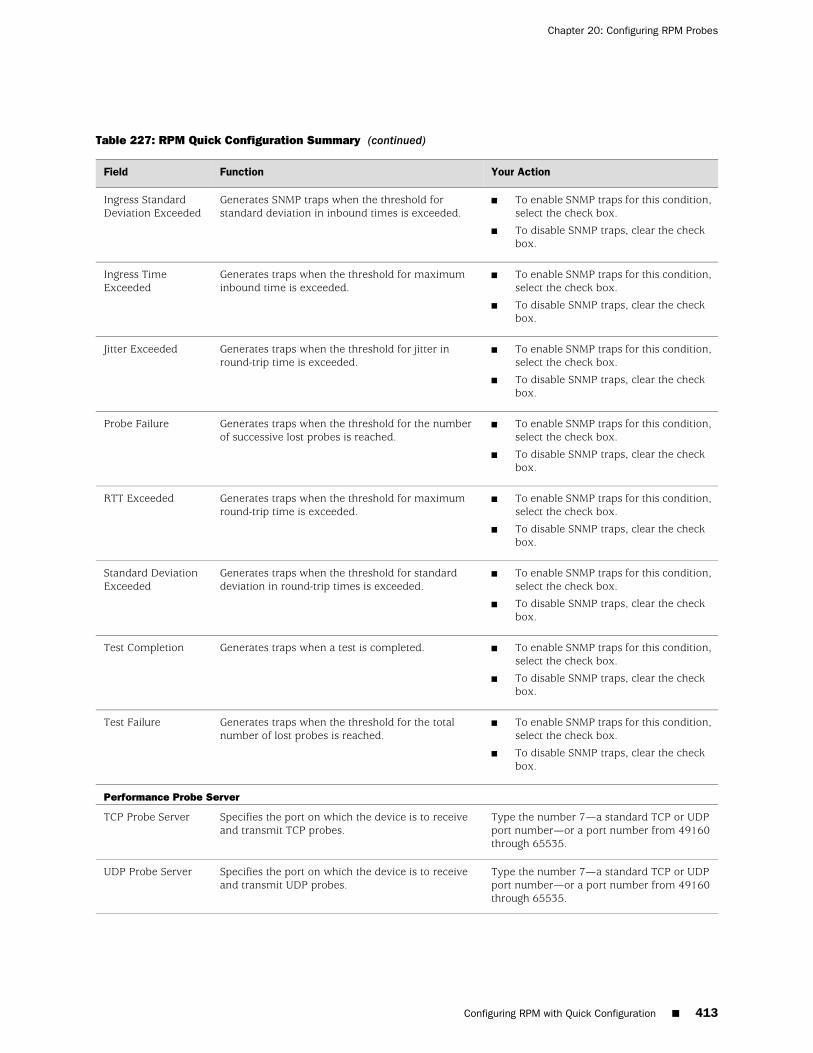
Table 227: RPM Quick Configuration Summary (continued)
Your ActionFunctionField
■ To enable SNMP traps for this condition,select the check box.
■ To disable SNMP traps, clear the checkbox.
Generates SNMP traps when the threshold forstandard deviation in inbound times is exceeded.
Ingress StandardDeviation Exceeded
■ To enable SNMP traps for this condition,select the check box.
■ To disable SNMP traps, clear the checkbox.
Generates traps when the threshold for maximuminbound time is exceeded.
Ingress TimeExceeded
■ To enable SNMP traps for this condition,select the check box.
■ To disable SNMP traps, clear the checkbox.
Generates traps when the threshold for jitter inround-trip time is exceeded.
Jitter Exceeded
■ To enable SNMP traps for this condition,select the check box.
■ To disable SNMP traps, clear the checkbox.
Generates traps when the threshold for the numberof successive lost probes is reached.
Probe Failure
■ To enable SNMP traps for this condition,select the check box.
■ To disable SNMP traps, clear the checkbox.
Generates traps when the threshold for maximumround-trip time is exceeded.
RTT Exceeded
■ To enable SNMP traps for this condition,select the check box.
■ To disable SNMP traps, clear the checkbox.
Generates traps when the threshold for standarddeviation in round-trip times is exceeded.
Standard DeviationExceeded
■ To enable SNMP traps for this condition,select the check box.
■ To disable SNMP traps, clear the checkbox.
Generates traps when a test is completed.Test Completion
■ To enable SNMP traps for this condition,select the check box.
■ To disable SNMP traps, clear the checkbox.
Generates traps when the threshold for the totalnumber of lost probes is reached.
Test Failure
Performance Probe Server
Type the number 7—a standard TCP or UDPport number—or a port number from 49160through 65535.
Specifies the port on which the device is to receiveand transmit TCP probes.
TCP Probe Server
Type the number 7—a standard TCP or UDPport number—or a port number from 49160through 65535.
Specifies the port on which the device is to receiveand transmit UDP probes.
UDP Probe Server
Configuring RPM with Quick Configuration ■ 413
Chapter 20: Configuring RPM Probes
Configuring RPM with a Configuration Editor
To configure the device to perform real-time performance tests, you perform thefollowing tasks. For information about using the J-Web and CLI configuration editors,see “User Interface Overview” on page 11.
■ Configuring Basic RPM Probes on page 414
■ Configuring TCP and UDP Probes on page 417
■ Tuning RPM Probes on page 419
■ Configuring RPM Probes to Monitor BGP Neighbors on page 420
Configuring Basic RPM Probes
To configure basic RPM probes, you must configure the probe owner, the test, andthe specific parameters of the RPM probe.
For ICMP ping, ICMP ping timestamp, UDP ping, and UDP ping timestamp probes,you can also set a timestamp to improve the measurement of latency or jitter. Theprobe is timestamped by the device originating the probe (the RPM client).
In this sample use of RPM, basic probes are configured for two customers: Customer Aand Customer B. The probe for Customer A uses ICMP timestamp packets and setsRPM thresholds and corresponding SNMP traps to catch lengthy inbound times. Theprobe for Customer B uses HTTP packets and sets thresholds and correspondingSNMP traps to catch excessive lost probes. To configure these RPM probes:
1. Navigate to the top of the configuration hierarchy in either the J-Web or CLIconfiguration editor.
2. Perform the configuration tasks described in Table 228 on page 415.
3. If you are finished configuring the network, commit the configuration.
4. Go on to one of the following procedures:
■ To configure a TCP or UDP probe, see “Configuring TCP and UDPProbes” on page 417.
■ To tune a probe, see “Tuning RPM Probes” on page 419.
■ To check the configuration, see “Verifying an RPM Configuration” on page 423.
414 ■ Configuring RPM with a Configuration Editor
JUNOS Software Administration Guide
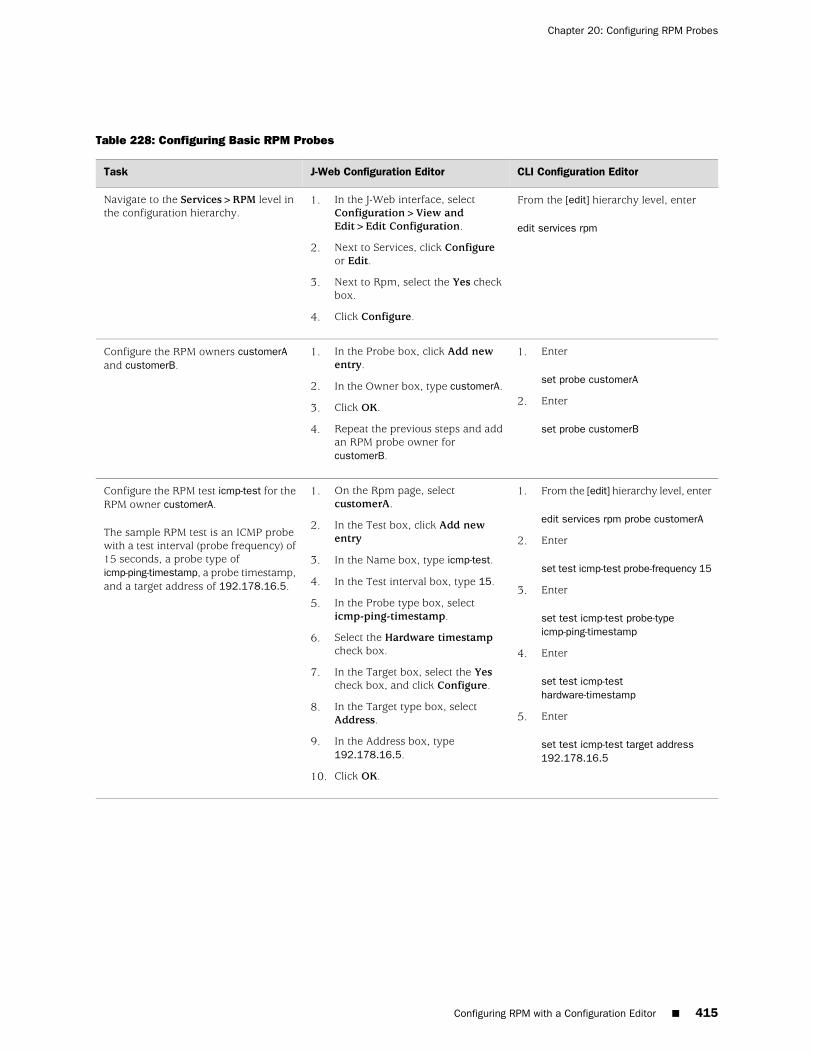
Table 228: Configuring Basic RPM Probes
CLI Configuration EditorJ-Web Configuration EditorTask
From the [edit] hierarchy level, enter
edit services rpm
1. In the J-Web interface, selectConfiguration>View andEdit>Edit Configuration.
2. Next to Services, click Configureor Edit.
3. Next to Rpm, select the Yes checkbox.
4. Click Configure.
Navigate to the Services>RPM level inthe configuration hierarchy.
1. Enter
set probe customerA
2. Enter
set probe customerB
1. In the Probe box, click Add newentry.
2. In the Owner box, type customerA.
3. Click OK.
4. Repeat the previous steps and addan RPM probe owner forcustomerB.
Configure the RPM owners customerAand customerB.
1. From the [edit] hierarchy level, enter
edit services rpm probe customerA
2. Enter
set test icmp-test probe-frequency 15
3. Enter
set test icmp-test probe-typeicmp-ping-timestamp
4. Enter
set test icmp-testhardware-timestamp
5. Enter
set test icmp-test target address192.178.16.5
1. On the Rpm page, selectcustomerA.
2. In the Test box, click Add newentry
3. In the Name box, type icmp-test.
4. In the Test interval box, type 15.
5. In the Probe type box, selecticmp-ping-timestamp.
6. Select the Hardware timestampcheck box.
7. In the Target box, select the Yescheck box, and click Configure.
8. In the Target type box, selectAddress.
9. In the Address box, type192.178.16.5.
10. Click OK.
Configure the RPM test icmp-test for theRPM owner customerA.
The sample RPM test is an ICMP probewith a test interval (probe frequency) of15 seconds, a probe type oficmp-ping-timestamp, a probe timestamp,and a target address of 192.178.16.5.
Configuring RPM with a Configuration Editor ■ 415
Chapter 20: Configuring RPM Probes
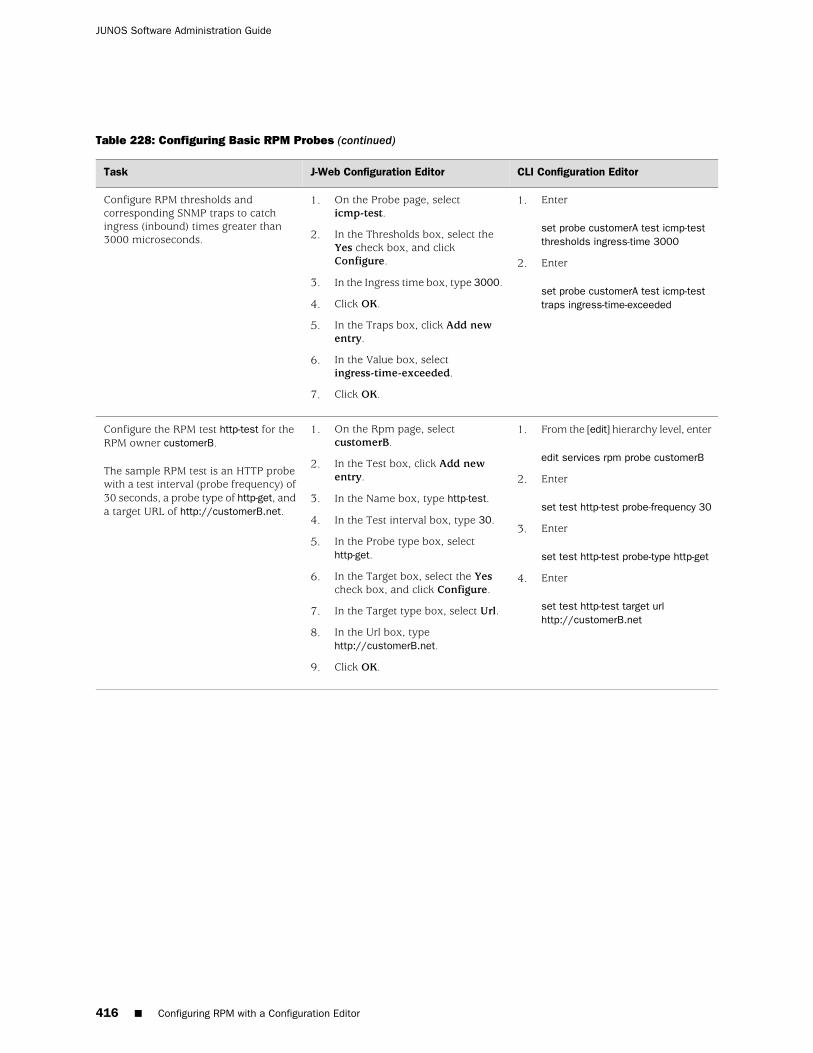
Table 228: Configuring Basic RPM Probes (continued)
CLI Configuration EditorJ-Web Configuration EditorTask
1. Enter
set probe customerA test icmp-testthresholds ingress-time 3000
2. Enter
set probe customerA test icmp-testtraps ingress-time-exceeded
1. On the Probe page, selecticmp-test.
2. In the Thresholds box, select theYes check box, and clickConfigure.
3. In the Ingress time box, type 3000.
4. Click OK.
5. In the Traps box, click Add newentry.
6. In the Value box, selectingress-time-exceeded.
7. Click OK.
Configure RPM thresholds andcorresponding SNMP traps to catchingress (inbound) times greater than3000 microseconds.
1. From the [edit] hierarchy level, enter
edit services rpm probe customerB
2. Enter
set test http-test probe-frequency 30
3. Enter
set test http-test probe-type http-get
4. Enter
set test http-test target urlhttp://customerB.net
1. On the Rpm page, selectcustomerB.
2. In the Test box, click Add newentry.
3. In the Name box, type http-test.
4. In the Test interval box, type 30.
5. In the Probe type box, selecthttp-get.
6. In the Target box, select the Yescheck box, and click Configure.
7. In the Target type box, select Url.
8. In the Url box, typehttp://customerB.net.
9. Click OK.
Configure the RPM test http-test for theRPM owner customerB.
The sample RPM test is an HTTP probewith a test interval (probe frequency) of30 seconds, a probe type of http-get, anda target URL of http://customerB.net.
416 ■ Configuring RPM with a Configuration Editor
JUNOS Software Administration Guide
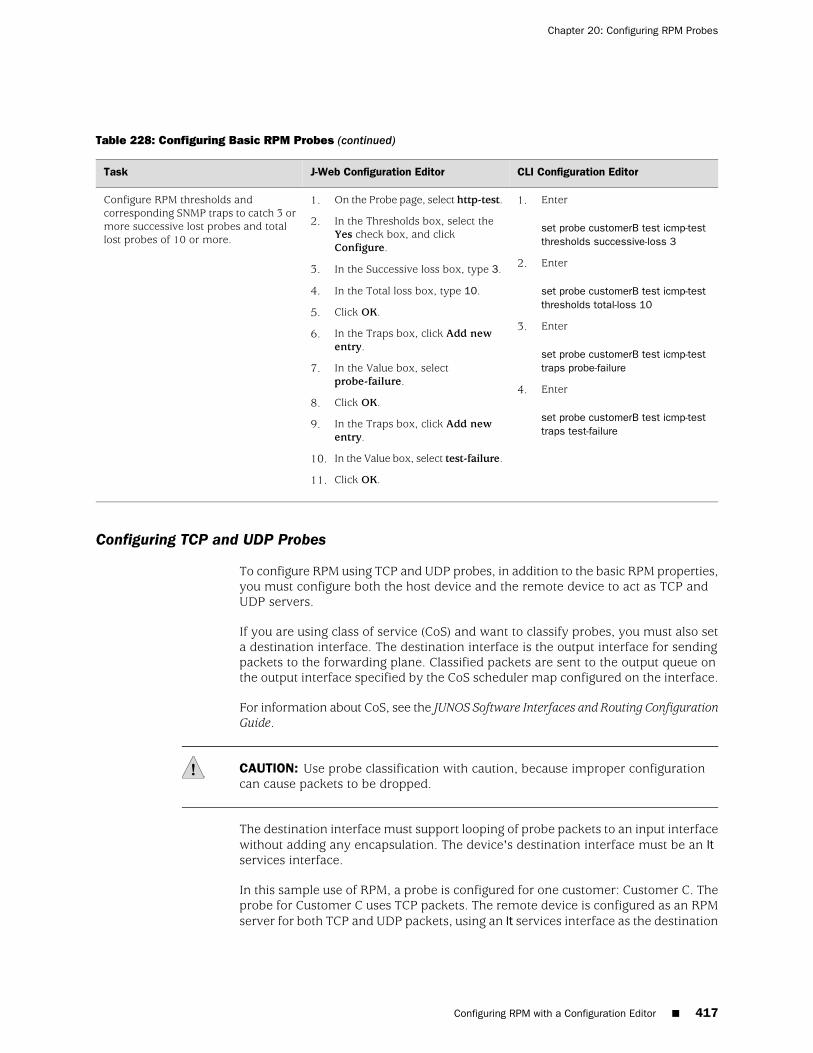
Table 228: Configuring Basic RPM Probes (continued)
CLI Configuration EditorJ-Web Configuration EditorTask
1. Enter
set probe customerB test icmp-testthresholds successive-loss 3
2. Enter
set probe customerB test icmp-testthresholds total-loss 10
3. Enter
set probe customerB test icmp-testtraps probe-failure
4. Enter
set probe customerB test icmp-testtraps test-failure
1. On the Probe page, select http-test.
2. In the Thresholds box, select theYes check box, and clickConfigure.
3. In the Successive loss box, type 3.
4. In the Total loss box, type 10.
5. Click OK.
6. In the Traps box, click Add newentry.
7. In the Value box, selectprobe-failure.
8. Click OK.
9. In the Traps box, click Add newentry.
10. In the Value box, select test-failure.
11. Click OK.
Configure RPM thresholds andcorresponding SNMP traps to catch 3 ormore successive lost probes and totallost probes of 10 or more.
Configuring TCP and UDP Probes
To configure RPM using TCP and UDP probes, in addition to the basic RPM properties,you must configure both the host device and the remote device to act as TCP andUDP servers.
If you are using class of service (CoS) and want to classify probes, you must also seta destination interface. The destination interface is the output interface for sendingpackets to the forwarding plane. Classified packets are sent to the output queue onthe output interface specified by the CoS scheduler map configured on the interface.
For information about CoS, see the JUNOS Software Interfaces and Routing ConfigurationGuide.
CAUTION: Use probe classification with caution, because improper configurationcan cause packets to be dropped.
The destination interface must support looping of probe packets to an input interfacewithout adding any encapsulation. The device's destination interface must be an ltservices interface.
In this sample use of RPM, a probe is configured for one customer: Customer C. Theprobe for Customer C uses TCP packets. The remote device is configured as an RPMserver for both TCP and UDP packets, using an lt services interface as the destination
Configuring RPM with a Configuration Editor ■ 417
Chapter 20: Configuring RPM Probes
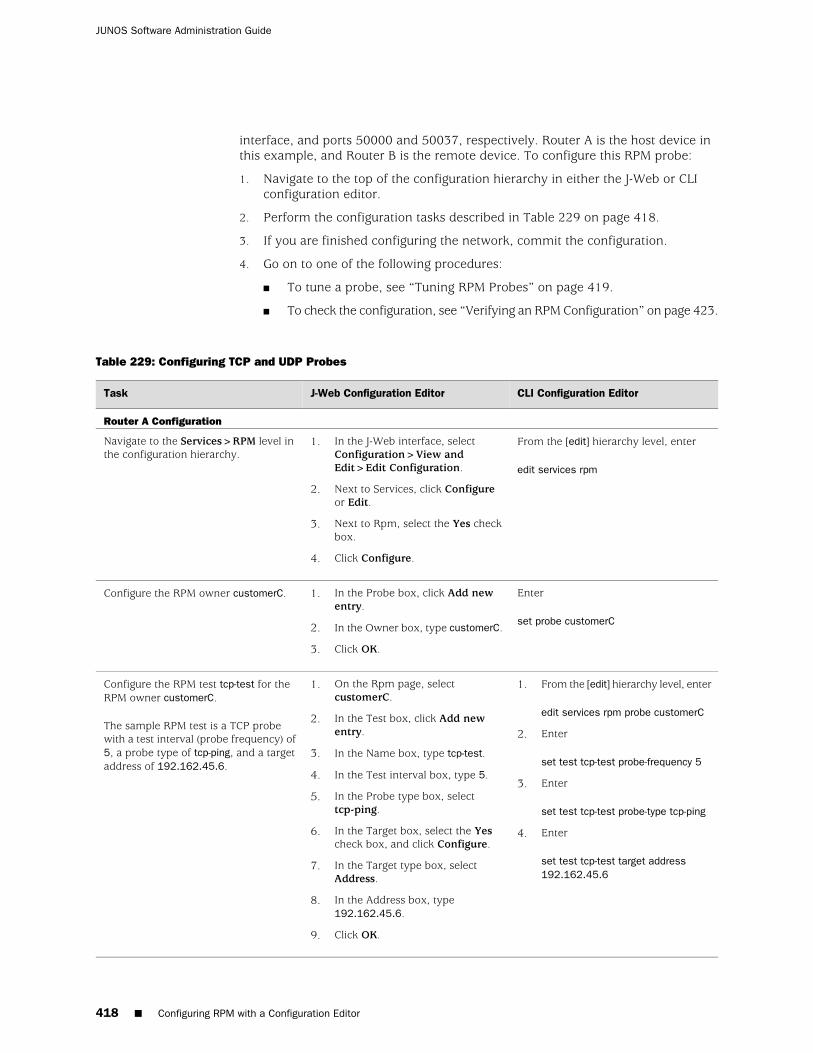
interface, and ports 50000 and 50037, respectively. Router A is the host device inthis example, and Router B is the remote device. To configure this RPM probe:
1. Navigate to the top of the configuration hierarchy in either the J-Web or CLIconfiguration editor.
2. Perform the configuration tasks described in Table 229 on page 418.
3. If you are finished configuring the network, commit the configuration.
4. Go on to one of the following procedures:
■ To tune a probe, see “Tuning RPM Probes” on page 419.
■ To check the configuration, see “Verifying an RPM Configuration” on page 423.
Table 229: Configuring TCP and UDP Probes
CLI Configuration EditorJ-Web Configuration EditorTask
Router A Configuration
From the [edit] hierarchy level, enter
edit services rpm
1. In the J-Web interface, selectConfiguration>View andEdit>Edit Configuration.
2. Next to Services, click Configureor Edit.
3. Next to Rpm, select the Yes checkbox.
4. Click Configure.
Navigate to the Services>RPM level inthe configuration hierarchy.
Enter
set probe customerC
1. In the Probe box, click Add newentry.
2. In the Owner box, type customerC.
3. Click OK.
Configure the RPM owner customerC.
1. From the [edit] hierarchy level, enter
edit services rpm probe customerC
2. Enter
set test tcp-test probe-frequency 5
3. Enter
set test tcp-test probe-type tcp-ping
4. Enter
set test tcp-test target address192.162.45.6
1. On the Rpm page, selectcustomerC.
2. In the Test box, click Add newentry.
3. In the Name box, type tcp-test.
4. In the Test interval box, type 5.
5. In the Probe type box, selecttcp-ping.
6. In the Target box, select the Yescheck box, and click Configure.
7. In the Target type box, selectAddress.
8. In the Address box, type192.162.45.6.
9. Click OK.
Configure the RPM test tcp-test for theRPM owner customerC.
The sample RPM test is a TCP probewith a test interval (probe frequency) of5, a probe type of tcp-ping, and a targetaddress of 192.162.45.6.
418 ■ Configuring RPM with a Configuration Editor
JUNOS Software Administration Guide
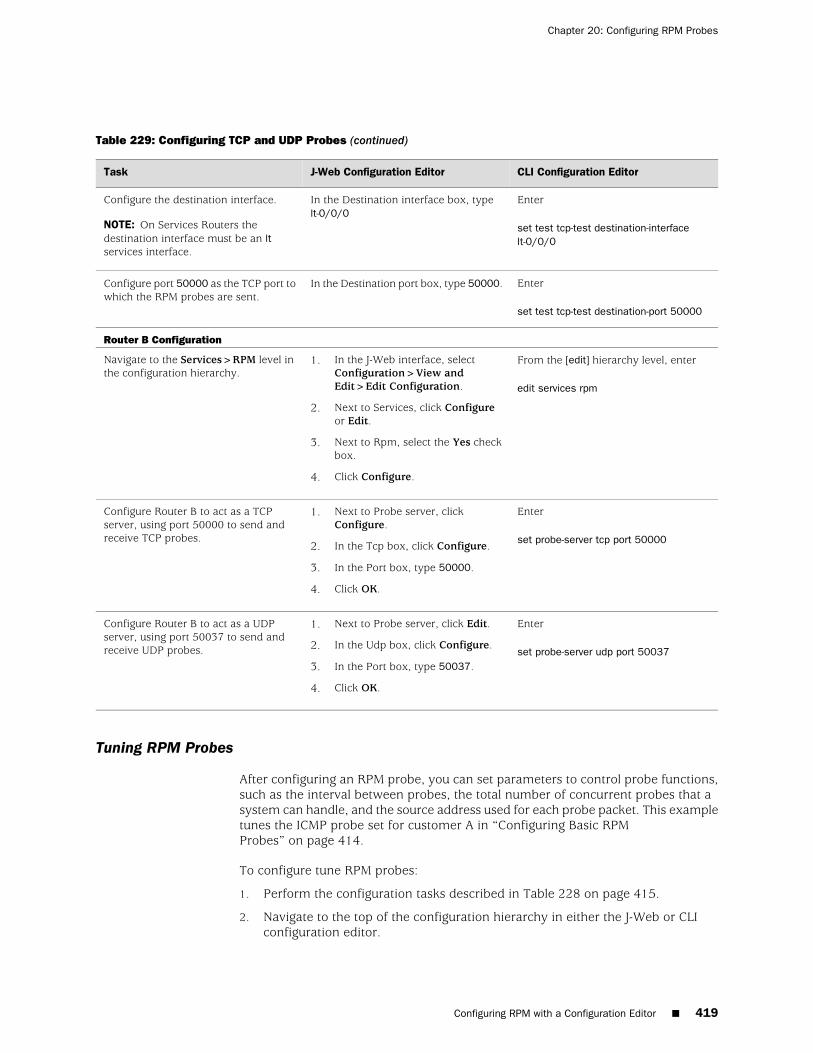
Table 229: Configuring TCP and UDP Probes (continued)
CLI Configuration EditorJ-Web Configuration EditorTask
Enter
set test tcp-test destination-interfacelt-0/0/0
In the Destination interface box, typelt-0/0/0
Configure the destination interface.
NOTE: On Services Routers thedestination interface must be an ltservices interface.
Enter
set test tcp-test destination-port 50000
In the Destination port box, type 50000.Configure port 50000 as the TCP port towhich the RPM probes are sent.
Router B Configuration
From the [edit] hierarchy level, enter
edit services rpm
1. In the J-Web interface, selectConfiguration>View andEdit>Edit Configuration.
2. Next to Services, click Configureor Edit.
3. Next to Rpm, select the Yes checkbox.
4. Click Configure.
Navigate to the Services>RPM level inthe configuration hierarchy.
Enter
set probe-server tcp port 50000
1. Next to Probe server, clickConfigure.
2. In the Tcp box, click Configure.
3. In the Port box, type 50000.
4. Click OK.
Configure Router B to act as a TCPserver, using port 50000 to send andreceive TCP probes.
Enter
set probe-server udp port 50037
1. Next to Probe server, click Edit.
2. In the Udp box, click Configure.
3. In the Port box, type 50037.
4. Click OK.
Configure Router B to act as a UDPserver, using port 50037 to send andreceive UDP probes.
Tuning RPM Probes
After configuring an RPM probe, you can set parameters to control probe functions,such as the interval between probes, the total number of concurrent probes that asystem can handle, and the source address used for each probe packet. This exampletunes the ICMP probe set for customer A in “Configuring Basic RPMProbes” on page 414.
To configure tune RPM probes:
1. Perform the configuration tasks described in Table 228 on page 415.
2. Navigate to the top of the configuration hierarchy in either the J-Web or CLIconfiguration editor.
Configuring RPM with a Configuration Editor ■ 419
Chapter 20: Configuring RPM Probes
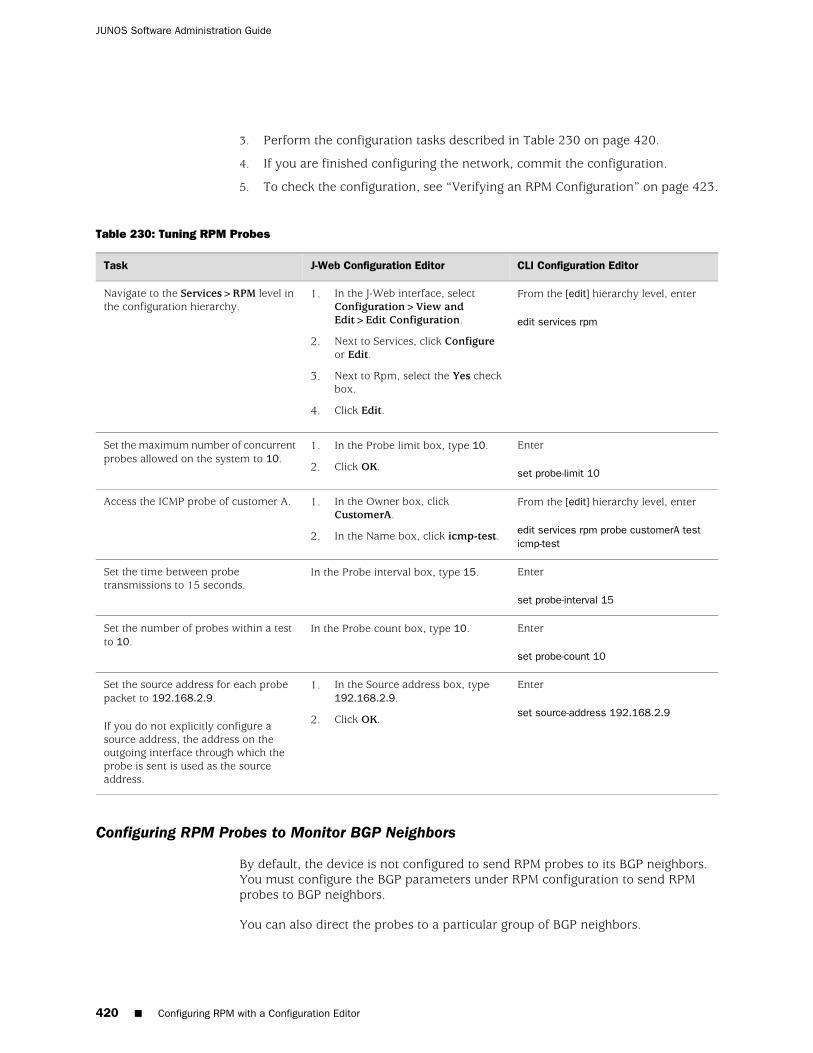
3. Perform the configuration tasks described in Table 230 on page 420.
4. If you are finished configuring the network, commit the configuration.
5. To check the configuration, see “Verifying an RPM Configuration” on page 423.
Table 230: Tuning RPM Probes
CLI Configuration EditorJ-Web Configuration EditorTask
From the [edit] hierarchy level, enter
edit services rpm
1. In the J-Web interface, selectConfiguration>View andEdit>Edit Configuration.
2. Next to Services, click Configureor Edit.
3. Next to Rpm, select the Yes checkbox.
4. Click Edit.
Navigate to the Services>RPM level inthe configuration hierarchy.
Enter
set probe-limit 10
1. In the Probe limit box, type 10.
2. Click OK.
Set the maximum number of concurrentprobes allowed on the system to 10.
From the [edit] hierarchy level, enter
edit services rpm probe customerA testicmp-test
1. In the Owner box, clickCustomerA.
2. In the Name box, click icmp-test.
Access the ICMP probe of customer A.
Enter
set probe-interval 15
In the Probe interval box, type 15.Set the time between probetransmissions to 15 seconds.
Enter
set probe-count 10
In the Probe count box, type 10.Set the number of probes within a testto 10.
Enter
set source-address 192.168.2.9
1. In the Source address box, type192.168.2.9.
2. Click OK.
Set the source address for each probepacket to 192.168.2.9.
If you do not explicitly configure asource address, the address on theoutgoing interface through which theprobe is sent is used as the sourceaddress.
Configuring RPM Probes to Monitor BGP Neighbors
By default, the device is not configured to send RPM probes to its BGP neighbors.You must configure the BGP parameters under RPM configuration to send RPMprobes to BGP neighbors.
You can also direct the probes to a particular group of BGP neighbors.
420 ■ Configuring RPM with a Configuration Editor
JUNOS Software Administration Guide
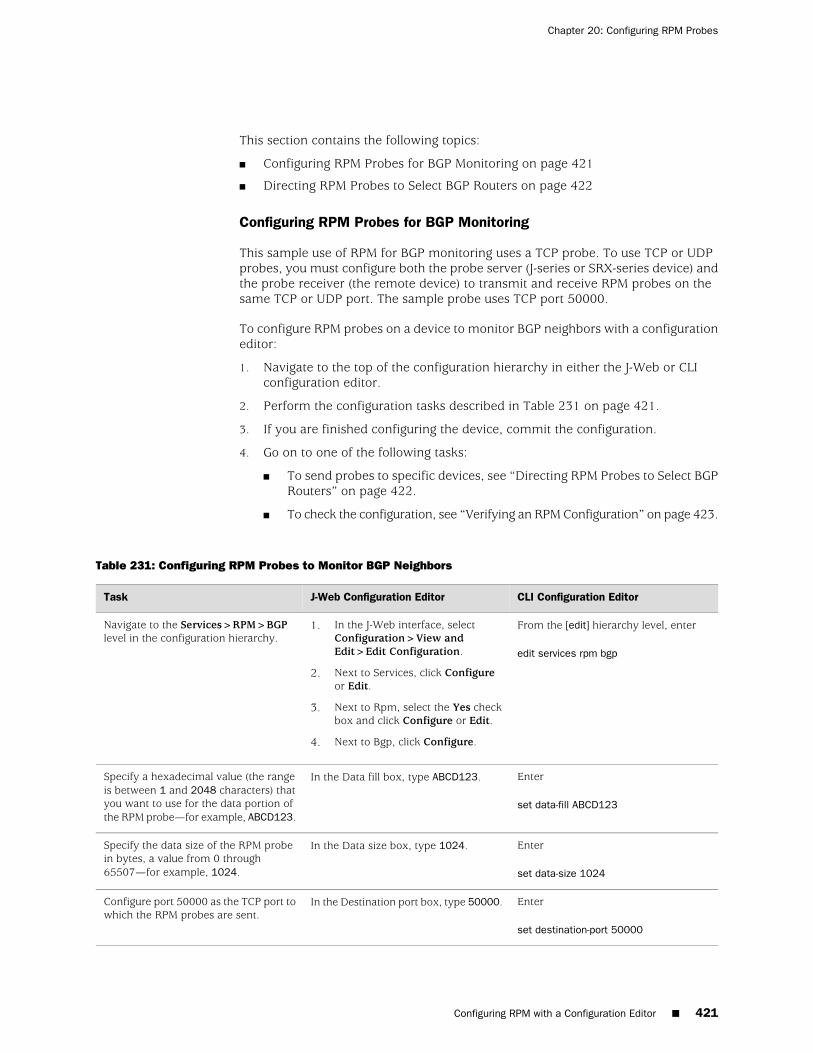
This section contains the following topics:
■ Configuring RPM Probes for BGP Monitoring on page 421
■ Directing RPM Probes to Select BGP Routers on page 422
Configuring RPM Probes for BGP Monitoring
This sample use of RPM for BGP monitoring uses a TCP probe. To use TCP or UDPprobes, you must configure both the probe server (J-series or SRX-series device) andthe probe receiver (the remote device) to transmit and receive RPM probes on thesame TCP or UDP port. The sample probe uses TCP port 50000.
To configure RPM probes on a device to monitor BGP neighbors with a configurationeditor:
1. Navigate to the top of the configuration hierarchy in either the J-Web or CLIconfiguration editor.
2. Perform the configuration tasks described in Table 231 on page 421.
3. If you are finished configuring the device, commit the configuration.
4. Go on to one of the following tasks:
■ To send probes to specific devices, see “Directing RPM Probes to Select BGPRouters” on page 422.
■ To check the configuration, see “Verifying an RPM Configuration” on page 423.
Table 231: Configuring RPM Probes to Monitor BGP Neighbors
CLI Configuration EditorJ-Web Configuration EditorTask
From the [edit] hierarchy level, enter
edit services rpm bgp
1. In the J-Web interface, selectConfiguration>View andEdit>Edit Configuration.
2. Next to Services, click Configureor Edit.
3. Next to Rpm, select the Yes checkbox and click Configure or Edit.
4. Next to Bgp, click Configure.
Navigate to the Services>RPM>BGPlevel in the configuration hierarchy.
Enter
set data-fill ABCD123
In the Data fill box, type ABCD123.Specify a hexadecimal value (the rangeis between 1 and 2048 characters) thatyou want to use for the data portion ofthe RPM probe—for example, ABCD123.
Enter
set data-size 1024
In the Data size box, type 1024.Specify the data size of the RPM probein bytes, a value from 0 through65507—for example, 1024.
Enter
set destination-port 50000
In the Destination port box, type 50000.Configure port 50000 as the TCP port towhich the RPM probes are sent.
Configuring RPM with a Configuration Editor ■ 421
Chapter 20: Configuring RPM Probes
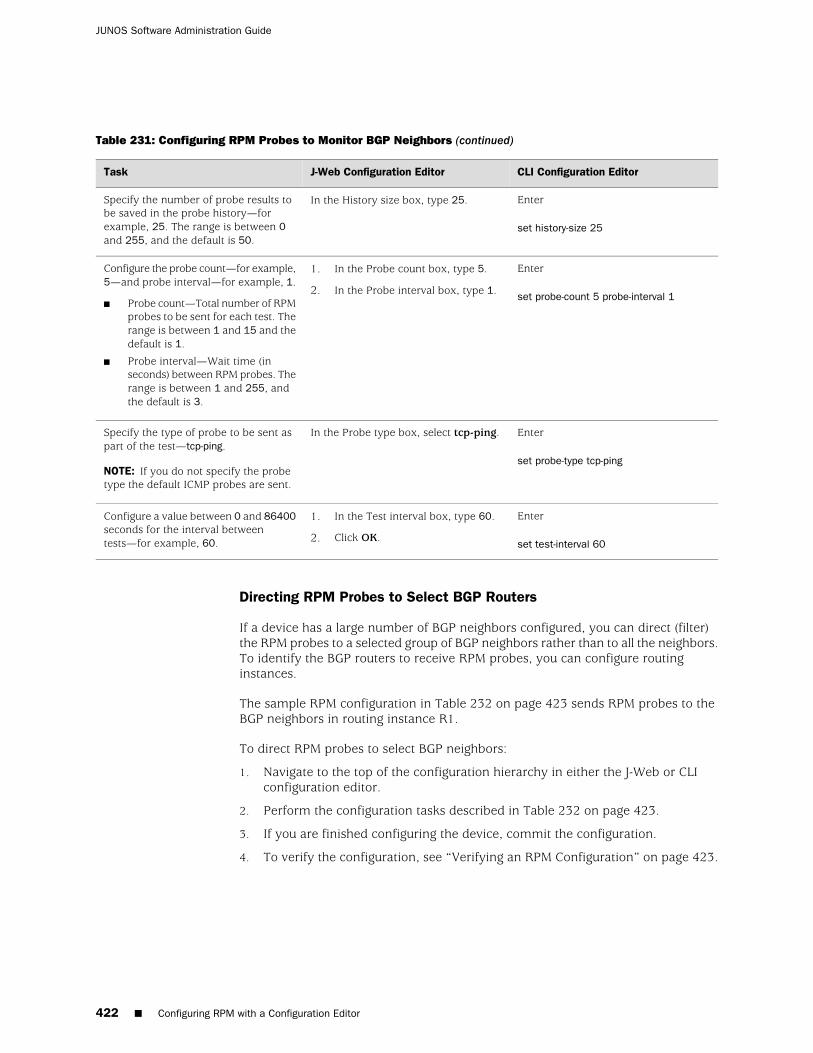
Table 231: Configuring RPM Probes to Monitor BGP Neighbors (continued)
CLI Configuration EditorJ-Web Configuration EditorTask
Enter
set history-size 25
In the History size box, type 25.Specify the number of probe results tobe saved in the probe history—forexample, 25. The range is between 0and 255, and the default is 50.
Enter
set probe-count 5 probe-interval 1
1. In the Probe count box, type 5.
2. In the Probe interval box, type 1.
Configure the probe count—for example,5—and probe interval—for example, 1.
■ Probe count—Total number of RPMprobes to be sent for each test. Therange is between 1 and 15 and thedefault is 1.
■ Probe interval—Wait time (inseconds) between RPM probes. Therange is between 1 and 255, andthe default is 3.
Enter
set probe-type tcp-ping
In the Probe type box, select tcp-ping.Specify the type of probe to be sent aspart of the test—tcp-ping.
NOTE: If you do not specify the probetype the default ICMP probes are sent.
Enter
set test-interval 60
1. In the Test interval box, type 60.
2. Click OK.
Configure a value between 0 and 86400seconds for the interval betweentests—for example, 60.
Directing RPM Probes to Select BGP Routers
If a device has a large number of BGP neighbors configured, you can direct (filter)the RPM probes to a selected group of BGP neighbors rather than to all the neighbors.To identify the BGP routers to receive RPM probes, you can configure routinginstances.
The sample RPM configuration in Table 232 on page 423 sends RPM probes to theBGP neighbors in routing instance R1.
To direct RPM probes to select BGP neighbors:
1. Navigate to the top of the configuration hierarchy in either the J-Web or CLIconfiguration editor.
2. Perform the configuration tasks described in Table 232 on page 423.
3. If you are finished configuring the device, commit the configuration.
4. To verify the configuration, see “Verifying an RPM Configuration” on page 423.
422 ■ Configuring RPM with a Configuration Editor
JUNOS Software Administration Guide
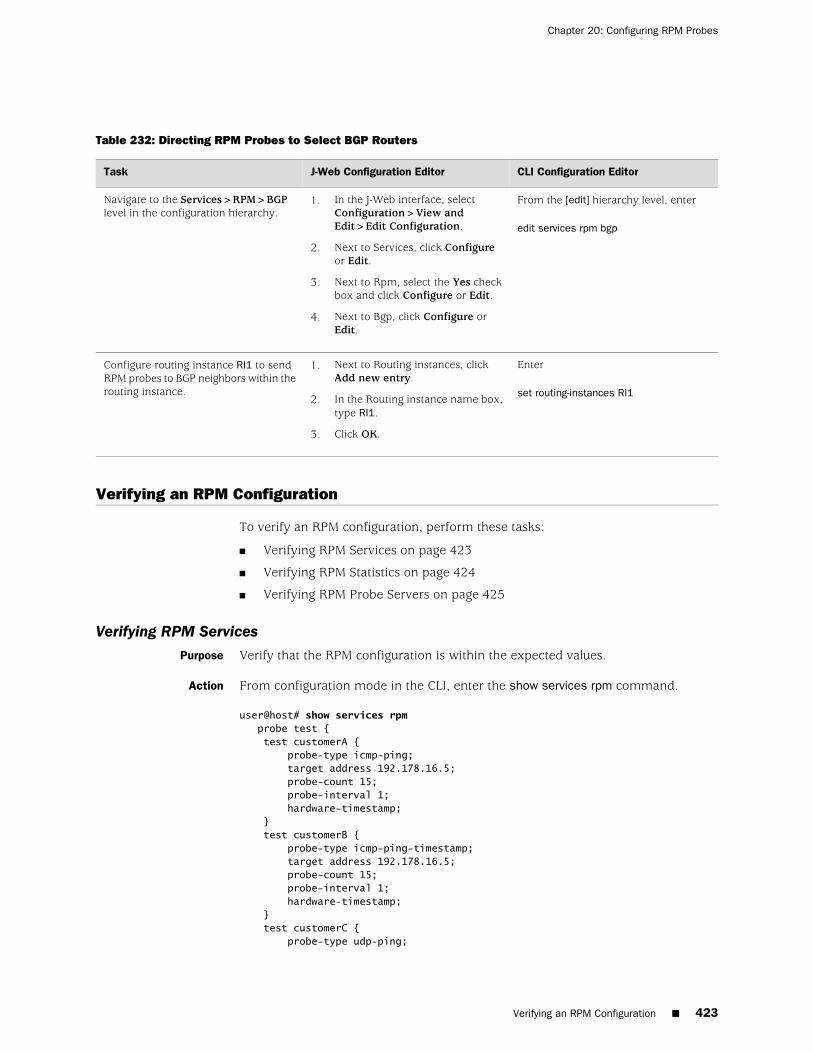
Table 232: Directing RPM Probes to Select BGP Routers
CLI Configuration EditorJ-Web Configuration EditorTask
From the [edit] hierarchy level, enter
edit services rpm bgp
1. In the J-Web interface, selectConfiguration>View andEdit>Edit Configuration.
2. Next to Services, click Configureor Edit.
3. Next to Rpm, select the Yes checkbox and click Configure or Edit.
4. Next to Bgp, click Configure orEdit.
Navigate to the Services>RPM>BGPlevel in the configuration hierarchy.
Enter
set routing-instances RI1
1. Next to Routing instances, clickAdd new entry.
2. In the Routing instance name box,type RI1.
3. Click OK.
Configure routing instance RI1 to sendRPM probes to BGP neighbors within therouting instance.
Verifying an RPM Configuration
To verify an RPM configuration, perform these tasks:
■ Verifying RPM Services on page 423
■ Verifying RPM Statistics on page 424
■ Verifying RPM Probe Servers on page 425
Verifying RPM ServicesPurpose Verify that the RPM configuration is within the expected values.
Action From configuration mode in the CLI, enter the show services rpm command.
user@host# show services rpm probe test { test customerA { probe-type icmp-ping; target address 192.178.16.5; probe-count 15; probe-interval 1; hardware-timestamp; } test customerB { probe-type icmp-ping-timestamp; target address 192.178.16.5; probe-count 15; probe-interval 1; hardware-timestamp; } test customerC { probe-type udp-ping;
Verifying an RPM Configuration ■ 423
Chapter 20: Configuring RPM Probes
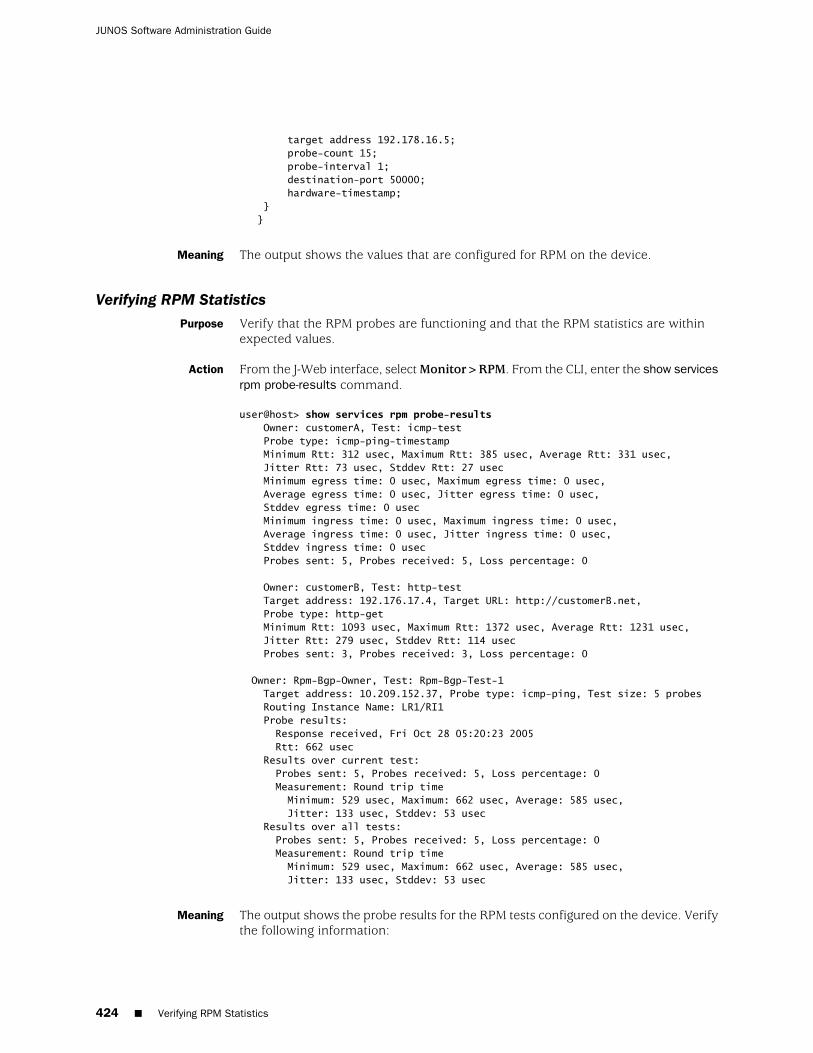
target address 192.178.16.5; probe-count 15; probe-interval 1; destination-port 50000; hardware-timestamp; } }
Meaning The output shows the values that are configured for RPM on the device.
Verifying RPM StatisticsPurpose Verify that the RPM probes are functioning and that the RPM statistics are within
expected values.
Action From the J-Web interface, select Monitor>RPM. From the CLI, enter the show servicesrpm probe-results command.
user@host> show services rpm probe-results Owner: customerA, Test: icmp-test Probe type: icmp-ping-timestamp Minimum Rtt: 312 usec, Maximum Rtt: 385 usec, Average Rtt: 331 usec, Jitter Rtt: 73 usec, Stddev Rtt: 27 usec Minimum egress time: 0 usec, Maximum egress time: 0 usec, Average egress time: 0 usec, Jitter egress time: 0 usec, Stddev egress time: 0 usec Minimum ingress time: 0 usec, Maximum ingress time: 0 usec, Average ingress time: 0 usec, Jitter ingress time: 0 usec, Stddev ingress time: 0 usec Probes sent: 5, Probes received: 5, Loss percentage: 0
Owner: customerB, Test: http-test Target address: 192.176.17.4, Target URL: http://customerB.net, Probe type: http-get Minimum Rtt: 1093 usec, Maximum Rtt: 1372 usec, Average Rtt: 1231 usec, Jitter Rtt: 279 usec, Stddev Rtt: 114 usec Probes sent: 3, Probes received: 3, Loss percentage: 0
Owner: Rpm-Bgp-Owner, Test: Rpm-Bgp-Test-1 Target address: 10.209.152.37, Probe type: icmp-ping, Test size: 5 probes Routing Instance Name: LR1/RI1 Probe results: Response received, Fri Oct 28 05:20:23 2005 Rtt: 662 usec Results over current test: Probes sent: 5, Probes received: 5, Loss percentage: 0 Measurement: Round trip time Minimum: 529 usec, Maximum: 662 usec, Average: 585 usec, Jitter: 133 usec, Stddev: 53 usec Results over all tests: Probes sent: 5, Probes received: 5, Loss percentage: 0 Measurement: Round trip time Minimum: 529 usec, Maximum: 662 usec, Average: 585 usec, Jitter: 133 usec, Stddev: 53 usec
Meaning The output shows the probe results for the RPM tests configured on the device. Verifythe following information:
424 ■ Verifying RPM Statistics
JUNOS Software Administration Guide

■ Each configured test is displayed. Results are displayed in alphabetical order,sorted first by owner name and then by test name.
■ The round-trip times fall within the expected values for the particular test. Theminimum round-trip time is displayed as Minimum Rtt, the maximum round-triptime is displayed as Maximum Rtt, and the average round-trip time is displayedas Average Rtt.
A high average round-trip time might mean that performances problems existwithin the network. A high maximum round-trip time might result in high jittervalues.
■ The egress (outbound) trip times fall within the expected values for the particulartest. The minimum outbound time is displayed as Minimum egress time, themaximum outbound time is displayed as Maximum egress time, and the averageoutbound time is displayed as Average egress time.
■ The ingress (inbound) trip times fall within the expected values for the particulartest. The minimum inbound time is displayed as Minimum ingress time, themaximum inbound time is displayed as Maximum ingress time, and the averageinbound time is displayed as Average ingress time.
■ The number of probes sent and received is expected.
Lost probes might indicate packet loss through the network. Packet losses canoccur if the remote server is flapping. If the RPM probe type is TCP or UDP,complete probe loss might indicate a mismatch in TCP or UDP RPM port number.
■ For Type, each peer is configured as the correct type (either internal or external).
Related Topics For a complete description of show services rpm probe-results output, see the JUNOSSystem Basics and Services Command Reference.
Verifying RPM Probe ServersPurpose Verify that the device is configured to receive and transmit TCP and UDP RPM probes
on the correct ports.
Action From the CLI, enter the show services rpm active-servers command.
user@host> show services rpm active-servers Protocol: TCP, Port: 50000
Protocol: UDP, Port: 50037
Meaning The output shows a list of the protocols and corresponding ports for which the deviceis configured as an RPM server.
Related Topics For a complete description of show services rpm active-servers output, see the JUNOSSystem Basics and Services Command Reference.
Verifying RPM Probe Servers ■ 425
Chapter 20: Configuring RPM Probes

426 ■ Verifying RPM Probe Servers
JUNOS Software Administration Guide

Part 6
Index
■ Index on page 429
Index ■ 427

428 ■ Index
JUNOS Software Administration Guide

Index
Symbols#, comments in configuration statements.................xxiii#, configuration mode command prompt....................22( ), in syntax descriptions..........................................xxiii* (red asterisk).............................................................16.gz.jc file extension See file encryption/cf/var/crash directory See crash files/cf/var/log directory See system logs/cf/var/tmp directory See temporary files/config directory
file encryption See file encryptionsnapshots for boot directories (CLI).....................301snapshots for boot directories (J-Web)................300
/var/db/config directory See file encryption/var/db/scripts/commit directory See commit scripts/var/db/scripts/op directory See operation scripts/var/log directory See system log messages< >, in syntax descriptions......................................xxiii>, operational mode command prompt......................22? command
for CLI online help................................................25in configuration mode...........................................23in operational mode..............................................22
? icon ..........................................................................16[ ], in configuration statements.................................xxiii{ }, in configuration statements................................xxiii| (pipe) command......................................................169| (pipe), in syntax descriptions..................................xxiii
Aaccess privileges
denying and allowing commands.........................42permission bits for................................................40predefined............................................................40specifying (Quick Configuration)...........................47
accounts See template accounts; user accountsactivate system scripts commit command.................152activate system scripts op command.........................155active alarms See alarms, activeactive routes, displaying.............................................183adaptive services interfaces
alarm conditions and configuration options........276
Add a RADIUS Server page..........................................43field summary......................................................44
Add a TACACS+ Server page.......................................44field summary......................................................45
Add a User Quick Configuration page...........................47field summary......................................................48
addressesdestination, displaying........................................183
Advanced Encryption Standard (AES) See AESencryption
AES encryptionfor Canada and U.S JUNOS.................................336setting.................................................................337
agents, SNMP See SNMP agentsalarm class See alarm severityALARM LED, color......................................................274alarm severity
action required...................................................282configuring for an interface.................................279displaying...........................................................282major (red) .........................................................275
See also major alarmsminor (yellow)....................................................275
See also minor alarmsalarms
active, checking..................................................281active, displaying at login....................................280conditions, on an interface.................................276configurable........................................................276configuration requirements for interface
alarms.............................................................279displaying for chassis..........................................177displaying for interfaces......................................181licenses...............................................................278major See major alarmsminor See minor alarmsmonitoring..........................................................281overview.............................................................274red See major alarmsred J-Web indicator.............................................281rescue configuration...........................................278severity See alarm severitytypes...................................................................275verifying.............................................................282yellow See minor alarms
Alarms Summary page...............................................281
Index ■ 429
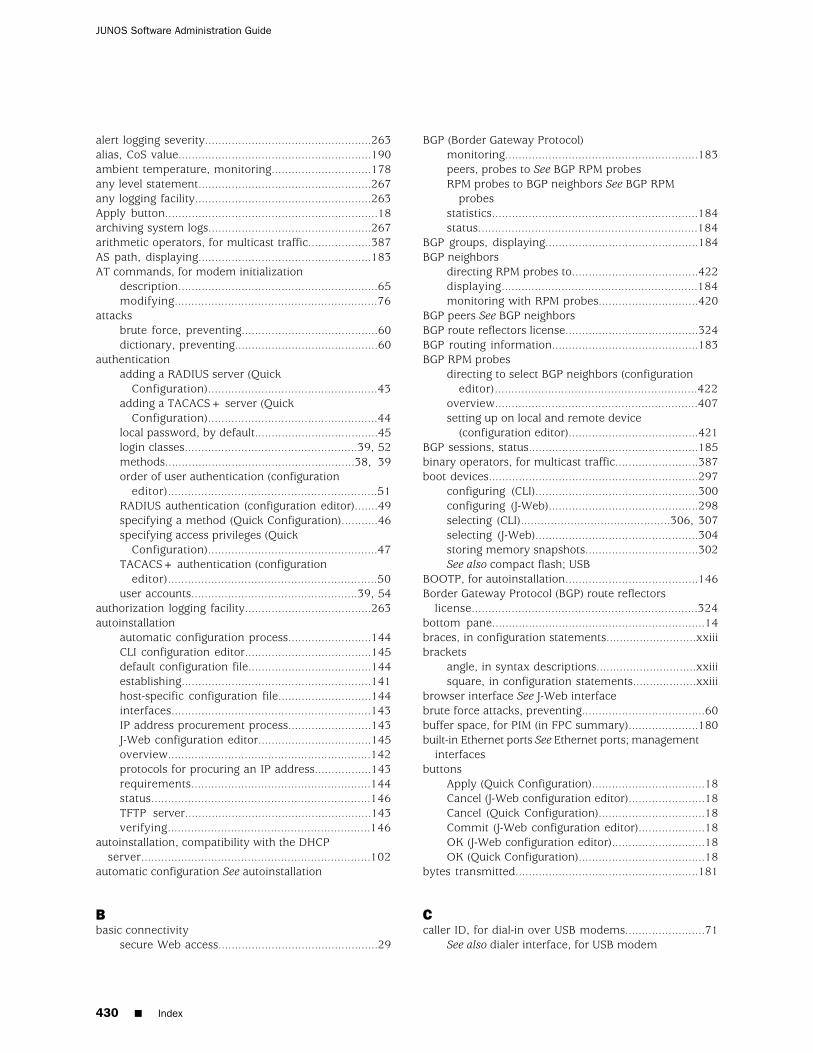
alert logging severity..................................................263alias, CoS value..........................................................190ambient temperature, monitoring..............................178any level statement....................................................267any logging facility.....................................................263Apply button................................................................18archiving system logs.................................................267arithmetic operators, for multicast traffic...................387AS path, displaying....................................................183AT commands, for modem initialization
description............................................................65modifying.............................................................76
attacksbrute force, preventing.........................................60dictionary, preventing...........................................60
authenticationadding a RADIUS server (Quick
Configuration)...................................................43adding a TACACS+ server (Quick
Configuration)...................................................44local password, by default.....................................45login classes....................................................39, 52methods.........................................................38, 39order of user authentication (configuration
editor)...............................................................51RADIUS authentication (configuration editor).......49specifying a method (Quick Configuration)...........46specifying access privileges (Quick
Configuration)...................................................47TACACS+ authentication (configuration
editor)...............................................................50user accounts..................................................39, 54
authorization logging facility......................................263autoinstallation
automatic configuration process.........................144CLI configuration editor......................................145default configuration file.....................................144establishing.........................................................141host-specific configuration file............................144interfaces............................................................143IP address procurement process.........................143J-Web configuration editor..................................145overview.............................................................142protocols for procuring an IP address.................143requirements......................................................144status..................................................................146TFTP server........................................................143verifying.............................................................146
autoinstallation, compatibility with the DHCPserver.....................................................................102
automatic configuration See autoinstallation
Bbasic connectivity
secure Web access................................................29
BGP (Border Gateway Protocol)monitoring..........................................................183peers, probes to See BGP RPM probesRPM probes to BGP neighbors See BGP RPM
probesstatistics..............................................................184status..................................................................184
BGP groups, displaying..............................................184BGP neighbors
directing RPM probes to......................................422displaying...........................................................184monitoring with RPM probes..............................420
BGP peers See BGP neighborsBGP route reflectors license........................................324BGP routing information............................................183BGP RPM probes
directing to select BGP neighbors (configurationeditor).............................................................422
overview.............................................................407setting up on local and remote device
(configuration editor).......................................421BGP sessions, status...................................................185binary operators, for multicast traffic.........................387boot devices...............................................................297
configuring (CLI).................................................300configuring (J-Web).............................................298selecting (CLI).............................................306, 307selecting (J-Web).................................................304storing memory snapshots..................................302See also compact flash; USB
BOOTP, for autoinstallation........................................146Border Gateway Protocol (BGP) route reflectors
license....................................................................324bottom pane................................................................14braces, in configuration statements...........................xxiiibrackets
angle, in syntax descriptions..............................xxiiisquare, in configuration statements...................xxiii
browser interface See J-Web interfacebrute force attacks, preventing.....................................60buffer space, for PIM (in FPC summary).....................180built-in Ethernet ports See Ethernet ports; management
interfacesbuttons
Apply (Quick Configuration)..................................18Cancel (J-Web configuration editor).......................18Cancel (Quick Configuration)................................18Commit (J-Web configuration editor)....................18OK (J-Web configuration editor)............................18OK (Quick Configuration)......................................18
bytes transmitted.......................................................181
Ccaller ID, for dial-in over USB modems........................71
See also dialer interface, for USB modem
430 ■ Index
JUNOS Software Administration Guide
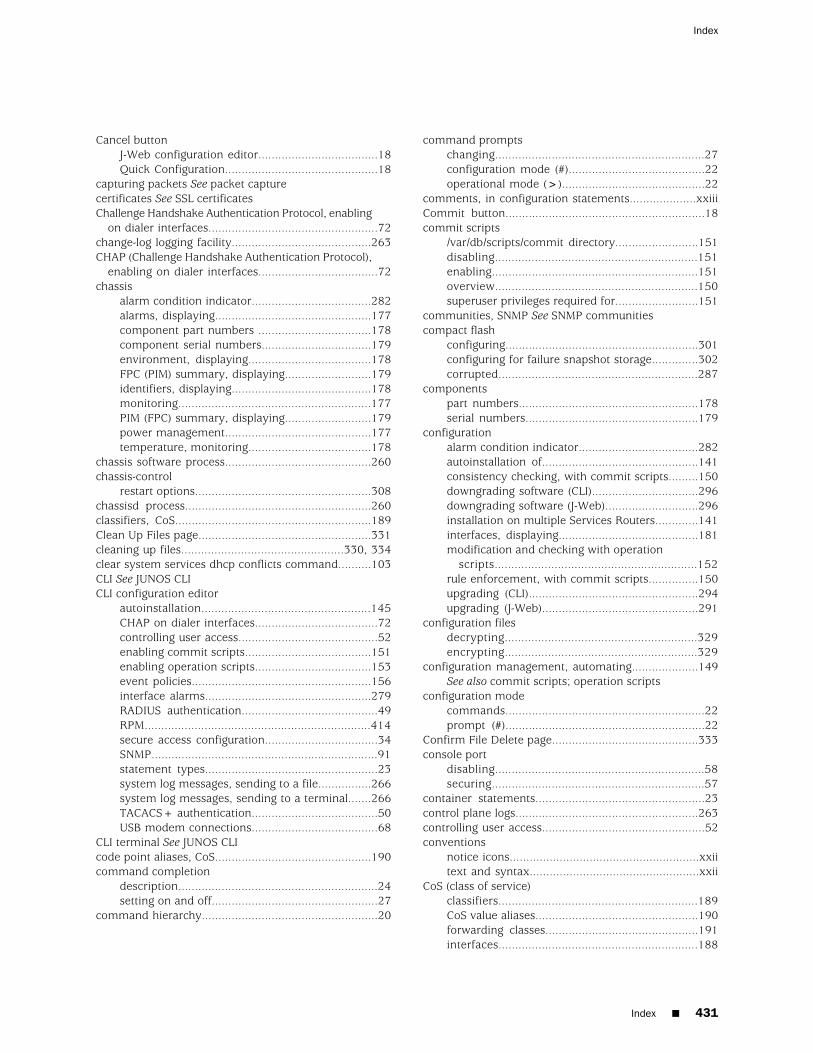
Cancel buttonJ-Web configuration editor....................................18Quick Configuration..............................................18
capturing packets See packet capturecertificates See SSL certificatesChallenge Handshake Authentication Protocol, enabling
on dialer interfaces...................................................72change-log logging facility..........................................263CHAP (Challenge Handshake Authentication Protocol),
enabling on dialer interfaces....................................72chassis
alarm condition indicator....................................282alarms, displaying...............................................177component part numbers ..................................178component serial numbers.................................179environment, displaying.....................................178FPC (PIM) summary, displaying..........................179identifiers, displaying..........................................178monitoring..........................................................177PIM (FPC) summary, displaying..........................179power management............................................177temperature, monitoring.....................................178
chassis software process............................................260chassis-control
restart options.....................................................308chassisd process........................................................260classifiers, CoS...........................................................189Clean Up Files page....................................................331cleaning up files.................................................330, 334clear system services dhcp conflicts command..........103CLI See JUNOS CLICLI configuration editor
autoinstallation...................................................145CHAP on dialer interfaces.....................................72controlling user access..........................................52enabling commit scripts......................................151enabling operation scripts...................................153event policies......................................................156interface alarms..................................................279RADIUS authentication.........................................49RPM....................................................................414secure access configuration..................................34SNMP....................................................................91statement types....................................................23system log messages, sending to a file................266system log messages, sending to a terminal.......266TACACS+ authentication......................................50USB modem connections......................................68
CLI terminal See JUNOS CLIcode point aliases, CoS...............................................190command completion
description............................................................24setting on and off..................................................27
command hierarchy.....................................................20
command promptschanging...............................................................27configuration mode (#).........................................22operational mode (>)...........................................22
comments, in configuration statements....................xxiiiCommit button............................................................18commit scripts
/var/db/scripts/commit directory.........................151disabling.............................................................151enabling..............................................................151overview.............................................................150superuser privileges required for.........................151
communities, SNMP See SNMP communitiescompact flash
configuring..........................................................301configuring for failure snapshot storage..............302corrupted............................................................287
componentspart numbers......................................................178serial numbers....................................................179
configurationalarm condition indicator....................................282autoinstallation of...............................................141consistency checking, with commit scripts.........150downgrading software (CLI)................................296downgrading software (J-Web)............................296installation on multiple Services Routers.............141interfaces, displaying..........................................181modification and checking with operation
scripts.............................................................152rule enforcement, with commit scripts...............150upgrading (CLI)...................................................294upgrading (J-Web)...............................................291
configuration filesdecrypting..........................................................329encrypting..........................................................329
configuration management, automating....................149See also commit scripts; operation scripts
configuration modecommands............................................................22prompt (#)............................................................22
Confirm File Delete page............................................333console port
disabling...............................................................58securing................................................................57
container statements...................................................23control plane logs.......................................................263controlling user access.................................................52conventions
notice icons.........................................................xxiitext and syntax...................................................xxii
CoS (class of service)classifiers............................................................189CoS value aliases.................................................190forwarding classes..............................................191interfaces............................................................188
Index ■ 431
Index

loss priority.........................................................194packet loss priority..............................................194RED drop profiles...............................................190rewrite rules........................................................192RPM probe classification.....................................417
See also TCP RPM probes; UDP RPM probesscheduler maps...................................................193
CPU usagePIM (in FPC summary)........................................179
crash filescleaning up (CLI).................................................334cleaning up (J-Web).............................................330downloading (J-Web)...........................................332
critical logging severity...............................................263cron logging facility....................................................263curly braces, in configuration statements..................xxiiicustomer support......................................................xxvi
contacting JTAC..................................................xxvihardware information for...................................178
Ddaemon logging facility..............................................263daemons See processes, softwareData Encryption Standard (DES) See DES encryptiondata plane logs...........................................................263deactivate system scripts commit command.............152deactivate system scripts op command.....................154debug logging severity...............................................263decryption, configuration files See file encryptiondefault configuration file, for autoinstallation.............144delete system scripts commit command....................151delete system scripts op command............................154deleting
crash files (J-Web)...............................................331files, with caution................................................333licenses (CLI).......................................................326log files (J-Web)...................................................331temporary files (J-Web).......................................331
DES encryptionfor international JUNOS......................................336setting.................................................................337
destination address, displaying..................................183device
automating operations and troubleshooting........149halting (CLI)........................................................306halting (J-Web)....................................................303packet capture....................................................389rebooting (J-Web)................................................303
DHCP (Dynamic Host Configuration Protocol)autoinstallation, compatibility with.....................102conflict detection and resolution.........................102interface restrictions...........................................103options................................................................101
overview.............................................................101See also DHCP leases; DHCP pages; DHCP
pools; DHCP serverserver function......................................................99verification..........................................................120
DHCP serverpreparation.........................................................103sample configuration..........................................114subnet and single client......................................115verifying operation..............................................123
dhcpd process............................................................260diagnosis
alarm configurations...........................................282automating with event policies...........................155
See also event policiesCLI command summary.....................................346displaying firewall filter for.................................400displaying packet capture configurations............399interfaces....................................................276, 381J-Web tools overview..........................................345license infringement...........................................278monitoring network performance.......................403MPLS connections (J-Web)..................................354multicast paths...................................................377network traffic....................................................383packet capture....................................................389packet capture (J-Web)........................................362ping command...................................................367ping host (J-Web)................................................350ping MPLS (J-Web)..............................................354ports...................................................................276preparation.................................................169, 349SNMP health monitor............................................86system logs.........................................................259system operation................................................381traceroute (J-Web)...............................................359traceroute command..........................................374traceroute monitor command.............................374traffic analysis with packet capture.....................389verifying captured packets..................................400verifying DHCP server operation.........................123verifying dialer interfaces......................................79verifying RPM probe servers...............................425verifying RPM statistics.......................................424verifying USB modem interfaces...........................78viewing active alarms.........................................281
diagnostic commands................................................346dial-in, USB modem (configuration editor)...................71
See also dialer interface, for USB modemdial-up modem connection
configuring device end..........................................68configuring user end.............................................74connecting device end..........................................67connecting user end..............................................75
432 ■ Index
JUNOS Software Administration Guide

dialer interface, for USB modemadding (configuration editor).................................69
See also USB modem connectionsCHAP for PPP (configuration editor)......................72dial-in (configuration editor)..................................71limitations.............................................................65naming convention...............................................65restrictions............................................................65verifying...............................................................79
dialer pools, for USB modems .....................................69See also dialer interface, for USB modem
dictionary attacks, preventing......................................60DiffServ code points, bits for RPM probes..................411disabling
commit scripts....................................................151console port..........................................................58operation scripts.................................................154packet capture....................................................397root login to console port......................................58system logs.........................................................267
discarded packets......................................................182disconnection of console cable for console logout........58dl0...............................................................................65documentation set
comments on......................................................xxvlist of..................................................................xxiv
downgradingsoftware, with J-Web...........................................296software, with the CLI ........................................296
download URL...........................................................290downloading
configuration, with autoinstallation.....................144crash files (J-Web)...............................................332log files (J-Web)...................................................332software upgrades...............................................290temporary files (J-Web).......................................332
DRAM, for PIM (in FPC summary)..............................179drop probabilities, CoS...............................................190drop profiles, CoS......................................................190dropped packets........................................................182DS1 ports See T1 portsDS3 ports See E3 ports; T3 portsDSCPs (DiffServ code points), bits for RPM
probes....................................................................411dynamic host configuration process...........................260Dynamic Host Configuration Protocol See DHCP
EE3 ports, alarm conditions and configuration
options...................................................................277egress See RPM probes, outbound timeselements, J-Web...........................................................15emergency logging severity........................................263encapsulation, modifying on packet capture-enabled
interfaces...............................................................398
encrypted accessthrough HTTPS.....................................................29through SSL..........................................................29
encryption, configuration files See file encryptionenforcement of configuration rules............................150environment, CLI
displaying.............................................................26setting...................................................................27
error logging severity.................................................263Ethernet ports
alarm condition indicator....................................282alarm conditions and configuration options........276autoinstallation on..............................................143configuring alarms on.........................................279Gigabit Ethernet ports, SNMP suppport.................83
event notifications, automating response to with eventpolicies...................................................................155
See also SNMP traps; system log messagesevent policies
configuration editor............................................156overview.............................................................155
event viewer, J-Weboverview.............................................................268
See also system log messagesExtensible Stylesheet Language Transformations (XSLT)
See commit scripts; operation scripts
Ffacility none statement...............................................267fans
speed, monitoring...............................................178status, monitoring...............................................178
feature licenses See licensesfile encryption
.gz.jc file extension.............................................336decrypting configuration files..............................338directories...........................................................336encrypting configuration files..............................337encryption algorithms required for JUNOS
versions...........................................................336encryption key....................................................336overview.............................................................336superuser privileges required for.........................336
file managementconfiguration files...............................................329crash files (CLI)...................................................334crash files (J-Web)...............................................330encryption-decryption See file encryptionlog files...............................................................329log files (CLI).......................................................334log files (J-Web)...................................................330packet capture file creation.................................392temporary files (CLI)...........................................334temporary files (J-Web).......................................330
Index ■ 433
Index
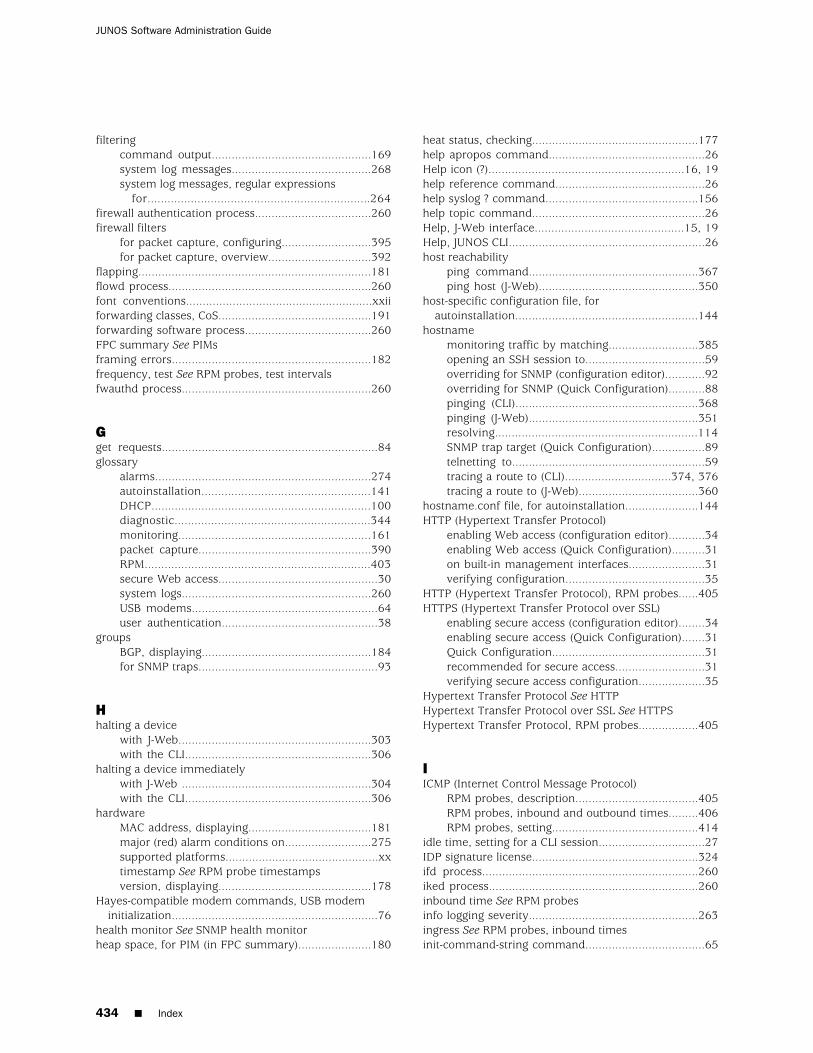
filteringcommand output................................................169system log messages..........................................268system log messages, regular expressions
for...................................................................264firewall authentication process...................................260firewall filters
for packet capture, configuring...........................395for packet capture, overview...............................392
flapping......................................................................181flowd process.............................................................260font conventions........................................................xxiiforwarding classes, CoS..............................................191forwarding software process......................................260FPC summary See PIMsframing errors............................................................182frequency, test See RPM probes, test intervalsfwauthd process.........................................................260
Gget requests.................................................................84glossary
alarms.................................................................274autoinstallation...................................................141DHCP..................................................................100diagnostic...........................................................344monitoring..........................................................161packet capture....................................................390RPM....................................................................403secure Web access................................................30system logs.........................................................260USB modems........................................................64user authentication...............................................38
groupsBGP, displaying...................................................184for SNMP traps......................................................93
Hhalting a device
with J-Web..........................................................303with the CLI........................................................306
halting a device immediatelywith J-Web .........................................................304with the CLI........................................................306
hardwareMAC address, displaying.....................................181major (red) alarm conditions on..........................275supported platforms..............................................xxtimestamp See RPM probe timestampsversion, displaying..............................................178
Hayes-compatible modem commands, USB modeminitialization..............................................................76
health monitor See SNMP health monitorheap space, for PIM (in FPC summary)......................180
heat status, checking..................................................177help apropos command...............................................26Help icon (?)...........................................................16, 19help reference command.............................................26help syslog ? command..............................................156help topic command....................................................26Help, J-Web interface.............................................15, 19Help, JUNOS CLI...........................................................26host reachability
ping command...................................................367ping host (J-Web)................................................350
host-specific configuration file, forautoinstallation.......................................................144
hostnamemonitoring traffic by matching...........................385opening an SSH session to....................................59overriding for SNMP (configuration editor)............92overriding for SNMP (Quick Configuration)...........88pinging (CLI).......................................................368pinging (J-Web)...................................................351resolving.............................................................114SNMP trap target (Quick Configuration)................89telnetting to..........................................................59tracing a route to (CLI)................................374, 376tracing a route to (J-Web)....................................360
hostname.conf file, for autoinstallation......................144HTTP (Hypertext Transfer Protocol)
enabling Web access (configuration editor)...........34enabling Web access (Quick Configuration)..........31on built-in management interfaces.......................31verifying configuration..........................................35
HTTP (Hypertext Transfer Protocol), RPM probes......405HTTPS (Hypertext Transfer Protocol over SSL)
enabling secure access (configuration editor)........34enabling secure access (Quick Configuration).......31Quick Configuration..............................................31recommended for secure access...........................31verifying secure access configuration....................35
Hypertext Transfer Protocol See HTTPHypertext Transfer Protocol over SSL See HTTPSHypertext Transfer Protocol, RPM probes..................405
IICMP (Internet Control Message Protocol)
RPM probes, description.....................................405RPM probes, inbound and outbound times.........406RPM probes, setting............................................414
idle time, setting for a CLI session................................27IDP signature license..................................................324ifd process.................................................................260iked process...............................................................260inbound time See RPM probesinfo logging severity...................................................263ingress See RPM probes, inbound timesinit-command-string command....................................65
434 ■ Index
JUNOS Software Administration Guide
Install Remote page...................................................292field summary............................................292, 299
installationlicenses (CLI).......................................................325software upgrades (CLI)......................................294software upgrades, from a remote server...........291software upgrades, uploading.............................293
Instance to which this connection belongsdescription..........................................................348using...................................................................357
interactive-commands logging facility........................263interface software process.........................................260interfaces See management interfaces; network
interfaces; portsinternal compact flash See compact flashInternet Explorer, modifying for worldwide version of
JUNOS software........................................................14Internet Key Exchange process..................................260intervals, probe and test See RPM probesIntrusion Detection and Prevention (IDP) signature
license....................................................................324ipconfig command.....................................................123
explanation.........................................................124
JJ-Flow license.............................................................324J-series.......................................................................329
alarms.................................................................273automating operations with scripts.....................149automating troubleshooting with scripts and event
policies............................................................149establishing secure Web access............................29HTTPS Web access...............................................29licenses...............................................................323managing user authentication...............................37monitoring .........................................................161network management...........................................83packet capture....................................................389performance monitoring.....................................403SSL access.............................................................29system log messages..........................................259user interfaces See user interfaces
J-series Services Routerlicenses...............................................................324
J-Web configuration editorautoinstallation...................................................145CHAP on dialer interfaces.....................................72controlling user access..........................................52enabling commit scripts......................................151enabling operation scripts...................................153event policies......................................................156interface alarms..................................................279RADIUS authentication.........................................49RPM....................................................................414secure access........................................................34
SNMP....................................................................91system log messages, sending to a file................266system log messages, sending to a terminal.......266TACACS+ authentication......................................50USB modem connections......................................68
J-Web interfacecontext-sensitive help.....................................15, 25Diagnose options................................................345event viewer.......................................................268Help (?) icon..........................................................16Internet Explorer, modifying for worldwide version
of JUNOS software with enhanced services.......14managing files....................................................330Monitor options..................................................162overview...............................................................12page layout...........................................................14sessions................................................................20side pane..............................................................17starting.................................................................14top pane...............................................................15windows, multiple, unpredictable results
with...................................................................20jitter
description..........................................................406See also RPM probes
in RPM probes, improving with timestamps.......405monitoring..........................................................202threshold, setting................................................411
JTAC (Juniper Networks Technical Assistance Center)hardware information for...................................178
JUNOS CLIaccess privilege levels...........................................40automatic command execution with event
policies............................................................155CLI terminal..........................................................21command completion...........................................24command hierarchy..............................................20command modes..................................................13command prompts See command promptsconsole.................................................................21context-sensitive help...........................................25denying and allowing commands.........................42diagnostic command summary...........................346editing keystrokes.................................................23environment, changing.........................................26filtering command output...................................169idle time...............................................................27managing licenses..............................................325monitoring (show) commands summary............162overview...............................................................13screen length........................................................27screen width.........................................................28ssh........................................................................21starting.................................................................21telnet....................................................................21
Index ■ 435
Index

terminal type........................................................28working directory.................................................27
JUNOS Enhanced Services softwaredocumentation...................................................xxiv
JUNOS Internet softwareestablishing secure Web access............................29
JUNOS softwareInternet Explorer, modifying for worldwide
version..............................................................14worldwide version, modifying Internet Explorer
for.....................................................................14JUNOS software with enhanced services
autoinstallation...................................................141encryption See file encryptionknown problems, operation scripts as
workarounds...................................................152processes............................................................260release notes, URL...............................................xixupgrading...........................................................287USB modems for remote management.................63
junos-jseries package See upgradesJUNOScope application................................................11JUNOScript API
enabling secure access..........................................31verifying secure access configuration....................35
JUNOScript Extensible Markup Language (XML) Seecommit scripts; operation scripts
JUNOScript over SSL....................................................31
Kkernel logging facility.................................................263key sequences, editing, in CLI......................................23
Llabel-switched paths See LSPslatency, in RPM probes, improving with
timestamps............................................................405Layer 2 circuits, monitoring.......................................354Layer 2 VPNs, monitoring..........................................354Layer 3 VPNs, monitoring..........................................354leaf statements.............................................................23libpcap format, for packet capture files......................401license infringement
verifying license usage........................................327verifying licenses installed..................................326
license infringement, alarm condition indicator.........282license keys
components........................................................325displaying (CLI)...................................................328
licensesadding (CLI)........................................................325BGP route reflectors............................................324deleting (CLI).......................................................326displaying (CLI)...................................................326
displaying usage.................................................327IDP signature......................................................324J-Flow traffic analysis..........................................324J-series Services Router ......................................324key......................................................................325
See also license keysmanaging (CLI)...................................................325overview.............................................................324preparation for....................................................325saving (CLI).........................................................326SRX-series services gateway...............................324traffic analysis.....................................................324verifying.............................................................326
licenses, alarm conditions and remedies....................278limitations
ALARM LED lights yellow whether alarm is minoror major..........................................................274
DHCP, no support on VPN interfaces..................103MPLS, no LSP statistics on outbound device.......196mtrace from-source packet statistics always
0.....................................................................379performance degradation with monitor traffic
command........................................................383PPP, no J-Web monitoring information
available..........................................................203Server relay and DHCP client cannot coexist in
device.............................................................101SNMP not supported on Gigabit Ethernet
interfaces..........................................................83software downgrade cannot be undone..............296
link statesnetwork interfaces..............................................180
local passworddefault authentication method for system.............45method for user authentication (Quick
Configuration)...................................................47order of user authentication (configuration
editor)...............................................................52overview.........................................................38, 39
local template accounts................................................56Locate LSP from interface name
description..........................................................348using...................................................................357
Locate LSP from virtual circuit informationdescription..........................................................349using...................................................................357
Locate LSP using interface namedescription..........................................................348using...................................................................356
log filesarchiving.............................................................329deleting unused files...........................................329rotating...............................................................329
Log Files page (Download).........................................332log messages See system log messageslogging facilities.........................................................263
436 ■ Index
JUNOS Software Administration Guide

logging severity levels................................................263logical interfaces, CoS................................................188logical operators, for multicast traffic.........................386login classes
defining (configuration editor)..............................53permission bits for................................................40predefined permissions........................................40specifying (Quick Configuration)...........................47
login retry limits, setting..............................................60logs See system logsloss priority, CoS........................................................194LSPs (label-switched paths)
information about...............................................196monitoring, with ping MPLS................................354statistics..............................................................197
MMAC (media access control) addresses
configured, displaying.........................................181hardware, displaying...........................................181
main pane, J-Web........................................................16major (red) alarms
action required...................................................282description..........................................................275
management devicediagnosing problems from..................................344monitoring from.................................................162
Management Information Bases See MIBsmanagement interfaces
active alarms......................................................181administrative states...........................................181alarm conditions and configuration options........276configuration, displaying.....................................181configuring alarms on.........................................279monitoring..................................................180, 381statistics..............................................................381
management software process..................................260managing
files.....................................................................329reboots...............................................................303snapshots............................................................297software..............................................................287user authentication...............................................37
manualscomments on......................................................xxvlist of .................................................................xxiv
match conditions, for multicast traffic...........................................................................385
maximum transmission unit (MTU), displaying..........181media access control See MAC addressesmemory usage
monitoring, PIM DRAM available........................179monitoring, PIM heap and buffer space
used................................................................180monitoring, SNMP See SNMP health monitor
messages See system log messagesmgd process..............................................................260MIBs (Management Information Bases)
controlling access (configuration editor)................94enterprise.............................................................84standard...............................................................84system identification (configuration editor)...........91URLs for download...............................................84views (configuration editor)..................................94
Microsoft Windows XP commands, connecting todevice from a management device...........................74
minor (yellow) alarmsaction required...................................................282description..........................................................275
modem connection to device USB port See USB modemconnections
modem connection to user management device SeeUSB modem connections
monitor interface command......................................381controlling output...............................................382
monitor interface traffic command............................381controlling output...............................................382
monitor list command...............................................381monitor start command.............................................381monitor stop command.............................................381monitor traffic command...........................................383
options................................................................384performance impact...........................................383
monitor traffic matching command...........................385arithmetic, binary, and relational operators........387logical operators.................................................386match conditions................................................385
monitoringalarms.................................................................281BGP.....................................................................184BGP neighbors, with RPM probes........................420chassis................................................................177CLI commands and corresponding J-Web
options............................................................162device health See SNMP health monitorhealth of the device See SNMP health monitorinterfaces....................................................180, 381J-Web options and corresponding CLI
commands......................................................162Layer 2 circuits...................................................354Layer 2 VPNs......................................................354Layer 3 VPNs......................................................354MPLS traffic
engineering.....................194, 195, 196, 197, 198multicast paths...................................................377network interface traffic.....................................383network traffic with packet capture....................389OSPF...................................................................185overview.............................................................162
See also diagnosis; statistics; statusports...................................................................180
Index ■ 437
Index

PPP (CLI).............................................................203PPPoE.................................................................203preparation.................................................169, 349RIP......................................................................187routing information.............................................182routing tables......................................................182RPM probes........................................................199SNMP health monitor See SNMP health monitorsystem log messages..........................................259system logs.........................................................381trace files............................................................381
monitoring the wx interface.......................................232MPLS (Multiprotocol Label Switching)
connections, checking.........................................354LSPs....................................................................196monitoring interfaces..........................................195monitoring LSP information................................195monitoring LSP statistics.............................196, 197monitoring MPLS interfaces................................195monitoring RSVP interfaces................................198monitoring RSVP sessions...........................197, 198monitoring traffic engineering............................194
mtrace monitor command.........................................380results.................................................................380
mtrace-from-source command...................................378options................................................................378results.................................................................379
MTU (maximum transmission unit), displaying..........181multicast
trace operations, displaying................................380tracing paths.......................................................378
MultiModem, recommended for USB modemconnections..............................................................63
multiple devices, using snapshots to replicateconfigurations
CLI......................................................................301J-Web..................................................................299
multiple routersdeploying See autoinstallation
Multiprotocol Label Switching See MPLS
Nname of network interfaces, displaying......................180neighbors, BGP See BGP neighbors; BGP RPM probesnetwork interfaces
active alarms......................................................181administrative states...........................................181alarm conditions and configuration options........276configuration, displaying.....................................181configuring alarms on.........................................279integrated services, alarm conditions and
configuration options......................................276monitoring..................................................180, 381monitoring MPLS traffic engineering...................195monitoring traffic................................................383
monitoring, CoS..................................................188monitoring, PPPoE..............................................203monitoring, RSVP...............................................199packet capture, configuring on............................395packet capture, disabling before changing
encapsulation..................................................398packet capture, supported on..............................391services, alarm conditions and configuration
options............................................................277statistics..............................................................381
network management..................................................84automating with operation scripts.......................152diagnosis and problem-solving with scripts.........152See also SNMP
network management system (NMS)...........................85network performance See RPMnetwork security process...........................................260network.conf file, default for
autoinstallation...............................................144, 145next hop, displaying...................................................183NMS (network management system)...........................85no-world-readable statement.....................................267notice icons................................................................xxiinotice logging severity...............................................263notifications See event policies; system log messages;
SNMP trapsnsd process................................................................260nsrpd process.............................................................260
Oobject identifiers (OIDs)...............................................84OIDs (object identifiers)...............................................84OK button
J-Web configuration editor....................................18Quick Configuration..............................................18
op command.............................................................154Open Shortest Path First See OSPFopenssl command........................................................31operation scripts
/var/db/scripts/op directory.................................153disabling.............................................................154enabling..............................................................153executing from the CLI.......................................154executing within an event policy.........................155overview.............................................................152superuser privileges required for.........................153
operational modecommands............................................................22prompt (>)...........................................................22
operational mode, filtering command output.............169operator login class permissions..................................40operators
arithmetic, binary, and relational operators........387logical.................................................................386
438 ■ Index
JUNOS Software Administration Guide
OSPF (Open Shortest Path First)monitoring..........................................................185statistics..............................................................186
OSPF interfacesdisplaying...........................................................186status..................................................................186
OSPF neighborsdisplaying...........................................................185status..................................................................186
OSPF routing information..........................................185outbound time See RPM probes
Ppacket capture
configuring..........................................................395configuring (J-Web).............................................362configuring on an interface.................................395device interfaces supported................................391disabling.............................................................397disabling before changing encapsulation on
interfaces........................................................398displaying configurations....................................399displaying firewall filter for.................................400enabling..............................................................393encapsulation on interfaces, disabling before
modifying........................................................398files See packet capture filesfirewall filters, configuring..................................395firewall filters, overview......................................392J-Web tool...........................................................362overview.............................................................391overview (J-Web).................................................362preparation.........................................................393verifying captured packets..................................400verifying configuration........................................399verifying firewall filter for...................................400
packet capture filesanalyzing............................................................393libpcap format....................................................401overview.............................................................392renaming before modifying encapsulation on
interfaces........................................................398Packet Capture page
field summary....................................................364results.................................................................366
packet loss priority, CoS.............................................194packets
capturing............................................................389capturing with J-Web packet capture..................362discarded............................................................182dropped..............................................................182monitoring jitter..................................................202monitoring packet loss........................................201monitoring round-trip times................................201multicast, tracking .............................................378
packet capture....................................................389packet capture (J-Web)........................................362tracking MPLS.....................................................358tracking with J-Web traceroute............................359tracking with the traceroute command...............374
pages, layout in J-Web..................................................14parentheses, in syntax descriptions...........................xxiiipart numbers.............................................................178partitioning a boot medium.......................................301password retry limits, setting.......................................61passwords
for downloading software upgrades....................290local password method for user authentication
(Quick Configuration)........................................47See also local password
RADIUS secret......................................................44retry limits............................................................60setting login retry limits........................................60TACACS+ secret...................................................45
paths, multicast, tracing.............................................377PCAP See packet capturepeers, BGP See BGP neighbors; BGP RPM probesperformance, monitoring See RPMpermission bits, for login classes..................................40permissions
denying and allowing commands.........................42predefined............................................................40
physical interfaces, CoS.............................................188PIC See PIMsPIMs (Physical Interface Modules)
checking power and heat status..........................177CPU usage (in FPC summary).............................179DRAM available (in FPC summary).....................179heap and buffer space used (in FPC
summary)........................................................180PIM number (always 0).......................................178slot number (in FPC summary)...........................179slot status (in FPC summary)..............................179temperature (in FPC summary)...........................179
pinghost reachability (CLI).........................................367host reachability (J-Web).....................................350ICMP probes.......................................................414indications..........................................................354RPM probes See RPM probesTCP and UDP probes..........................................417
ping command...........................................................367DHCP server operation.......................................123DHCP server operation, explanation...................123options................................................................368
Ping end point of LSPdescription..........................................................349using...................................................................357
ping hostresults.................................................................353
Index ■ 439
Index
Ping Host page...........................................................351field summary....................................................351results.................................................................353
Ping LDP-signaled LSPdescription..........................................................348using...................................................................356
Ping LSP to Layer 3 VPN prefixdescription..........................................................348using...................................................................356
ping MPLS (J-Web)indications..........................................................358Layer 2 circuits...................................................354Layer 2 VPNs......................................................354Layer 3 VPNs......................................................354LSP state.............................................................354options........................................................347, 348requirements......................................................349results.................................................................358
ping mpls l2circuit command.....................................373results.................................................................358
ping mpls l2vpn command........................................372results.................................................................358
ping mpls l3vpn command........................................371results.................................................................358
ping mpls ldp command............................................370results.................................................................358
ping mpls lsp-end-point command.............................370results.................................................................358
Ping MPLS page.........................................................355field summary....................................................356results.................................................................358
ping mpls rsvp command..........................................370results.................................................................358
Ping RSVP-signaled LSPdescription..........................................................348using...................................................................356
pipe (|) command, to filter output..............................169Point-to-Point Protocol See PPPPoint-to-Point Protocol over Ethernet See PPPoEports
alarm conditions and configuration options........276configuration, displaying.....................................181configuring alarms on.........................................279console port, securing...........................................57DHCP interface restrictions.................................103individual port types...........................................276monitoring..........................................................180
power management, chassis......................................177PPP (Point-to-Point Protocol)
CHAP on dialer interfaces.....................................72monitoring (CLI)..................................................203
PPPoE (Point-to-Point Protocol over Ethernet)interfaces............................................................203monitoring..........................................................203session status......................................................203
statistics..............................................................204version information............................................205
printf statements........................................................153probe loss
monitoring..........................................................201threshold, setting................................................411
probes, monitoring............................................199, 203See also RPM probes
process command, displaying....................................176process ID, displaying................................................176process owner, displaying..........................................176process sleep state, displaying...................................176process start time, displaying.....................................177process status, displaying...........................................176process terminal, displaying.......................................176processes, software
chassis process...................................................260forwarding process.............................................260interface process.................................................260management process..........................................260routing protocol process.....................................260
prompt See command prompts; restart-after-upgradeprompt
protocolsDHCP See DHCPoriginating, displaying.........................................183OSPF, monitoring...............................................185PPP, monitoring..................................................203RIP, monitoring..................................................186routing protocols, monitoring.....................182, 183
QQuick Configuration
Add a RADIUS Server page...................................43Add a TACACS+ Server page...............................44Add a User page....................................................47adding users.........................................................47authentication method..........................................45buttons.................................................................18Packet Capture page...........................................363Packet Capture results page................................366RADIUS server......................................................43RPM pages..................................................408, 409Secure Access page...............................................32secure Web access................................................31SNMP page...........................................................87TACACS+ server..................................................44user management.................................................42Users page............................................................46View Events page................................................268
440 ■ Index
JUNOS Software Administration Guide

RRADIUS
adding a server (Quick Configuration)...................43authentication (configuration editor).....................49order of user authentication (configuration
editor)...............................................................52secret (configuration editor)..................................50secret (Quick Configuration).................................44specifying for authentication (Quick
Configuration)...................................................46random early detection (RED) drop profiles, CoS.......190RARP, for autoinstallation..........................................146read-only login class permissions.................................40real-time performance monitoring See RPMreboot immediately
with J-Web..........................................................304with the CLI........................................................305
rebootingwith J-Web .........................................................303with the CLI........................................................305
red Alarms indicator, in J-Web...................................281red asterisk (*).............................................................16RED drop profiles, CoS...............................................190registration form, for software upgrades............288, 289regular expressions for filtering system logs..............264relational operators, for multicast traffic....................387release notes, URL.......................................................xixremote accounts
accessing with SSH (CLI).......................................59accessing with Telnet (CLI)....................................58remote template accounts....................................55
remote connection to deviceconnecting USB modem to device........................67
See also USB modem connectionsconnecting USB modem to user management
device...............................................................74See also USB modem connections
remote management, with USB modems.....................63See also USB modem connections; USB modems
remote monitoring (RMON) See SNMP health monitorremote server, upgrading from..................................291remote template accounts............................................55request interface modem reset umd0 command.........77request system halt command...................................306
options................................................................306request system license add command.......................325request system license add terminal command.........325request system license delete command....................326request system license save command......................326request system reboot command...............................305
options................................................................305request system set-encryption-key algorithm des
command...............................................................337request system set-encryption-key command............337request system set-encryption-key des unique...........337request system set-encryption-key unique.................337
request system snapshot command...........................300options................................................................301
request system software add validate unlink rebootcommand...............................................................294
request system storage cleanup command................335request system storage cleanup dry-run
command...............................................................335required entry .............................................................16rescue configuration, alarm about..............................278Resource Reservation Protocol See RSVPrestart-after-upgrade prompt........................................27retry limits for passwords............................................60Reverse Address Resolution Protocol (RARP), for
autoinstallation.......................................................146reverting to a previous configuration file (J-Web).......296rewrite rules, CoS.......................................................192RIP (Routing Information Protocol)
monitoring..........................................................186statistics..............................................................187
RIP neighborsdisplaying...........................................................187status..................................................................187
RIP routing information.............................................186RMON (remote monitoring) See SNMP health monitorrolling back a configuration file, to downgrade software
(CLI).......................................................................296root login to the console, disabling...............................58rotating files...............................................................331round-trip time
description..........................................................406See also RPM probes
threshold, setting................................................411route reflectors, BGP, license......................................324router.conf file, for autoinstallation............................144routing
monitoring..........................................................182traceroute (J-Web)...............................................359traceroute command..........................................374traceroute monitor command.............................374
Routing Enginetemperature........................................................178
routing policiesexport, displaying...............................................185import, displaying...............................................185
routing protocol software process..............................260routing table
displaying...........................................................183monitoring..........................................................182
rpd process................................................................260RPM (real-time performance monitoring)
basic probes (configuration editor)......................414BGP monitoring See BGP RPM probesinbound and outbound times..............................406jitter, viewing......................................................202monitoring probes..............................................199
Index ■ 441
Index

overview.............................................................404See also RPM probes
preparation.........................................................408probe and test intervals......................................405probe counts.......................................................407Quick Configuration............................................408round-trip times, description...............................406round-trip times, viewing....................................201sample configuration..........................................423sample graphs....................................................200statistics..............................................................406statistics, verifying..............................................424TCP probes (configuration editor).......................417
See also TCP RPM probestests....................................................................405tests, viewing......................................................200threshold values..................................................407tuning probes......................................................419UDP probes (configuration editor).......................417
See also UDP RPM probesverifying probe servers.......................................425
RPM pages.........................................................408, 409field summary....................................................410
RPM probe timestampsoverview.............................................................405setting (configuration editor)...............................414
RPM probesbasic (configuration editor).................................414BGP neighbors See BGP RPM probescumulative jitter..................................................202current tests........................................................200DSCP bits (Quick Configuration).........................411graph results.......................................................200ICMP (configuration editor).................................414inbound times.....................................................406jitter threshold....................................................411monitoring..........................................................199outbound times...................................................406probe count, setting (Quick Configuration)..........410probe count, tuning............................................420probe counts.......................................................407probe intervals....................................................405probe intervals, setting (Quick
Configuration).................................................410probe intervals, tuning........................................420probe loss count.................................................411probe owner.......................................................410probe type, setting (Quick Configuration)...........410probe types.........................................................404round-trip time threshold....................................411round-trip times, description...............................406round-trip times, viewing....................................201SNMP traps (Quick Configuration).......................412source address, setting........................................420TCP (configuration editor)...................................417
See also TCP RPM probes
TCP server port...................................................413test intervals.......................................................405test intervals, setting (Quick Configuration)........410test target...........................................................410threshold values, description..............................407threshold values, setting (Quick
Configuration).................................................411timestamps See RPM probe timestampstuning.................................................................419UDP (configuration editor)..................................417
See also UDP RPM probesUDP server port..................................................413verifying TCP and UDP probe servers.................425
RSVP (Resource Reservation Protocol)interfaces, monitoring.........................................199sessions, monitoring...........................................198
RTT See RPM probes, round-trip times
Ssample configuration
for secure access...................................................36for SSL certificates................................................35
samplesalarm configuration............................................282basic RPM probes...............................................414local template account..........................................56RPM probes........................................................423RPM test graphs..................................................200TCP and UDP probes..........................................417user account.........................................................54
saving licenses (CLI)...................................................326scheduler maps, CoS..................................................193scheduling a reboot
with J-Web..........................................................304with the CLI........................................................306
screen length, CLI, setting ...........................................27screen width, CLI, setting ............................................28scripts See commit scripts; operation scriptssecret
RADIUS (configuration editor)...............................50RADIUS (Quick Configuration)..............................44TACACS+ (configuration editor)...........................51TACACS+ (Quick Configuration)..........................45
secure accessgenerating SSL certificates....................................31HTTPS access (configuration editor)......................34HTTPS access (Quick Configuration).....................31HTTPS recommended...........................................31installing SSL certificates (configuration
editor)...............................................................34installing SSL certificates (Quick
Configuration)...................................................31JUNOScript SSL access..........................................31overview...............................................................30requirements........................................................31
442 ■ Index
JUNOS Software Administration Guide

sample configuration............................................36verifying secure access configuration....................35
Secure Access pagedescription............................................................32field summary......................................................33
Secure Sockets Layer See SSLsecurity
access privileges.............................................39, 52configuration file encryption...............................336
See also file encryptionconsole port security.............................................57packet capture for intrusion detection................391password retry limits............................................60user accounts..................................................39, 54user authentication...............................................38
serial cable, disconnection for console logout..............58Serial Line Address Resolution Protocol (SLARP), for
autoinstallation.......................................................146serial number
chassis components............................................179Services Router...................................................171
serial portsalarm condition indicator....................................282alarm conditions and configuration options........276autoinstallation on..............................................143configuring alarms on.........................................279
services gatewayestablishing secure Web access............................29HTTPS Web access...............................................29licenses...............................................................323SSL access.............................................................29user interfaces See user interfaces
services modulealarm condition indicator....................................282alarm conditions and configuration options........277
Services Routeras a DHCP server..................................................99autoinstallation...................................................141bring components online/offline.........................307diagnosis.............................................................343establishing secure Web access............................29HTTPS Web access...............................................29licenses...............................................................323monitoring .........................................................161multiple, deploying See autoinstallationnetwork management...........................................83performance monitoring.....................................403rebooting (CLI)....................................................305serial number, displaying....................................171software upgrades...............................................287SSL access.............................................................29USB modems for remote management.................63user interfaces See user interfaces
sessionsBGP peer, status details.......................................185BGP peer, status summary..................................184
RSVP, monitoring...............................................198Telnet...................................................................59
sessions, J-Web............................................................20set cli commands.........................................................27set no-encrypt-configuration-files command..............338set requests..................................................................84set system dump-device command............................302
options................................................................302severity levels
for alarms See alarm severityfor system logs...................................................263
show bgp neighbor command....................................184show bgp summary command...................................183show chassis alarms command..................177, 281, 282show chassis environment command........................177show chassis fpc command.......................................177show chassis hardware command.............................177show chassis power-ratings command.......................177show class-of-service classifier command..................189show class-of-service code-point-aliases
command...............................................................190show class-of-service command.................................188show class-of-service drop-profile command..............190show class-of-service forwarding-class command......191show class-of-service rewrite-rules command............192show class-of-service scheduler-map command.........193show cli command.......................................................26show firewall filter dest-all command.........................400show interfaces detail command................................180show interfaces dl0 extensive command.....................79show interfaces interface-name command.................180show interfaces pp0 command..................................203show interfaces terse command................................180show interfaces umd0 extensive command.................78
explanation, for USB modem interfaces................78show log command....................................................262show mpls interface command..................................195show mpls lsp command...........................................195show mpls statistics command..................................196show ospf interfaces command.................................185show ospf neighbors command.................................185show ospf statistics command...................................185show ppp address-pool command..............................203show ppp interface command....................................203show ppp statistics command....................................203show ppp summary command..................................203show pppoe interfaces command..............................203show pppoe statistics command................................203show pppoe version command..................................203show rip neighbors command....................................187show rip statistics command......................................187show route detail command.......................................182show route terse command........................................182show services rpm active-servers command..............425
explanation.........................................................425
Index ■ 443
Index

show services rpm probe-results command.......199, 424explanation.........................................................424
show snmp health-monitor command.........................96show snmp statistics command...................................95show system alarms command..................................281show system autoinstallation status command..........146show system license command..................................327
explanation.........................................................327show system license keys command.........................328show system license usage command........................327
explanation.........................................................327show system processes command.....................171, 262show system services dhcp binding command..........121show system services dhcp binding detail
command...............................................................121show system services dhcp client command..............122show system services dhcp client interface
command...............................................................122show system services dhcp client statistics
command...............................................................122show system services dhcp conflict command...........103show system services dhcp global command.............120show system services dhcp relay-statistics
command...............................................................124explanation.........................................................124
show system storage command.................................171show system uptime command.................................171show system users command....................................171show forwarding-options command...........................399side pane, J-Web..........................................................17signatures, IDP, license..............................................324Simple Network Management Protocol See SNMPSLARP, for autoinstallation.........................................146slots, PIM, monitoring (in FPC summary)...................179SMI (Structure of Management Information)................84Snapshot page............................................................298snapshots
configuring for failure snapshot storage..............302to replace internal compact flash, for multiple
devices (CLI)....................................................301to replace primary compact flash, for multiple
devices (J-Web)................................................299SNMP (Simple Network Management Protocol)
agents See SNMP agentsarchitecture...........................................................84communities See SNMP communitiescontrolling access (configuration editor)..........94, 95get requests..........................................................84health monitor See SNMP health monitormanagers..............................................................84MIBs See MIBson Gigabit Ethernet interfaces...............................83overview...............................................................84preparation...........................................................86Quick Configuration..............................................87set requests...........................................................84
spoofed traps........................................................85system identification (configuration editor)...........91traps See SNMP trapsviews (configuration editor)..................................94
SNMP agents................................................................84configuring (configuration editor)..........................92verifying...............................................................95
SNMP communitiescreating (configuration editor)...............................92description............................................................85Quick Configuration..............................................88
SNMP health monitordescription............................................................86Quick Configuration..............................................87verifying...............................................................96
SNMP managers...........................................................84SNMP page...................................................................87SNMP traps
automating response to with event policies........155creating groups for (configuration editor)..............93initiation by event policy, overview....................155initiation by event policy, setting (configuration
editor).............................................................157overview...............................................................85performance monitoring See RPM probesQuick Configuration..............................................88spoofed traps........................................................85
softwarehalting immediately (CLI) ...................................306halting immediately (J-Web) ...............................304upgrades See upgrades
speed, fans, monitoring.............................................178spoofed SNMP traps.....................................................85SRC application............................................................11SRX-series..................................................................329
alarms.................................................................273automating operations with scripts.....................149automating troubleshooting with scripts and event
policies............................................................149establishing secure Web access............................29HTTPS Web access...............................................29licenses...............................................................323managing user authentication...............................37monitoring .........................................................161network management...........................................83packet capture....................................................389performance monitoring.....................................403SSL access.............................................................29system log messages..........................................259user interfaces See user interfaces
SRX-series services gatewaylicenses...............................................................324
SSHaccessing remote accounts (CLI)...........................59setting login retry limits........................................60
444 ■ Index
JUNOS Software Administration Guide
ssh command..............................................................59options..................................................................59
SSL (Secure Sockets Layer)enabling secure access (Quick Configuration).......31management access.............................................30verifying SSL configuration...................................35
SSL 3.0 option, disabling on Internet Explorer forworldwide version of JUNOS software......................14
SSL certificatesadding (configuration editor).................................35adding (Quick Configuration)................................33generating.............................................................31sample configuration............................................35verifying SSL configuration...................................35
startupJ-Web interface.....................................................14JUNOS CLI.............................................................21
statements, configuration types...................................23statistics
BGP.....................................................................184interfaces............................................................381LSP.....................................................................197OSPF...................................................................186performance monitoring.....................................406PPPoE.................................................................204RIP......................................................................187RPM, description.................................................406RPM, monitoring.................................................200RPM, verifying....................................................424
statusadministrative link state......................................181autoinstallation...................................................146BGP.............................................................184, 185fans.....................................................................178link states, network interfaces............................180OSPF interfaces..................................................186OSPF neighbors..................................................186RIP neighbors.....................................................187slot (in FPC summary)........................................179
storage mediaconfiguring boot devices.....................................297
Structure of Management Information (SMI)................84super-user login class permissions...............................40superuser login class permissions................................40support, technical See technical supportsyntax conventions....................................................xxiisyslog See system logssystem identification, displaying................................171system log messages
/var/log directory.................................................266capturing in a file (configuration editor)..............266destinations........................................................262displaying at a terminal (configuration
editor).....................................................264, 266event viewer.......................................................268facilities..............................................................263
filtering (Quick Configuration).............................268monitoring (Quick Configuration).......................268overview.............................................................262preparation.........................................................265regular expressions for filtering..........................264sending messages to a file (configuration
editor).............................................................266sending messages to a terminal (configuration
editor).............................................................266severity levels.....................................................263viewing (Quick Configuration).............................270
system logsarchiving.............................................................267control plane logs................................................263data plane logs....................................................263destinations for log files......................................262disabling.............................................................267event triggers for SNMP traps, setting in event
policies............................................................157file cleanup (CLI).................................................334file cleanup (J-Web).............................................330functions.............................................................262logging facilities..................................................263logging severity levels.........................................263messages See system log messagesmonitoring..........................................................381overview.............................................................262regular expressions for filtering..........................264
system managementautomating.........................................................149
See also commit scripts; event policies;operation scripts
displaying log and trace file contents..................381login classes....................................................39, 52preparation...........................................................42Quick Configuration..............................................42system logs.........................................................259template accounts...........................................42, 55user accounts..................................................39, 54user authentication...............................................38
system process information, displaying.....................177
TT1 ports
alarm conditions and configuration options........276configuring alarms on.........................................279
T3 portsalarm condition indicator....................................282alarm conditions and configuration options........278configuring alarms on.........................................279
TACACS+adding a server (Quick Configuration)...................44authentication (configuration editor).....................50order of user authentication (configuration
editor)...............................................................52
Index ■ 445
Index

secret (configuration editor)..................................51secret (Quick Configuration).................................45specifying for authentication (Quick
Configuration)...................................................46taskbar.........................................................................15TCP RPM probes
CoS classification, destination interfacerequirement....................................................417
CoS classification, use with caution.....................417description..........................................................405server port..........................................................413setting.................................................................417verifying servers.................................................425
technical publications list...........................................xxivtechnical support
contacting JTAC..................................................xxvihardware information for...................................178
Telnetaccessing remote accounts (CLI)...........................58setting login retry limits........................................60
telnet command...........................................................59options..................................................................59
Telnet session..............................................................59temperature
chassis, monitoring.............................................178PIM (in FPC summary)........................................179
template accountsdescription............................................................42local accounts (configuration editor).....................57remote accounts (configuration editor).................56
temporary filescleaning up (CLI).................................................334cleaning up (J-Web).............................................330downloading (J-Web)...........................................332for packet capture...............................................393
terminal session, sending system log messagesto............................................................................266
terminal type, setting ..................................................28terminology
alarms.................................................................274autoinstallation...................................................141DHCP..................................................................100diagnostic...........................................................344monitoring..........................................................161packet capture....................................................390RPM....................................................................403secure Web access................................................30system logs.........................................................260USB modems........................................................64user authentication...............................................38
tests See RPMTFTP, for autoinstallation...........................................143threshold
falling....................................................................86rising....................................................................86SNMP health monitor............................................86
threshold values, for RPM probes See RPM probestime to live See TTLtimestamps
for RPM probes See RPM probe timestampssuppressing in packet headers, in captured
packets............................................................365suppressing in packet headers, in traffic
monitoring......................................................384top pane, J-Web...........................................................15trace files
monitoring..........................................................381multicast, monitoring..........................................380
tracerouteCLI command.....................................................374indications..........................................................362J-Web tool...........................................................359results.................................................................361TTL increments...................................................359
traceroute command..................................................374options................................................................374
traceroute monitorCLI command.....................................................375
traceroute monitor command....................................375options................................................................376results.................................................................377
Traceroute page.........................................................360field summary....................................................360
trafficanalyzing with packet capture.............................389multicast, tracking..............................................378tracking with J-Web traceroute............................359tracking with the traceroute command...............374
traffic analysis license................................................324transmission speed, displaying..................................181traps See SNMP trapstriggers for SNMP traps, setting in event policies.......157Trivial File Transfer Protocol (TFTP), for
autoinstallation.......................................................143troubleshooting
automating with event policies...........................155operation scripts.................................................152
See also diagnosis; operation scriptspacket capture for analysis.................................389
See also diagnosis; packet captureSNMP health monitor............................................86
TTL (time to live)default, in multicast path-tracking queries..........378in ping requests..................................................353increments, in traceroute packets.......................359threshold, in multicast trace results....................380total, in multicast trace results............................380
types of configuration statements................................23
446 ■ Index
JUNOS Software Administration Guide
UUDP RPM probes
CoS classification, destination interfacerequirement....................................................417
CoS classification, use with caution.....................417description..........................................................405server port..........................................................413setting.................................................................417verifying servers.................................................425
umd0...........................................................................65unauthorized login class permissions...........................40universal serial bus See USBupgrades
downloading.......................................................290installing (CLI).....................................................294installing by uploading........................................293installing from remote server..............................291overview.............................................................288requirements..............................................288, 289
Upload package page.................................................293field summary....................................................294
URLsJuniper Networks enterprise MIBs.........................85release notes........................................................xixsoftware downloads............................................290standard MIBs.......................................................84
USB (universal serial bus)configuring..........................................................301configuring for failure snapshot storage..............302
USB modem connectionsadding an interface...............................................68CHAP on dialer interfaces (configuration
editor)...............................................................72configuring device end..........................................68configuring dial-up modem at user end................74connecting device end..........................................67connecting dial-up modem at user end.................75connecting to user end.........................................74dial-in (configuration editor)..................................71dialer interface See dialer interface, USB modeminterface naming conventions...............................64overview...............................................................66requirements........................................................67USB modem interface types..................................64verifying dialer interfaces......................................79verifying USB modem interfaces...........................78
USB modem interfacesCHAP on dialer interfaces (configuration
editor)...............................................................72dial-in (configuration editor)..................................71dialer interface See dialer interface, USB modeminterface types......................................................64verifying USB modem interfaces...........................78
USB modemsadministering........................................................75AT commands......................................................65
AT commands, modifying.....................................76configuration overview.........................................66connecting at device end......................................67connecting at user end..........................................74default modem initialization commands...............65default modem initialization commands,
modifying..........................................................76initialization by device..........................................65MultiModem.........................................................63overview...............................................................64
See also dialer interface, for USB modem; USBmodem connections
recommended modem.........................................63resetting................................................................77verifying...............................................................77
user accountsauthentication order (configuration editor)...........51contents................................................................39creating (configuration editor)...............................55for local users.......................................................56for remote users...................................................55predefined login classes........................................40templates for..................................................42, 55
See also template accountsuser interfaces
JUNOScope application.........................................11overview...............................................................11preparation...........................................................13SRC application.....................................................11
user logging facility....................................................263username
description............................................................39specifying (Quick Configuration)...........................47
usersaccess privileges.............................................39, 52accounts See user accountsadding (Quick Configuration)................................47login classes....................................................39, 52predefined login classes........................................40template accounts See template accountsusernames............................................................39
Users Quick Configuration page...................................46
Vverification
active licenses.....................................................326alarm configurations...........................................282autoinstallation...................................................146captured packets.................................................400destination path (J-Web).....................................359DHCP server operation.......................................123DHCP statistics...................................................124dialer interfaces....................................................79firewall filter for packet capture..........................400host reachability (CLI).........................................367
Index ■ 447
Index

host reachability (J-Web).....................................350license usage.......................................................327licenses ..............................................................326LSPs (J-Web).......................................................354packet capture....................................................399RPM configuration..............................................423RPM probe servers..............................................425RPM statistics.....................................................424secure access........................................................35SNMP....................................................................95SNMP health monitor............................................96traceroute command..........................................374traceroute monitor command.............................374tracing multicast paths........................................378USB modem interfaces.........................................78
versionhardware, displaying...........................................178PPPoE, information about...................................205
View Events page.......................................................268field summary (filtering log messages)................269field summary (viewing log messages)................270
views, SNMP................................................................95VPNs (virtual private networks), DHCP support on
interfaces...............................................................103
Wwarning logging severity............................................263Web access, secure See secure accessWeb browser, modifying Internet Explorer for
worldwide version of JUNOS software......................14windows, J-Web, unpredictable results with
multiple....................................................................20working directory, setting............................................27world-readable statement..........................................267
XXML See commit scripts; operation scriptsXSLT See commit scripts; operation scripts
Yyellow alarms See minor alarms
448 ■ Index
JUNOS Software Administration Guide