Embed Size (px)
Citation preview

https://crowe.wisc.edu
Forecasting the U.S. and Wisconsin Economies in 2019
Junjie Guo and Noah Williams
Center for Research on the Wisconsin Economy, UW-Madison
January 8, 2019
Abstract This paper provides forecasts for the United States and Wisconsin economies in 2019. We use a mixed-frequency vector auto-regression (MF-VAR) model that has been previously applied to forecast the national economy, which we extend to also consider the state of Wisconsin. Our median forecasts suggest that the growth rate of the national economy will slow substantially, with GDP growth down to about 1.4% in 2019, and the unemployment rate will rise to about 4.2% by the end of the year. For the Wisconsin economy, we forecast that real GDP will grow by about 2.4% in 2019, and the unemployment rate will also rise to about 4.2% by the end of the year. The rising unemployment rate, coupled with a shrinking civilian labor force which is forecast to decline by about 1%, implies that employment growth in Wisconsin may turn negative in 2019. There is a chance that the slowdown may be more dramatic for both economies: our forecasts give non-negligible weight to real GDP falling by as much 1% and the unemployment rate rising above 4.5%, and the chance that real GDP will decline in two consecutive quarters is over 20%. However, while there is heighted recession risk, for both economies, our median forecasts for 2019 instead suggest a growth slowdown, from the more rapid growth 2017-2018 to levels which have been more prevalent during the recovery.

Forecasting the U.S. and Wisconsin Economies in 2019
https://crowe.wisc.edu
1 Overview This paper provides forecasts for the United States and Wisconsin economies in 2019. We use a mixed-frequency vector auto-regression model with exogenous variables (MF-VARX). As with other VAR models used for forecasting, the MF-VARX model assumes that a variable in a given period depends on its lagged values as well as the current and lagged values of other variables. This dependence is estimated using historical data. Assuming the recent trends and relationships between economic variables at the national and state levels will continue, the estimated model is then used to forecast each variable forward. Changes in federal and state policy going forward thus only enter our forecasts to the extent that expectations of these changes are reflected in current variables. For example, expectations of future fiscal and monetary policies are priced into current financial indicators and investment decisions.
We use 18 variables for the national economy covering measures of overall economic activity like GDP and investment, as well as measures of specific sectors like the labor market, the financial market and the manufacturing sector. Our model for the Wisconsin economy includes 13 state-level variables with coverage similar to the national variables, which are also included and treated as exogenous to the state economy. We estimate the model for each economy using data available by January 4, 2019. With the estimated model, we forecast each variable forward to the end of 2019.
National Economy Our median forecasts suggest that the national economy will slow down substantially from its performance over the last couple of years: the growth rate of real GDP will drop to about 1.42%, the growth rate of investment may even drop below 1%, and the growth rate of personal consumption expenditures will drop by about 1 percentage point from 4.67% in 2018Q4 to 3.65% in 2019Q4. The growth rate of government expenditures will remain high at around 2%. All these values are close to what they were in early 2016.
As the economy slows down, inflation, measured by the growth rate of price indices of personal consumption expenditures, will drop slightly from 1.8% to about 1.4%, the unemployment rate will rise above 4% to about 4.2% by the end of 2019, and the manufacturing sector will shrink in terms of both output and employment. This slowdown will put a downward pressure on the interest rate. We forecast the effective federal funds rate will drop from its current value of 2.4% to about 1.84% by the end of 2019. This potential decrease in the federal funds rate is consistent with recent remarks by Federal Reserve Chairman Jerome Powell that a “Patient” Fed is watching for signs of economic weakness.0F
1 The treasury yield and stock market will also drop slightly.
There is a risk that the economic slowdown could be more dramatic, with the growth rate of real GDP dropping below zero and the unemployment rate rising above 4.5%. In particular, the model forecasts that the chance that the real GDP will drop in two consecutive quarters, a common definition of a recession, in 2019 is about 24%.
1 https://www.nytimes.com/2019/01/04/business/economy/jerome-powell-fed-reserve.html

Forecasting the U.S. and Wisconsin Economies in 2019
https://crowe.wisc.edu
Wisconsin Economy For the Wisconsin economy, we forecast that real GDP will grow by about 2.38% in 2019, personal income will increase by about 2.66% and tax collections will increase by about 2.35%. Like the national economy, the unemployment rate will start to rise and reach 4.2% by the end of the year. With the civilian labor force forecast to decline by about 1% in 2019, employment growth will slow down and likely turn negative. Output of the manufacturing sector will continue its recent trend since mid-2017 and grow by about 6% in 2019, but employment in the sector will shrink.
Like the national economy, there is also a risk that the Wisconsin economy will slow down more dramatically: real GDP may decline by 1%, the unemployment rate may rise above 4.5%, and there is a 28% chance that the state economy will enter a recession with real GDP will dropping in two consecutive quarters in 2019.
Overall, our forecasts suggest that the growth of both economies will slow down in 2019, and both labor markets will see an increase in unemployment and a decrease in job growth. However, for both economies, we find it much more likely that the growth will slow but remain positive instead of the economies entering a recession. While recession risk is higher that it was a year ago, our median forecasts for 2019 are within the range of values observed in the past few years. This suggests that, in the absence of significant shocks, both economies will continue on their recent trends with relatively little chance of substantial economic downturn.
2 Model and Data We use a mixed-frequency vector auto-regression model with exogenous variables (MF-VARX). A detailed description of the model can be found in Guo and Williams (2018), which uses the same model to forecast the U.S. and Wisconsin economies in 2018. Here we only describe the model briefly.
Traditional VAR models require all variables to be measured at the same frequency. For example, quarterly variables cannot be used directly in a model of monthly variables. To relax this restriction and utilize the information from variables of different frequencies for forecasting, Schorfheide and Song (2015) developed a mixed-frequency vector auto-regression (MF-VAR) model that treats a low frequency (e.g. quarterly) variable as evolving at the high frequency (e.g. monthly) but are only measured infrequently. Working with national variables only, Schorfheide and Song (2015) assume that all variables are endogenous and could affect each other. We use the same approach in our model for the national economy, but extend the original MF-VAR model to allow for exogenous variables at the national level in our model for the Wisconsin economy.
As other VAR models used for forecasting, the MF-VARX model assumes that a variable in a given period depends on its lagged values as well as the current and lagged values of other variables. This dependence is estimated using historical data. Assuming the recent trends and relationships between economic variables at the national and state levels will continue, the estimated model is then used to forecast each variable forward.

Forecasting the U.S. and Wisconsin Economies in 2019
https://crowe.wisc.edu
Changes in federal and state policy going forward only enter our forecasts to the extent that expectations of these changes are reflected in current variables. For example, expectations of future fiscal and monetary policies are priced into current financial indicators and investment decisions.
Table 1 lists the variables used in this paper. There are 18 variables for the national economy and 13 variables measuring the Wisconsin economy. For each economy, we use both measures of overall economic activities like GDP and investment and indicators for specific sectors like the labor market, the financial market and the manufacturing sector. Except for tax collections where the data is obtained from the U.S. Census Bureau, all other variables are retrieved from the FRED database maintained by the Research division of the Federal Reserve Bank of St. Louis. The variables are measured either monthly or quarterly.
We estimate the model for each economy using data available by January 4, 2019. By this date, most of the quarterly variables are available until the third quarter (Q3) of 2018, most of the monthly variables at the national level are available until December (M12), 2018, and most of the monthly variables at the state level are available until November (M11), 2018.
Table 1: Description of Variables
Variable (short name) End Series name in FRED U.S.
Real gross domestic product (gdp) Q3 GDPC1 Fixed private investment (fpi) Q3 FPI Real government expenditures (gce) Q3 GCEC1 Manufacturing real output index (outms) Q3 OUTMS Civilian unemployment rate (ur) M12 UNRATE Total nonfarm payroll employment (emp) M12 PAYEMS Manufacturing employment (manemp) M12 MANEMP Aggregate weekly hours index (hrs) M12 AWHI Average hourly earnings in private sector (wage) M12 AHETPI Average hourly earnings in manufacturing (manwage) M12 CES3000000008 Personal consumption expenditures (pce) M11 PCE PCE price index (pcepi) M11 PCEPI PCE price index excluding food and energy (pcepilfe) M11 PCEPILFE Industrial production index (indpro) M11 INDPRO Effective federal funds rate (fedfunds) M12 FEDFUNDS 10-year treasury bond yield (gs10) M12 GS10 Moody’s seasoned Baa corporate bond yield (baa) M12 BAA S&P 500 index (sp500) M12 SP500
Wisconsin
Real GDP (wigdp) Q2 WIRQGSP Manufacturing GDP (wimangdp) Q2 WIMANRQGSP Personal income (wipinc) Q3 WIOTOT All-transactions house price index (wihpi) Q3 WISTHPI Return on average assets for banks (wiroa) Q3 WIROA

Forecasting the U.S. and Wisconsin Economies in 2019
https://crowe.wisc.edu
Tax collections (witax) Q3 Census Bureau Unemployment rate (wiur) M11 WIUR Civilian labor force (wilf) M11 WILF Nonfarm employment (wiemp) M11 WINA Manufacturing employment (wimanemp) M11 WIMFG New private building permits (wipermits) M10 WIBPPRIVSA Initial unemployment insurance claims (wiiclaims) M12 WIICLAIMS Average hourly earnings: manufacturing (wimanwage) M11 SMU55000003000000008SA
Note. The second column (End) reports the last period (month: M or quarter: Q) when the data is available. Except for tax collections where the data is obtained from the U.S. Census Bureau, all other variables are retrieved from the FRED database maintained by the Research division of the Federal Reserve Bank of St. Louis. Before presenting our forecasts for 2019, we first evaluate the performance of our model by comparing the forecasts in Guo and Williams (2018), which applies the same model to data available by the end of 2017 to forecast the U.S. and Wisconsin economies in 2018, with actual data. Table 2 reports the results. For each variable, the Period column, which is the same as the End column in Table 1, reports the last period (quarter or month in 2018) when the variable is available in data, and the corresponding value is reported in the Data column. The Forecast column reports the (median) forecast in Guo and Williams (2018),1F
2 and the last column reports the percentage difference between the forecast and data.
Table 2: Evaluating the forecasts in 2018 Variable (short name) Period Data Forecast % Difference
U.S. Real gross domestic product (gdp) Q3 $18.66T $18.56T -0.54 Fixed private investment (fpi) Q3 $3.62T $3.42T -5.52 Real government expenditures (gce) Q3 $3.19T $3.11T -2.51 Manufacturing real output index (outms) Q3 108.24 109.59 1.25 Civilian unemployment rate (ur) M12 3.9% 3.6% -7.69 Total nonfarm payroll employment (emp) M12 150.26M 150.03M -0.15 Manufacturing employment (manemp) M12 12.84M 12.55M -2.26 Aggregate weekly hours index (hrs) M12 118.3 118.3 0.00 Average hourly earnings in private sector (wage) M12 $23.05 $22.98 -0.30 Average hourly earnings in manufacturing (manwage) M12 $21.8 $21.6 -0.92 Personal consumption expenditures (pce) M11 $14.24T $14.29T 0.35 PCE price index (pcepi) M11 108.87 109.08 0.19 PCE price index excluding food and energy (pcepilfe) M11 110.67 110.26 -0.37 Industrial production index (indpro) M11 109.39 107.69 -1.55 Effective federal funds rate (fedfunds) M12 2.27% 1.76% -22.47 10-year treasury bond yield (gs10) M12 2.83% 2.46% -13.07 Moody’s seasoned Baa corporate bond yield (baa) M12 5.13% 4.64% -9.55 S&P 500 index (sp500) M12 2567.31 2752.9 7.23 Average absolute % difference 4.22
2 Some of the values are renormalized to reflect the corresponding renormalization in data. For example, FRED adjusted the unit of GDP values from chained 2009 dollars to chained 2012 dollars in the middle of 2018. The Forecast column adjusts the actual forecast in Guo and Williams (2018), where the GDP values are indexed to 2009 dollars, to reflect this renormalization and make it comparable with the value reported in the Data column.

Forecasting the U.S. and Wisconsin Economies in 2019
https://crowe.wisc.edu
Wisconsin
Real GDP (wigdp) Q2 $298.67B $298.80B 0.04 Manufacturing GDP (wimangdp) Q2 $55.28B $51.56B -6.73 Personal income (wipinc) Q3 $295.44B $290.12B -1.80 All-transactions house price index (wihpi) Q3 361.88 364.49 0.72 Return on average assets for banks (wiroa) Q3 1.17 1.12 -4.27 Tax collections (witax) Q3 $4.77B $4.43B -7.13 Unemployment rate (wiur) M11 3.0% 2.4% -20.00 Civilian labor force (wilf) M11 3.16M 3.24M 2.53 Nonfarm employment (wiemp) M11 2.99M 3.02M 1.00 Manufacturing employment (wimanemp) M11 490.6K 496.6K 1.22 New private building permits (wipermits) M10 1.35K 1.47K 8.89 Initial unemployment insurance claims (wiiclaims) M12 4.86K 4.83K -0.62 Average hourly earnings: manufacturing (wimanwage) M11 $20.5 $20.0 -2.44 Average absolute % difference 4.42
The model did an excellent job in forecasting real GDP for both the U.S. and Wisconsin. However, it under-predicted the unemployment rate and the financial returns for both economies, forecasting that interest rates would rise by less than they did. On average, the forecasts were within 4.5% of the actual values.
3 Forecast for the U.S. Economy The section reports our forecasts for the U.S. economy in 2019. Overall, the model forecasts that the national economy will slow down: the growth rate of real GDP will drop below 2%, the growth rate of investment may even drop below 1%, and the growth rate of personal consumption expenditures will drop by about 1 percentage point from 4.67% in 2018Q4 to 3.65% in 2019Q4. The growth rate of government expenditures will remain high at around 2%. All these values are close to what they were in early 2016.
As the economy slows down, inflation, measured by the growth rate of price indices of personal consumption expenditures, will drop slightly from 1.8% to about 1.4%, the unemployment rate will rise above 4% to about 4.2% by the end of 2019, and the manufacturing sector will shrink in terms of both output and employment. This slowdown will put a downward pressure on the interest rate. We forecast the effective federal funds rate will drop from its current value of 2.4% to about 1.84% by the end of 2019. This potential decrease in the federal funds rate is consistent with recent remarks by Chairman Powell that a “Patient” Fed is watching for signs of economic weakness. The treasury yield and stock market will also drop slightly.
There is a risk that the economic slowdown could be more dramatic, with the growth rate of real GDP dropping below zero and the unemployment rate rising above 4.5%. In particular, the model forecasts that the chance that the real GDP will drop in two consecutive quarters in 2019 is about 24%.
The rest of this section discusses these forecasts in detail.
Forecasting the U.S. and Wisconsin Economies in 2019
https://crowe.wisc.edu
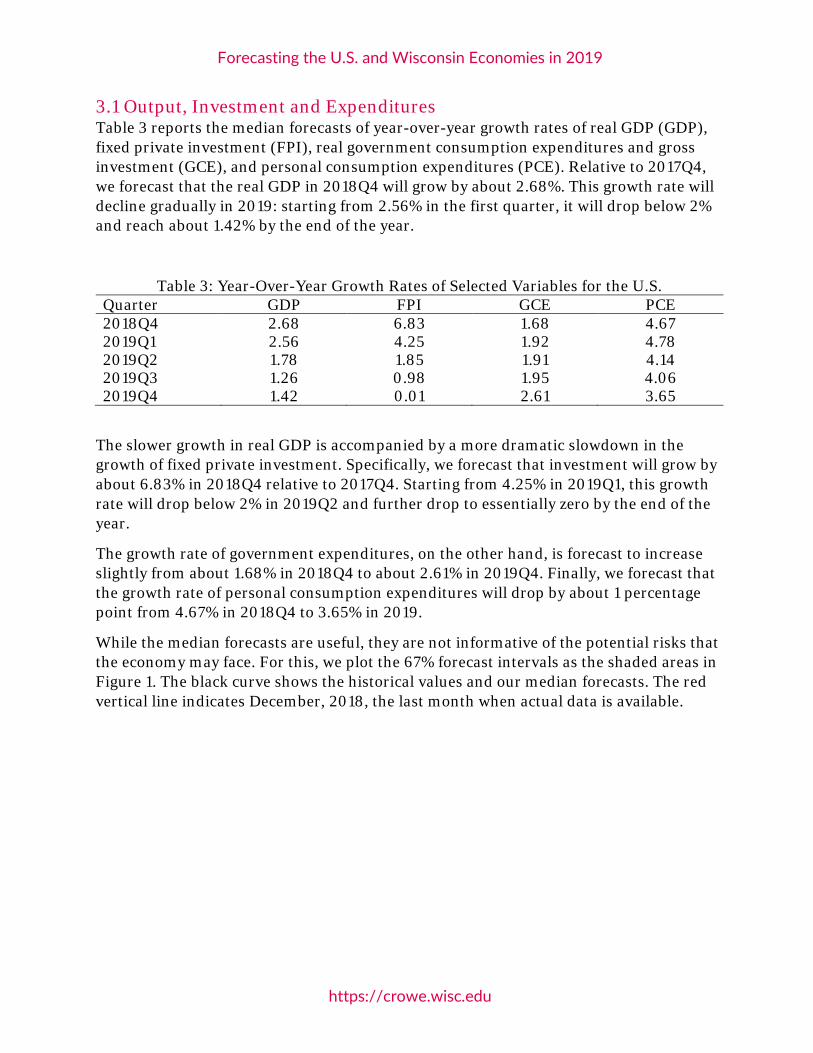
3.1 Output, Investment and Expenditures Table 3 reports the median forecasts of year-over-year growth rates of real GDP (GDP), fixed private investment (FPI), real government consumption expenditures and gross investment (GCE), and personal consumption expenditures (PCE). Relative to 2017Q4, we forecast that the real GDP in 2018Q4 will grow by about 2.68%. This growth rate will decline gradually in 2019: starting from 2.56% in the first quarter, it will drop below 2% and reach about 1.42% by the end of the year.
Table 3: Year-Over-Year Growth Rates of Selected Variables for the U.S. Quarter GDP FPI GCE PCE 2018Q4 2.68 6.83 1.68 4.67 2019Q1 2.56 4.25 1.92 4.78 2019Q2 1.78 1.85 1.91 4.14 2019Q3 1.26 0.98 1.95 4.06 2019Q4 1.42 0.01 2.61 3.65
The slower growth in real GDP is accompanied by a more dramatic slowdown in the growth of fixed private investment. Specifically, we forecast that investment will grow by about 6.83% in 2018Q4 relative to 2017Q4. Starting from 4.25% in 2019Q1, this growth rate will drop below 2% in 2019Q2 and further drop to essentially zero by the end of the year.
The growth rate of government expenditures, on the other hand, is forecast to increase slightly from about 1.68% in 2018Q4 to about 2.61% in 2019Q4. Finally, we forecast that the growth rate of personal consumption expenditures will drop by about 1 percentage point from 4.67% in 2018Q4 to 3.65% in 2019.
While the median forecasts are useful, they are not informative of the potential risks that the economy may face. For this, we plot the 67% forecast intervals as the shaded areas in Figure 1. The black curve shows the historical values and our median forecasts. The red vertical line indicates December, 2018, the last month when actual data is available.

Forecasting the U.S. and Wisconsin Economies in 2019
https://crowe.wisc.edu
Figure 1: Year-over-year growth rates of real GDP (gdp), fixed private investment (fpi), real government consumption expenditures and gross investment (gce) and personal consumption expenditures (pce) in the U.S. The red vertical line indicates December, 2018. The black curve reports the actual values when available and median forecasts otherwise. The yellow shaded area reports the 67% forecast intervals. The model suggests that the slowdown of the national economy could be more dramatic than implied by the median forecasts in Table 3: the growth rate of real GDP may drop below zero by the end of 2019, and the likelihood of a decline in investment is even larger. One common definition of a recession is that real GDP declines in two consecutive quarters. According to this definition, the model forecasts that the probability of a recession in 2019 is over 20%.
Figure 1 also shows that our median forecasts for 2018Q4 and 2019 are within the range of values observed in the past few years, and it seems the economy would return to what it was in early 2016 by the end of 2019. 3.2 Inflation Figure 2 reports our inflation forecasts. We use two measures of inflation: the year-over-year growth rate of the price index of overall personal consumption expenditures (pcepi) and the year-over-year growth rate of the price index of personal consumption expenditures excluding food and energy (pcepilfe). We forecast that both measures will decrease slightly from about 1.8% at the end of 2018 to about 1.4% by the end of 2019.

Forecasting the U.S. and Wisconsin Economies in 2019
https://crowe.wisc.edu
Figure 2: Year-over-year growth rates of price indices for personal consumption expenditures in the U.S: overall (pcepi) and excluding food and energy (pcepilfe). The red vertical line indicates December, 2018. The black curve reports the actual values when available and median forecasts otherwise. The yellow shaded area reports the 67% forecast intervals. 3.3 Labor Market Figure 3 reports our forecasts for the labor market. The first panel (ur) shows that, after the gradual decline since the Great Recession starting in 2007, the unemployment rate will start to rise in 2019. According to the median forecasts given by the black curve, the unemployment rate will rise above 4% to about 4.2% by the end of the year.
Figure 3: Labor market indicators in the U.S: the unemployment rate (ur), year-over-year growth of nonfarm employment in thousands (emp), and average hourly earnings of production and nonsupervisory employees in dollars (wage). The red vertical line indicates December, 2018. The black curve reports the actual values when available and median forecasts otherwise. The yellow shaded area reports the 67% forecast intervals.
With the rise in the unemployment rate, job growth is forecast to slow down. The second panel (emp), which reports the year-over-year change in the number of nonfarm employees, suggests the economy may only add 1 million more nonfarm jobs in 2019, which is only about half the size in the past few years.
Finally, the last panel (wage) shows that the average hourly earnings in the private sector will continue to increase, rising from $23.05 in 2018M12 to about $23.79 in 2019M12.

Forecasting the U.S. and Wisconsin Economies in 2019
https://crowe.wisc.edu
This represents a 3.2% increase, comparable with the recent experience since 2018M10 but slight larger than the increase before that which is typically around 2.5%.
The 67% forecast intervals shown by the yellow-shaded areas again suggest that the labor market may fare worse than implied by the median forecasts: the unemployment rate may rise above 4.5%, and the economy may add much fewer nonfarm jobs.
3.4 Financial Market Figure 4 plots our forecasts for the financial market. The model forecasts that the effective federal funds rate (fedfunds) will decline from its current level of 2.4% in 2018M12 to about 1.84% by 2019M12. Part of this is related to the downward pressure in economic growth mentioned above and, as mentioned above, consistent with recent remarks by Chairman Powell that a “Patient” Fed is watching for signs of economic weakness.
Figure 4: Financial market indicators in the U.S: effective federal funds rate (fedfunds), 10-year treasury constant maturity rate (gs10), Moody’s seasoned Baa corporate bond yield (baa), and S&P 500 index (sp500). The red vertical line indicates December, 2018. The black curve reports the actual values when available and median forecasts otherwise. The yellow shaded area reports the 67% forecast intervals. With the decrease in short-term rates, the treasury yield, shown in the second panel (gs10), will decline slightly from 2.83% in 2018M12 to about 2.66% in 2019M12, and the

Forecasting the U.S. and Wisconsin Economies in 2019
https://crowe.wisc.edu
stock market, as represented by the S&P 500 index in the last panel (sp500), will also drop slightly during the same period.
3.5 Manufacturing Sector Figure 5 plots our forecasts for the manufacturing sector. The first panel (outms) shows the year-over-year growth rate of manufacturing output. We forecast that manufacturing output will increase by 2.57% between 2017Q4 and 2018Q4. Like the overall economy measured by real GDP and investment, the growth rate of manufacturing output is forecast to decrease in 2019 and it may even turn negative. As the growth rate of manufacturing output is lower than that of real GDP, we forecast that the manufacturing sector will continue to shrink.
Figure 5: Indicators for the manufacturing sector in the U.S: year-over-year growth rate of real output (outms), year-over-year growth of employment in thousands (manemp), and average hourly earnings of production and nonsupervisory employees in dollars (manwage). The red vertical line indicates December, 2018. The black curve reports the actual values when available and median forecasts otherwise. The yellow shaded area reports the 67% forecast intervals.
The second panel (manemp) shows the year-over-year change in the size of manufacturing employment. The economy added about 284 thousand manufacturing jobs between 2017M12 and 2018M12, one of the last increase in the last few years. Consistent with our forecasts for the manufacturing output, we forecast that the growth in manufacturing employment will slow down and may even turn negative 2019.
The average hourly earnings of production and nonsupervisory employees in manufacturing (manwage) will rise slightly from $21.8 in 2018M12 to about $22.37 in 2019M12. This 2.6% wage increase is comparable with the corresponding increase in the past few.
Overall, the model forecasts that the manufacturing sector will shrink in 2019, and the wide forecast intervals suggest that this decline may be more dramatic than implied by the median forecasts.

Forecasting the U.S. and Wisconsin Economies in 2019
https://crowe.wisc.edu
4 Forecast for the Wisconsin Economy This section reports our forecasts for the Wisconsin economy in 2019. Overall, the model forecasts that the real GDP will grow by about 2.38% in 2019, personal income will increase by about 2.66% and tax collections will increase by about 2.35%. Like the national economy, the unemployment rate will start to rise and reach 4.2% by the end of the year. With the civilian labor force forecast to decline by about 1% in 2019, the employment growth will slow down and turn negative. Output of the manufacturing sector will continue its recent trend since mid-2017 and grow by about 6% in 2019, but the employment in the sector will shrink.
Like the national economy, there is also a risk that the Wisconsin economy will slow down more dramatically: the real GDP may decline by 1%, the unemployment rate may rise above 4.5%, and there is a 28% chance that the real GDP will decline in two consecutive quarters in 2019.
The rest of this section discusses the forecasts in detail.
4.1 Output, Income and Tax Table 4 and Figure 6 report our forecasts of the year-over-year growth rates of real GDP (wigdp), personal income (wipinc) and tax collections (witax) in Wisconsin.
Table 4: Year-Over-Year Growth Rates of Selected Variables for Wisconsin Quarter GDP Income Tax 2018Q4 3.75 3.48 3.06 2019Q1 3.32 2.77 7.15 2019Q2 3.15 3.16 3.43 2019Q3 2.30 2.65 4.64 2019Q4 2.38 2.66 2.35
Figure 6: Year-over-year growth rates of real GDP (wigdp), personal income (wipinc) and tax collections (witax) for Wisconsin. The red vertical line indicates December, 2018. The black curve reports the actual values when available and median forecasts otherwise. The yellow shaded area reports the 67% forecast intervals.
Relative to 2017Q4, we forecast that the real GDP in 2018Q4 will grow by 3.75%, the highest value observed in past few years. This growth rate will drop to 3.32% in 2019Q1

Forecasting the U.S. and Wisconsin Economies in 2019
https://crowe.wisc.edu
and it will drop below 2.5% in the second half of 2019. We also forecast that personal income in Wisconsin will increase by about 2.66% in 2018, while the growth rate of (seasonally adjusted) tax collections will fluctuate around 3%. Overall, our forecasts suggest that the Wisconsin economy will continue its growth at a slightly higher rate than observed in the past few years. However, there is a risk that the economy will slow down, and the real GDP may decline by about 1%. In particular, the probability that the real GDP will decline in two consecutive quarters in 2019 is about 28%. 4.2 Labor Market Figure 7 plots our forecasts for the Wisconsin labor market. The first panel (wiur) shows the unemployment rate. After staying at the historically low value of around 3% for a year, the unemployment rate is forecast to rise sharply in 2019 to about 4%. Accordingly, the (seasonally adjusted) number of initial unemployment insurance claims (wiiclaims) will increase from its current level of about 5,100 a month to about 5,700 a month.
Figure 7: Labor market indicators in Wisconsin: the unemployment rate (wiur), number of initial unemployment insurance claims (wiiclaims), year-over-year growth rate of the civilian labor force (wilf), and year-over-year change in nonfarm employment in thousands (wiemp). The red vertical line indicates December, 2018. The black curve reports the actual values when available and median forecasts otherwise. The yellow shaded area reports the 67% forecast intervals.

Forecasting the U.S. and Wisconsin Economies in 2019
https://crowe.wisc.edu
The third panel (wilf) shows that the civilian labor force will continue its recent decline into 2019 and the state may lose 1% of its labor force. Both the rising unemployment rate and the shrinking labor force imply the employment will decline. As shown in the last panel (wiemp), after adding about 20,000 nonfarm jobs in each of the past few years, Wisconsin is forecast to lose about 50,000 nonfarm jobs in 2019. The 67% forecast intervals represented by the shaded areas suggest that the risks faced by the Wisconsin labor market may be much more severe than implied by the median forecasts. In particular, the unemployment may reach 5% and the economy may lose over 60,000 nonfarm jobs. 4.3 Housing Market Figure 8 reports our forecasts for the Wisconsin housing market. We forecast that the number of new private housing units authorized by building permits (wipermits) will decline from its current value of around 1,400 to about 1,200, and the all-transactions housing price index (wihpi) will rise by about 3-6%.
Figure 8: Housing market indicators in Wisconsin: number of new private housing units authorized by building permits (wipermits) and year-over-year growth rate of house price index (wihpi). The red vertical line indicates December, 2018. The black curve reports the actual values when available and median forecasts otherwise. The yellow shaded area reports the 67% forecast intervals. 4.4 Manufacturing Sector Figure 9 reports our forecasts for the Wisconsin manufacturing sector. The growth rate of output, reported in the first panel (wimangdp), is forecast to be around 6%, higher than the values observed in the past few years but consistent with the recent trend starting from mid-2017. The employment in this sector, however, is forecast to shrink as it did in 2016. The average hourly earnings of production employees (wimanwage) is forecast to increase from $20.5 in 2018M11 to about $21.21 in 2019M12. This implies an annualized growth rate of 2.82% which is comparable with and slightly larger than recent values.

Forecasting the U.S. and Wisconsin Economies in 2019
https://crowe.wisc.edu
Figure 9: Indicators of the manufacturing sector in Wisconsin: year-over-year growth rate of real output (wimangdp), year-over-year growth of employment in thousands (wimanemp), and average hourly earnings of production employees in dollars (wimanwage). The red vertical line indicates December, 2018. The black curve reports the actual values when available and median forecasts otherwise. The yellow shaded area reports the 67% forecast intervals.
5 Conclusion Overall, our forecasts suggest that the growth of both economies will slow down in 2019, and both labor markets will see an increase in unemployment and a decrease in job growth. However, for both economies, our median forecasts for 2019 are within the range of values observed in the past few years, suggesting that, in the absence of significant shocks, both economies will continue on their trends with little chance of substantial economic downturn. While there is heighted recession risk, for both the U.S. and Wisconsin economies, our median forecasts for 2019 instead suggest a growth slowdown, from the more rapid growth 2017-2018 to levels which have been more prevalent during the recovery.
References Guo, J. and Williams, N. (2018). Forecasting the US and Wisconsin Economies in 2018. Research Report, Center for Research on the Wisconsin Economy, University of Wisconsin-Madison.
Schorfheide, F. and Song, D. (2015). Real-Time Forecasting with a Mixed-Frequency VAR. Journal of Business and Economic Statistics, vol. 33(3), pages 366-380.