Embed Size (px)
Citation preview
ELECTIONS
Issues Related to Registering Voters and Administering Elections
Report to Congressional Requesters
June 2016
GAO-16-630
United States Government Accountability Office
United States Government Accountability Office
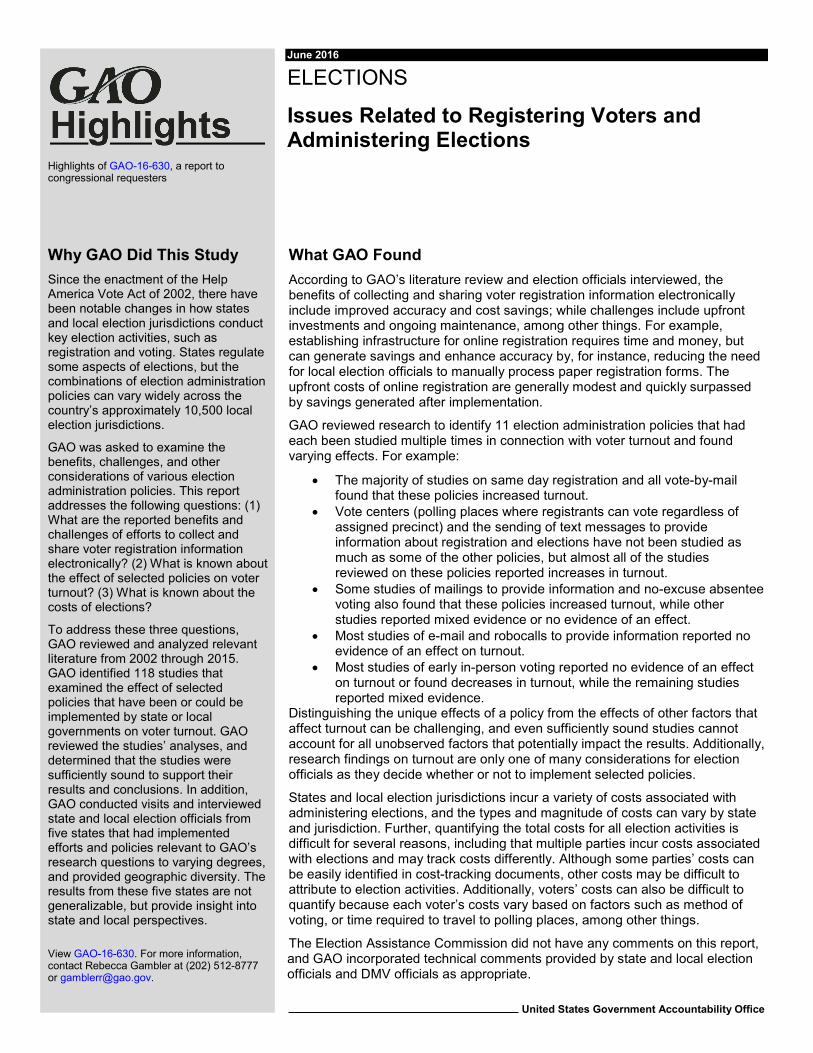
Highlights of GAO-16-630, a report to congressional requesters
June 2016
ELECTIONS
Issues Related to Registering Voters and Administering Elections
What GAO Found According to GAO’s literature review and election officials interviewed, the benefits of collecting and sharing voter registration information electronically include improved accuracy and cost savings; while challenges include upfront investments and ongoing maintenance, among other things. For example, establishing infrastructure for online registration requires time and money, but can generate savings and enhance accuracy by, for instance, reducing the need for local election officials to manually process paper registration forms. The upfront costs of online registration are generally modest and quickly surpassed by savings generated after implementation.
GAO reviewed research to identify 11 election administration policies that had each been studied multiple times in connection with voter turnout and found varying effects. For example:
• The majority of studies on same day registration and all vote-by-mail found that these policies increased turnout.
• Vote centers (polling places where registrants can vote regardless of assigned precinct) and the sending of text messages to provide information about registration and elections have not been studied as much as some of the other policies, but almost all of the studies reviewed on these policies reported increases in turnout.
• Some studies of mailings to provide information and no-excuse absentee voting also found that these policies increased turnout, while other studies reported mixed evidence or no evidence of an effect.
• Most studies of e-mail and robocalls to provide information reported no evidence of an effect on turnout.
• Most studies of early in-person voting reported no evidence of an effect on turnout or found decreases in turnout, while the remaining studies reported mixed evidence.
Distinguishing the unique effects of a policy from the effects of other factors that affect turnout can be challenging, and even sufficiently sound studies cannot account for all unobserved factors that potentially impact the results. Additionally, research findings on turnout are only one of many considerations for election officials as they decide whether or not to implement selected policies.
States and local election jurisdictions incur a variety of costs associated with administering elections, and the types and magnitude of costs can vary by state and jurisdiction. Further, quantifying the total costs for all election activities is difficult for several reasons, including that multiple parties incur costs associated with elections and may track costs differently. Although some parties’ costs can be easily identified in cost-tracking documents, other costs may be difficult to attribute to election activities. Additionally, voters’ costs can also be difficult to quantify because each voter’s costs vary based on factors such as method of voting, or time required to travel to polling places, among other things.
The Election Assistance Commission did not have any comments on this report, and GAO incorporated technical comments provided by state and local election officials and DMV officials as appropriate.
View GAO-16-630. For more information, contact Rebecca Gambler at (202) 512-8777 or [email protected].
Why GAO Did This Study Since the enactment of the Help America Vote Act of 2002, there have been notable changes in how states and local election jurisdictions conduct key election activities, such as registration and voting. States regulate some aspects of elections, but the combinations of election administration policies can vary widely across the country’s approximately 10,500 local election jurisdictions.
GAO was asked to examine the benefits, challenges, and other considerations of various election administration policies. This report addresses the following questions: (1) What are the reported benefits and challenges of efforts to collect and share voter registration information electronically? (2) What is known about the effect of selected policies on voter turnout? (3) What is known about the costs of elections?
To address these three questions, GAO reviewed and analyzed relevant literature from 2002 through 2015. GAO identified 118 studies that examined the effect of selected policies that have been or could be implemented by state or local governments on voter turnout. GAO reviewed the studies’ analyses, and determined that the studies were sufficiently sound to support their results and conclusions. In addition, GAO conducted visits and interviewed state and local election officials from five states that had implemented efforts and policies relevant to GAO’s research questions to varying degrees, and provided geographic diversity. The results from these five states are not generalizable, but provide insight into state and local perspectives.

Page i GAO-16-630 Registering Voters and Administering Elections
Letter 1
Background 6 Electronically Collecting and Sharing Voter Registration
Information Involves Investments but Can Provide Efficiencies 12 Our Review of Relevant Research Finds that Effects of Selected
Policies and Practices on Voter Turnout Vary 31 Election Activities Result in Various Costs, and These Costs Can
Be Difficult to Quantify 36 Agency and Third Party Comments 48
Appendix I States’ Use of Provisional Ballots, 2008 – 2014 51
Appendix II Objectives, Scope, and Methodology 54
Appendix III Voter Turnout for Selected Demographic Characteristics 65
Appendix IV Review of Research on Effects of Eleven Selected Election Administration Policies on Voter Turnout 69
Appendix V Bibliography 110
Appendix VI GAO Contact and Staff Acknowledgments 121
Tables
Table 1: Department of Motor Vehicles (DMV) Data-Sharing Efforts in States GAO Visited 19
Table 2: Use of Provisional Ballots in the States and District of Columbia, 2008 – 2014 General Elections 52
Contents

Page ii GAO-16-630 Registering Voters and Administering Elections
Figures
Figure 1: Timeline Showing the Years States and the District of Columbia Implemented Online Voter Registration 9
Figure 2: National Voter Turnout Rates for General Elections, 1972-2014 12
Figure 3: Findings of Studies Examining Effects of Eleven Selected Policies on Voter Turnout 35
Figure 4: Voter Turnout 1972 – 2014, by Age 66 Figure 5: Voter Turnout 2004 – 2014, by Race and Ethnicity 67 Figure 6: Voter Turnout 1972 – 2014, by Educational Attainment 68 Figure 7: Symbols Used to Represent Studies’ Findings Related to
Voter Turnout 70 Figure 8: Studies’ Reported Findings Regarding the Effects of E-
mail on Voter Turnout 71 Figure 9: Studies’ Reported Findings Regarding the Effects of
Mailings on Voter Turnout 74 Figure 10: Studies’ Reported Findings Regarding the Effects of
Robocalls on Voter Turnout 79 Figure 11: Studies’ Reported Findings Regarding the Effects of
Text Messages on Voter Turnout 82 Figure 12: Studies’ Reported Findings Regarding the Effects of
Changes to Registration Closing Dates on Voter Turnout 86 Figure 13: Studies’ Reported Findings Regarding the Effects of
Same Day Registration on Voter Turnout 88 Figure 14: Studies’ Reported Findings Regarding the Effects of All
Vote-by-Mail on Voter Turnout 93 Figure 15: Studies’ Reported Findings Regarding the Effects of
Early In-Person Voting on Voter Turnout 97 Figure 16: Studies’ Reported Findings Regarding the Effects of
Hours Available for Voting on Voter Turnout 100 Figure 17: Studies’ Reported Findings Regarding the Effects of
No-excuse Absentee Voting on Voter Turnout 103 Figure 18: Studies’ Reported Findings Regarding the Effects of
Vote Centers on Voter Turnout 111
Page iii GAO-16-630 Registering Voters and Administering Elections
Abbreviations CPS Current Population Survey DMV Department of Motor Vehicles EAC Election Assistance Commission EAVS Election Administration and Voting Survey ERIC Electronic Registration Information Center HAVA Help America Vote Act NCOA National Change of Address NVRA National Voter Registration Act
This is a work of the U.S. government and is not subject to copyright protection in the United States. The published product may be reproduced and distributed in its entirety without further permission from GAO. However, because this work may contain copyrighted images or other material, permission from the copyright holder may be necessary if you wish to reproduce this material separately.

Page 1 GAO-16-630 Registering Voters and Administering Elections
441 G St. N.W. Washington, DC 20548
June 30, 2016
Congressional Requesters
The Help America Vote Act (HAVA) of 2002 includes a number of provisions related to voter registration, voting equipment, and other election administration activities.1 The act authorized the appropriation of funds to be used toward implementing the law’s requirements.2 Among other things, HAVA required states to create statewide computerized voter registration lists to serve as official rosters of legally registered voters for elections for federal office. It also provided funding to improve election administration, including funding to replace punch card and lever voting equipment. Since the enactment of HAVA, states and local elections jurisdictions have made other changes to registration and voting. For example, by 2008, Arizona and Washington had begun offering voters the option to complete an online application to register to vote, and since that time 29 additional states and Washington, D.C., have implemented similar online registration options. Additionally, since HAVA’s enactment, Washington and Colorado have joined Oregon in implementing statewide vote-by-mail systems.3 Decisions regarding these
1Pub. L. No. 107-252, 116 Stat. 1666 (2002) (codified as amended at 52 U.S.C. §§ 20901-21145). Congress passed HAVA in response to reports of problems encountered in the 2000 presidential election with respect to voter registration lists, absentee ballots, ballot counting, and antiquated voting systems. In the years following HAVA’s enactment, states implemented major election reforms, amending their election codes or making other changes to their election procedures in order to comply with HAVA’s provisions. For example, HAVA required states to collect certain identifying information from first-time voters who register by mail, and states have amended their processes to reflect these requirements. 52 U.S.C. § 21083. Numerous states have enacted additional laws since that time that address how an individual may register to vote or cast a ballot. In particular, many states have made substantive changes to their election codes or procedures in the areas of voter identification; alternative methods of voting, such as in-person early voting prior to Election Day; and requirements for voter registration drives conducted by nongovernmental organizations (i.e., third parties). 2See 52 U.S.C. §§ 20901-20904, 21001-21008. 3Oregon provided for all elections to be conducted by mail prior to HAVA’s enactment. In Washington, county auditors were provided discretion in 2005 to conduct all elections entirely by mail ballot and, in 2011, Washington shifted to become a vote-by-mail state. In 2013, Colorado enacted a law that required all elections on or after July 1, 2013, to be conducted by mail. Colorado also provides an in person voting option at voter service and polling centers.
Letter
Page 2 GAO-16-630 Registering Voters and Administering Elections
and other election administration policies—including policies for providing information to voters, registering voters, and providing voting opportunities—involve consideration of various benefits and challenges, including costs to states and local jurisdictions, as well as costs to voters.
States regulate various aspects of elections, including, for example, registration procedures, absentee voting requirements, and establishment of polling places. States are required under the National Voter Registration Act (NVRA) of 1993 to provide certain registration opportunities, such as when individuals obtain a driver’s license.4 However, states can determine whether to provide additional opportunities, such as registering online. States also establish policies for how voters can cast their ballots—including opportunities to vote in person on Election Day, in person in advance of Election Day (early voting), by mail under certain circumstances (absentee voting), by mail under any circumstances (no-excuse absentee or all vote-by-mail)—and states can choose to implement a combination of such policies. Although some election policy decisions are made at the state level, election administration within each state is largely a local responsibility. Thus local factors can also affect election administration—such as the designation of specific polling places. The combinations of election administration policies can vary widely across the country’s approximately 10,500 local election jurisdictions. When considering whether to implement changes to election policies, state and local election officials may consider implementation costs, the availability of funds or other resources at the state or local level, administrative efficiencies, additional voter convenience, and anticipated effects on voter turnout, among other factors.
You asked us to examine the benefits, challenges, and other considerations of various election administration policies. This report addresses the following questions:
4Pub. L. No. 103-31, 107 Stat. 77 (1993) (codified at 52 U.S.C. §§ 20501-20511). Certain states are exempt from NVRA, including North Dakota—which has no voter registration requirement—and Idaho, Minnesota, New Hampshire, Wisconsin, and Wyoming—which have Election Day registration. NVRA does not apply to states where either (1) under law that has been in effect continuously on and after August 1, 1994, there is no voter registration requirement for any voter in the state for a federal election or (2) under law that has been in effect continuously on and after, or enacted prior to, August 1, 1994, all voters in the state may register to vote at the polling place at the time of voting in a general election for federal office.

Page 3 GAO-16-630 Registering Voters and Administering Elections
1. What are the reported benefits and challenges of efforts to collect and share voter registration information electronically?
2. What is known about the effect of selected policies and practices on voter turnout?
3. What is known about the costs of elections?
In addition, we reviewed information related to the use of provisional ballots.5 This information can be found in appendix I.
To address these questions, we reviewed and analyzed relevant literature from scholarly and peer reviewed publications; government reports; dissertations; conference papers; books; association, think tank, and other nonprofit organizations’ publications; working papers; and general news articles published from 2002 through 2015 to identify publications that were potentially relevant to the topics in question.6 The literature search produced over 1,000 publications related to the topics in our three questions. For publications relevant to efforts to collect and share voter registration information electronically, we cataloged information regarding benefits or challenges associated with these efforts. Among the over 400 publications from our search related to voter turnout, we limited our scope to those publications that examined policies or practices that have been or could be implemented by a state or local government.7 Within this framework, we further limited the scope to publications that (1) contained quantitative analysis of the effect of a given policy or practice on turnout
5Section 302 of HAVA established provisional voting requirements. Specifically, potential voters who declare that they are registered and eligible to vote in the jurisdiction in which they desire to vote to cast provisional ballots must be permitted to cast a provisional ballot in the event their names do not appear on the registration list or the voters’ eligibility is challenged by an election official. 52 U.S.C. § 21082(a). 6We selected 2002 because the enactment of the Help America Vote Act in 2002 had implications for voter registration efforts and other policies that may affect voter turnout. However, we limited our searches for information on election-related costs to a 10-year period (from 2005 through 2015) to ensure the search results we obtained were manageable. 7Factors that influence voter turnout have been widely studied. Therefore, in order to provide a reasonable and useful synthesis of the literature, we further limited our scope by excluding publications that examined partisan practices—such as using partisan language in mailings to potential voters—and policies or practices that would be resource-intensive, such as door-to-door canvassing. Appendix II provides more information about our scope and methodology, including a more detailed listing of the types of policies that were outside the scope of our review.

Page 4 GAO-16-630 Registering Voters and Administering Elections
and (2) used sufficiently sound methodologies for conducting such analyses. Specifically, two GAO social scientists, and a GAO statistician when necessary, reviewed the studies within the publications produced from our searches to determine those for which the design, implementation, and analyses of the studies were sufficiently sound to support their results and conclusions and were based on generally accepted social science principles. Our report presents the findings for any policy we found to have been studied at least twice within this resulting set of publications. As a result of this process, we included in our review the results of 118 studies found within 53 publications. For publications relevant to election-related costs, we identified examples of the types of costs and corresponding amounts, where available.
Additionally, to address all three questions, we visited and conducted interviews with state and local jurisdiction election officials from five selected states (Colorado, Delaware, Illinois, Oregon, and Rhode Island) to obtain the perspectives of state and local election administrators regarding the policies, practices, and efforts in use in their respective states and jurisdictions that corresponded with the scope of our review. We selected these states primarily based on the statewide implementation of the registration and turnout policies in the scope of our review, prioritizing states that had more policies in place than others. Specifically, we considered states that had implemented online voter registration, data-sharing efforts between the state election office and the state motor vehicle agency or through interstate data-sharing efforts, Election Day or same day registration, vote-by-mail as their selected voting method, and requirements for informational mailings to voters. Finally, we considered geographic diversity, when possible, in making state selection decisions in order to capture possible regional differences in election administration practices.
Within each of the five states identified above, we selected two local election jurisdictions to visit in order to obtain different perspectives at the local level within a state. We selected jurisdictions based on recommendations from state election officials and varying degrees of population size and density. While the perspectives of officials from our selected states and local jurisdictions cannot be generalized to other states and local election jurisdictions, officials in these locations provided a range of perspectives on the topics within the scope of our review. During each visit we met with the state election director (or equivalent)

Page 5 GAO-16-630 Registering Voters and Administering Elections
and election officials from two local jurisdictions.8 We also met with officials from state motor vehicle agencies to get their perspectives on voter registration data-sharing programs with the state election office. We corroborated the information we gathered through these interviews by reviewing relevant state statutes and documentation that these jurisdictions provided to us, such as cost data. For examples of election costs provided in this report based on literature we reviewed or documents provided to us by state and local election officials, a GAO economist reviewed the source material to assess data reliability. To the extent that the source documentation included information about how cost estimates were derived, the economist reviewed the methodology to ensure reliability, but we did not independently assess the internal controls associated with state or local financial systems or other means for calculating such costs. We determined that these data were sufficiently reliable for providing illustrative examples of the costs for election activities.
For the question regarding voter registration efforts, we also analyzed data from the U.S. Census Bureau’s Current Population Survey (CPS) Voting and Registration Supplement for general elections occurring from 2008 through 2014 to determine the extent to which policies to collect and share voter information electronically may improve the quality of voter registration lists. We reviewed documentation describing steps taken by the CPS data managers to ensure data reliability and tested the data for anomalies that could indicate reliability concerns. We determined that the CPS data were sufficiently reliable for the purposes of this analysis. More information on our objectives, scope, and methodology can be found in appendix II.
We conducted this performance audit from April 2015 to June 2016 in accordance with generally accepted government auditing standards. Those standards require that we plan and perform the audit to obtain sufficient, appropriate evidence to provide a reasonable basis for our findings and conclusions based on our audit objectives. We believe that
8In Delaware, the state’s Department of Elections oversees and conducts elections throughout the state. The Department of Elections has offices in each of Delaware’s three counties, and the state Election Commissioner noted that we could meet with officials based in each of the three county offices when these officials were present at the main state election office for a meeting that coincided with the date of our visit. Therefore, we spoke with election officials from all three counties.

Page 6 GAO-16-630 Registering Voters and Administering Elections
the evidence obtained provides a reasonable basis for our findings and conclusions based on our audit objectives.
In the United States, authority to regulate elections is shared by federal, state, and local officials. Congressional authority to regulate elections derives from various constitutional sources, depending upon the type of election, and Congress has passed legislation in major functional areas of the voting process, such as voter registration, as well as prohibitions against discriminatory voting practices. However, the responsibility for the administration of state and federal elections resides at the state level, and states regulate various aspects of elections including, for example, registration procedures, absentee and early voting requirements, and Election Day procedures. Within each state, responsibility for managing, planning, and conducting elections is largely a local process, residing with about 10,500 local election jurisdictions nationwide. Some states have mandated statewide election administration guidelines and procedures that foster uniformity in the way their local jurisdictions conduct elections, whereas other states have guidelines that generally permit local election jurisdictions considerable autonomy and discretion in the way they run elections. Along with the various ways that states and local election jurisdictions may share election policy responsibilities, there are a variety of cost-sharing arrangements between state and local election offices. The result is that elections can be administered differently across states and local jurisdictions.
The offices that administer elections in states and local jurisdictions can be organized in different ways, and in some cases offices with primary responsibility for elections (referred throughout this report as election offices) may have responsibility for other areas of government as well. For example, in Rhode Island, the Secretary of State’s office oversees the Elections Division as well as other divisions and offices responsible for public records, business services, the state library, and the state archives. In contrast, in Delaware, the State Election Commissioner has a more singular focus of overseeing the Department of Elections. Similarly, local election offices may include a Board of Elections or Board of Canvassers that are specifically responsible for elections, or a county clerk’s office that may also have responsibility for public records, licenses, or other activities.
Background
Election Administration Roles and Responsibilities

Page 7 GAO-16-630 Registering Voters and Administering Elections
As election officials manage voter registration processes and voter lists, they must balance two important goals. First, officials seek to minimize the burden on eligible people registering to vote. Additionally, they seek to ensure that the voter lists are accurate, a task that involves including the name of each eligible voter on the voter list, removing names of ineligible voters, and having safeguards in place so that names of voters are not removed in error from the list.
States have established a variety of mechanisms for registering voters and confirming the identity and registration of those who seek to vote, whether at the polls on Election Day or by absentee ballot.9 Two key pieces of federal legislation require states to take certain measures addressing voter registration—NVRA and HAVA. In addition to any other method of voter registration provided for under state law, NVRA prescribes three methods of registering voters for federal elections: (1) when they obtain a driver’s license, (2) by mail using the federal voter registration form prescribed by the Election Assistance Commission (EAC), or (3) in person at offices that provide public assistance and services to persons with disabilities and other state agencies and offices.10
Certain states are exempt from NVRA—specifically those states that allowed Election Day registration at polling places at the time that NVRA was enacted and North Dakota, which does not require registration to vote.11 This means that in those exempted states voters can register to vote and vote on Election Day pursuant to state requirements and the states are not required to provide the NVRA registration methods noted above. Lastly, NVRA also establishes requirements to ensure that state programs that identify and remove from voter registration rolls the names of individuals who are no longer eligible to vote are uniform,
9For more information about state laws regarding registration, see GAO, Elections: State Laws Addressing Voter Registration and Voting on or before Election Day, GAO-13-90R (Oct. 4, 2012). 1052 U.S.C. §§ 20503-20506. 1152 U.S.C. § 20503(b).
Voter Registration

Page 8 GAO-16-630 Registering Voters and Administering Elections
nondiscriminatory, and do not exclude a voter from the rolls solely because of his or her failure to vote.12
HAVA required states to each establish a single, uniform, statewide, computerized voter registration list for conducting elections for federal office.13 To assist with those and other elections efforts addressed in HAVA, Congress authorized more than $3 billion in funding to be distributed to the states to fund compliance with HAVA requirements, and to generally improve the administration of elections for federal office.14 According to researchers, HAVA, and the funding Congress provided to implement HAVA, played a major role in removing barriers associated with paperless registration.15
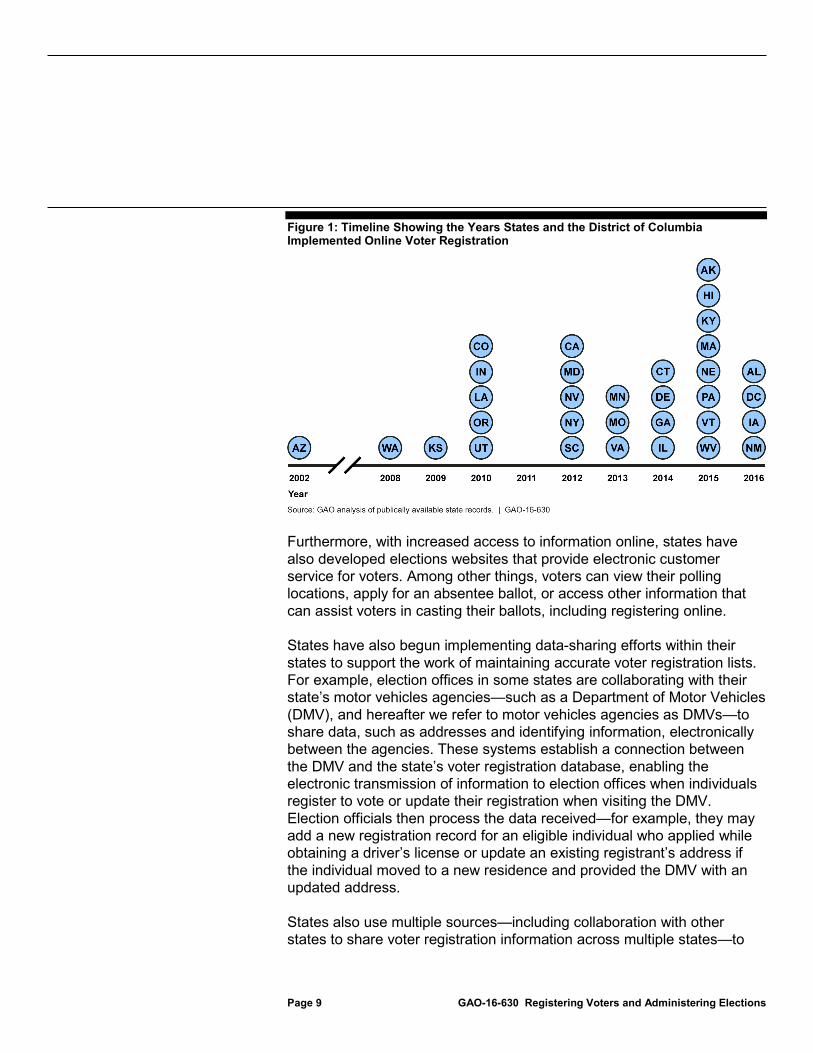
Increasingly, voters in many states can register or update their registration information online, in addition to other available registration options required by NVRA or established by the states.16 As shown in figure 1, Arizona was the first state in the nation to implement online voter registration, in 2002, the same year as the passage of HAVA. As of May 2016, 31 states and Washington, D.C., offer online voter registration. In some of these states, the online registration option is only available to citizens who have a driver’s license or state-issued identification (ID) card. In these states, individuals who do not have either of these forms of ID may fill out the registration form online, print, sign, and mail it to the election office.
12See 52 U.S.C. § 20507(a)(3), (4), and (c). The NVRA states that the name of a registrant may not be removed from the official list of eligible voters except at the request of the registrant, as provided by state law, by reason of criminal conviction or mental incapacity, or under a general program to remove ineligible voters by reason of the death of the registrant, or a change in the residence of the registrant. 1352 U.S.C. § 21083. 14See Pub. L. No. 107-252, 116 Stat. 1666 (2002) (codified at 52 U.S.C. §§ 20901-21145). 15Naifeh, Stuart, Driving the Vote: Are States Complying with the Motor Vote Requirements of the National Voter Registration Act? (New York, NY: Demos, 2015) and Ponoroff, Christopher, Voter Registration in a Digital Age, ed. Wendy Weiser (New York, NY: The Brennan Center for Justice at New York University School of Law, 2010). 16The steps to authorize online registration vary for each state. Of the states that have online registration, while the majority of them have authorized it through legislation enabling online registration, some states have made online voter registration available without enabling legislation.
Page 9 GAO-16-630 Registering Voters and Administering Elections
Figure 1: Timeline Showing the Years States and the District of Columbia Implemented Online Voter Registration
Furthermore, with increased access to information online, states have also developed elections websites that provide electronic customer service for voters. Among other things, voters can view their polling locations, apply for an absentee ballot, or access other information that can assist voters in casting their ballots, including registering online.
States have also begun implementing data-sharing efforts within their states to support the work of maintaining accurate voter registration lists. For example, election offices in some states are collaborating with their state’s motor vehicles agencies—such as a Department of Motor Vehicles (DMV), and hereafter we refer to motor vehicles agencies as DMVs—to share data, such as addresses and identifying information, electronically between the agencies. These systems establish a connection between the DMV and the state’s voter registration database, enabling the electronic transmission of information to election offices when individuals register to vote or update their registration when visiting the DMV. Election officials then process the data received—for example, they may add a new registration record for an eligible individual who applied while obtaining a driver’s license or update an existing registrant’s address if the individual moved to a new residence and provided the DMV with an updated address.
States also use multiple sources—including collaboration with other states to share voter registration information across multiple states—to

Page 10 GAO-16-630 Registering Voters and Administering Elections
maintain accurate registration lists given that individuals may move across state lines without cancelling their registrations at their previous addresses. For example, the Electronic Registration Information Center (ERIC), founded in 2012 as a project between the states and The Pew Charitable Trusts, was organized to address the challenge of incomplete and inaccurate voter registration lists. Since shortly after ERIC’s founding, state election officials have overseen and managed the program to organize the collection, analysis, and distribution of data among member states. The organization uses automated data-matching software to produce reports for member states, with the goal of helping state and local officials maintain accurate registration lists.
Researchers calculate turnout using different methods, based on available data and the purpose of their research. Specifically, turnout is expressed as a percentage, but the numerator and denominator used may differ. For instance, the numerator may represent the number of votes for the highest office on the ballot or total ballots cast (regardless of whether or not individuals voted for the highest office). Similarly, the denominator may represent the voting-age population (everyone 18 years of age and older), the voting-eligible population (the voting-age population adjusted for segments of the population that are not eligible to vote, such as non-citizens), or registered voters. Additionally, data may come from official voter records or from surveys—which rely on self-reported information—and political scientists have found that surveys produce higher estimates of turnout than official records maintained by election administrators. Possible explanations for this discrepancy between survey responses and actual records include memory limitations and respondents indicating they had voted when they had not, because of positive social attitudes toward voting among some groups of respondents.17 However, weaknesses in how voter records are maintained can also cause error and can lead to an underestimation of
17Ansolabehere, Stephen, and Eitan Hersh, “Validation: What Big Data Reveal about Survey Misreporting and the Real Electorate,” Political Analysis 20 (2012).
Voter Turnout

Page 11 GAO-16-630 Registering Voters and Administering Elections
turnout when calculated as a proportion of registered eligible voters.18 Measurements of voter turnout can vary based on the calculation and data used.
According to CPS data for the voting-age population, national turnout rates in presidential and midterm elections have declined slightly over the past three-and-a-half decades (see fig. 2). Although states and local election jurisdictions have implemented policies that seek to make voting more convenient, and thus less costly to voters, broad academic research on voter turnout has concluded that individual differences among citizens—such as age and political interest—and the competitiveness of elections are more strongly and consistently associated with the decision to vote than interventions that seek to increase convenience.19 Demographic differences may be strongly and consistently associated with differences in turnout rates, and to illustrate this, we have included figures in appendix III that show differences in turnout over time related to age, race and ethnicity, and educational attainment.
18In particular, official lists of registered voters do not necessarily identify those who are on the list of registered voters but ineligible to vote in any one election. A person may have been eligible to vote several years ago, and therefore was placed on the registration rolls, but subsequently moved out of the jurisdiction or state, died, or committed a crime that makes him or her ineligible to vote. Registration and voter history records may not reflect this change in eligibility, depending on the extent to which records are updated. See also Stephen Ansolabehere and Eitan Hersh, “The Quality of State Voter Registration Records: A State-by-State Analysis.” Working paper, Cal-Tech/MIT Voting Technology Project and the Institute for Quantitative Social Science, Harvard University, July 14, 2010. 19Our review of the research literature—as presented later in this report—focuses on factors (policies and practices) that state and local governments have control over—such as policies associated with when, where, and how voters may cast their ballots (e.g., early or on Election Day, by mail or in-person, etc.), among others.

Page 12 GAO-16-630 Registering Voters and Administering Elections
Figure 2: National Voter Turnout Rates for General Elections, 1972-2014
Note: This figure represents turnout among the voting-age population. We use voting-age population because this calculation is consistently available for national voter turnout as well as turnout among various demographic groups depicted in figures in appendix III.
States have implemented efforts to collect and share voter registration information electronically—specifically through (1) online registration, (2) sharing voter registration information between DMVs and election offices, and (3) sharing registration data among multiple states. According to literature on these efforts and election officials we spoke with, these efforts involve initial investments and implementation challenges, but they can provide efficiencies, such as improved accuracy of voter registration records, cost savings, and improved voter experience.
Electronically Collecting and Sharing Voter Registration Information Involves Investments but Can Provide Efficiencies

Page 13 GAO-16-630 Registering Voters and Administering Elections
States that adopt online registration create a web-based system or portal that takes applicants through the registration process enabling them to register and make updates to their registration online.20 For individuals who are not already registered, the system collects the required information that individuals would have otherwise provided on a paper registration form. Those who have already registered in the state may make changes online to their registration, for example by updating their address or changing their party affiliation. As of May 2016, 31 states and Washington, D.C., offer online registration, including four of the five states we visited—Colorado, Delaware, Illinois, and Oregon.21 In three of these four states, online registration is an option for individuals who have a driver’s license or state-issued ID card.22 Other registrants in these states can access a form online to print, sign, and mail to the election office or register through other methods available in their state.
Investments of time and money are involved in implementing online registration, and the process can include technological challenges, according to election officials we spoke with and our literature review. Generally, state election offices are responsible for designing and implementing online registration systems that voters in any local jurisdiction within the state can use, and thus state offices incur the costs of these investments. However, the upfront costs of online registration are generally modest and quickly surpassed by the savings generated after implementation. A 2015 review by The Pew Charitable Trusts found that while the creation of an online registration system involved some initial expenditure, the reported average cost to design, build, and implement a system was $249,005, based on survey results from 14 states that
20Some states may post registration forms online that allow individuals to type their registration information into the form, print the completed form, and mail it to election officials. However, for the purposes of this report, online registration refers to systems that allow voters to both complete and submit their registration electronically. 21Rhode Island enacted legislation authorizing online registration in March 2016. The state election director anticipates the online registration option will be available in July 2016. 22In Delaware, individuals do not need to have a driver’s license or other form of state ID in order to utilize the online registration system.
Online Registration
Investments and Challenges

Page 14 GAO-16-630 Registering Voters and Administering Elections
implemented online registration as of November 2014.23 Additionally, among the states we visited that have online registration systems—Colorado, Delaware, Illinois, and Oregon—most state officials we spoke with did not mention costs when asked what, if any, challenges they faced when implementing online registration. Officials from one state, Illinois, cited the lack of additional funding for designing their online registration system as a challenge of implementing the effort. The costs states incur result from activities such as building the online registration infrastructure and performing ongoing maintenance. State personnel or outside specialists under contract from the state may complete these activities. For example, in Illinois, state officials reported that the State Board of Elections Information Technology Department designed the online registration system. The state’s total costs for fiscal years 2013 and 2014, including the salaries of the individuals who designed the system, were reported to be approximately $600,000. Similarly, state officials we spoke with in Oregon noted that the state developed its online registration system in house, and thus there was no additional expense resulting from the upfront costs for implementation, beyond staff time for the Information Services Division of the Office of the Secretary of State and the DMV. However, Oregon officials reported that there are monthly and annual costs associated with vendors who provide continual maintenance of the system.
Election officials from three states we visited also said they needed to overcome multiple technical challenges when implementing online registration in their respective states. In particular, developing an online registration system includes the creation of a secure application for collecting registration information and transferring the information to local election offices, and this technical capability can be challenging to design. Illinois election officials said that in designing their state’s online registration system, they faced technical challenges because the system needed to interface with various systems that local jurisdictions use for
23The Pew Charitable Trusts, Understanding Online Voter Registration: Trends in Development and Implementation, May 2015. Twenty states were surveyed, and 14 reported costs. One state did not answer the cost question, and two other states had not determined total costs at the time of the survey. Three states reported using staff time and did not report the monetary value of staff time associated with implementation.

Page 15 GAO-16-630 Registering Voters and Administering Elections
processing and maintaining registration records.24 Thus, state officials designing the online registration system had to work with multiple vendors for the local jurisdictions’ systems to ensure the state’s online form could transmit data to the local jurisdictions.
Election officials in the states we visited also noted that designing the online registration system to capture a signature from registrants was a challenge.25 According to The National Research Council, state DMV databases generally provide the signature used for online registration.26 In Colorado, to verify the identity and obtain a digitized signature for first time registrants, the online system needs to connect to the DMV database in real time; the state had to overcome initial technical challenges with this connection when first implementing the system in 2010. In Delaware, state officials told us that a 2003 change in state law made online registration possible by permitting the election office to accept electronic signatures—a registrant can either access the system on a tablet and provide a signature using a stylus pen or upload a scan of his or her signature—if the registrant does not already have a signature on file in the elections or DMV databases.27
24In Illinois, the state’s voter registration database compiles data maintained by local jurisdictions in their own databases. Thus, prior to the design of online registration, the state had a mechanism to receive information from local jurisdictions, but not to provide information to them. 25In general, states with online registration require the collection of a signature, which can then be compared to the signature of the voter taken at the time of voting (for example, by signing a mail ballot or poll book) to verify the voter’s identity. Additionally, some state statutes treat online voter registrations as a registration by mail, for which a signature is required. See, e.g., Wash. Rev. Code Ann. § 29A.08.123(4). NVRA requires that a voter registration application (both by mail and at the DMV) include a statement that “(i) states each eligibility requirement (including citizenship); (ii) contains an attestation that the applicant meets each such requirement; and (iii) requires the signature of the applicant, under penalty of perjury.” 52 U.S.C. §§ 20504(c)(2)(C), 20506(a)(6)(A)(i), 20508(b)(2). States we spoke with, as well as the literature, cite capturing a signature as a challenge to online registration. 26The National Research Council Committee on State Voter Registration Databases, Improving State Voter Registration Databases: Final Report (Washington, D.C.: National Academies Press, 2010). 2774 Del. Laws 168, § 1 (2003) (codified at Del. Code. Ann. tit. 15, § 1302(e)) (allowing the applicant’s signature on his or her voter registration application to be a digitized signature obtained by a state agency as part of the process that includes registering a person to vote or updating the applicant’s voter registration information).
Page 16 GAO-16-630 Registering Voters and Administering Elections
According to literature we reviewed and state and local election officials we spoke with, the benefits of implementing an online registration system include administrative efficiencies that can result in improved registration accuracy and cost savings, including cost savings to voters in the form of greater convenience. Online registration results in administrative efficiencies, in part, by reducing the amount of manual data entry required to input information from registrants into a computerized voter registration database. Although state officials are generally responsible for the initial investments to set up the online registration system, local election officials may reap more of the benefits of online registration because they are responsible for processing and certifying individual registration records, and thus the local election officials benefit from being able to process registrations more quickly. For example, in Illinois, officials said that having the information electronically transferred has reduced processing times to a few minutes, replacing a more time-consuming process that required staff to open the envelope(s), date stamp each application, and manually enter the data into their computer systems.
Officials from all four states we visited with online registration noted improved accuracy of their registration rolls as a benefit of the system, and local officials in Delaware cited this as the greatest benefit of the new system. Local election officials in Colorado and Oregon noted that online registration reduces the need to decipher illegible handwriting, which can lead to errors when processing handwritten, paper registration forms. Additionally, in Illinois, election officials said that the registration information they receive is more complete because the online system identifies when individuals have left a required field blank and does not allow them to submit the application without completing all the required fields. In contrast, if individuals submit paper forms with incomplete or missing information, local officials processing the registrations would
Efficiencies and Other Benefits

Page 17 GAO-16-630 Registering Voters and Administering Elections
need to contact the individuals to obtain the information required to complete the registration process.28
After implementing online registration, the administrative efficiencies associated with processing registration forms can translate into cost savings for election offices. Twelve out of 13 states with online registration surveyed by Pew in 2013 reported that cost savings is one of the key benefits of these systems.29 Officials in Maricopa County in Arizona—the first state to have online registration—also reported that the cost of registration dropped significantly since the implementation of online registration, from $0.83 for a paper registration to $0.03 for an online registration—a total savings of approximately $1.4 million between 2008 and 2012.30
All local officials we spoke with in states with online registration noted that the administrative efficiencies from online registration reduced the costs, as well as time costs, associated with managing their registration lists. In Delaware, election officials stated that staff now more efficiently process registration applications, whereas officials previously had to work 10- to 12-hour shifts to process all incoming registration forms by the official deadline. This has resulted in less use of overtime pay in the weeks leading up to the state’s registration deadline, according to officials. Delaware state election officials also noted that their staff spends less time responding to phone calls from voters with registration questions since the implementation of the state’s online registration system, which has allowed election officials more time to do other elections related
28We also conducted a quantitative analysis to determine if states that adopted online registration saw an increase in the accuracy of their voter registration lists. We analyzed data from the 2008 through 2014 Voting and Registration Supplements of the U.S. Census Bureau’s Current Population Survey (CPS) to determine the extent to which implementation of online registration affected the number of registered voters reporting problems voting due to registration issues, which could be an indicator of the accuracy of a state’s registration list. Our analysis did not find a statistically significant reduction in reported registration problems in states that had implemented online voter registration versus states that had not. We provide more details on this analysis as well as its limitations in appendix II. 29The Pew Charitable Trusts, Understanding Online Voter Registration, January 2014. 30Maricopa County Elections Department, Cost of Elections: Online Voter Registration & Provisional Ballots, accessed March 18, 2016, https://recorder.maricopa.gov/voteroutreach/pdf/english/Cost%20of%20Elections%20Online%20VR%20and%20Provisionals.pdf.
Page 18 GAO-16-630 Registering Voters and Administering Elections
tasks. Additionally, officials in one local jurisdiction reported they have reduced their overall costs because they have fewer requests to mail registration applications, which saves time, postage, and supplies.
In addition to these benefits for election offices, the election officials we spoke with and the literature we reviewed noted that voters benefit from the added convenience online registration provides, and added convenience can translate to a decrease in the time cost to voters for participating in the voting process. Specifically, officials from all four states we visited with online registration noted that the system provides added convenience to voters, and other benefits, such as the ability to access other information related to an upcoming election. For example, officials from one local jurisdiction said that online registration along with their locally developed mobile application enables individuals to easily register, change their party affiliation, and access other information to participate in elections. Additionally, in the first year after implementation, a study of Washington residents reported that nearly 70 percent of people who had used the system reported that it was “very easy” to do so and 95 percent of those most informed about online registration agreed with the statement, “if I had a son or daughter turning 18, I would encourage them to register to vote online.”31
State and local election officials use a variety of tools to maintain voter registration lists. We reviewed two methods for sharing voter registration data electronically: (1) data sharing between state DMVs and election offices and (2) data sharing among multiple states. Since the passage of NVRA, DMVs have played a critical role in the voter registration process. Therefore, they are sometimes able to provide more current and accurate data about registered or potentially eligible voters. Moreover, in an effort to improve the quality of voter registration lists, states may take additional steps to share registration information with other states, thus helping to identify duplicate and deceased registrants and update each state’s registration rolls. Officials implementing DMV and interstate data-sharing efforts, as well as the literature we reviewed, have noted that there are
31Washington Institute for the Study of Ethnicity and Race (University of Washington, Seattle) and the Election Administration Research Center (University of California, Berkeley), Online Voter Registration Systems in Arizona and Washington: Evaluating Usage, Public Confidence, and Implementation Processes, April 2010.
Data-Sharing Efforts
Page 19 GAO-16-630 Registering Voters and Administering Elections
investments and challenges to implementation, but generally these efforts result in efficiencies and costs savings for voter registration activities.
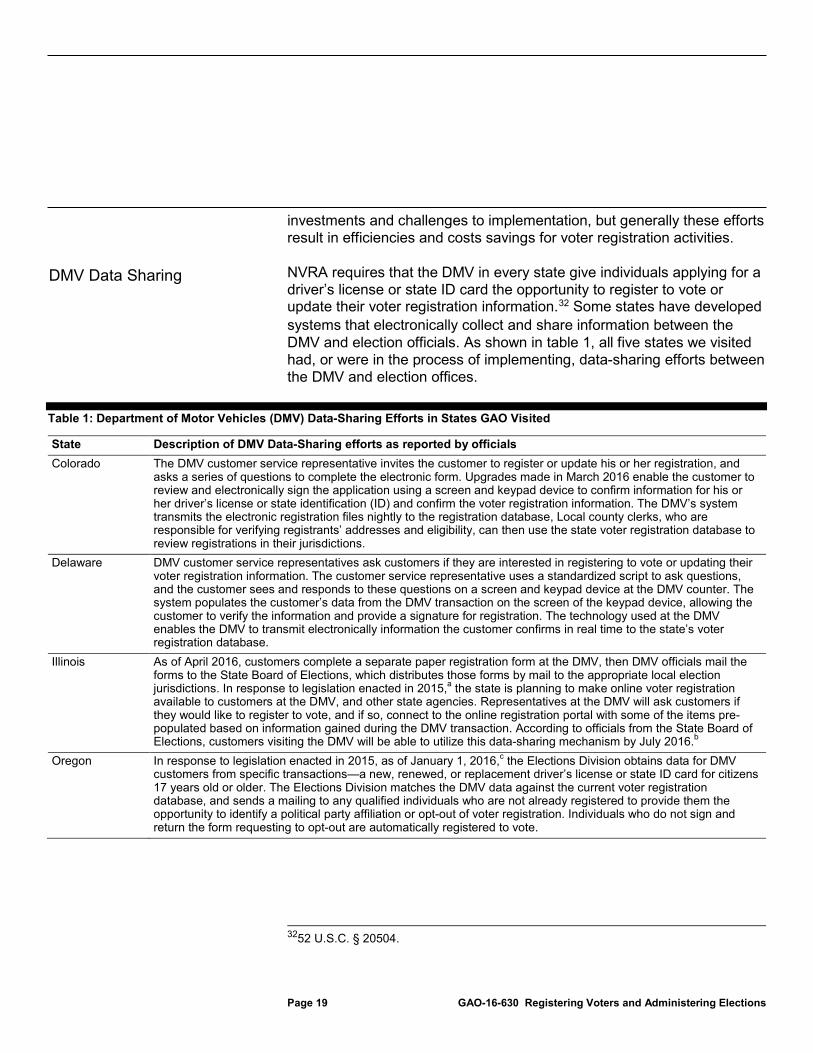
NVRA requires that the DMV in every state give individuals applying for a driver’s license or state ID card the opportunity to register to vote or update their voter registration information.32 Some states have developed systems that electronically collect and share information between the DMV and election officials. As shown in table 1, all five states we visited had, or were in the process of implementing, data-sharing efforts between the DMV and election offices.
Table 1: Department of Motor Vehicles (DMV) Data-Sharing Efforts in States GAO Visited
State Description of DMV Data-Sharing efforts as reported by officials Colorado The DMV customer service representative invites the customer to register or update his or her registration, and
asks a series of questions to complete the electronic form. Upgrades made in March 2016 enable the customer to review and electronically sign the application using a screen and keypad device to confirm information for his or her driver’s license or state identification (ID) and confirm the voter registration information. The DMV’s system transmits the electronic registration files nightly to the registration database, Local county clerks, who are responsible for verifying registrants’ addresses and eligibility, can then use the state voter registration database to review registrations in their jurisdictions.
Delaware DMV customer service representatives ask customers if they are interested in registering to vote or updating their voter registration information. The customer service representative uses a standardized script to ask questions, and the customer sees and responds to these questions on a screen and keypad device at the DMV counter. The system populates the customer’s data from the DMV transaction on the screen of the keypad device, allowing the customer to verify the information and provide a signature for registration. The technology used at the DMV enables the DMV to transmit electronically information the customer confirms in real time to the state’s voter registration database.
Illinois As of April 2016, customers complete a separate paper registration form at the DMV, then DMV officials mail the forms to the State Board of Elections, which distributes those forms by mail to the appropriate local election jurisdictions. In response to legislation enacted in 2015,a the state is planning to make online voter registration available to customers at the DMV, and other state agencies. Representatives at the DMV will ask customers if they would like to register to vote, and if so, connect to the online registration portal with some of the items pre-populated based on information gained during the DMV transaction. According to officials from the State Board of Elections, customers visiting the DMV will be able to utilize this data-sharing mechanism by July 2016.b
Oregon In response to legislation enacted in 2015, as of January 1, 2016,c the Elections Division obtains data for DMV customers from specific transactions—a new, renewed, or replacement driver’s license or state ID card for citizens 17 years old or older. The Elections Division matches the DMV data against the current voter registration database, and sends a mailing to any qualified individuals who are not already registered to provide them the opportunity to identify a political party affiliation or opt-out of voter registration. Individuals who do not sign and return the form requesting to opt-out are automatically registered to vote.
3252 U.S.C. § 20504.
DMV Data Sharing
Page 20 GAO-16-630 Registering Voters and Administering Elections
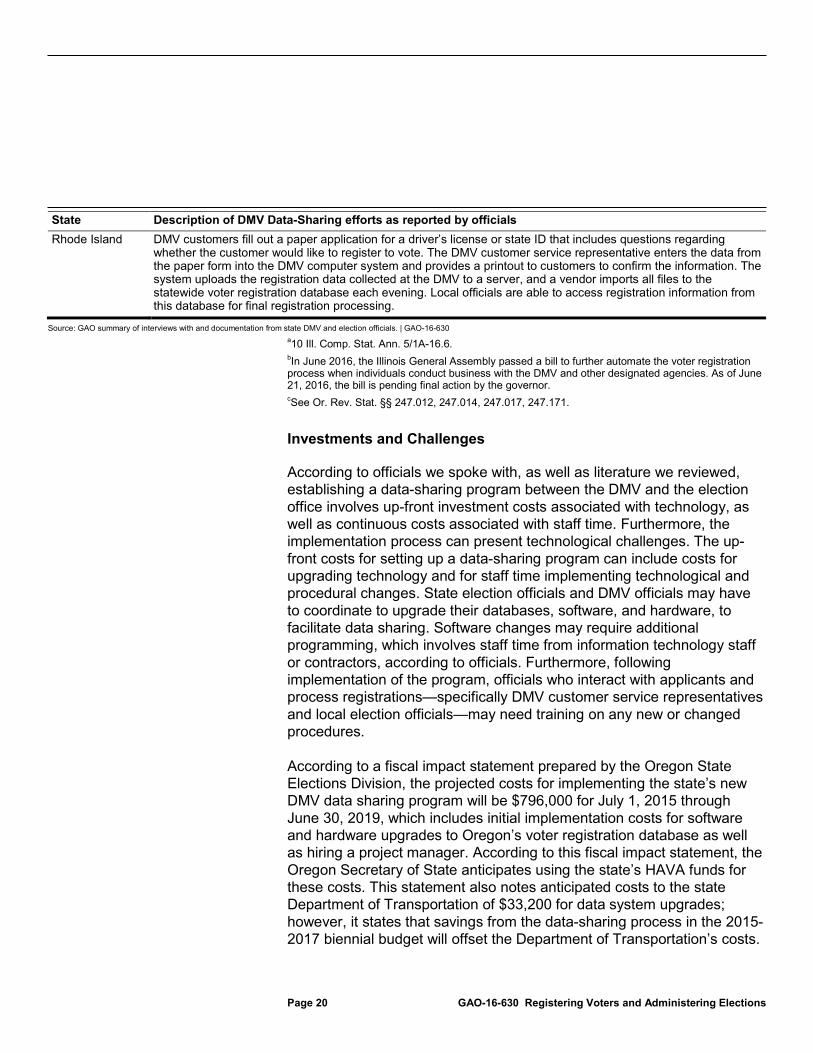
State Description of DMV Data-Sharing efforts as reported by officials Rhode Island DMV customers fill out a paper application for a driver’s license or state ID that includes questions regarding
whether the customer would like to register to vote. The DMV customer service representative enters the data from the paper form into the DMV computer system and provides a printout to customers to confirm the information. The system uploads the registration data collected at the DMV to a server, and a vendor imports all files to the statewide voter registration database each evening. Local officials are able to access registration information from this database for final registration processing.
Source: GAO summary of interviews with and documentation from state DMV and election officials. | GAO-16-630 a10 Ill. Comp. Stat. Ann. 5/1A-16.6. bIn June 2016, the Illinois General Assembly passed a bill to further automate the voter registration process when individuals conduct business with the DMV and other designated agencies. As of June 21, 2016, the bill is pending final action by the governor. cSee Or. Rev. Stat. §§ 247.012, 247.014, 247.017, 247.171.
Investments and Challenges
According to officials we spoke with, as well as literature we reviewed, establishing a data-sharing program between the DMV and the election office involves up-front investment costs associated with technology, as well as continuous costs associated with staff time. Furthermore, the implementation process can present technological challenges. The up-front costs for setting up a data-sharing program can include costs for upgrading technology and for staff time implementing technological and procedural changes. State election officials and DMV officials may have to coordinate to upgrade their databases, software, and hardware, to facilitate data sharing. Software changes may require additional programming, which involves staff time from information technology staff or contractors, according to officials. Furthermore, following implementation of the program, officials who interact with applicants and process registrations—specifically DMV customer service representatives and local election officials—may need training on any new or changed procedures.
According to a fiscal impact statement prepared by the Oregon State Elections Division, the projected costs for implementing the state’s new DMV data sharing program will be $796,000 for July 1, 2015 through June 30, 2019, which includes initial implementation costs for software and hardware upgrades to Oregon’s voter registration database as well as hiring a project manager. According to this fiscal impact statement, the Oregon Secretary of State anticipates using the state’s HAVA funds for these costs. This statement also notes anticipated costs to the state Department of Transportation of $33,200 for data system upgrades; however, it states that savings from the data-sharing process in the 2015-2017 biennial budget will offset the Department of Transportation’s costs.

Page 21 GAO-16-630 Registering Voters and Administering Elections
Implementation of Delaware’s data-sharing program did not require hiring additional staff; rather, existing staff from both the state election office and DMV made the necessary programming and procedural changes.33 According to state election officials, Delaware also used federal funds provided through HAVA for some of the implementation costs, specifically to make programming adjustments to automated kiosks at the DMV that customers used prior to data sharing to update information on their drivers’ licenses or state IDs.34 The state election office’s costs were primarily to pay a vendor to make programming adjustments to the proprietary software for the kiosks, to incorporate the voter registration features.
In addition to the costs for technology and staff time, setting up connections to share DMV data can be technologically challenging, according to the literature and election officials we interviewed. For example, a Pew Charitable Trusts report noted that compatibility between data systems at election offices and DMVs is a technological challenge to implementing data-sharing programs.35 Similarly, Colorado officials reported challenges getting DMV and state elections systems to work together, and officials plan additional changes through 2017 to improve the compatibility of data shared between the agencies. In Delaware, DMV officials told us that creating a web server link between the screen and keypad devices that voters use to input their information and the DMV computer system was the most difficult technical challenge. Lastly, Oregon DMV officials reported having to create an entirely new application in their system to share information with the election office.
Following implementation of a data-sharing process, there may also be ongoing costs associated with processing an increased volume of registrations. Officials we spoke with, as well as studies analyzing the implementation of intrastate data-sharing efforts, note that the volume of voter registration applications can increase from implementing efforts
33Officials we spoke with explained they did not break out the costs associated with implementing these upgrades for their DMV data-sharing efforts because the changes were done by in-house staff and completed during normal business hours. 34In addition to the screen and keypad devices at the counters where customers interact with a DMV representative, the Delaware DMVs have automated kiosks that customers can use to make changes to their address on their DMV-issued IDs. 35The Pew Charitable Trusts, Measuring Motor Voter, May 2014.

Page 22 GAO-16-630 Registering Voters and Administering Elections
such as DMV data sharing. Local election officials can face increased workload as they maintain responsibility for processing and certifying these registrations. For example, local officials in one state we visited told us more individuals were registering after implementation of DMV data sharing, and state officials in Delaware also reported increased registration rates, though neither reported that processing increased registrations presented a challenge. However, Oregon election officials and DMV officials we spoke with anticipate that the state’s data-sharing program—that registers DMV customers as of January 1, 2016, unless they specifically opt out—will increase registration rates and result in increased costs. Processing registrations includes the production and mailing of confirmation notices to eligible individuals informing them that election officials have certified their registration.36 Because of the expected workload increase for county officials, Oregon state election officials said the state plans to reimburse counties $0.15 per registered voter over a 6- to 8-year phase-in period for the program.
The quality of registrants’ signatures collected at the DMV, and various constraints on sharing signatures across agencies, can pose a challenge for election officials when trying to verify a voter’s identity when comparing a signature captured during the registration process with a signature when the voter casts a ballot. While some state DMVs continue to collect a signature on a paper form as part of their registration process, others have installed new hardware to collect digital signatures, but an election official in Oregon cited challenges with the quality of these signatures, which can vary depending on the technology used. In Oregon, the signature provided to the DMV is crucial because it will become the official signature on file in the state’s voter registration system. As a vote-by-mail state, Oregon requires that the signature on file match the signature provided on the voter’s mail ballot. Oregon officials are considering installing signature pads at the DMV that will produce high quality signatures, but as of May 2016 the DMV staff are scanning a paper copy of the customer’s signature and transferring it to the state elections office. In Delaware, officials implemented the data-sharing program to collect two signatures, one for DMV transactions and one for elections office transactions. Delaware officials explained that this was necessary because, according to state law, DMV customers, in
36In Oregon, the process includes mailing notices to qualified individuals who have done business with the DMV to inform them of options to select a party affiliation or opt-out of registration.

Page 23 GAO-16-630 Registering Voters and Administering Elections
conducting DMV transactions, did not consent to share their signature with the Department of Elections.37
Efficiencies and Other Benefits
According to literature we reviewed and DMV officials we spoke with, DMV data-sharing programs can lead to cost savings and other efficiencies for officials while also providing added convenience to voters. Electronic data transmission can result in cost savings to DMV and election officials because of administrative efficiencies—such as eliminating physical transport—and improved data quality. For example, in Delaware, officials reported that prior to implementation of the data-sharing program, election officials drove to their local DMVs every day to pick up voter registration forms; and electronic transmission eliminated these daily trips. In other states where the DMV previously mailed registration forms to election offices, the electronic data transfer saves mailing costs.38 According to one report, Washington’s DMV data-sharing program saved $121,000 in mailing costs from January 2008 to July 2009.39 Furthermore, because electronic receipt of registration data replaces manual data entry from paper registration forms, DMV data sharing can reduce the amount of time elections officials spend processing registrations. In Delaware, the state election office returned full-time positions to the state because electronic application transmission increased efficiency, according to state election officials.
Additionally, officials we spoke with stated that DMV data-sharing programs likely increase accuracy, as election officials are no longer deciphering illegible handwriting on paper forms. The literature also cites accuracy and cost savings as the predominant benefits of DMV data sharing. Among recommendations to improve states’ electoral systems and implementation of HAVA, a report by The Century Foundation Working Group on State Implementation of Election Reform encourages
37See Del. Code Ann. tit. 15, § 2050(a)(4). 38Burd-Sharps, Sarah and Patrick Guyer Nolan, The Costs of Modernizing Voter Registration Systems: A Case Study of California and Arizona, Social Science Research Council, February 2015. 39Weiser, Wendy, Adam Skaggs, Christopher Ponoroff, and Lawrence Norden, Modernizing Ohio's System for Registering Voters: Automatic & Online Registration, (New York, New York: The Brennan Center for Justice, 2009).
Page 24 GAO-16-630 Registering Voters and Administering Elections
data sharing from DMV data systems and other state databases.40 The report cites examples from Kentucky and Michigan where data-sharing efforts ensured that states’ voter registration lists automatically reflected relevant updates, such as a change in address. Additionally, a Brennan Center report notes that the Washington Secretary of State’s office saved $126,000 in 2008 due to both online voter registration and DMV data sharing.41 In Delaware, officials reported reducing DMV transaction time by 1 minute per customer after the DMV customer service process incorporated registration questions, because customers no longer have to wait for representatives to print forms with their information in triplicate for customers to sign.
DMV data sharing may also result in a more efficient experience for voters, because they are not required to update their voter registration records separately, as the DMV automatically forwards the information to the election office. The literature also indicates that shifting the burden of voter registration from the registrant to government agencies such as the DMV and the election office is especially helpful for mobile, low-income, and minority populations, who benefit from the added convenience, as well as young voters,42 who may be able to preregister when they apply to obtain a driver’s license.43 Rhode Island officials we spoke with also noted cost savings for voters because registration at the DMV eliminates the need for registrants to pay postage to mail a voter registration form to the elections office.
Various interstate data-sharing efforts help state and local election offices maintain accurate voter registration lists, according to election officials
40Balancing Access and Integrity: A Report of the Century Foundation Working Group on State Implementation of Election Reform (New York, New York: The Century Foundation Press, 2005). 41Christopher Ponoroff, Voter Registration in a Digital Age. 42Novakowski, Scott, Democracy in a Mobile America (New York, New York: Demos, 2009); Alvarez, Michael R., Bernard Grofman, Election Administration in the United States: The State of Reform after Bush v. Gore; Cha, J.M, Liz Kennedy, Millions to the Polls: Permanent & Portable Voter Registration (New York, New York: Demos, 2014). 43In some states, individuals can pre-register when they are 16 or 17 years old, and these pre-registrations become active registrations when the individuals become eligible to vote. In many cases, they are eligible to vote once they turn 18, but in some states, 17-year-olds can vote in a primary election if they will be 18 years old by the date of the corresponding general election.
Interstate Data Sharing
Page 25 GAO-16-630 Registering Voters and Administering Elections
and literature. These efforts include, among others, state participation in interstate exchanges—such as ERIC and the Interstate Voter Registration Crosscheck Program—in which states compare information from their voter registration lists, as well as individual states’ use of national databases—such as the U.S. Postal Service’s National Change of Address (NCOA) database44 or death records from the Social Security Administration—to identify registrants who have moved to another jurisdiction or state, or who have died.45 Researchers found that, in 2008 and 2010, approximately half of the states used checks against one or more external databases that contained information across multiple states to maintain the accuracy of their voter registration records.46 In a 2009 report, the National Research Council Committee on State Voter Registration Databases made multiple recommendations aimed at upgrading procedures to conduct data matching to enable election officials to identify potential duplicate registrations across states’ registration databases.47 Similarly, the Presidential Commission on Election Administration recommended that states should participate in interstate exchanges of voter registration information, such as ERIC and the Interstate Voter Registration Crosscheck Program, adding that such efforts could result in more accurate registration lists, among other
44The National Change of Address database is a product of the United States Postal Service. Entities use the database to obtain the most current and accurately formatted mailing address information to help reduce undeliverable mail. 45Three of the states we visited—Colorado, Illinois, and Oregon—are either current or former participants in the Interstate Voter Registration Crosscheck program. According to election officials we spoke with in these states, participating states agree to provide information such as full name and date of birth for those registered as well as turnout data, to Interstate Voter Registration Crosscheck program administrators in January following a general election. Using the information provided by member states, the Interstate Voter Registration Crosscheck program then provides states with data on potential duplicate registrations and potential double voters. Chief election officials in these three states also contract for data matching against the NCOA database, which assists officials either in having up-to-date mailing address information for registrants who have moved, to a different jurisdiction within the state, or out of state. Lastly, the Colorado election director also told us that the state election office utilizes Social Security death records to help maintain the accuracy of the state’s registration list. 46Barry C. Burden and Charles Stewart III, The Measure of American Elections, first edition (Cambridge, United Kingdom: Cambridge University Press, 2014). 47The National Research Council Committee on State Voter Registration Databases, Improving State Voter Registration Databases: Final Report (Washington, D.C.: National Academies Press, 2009).

Page 26 GAO-16-630 Registering Voters and Administering Elections
benefits.48 Among such interstate data sharing efforts, we reviewed ERIC in more detail, because it provides an illustrative example of such interstate data-sharing efforts used by state and local election offices in maintaining voter registration lists.
ERIC is a multistate partnership that uses data-matching technology to compare member states’ voter registration lists, DMV records, and nationally available lists from the U.S. Postal Service and the Social Security Administration. ERIC administrators stated that the goal of the partnership is to improve the accuracy and quality of voter registration rolls, adding that this can increase voter turnout and decrease costs associated with administering elections by enabling states to have more up-to-date registration lists. ERIC was organized in 2012 with seven states as founding members and has grown to include 19 member states and Washington, D.C., as of June 19, 2016, including all five states we visited.49
Participation in the ERIC partnership places a number of requirements on states to provide information to ERIC for data-matching purposes, and in response, ERIC administrators provide regular reports to the states that election officials may use to update their registration lists.
• At least bi-monthly, member states are required to provide ERIC with data from their voter registration lists and DMV records for individuals with licenses or state IDs. These data include identifiers/data elements such as name, address, date of birth, last four digits of a Social Security Number, driver’s license or state ID number, and citizenship, among others, when these data elements are available.
• At least once per year—or more frequently if the member state submits a request—ERIC administrators provide member states with lists of cross state matches, in-state updates (where the DMV may have a more up-to-date address than the election office), duplicate
48Presidential Commission on Election Administration, The American Voting Experience: Report and Recommendations of the Presidential Commission on Election Administration, January 2014. 49The following are ERIC members as of June 19, 2016: Alaska, Alabama, Colorado, Connecticut, Delaware, Illinois, Louisiana, Maryland, Minnesota, Nevada, Ohio, Oregon, Pennsylvania, Rhode Island, Utah, Virginia, Washington, West Virginia, Washington, D.C., and Wisconsin.

Page 27 GAO-16-630 Registering Voters and Administering Elections
registrations, and deceased voters. Within 90 days, states are required to initiate contact with 95 percent of the voters whose registration data ERIC’s data-matching process deemed to be inaccurate or out-of-date, to begin registration list maintenance activities.
• At least every other year—or more frequently if the member state submits a request—ERIC administrators provide states with a list of possibly eligible, unregistered individuals—specifically, individuals who have a driver’s license or state ID but have not registered to vote. Using this information, states are required to establish a plan to outreach to these individuals, such as by sending a mailing that provides information on how these individuals can register if they are eligible citizens, though the individual approaches and mailings may vary by state.
Investments and Challenges
Member states incur financial and staff time investments for joining ERIC, as well as experience other challenges in leveraging the matched data based on the quality of their own state’s data. Participation in ERIC requires multiple fees, which can present a challenge according to state election officials and our literature review. Upon joining ERIC, states pay an initial $25,000 membership fee. States must also pay annual fees based on the number of registered voters in the state and the number of member states participating. State officials we spoke to report a range of participation fees between $26,000 and $75,000 annually. Officials from Delaware noted that they have used some of their remaining HAVA funds to cover the cost of their annual fees.
Once states receive matched data from ERIC, election officials invest time and other resources to review and process the results in a timely manner. However, when asked about the challenges they faced from joining ERIC, local officials from Delaware, Rhode Island, and Oregon, who are responsible for processing the results, did not indicate that the requirement to contact registered voters identified as having inaccurate or out-of-date records within 90-days specifically posed an issue.50
50Officials in Colorado stated in October 2015 that they were unable to meet this deadline due to limitations in their state DMV database, but are implementing upgrades, which they expect will resolve this problem.
Page 28 GAO-16-630 Registering Voters and Administering Elections
States can incur costs associated with mailings that are required by the ERIC bylaws, in particular, the bi-annual mailings to all identified possibly eligible, unregistered individuals. According to the state election director in Oregon, ERIC identified about 795,678 possibly eligible, unregistered individuals in 2014. State officials reported that the total associated mailing cost was $123,767. However, new member states, or those interested in joining ERIC, can apply to The Pew Charitable Trusts for grants to help offset the costs associated with the required mailings.51 For example, grant funds from The Pew Charitable Trusts covered approximately three-quarters of Oregon’s $123,767 mailing to possibly eligible, unregistered individuals. Although the first batch of possibly eligible, unregistered individuals identified after a state joins ERIC can require a large mailing, states only need to attempt contact with those identified individuals once, according to the membership agreement. Because subsequent state mailings can focus on only those newly identified possibly eligible, unregistered individuals since the prior data provided by ERIC, these mailings are therefore likely not to be as large or costly.
States may also face challenges using information provided by ERIC based on the reliability of underlying data provided, and the number and geographic proximity of member states. For example, Colorado election officials said that they are not confident in the quality of the state’s DMV address data and thus the in-state updates list that state election officials receive from ERIC are not always accurate. Colorado DMV officials stated that, by 2017, they plan to complete upgrades to make their system more compatible with the state’s voter registration database, which election officials expect will make the DMV address data more reliable and the ERIC matching process more useful.
Additionally, election officials in some of the states that we visited reported that the absence of ERIC participation among neighboring states limited ERIC’s ability to provide complete data to update registration lists. Officials in Delaware and Rhode Island noted that participation by states to which retirees commonly move (such as Florida) might result in particularly useful information for updating registration lists.
51According to officials, ERIC was founded in 2012 as a project between the states and The Pew Charitable Trusts, but is now an independent organization managed by representatives from member states. In 2014, The Pew Charitable Trusts awarded grants to four states to conduct their initial ERIC mailings.
Page 29 GAO-16-630 Registering Voters and Administering Elections
Efficiencies and Other Benefits
According to election officials we spoke with, as well as officials’ views cited in literature we reviewed, a state’s participation in ERIC leads to more accurate voter registration lists and cost savings for state and local election offices. State officials noted that ERIC data improve the accuracy of voter registration lists by identifying registrants who elections administrators should remove for various reasons, such as having moved to another state or died. For example, local officials in Oregon noted that ERIC lists identified over 900 registrants who died in another state, enabling election officials to remove the majority of these registrants from Oregon’s registration list. From our literature review, studies that evaluated ERIC also identified increased accuracy as a benefit of the program. For example, an RTI International report52 noted that all officials interviewed for the study from states that had participated in ERIC were confident in ERIC’s matching process to increase the accuracy of their voter registration lists.53
State officials in all states we visited, as well as multiple sources in the literature we reviewed, reported that improved accuracy of registration lists translates into cost savings from decreased mailing costs as well as decreased staff time to maintain the voter registration lists. Vote-by-mail states, such as Colorado and Oregon, have a heightened interest in maintaining clean voter registration lists because of the costs associated with mailing a ballot to an incorrect address. Election officials in both states noted that the data provided by ERIC are among multiple tools
52Bland, Gary and Barry C. Burden, Electronic Registration Information Center (ERIC) Stage 1 Evaluation: Report to the Pew Charitable Trusts, RTI International, December 2013. 53In addition to the officials cited, the RTI International study referenced above used a difference-in-difference modeling approach to estimate the effect of ERIC adoption on changes in the number of registered voters reporting problems voting due to registration issues, as reported on the Voting and Registration Supplements of the U.S. Census Bureau’s Current Population Survey (CPS) for the 2008 to 2014 elections. We replicated the methods used in RTI International’s analysis to estimate the effect of ERIC adoption on changes in reported problems voting due to registration, a proxy measure of registration list accuracy, for midterm elections in 2010 through 2014 as well as the 2008 and 2012 presidential elections. We did not find statistically significant differences between states that adopted ERIC and those that did not. The specifics of this analysis and a discussion of its limitations can be found in Appendix II.
Page 30 GAO-16-630 Registering Voters and Administering Elections
they use to maintain accurate registration rolls.54 Additionally, according to a study by The Pew Charitable Trusts, King County, Washington, which conducts elections entirely by mail, saw a drop in undeliverable ballots from 17,911 in the 2013 primary to 11,174 in the 2014 primary, which county election officials attributed to Washington’s participation in ERIC.55
States without all vote-by-mail elections cited similar benefits. For example, according to election officials in Delaware, having more accurate voter registration lists from participation in ERIC has resulted in mailings that are more effective, because updates based on the information provided by ERIC increase the likelihood that voters will receive mailings while reducing the amount of undeliverable mail. Since making ERIC updates, officials reported receiving about three bins of returned postcards instead of eight bins from the state’s bi-annual mailing to verify voters’ addresses, resulting in less money wasted on printing and postage for mailings that do not reach the intended recipient. Elections officials in Delaware and Rhode Island also reported that their staff spend less time updating the voter registration lists in the months leading up to an election, with the work of cleaning the registration list more evenly distributed across the year. One local election official in Rhode Island, which joined ERIC in July 2015, indicated that ERIC participation should help to reduce the rate of duplicate registrations, resulting in reduced printing costs at the local level for poll books. According to a Pew Charitable Trusts report, the director of elections in Minnesota cited approximately $116,250 in savings to counties since the state joined ERIC in August 2014.56
54Officials in Oregon specifically cited the identification of deceased registrants from ERIC as particularly helpful. Officials in Colorado added that, in addition to ERIC they rely on the NCOA database to make most of their updates to their registration lists. As previously stated, ERIC plans to provide an additional report to member states that compares states’ lists against the NCOA database. 55The Pew Charitable Trusts, ERIC Reduces Undeliverable Ballots in King County, Washington, October 16, 2014. 56The Pew Charitable Trusts, ERIC Promotes Long-Term Cost Savings in Minnesota, March 24, 2015.

Page 31 GAO-16-630 Registering Voters and Administering Elections
State and local governing bodies and election officials are responsible for selecting and implementing various policies and practices (hereafter “policies”) to facilitate election administration. We systematically reviewed literature to identify which of these policies researchers have studied for potential effects on turnout and the findings from these studies. Through our review we identified 11 policies that were each studied in multiple publications. The research indicated these policies had varying effects on turnout. For instance, the majority of studies we reviewed that assessed the effect of same day registration and all vote-by-mail on voter turnout found that these policies increased turnout. Additionally, some studies on informational mailings and no-excuse absentee voting policies also found that these policies increased turnout, but other studies associated with these policies reported mixed evidence or no evidence of an effect. In appendix IV, we summarize the detailed results of our literature review and present contextual information related to each of the 11 policies.
Broad academic research on voter turnout has generally shown that individual and demographic differences among populations—such as political interest and age—and the competitiveness of elections are more strongly and consistently associated with the decision to vote than interventions that seek to make voting more convenient, and thus less costly, to voters. Additionally, according to CPS data for the voting-age population, national turnout rates in presidential and midterm elections have declined slightly over the past three-and-a-half decades; at the same time, state and local governments have implemented various policies which, in many cases, have helped to expand options related to when, where, and how individuals may register and vote.
Our review focused on policies that fall into three broad categories:
• Providing information: State and local strategies for providing information about registration and elections can vary in terms of the methods used (e.g., websites, mail, etc.) and content, format, and frequency of communications. Some informational policies are determined by state law, regulation, or policy, and others are determined by local jurisdictions.
Our Review of Relevant Research Finds that Effects of Selected Policies and Practices on Voter Turnout Vary
Policies We Reviewed

Page 32 GAO-16-630 Registering Voters and Administering Elections
• Registering individuals: States vary with regard to where, when, and how citizens may register to vote.57 For instance, some states have registration closing dates in advance of Election Day while other states allow citizens to register and vote on Election Day. Within state requirements, local jurisdictions may have some discretion, such as in selecting which locations may be available for citizens to register in person.
• Providing opportunities to vote: States also vary with regard to where, when, and how registered individuals may cast a ballot. For instance, states differ in the extent to which they allow voting prior to Election Day (either in-person or by mail). Within state requirements, local jurisdictions may have some discretion, such as in determining which specific days they will allow early in-person voting, or in setting polling hours.
We identified and reviewed literature that assessed the effects of a variety of policies on voter turnout. Specifically, our literature search identified over 400 journal articles, reports, or books published from 2002 through 2015 relevant to the topic of voter turnout. We used a systematic process to conduct the review, which appendix II describes in more detail. We ultimately identified and reviewed 118 studies within 53 publications that (1) assessed policies that have been or could be implemented by a state or local government, (2) contained quantitative analyses of the effect of a given policy on turnout, and (3) used sufficiently sound methodologies for conducting such analyses.58 As used in this report, a “study” is an analysis or experiment with a unique sample of data.59
Our synthesis of the research literature provides a high-level summary of each policy’s general effect on turnout, as reported in recent research.
57North Dakota does not require voters to register prior to casting a ballot. 58Research on voter turnout has examined a wide range of policies. Therefore, in order to provide a reasonable and useful synthesis of the literature, we further limited our scope using other criteria, such as by excluding policies that were not examined in at least two publications. See appendix II for more information about our scoping decisions. See appendix V for a bibliography of these publications. 59For example, in some cases, authors presented their findings broken down by type of election (e.g., presidential vs. mid-term) or election year (e.g., 2002 and 2004). In these instances, we considered the findings related to the separate types of elections or time periods as resulting from separate samples (thus, separate “studies,” as we use the term in this report).
Page 33 GAO-16-630 Registering Voters and Administering Elections
Although we found the studies we reference in our report to have used sufficiently sound methods, the studies we reference were subject to limitations. For instance, many of the policies we reviewed cannot easily be evaluated using randomized controlled trials that often provide the most persuasive evidence of program effects, and thus many of the studies in our review used quasi-experimental approaches or statistical analysis of observational data to examine the impacts of such policies.60 With such designs, any observed differences in turnout across jurisdictions, time periods, or groups could be caused or influenced by the policy itself; by factors related to the jurisdiction’s decision to adopt the policy; by differing demographic factors across voters; by the contemporaneous implementation of other election policies; or by unobserved or unmeasured factors—such as mobilization campaigns, news media coverage, or social and psychological differences across voters. As a result, distinguishing the unique effects of a policy from the effects of other factors that affect turnout can be challenging. These vulnerabilities can be mitigated, in part, with attention to research design, including appropriate statistical analysis and interpretation. Nevertheless, any policy evaluation in a non-experimental setting cannot account for all unobserved factors that could bias or confound impact estimates with certainty.
Our synthesis of the research literature also discusses additional contextual information that may be related to a specific policy’s effect on turnout. We recognize that variations in policy implementation exist—such as differences between the number and type (weekday versus weekend) of days early in-person voting may be available—and may have different effects on turnout. We provide examples of studies that assessed some of these variations in implementation, and their associated impacts on turnout, in the individual policy summaries in appendix IV. Moreover, the development and implementation of various election administration policies are informed by a variety of factors at the state and local level, and thus research findings on turnout may not be the only considerations for election officials in deciding whether to implement changes to election administration policies. We include a discussion of selected factors that administrators may consider in the individual policy summaries in appendix IV.
60Jurisdictions likely would not randomly assign some citizens to one method of election administration and other citizens to another method without first examining whether such random assignment has the potential of violating equal-protection principles.

Page 34 GAO-16-630 Registering Voters and Administering Elections
We reviewed the research conducted on 11 policies that met the criteria for inclusion in our literature review. Each of these 11 policies falls within one of the three broad types of activities conducted by election administrators: providing information, registering individuals, or providing opportunities to vote. Figure 3 presents the total number of studies that examined each policy’s impact on turnout, and summarizes the findings of the studies. Some studies examined more than one policy and thus appear more than once in figure 3. Additionally, some studies reported more than one finding related to the effect of a given policy.61 For a given policy, we categorize the findings for each study as follows:
• Increased turnout: A study reported only statistically significant positive effects (one or more).
• Mixed evidence: A study reported one or more statistically significant effects (positive or negative) and one or more findings that were not statistically significant. Alternatively, a study reported one or more statistically significant positive effects and one or more statistically significant negative effects, with or without additional findings that were not statistically significant.
• No evidence of effect: A study reported no statistically significant effects.
• Decreased turnout: A study reported only statistically significant negative effects (one or more).
61For instance, some studies analyzed turnout data using multiple statistical models, resulting in multiple findings (one from each model). Additionally, other studies reported more than one finding because they broke down their results by subsamples, such as by race or by treatment groups associated with variations in policy implementation.
Observations from our Literature Review

Page 35 GAO-16-630 Registering Voters and Administering Elections
Figure 3: Findings of Studies Examining Effects of Eleven Selected Policies on Voter Turnout
a“Robocalls” refers to automated telephone calls that deliver prerecorded messages to inform potential voters about dates or other aspects of upcoming elections and encourage them to register or vote. b“No-excuse absentee voting” refers to the allowance for any registered individual to request an absentee ballot and to vote by mail, without requiring that the individual state a reason for doing so. c“Vote centers” refers to polling places that are strategically located throughout a political subdivision where any registered individual may vote, regardless of the precinct in which the individual resides.
As shown in figure 3, some policies have been studied more than others, and the research on some policies resulted in more consistent findings than on others. Taking both of these factors into consideration, we observe that:
• The majority of studies we reviewed on same day registration (21 of 33 studies) and all vote-by-mail (11 of 21 studies) found that these policies increased turnout.
• Vote centers (polling places where registrants can vote regardless of assigned precinct) and the sending of text messages to provide information about registration and elections have not been studied as
Page 36 GAO-16-630 Registering Voters and Administering Elections
much as some of the other policies, but almost all of the studies we reviewed on these policies (with the exception of one study on vote centers) reported increased turnout.
• Some studies of mailings to provide information and no-excuse absentee voting policies also found that these policies increased turnout, while other studies associated with these policies reported mixed evidence or no evidence of an effect. In some cases, variations in how these policies were implemented and unique contextual factors associated with their implementation may, in part, account for this varied evidence.
• Most studies that examined e-mail and robocalls used to provide information reported no evidence of an effect on turnout.
• Most studies (15 of 20) associated with early in-person voting found that the policy either had no effect on turnout (7 studies) or decreased turnout (8 studies), and 5 studies reported mixed evidence.
In appendix IV we present additional information specific to each of the 11 policies. For each policy, we present (1) a summary of findings from the literature related to the policy’s effects on voter turnout; (2) examples of specific studies; (3) descriptions of variations in how the policy may be implemented; and (4) information about the administrative costs of policy implementation, effects on voter convenience (costs to voters), and other considerations that election officials may wish to consider when deciding whether and how to implement the policy (e.g., technological or legal considerations).
States and local election jurisdictions incur a variety of costs associated with administering elections, and the types and magnitude of costs can vary by state and jurisdiction. Further, quantifying the costs for all election activities is difficult for several reasons, including that multiple parties incur costs associated with elections and these parties may track costs differently. Although some parties’ costs can be easily identified in state and local budgets or other cost-tracking documents, other costs may be difficult to break out or attribute to election activities. Additionally, voters’ costs are difficult to quantify and monetize because individual voters’ circumstances differ.
Election Activities Result in Various Costs, and These Costs Can Be Difficult to Quantify
Page 37 GAO-16-630 Registering Voters and Administering Elections
Election officials are responsible for providing information, registering individuals, and providing the opportunity to vote, but states and local jurisdictions differ in how they administer the activities within these areas of responsibility. The differences in election administration across jurisdictions result in variations in the types and magnitudes of costs that states and local jurisdictions incur for these activities. The following are some examples of variations in cost for different aspects of election administration.
State and local jurisdictions have different ways of informing residents about registration requirements and the voting process, and the costs for these efforts can vary. For example, communication efforts could include speaking to civic groups, churches, unions, high schools, and other interested groups; providing registration and voting information at naturalization ceremonies; publishing information in newspapers, on websites, or on social media; or mailing each household a voter guide. The type and magnitude of costs for these outreach efforts can vary because of the different methods states and local election jurisdictions may use to provide information to residents. For example, speaking to interested groups involves a time cost for the officials who speak at such events, and this time cost may be considered part of an election official’s regular salary and work schedule, whereas mailing voter guides involves printing and postage costs. A state election official in Rhode Island noted that he visits high schools to inform students about registration, and the costs are staff time that fall within his regular salary, in addition to transportation (mileage reimbursement).
According to the chief election official in one local jurisdiction we visited, the election office spent about $7,000 to advertise elections information (e.g., polling locations, deadlines related to the election) in newspapers for the 2014 primary and general elections, in addition to about $12,000 for printing and mailing informational materials about state referenda on the ballot to registered voters. Officials in another local election jurisdiction said they send some voter information by e-mail, such as reminders to update registration information or information about election updates; although providing information by e-mail does not involve printing or postage costs, it requires that the election office have access to e-mail addresses. In some cases, election officials may be able to use e-mail addresses provided through other local government activities—for example, in one local jurisdiction we visited, the clerk includes election information in a general community e-mail newsletter to individuals who request the newsletter through the local government’s website. States and local jurisdictions may consider these costs, as well as other factors,
States and Local Jurisdictions Incur a Variety of Costs Associated with Administering Elections
Costs for Providing Information

Page 38 GAO-16-630 Registering Voters and Administering Elections
such as the intended target audience or legal requirements, in selecting a combination of outreach efforts to inform residents about registration and voting processes.
In particular, information about registration requirements and processes may need to be distributed in such a way to reach individuals who are not registered or may need to update their registration. States and local election officials may choose outreach methods that address the general public to provide such information. In some cases, media may convey the information as part of a local news segment without charging an advertising fee. For example, Delaware election officials said that they provide information to the local TV news network to promote National Voter Registration Day, and officials in another local jurisdiction said they shared information with media outlets when the state introduced online registration. Officials may also use free-of-charge social media accounts to provide information. Additionally, as noted earlier in this report, states that participate in ERIC are required by the program to mail information to potentially eligible, unregistered individuals to provide information about opportunities to register. The costs of these mailings can be affected by the format the state chooses for its mailing (e.g., postcard or letter) as well as the number of potentially eligible, unregistered individuals ERIC identifies in the state.
Other outreach efforts may be targeted at registered voters to inform them about the particular details regarding an upcoming election. In some cases, states or local jurisdictions are required by state law to provide certain types of information to registered voters. For example, in Colorado, both the state and local jurisdictions are required to mail information to voters when there are ballot issues that affect debt or taxes.62 In Rhode Island, the Secretary of State must mail a voter information handbook that lists all state questions and explanations of the subjects of these questions to each residence, while local jurisdictions, prior to each local election at which public questions are on the ballot, may mail similar voter information handbooks listing public questions and explanations of the subjects of the questions to each residence in lieu of posting the information in public locations and publishing it in a local
62Colo. Const. art. X, § 20, cl. 2-4.

Page 39 GAO-16-630 Registering Voters and Administering Elections
newspaper.63 One jurisdiction we visited spent about $75,000 for printing and mailing a state-required notice for an election in 2013.
State election officials may also need to ensure that potential voters are informed about, and have access to, forms of ID required to vote in that state. In general, many states that require a government-issued photo ID for voting offer some form of ID free of charge.64 However, voters may incur costs—either monetary or time costs—for obtaining ID, as discussed later in this report. States may make IDs available free of charge for residents for voting purposes in a variety of ways—including providing them through the DMV or through the state election office. For example, in Rhode Island, the Secretary of State’s office purchased equipment to produce voting ID cards, and individuals can obtain these cards free of charge by visiting the Secretary of State’s office. The equipment is portable, and staff from the Secretary of State’s office also bring the equipment to various events to provide additional opportunities to obtain a voting ID card. Therefore, in addition to the costs for the ID equipment, the state incurs staff time cost for attending local events. The National Conference of State Legislatures reported that Indiana’s estimated production costs—including staff time, transaction time, and manufacturing—for providing 168,264 IDs to voters in 2010 exceeded $1.3 million.65 The Brennan Center reported that this estimate did not include costs such as training and voter education and outreach.66 Some states have prepared fiscal notes to accompany pending legislation that demonstrate how much providing voters with free IDs could cost. Although a proposed voter ID law did not pass in Minnesota, the state estimated that providing voter ID at 90 locations across the state would cost the state at least $250,000 in the first year of implementation, with recurring costs in future years. The state noted that individuals who lack
63R.I. Gen. Laws §§ 17-5-1.1, 17-5-1, 17-8-10. 64For more information about voter ID requirements, see GAO-13-90R and GAO, Elections: Issues Related to State Voter Identification Laws, GAO-14-634 (Washington, D.C.: Sept. 19, 2014). 65National Conference of State Legislatures, “Elections and the Economy: The Cost of Voter ID Requirements,” The Canvass: States and Election Reform (Denver, Colorado: February 2011). 66Agraharkar, Vishal; Wendy Weiser, and Adam Skaggs, The Cost of Voter ID Laws: What the Courts Say (New York, New York: The Brennan Center at New York University School of Law, 2011).

Page 40 GAO-16-630 Registering Voters and Administering Elections
ID tend to change residences more often than the average person, which may affect supply costs. Minnesota’s estimate also noted that county auditors would incur substantial expenses related to providing the IDs, including designating and housing locations where voter ID could be obtained, processing the applications for voter ID cards, issuing and producing the cards, as well as receiving returned cards when residents change their residence. Additionally, the state’s cost estimate noted that municipal governments would need to hire additional poll workers to accommodate the additional time needed for asking for an ID from each voter as well as handling provisional ballots for individuals who did not bring ID with them to the polls. The state estimated that the local government costs for additional poll workers could range from $375,830 to $536,900 for each statewide election.67
The different registration methods offered within states can influence costs—the use of paper forms involves paper and printing costs, among others, whereas an online registration option involves information technology development and maintenance costs. The U.S. Public Interest Research Group, a coalition of state public interest research groups, released a study in 2009 of 100 counties of various sizes in 36 states that estimated that these counties’ cost to conduct registration and run error-correction programs on the voter registration information was $33,467,910 for the 2008 election.68 According to the report, in counties in the survey with populations under 50,000, total expenditures were estimated at $86,977 per county; in counties with population between 50,000 and 200,000 persons, the total expenditures were $248,091 per county; and, in counties with total populations greater than 200,000 the total expenditures per county were estimated to average $1,079,610. The report also noted that in a survey of a subset of the 100 counties (9 counties from each of the three population ranges), most counties reported that full-time registrar staff spent at least half their time on
67Minnesota Secretary of State, Fiscal Note – 2009-10 Session, Bill No. H0057-0 (Feb. 3, 2009). In Minnesota, municipal governments (e.g., cities and townships) are responsible for appointing poll workers. 68Lisa Gilbert, U.S. Public Interest Research Group, Saving Dollars, Saving Democracy: Cost Savings for Local Election Officials through Voter Registration Modernization, 2009. These amounts generally reflect the costs for paper-based registration. At the time of the 2008 election, Arizona and Washington were the only states to offer online registration. Among the counties surveyed, six were in Arizona and Washington, with each of the three population categories (under 50,000, between 50,000 and 200,000, and between 200,000 and 1,000,000) being represented by one county in each state.
Costs for Registering Individuals

Page 41 GAO-16-630 Registering Voters and Administering Elections
registration issues.69 However, since the 2008 election, a total of 31 states and Washington, D.C., have implemented online voter registration which, as discussed earlier in this report, may involve initial investments, but may later result in time and cost savings to local election officials who spend less time processing electronic registrations than paper registrations. As reported earlier, improved efficiencies in processing registration can reduce the number of staff needed to process registration or may free up staff to attend to other responsibilities.
States and local jurisdictions can also incur costs for voter registration list maintenance activities, and these activities vary across states and local jurisdictions. For example, some states or local jurisdictions may send mailings to all registered voters and use any returned undeliverable mail as an indication that a voter is not currently residing at the address on the voter’s registration record. States may also participate in the data-sharing efforts mentioned earlier in this report or checks against other data sources. For example, state and local election officials can compare their voter registration lists against databases such as the U.S. Postal Service NCOA database to determine whether an individual has moved to a new address or Social Security Administration records to determine if an individual is deceased.
States provide opportunities to vote, such as voting in-person on or before Election Day or voting by mail (absentee options in all states and vote-by-mail in three states). These different voting methods also result in different types of costs—for example:
• Polling Places. Election officials in jurisdictions that offer in-person voting options locate and prepare polling places and organize and deliver voting equipment and supplies to polling places. The costs for establishing in-person polling locations can vary by state and local jurisdiction. According to officials in one local jurisdiction we visited, their office pays a $125 daily rental fee for polling places that are in privately owned buildings and, for public buildings, the jurisdiction pays only the marginal costs of keeping the buildings open before or
69The counties surveyed on this issue include counties from Arizona and Washington, which had implemented online registration prior to the 2008 election. Among the 27 counties surveyed regarding the percentage of staff time allocated to registration activities, 1 county was in Arizona (population between 50,000 and 200,000) and 1 county was in Washington (population less than 50,000). Both these counties reported spending 75 percent or more of their full-time registrar staff’s time on registration activities.
Costs for Providing Voting Opportunities

Page 42 GAO-16-630 Registering Voters and Administering Elections
after regular hours for voting purposes. In contrast, in Delaware, the fiscal year 2016 state appropriations act requires election jurisdictions to pay owners of polling locations a $300 daily rental fee, regardless of whether the building is publicly or privately owned. The total costs for polling places can vary because of any fees to use the facility, the number of days the facility is used for voting (e.g., early voting in addition to Election Day), and the number of polling places in a given jurisdiction. Among the jurisdictions we visited that primarily offer in-person voting opportunities, according to election officials in those jurisdictions, the number of polling places ranged from 3 to about 1,800.
• Election Workers. Costs for recruiting, training, and paying poll workers at polling places can also vary—for example, election officials in jurisdictions in the three states we visited that offer primarily in-person voting—Delaware, Illinois, and Rhode Island—cited poll worker compensation ranging from $100 to $235 per day, with variations across and within states and by level of responsibility.70 Regardless of whether states offer voting in person or by mail, election offices may need to hire temporary staff to assist with the additional workload in the weeks leading up to or following an election. For example, Colorado voters have the option of voting by mail or in person at voter service and polling centers, which can be partially staffed with permanent staff from election offices, but local jurisdictions also hire additional workers to assist at these polling locations or with other election activities. Similarly, Oregon does not have in-person polling locations, yet local election officials we spoke with said that they hire temporary staff to assist with a range of elections responsibilities, including registration and ballot processing, during the peak workload period surrounding an election.71
70States and local jurisdictions can assign different responsibilities to different classifications of poll workers, and compensation can vary based on the responsibilities assigned. For example, in Rhode Island, (1) moderators and wardens are the lead poll workers responsible for a given polling place; (2) clerks are responsible for handling ballots and ballot accounting; and (3) supervisors are responsible for processing voters as they approach the supervisors’ tables, matching the voter’s name on the precinct poll book, and assisting the warden or moderator as needed. 71Registrants in Oregon receive their ballots by mail and have the option of returning them by mail or in-person to designated drop boxes or the county election office. Under specific circumstances, such as if a registrant has a lost or damaged ballot, a registrant may obtain a ballot in person at the election office and return the ballot in person during the same visit after marking his or her selections on the ballot.

Page 43 GAO-16-630 Registering Voters and Administering Elections
• Vote-by-Mail and Absentee Ballots. Preparing ballots to be mailed to voters in vote-by-mail states, or to absentee voters in states that continue to offer in-person voting, involves printing costs for ballots and envelopes and postage costs for delivering the ballots to voters. For example, in one large, urban local jurisdiction we visited in a vote-by-mail state, the ballot printing costs for a 2013 statewide election were over $280,000, and according to officials, postage costs to mail these ballots were about $32,000. In Rhode Island, which conducts primarily in-person voting, the state assumes the costs for all absentee ballots, including printing the ballots, mailing them to voters, and processing the ballots.72 Rhode Island election officials said that the use of absentee voting has increased since the state broadened the allowed excuses for requesting an absentee ballot, and thus the costs for absentee ballots have increased. However, to ensure that no in-person polling place experiences a ballot shortage, the state has continued to print enough ballots for in-person voting for all registered voters in every precinct. The costs for mailed ballots may also include return postage—for example, Rhode Island state election officials said that the state pays return postage for absentee ballots for homebound voters.73
The magnitude of costs for any particular expense category can vary based on the voting opportunities offered. For example, the total costs for poll workers—who may be paid for each day of work—can increase if early voting is offered and poll workers are needed to staff polling places on days in addition to Election Day. Similarly, the total costs for polling places can depend on the number and types of polling places within an election jurisdiction. A state or local jurisdiction’s costs can also depend on how many elections there are over a given period of time—although some states have standardized election calendars that consolidate federal, state, and local elections at the same times, other states may
72The Secretary of State’s office is responsible for printing all ballots, mailing absentee ballots, and delivering ballots for in-person voting to the State Board of Elections, which then distributes the ballots along with other supplies to polling places. All absentee ballots are addressed to be returned to the State Board of Elections, which is responsible for processing the results and adding them to the in-person voting results reported by local jurisdictions. 73These voters certify on their application for an absentee ballot that they are incapacitated to the extent that it would be an undue hardship to vote at the polls because of illness, or mental or physical disability, blindness, or serious impairment of mobility. See R.I. Gen. Laws §§ 17-20-9, 17-20-10.
Page 44 GAO-16-630 Registering Voters and Administering Elections
have multiple elections at different times for different levels of government. Special elections can also affect the total costs for conducting elections by increasing the number of elections.
Quantifying the costs for all election activities is difficult for several reasons, including that multiple parties incur costs associated with elections and these parties may track costs differently. Although some parties’ costs can be easily identified in state and local budgets or other cost-tracking documents, other costs may be difficult to break out or attribute to election activities. Therefore, adding up the budgets for all election jurisdictions within a state together with the budget for the state election office is not a comprehensive or accurate means for determining the cost of elections within a given state. Such budget or cost-tracking documents also do not include the cost to voters, and voters’ costs are additionally difficult to quantify and monetize because individual voters’ circumstances differ.
States and local election jurisdictions have developed their own methods of tracking election activities and associated costs through documents such as budgets, accounting systems, or spreadsheets. The budgets for state and local election offices are one way of identifying and tracking costs associated with elections. However, there is no standard budget scheme across all states or local election jurisdictions for categorizing the various elections activities and their associated costs. For example, state and local jurisdictions use different time frames for their budgeting process. According to the National Association of State Budget Officers, 30 states prepare annual budgets, while 20 states prepare biennial budgets, though the association reports that in practice, a number of states use a combination of annual and biennial budgeting.74 The months covered by budgets can also vary, which provides important context for elections budgets because of how many elections fall within the period
74National Association of State Budget Officers, Budget Processes in the States, (Washington, D.C.: Spring 2015).
Election Costs are Difficult to Quantify
Page 45 GAO-16-630 Registering Voters and Administering Elections
covered by a budget.75 This can affect how costs for elections are distributed across different fiscal years’ budgets. For example, two local jurisdictions we visited in the same state have fiscal years that span different periods such that their fiscal years cover a different number of elections—for one jurisdiction, the presidential primary, general election primary, and general election will occur in fiscal year 2016, and for the other the presidential primary will occur in fiscal year 2016 and the general election primary and general election will occur in fiscal year 2017.
Election offices may also maintain accounting records, spreadsheets, or other documents that provide varying levels of detail on elections costs. Within these cost-tracking documents, state or local jurisdictions can use different categories to organize their elections expenses. For example, across three local jurisdictions we visited in different states, all three local jurisdictions track costs in a postage category but use varying categories to capture the costs for supplies. Specifically, one jurisdiction has a single category for “signage, forms, and all other supplies,” whereas the other two jurisdictions have additional categories—one jurisdiction has categories for office supplies and toner cartridge and ribbons, and the other jurisdiction has categories for computer supplies, map supplies, office supplies, and supplies and equipment. As such, cost information may not be standardized across or within states, and thus it may not be possible to calculate the costs for a particular election activity or expense across jurisdictions because the information is captured or reported in different ways.
Some states have implemented efforts to standardize cost tracking for elections across local election jurisdictions in their states. For example, the Oregon and Colorado state election offices collect election cost data from local jurisdictions within their states. Oregon state officials said that
75Four of the five states we visited prepare budgets that cover a 1-year period from July 1 through June 30, and the fifth state prepares budgets that cover a 2-year period from July 1 of an odd-numbered year through June 30 of the next odd-numbered year. The date ranges for fiscal years also varied among the 11 local election jurisdictions we visited—six of the jurisdictions’ fiscal years covered July 1 through June 30, two jurisdictions’ fiscal years covered January 1 through December 31, one jurisdiction’s fiscal year covered April 1 through March 31, one jurisdiction’s fiscal year covered December 1 through November 30, and one jurisdiction was funded by a city and county with different fiscal year date ranges (January 1 through December 31 for one budget and December 1 through November 30 for the other budget).

Page 46 GAO-16-630 Registering Voters and Administering Elections
the data they collect are used to summarize information about the costs of an election—state officials compile the total costs for each county and calculate, per county and statewide, the average cost per eligible voter and the average cost per ballot cast for each statewide election and track these costs over time. Colorado state officials explained that the state developed a standardized cost tracking form to determine the costs of elections for local jurisdictions, particularly given that the state is statutorily required to reimburse local jurisdictions when there is a state measure on a ballot.76 Although both states have developed methods of collecting cost information from local jurisdictions in a standardized way, the categories these two states use in their cost-tracking forms are different. Other states collect information on certain expenses, but do not standardize broad cost information across jurisdictions to calculate the overall costs of an election—for example, state election officials in Illinois said that local jurisdictions incur the majority of election-related costs, but the state reimburses a portion of the poll worker cost and thus collects limited cost information on poll workers from local jurisdictions for reimbursement purposes.
Identifying elections costs can also be difficult when the office that is tasked with administering elections responsibilities also has responsibility for activities other than elections. Specifically, the cost information tracked by such offices may include costs that are not related to elections, and thus it may be difficult to separate elections costs from costs incurred for other activities and responsibilities. For example, in some locations a county, city, or town clerk is responsible for overseeing elections as well as other functions. In one local jurisdiction we visited, the clerk’s office was responsible for administering elections as well as issuing licenses (marriage, dogs, yard sales, hunting, and fishing) and maintaining public records (birth certificates, death certificates, and probate records). The clerk for canvassing in this location is primarily responsible for administering elections, but all staff within the clerk’s office assist with elections activities such as answering phone calls from residents with registration and voting questions.
Additionally, some elections-related activities may rely on support from other state or local offices that do not have primary responsibility for administering elections. For example, election offices may receive
76See Colo. Rev. Stat. § 1-5-505.5.

Page 47 GAO-16-630 Registering Voters and Administering Elections
support from offices that provide legal or information technology support. In some cases, for these other offices, it may be possible to identify the costs associated with elections-related activities, but in other cases, it may be difficult to separate elections-related costs from regular operating costs. For example, in one local jurisdiction we visited, all county offices use the same accounting system, which enables offices other than the Elections Division to charge expenses to the Elections Division accounting code so those offices can be reimbursed for elections-related expenses. In contrast, the state elections director in Rhode Island said that during busy periods around Election Day, employees from divisions of the Secretary of State’s office other than the Elections Division assist state election officials, but the budgets for these other divisions do not separate staff time by activity to identify what proportion of time is spent on their primary activities in those other divisions and what proportion is spent on election-related activities.
In addition to costs to state and local jurisdictions, voters also incur costs associated with elections. Some costs to voters are monetary, though not all voters will incur these costs to the same extent. Voters may incur postage costs for submitting forms or returning a mail ballot. The cost for a first-class stamp is $0.47, although additional postage may be required if a ballot has numerous pages that exceed 1 ounce in weight. However, not all voters rely on mail to submit their registration applications or cast a ballot, and in some cases even those that do may not incur the cost associated with postage. For example, in Rhode Island, absentee voters who certify that they fit particular criteria receive an absentee ballot that does not require return postage; rather, the state incurs the return postage cost for those ballots.77 Additionally, voters can incur costs for transportation to the designated registration and voting locations. This can include public transportation fares as well as the cost of fuel/mileage for the use of a private vehicle, and the amounts for these costs will vary by voter. Further, some states require voters to show specific forms of ID to be able to vote. Some voters may have the required ID for everyday purposes—such as drivers’ licenses—whereas others may need to obtain
77These voters certify in their absentee ballot application that they are incapacitated to the extent that it would be an undue hardship to vote at the polls because of illness, or mental or physical disability, blindness, or serious impairment of mobility.
Page 48 GAO-16-630 Registering Voters and Administering Elections
such ID specifically for the purposes of voting.78 For individuals who need to obtain ID for voting purposes, the costs and requirements to obtain certain forms of ID, including a driver’s license, nondriver state ID, or free state ID, vary by state. For example, a voter may be required to present documentation to obtain such IDs—including the free state IDs offered for voting purposes—and the underlying documents, such as a birth certificate, can result in costs to voters as well.
However, voters also incur costs associated with time, for which it may be difficult to assign a dollar amount. For example, voters may spend time registering to vote, researching candidates and issues, obtaining required ID, traveling to a polling place, and casting a ballot. The time required for these activities can vary based on the options available to the voter—for example, voters who vote by mail (either as absentee voters or because they are in a vote-by-mail state) receive their ballots by mail and do not wait in line as voters who vote in person may have to do.79 The costs of spending time on these voting processes rather than some other activity result in an opportunity cost to voters, and these opportunity costs may vary by voter based on numerous factors, including each voter’s individual competing priorities as well as the range of options available for how to register or vote. For example, options that increase voter convenience reduce the amount of time a voter spends registering or voting instead of engaging in some other activity, thus reducing the opportunity cost of voting. Ultimately, an individual’s decision about whether to participate in the voting process—first, deciding whether to register to vote, then deciding whether to cast a ballot—can be seen as a consideration of the costs and benefits of voting for that individual, and not all individuals experience the same costs for participating.
We provided a draft of this report to the EAC and the state and local election officials and DMV officials we met with in our five selected states. The EAC had no comments on the draft report, as noted in an e-mail received on June 23, 2016, from the commission’s Executive Director.
78We have previously reported on literature that estimated the rates of ownership of driver’s licenses or state-issued IDs in selected states or nationwide. The 10 studies we reviewed estimated, depending on the study, that ownership rates among registered voters ranged from 84 to 95 percent. For more information about voter ID requirements, including costs to voters for obtaining ID, see GAO-14-634. 79For more information about voter wait times, see GAO-14-850.
Agency and Third Party Comments
Page 49 GAO-16-630 Registering Voters and Administering Elections
We incorporated technical comments received from other parties in the report as appropriate.
We are sending copies of this report to the EAC, appropriate congressional committees and members, and other interested parties. In addition, the report is available at no charge on the GAO website at http://www.gao.gov. If you or your staff have any questions about this report, please contact me at (202) 512-8777 or [email protected]. Contact points for our Offices of Congressional Relations and Public Affairs may be found on the last page of this report. GAO staff who made key contributions to this report are listed in appendix VI.
Rebecca Gambler Director, Homeland Security and Justice

Page 50 GAO-16-630 Registering Voters and Administering Elections
List of Requesters
The Honorable Elijah E. Cummings Ranking Member Committee on Oversight and Government Reform House of Representatives
The Honorable Joaquin Castro House of Representatives
The Honorable Danny K. Davis House of Representatives
The Honorable Tammy Duckworth House of Representatives
The Honorable Marcia L. Fudge House of Representatives
The Honorable Eddie Bernice Johnson House of Representatives
The Honorable Hank Johnson House of Representatives
The Honorable Robin L. Kelly House of Representatives
The Honorable John Lewis House of Representatives
Appendix I: States’ Use of Provisional Ballots, 2008 – 2014
Page 51 GAO-16-630 Registering Voters and Administering Elections
Section 302 of the Help America Vote Act (HAVA) established provisional voting requirements.1 Specifically, potential voters who declare that they are registered to vote in the jurisdiction in which they desire to vote must be permitted to cast provisional ballots in the event their names do not appear on the registration list or the voters’ eligibility is challenged by an election official. In general, the issuance of a provisional ballot can be described as a safety net or fail safe for the voter, in that (1) it maintains the person’s intent to vote and voting selections until election officials determine that the person does or does not have the right to cast a ballot in the election, and (2) it allows the determination of the voter’s eligibility to be made at a time when more complete information is available either from the voter or from the election jurisdiction. Election officials make the decision on whether to count provisional ballots based on voter eligibility standards established in state and federal law, including age, citizenship, and residence requirements. The policies and procedures for administering provisional voting vary across states. For example, in some states, a person can cast a provisional ballot in any precinct in the state regardless of where the person is registered. In other states, a person must cast a provisional ballot in the precinct in which the person is eligible to vote.
Data on the overall number of provisional ballots cast are available through the Election Assistance Commission’s (EAC) Election Administration and Voting Survey (EAVS), which the EAC administers to states and U.S. territories after each general election. States report the data at the level of individual election jurisdictions. Table 2 below presents the percent of provisional ballots cast as a percentage of the total number of participating voters. In some cases, states do not provide data on the number of provisional ballots cast in some jurisdictions. To ensure the reliability of the data we present, table 2 omits data from any state where, in a given year, 20 percent or more of the local jurisdictions within the state did not provide data on provisional ballot use. To further assess the reliability of the 2008 through 2014 EAVS data, we interviewed EAC officials regarding their data collection and quality control processes. We found the data to be sufficiently reliable for the purposes of our review.
152 U.S.C. § 21082(a).
Appendix I: States’ Use of Provisional Ballots, 2008 – 2014
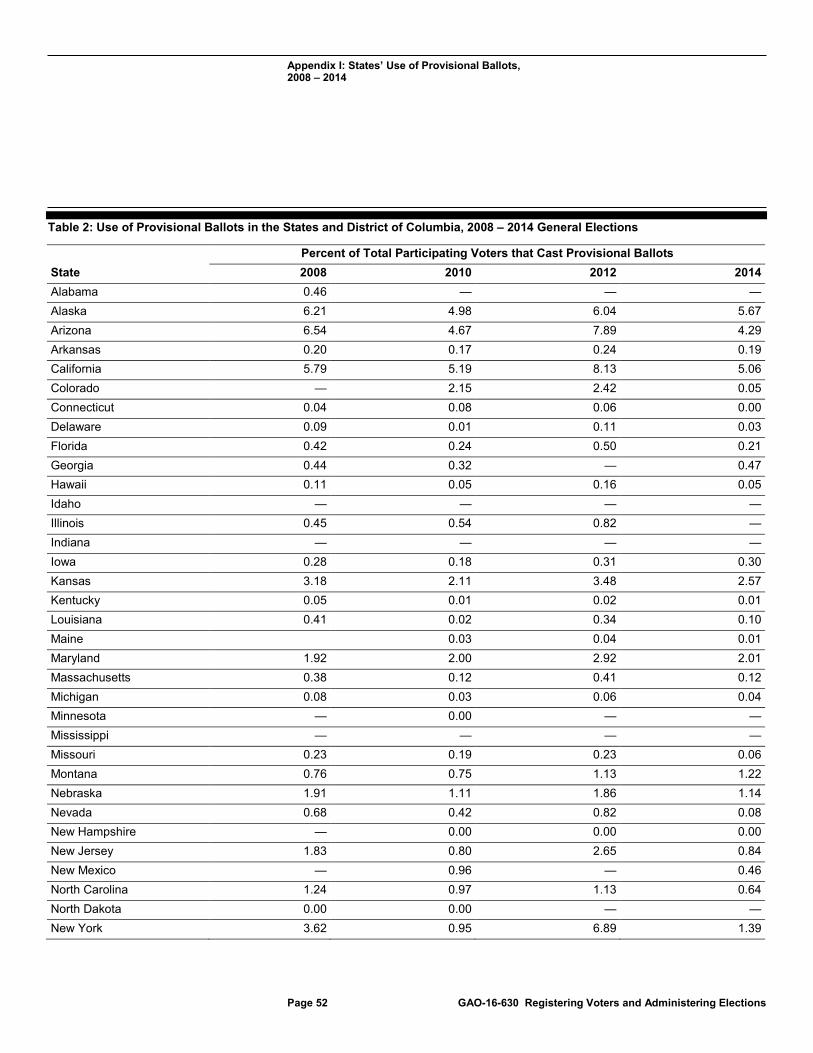
Appendix I: States’ Use of Provisional Ballots, 2008 – 2014
Page 52 GAO-16-630 Registering Voters and Administering Elections
Table 2: Use of Provisional Ballots in the States and District of Columbia, 2008 – 2014 General Elections
Percent of Total Participating Voters that Cast Provisional Ballots State 2008 2010 2012 2014 Alabama 0.46 — — — Alaska 6.21 4.98 6.04 5.67 Arizona 6.54 4.67 7.89 4.29 Arkansas 0.20 0.17 0.24 0.19 California 5.79 5.19 8.13 5.06 Colorado — 2.15 2.42 0.05 Connecticut 0.04 0.08 0.06 0.00 Delaware 0.09 0.01 0.11 0.03 Florida 0.42 0.24 0.50 0.21 Georgia 0.44 0.32 — 0.47 Hawaii 0.11 0.05 0.16 0.05 Idaho — — — — Illinois 0.45 0.54 0.82 — Indiana — — — — Iowa 0.28 0.18 0.31 0.30 Kansas 3.18 2.11 3.48 2.57 Kentucky 0.05 0.01 0.02 0.01 Louisiana 0.41 0.02 0.34 0.10 Maine 0.03 0.04 0.01 Maryland 1.92 2.00 2.92 2.01 Massachusetts 0.38 0.12 0.41 0.12 Michigan 0.08 0.03 0.06 0.04 Minnesota — 0.00 — — Mississippi — — — — Missouri 0.23 0.19 0.23 0.06 Montana 0.76 0.75 1.13 1.22 Nebraska 1.91 1.11 1.86 1.14 Nevada 0.68 0.42 0.82 0.08 New Hampshire — 0.00 0.00 0.00 New Jersey 1.83 0.80 2.65 0.84 New Mexico — 0.96 — 0.46 North Carolina 1.24 0.97 1.13 0.64 North Dakota 0.00 0.00 — — New York 3.62 0.95 6.89 1.39
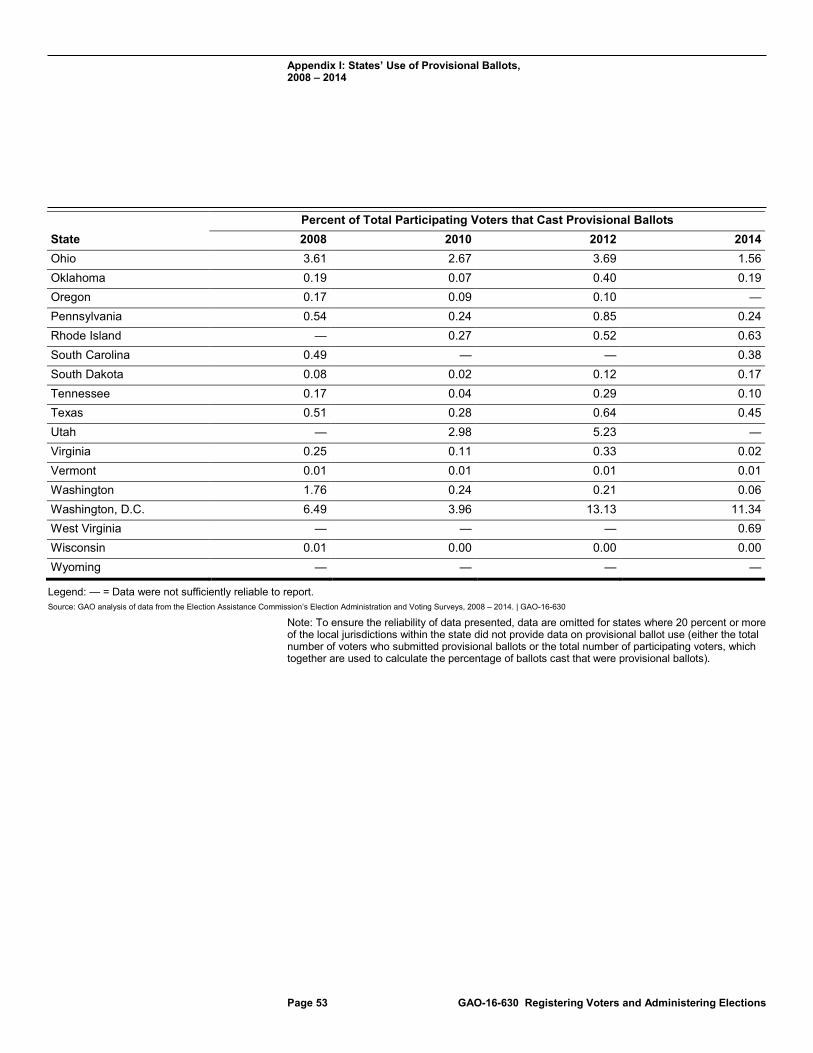
Appendix I: States’ Use of Provisional Ballots, 2008 – 2014
Page 53 GAO-16-630 Registering Voters and Administering Elections
Percent of Total Participating Voters that Cast Provisional Ballots State 2008 2010 2012 2014 Ohio 3.61 2.67 3.69 1.56 Oklahoma 0.19 0.07 0.40 0.19 Oregon 0.17 0.09 0.10 — Pennsylvania 0.54 0.24 0.85 0.24 Rhode Island — 0.27 0.52 0.63 South Carolina 0.49 — — 0.38 South Dakota 0.08 0.02 0.12 0.17 Tennessee 0.17 0.04 0.29 0.10 Texas 0.51 0.28 0.64 0.45 Utah — 2.98 5.23 — Virginia 0.25 0.11 0.33 0.02 Vermont 0.01 0.01 0.01 0.01 Washington 1.76 0.24 0.21 0.06 Washington, D.C. 6.49 3.96 13.13 11.34 West Virginia — — — 0.69 Wisconsin 0.01 0.00 0.00 0.00 Wyoming — — — —
Legend: — = Data were not sufficiently reliable to report. Source: GAO analysis of data from the Election Assistance Commission’s Election Administration and Voting Surveys, 2008 – 2014. | GAO-16-630
Note: To ensure the reliability of data presented, data are omitted for states where 20 percent or more of the local jurisdictions within the state did not provide data on provisional ballot use (either the total number of voters who submitted provisional ballots or the total number of participating voters, which together are used to calculate the percentage of ballots cast that were provisional ballots).

Appendix II: Objectives, Scope, and Methodology
Page 54 GAO-16-630 Registering Voters and Administering Elections
This report addresses the following questions:
1. What are the reported benefits and challenges of efforts to collect and share voter registration information electronically?
2. What is known about the effect of selected policies and practices on voter turnout?
3. What is known about the costs of elections?
For all three questions, we (1) reviewed and analyzed relevant literature and (2) conducted interviews with state and local jurisdiction election officials from five selected states, Colorado, Delaware, Illinois, Oregon, and Rhode Island. For the question regarding voter registration efforts, we also analyzed data from the U.S. Census Bureau’s Current Population Survey (CPS) Voting and Registration Supplement for general elections occurring from 2008 through 2014 to determine the extent to which policies to collect and share voter information electronically may improve the accuracy of voter registration lists.
We identified selected efforts and policies within the scope of each question to examine in detail in this review. Specifically, in examining efforts to collect and share voter registration information electronically, we limited the scope of our review to online voter registration, data-sharing efforts between the state election office and the state motor vehicle agency, and interstate exchanges of voter registration information, including states’ participation in the Electronic Registration Information Center (ERIC). We selected ERIC as an illustrative example of such interstate voter registration data-sharing efforts. We interviewed representatives of ERIC and reviewed documentation regarding requirements for participation. Regarding the effect of policies and practices on voter turnout, we limited our review to policies and practices that have been rigorously studied in academic and professional literature and that election officials have implemented or could potentially implement in their states or local jurisdictions. Additional information on how we identified these policies through a literature review is discussed below. In examining the costs of elections, we reviewed information about the costs to states and local election jurisdictions, as well as the cost to voters. We did not examine campaign or other third party costs.
We conducted a literature review of research related to our three objectives. A GAO research librarian conducted searches of scholarly and peer reviewed publications; government reports; dissertations;
Appendix II: Objectives, Scope, and Methodology
Literature Review

Appendix II: Objectives, Scope, and Methodology
Page 55 GAO-16-630 Registering Voters and Administering Elections
conference papers; books; association, think tank, and other nonprofit organizations’ publications; working papers; and general news articles published from 2002 through 2015 to identify publications that were potentially relevant to each objective.1 We also reviewed literature recommended by experts and researchers affiliated with organizations such as the Congressional Research Service, the National Conference of State Legislatures, the National Association of Counties, and the Bipartisan Policy Center. The literature search produced over 1,000 publications related to the topics in our three objective questions. GAO analysts worked in pairs to complete the following steps:
1. We reviewed each publication’s abstract and determined whether the publication was potentially relevant to one or more of our objectives.
2. For those publications we determined to be relevant, we reviewed the full text, to determine whether the publication provided evidence that could be used to directly address one of our objectives. Each analyst reviewed the publication independently, then reached consensus within the pair.
For each objective, we analyzed the evidence presented in the relevant publications using a data collection instrument specific to each objective.
Regarding efforts to collect and share voter registration information electronically, we used a data collection instrument to catalog the benefits and challenges of the efforts within the scope of our review. For every publication determined to be relevant to this objective, one analyst reviewed the full text version, highlighted the benefits and challenges that the article identified, and entered that information into the data collection instrument. A second analyst compared the information entered in the data collection instrument against the original publication and noted any discrepancies. The pair of analysts discussed any discrepancies noted until they reached a consensus on the benefits and challenges identified within that publication.
1We selected 2002 because the enactment of the Help America Vote Act in 2002 had implications for voter registration efforts and other policies that may affect voter turnout. However, we limited our searches for information on election-related costs to a 10-year period (from 2005 through 2015) to ensure the search results we obtained were manageable.
Literature on Voter Registration Efforts

Appendix II: Objectives, Scope, and Methodology
Page 56 GAO-16-630 Registering Voters and Administering Elections
Research on voter turnout has examined a wide range of policies and practices (hereafter “policies”), and in reviewing the over 400 publications our search identified as related to voter turnout, we focused our review on policies that have been or could potentially be implemented by a state or local government. Thus, we excluded research on policies that could not reasonably or feasibly be implemented by a state or local government, including partisan policies—such as using partisan language in mailings to potential voters—and policies that would be resource-intensive, such as door-to-door canvassing. In order to provide a reasonable and useful synthesis of the literature, we further limited our scope by excluding research on policies that did not have a federal nexus to voting (such as how turnout in local elections is affected by consolidating local elections with state or federal elections), or examined alternative voting systems (e.g., ranked-choice or compulsory voting), or voter identification laws.2
The publications we reviewed often conducted multiple analyses or experiments. As used in this report, a “study” is an analysis or experiment with a unique sample. In some cases, authors presented their findings broken down by type of election (e.g., presidential vs. midterm) or election year (e.g., 2002 and 2004). In these instances, we considered the findings related to the separate types of elections or time periods as resulting from separate samples (thus, separate “studies,” as we use the term in this report).3 In reviewing the results from our literature review, as discussed in greater detail below, we excluded studies that assessed the combined effect of two or more policies (because such studies would not enable us to determine the effect of each policy independent of the other or others), analyzed policies using data for elections outside of the United States, or assessed a policy’s effect on over or under votes.
2We excluded research that examined voter identification laws because we examined this topic specifically in GAO, Elections: Issues Related to State Voter Identification Laws, GAO-14-634 (Washington, D.C.: Sept. 19, 2014). 3For instance, in one publication, the authors used the same analytical approach to examine the effect of a policy on voter turnout from 1972 through 2002, and reported their findings separately for presidential and midterm elections. Thus, we considered these findings as resulting from analysis related to two unique samples (studies). Another publication used the same analytical approach to examine the effect of a policy in presidential elections from 2000 through 2008, and authors reported their findings separately for the 2000, 2004, and 2008 elections. Thus, we considered these findings as resulting from analysis related to three unique samples (studies).
Literature on Voter Turnout

Appendix II: Objectives, Scope, and Methodology
Page 57 GAO-16-630 Registering Voters and Administering Elections
1. Cataloguing publications based on policies within our scope: A GAO analyst reviewed each publication, and recorded (a) what policy or policies the publication addressed that were within our scope, (b) whether the publication used one or more systematic quantitative methodologies, and (c) whether or not the publication used original data analysis in at least one or more analyses. A second GAO analyst verified these determinations and worked with the first analyst to ensure both analysts were in agreement. Based on these reviews, we identified publications that analyzed one or more policies within our scope, used one or more systematic quantitative methodologies, and contained original analysis.
2. Identifying specific studies that used sufficiently rigorous methods: A GAO social scientist reviewed the publications identified in the first step to identify studies within these publications for which the design, implementation, and analyses were sufficiently sound to support the results and conclusions, based on generally accepted social science principles. Specifically, the social scientist examined such factors as whether data were analyzed before and after policy changes were made; how the effects of policy changes were isolated (i.e., the use of groups or states not receiving the change, or statistical controls); the appropriateness of sampling, if used; outcome measures; and the statistical analyses used. A second GAO social scientist verified these determinations and worked with the first social scientist to ensure both were in agreement. A statistician reviewed studies when additional expertise was necessary to interpret findings from studies that used advanced statistical techniques or to ensure that researchers who analyzed complex survey data employed appropriate sample weights when reporting findings.
To ensure that there was a sufficient body of research on each policy we selected, we excluded policies that were not examined in at least two publications.
As a result of this process, from more than 400 publications we initially identified related to voter turnout, we found 53 that studied policies within the scope of our review and used sufficiently sound methodologies. Within these publications, 118 studies examined a total of 11 policies.4
4For purposes of our review, we classified relevant chapters in edited books as separate publications. We did this because it was in keeping with how we categorized other publications (usually journal articles written by distinct authors).

Appendix II: Objectives, Scope, and Methodology
Page 58 GAO-16-630 Registering Voters and Administering Elections
The studies we reviewed used various quantitative approaches and data, and covered different types of elections and time periods. Some studies used randomized experiments or quasi-experimental research designs, and some studies used non-experimental designs, such as statistical analysis of observational data. Studies used both longitudinal and cross-sectional comparisons. Similarly, some studies used data obtained directly from official state or local voter records (or from vendors or others that compiled official voter records), and some used survey responses, such as from the CPS Voting and Registration Supplement. The studies we reviewed also covered different types of elections (e.g., presidential, midterm, primary, statewide, local, or various combinations of these) and time periods (with studies ranging from addressing one election to multiple elections and ranging from 1920 to 2014).
Further, some studies examined the separate effects of more than one policy on voter turnout,5 and some studies reported more than one finding related to the effect of a given policy on turnout. For instance, some studies analyzed turnout data using multiple statistical models, resulting in multiple findings (one from each model). Additionally, other studies reported more than one finding because they broke down their results by subsamples, such as by race or by treatment groups associated with variations in policy implementation.6 Where studies reported one or more effects on turnout for a given policy, we reported a range of effects.7
5For example, one study assessed the effects of several election policies (same day registration, no-excuse absentee voting, and early in-person voting) on turnout, and the construction of the model used in the analysis allowed the authors to determine the separate effects of each policy (i.e., how same day registration affected turnout, how no-excuse absentee voting affected turnout, and how early in-person voting affected turnout). This is in contrast to studies that examined the combined effects of two or more policies on turnout. As noted previously, we excluded studies that assessed the combined effect of two or more policies on turnout because such studies would not enable us to determine the effect of each policy independent of the other or others. 6For example, one study examined early in-person voting and presented separate findings for the policy’s effect on turnout based on whether or not states included in the analysis permitted local election administrators to offer early in-person voting on at least one weekend prior to Election Day. 7For instance, one study may have reported a 1 percentage point increase in turnout for one subsample and a 3 percentage point increase in turnout for another subsample, resulting in a range of 1 to 3 percentage point increases in our summary of this study’s findings.

Appendix II: Objectives, Scope, and Methodology
Page 59 GAO-16-630 Registering Voters and Administering Elections
Moreover, not all studies reported findings that were statistically significant (at least at the 0.10 level). Many studies did not detect a statistically significant effect, or reported a finding that was not statistically significant along with a statistically significant effect.8 When a study reported one or more findings that were not statistically significant, this did not mean that the policy examined did not have an effect on turnout, only that the study could not affirmatively reject the possibility that the policy had no effect on turnout.
For each of the 118 studies, a GAO social scientist reviewed each of the study’s findings related to voter turnout and recorded key information on each finding. If a study examined more than one policy, these findings were recorded separately for each policy included in the study. For each policy examined within a particular study, the social scientist categorized the findings related to that policy as follows:
• Increased turnout: Only statistically significant positive effects (one or more).
• Mixed evidence: One or more statistically significant effects (positive or negative) and one or more findings that were not statistically significant; or, one or more statistically significant positive effects and one or more statistically significant negative effects, with or without additional findings that were not statistically significant.
• No evidence of effect: No statistically significant effects.
• Decreased turnout: Only statistically significant negative effects (one or more).
For each significant effect, the social scientist also recorded the associated percentage point increase or decrease in voter turnout, when possible. However, study authors oftentimes did not report one or more of their effects in terms of a percentage point increase or decrease in turnout; for instance, in some cases, authors reported effects in statistical terms such as coefficients from a statistical model.
A second GAO social scientist verified these determinations and worked with the first social scientist to ensure both were in agreement.
8In statistical language, an “effect” implies statistical significance.

Appendix II: Objectives, Scope, and Methodology
Page 60 GAO-16-630 Registering Voters and Administering Elections
Regarding election costs, we used a data collection instrument to catalog information in each of the relevant publications regarding (1) the types of costs associated with elections activities and (2) examples of amounts corresponding to these activities, where available. Of the over 150 publications from our search that identified costs associated with one or more election activities, none of the publications we reviewed comprehensively addressed all areas of election-related costs, and oftentimes the publications identified by our search only identified costs associated with one particular aspect of elections.
To obtain the perspectives of state and local election officials regarding the policies, practices, and efforts in use in their respective states and jurisdictions that corresponded with our objectives, we selected five states to visit—Colorado, Delaware, Illinois, Oregon, and Rhode Island.9 We selected these states primarily based on the statewide implementation of the registration and turnout policies in the scope of our review, prioritizing states that had more polices in place than others. Specifically we considered states that had implemented online voter registration, data-sharing efforts between the election office and the state motor vehicle agency or through interstate data-sharing efforts, Election Day or same day registration, vote-by-mail as their selected voting method, and requirements for informational mailings to voters. Because all states and local jurisdictions incur election-related costs and could provide perspectives on the topic, considerations regarding elections-related costs did not significantly affect our site selection decisions. Finally, we considered geographic diversity (by selecting states from various regions of the country), when possible, when making state selection decisions in order to capture possible regional differences in election administration practices.
Within the five states identified above, we selected two local election jurisdictions to visit in order to obtain different perspectives at the local level within a state. We selected jurisdictions based on (1) recommendations from introductory teleconference meetings with state election officials and (2) demographic factors, specifically population size
9In addition to the five states identified, we also selected a sixth state, but state election officials declined to meet with GAO on this engagement.
Literature on Election Costs
Interviews with State and Local Jurisdiction Election Officials
Appendix II: Objectives, Scope, and Methodology
Page 61 GAO-16-630 Registering Voters and Administering Elections
and density. The following is a list of the election jurisdictions we visited in our five selected states:
• Colorado: Denver City and County, Grand County • Delaware: Kent County, New Castle County, and Sussex County10 • Illinois: City of Chicago, Sangamon County • Oregon: Multnomah County, Yamhill County • Rhode Island: City of Pawtucket, Town of Scituate
While our selected states and local jurisdictions are not representative of all states and jurisdictions nationwide and their responses cannot be generalized to other states and local election jurisdictions, officials in these locations provided a range of perspectives on efforts to collect and share voter registration information electronically, the effect of selected policies and practices on voter turnout, and elections-related costs. During our visits, we met with state and local election officials, including the state election director (or equivalent) and the chief election official in each local jurisdiction.11 We also met with officials from state motor vehicle agencies in Colorado, Delaware, Oregon, and Rhode Island to get their perspectives on voter registration data-sharing programs with the state election office.12 We corroborated the information we gathered through these interviews by reviewing relevant state statutes and documentation that these states and local election jurisdictions provided to us, such as cost data. We conducted these interviews between October and December 2015. For examples of election costs provided in this report based on literature we reviewed or documents provided to us by state and local election officials, a GAO economist reviewed the
10In Delaware, the state’s Department of Elections oversees and conducts elections throughout the state. The Department of Elections has offices in each of Delaware’s three counties, and the state Election Commissioner noted that we could meet with officials based in each of the three county offices when these officials were present at the main state election office for a meeting that coincided with the date of our visit. Therefore, we spoke with election officials from all three counties. 11In the event that a key election official (state election director or local chief election official) was not available to meet with us, we met with that official’s designated representative. 12We did not meet with officials from the Illinois Driver Services Department because data sharing between the Driver Services Department and the state elections office was in the early stages of design. In April 2016, state election officials informed us that the State Board of Elections has completed its portion of the design. Illinois State Board of Elections officials expect DMV data sharing to be implemented by July 1, 2016.

Appendix II: Objectives, Scope, and Methodology
Page 62 GAO-16-630 Registering Voters and Administering Elections
source material to assess data reliability. To the extent that the source documentation included information about how cost estimates were derived, the economist reviewed the methodology to ensure reliability, but we did not independently assess the internal controls associated with state or local financial systems or other means for calculating such costs. We determined that these data were sufficiently reliable for providing illustrative examples of the costs for election activities.
For the objective regarding voter registration, we analyzed data to determine whether policies to collect and share voter information electronically—specifically online voter registration and ERIC—improved the quality of voter registration lists. We focused our data analysis on these two efforts to collect and share voter information electronically because, among the efforts within the scope of our objective on registration, these efforts are fairly standardized in their implementation. Specifically, it was possible for us to identify which states have implemented online voter registration and ERIC and when they did so. In contrast, states may have varying levels of data sharing between their election offices and motor vehicles agencies. Therefore we could not group states into definitive groups of those that had similarly implemented DMV data sharing and those that had not.
We analyzed data to determine whether these two policies—online voter registration and ERIC—affected the proportion of individuals surveyed who did not vote because there was a problem with their registration, as reported in the biennial CPS Voting and Registration Supplement from 2008 through 2014. Specifically, the CPS Voting and Registration Supplement asks respondents who indicated that they were registered but did not vote the main reason why they did not vote. These respondents are presented with 11 possible choices, one of which is “Registration problems (i.e. didn’t receive absentee ballot, not registered in current location).” We considered this measure—the proportion of registered non-voting individuals who responded to this question by selecting the choice for registration problems—to be a proxy-indicator of registration list quality because problems with registration can indicate that registration data are inaccurate. We reviewed documentation describing steps taken by the CPS data managers to ensure data reliability and tested the data for anomalies that could indicate reliability concerns. We determined that the CPS data were sufficiently reliable for the purposes of this analysis.
Evaluation of Selected Policies on the Accuracy of State Voter Registration Lists

Appendix II: Objectives, Scope, and Methodology
Page 63 GAO-16-630 Registering Voters and Administering Elections
For our analysis, we used the difference-in-difference modeling approach to attempt to identify what effect, if any, states’ adoption of online voter registration or ERIC had on our proxy measure of the quality of state voter registration lists. The difference-in-difference estimation strategy compares the difference in the average outcome between two time periods among a “treatment” group (in this case, states that adopted a given policy in-between the two time periods) and a “control” group (states whose policies did not change between the two time periods). The approach is designed to account for both pre-existing differences between treatment and control groups, as well as changes over time that affect states in both groups. In order to make appropriate comparisons, we modeled presidential (2008 and 2012) and midterm (2010 and 2014) years separately. The policy “treatments” of interest are states’ adoption of online voter registration and ERIC.
As noted in our report, our analysis did not find statistically significant reductions in reported registration problems in states that had implemented online voter registration between the two presidential elections or the two midterm elections, compared to those states that had not. Similarly, our analysis did not find statistically significant reductions in reported registration problems in states that joined ERIC compared to states that had not. Thus, we cannot conclude based on the evidence from this analysis that states that adopted online voter registration or ERIC saw changes in our proxy measure of registration list quality.
However, despite the advantages of our estimation approach, a number of limitations are associated with the data and methods we employed for this analysis. First, our outcome variable was not a direct measure of registration list accuracy, and there could have been other factors responsible for respondents reporting registration problems besides the quality of a state’s registration list. Second, our analysis did not control for any variables that may have been associated with the adoption of online registration or ERIC, and this could have affected our results. Finally, given the type of analysis we conducted, the number of states that had online registration during this time period as well as the relatively small size of our analysis sample may have affected our ability to detect a statistically significant relationship.
We conducted this performance audit from April 2015 to June 2016 in accordance with generally accepted government auditing standards. Those standards require that we plan and perform the audit to obtain sufficient, appropriate evidence to provide a reasonable basis for our findings and conclusions based on our audit objectives. We believe that

Appendix II: Objectives, Scope, and Methodology
Page 64 GAO-16-630 Registering Voters and Administering Elections
the evidence obtained provides a reasonable basis for our findings and conclusions based on our audit objectives.
Appendix III: Voter Turnout for Selected Demographic Characteristics
Page 65 GAO-16-630 Registering Voters and Administering Elections
Broad academic research on voter turnout has generally found that individual differences among citizens may be strongly and consistently associated with differences in turnout rates. To illustrate, we have included figures 4 through 6 that show differences in turnout over time related to age, race and ethnicity, and educational attainment. Presidential and midterm elections are presented separately, since as noted earlier in this report, nationwide turnout has been consistently higher in presidential elections than midterm elections since 1972. The figures below report voter turnout estimates based on the percentage of individuals in a given demographic that voted among the total voting-age U.S. population in that demographic group, as reported by the U.S. Census Bureau, from the Current Population Survey (CPS) Voting and Registration Supplement.
Appendix III: Voter Turnout for Selected Demographic Characteristics

Appendix III: Voter Turnout for Selected Demographic Characteristics
Page 66 GAO-16-630 Registering Voters and Administering Elections
Figure 4: Voter Turnout 1972 – 2014, by Age

Appendix III: Voter Turnout for Selected Demographic Characteristics
Page 67 GAO-16-630 Registering Voters and Administering Elections
Figure 5: Voter Turnout 2004 – 2014, by Race and Ethnicity
Note: We are presenting data from 2004 through 2014 because categories for race in the Current Population Survey (CPS) changed beginning in 2003, and thus data from earlier years are not directly comparable with the data presented here. The CPS now gives respondents the option of reporting more than one race. This figure shows data as reported in historical tables from the U.S. Census Bureau for people who reported they were of a single race (White, Black, or Asian). Use of the single-race populations does not imply that it is the preferred method of presenting or analyzing data. The CPS also includes an ethnicity question, separate from the question about race, regarding whether the respondent identifies as being of Hispanic origin or not. The responses of people who reported they were of Hispanic origin, regardless of race, are presented in the “Hispanic (of any race)” category. Thus, the categories in the figure are overlapping; that is, some people who reported single race White, single race Black, or single race Asian, may have also reported they were of Hispanic origin.
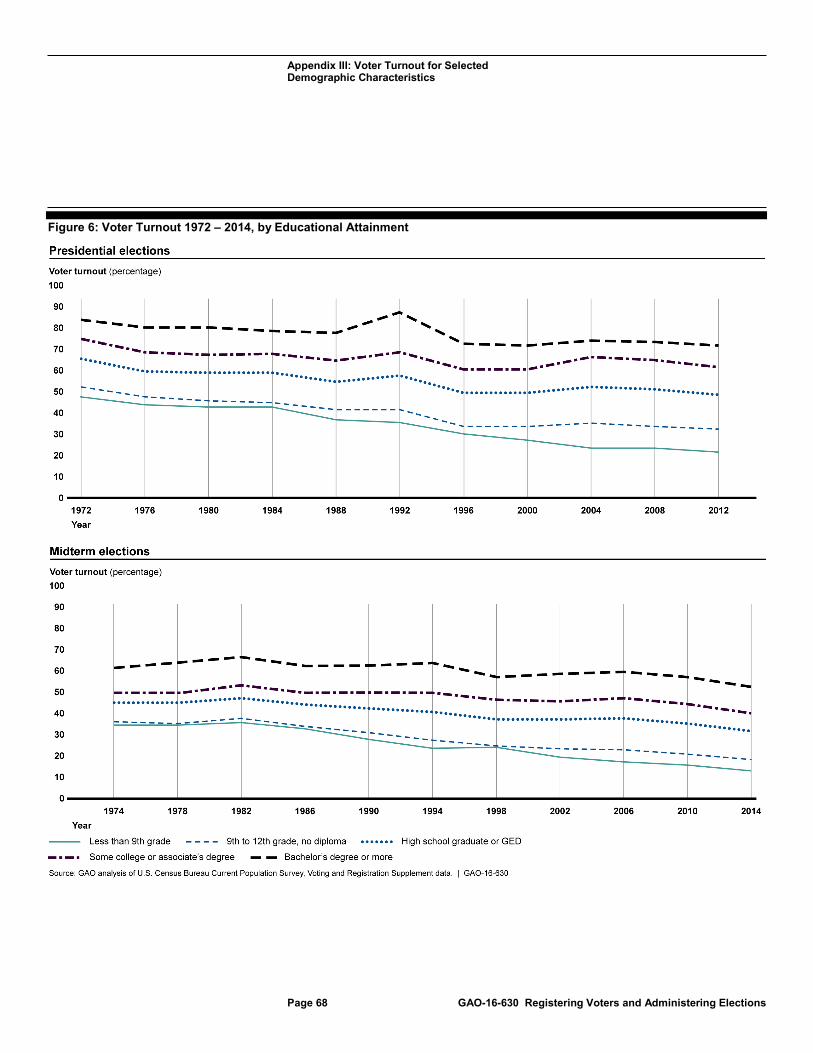
Appendix III: Voter Turnout for Selected Demographic Characteristics
Page 68 GAO-16-630 Registering Voters and Administering Elections
Figure 6: Voter Turnout 1972 – 2014, by Educational Attainment
Appendix IV: Review of Research on Effects of Eleven Selected Election Administration Policies on Voter Turnout
Page 69 GAO-16-630 Registering Voters and Administering Elections
From more than 400 publications we initially identified related to voter turnout, we identified and reviewed 118 studies within 53 publications that (1) assessed policies that have been or could be implemented by a state or local government (11 such policies in total across the 118 studies), (2) contained quantitative analyses of the effect of a given policy on turnout, and (3) used sufficiently sound methodologies for conducting such analyses. This appendix presents additional information specific to each of these 11 policies. Each policy summary contains the following sections:
• Literature review results. This section includes a summary of findings from the literature related to a policy’s effects on turnout. It also includes a figure showing the specific findings reported by each study that examined the policy. As previously discussed, each study may contain more than one finding related to a given policy’s effect on voter turnout, such as when findings were broken down by race or treatment groups associated with variations in policy implementation.1 Where studies reported more than one statistically significant effect on turnout for a given policy, we reported the range of effects.2 Where studies reported effects in terms of percentage point differences—which allow for comparisons of effects on the same scale—we report those differences. However, not all studies reported statistically significant effects—and studies that reported such effects did not always do so in units of percentage point differences.3 We use symbols in each figure to communicate these various types of findings, as shown in figure 7.
1For example, one study examined early in-person voting and presented separate findings for the policy’s effect on turnout based on whether or not states included in the analysis permitted local election administrators to offer early in-person voting on at least one weekend prior to Election Day. 2For instance, one study may have reported a 1 percentage point increase in turnout for one subsample and a 3 percentage point increase in turnout for another subsample, resulting in a range of a 1 to 3 percentage point turnout increase in our summary of this study’s findings. 3Many studies did not detect a statistically significant effect, or reported a finding that was not statistically significant along with a statistically significant effect. When a study reported one or more findings that were not statistically significant, this did not mean that the policy examined did not have an effect on turnout, only that the study could not affirmatively reject the possibility that the policy had no effect on turnout. Additionally, many studies did not report their findings in terms of a percentage point increase or decrease in turnout. For instance, many studies reported their findings as coefficients from a statistical model.
Appendix IV: Review of Research on Effects of Eleven Selected Election Administration Policies on Voter Turnout

Appendix IV: Review of Research on Effects of Eleven Selected Election Administration Policies on Voter Turnout
Page 70 GAO-16-630 Registering Voters and Administering Elections
Figure 7: Symbols Used to Represent Studies’ Findings Related to Voter Turnout
• Examples of specific studies. This section includes a description of
selected individual studies, including the specific findings, data analyzed, the population studied, any variations in policy implementation that were examined, and other contextual information—such as what specific election or elections were studied, among other things.
• Variations in implementation. This section includes descriptions of variations in how a policy may be implemented. For instance, jurisdictions may implement same-day registration at all polling places or at a limited number of them, or jurisdictions may send mailings in different formats, including as postcards or voter guides, among others.
• Observations on cost, voter convenience, and other considerations. This section includes information about the administrative costs of policy implementation, effects on voter convenience (costs to voters), and other considerations that election officials may wish to consider when deciding whether and how to implement these policies (e.g., technological or legal considerations). Some of these observations come from election officials we met with during our state and local visits.
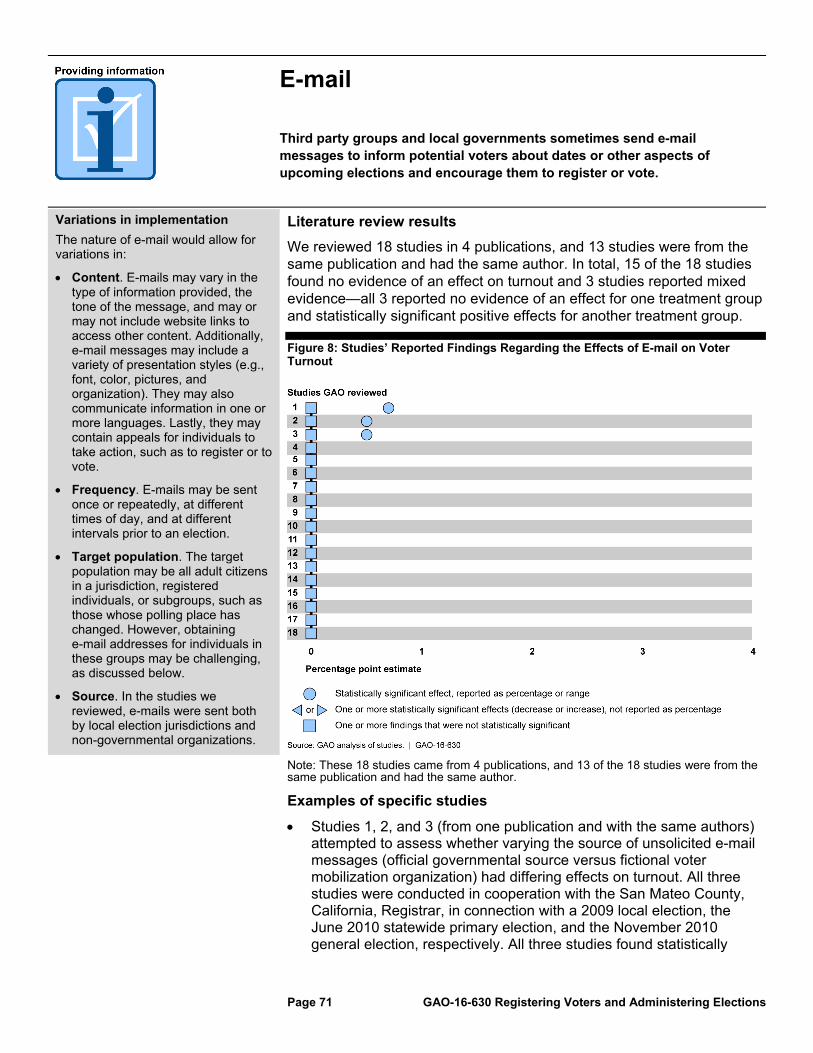
Third party groups and local governments sometimes send e-mail messages to inform potential voters about dates or other aspects of upcoming elections and encourage them to register or vote.
Page 71 GAO-16-630 Registering Voters and Administering Elections
Variations in implementation
The nature of e-mail would allow for variations in:
Content. E-mails may vary in the type of information provided, the tone of the message, and may or may not include website links to access other content. Additionally, e-mail messages may include a variety of presentation styles (e.g., font, color, pictures, and organization). They may also communicate information in one or more languages. Lastly, they may contain appeals for individuals to take action, such as to register or to vote.
Frequency. E-mails may be sent once or repeatedly, at different times of day, and at different intervals prior to an election.
Target population. The target population may be all adult citizens in a jurisdiction, registered individuals, or subgroups, such as those whose polling place has changed. However, obtaining e-mail addresses for individuals in these groups may be challenging, as discussed below.
Source. In the studies we reviewed, e-mails were sent both by local election jurisdictions and non-governmental organizations.
Literature review results
We reviewed 18 studies in 4 publications, and 13 studies were from the same publication and had the same author. In total, 15 of the 18 studies found no evidence of an effect on turnout and 3 studies reported mixed evidence—all 3 reported no evidence of an effect for one treatment group and statistically significant positive effects for another treatment group.
Figure 8: Studies’ Reported Findings Regarding the Effects of E-mail on Voter Turnout
Note: These 18 studies came from 4 publications, and 13 of the 18 studies were from the same publication and had the same author.
Examples of specific studies
Studies 1, 2, and 3 (from one publication and with the same authors) attempted to assess whether varying the source of unsolicited e-mail messages (official governmental source versus fictional voter mobilization organization) had differing effects on turnout. All three studies were conducted in cooperation with the San Mateo County, California, Registrar, in connection with a 2009 local election, the June 2010 statewide primary election, and the November 2010 general election, respectively. All three studies found statistically

Page 72 GAO-16-630 Registering Voters and Administering Elections
significant, albeit small, effects on turnout (0.7, 0.5, 0.5 percentage point increases) for e-mail messages sent from the Registrar's office, as compared to the control groups (which did not receive e-mail messages). Using separate treatment groups, all three studies also assessed the effect of identical e-mail messages sent from a fictional voter mobilization organization, and each study found no statistically significant effect on turnout resulting from these messages—even though the content and the timing of the messages were the same as those sent from the Registrar's office. The authors noted that participants in their studies only included individuals who had provided an e-mail address at the time of registration (about 20 percent of all registered individuals). These individuals tended to be younger and less likely to have voted in previous elections than other registrants in the county.
Studies 4 through 16 (from one publication and with the same author) found no evidence of an effect on turnout for e-mail messages, despite using different strategies to recruit study participants. The author partnered with three nonpartisan organizations to design, implement, and analyze the results of 13 studies examining the effect of e-mail communication on turnout.
o One organization conducted five studies (studies 4 through 8) at five different universities (across four states) during the 2002 congressional election. Student names and e-mail addresses were purchased from or provided by the five universities. For each university, students with valid e-mail addresses were randomly divided into a treatment group (which received e-mail messages) and a control group (which did not receive e-mail messages). Students in each treatment group received a series of unsolicited e-mails encouraging registration and voter turnout. The author noted that the percentage of e-mails that were actually opened averaged only 20 percent across the five universities.
o Another organization conducted a study (study 9) among registered individuals under the age of 26 in the city of Houston, Texas, during a 2003 mayoral race. This study targeted those registrants who had indicated that they were willing to receive e-mail messages from third parties and did not opt-out after receiving an e-mail invitation to participate in the study. The study included a treatment group of 6,386 that received a brief welcome e-mail and three additional e-mail messages leading up to the election, and a control group of the same size that only received the welcome e-mail. E-mails (other than the welcome e-mail) typically began with a short quiz and an invitation to explore a
Page 73 GAO-16-630 Registering Voters and Administering Elections
website, and concluded with a brief blandishment to vote. The percentage of e-mails that were opened was not available.
o A third organization conducted the remaining seven studies (studies 10 through 16) in connection with the 2004 presidential election. These studies differed from the other six studies because e-mail messages were only sent to individuals who came to the organization's website and specifically requested to join the e-mailing list reminding individuals to register and vote. Individuals who signed up were assigned to either a treatment or a control group in each of the seven study locations (California; Colorado; Michigan; Minnesota; Missouri; North Carolina; and Clark County, Nevada). Study participants in the treatment groups were sent a series of e-mail messages encouraging registration and turnout. E-mail message open rates were not recorded for these studies.
Observations on cost, voter convenience, and other considerations
One publication we reviewed noted that e-mail communication has low transactions costs and large economies of scale, compared to direct mail.a However, there may be costs associated with obtaining e-mail addresses for the target population.
The voter registration forms of the five states we visited all asked for, but did not require, e-mail addresses. As a result, in these states e-mail contact information for registered individuals is dependent on whether a registrant chooses to provide this information.
States or localities may have privacy laws or regulations associated with the storage and use of voter information, including e-mail addresses. Officials in one local jurisdiction said that, upon receiving a voter registration application that includes an e-mail address, they retain the e-mail address for potential outreach purposes, but they do not import the e-mail address into their state’s voter registration database along with the other required registration information (such as name and address). Officials said they do this to protect the privacy of these individuals—because once an e-mail address is imported into the state’s official voter registration database, it becomes part of the public record, and campaigns and other parties can use it to contact registered individuals.
aDavid W. Nickerson, “Does Email Boost Turnout?” Quarterly Journal of Political Science, vol. 2, no. 4 (2008).

Mailings
State or local governments sometimes send mailings to inform potential voters about upcoming elections or encourage them to register or vote.
Page 74 GAO-16-630 Registering Voters and Administering Elections
Variations in implementation
Potential variations in mailings fall into five broad categories:
Format. Mailings may be sent as postcards, brochures, pamphlets, booklets, or in other formats. Additionally, they may include a variety of presentation styles (e.g., font, color, pictures, and organization), and they may communicate information in one or more languages.
Content. Mailings may communicate basic procedural information (such as when an election is taking place and how a person may register or vote), or more detailed information about races and measures on the ballot. They may also contain photographs or artwork intended to communicate a particular feeling (e.g., civic pride or urgency). Lastly, they may contain appeals for individuals to take action, such as to register or to vote.
Frequency. Mailings may be sent once or repeatedly and at different intervals prior to elections.
Target population. Mailings may be sent to all mailing addresses in a jurisdiction, to all registered individuals in a jurisdiction, or to relevant sub-groups, such as those whose polling place has changed.
Source. In the studies we reviewed, mailings were sent by state and non-governmental sources.
Literature review results
We reviewed 36 studies in 16 publications. We found that the results of the studies were mixed, with most studies reporting no evidence of an effect (13 studies), an increase in turnout (9 studies), or a combination of the two (12 studies), as shown in figure 9 below.
Figure 9: Studies’ Reported Findings Regarding the Effects of Mailings on Voter Turnout
Note: These 36 studies came from 16 publications.

Mailings
Page 75 GAO-16-630 Registering Voters and Administering Elections
Examples of specific studies
Study 1 found mixed results for mailings among the groups studied, and reported that mailings may have differing effects on turnout among registered individuals, based on their propensity to vote. The study reported the results of a field experiment conducted in Brownsville, Texas, prior to the 2004 presidential election. Specifically, study authors obtained a list of all registered individuals from the Cameron County Elections Department, and randomly assigned participants to a mailing group and a control group. Postcards were sent to 3,794 registered individuals 8 days prior to the election encouraging them to vote. After the election, the Cameron County Elections Department provided validated voter turnout information for those in the mailing and control groups. The authors reported an increase in turnout of 5.5 percentage points among “regular” and “occasional” voters and 5.6 percentage points among “rare” voters, compared to similarly classified individuals in the control group, who did not receive postcards. The authors also reported no statistically significant effects for mailings among other subgroups (habitual voters and registered nonvoters).a The authors suggested that the unusually high effects on turnout they found in their study might have been because of the lack of other mobilization efforts, thus their mailer appeared more visible.
Study 5 tested the effects on voter turnout of five different variations of postcard mailings, and found mixed results among the groups studied. The postcards contained information about either (1) an individual’s past voting record, (2) past turnout rates in their local community, or (3) some combination of the two. Postcards were sent to 5,000 registered individuals in Hawthorne, California, approximately 5 days prior to a local election in November 2011. After the election, the authors obtained validated voter turnout data from the official Hawthorne, California voter file, and compared it across the five treatment groups and the control group (which did not receive a postcard). The authors found that only messages that included information about the subjects’ own voting histories (whether or not they voted in the 2006 and 2008 general elections) effectively mobilized them to vote. Specifically, three of the five variations in postcard content contained individuals’ personal voting history, and for these variations, the authors reported turnout effects ranging from 1.4 to 3.1 percentage point increases, compared to the control group; whereas the other two variations in postcards, which did not include personal voter histories, resulted in no statistically significant effects

Mailings
Page 76 GAO-16-630 Registering Voters and Administering Elections
on turnout.
Studies 6 and 17 (from one publication and with the same authors) found that sending postcards to eligible but unregistered individuals encouraging them to register resulted in increases in turnout for all groups studied. Study authors conducted their studies in partnership with Delaware state election officials in connection with the 2012 general election (study 6), and in partnership with Oregon state election officials in connection with the 2014 general election (study 17). Upon receiving contact information for eligible but unregistered individuals in each state from the ERIC program, authors assigned these individuals to treatment groups (who received different variations of postcards) and a control group (who did not receive postcards) in each state. Both states used a similar set of variations in their communication—stressing either urgency, civic identity or obligation, or plan making (prompting individuals to think about the process of registering).b After the elections, the authors matched the list of eligible by unregistered individuals to voter registration rolls in their respective states to verify who registered and voted. For the study in Delaware, the authors reported positive effects on turnout ranging from 1.9 to 2.4 percentage points, depending on the variation of postcard sent. For the study in Oregon, authors reported positive effects on turnout ranging from 0.5 to 0.6 percentage points, depending on the variation of postcard sent.c
Study 36 assessed the effect of mailing Easy Voter Guides to 27,108 registered Asian-Americans in Orange County, California, prior to the November 2006 general election. According to the authors of the study, Easy Voter Guides included user-friendly information about ballot items, including for and against arguments for ballot propositions, and information about the candidates for office. These guides were sent only to registered individuals with a “low-propensity” for voting.d Study authors reported statistically significant effects in two of six groups studied, compared to the control group (which did not receive a mailing). An organization serving Asian-Americans mailed the guides prior to the November 2006 general election in English to registered individuals who were U.S. born or were foreign born and 35 years old or younger, and in Chinese, Korean, or Vietnamese to registered individuals who were foreign born and older than 35 years. The study found that mailing Easy Voter Guides in English to Chinese-American and Vietnamese-American registered individuals decreased turnout by 4.1 and 3.1 percentage points, respectively. However, the guides had no statistically significant effect on turnout among other language/ethnicity combinations (Chinese-

Mailings
Page 77 GAO-16-630 Registering Voters and Administering Elections
Americans who were sent a guide in Chinese, Korean-Americans who were sent a guide in Korean or English, and Vietnamese-Americans who were sent a guide in Vietnamese).
Observations on cost, voter convenience, and other considerations
To save on costs, state and local election officials may send eligible mailings using U.S. Postal Service bulk mail, and in some instances may use discounted nonprofit rates.e
In some instances, local jurisdictions consolidate their mailings with state mailings to save on costs. For example, the Colorado Constitution allows local jurisdictions to combine the mailing of required notices related to debt or tax ballot measures with the mailing of the required ballot information booklet from the state in order to save mailing costs.f
Competing requirements can limit resource availability for informational mailing efforts. For example, election officials in one local jurisdiction we visited said they are already required to send mailings for multiple purposes—such as to correct misinformation or obtain additional information as part of the registration process. These officials said they would like to send more mailings to inform people of their options regarding how they may register and vote, but said they are unable to do so because of the cost of the mailings they are already required to send.
State laws may require that jurisdictions send mailings for various reasons. For instance, Colorado’s Constitution requires that (1) the state distribute an information booklet to registered voters prior to each election in which a statewide issue will appear on the ballot, and (2) local jurisdictions mail notices to inform registered voters about upcoming ballot measures related to debt or taxes.g Similarly, Rhode Island state law requires that prior to each general election the state mail each residence basic information pertaining to all ballot questions, and specific information pertaining to questions involving bonds, indebtedness, or any other long term financial obligations.h
aThe authors identified five separate voting patterns, based on how long individuals had been registered and how often they had voted in general elections and party primaries. They characterized these voting patterns as: habitual voters, regular voters, occasional voters, rare voters, and registered nonvoters (listed in order from most to least frequency of voting).
Mailings
Page 78 GAO-16-630 Registering Voters and Administering Elections
bSpecifically, all variations of postcards—for both Delaware and Oregon –included the same basic information on the back of the postcards encouraging registration. However, the pictures and wording on the front of the postcards varied. Delaware postcards included four variations, which the authors referred to as “visualization/plan making,” “urgency,” “national identity,” and “state identity;” Oregon postcards also included four variations, which the authors referred to as “visualization/plan making,” “civic duty,” “state identity”, and “placebo.” The “placebo” postcard variation in Oregon included a picture of the same sticky note that is on the front of all other Oregon postcard variations and reads “IMPORTANT! Don’t forget to register to vote before the deadline.” The placebo postcard, however, had no other pictures on the front of the postcard (as the other variations did). cThe lack of difference between the placebo variation and the other variations in Oregon indicated that none of the postcard variations led to increases in turnout beyond the common elements shared across all of the mailings. dThe authors defined “low-propensity” registered individuals as those who had voted in two or fewer of the last four statewide elections, were under the age of 25, or were newly registered (those who had registered after the last statewide election). eThe NVRA required the Postal Service to make available to a State or local voting registration official the nonprofit mail rate “for the purpose of making a mailing that the official certifies is required or authorized by the [NVRA].” Pub. L. No. 103-31, § 8(h), 107 Stat. 77, 86 (1993) (codified at 39 U.S.C. § 3629). fColo. Const. art. X, § 20. gColo. Const. art. V, § 1; art. X, § 20. hR.I. Gen. Laws § 17-5-3.
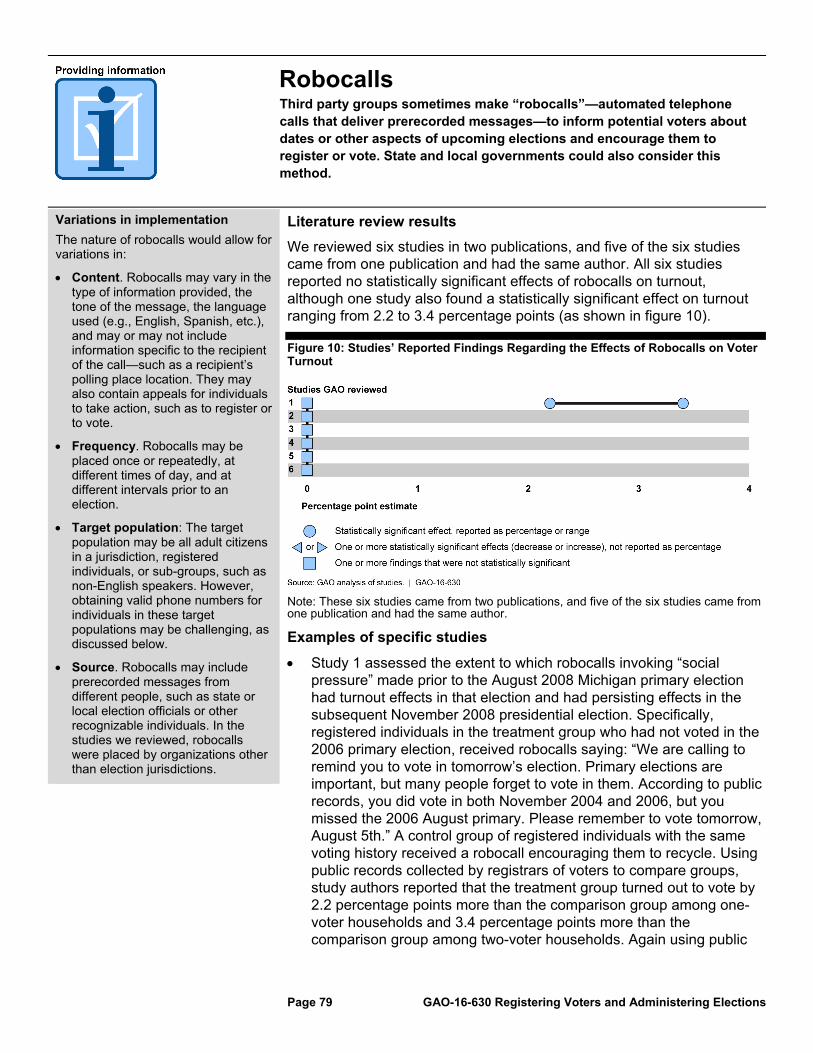
Robocalls Third party groups sometimes make “robocalls”—automated telephone calls that deliver prerecorded messages—to inform potential voters about dates or other aspects of upcoming elections and encourage them to register or vote. State and local governments could also consider this method.
Page 79 GAO-16-630 Registering Voters and Administering Elections
Variations in implementation
The nature of robocalls would allow for variations in:
Content. Robocalls may vary in the type of information provided, the tone of the message, the language used (e.g., English, Spanish, etc.), and may or may not include information specific to the recipient of the call—such as a recipient’s polling place location. They may also contain appeals for individuals to take action, such as to register or to vote.
Frequency. Robocalls may be placed once or repeatedly, at different times of day, and at different intervals prior to an election.
Target population: The target population may be all adult citizens in a jurisdiction, registered individuals, or sub-groups, such as non-English speakers. However, obtaining valid phone numbers for individuals in these target populations may be challenging, as discussed below.
Source. Robocalls may include prerecorded messages from different people, such as state or local election officials or other recognizable individuals. In the studies we reviewed, robocalls were placed by organizations other than election jurisdictions.
Literature review results
We reviewed six studies in two publications, and five of the six studies came from one publication and had the same author. All six studies reported no statistically significant effects of robocalls on turnout, although one study also found a statistically significant effect on turnout ranging from 2.2 to 3.4 percentage points (as shown in figure 10).
Figure 10: Studies’ Reported Findings Regarding the Effects of Robocalls on Voter Turnout
Note: These six studies came from two publications, and five of the six studies came from one publication and had the same author.
Examples of specific studies
Study 1 assessed the extent to which robocalls invoking “social pressure” made prior to the August 2008 Michigan primary election had turnout effects in that election and had persisting effects in the subsequent November 2008 presidential election. Specifically, registered individuals in the treatment group who had not voted in the 2006 primary election, received robocalls saying: “We are calling to remind you to vote in tomorrow’s election. Primary elections are important, but many people forget to vote in them. According to public records, you did vote in both November 2004 and 2006, but you missed the 2006 August primary. Please remember to vote tomorrow, August 5th.” A control group of registered individuals with the same voting history received a robocall encouraging them to recycle. Using public records collected by registrars of voters to compare groups, study authors reported that the treatment group turned out to vote by 2.2 percentage points more than the comparison group among one-voter households and 3.4 percentage points more than the comparison group among two-voter households. Again using public
Robocalls
Page 80 GAO-16-630 Registering Voters and Administering Elections
records, the authors followed-up to see if these turnout effects persisted in the next election—the 2008 presidential election in November. They reported that the differences between the treatment and control groups found in the 2008 primary election did not persist in the 2008 presidential election in November.
Studies 2 through 6 (from one publication and with the same author) each found no effect on turnout from the use of robocalls. The studies were all conducted in connection with the November 2002 midterm election, and each study targeted registered individuals who resided in precincts where Latinos made up at least 70 percent of those registered to vote, and where turnout among registered individuals was less than half the national average in the 2000 presidential election. Each of the studies were conducted in precincts in one of five locations nationwide: Los Angeles County, California; Orange County, California; Harris County, Texas; the Denver, Colorado metropolitan area; and the state of New Mexico. In each location, registered individuals were randomly assigned to either a location-specific treatment group (which received robocalls) or a location-specific control group (which did not receive robocalls). In the two California locations, the Texas location, and the New Mexico location, those in the treatment groups received two calls in Spanish, read by a prominent Spanish-language newscaster, encouraging them to vote and saying “Your vote strengthens our communities and families with better schools, better jobs and safer communities.” In the Denver metropolitan area, a Denver city council member read a similar script in English to those in the treatment group. The author reported no statistically significant effects resulting from the robocalls in each location (comparing turnout among those in the treatment group in each location to turnout among those in the control group in each location). The author highlighted challenges with robocalling, including the inability to know with certainty the primary language of the household, and difficulty obtaining current phone numbers. The author suggested that future studies might find stronger effects of robocalls on turnout by trying new or different messages, such as messages that include each respondent’s polling location.
Observations on cost, voter convenience, and other considerations
There may be costs associated with (1) obtaining phone numbers for the target population, (2) determining which phone numbers are current and which numbers connect to landlines versus mobile phones, and (3) placing robocalls. In one publication we reviewed, the author reported that the total cost of a robocall campaign that
Robocalls
Page 81 GAO-16-630 Registering Voters and Administering Elections
targeted 240,951 people was $23,725, making the cost per participant about 10 cents.a
Federal law does not prohibit non-commercial, informational robocalls to landlines without prior consent.b However, by regulation, prior consent must be obtained, either orally or in writing, for similar calls to wireless phones.c States or localities may have privacy laws or regulations associated with the storage and use of voter information, including phone numbers.
The voter registration forms of the five states we visited all asked for, but did not require, a phone number. As a result, in these states phone contact information for registered individuals is dependent on whether a registrant chooses to provide this information.
aRicardo Ramirez, “Giving Voice to Latino Voters: A Field Experiment on the Effectiveness of a National Nonpartisan Mobilization Effort,” The Annals of the American Academy of Political and Social Science, vol. 601 (2005).
bSee Telephone Consumer Protection Act of 1991, Pub. L. No. 102-243, § 3, 105 Stat. 2394, 2395 (1991) (codified at 47 U.S.C. § 227); 47 C.F.R. § 64.1200(a)(3)(ii).
c47 C.F.R. § 64.1200(a)(1)(iii). In 2012, the FCC issued a ruling that clarified that an entity must obtain prior express consent to make robocalls to wireless numbers, but allows consent to be obtained orally or in writing for non-telemarketing calls. Rules and Regulations Implementing the Telephone Consumer Protection Act of 1991, CG Docket 02-278, Report and Order, 27 FCC Rcd. 1830, 1837-1841, para. 28 (2012).
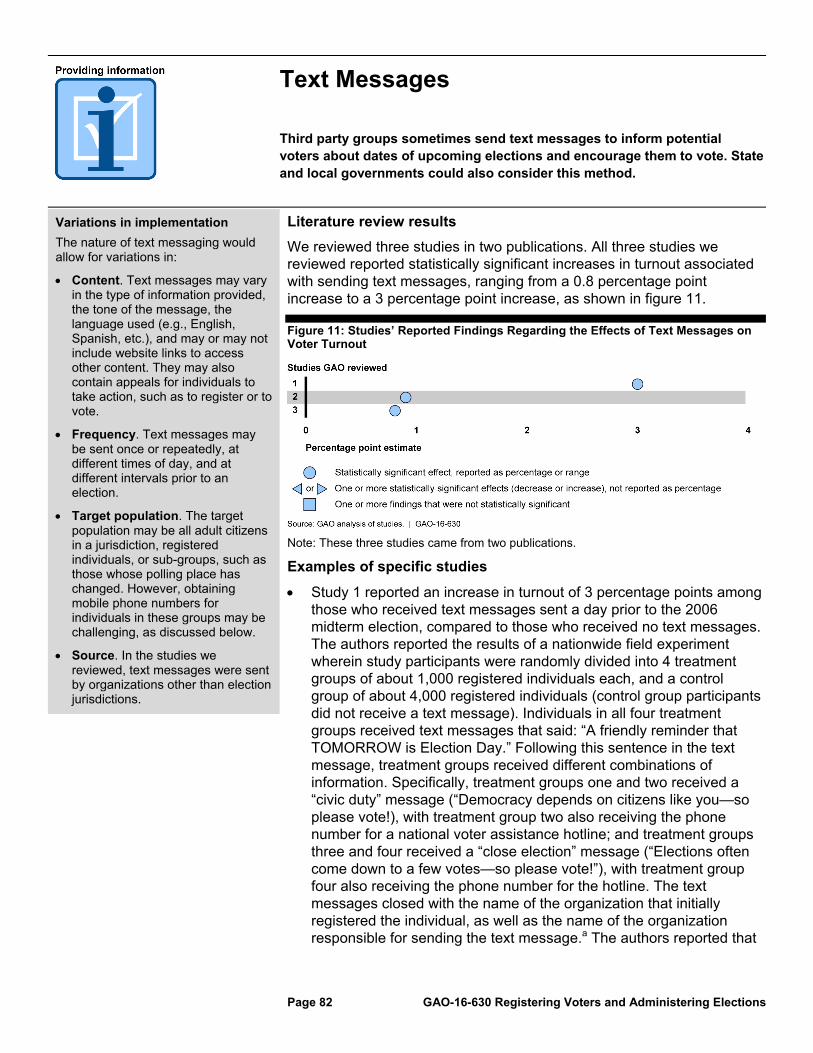
Text Messages
Third party groups sometimes send text messages to inform potential voters about dates of upcoming elections and encourage them to vote. State and local governments could also consider this method.
Page 82 GAO-16-630 Registering Voters and Administering Elections
Variations in implementation
The nature of text messaging would allow for variations in:
Content. Text messages may vary in the type of information provided, the tone of the message, the language used (e.g., English, Spanish, etc.), and may or may not include website links to access other content. They may also contain appeals for individuals to take action, such as to register or to vote.
Frequency. Text messages may be sent once or repeatedly, at different times of day, and at different intervals prior to an election.
Target population. The target population may be all adult citizens in a jurisdiction, registered individuals, or sub-groups, such as those whose polling place has changed. However, obtaining mobile phone numbers for individuals in these groups may be challenging, as discussed below.
Source. In the studies we reviewed, text messages were sent by organizations other than election jurisdictions.
Literature review results
We reviewed three studies in two publications. All three studies we reviewed reported statistically significant increases in turnout associated with sending text messages, ranging from a 0.8 percentage point increase to a 3 percentage point increase, as shown in figure 11.
Figure 11: Studies’ Reported Findings Regarding the Effects of Text Messages on Voter Turnout
Note: These three studies came from two publications.
Examples of specific studies
Study 1 reported an increase in turnout of 3 percentage points among those who received text messages sent a day prior to the 2006 midterm election, compared to those who received no text messages. The authors reported the results of a nationwide field experiment wherein study participants were randomly divided into 4 treatment groups of about 1,000 registered individuals each, and a control group of about 4,000 registered individuals (control group participants did not receive a text message). Individuals in all four treatment groups received text messages that said: “A friendly reminder that TOMORROW is Election Day.” Following this sentence in the text message, treatment groups received different combinations of information. Specifically, treatment groups one and two received a “civic duty” message (“Democracy depends on citizens like you—so please vote!), with treatment group two also receiving the phone number for a national voter assistance hotline; and treatment groups three and four received a “close election” message (“Elections often come down to a few votes—so please vote!”), with treatment group four also receiving the phone number for the hotline. The text messages closed with the name of the organization that initially registered the individual, as well as the name of the organization responsible for sending the text message.a The authors reported that

Text Messages
Page 83 GAO-16-630 Registering Voters and Administering Elections
the results indicated no significant difference between the turnout effects attributed to the two message appeals (civic duty vs. close elections). They also concluded that adding a polling place hotline number did not have an additional effect on turnout (beyond the effects found for text messages generally).
Studies 2 and 3 (from one publication and with the same authors) had different authors than study 1 but used a similar text message as study 1. Study 2 reported an increase of 0.9 percentage points in turnout among the study participants who received text messages a day prior to the June 2010 statewide elections in California, compared to those who did not. Specifically, individuals were divided randomly into a treatment group and a control group. In the treatment group, text messages were sent to 14,844 registered individuals in San Mateo County who had provided valid cell phone numbers at the time of registration; the control group included 14,829 registered individuals who did not receive a text message, but who also provided valid cell phone numbers at the time of registration. The text messages were sent by a third party firm and included the same text as the civic duty message in study 1 noted above: “A friendly reminder that TOMORROW is Election Day. Democracy depends on citizens like you—so please vote!” The authors noted that in study 1 (discussed above), people received texts from organizations that registered them and in some cases gave permission to be contacted via text message in the future. The authors distinguished their study from the previous study by noting that their experiment sent “cold” text messages—that is, the recipients did not receive text messages from an organization that registered them in person and were not asked for permission to receive text messages prior to Election Day. In study 3 the same text messages were sent to a similar population in San Mateo County, California, with a control group identified in the same way as in study 2—but this study was conducted in connection with a November 2009 local election. The authors reported a 0.8 percentage point increase in turnout associated with sending text messages in connection with this election.
Observations on cost, voter convenience, and other considerations
There may be costs associated with (1) obtaining phone numbers for the target population, (2) determining which phone numbers are current, and which are landline versus mobile numbers, and (3) sending bulk text messages. The three studies we reviewed used phone numbers provided during voter registration. Two of these studies used an outside firm to determine which numbers were
Text Messages
Page 84 GAO-16-630 Registering Voters and Administering Elections
connected to mobile phones, and one study noted that this task was performed, but did not say who performed it. All three studies used third party groups to send the text messages.
Federal law prohibits text messages sent to mobile phones using an automatic telephone dialing system unless the recipient previously provided consent.b For non-commercial, informational text messages, prior consent may be given orally or in writing.c Additionally, the message must include a convenient way to “opt-out” of future messages. Additionally, states or localities may have privacy laws or regulations associated with the storage and use voter information, including phone numbers.
The voter registration forms of the five states we visited all asked for, but did not require, a phone number. As a result, in these states phone contact information for registered individuals is dependent on whether a registrant chooses to provide this information.
aAll participants in this experiment were registered through a third party voter registration organization. bThe Telephone Consumer Protection Act (TCPA), as amended, prohibits any person from making a call to any telephone number assigned to a cellular telephone service, with certain narrow exceptions, without the prior express consent of the called party using any automatic telephone dialing system. Pub. L. No. 102-243, § 3, 105 Stat. 2394, 2395 (1991) (codified at 47 U.S.C. § 227); 47 C.F.R. § 64.1200(a)(1)(iii). In 2003, the FCC issued an order interpreting the TCPA to include a text message within the meaning of a “call,” thereby requiring a person or entity sending text messages to a recipient using an automatic telephone dialing system to obtain prior express consent. In re Rules and Regulations Implementing the Telephone Consumer Protection Act of 1991, CG Docket No. 02-278, Report and Order, 18 FCC Rcd. 14014, 14115 (2003); Satterfield v. Simon & Schuster, Inc., 569 F.3d 946 (9th Cir. 2009) (finding that the FCC’s interpretation of the TCPA was reasonable). cRules and Regulations Implementing the Telephone Consumer Protection Act of 1991, CG Docket No. 02-278, Declaratory Ruling and Order, 30 FCC Rcd. 7961, 7992, 8016-22 (2015).
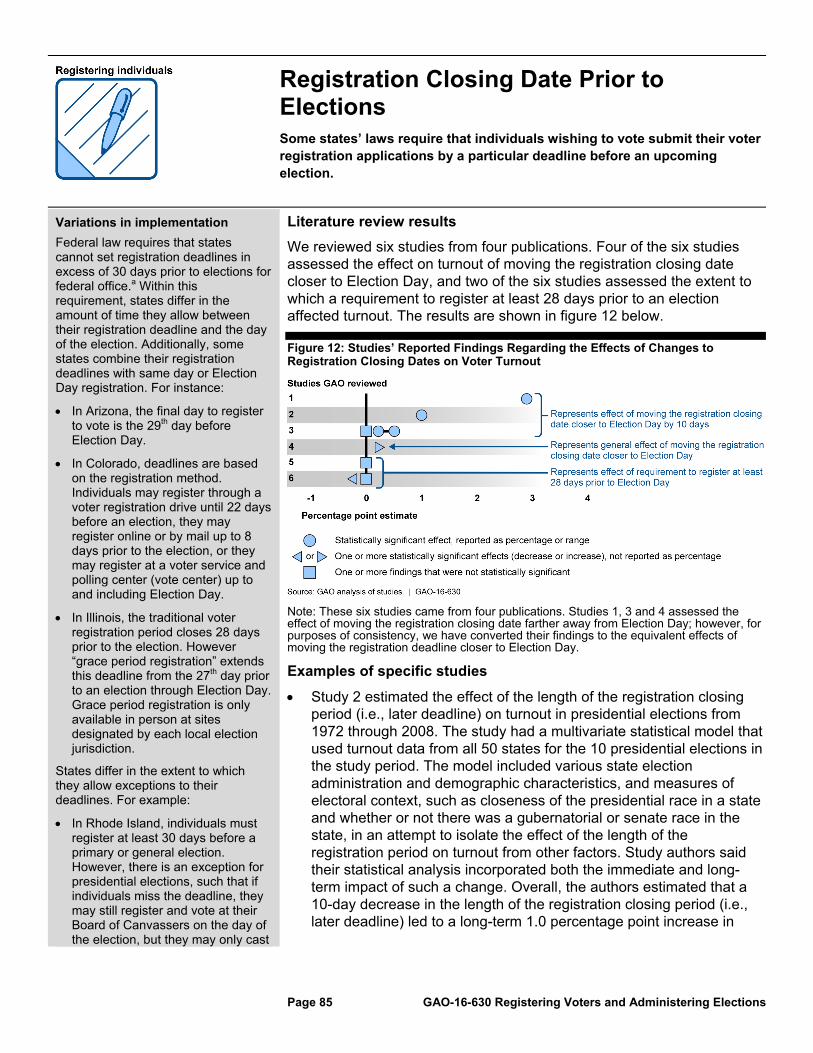
Registration Closing Date Prior to Elections Some states’ laws require that individuals wishing to vote submit their voter registration applications by a particular deadline before an upcoming election.
Page 85 GAO-16-630 Registering Voters and Administering Elections
Variations in implementation
Federal law requires that states cannot set registration deadlines in excess of 30 days prior to elections for federal office.a Within this requirement, states differ in the amount of time they allow between their registration deadline and the day of the election. Additionally, some states combine their registration deadlines with same day or Election Day registration. For instance:
In Arizona, the final day to register to vote is the 29th day before Election Day.
In Colorado, deadlines are based on the registration method. Individuals may register through a voter registration drive until 22 days before an election, they may register online or by mail up to 8 days prior to the election, or they may register at a voter service and polling center (vote center) up to and including Election Day.
In Illinois, the traditional voter registration period closes 28 days prior to the election. However “grace period registration” extends this deadline from the 27th day prior to an election through Election Day. Grace period registration is only available in person at sites designated by each local election jurisdiction.
States differ in the extent to which they allow exceptions to their deadlines. For example:
In Rhode Island, individuals must register at least 30 days before a primary or general election. However, there is an exception for presidential elections, such that if individuals miss the deadline, they may still register and vote at their Board of Canvassers on the day of the election, but they may only cast
Literature review results
We reviewed six studies from four publications. Four of the six studies assessed the effect on turnout of moving the registration closing date closer to Election Day, and two of the six studies assessed the extent to which a requirement to register at least 28 days prior to an election affected turnout. The results are shown in figure 12 below.
Figure 12: Studies’ Reported Findings Regarding the Effects of Changes to Registration Closing Dates on Voter Turnout
Note: These six studies came from four publications. Studies 1, 3 and 4 assessed the effect of moving the registration closing date farther away from Election Day; however, for purposes of consistency, we have converted their findings to the equivalent effects of moving the registration deadline closer to Election Day.
Examples of specific studies
Study 2 estimated the effect of the length of the registration closing period (i.e., later deadline) on turnout in presidential elections from 1972 through 2008. The study had a multivariate statistical model that used turnout data from all 50 states for the 10 presidential elections in the study period. The model included various state election administration and demographic characteristics, and measures of electoral context, such as closeness of the presidential race in a state and whether or not there was a gubernatorial or senate race in the state, in an attempt to isolate the effect of the length of the registration period on turnout from other factors. Study authors said their statistical analysis incorporated both the immediate and long-term impact of such a change. Overall, the authors estimated that a 10-day decrease in the length of the registration closing period (i.e., later deadline) led to a long-term 1.0 percentage point increase in

Registration Closing Date Prior to
Elections
Page 86 GAO-16-630 Registering Voters and Administering Elections
a vote for President/Vice President.
In California, individuals must register at least 15 days before Election Day. However, California residents who move to a new county after this deadline can vote at the polling place of their old address (if they were already registered).
turnout in states without Election Day registration.
Study 3 analyzed state-level turnout data during presidential election years from 1920 through 2000. This study found that for all states combined as the period of time between registration closing and Election Day decreased, turnout increased.b However, when examining states on the basis of geography, the effect of registration closing dates on turnout depended on the group of states included in the comparison. Study authors reported statistically significant effects for all states combined and also for southern states, but not for non-southern states. For all states combined, the turnout increase was estimated to be 0.021 percentage points for each one-day decrease in the time between the registration deadline and Election Day, and for southern states the turnout increase was 0.045 percentage points per one-day decrease. So, for all states combined, a 10-day decrease in the time between the registration deadline and Election Day resulted in a 0.2 percentage point increase in turnout; and for southern states, a 10-day decrease resulted in a 0.45 percentage point increase in turnout.
Studies 5 and 6 (from one publication) assessed the effect of state registration deadlines that required individuals to register at least 28 days before an election (compared to the effect of state registration deadlines that were less than 28 days). Using U.S. Census Bureau’s Current Population Survey (CPS) data, study 5 found no statistically significant effect on turnout from having a deadline at least 28-days before the 2008 presidential election, across four different models (the models differed in the extent to which they controlled for different early voting laws and other state-level reforms). Also using CPS data, study 6 conducted a similar analysis in relation to the 2012 midterm election and found a statistically significant decrease in turnout in one model (not reported as a percentage point estimate) and no statistically significant effects in the other three models.
Observations on cost, voter convenience, and other considerations
All five of the states we visited have registration deadlines prior to Election Day; however, three of them (Colorado, Illinois, and Rhode Island) also have some form of same day registration. State election officials in four of these states generally said that having a deadline provides time for local election officials to complete various election-related tasks, such as processing remaining registration applications and updating registration rolls, preparing and printing poll books, preparing ballots, and mailing ballots.

Registration Closing Date Prior to
Elections
Page 87 GAO-16-630 Registering Voters and Administering Elections
One publication we reviewed argued that voters’ interest in an election builds progressively until Election Day, and so registration closing dates can limit whether some interested citizens, who would otherwise be eligible, register to vote in time and are then able to vote.c Similarly, a local election official we spoke with noted that despite the jurisdiction’s efforts to announce and publicize upcoming elections, many voters do not become interested in the elections until a few weeks before Election Day, which is too late to register in that jurisdiction’s state.
States may have different deadlines and rules related to third party registration drives. For instance, in addition to having a separate deadline for individuals who register through voter registration drives, Colorado law requires that third party groups deliver completed applications to the appropriate local jurisdiction no later than 15 business days after the application was signed (or postmarked by that date, if mailed).d Researchers at one organization we spoke with said that third party registration groups often turn in many paper registration forms at the same time close to the registration deadline, increasing the burden on election officials who need to input the information from the forms into their state’s voter registration database.
Federal law requires that individuals who move to a new state within 30 days of a presidential election must be allowed to vote for President and Vice President in their former state, either in-person or by absentee ballot.e Additionally, individuals who move within the same local jurisdiction must be given the opportunity to update their registration and vote even if they never notified the registrar of their move.
aSee 52 U.S.C. § 20507(a)(1). bStudy 3 assessed the effect of moving the registration closing date farther away from Election Day; however, for purposes of consistency in this policy summary, we have converted its findings to the equivalent effect of moving the registration deadline closer to Election Day. cMelanie J. Springer, “State Electoral Institutions and Voter Turnout in Presidential Elections, 1920-2000,” State Politics & Policy Quarterly, vol. 12, no. 3 (2012). dColo. Rev. Stat. § 1-2-702. e52 U.S.C. § 10502(e).

Same Day Registration
Some state laws allow eligible individuals to register (or update their registration) and vote on the same day.
Page 88 GAO-16-630 Registering Voters and Administering Elections
Variations in implementation
Depending on the state, same day registration may be offered on Election Day, during an early voting period, or both. Some states refer to this policy as Election Day registration, and the two terms (same day registration and Election Day registration) are sometimes used interchangeably. When referring to findings in publications and studies, we use the terms used by the authors.
States may also have deadlines for registration in advance of the election while also allowing for same day registration; when and how the individual registers can affect the process that individual goes through to cast a ballot. For example, in Colorado, registration deadlines are dependent upon the method of registration.a For example, registration applications submitted through a voter registration drive must be submitted no later than 22 days before an election. However, voters can continue to register online or by mail after this deadline, though the timing may affect whether an individual receives a ballot by mail, given that Colorado is an all vote-by-mail state. Individuals registering at least 8 days in advance will automatically receive a mail ballot, but those registering after this time must visit a polling location to receive a ballot. Individuals can also register in person at polling places during early voting or on Election Day.
States or local jurisdictions may allow for same day registration at all or select polling locations. For example, in Illinois, the requirements for offering same day registration (known as “grace period registration and voting”) differ by county.b In Illinois, counties with more than 100,000 people and those of any size that use electronic poll books are required to provide for same day registration at the main
Literature review results
We reviewed 33 studies in 17 publications, and 21 of these studies found increases in turnout, 3 studies found mixed effects (positive increases combined with non-significant findings), while 9 studies found no statistically significant effects.
Figure 13: Studies’ Reported Findings Regarding the Effects of Same Day Registration on Voter Turnout
Note: These 33 studies came from 17 publications.
Examples of specific studies
Studies 1 and 19 (from the same publication) examined how the

Same Day Registration
Page 89 GAO-16-630 Registering Voters and Administering Elections
county election office and all permanent early voting and Election Day polling places, while smaller counties that use printed poll books are only required to offer it at the main election office and in any polling place that serves 20 percent or more of the county’s residents and is located in a different municipality than the main election office.
Some states limit the type of ballot available to individuals who register and vote on the same day. For example, in Rhode Island, an individual who has not registered to vote can cast a ballot for President and Vice President on Election Day at his or her city or town hall or an alternate location designated by the local board of canvassers, and the casting of the ballot begins the process of voter registration.c
proximity of registration deadlines to Election Day affects voter turnout, with Election Day registration being a registration deadline of 0 days before Election Day. Study 1 analyzed CPS data at the county level for all presidential and midterm elections from 1992 through 2004 in which there was at least one statewide-office on the ballot. The author analyzed the effect of the length of registration deadlines (how far in advance an individual must register before an election) on turnout and estimated that a change from a registration deadline 30 days in advance of the election to 0 days (the equivalent of Election Day registration) would increase turnout by 8.7 percentage points. Study 19 used individual-level CPS data from presidential and midterm elections from 1994 through 2006 and estimated that changing a registration deadline from 30 days before Election Day to 0 days (Election Day registration) would increase an individual’s probability of voting by an estimated 7.3 percent.d
Two studies (Studies 7 and 13) in another publication assessed the effect of Election Day registration in presidential and midterm elections, respectively, from 1980 through 2006. Using one model, Study 7 found that the policy increased turnout by 4.5 percentage points, on average, in presidential election years, and Study 13 found that the policy increased turnout by 2 percentage points, on average, in midterm election years. The authors also presented alternative models in each study that controlled for the interaction between Election Day registration and the competitiveness of key races (presidential races in the presidential election years and state gubernatorial races in midterm election years) and found no statistically significant effects of Election Day registration alone in these models. However, study 13 found that states with Election Day registration that had competitive gubernatorial elections had significantly higher midterm turnout than did states with only Election Day registration or just competitive gubernatorial races. The authors concluded that with less information generally available for midterm elections, electoral competition along with Election Day registration may combine to increase turnout.
Study 9 examined Wisconsin’s initial implementation of Election Day registration as a natural experiment because the policy was implemented in different municipalities throughout the state at different times. Specifically, municipalities that previously required voters to register before voting were required to implement the policy, whereas municipalities that did not have a registration requirement did not change their procedures.e As a result, a county could have some municipalities that implemented Election Day registration and
Same Day Registration
Page 90 GAO-16-630 Registering Voters and Administering Elections
some that continued without a registration requirement. Using county-level data from the Wisconsin Election Board for the number of votes cast in presidential elections from 1972 through 1980 and the proportion of a county’s population affected by the adoption of Election Day registration, the authors estimated that if a county were to move from no population covered by Election Day registration to having all of its population covered by Election Day registration, turnout would increase by about 3.0 percentage points.
Observations on cost, voter convenience, and other considerations
Implementing same day registration can have cost implications. To avoid the potential for longer lines at polling places resulting from the additional step to register and possible confusion over the process, some jurisdictions may hire additional poll workers to assist those who need to register as well as vote. For example, the Office of Policy Analysis within the Maryland Department of Legislative Services reported that the main additional cost of implementing Election Day registration, as it was being considered in proposed legislation, would be hiring additional staff to process registrations at polling places.f Additionally, officials from one large urban jurisdiction told us they had purchased electronic poll books in anticipation of offering same day registration, which was a cost to the jurisdiction. However, electronic poll books may reduce costs in other areas, specifically eliminating the need to print paper poll books for each polling place.
Literature that we reviewed indicated that same day registration can provide convenience for voters, including those who missed a registration deadline as well as particular subsets of voters, such as young voters or those who move frequently.
The Pew Center on the States reported that allowing for registration on Election Day can provide a failsafe option for eligible individuals whose registration information is inaccurately listed despite their own best efforts.g Similarly, the Government Accountability Board of Wisconsin—a state that has had Election Day registration since 1976—noted that Election Day registration offers an eligible individual the opportunity to correct administrative mistakes made by the individual or election officials.h
The National Conference of State Legislatures reported that same day registration can result in administrative burdens for election officials, given that eligibility must be verified at the same time that the registrant provides his or her information.i In general, states with same day registration require applicants to provide some form of

Same Day Registration
Page 91 GAO-16-630 Registering Voters and Administering Elections
identification and proof of residency. One case study across multiple states noted that the Election Day registration process and requirements can result in confusion for poll workers and long lines.j
Literature we reviewed cited concerns about potential fraud associated with registering individuals and immediately allowing them to cast a ballot, because there may be challenges to verifying an individual’s eligibility at the polling place. For example, polling places that use printed precinct-specific poll books may not have resources available for poll workers to be able to confirm that the individual is not already registered in another location. However, the literature and officials we spoke with noted that there are methods for limiting the potential for fraud. In Colorado, all jurisdictions in the state use electronic poll books that are connected in real-time via the internet to the state’s voter registration system, and the Colorado election director said that this technology helps officials or poll workers at the polling place determine if a person is already registered elsewhere in the state, which can mitigate fraud concerns. In Illinois, which recently began to implement same day registration, state officials said that local jurisdictions will be responsible for determining how to verify eligibility and prevent fraud—they noted that some may use tools connected to the internet to verify potential registrants against the state’s registration system, while others may require voters to sign an affidavit that they will not vote again at another location.
aSee Colo. Rev. Stat. § 1-2-201. bIn Illinois, during the 28 days preceding an election (the “grace period”), in counties with populations greater than 100,000 or that use electronic poll books, an unregistered individual may register to vote, and a registered voter may submit a change of address form, in person in the office of the election authority, at a permanent early voting site (which local jurisdictions establish according to specifications in state law), at any other early voting site beginning 15 days prior to the election, at a polling place on Election Day, or at a voter registration location specifically designated for this purpose by the election authority. See 10 Ill. Comp. Stat. Ann. 5/4-50, 5-50, 6-100. cR.I. Gen. Laws § 17-1-3. dThis study estimated the increase in an individual’s probability of voting, rather than a percentage point increase in turnout among a group or population. Thus, it is not represented as a percentage point estimate in figure 13. eIn Wisconsin, municipalities are responsible for administering elections. Until January 1, 2006, Wisconsin municipalities with populations greater than 5,000 were required to register voters, whereas municipalities under this threshold could choose whether or not to establish registration requirements.
Same Day Registration
Page 92 GAO-16-630 Registering Voters and Administering Elections
fMaryland Department of Legislative Services, Office of Policy Analysis, Election Day Registration (Annapolis, Maryland: Dec. 12, 2008). gThe Pew Center on the States, Upgrading Democracy: Improving America’s Elections by Modernizing States’ Voter Registration Systems (Washington, D.C.: November 2010). hState of Wisconsin Government Accountability Board, Final Report on the Impacts and Costs of Eliminating Election Day Registration in Wisconsin (Feb. 18, 2013). iOwens Hubler, Katy, “Improving Voter Turnout,” Legisbrief Briefing Papers on the Important Issues of the Day, vol. 22, no. 40 (Denver, Colorado: National Conference of State Legislatures, October 2014). jelectiononline.org, Election-Day Registration: A Case Study (Washington, D.C.: Election Reform Information Project, February 2007). The Election Reform Information Project is a project at the University of Richmond supported by The Pew Charitable Trusts.
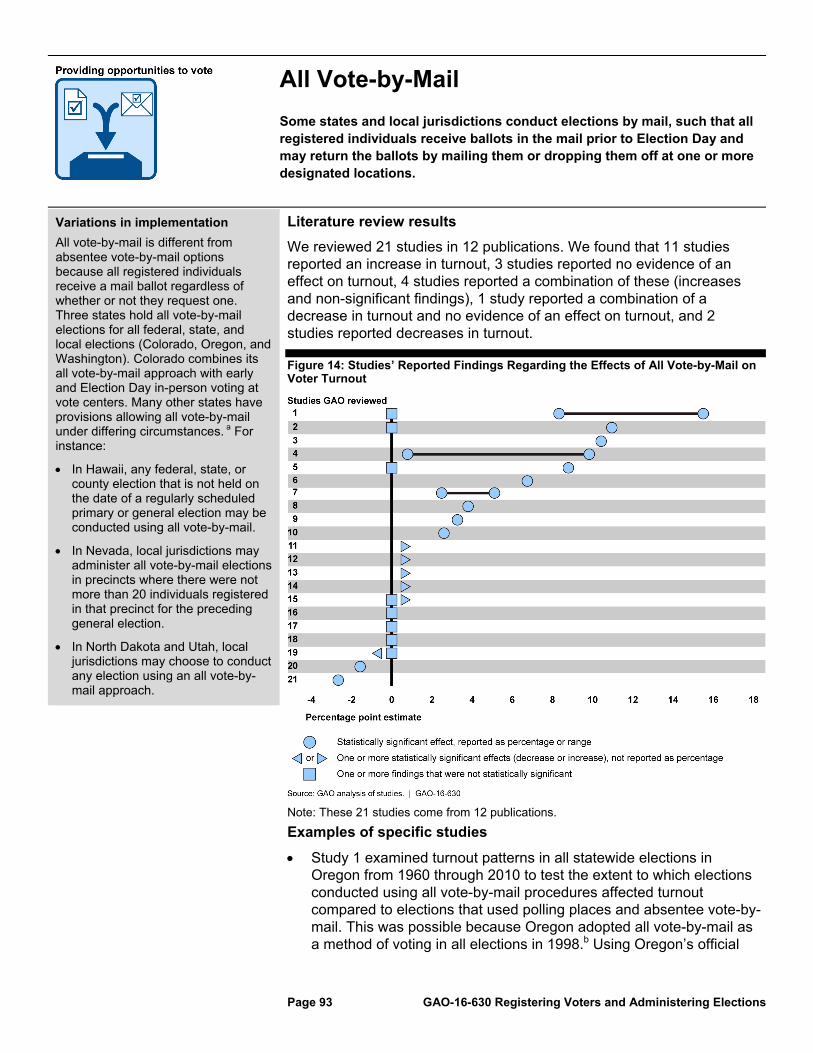
All Vote-by-Mail
Some states and local jurisdictions conduct elections by mail, such that all registered individuals receive ballots in the mail prior to Election Day and may return the ballots by mailing them or dropping them off at one or more designated locations.
Page 93 GAO-16-630 Registering Voters and Administering Elections
Variations in implementation
All vote-by-mail is different from absentee vote-by-mail options because all registered individuals receive a mail ballot regardless of whether or not they request one. Three states hold all vote-by-mail elections for all federal, state, and local elections (Colorado, Oregon, and Washington). Colorado combines its all vote-by-mail approach with early and Election Day in-person voting at vote centers. Many other states have provisions allowing all vote-by-mail under differing circumstances. a For instance:
In Hawaii, any federal, state, or county election that is not held on the date of a regularly scheduled primary or general election may be conducted using all vote-by-mail.
In Nevada, local jurisdictions may administer all vote-by-mail elections in precincts where there were not more than 20 individuals registered in that precinct for the preceding general election.
In North Dakota and Utah, local jurisdictions may choose to conduct any election using an all vote-by-mail approach.
Literature review results
We reviewed 21 studies in 12 publications. We found that 11 studies reported an increase in turnout, 3 studies reported no evidence of an effect on turnout, 4 studies reported a combination of these (increases and non-significant findings), 1 study reported a combination of a decrease in turnout and no evidence of an effect on turnout, and 2 studies reported decreases in turnout.
Figure 14: Studies’ Reported Findings Regarding the Effects of All Vote-by-Mail on Voter Turnout
Note: These 21 studies come from 12 publications.
Examples of specific studies
Study 1 examined turnout patterns in all statewide elections in Oregon from 1960 through 2010 to test the extent to which elections conducted using all vote-by-mail procedures affected turnout compared to elections that used polling places and absentee vote-by-mail. This was possible because Oregon adopted all vote-by-mail as a method of voting in all elections in 1998.b Using Oregon’s official
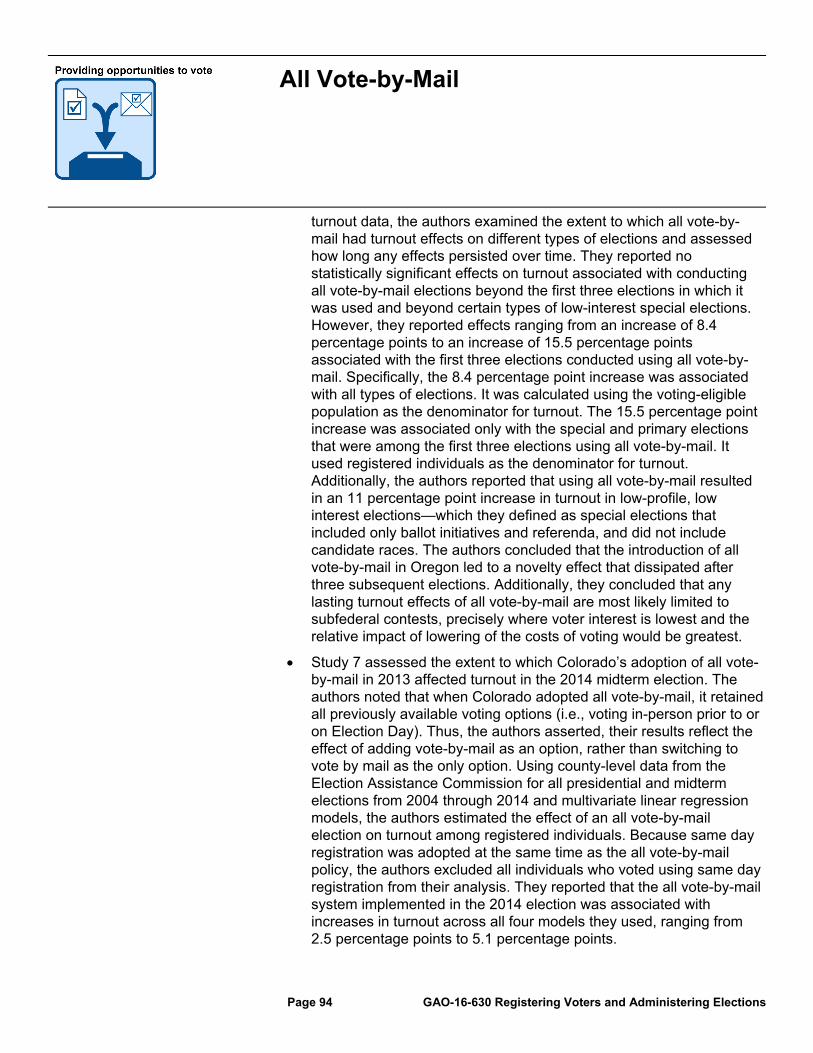
All Vote-by-Mail
Page 94 GAO-16-630 Registering Voters and Administering Elections
turnout data, the authors examined the extent to which all vote-by-mail had turnout effects on different types of elections and assessed how long any effects persisted over time. They reported no statistically significant effects on turnout associated with conducting all vote-by-mail elections beyond the first three elections in which it was used and beyond certain types of low-interest special elections. However, they reported effects ranging from an increase of 8.4 percentage points to an increase of 15.5 percentage points associated with the first three elections conducted using all vote-by-mail. Specifically, the 8.4 percentage point increase was associated with all types of elections. It was calculated using the voting-eligible population as the denominator for turnout. The 15.5 percentage point increase was associated only with the special and primary elections that were among the first three elections using all vote-by-mail. It used registered individuals as the denominator for turnout. Additionally, the authors reported that using all vote-by-mail resulted in an 11 percentage point increase in turnout in low-profile, low interest elections—which they defined as special elections that included only ballot initiatives and referenda, and did not include candidate races. The authors concluded that the introduction of all vote-by-mail in Oregon led to a novelty effect that dissipated after three subsequent elections. Additionally, they concluded that any lasting turnout effects of all vote-by-mail are most likely limited to subfederal contests, precisely where voter interest is lowest and the relative impact of lowering of the costs of voting would be greatest.
Study 7 assessed the extent to which Colorado’s adoption of all vote-by-mail in 2013 affected turnout in the 2014 midterm election. The authors noted that when Colorado adopted all vote-by-mail, it retained all previously available voting options (i.e., voting in-person prior to or on Election Day). Thus, the authors asserted, their results reflect the effect of adding vote-by-mail as an option, rather than switching to vote by mail as the only option. Using county-level data from the Election Assistance Commission for all presidential and midterm elections from 2004 through 2014 and multivariate linear regression models, the authors estimated the effect of an all vote-by-mail election on turnout among registered individuals. Because same day registration was adopted at the same time as the all vote-by-mail policy, the authors excluded all individuals who voted using same day registration from their analysis. They reported that the all vote-by-mail system implemented in the 2014 election was associated with increases in turnout across all four models they used, ranging from 2.5 percentage points to 5.1 percentage points.

All Vote-by-Mail
Page 95 GAO-16-630 Registering Voters and Administering Elections
Studies 20 and 21 (from one publication) found that turnout was lower in California precincts that conducted elections exclusively by mail compared to California precincts that used polling places in combination with the opportunity to cast absentee ballots. The authors took advantage of a “natural experiment” created by a state law in California that allows county registrars to designate any precinct with fewer than 250 registrants as an all vote-by-mail precinct. The authors noted that since this natural experiment did not perfectly mimic random assignment, they used matching methods to pair each all vote-by-mail precinct with precincts where elections were conducted using polling places and absentee ballots, and contained populations with similar demographic and political attributes (e.g., similar partisanship balances among the electorate and similar margins of victory between the top two contestants). Study 20 assessed turnout differences between the two groups across 9 counties in the 2002 midterm election. Study 21 assessed differences between the two groups across 18 counties in connection with the 2000 presidential election. Using precinct-level data, the authors reported that turnout among voters in all vote-by-mail precincts was 1.5 and 2.7 percentage points lower than turnout among voters in polling place precincts for the 2002 midterm election and 2000 presidential election, respectively. The authors concluded that shifting elections from the polling place to the mailbox risks producing a decline in turnout for regularly scheduled general elections.
Observations on cost, voter convenience, and other considerations
State and local election officials we met with in Colorado and Oregon generally agreed that all vote-by-mail elections save on costs and are easier to administer than elections where votes are cast at polling places. For instance, according to the Colorado Director of Elections, many Colorado counties reported that the change to all vote-by-mail (which Colorado did in 2013) saved their jurisdictions money in the administration of elections. Further, this official said that counties reported that the primary area of cost savings was personnel costs, due to not having to staff as many locations. Additionally, officials in one local jurisdiction said that they believed that the all vote-by-mail system they use saves money because they do not have to maintain as much voting equipment, hire as many poll workers, or rent polling places.
Chief election officials from three local jurisdictions stated that voting by mail allows voters whatever time they need to research the relevant issues and cast a ballot. On the other hand, the chief local

All Vote-by-Mail
Page 96 GAO-16-630 Registering Voters and Administering Elections
election official from one local jurisdiction noted that filling out a ballot in one’s own home may compromise privacy or allow for coercion in the voting process (for example, from other family members).
The Presidential Commission on Election Administration reported several challenges associated with conducting elections by mail.c For instance, the Commission reported that voting by mail requires successful delivery and receipt of the ballot at many stages in the voting pipeline. Thus, ballots can be lost in the mail or can be mailed out or received too late for timely voting. They also reported that voters occasionally make mistakes in complying with various signature and other requirements in order for their mail ballots to be counted. Nevertheless, the Commission reported that appropriate safeguards could mitigate these risks—such as establishing communication with the local Postmaster and implementing ballot tracking mechanisms.
The state election directors in both Colorado and Oregon—which conduct all vote-by-mail elections—reported having little concern with the security and integrity of administering all vote-by-mail elections. These officials noted that their states require one or more local election officials to compare signatures on the ballots with signatures in their states’ respective voter registration databases and validate each signature individually. Additionally, one local jurisdiction we visited implemented a ballot tracking system that uses postal barcodes to track mail ballot envelopes from the time they are printed through every stage of the postal process, up to the time when they have been delivered to the local jurisdiction. This system provides reports to local election officials about the status of all mail ballots and can be used by individual voters to obtain status updates, including notifications that their ballots have been accepted for counting (or rejected due a signature discrepancy).
aSee Haw. Rev. Stat. Ann. § 11-91.5; Nev. Rev. Stat. Ann. § 293.213; N.D. Cent. Code § 16.1-11.1-01; Utah Code Ann. § 20A-3-302. bAccording to the study, all vote-by-mail was available as a local option since 1987 and was first used on a statewide basis to administer a 1993 special election. cPresidential Commission on Election Administration, The American Voting Experience.
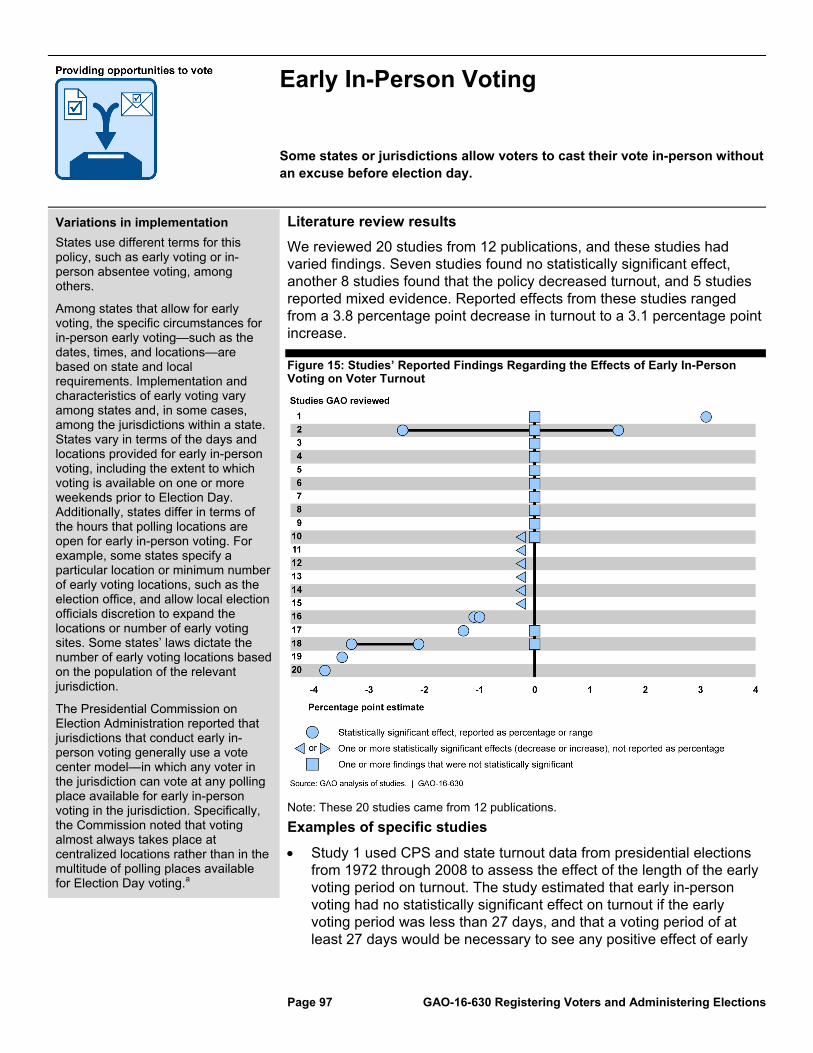
Early In-Person Voting
Some states or jurisdictions allow voters to cast their vote in-person without an excuse before election day.
Page 97 GAO-16-630 Registering Voters and Administering Elections
Variations in implementation
States use different terms for this policy, such as early voting or in-person absentee voting, among others.
Among states that allow for early voting, the specific circumstances for in-person early voting—such as the dates, times, and locations—are based on state and local requirements. Implementation and characteristics of early voting vary among states and, in some cases, among the jurisdictions within a state. States vary in terms of the days and locations provided for early in-person voting, including the extent to which voting is available on one or more weekends prior to Election Day. Additionally, states differ in terms of the hours that polling locations are open for early in-person voting. For example, some states specify a particular location or minimum number of early voting locations, such as the election office, and allow local election officials discretion to expand the locations or number of early voting sites. Some states’ laws dictate the number of early voting locations based on the population of the relevant jurisdiction.
The Presidential Commission on Election Administration reported that jurisdictions that conduct early in-person voting generally use a vote center model—in which any voter in the jurisdiction can vote at any polling place available for early in-person voting in the jurisdiction. Specifically, the Commission noted that voting almost always takes place at centralized locations rather than in the multitude of polling places available for Election Day voting.a
Literature review results
We reviewed 20 studies from 12 publications, and these studies had varied findings. Seven studies found no statistically significant effect, another 8 studies found that the policy decreased turnout, and 5 studies reported mixed evidence. Reported effects from these studies ranged from a 3.8 percentage point decrease in turnout to a 3.1 percentage point increase.
Figure 15: Studies’ Reported Findings Regarding the Effects of Early In-Person Voting on Voter Turnout
Note: These 20 studies came from 12 publications.
Examples of specific studies
Study 1 used CPS and state turnout data from presidential elections from 1972 through 2008 to assess the effect of the length of the early voting period on turnout. The study estimated that early in-person voting had no statistically significant effect on turnout if the early voting period was less than 27 days, and that a voting period of at least 27 days would be necessary to see any positive effect of early

Early In-Person Voting
Page 98 GAO-16-630 Registering Voters and Administering Elections
in-person voting on turnout. Further, the authors estimated that a 45-day early voting period would lead to a 3.1 percentage-point increase in turnout. However, the authors note that 45 days is a longer voting period than most states allow.
Study 2 found that early in-person voting had mixed effects on turnout, depending on how long the policy had been in place. Using aggregate turnout data from 500 randomly selected counties nationwide, the authors analyzed turnout in these counties for presidential elections from 1972 through 2004 and examined the change in turnout in each county before and after the county implemented early in-person voting. The study found that the first time early in-person voting was offered in a presidential election, it increased county-level turnout by 1.5 percentage points compared to the previous presidential election, but the second time early in-person voting was offered in a presidential election, it decreased county-level turnout by 2.4 percentage points (also compared to the previous presidential election); the study found no statistically significant effect of this policy in the third presidential election after it was introduced (again, compared to the previous presidential election).
Study 10 used CPS data covering presidential and midterm elections from 1980 through 2010 and found no statistically significant effects of early in-person voting on turnout among Whites and Blacks, but found evidence that early in-person voting decreased turnout among Latinos in states that offered this policy compared to states that did not, though the effect was not stated in terms of a percentage point difference.
Studies 19 and 20, which are from one publication, analyzed the effect of early in-person voting on county-level turnout across multiple states (collected from several sources) in the 2012 and 2008 presidential elections, respectively. The studies found that the statewide availability of this policy decreased turnout by 3.8 percentage points in the 2008 election and by 3.5 percentage points in the 2012 election in counties that offered it in each election compared to counties where it was not offered. The author suggested that early in-person voting depresses turnout by decreasing the civic energy traditionally associated with Election Day as well as get-out-the-vote (GOTV) efforts and media attention in the weeks before Election Day. However, the author also included in his analysis a variable that accounted for the number of early voting locations (per 1,000 voting-age residents) and found that a greater number of early voting locations was associated with higher turnout. The author
Early In-Person Voting
Page 99 GAO-16-630 Registering Voters and Administering Elections
concluded that while adopting early in-person voting at the state level fails to increase turnout, adopting early voting and also providing an ample number of locations could lower voters’ costs enough to increase turnout.
Observations on cost, voter convenience, and other considerations
Although there can be costs associated with opening polling places for additional days, the Presidential Commission on Election Administration reported that these costs could be offset because fewer polling places could be needed on Election Day, although the Commission noted that adequate facilities should remain available on Election Day to ensure reasonable wait times.b Officials in one local jurisdiction we visited said they were able to reduce Election Day polling places by 20 percent because of early voting opportunities, including early in-person voting and no-excuse absentee voting.
Officials from one local jurisdiction we visited said that early in-person voting increases convenience for voters and reduces wait times on Election Day. These officials noted that early in-person voting can also reduce the effect of any problems that arise on Election Day—for example, if there is inclement weather, individuals who vote early are unlikely to be affected.
In a nationwide survey we conducted following the November 2012 election, officials in 23 states reported that the availability of alternative voting options, including early in-person voting, can affect wait times on Election Day. In some cases, officials reported that they believed that no or limited opportunities for voting outside of Election Day were a contributing factor to long wait times on Election Day.c
aPresidential Commission on Election Administration, The American Voting Experience. bPresidential Commission on Election Administration, The American Voting Experience. cGAO, Elections: Observations on Wait Times for Voters on Election Day 2012, GAO-14-850 (Washington, D.C.: Sept. 30, 2014). For this report, we conducted a web-based survey of election officials from a nationally representative stratified random sample of 423 local election jurisdictions, excluding jurisdictions with populations of 10,000 or fewer and jurisdictions in Oregon and Washington, which were vote-by-mail states for the November 2012 election. On the basis of our survey results, of the jurisdictions nationwide that had wait times officials considered too long at a few or more polling places on election day, we estimate that in 24 percent (from 15 to 37 percent), officials believe no or limited opportunities for voting outside of election day was a contributing factor.

Hours Available for Voting States and local jurisdictions determine the hours available for voting on Election Day or any available early voting days, and the number of hours available for voting can be longer in some locations than others.
Page 100 GAO-16-630 Registering Voters and Administering Elections
Variations in implementation
Current federal law does not dictate the hours that polling places are required to be open on Election Day. Some states establish statewide requirements for the times that voting will be available, while other states may allow for local discretion regarding the opening and closing times for the polls. For example, Delaware state law requires polling places to open at 7:00 a.m. and close at 8:00 p.m.a Kansas state law establishes poll hours from 7:00 a.m. to 7:00 p.m., unless different hours are set and publicly announced by the county election officer, and if different hours are set state law requires the polls to be open at least 12 continuous hours (opening no earlier than 6:00 a.m., closing no earlier than 7:00 p.m. and no later than 8:00 p.m.).b In Vermont, each town sets polling place hours, though state law requires that the polls open no earlier than 5:00 a.m. and no later than 10:00 a.m. and that polls close at 7:00 p.m.c
The literature we reviewed addressed the hours for voting on Election Day, but states and local jurisdictions may also vary the hours available for voting during early in-person voting. For example, polling places can be open different hours on weekdays compared to weekends during the early voting period.
Literature review results
Two studies from two different publications examined the effects of extending poll hours. Both studies found evidence that extended poll hours could increase turnout, although one of the two studies also found no statistically significant effect in one portion of the study’s analysis.
Figure 16: Studies’ Reported Findings Regarding the Effects of Hours Available for Voting on Voter Turnout
Note: These two studies came from two publications.
Examples of specific studies
Using CPS data from the 2000 presidential election, Study 1 examined the effects of states having polling places open before 7:00 a.m. (compared to states that did not have polling places open before that time) and the effects of having polling places open after 7:00 p.m. (compared to states that did not have polling places open after that time). The study reported an estimated 1.7 percentage point increase in turnout from opening polling places before 7:00 a.m. and a 1.0 percentage point increase in turnout from keeping polling places open after 7:00 p.m.
The authors of study 2 compiled an original data set of state turnout rates for presidential elections from 1920 through 2000 using vote totals provided by the Clerk of the U.S. House of Representatives and population data from the U.S. Census Bureau’s Statistical Abstracts of the United States. The study uses three multivariate regression models—one for all 50 states, one for 11 southern states, and one for 39 non-southern states to look at the effect of the varying number of hours the polls are open, by state, on turnout. The study found that the number of hours that polls were open did not have a statistically significant effect in the models for all 50 states or southern states, but the model for non-southern states indicated a statistically significant relationship between the total number of hours that the polls are open
Hours Available for Voting
Page 101 GAO-16-630 Registering Voters and Administering Elections
on Election Day and voter turnout particularly between non-Southern states that had shorter polling days (4 to 5 hours) and those that had longer polling days (9 to 10 hours).d The authors noted a possible decrease in turnout from having the polls open for more than 11 hours, and suggested that there is a point (around 10 hours) at which state turnout rates are maximized.
Observations on cost, voter convenience, and other considerations
Keeping polling locations open for additional hours may have cost implications. For example, election officials in one local jurisdiction we visited said the election office must pay for the marginal cost of having the facility open for the additional voting hours, which can include costs such as utilities or building security. Similarly, states or local jurisdictions that pay poll workers by an hourly rate would incur additional costs from having polling places open additional hours.
Additional poll hours may provide additional convenience to some voters. According to CPS data for general elections from 2000 through 2014, the most commonly reported reason among registered voters for not voting was being too busy or having a conflicting schedule. Extending voting hours may provide additional options for some voters whose schedules conflict with existing available hours for voting.
Election offices can face challenges in recruiting poll workers, partly because of the hours workers are required to be at polling locations, and election offices may face increased challenges in recruiting poll workers for longer voting days. The EAC has reported that many people find the long hours required of poll workers to be a deterrent to serving as a poll worker.e According to the EAC, to address the issue that some individuals may not want to work long hours on Election Day, some jurisdictions allow poll workers to work split shifts. However the EAC notes that such split shifts are sometimes controversial because they can create administrative difficulties; for example, poll workers for later shifts may not show up to replace those who are scheduled to leave.f
aDel. Code Ann. tit. 15, § 3104. bThe hours noted are those for Kansas counties located in the central time zone. The provisions for Kansas counties located in the mountain time zone are set an hour earlier, local time, to be similar to the hours for Kansas counties in the central time zone. Polls for counties in the mountain time zone are to be open from 6:00 a.m. to 6:00 p.m., unless
Hours Available for Voting
Page 102 GAO-16-630 Registering Voters and Administering Elections
different hours are set and publicly announced by the county election officer, and if different hours are set state law requires the polls to be open at least 12 continuous hours (opening no earlier than 5:00 a.m., closing no earlier than 6:00 p.m. and no later than 7:00 p.m.). Kan. Stat. Ann. § 25-106. cVt. Stat. Ann. tit. 17, § 2561. dThe article does not provide detailed data for the polling hours used for each state and election in the scope of the study (1920 through 2000). From the information in the article, it is unclear which state(s) had polling days of 4 to 5 hours and for which elections the state(s) had those hours. eEAC, Guidebook on Successful Practices for Poll Worker Recruitment, Training, and Retention (July 2007). fEAC, Guidebook on Successful Practices for Poll Worker Recruitment, Training, and Retention.
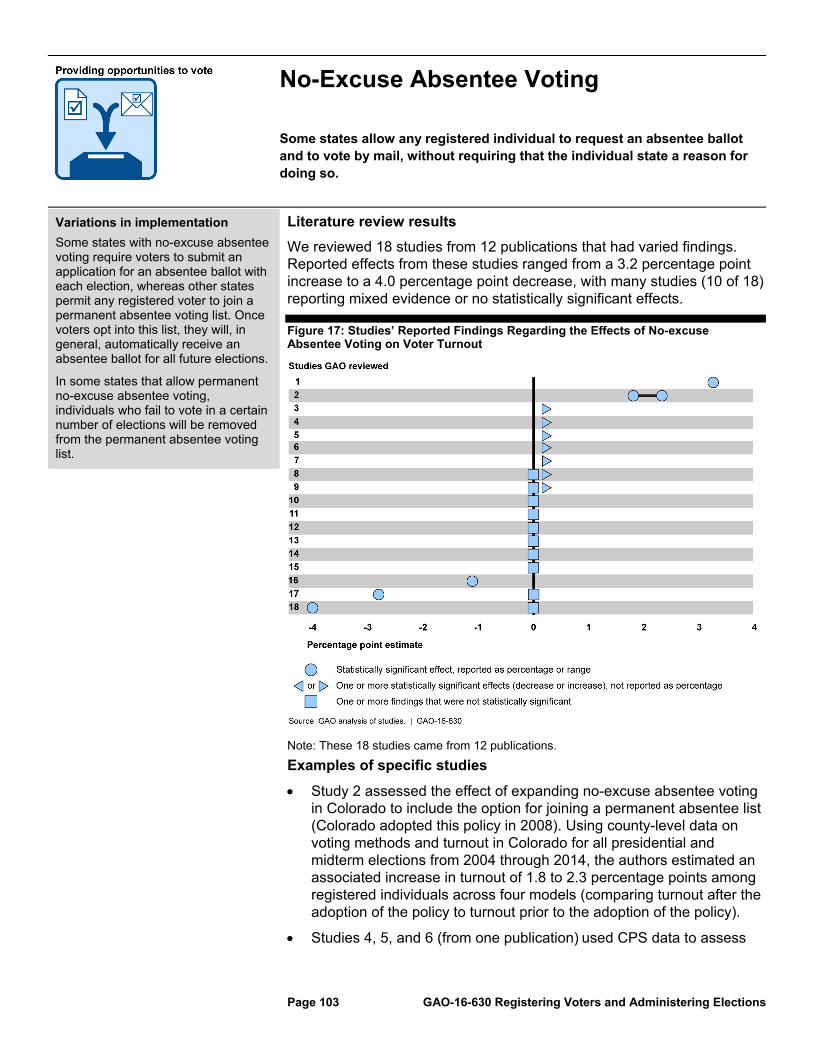
No-Excuse Absentee Voting Some states allow any registered individual to request an absentee ballot and to vote by mail, without requiring that the individual state a reason for doing so.
Page 103 GAO-16-630 Registering Voters and Administering Elections
Variations in implementation
Some states with no-excuse absentee voting require voters to submit an application for an absentee ballot with each election, whereas other states permit any registered voter to join a permanent absentee voting list. Once voters opt into this list, they will, in general, automatically receive an absentee ballot for all future elections.
In some states that allow permanent no-excuse absentee voting, individuals who fail to vote in a certain number of elections will be removed from the permanent absentee voting list.
Literature review results
We reviewed 18 studies from 12 publications that had varied findings. Reported effects from these studies ranged from a 3.2 percentage point increase to a 4.0 percentage point decrease, with many studies (10 of 18) reporting mixed evidence or no statistically significant effects.
Figure 17: Studies’ Reported Findings Regarding the Effects of No-excuse Absentee Voting on Voter Turnout
Note: These 18 studies came from 12 publications.
Examples of specific studies
Study 2 assessed the effect of expanding no-excuse absentee voting in Colorado to include the option for joining a permanent absentee list (Colorado adopted this policy in 2008). Using county-level data on voting methods and turnout in Colorado for all presidential and midterm elections from 2004 through 2014, the authors estimated an associated increase in turnout of 1.8 to 2.3 percentage points among registered individuals across four models (comparing turnout after the adoption of the policy to turnout prior to the adoption of the policy).
Studies 4, 5, and 6 (from one publication) used CPS data to assess
No-Excuse Absentee Voting
Page 104 GAO-16-630 Registering Voters and Administering Elections
the effects of both permanent no-excuse absentee voting and nonpermanent no-excuse absentee voting on turnout in the 2000, 2004, and 2008 presidential elections, respectively. Each study found that both forms of no-excuse absentee voting were associated with a higher probability of voting among individuals in states that allowed these voting options than in states that did not allow these options. However, the authors did not report their findings in terms of percentage point effects on turnout.
Studies 15 and 16 (from one publication) assessed the effect of no-excuse absentee voting in midterm and presidential elections, respectively. These studies utilized state-level turnout data from all 50 states for elections held from 1980 through 2006. Study 15, related to midterm elections, found no statistically significant effect on turnout associated with no-excuse absentee voting (comparing turnout in states that had no-excuse absentee voting to states that did not). Study 16, related to presidential elections, estimated a decrease in turnout of 1.1 percentage points in states that allowed no-excuse absentee voting, compared to states that did not.
Study 17 attempted to determine the extent to which no-excuse absentee voting affected turnout and the extent to which the effect persisted in subsequent elections after its introduction. Using turnout data from 500 randomly selected counties nationwide, and examining turnout in presidential elections from 1972 through 2004, the authors of this study reported that the policy had no statistically significant effects on turnout in the first two presidential elections after it was introduced. However, they estimated a 2.8 percentage point decrease in turnout associated with the third presidential election after the policy became available.
Observations on cost, voter convenience, and other considerations
The author of one publication reported cost savings associated with administering permanent no-excuse absentee ballots versus administering nonpermanent no-excuse absentee ballots.a Specifically, the author reported that in the 2008 presidential election, Contra Costa County in California spent $1.37 per ballot to administer about 215,000 permanent no-excuse absentee ballots versus $10.64 per ballot to administer about 40,000 nonpermanent no-excuse absentee ballots. Some of the cost savings, the author explained, come from not having to process individual requests for each ballot. The author notes, however, that while the lower cost for administering permanent absentee ballots is encouraging, it is important to remember that mail ballots still represent additional costs in the
No-Excuse Absentee Voting
Page 105 GAO-16-630 Registering Voters and Administering Elections
conduct of elections as long as a jurisdiction is also staffing polling places.
Some jurisdictions may choose to pay for return postage on absentee ballots, which transfers this cost from the voter to the jurisdiction. In 2010, the EAC reported that approximately 30 percent of survey respondents in a nationwide EAC study believed that free postage would make them more likely to vote in an election. However, only 9 percent of respondents indicated that without a free postage program there was a significant chance they would not vote in an election.b
Officials in one local jurisdiction we visited said that enabling more people to vote by mail through no-excuse absentee voting can reduce the number of people voting in person on Election Day. These officials said they plan to send an absentee application to all registered individuals with an active registration prior to the 2016 presidential election to encourage the use of absentee voting. They said the amount of cost savings from this effort will depend on how many people use this option. They anticipate an increase in the use of absentee voting and expect some overall cost savings from this effort, but noted that absentee mail voting also has labor costs—such as costs associated with processing the requests, mailing the ballots, and performing signature verifications, among other things.
aRobert S. Montjoy, “The Changing Nature . . . and Costs . . . of Election Administration,” Public Administration Review, vol. 70, no. 6 (2010). bEAC, Absentee Postage – EAC Summary and Recommendations, (Washington, D.C.: Sept. 7 2010).
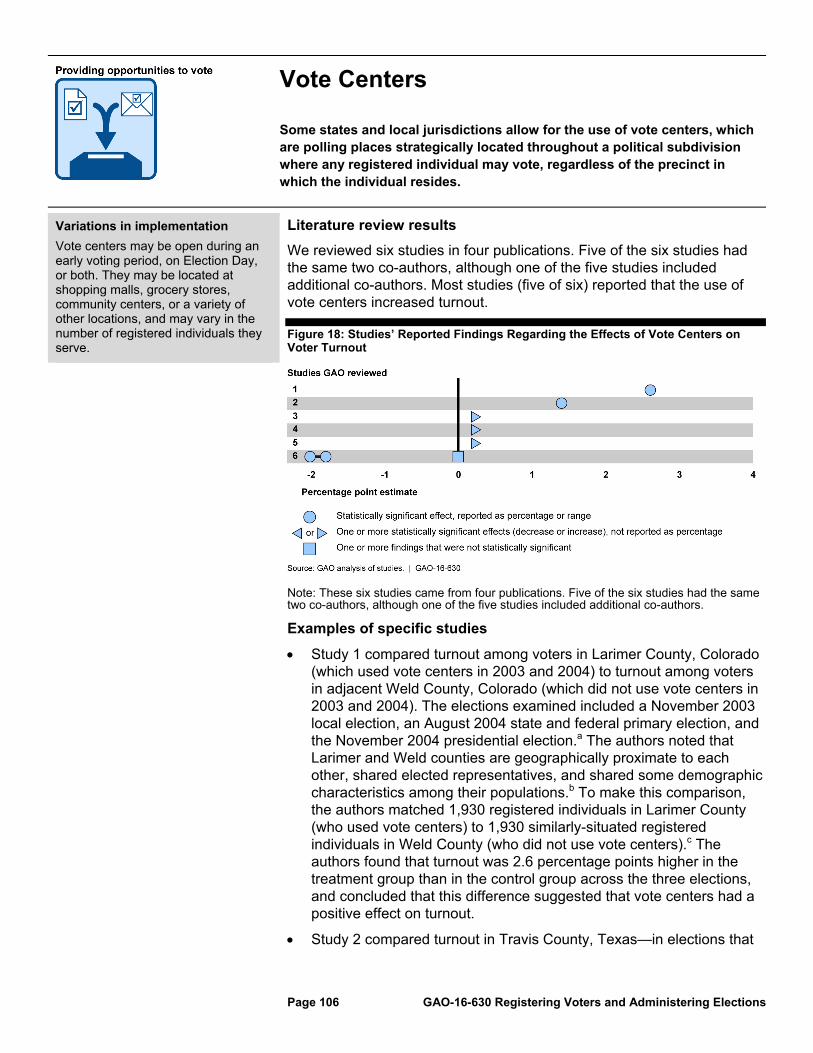
Vote Centers Some states and local jurisdictions allow for the use of vote centers, which are polling places strategically located throughout a political subdivision where any registered individual may vote, regardless of the precinct in which the individual resides.
Page 106 GAO-16-630 Registering Voters and Administering Elections
Variations in implementation
Vote centers may be open during an early voting period, on Election Day, or both. They may be located at shopping malls, grocery stores, community centers, or a variety of other locations, and may vary in the number of registered individuals they serve.
Literature review results
We reviewed six studies in four publications. Five of the six studies had the same two co-authors, although one of the five studies included additional co-authors. Most studies (five of six) reported that the use of vote centers increased turnout.
Figure 18: Studies’ Reported Findings Regarding the Effects of Vote Centers on Voter Turnout
Note: These six studies came from four publications. Five of the six studies had the same two co-authors, although one of the five studies included additional co-authors.
Examples of specific studies
Study 1 compared turnout among voters in Larimer County, Colorado (which used vote centers in 2003 and 2004) to turnout among voters in adjacent Weld County, Colorado (which did not use vote centers in 2003 and 2004). The elections examined included a November 2003 local election, an August 2004 state and federal primary election, and the November 2004 presidential election.a The authors noted that Larimer and Weld counties are geographically proximate to each other, shared elected representatives, and shared some demographic characteristics among their populations.b To make this comparison, the authors matched 1,930 registered individuals in Larimer County (who used vote centers) to 1,930 similarly-situated registered individuals in Weld County (who did not use vote centers).c The authors found that turnout was 2.6 percentage points higher in the treatment group than in the control group across the three elections, and concluded that this difference suggested that vote centers had a positive effect on turnout.
Study 2 compared turnout in Travis County, Texas—in elections that

Vote Centers
Page 107 GAO-16-630 Registering Voters and Administering Elections
occurred before and after the county adopted vote centers—and found that the use of vote centers increased turnout by 1.4 percentage points. Specifically, the authors compared turnout in a 2009 statewide constitutional amendment election (before Travis County adopted vote centers) to turnout in a 2011 statewide constitutional amendment election (after the county adopted vote centers).d The authors noted that the elections were similar to one another and there were no significant campaigns related to any of the amendments in either election (11 amendments in 2009 and 10 amendments in 2011). To make the comparison, the authors obtained the Travis County voter file and filtered it to exclude any individual who was not eligible to vote in both elections. The authors explained that in Travis County, most of the precinct polling sites used in the 2009 election continued to operate in the 2011 election but were converted to vote centers, and the county also added six new vote center locations for the 2011 election (for a total of 187 vote center locations). As such, Travis County adopted the openness of vote centers—so that anyone in the county could vote at any location—without centralizing the polling places. This, the authors asserted, allowed them to isolate the effects of openness on turnout apart from effects that might result from consolidating the total number of polling places; however, the Travis County model likely differs from most other vote center models where consolidation is a key aspect.
Study 6 assessed the effect of vote centers on turnout in the 2006 midterm election for 61 of Colorado’s 64 counties.e Using county-level turnout data, the authors compared turnout among counties that used vote centers and counties that did not.f The authors used three different models to assess the effect of vote centers on turnout and the extent to which turnout also may have been influenced by electoral competition. The authors reported decreases in turnout of 2 and 1.8 percentage points in counties using vote centers for two of the models and no statistically significant effect in the third model. The authors noted that these findings match some basic statistics regarding which counties chose to make the switch to vote centers, with counties that chose to make the switch having lower overall turnout in both the 1998 and 2002 midterm elections also. Thus, the authors concluded, the causal direction of the relationship between vote centers and turnout remains unclear.
Observations on cost, voter convenience, and other considerations
A study sponsored by the Indiana Secretary of State and published in 2010 concluded that Election Day vote centers would likely produce

Vote Centers
Page 108 GAO-16-630 Registering Voters and Administering Elections
significant cost savings for all counties that might implement them due to efficiencies gained from having fewer overall polling places and poll workers on Election Day, and reducing the number of voting machines necessary.g Informed by a previous study relating specifically to the implementation of Election Day vote centers at three pilot sites, authors of this study developed a model that estimated possible cost savings associated with implementing Election Day vote centers in each county. Compared to a precinct-based process, the authors estimated that Election Day vote centers would result in cost-per-vote savings ranging from 20 percent to 56 percent across Illinois counties.h
The chief election official in one local jurisdiction we visited said that vote centers are easier to manage and result in cost savings for the jurisdiction, compared to managing traditional precinct locations. Specifically, this official said that having a smaller number of locations and not having to hire as many poll workers results in cost savings. Additionally, the official said, vote centers provide a better experience for voters because, in this jurisdiction, permanent elections office staff, rather than temporary poll workers, are always present to answer any questions or address any concerns.
According to one publication we reviewed, although vote centers are typically fewer in number across jurisdictions and may be greater distances from individuals’ residences than are precinct-based polling places, they increase the number of sites available to potential voters, and may be more complementary with people’s daily routines than exclusive precinct locations. The authors note that having vote centers available might be particularly important for those individuals who commute longer distances to work, as precinct-based polling locations might only be accessible to them in the mornings or evenings, while other polling locations might be nearer to their workplaces and more accessible throughout the day.i
The EAC guidelines state that vote centers require the use of electronic poll books and a secure real-time connection to a central election office voter registration database to ensure that no voters can vote twice in an election.j Additionally, the National Conference of State Legislatures reported that vote centers must be able to produce the appropriate ballot for each voter.k This requires either touchscreen machines that can be reset for each voter, "print-on-demand" equipment, or sufficient quantities of paper ballots for every ballot style. Thus, there may be initial investments required for some jurisdictions wishing to convert to a vote center model.

Vote Centers
Page 109 GAO-16-630 Registering Voters and Administering Elections
aAccording to a co-author of this study, in Larimer County, a limited number of Election Day vote centers were also used as early voting vote centers in the 2003 and 2004 elections. bThe authors explained that having shared representatives meant that voters in both Larimer and Weld voted for and participated in many of the same contests for public office. Moreover, voters in both counties experienced the same campaigns and candidates’ messages that influenced voter turnout. According to the authors, the two counties were statistically similar on indices of age, homeownership and income; however, Weld had a larger Hispanic population than Larimer (28 percent compared to 10 percent), and Larimer had a higher percent of adults with a college education (40 percent compared to 22 percent). cFor example, this procedure would attempt to match a 38-year-old female who was registered with a major party and had voted in five previous elections as of November 2003 in Larimer County with a corresponding 38-year-old female who was registered with a major party and had voted in five previous elections as of November 2003 in Weld County. dAccording to two co-authors of this study, early voting was available at a limited number of locations in both the 2009 and 2011 elections. These co-authors further noted that in 2009, prior to the transition to Election Day vote centers, early voting polling locations were open to all registered individuals in the county. Thus, Travis County was operating a vote center type model for early voting in the 2009 election. eIn the 2006 midterm election, Colorado counties had the option for voting in-person during an early voting period as well as on Election Day. According to the study, one or more counties in Colorado used a vote center model for early in-person voting in the 2006 midterm election. fThe authors note that 29 percent of the counties in the sample used vote centers. gIndiana Fiscal Policy Institute, Vote Centers and Election Costs: A Study on the Fiscal Impact of Vote Centers in Indiana, (Indianapolis, Indiana: January 2010). hThese estimates assume the same number of registered individuals for each county as in 2008. The estimates further assume a vote center for each 3,000 registered individuals and 8 poll workers per vote center. iRobert M. Stein, Greg Vonnahme, “Engaging the Unengaged Voter: Vote Centers and Voter Turnout,” The Journal of Politics, vol. 70, no. 2 (2008). jEAC, Election Management Guidelines: Chapter 9: Polling Place and Vote Center Management (no publication location or date provided in document), available for download at http://www.eac.gov/election_management_resources/election_management_guidelines.aspx. kNational Conference of State Legislatures, Vote Centers website, accessed April 27, 2016, http://www.ncsl.org/research/elections-and-campaigns/vote-centers.aspx.
Appendix V: Bibliography
Page 110 GAO-16-630 Registering Voters and Administering Elections
This bibliography contains citations for the studies in the 53 publications we reviewed regarding policies and practices that may affect voter turnout.1 The publications listed below include one or more studies for which the design, implementation, and analyses were sufficiently sound to support the results and conclusions, based on generally accepted social science principles.2 (See appendix II for more information about how we made these determinations.) Publications may be listed multiple times—once under each policy or practice within our scope that the publication’s authors analyzed—and following the citation we include the study numbers that correspond to content in the individual policy summaries earlier in this report. For example, in the e-mail policy summary, figure 8 in appendix IV depicts findings from 18 studies (each numbered in the figure), and the numbers 1 through 18 in the figure correspond to the numbers listed following citations for publications that analyzed the effect of e-mail on voter turnout.
Haenschen, Katherine. “@ The Vote: Four Experiments Using Facebook & Email To Increase Voter Turnout.” Prepared for the American Political Science Association Conference, September 2015. (Study 17)
Malhotra, Neil; Melissa R. Michelson; and Ali Adam Valenzuela. “Emails from Official Sources Can Increase Turnout.” Quarterly Journal of Political Science, vol. 7, no. 3, (2012): 321-332. (Studies 1–3)
Nickerson, David W. “Does Email Boost Turnout?” Quarterly Journal of Political Science, vol. 2, no. 4, (2007): 369-379. (Studies 4–16)
Ulbig, Stacy G. and Tamara Waggener. “Getting Registered and Getting to the Polls: The Impact of Voter Registration Strategy and Information
1For purposes of our review, we classified relevant chapters in edited books as separate publications. We did this because it was in keeping with how we categorized other publications (usually journal articles written by distinct authors). 2As used in this report, a “study” is an analysis or experiment with a unique sample. In some cases, authors presented their findings broken down by type of election (e.g., presidential vs. midterm) or election year (e.g., 2002 and 2004). In these instances, we considered the findings related to the separate types of elections or time periods as resulting from separate samples (thus, separate “studies,” as we use the term in this report).
Appendix V: Bibliography

Appendix V: Bibliography
Page 111 GAO-16-630 Registering Voters and Administering Elections
Provision on Turnout of College Students.” PS: Political Science and Politics, vol. 44, no. 3, (2011): 544-551. (Study 18)
Abrajano, Marisa and Costas Panagopoulos. “Does Language Matter? The Impact of Spanish Versus English-Language GOTV Efforts on Latino Turnout.” American Politics Research, vol. 39, no. 4, (2011): 643-663. (Study 7)
Bedolla, Lisa Garcia and Melissa R. Michelson. “What Do Voters Need to Know? Testing the Role of Cognitive Information in Asian American Voter Mobilization.” American Politics Research, vol. 37, no. 2, (2009): 254-274. (Studies 2, 34, and 36)
Davenport, Tiffany C.; Alan S. Gerber; Donald P. Green; Christopher W. Larimer; Christopher B. Mann; and Costas Panagopoulos. “The Enduring Effects of Social Pressure: Tracking Campaign Experiments over a Series of Elections.” Political Behavior, vol. 32, no. 3, (2010): 423-430. (Studies 3, 8, 10, 13, 27, and 28)
Gerber, Alan S.; Gregory A. Huber; Daniel R. Biggers; and David J. Hendry. “Ballot Secrecy Concerns and Voter Mobilization: New Experimental Evidence about Message Source, Context, and the Duration of Mobilization Effects.” American Politics Research, vol. 42, no. 5, (2014): 896-923. (Studies 4 and 14)
Mann, Christopher B. and Lindsay Pryor, 2013 ERIC Voter Registration Outreach in Washington State. Accessed July 23, 2015, http://www.sos.wa.gov/assets/elections/2013-ERIC-Voter-Registration-in-Washington-State-FINAL-3-20-2014.pdf. (Study 16)
Mann, Christopher B. and Lisa A. Bryant. “If You Ask, They Will Come (to Register and Vote): Field Experiments with State Election Agencies on Encouraging Voter Registration.” Prepared for the MIT Conference on Election Administration, June 8, 2015. (Studies 6 and 17)
Matland, Richard E. and Gregg R. Murray. “An Experimental Test of Mobilization Effects in a Latino Community.” Political Research Quarterly, vol. 65, no. 1, (2012): 192-205. (Study 1)
Matland, Richard E. and Gregg R. Murray. “I Only Have Eyes for You: Does Implicit Social Pressure Increase Voter Turnout?” Political Psychology (2015). (Studies 11, 22–24, and 35)
Mailings

Appendix V: Bibliography
Page 112 GAO-16-630 Registering Voters and Administering Elections
Murray, Gregg R. and Richard E. Matland. “Mobilization Effects Using Mail: Social Pressure, Descriptive Norms, and Timing.” Political Research Quarterly, vol. 67, no. 2, (2014): 304-319. (Studies 20 and 21)
Panagopoulos, Costas. “I’ve Got My Eyes on You: Implicit Social-Pressure Cues and Prosocial Behavior.” Political Psychology, vol. 35, no. 1, (2014): 23-33. (Study 15)
Panagopoulos, Costas. “Raising Hope: Hope Inducement and Voter Turnout.” Basic and Applied Social Psychology, vol. 36, no. 6, (2014): 494-501. (Studies 25 and 26)
Panagopoulos, Costas; Christopher W. Larimer; and Meghan Condon. “Social Pressure, Descriptive Norms, and Voter Mobilization.” Political Behavior, vol. 36, no. 2, (2014): 451-469. (Study 5)
Ramírez, Ricardo. “Giving Voice to Latino Voters: A Field Experiment on the Effectiveness of a National Nonpartisan Mobilization Effort.” The ANNALS of the American Academy of Political and Social Science, vol. 601, no. 1, (2005): 66-84. (Studies 18, 19, and 30–33)
Trivedi, Neema. “The Effect of Identity-Based GOTV Direct Mail Appeals on the Turnout of Indian Americans.” The ANNALS of the American Academy of Political and Social Science, vol. 601, no. 1, (2005): 115-122. (Study 29)
Wolfinger, Raymond E; Benjamin Highton; and Megan Mullin. “How Postregistration Laws Affect the Turnout of Citizens Registered to Vote.” State Politics & Policy Quarterly, vol. 5, no. 1, (2005): 1-23. (Study 12)
Wong, Janelle S. “Mobilizing Asian American Voters: A Field Experiment.” The ANNALS of the American Academy of Political and Social Science, vol. 601, no. 1, (2005): 102-114. (Study 9)
Davenport, Tiffany C.; Alan S. Gerber; Donald P. Green; Christopher W. Larimer; Christopher B. Mann; and Costas Panagopoulos. “The Enduring Effects of Social Pressure: Tracking Campaign Experiments over a Series of Elections.” Political Behavior, vol. 32, no. 3, (2010): 423-430. (Study 1)
Robocalls
Appendix V: Bibliography
Page 113 GAO-16-630 Registering Voters and Administering Elections
Ramírez, Ricardo. “Giving Voice to Latino Voters: A Field Experiment on the Effectiveness of a National Nonpartisan Mobilization Effort.” The ANNALS of the American Academy of Political and Social Science, vol. 601, no. 1, (2005): 66-84. (Studies 2–6)
Dale, Allison and Aaron Strauss. “Don’t Forget to Vote: Text Message Reminders as a Mobilization Tool.” American Journal of Political Science, vol. 53, no. 4, (2009): 787-804. (Study 1)
Malhotra, Neil; Melissa R. Michelson; Todd Rogers; and Ali Adam Valenzuela. “Text Messages as Mobilization Tools: The Conditional Effect of Habitual Voting and Election Salience.” American Politics Research, vol. 39, no. 4, (2011): 664-681. (Studies 2 and 3)
Leighley, Jan E. and Jonathan Nagler. Who Votes Now? Demographics, Issues, Inequality, and Turnout in the United States. Princeton, New Jersey: Princeton University Press, 2013. (Study 2)
McDonald, Michael P.; Enrijeta Shino; and Daniel A. Smith. “Convenience Voting and Turnout: Reassessing the Effects of Election Reforms.” Prepared for the New Research on Election Administration and Reform Conference at MIT, June 8, 2015. (Studies 5 and 6)
Springer, Melanie J. “State Electoral Institutions and Voter Turnout In Presidential Elections, 1920-2000.” State Politics & Policy Quarterly, vol. 12, no. 3, (2012): 252-283. (Study 3)
Vonnahme, Greg. “Registration Deadlines and Turnout in Context.” Political Behavior, vol. 34, no. 4 (2012): 765-779. (Studies 1 and 4)
Alvarez, R. Michael; Stephen Ansolabehere; and Catherine H. Wilson. “Election Day Voter Registration in the United States: How One-Step Voting Can Change the Composition of the American Electorate.” Working paper, Caltech/MIT Voting Technology Project, June 2002. (Study 20)
Burden, Barry C. “Registration and Voting: A View from the Top” in The Measure of American Elections, ed. Barry C. Burden and Charles Stewart III. New York, New York: Cambridge University Press, 2014. (Studies 2 and 4)
Text Messages
Registration Closing Date prior to Elections
Same Day Registration

Appendix V: Bibliography
Page 114 GAO-16-630 Registering Voters and Administering Elections
Burden, Barry C.; David T. Canon; Kenneth R. Mayer; and Donald P. Moynihan. “Election Laws, Mobilization, and Turnout: The Unanticipated Consequences of Election Reform.” American Journal of Political Science, vol. 58, no. 1, (2014): 95-109. (Studies 12, 16, and 25–27)
Fitzgerald, Mary. “Greater Convenience but Not Greater Turnout: The Impact of Alternative Voting Methods on Electoral Participation in the United States.” American Politics Research, vol. 33, no. 6, (2005): 842-867. (Studies 8 and 15)
Fullmer, Elliott B. “Early Voting: Do More Sites Lead to Higher Turnout.” Election Law Journal, vol. 14, no. 2, (2015): 81-96. (Studies 10 and 14)
Hanmer, Michael J. Discount Voting: Voter Registration Reforms and Their Effects. New York, New York: Cambridge University Press, 2012. (Studies 6, 24, 28 and 29)
Keele, Luke and William Minozzi. “How Much Is Minnesota Like Wisconsin? Assumptions and Counterfactuals in Causal Inference with Observational Data.” Political Analysis, vol. 21, no. 2, (2013): 193-216. (Studies 30 and 31)
Larocca, Roger and John S. Klemanski. “U.S. State Election Reform and Turnout in Presidential Elections.” State Politics & Policy Quarterly, vol. 11, no. 1, (2011): 76-101. (Studies 21–23)
Leighley, Jan E. and Jonathan Nagler. Who Votes Now? Demographics, Issues, Inequality, and Turnout in the United States. Princeton, New Jersey: Princeton University Press, 2013. (Study 3)
McDonald, Michael P.; Enrijeta Shino; and Daniel A. Smith. “Convenience Voting and Turnout: Reassessing the Effects of Election Reforms.” Prepared for the New Research on Election Administration and Reform Conference at MIT, June 8, 2015. (Studies 17 and 18)
Neiheisel, Jacob R. and Barry C. Burden. “The Impact of Election Day Registration on Voter Turnout and Election Outcomes.” American Politics Research, vol. 40, no. 4, (2012): 636-664. (Study 9)
Pellissier, Allyson. “In Line or Online? American Voter Registration in the Digital Era.” Working paper, Caltech/MIT Voting Technology Project, February 18, 2014. (Study 33)

Appendix V: Bibliography
Page 115 GAO-16-630 Registering Voters and Administering Elections
Rocha, Rene R. and Tetsuya Matsubayashi. “The Politics of Race and Voter ID Laws in the States: The Return of Jim Crow?” Political Research Quarterly, vol. 67, no. 3, (2014): 666-679. (Study 32)
Springer, Melanie J. “State Electoral Institutions and Voter Turnout In Presidential Elections, 1920-2000.” State Politics & Policy Quarterly, vol. 12, no. 3, (2012): 252-283. (Study 5)
Street, Alex; Thomas A. Murray; John Blitzer; and Rajan S. Patel. “Estimating Voter Registration Deadline Effects with Web Search Data.” Political Analysis, vol. 23, no. 2 (2015): 225-241. (Study 11)
Tolbert, Caroline; Todd Donovan; Bridgett King; and Shaun Bowler. “Election Day Registration, Competition, and Voter Turnout” in Democracy in the States: Experiments in Election Reform, ed. Bruce E. Cain, Todd Donovan, and Caroline J. Tolbert. Washington, D.C.: Brookings Institution Press, 2008. (Studies 7 and 13)
Vonnahme, Greg. “Registration Deadlines and Turnout in Context.” Political Behavior, vol. 34, no. 4, (2012): 765-779. (Studies 1 and 19)
Burden, Barry C. “Registration and Voting: A View from the Top” in The Measure of American Elections, ed. Barry C. Burden and Charles Stewart III. New York, New York: Cambridge University Press, 2014. (Studies 3 and 16)
Gerber, Alan S.; Gregory A. Huber; and Seth J. Hill. “Identifying the Effect of All-Mail Elections on Turnout: Staggered Reform in the Evergreen State.” Political Science Research and Methods, vol. 1, no. 1, (2013): 91-116. (Studies 4, 8, 9 and 10)
Gronke, Paul and Peter Miller. “Voting by Mail and Turnout in Oregon: Revisiting Southwell and Burchett.” American Politics Research, vol. 40, no. 6, (2012): 976-997. (Study 1)
Gronke, Paul; Eva Galanes-Rosenbaum; and Peter A. Miller. “Early Voting and Voter Turnout” in Democracy in the States: Experiments in Election Reform, ed. Bruce E. Cain, Todd Donovan, and Caroline J. Tolbert. Washington, D.C.: Brookings Institution Press, 2008. (Studies 6 and 18)
All Vote-by-Mail

Appendix V: Bibliography
Page 116 GAO-16-630 Registering Voters and Administering Elections
Kousser, Thad and Megan Mullin. “Does Voting by Mail Increase Participation? Using Matching to Analyze a Natural Experiment.” Political Analysis, vol. 15, no. 4, (2007): 428-445. (Studies 20 and 21)
Larocca, Roger and John S. Klemanski. “U.S. State Election Reform and Turnout in Presidential Elections.” State Politics & Policy Quarterly, vol. 11, no. 1, (2011): 76-101. (Studies 12, 13, and 17)
Menger, Andrew; Robert M. Stein; and Greg Vonnahme. “Turnout Effects from Vote by Mail Elections.” Prepared for the 2015 Annual Meetings of the American Political Science Association, September 3-6, 2015. (Study 7)
Pellissier, Allyson. “In Line or Online? American Voter Registration in the Digital Era.” Working paper, Caltech/MIT Voting Technology Project, February 18, 2014 (Study 14)
Richey, Sean. “Voting by Mail: Turnout and Institutional Reform in Oregon.” Social Science Quarterly, vol. 89, no. 4, (2008): 902-915. (Studies 2 and 5)
Rocha, Rene R. and Tetsuya Matsubayashi. “The Politics of Race and Voter ID Laws in the States: The Return of Jim Crow?” Political Research Quarterly, vol. 67, no. 3, (2014): 666-679. (Study 19)
Southwell, Priscilla L. “Analysis of the Turnout Effects of Vote by Mail Elections, 1980-2007.” The Social Science Journal, vol. 46, no. 1 (2009): 211-217. (Study 15)
Southwell, Priscilla L. “Voting Behavior in Vote-by-Mail Elections.” Analyses of Social Issues and Public Policy, vol. 10, no. 1, (2010): 106-115. (Study 11)
Fitzgerald, Mary. “Greater Convenience but Not Greater Turnout: The Impact of Alternative Voting Methods on Electoral Participation in the United States.” American Politics Research, vol. 33, no. 6, (2005): 842-867. (Studies 3 and 4)
Fullmer, Elliott B. “Early Voting: Do More Sites Lead to Higher Turnout.” Election Law Journal, vol. 14, no. 2, (2015): 81-96. (Studies 19 and 20)
Early In-Person Voting
Appendix V: Bibliography
Page 117 GAO-16-630 Registering Voters and Administering Elections
Giammo, Joseph D. and Brian J. Brox. “Reducing the Costs of Participation: Are States Getting a Return on Early Voting.” Political Research Quarterly, vol. 63, no. 2, (2010): 295-303. (Study 2)
Gronke, Paul; Eva Galanes-Rosenbaum; and Peter A. Miller. “Early Voting and Voter Turnout” in Democracy in the States: Experiments in Election Reform, ed. Bruce E. Cain, Todd Donovan, and Caroline J. Tolbert. Washington, D.C.: Brookings Institution Press, 2008. (Study 6 and 7)
Larocca, Roger and John S. Klemanski. “U.S. State Election Reform and Turnout in Presidential Elections.” State Politics & Policy Quarterly, vol. 11, no. 1, (2011): 76-101. (Studies 12–14)
Leighley, Jan E. and Jonathan Nagler. Who Votes Now? Demographics, Issues, Inequality, and Turnout in the United States. Princeton, New Jersey: Princeton University Press, 2013. (Study 1)
McDonald, Michael P.; Enrijeta Shino; and Daniel A. Smith. “Convenience Voting and Turnout: Reassessing the Effects of Election Reforms.” Prepared for the New Research on Election Administration and Reform Conference at MIT, June 8, 2015. (Studies 5 and 11)
Pellissier, Allyson. “In Line or Online? American Voter Registration in the Digital Era.” Working paper, Caltech/MIT Voting Technology Project, February 18, 2014 (Study 15)
Richey, Sean. “Voting by Mail: Turnout and Institutional Reform in Oregon.” Social Science Quarterly, vol. 89, no. 4, (2008): 902-915. (Studies 17 and 18)
Rocha, Rene R. and Tetsuya Matsubayashi. “The Politics of Race and Voter ID Laws in the States: The Return of Jim Crow?” Political Research Quarterly, vol. 67, no. 3, (2014): 666-679. (Study 10)
Springer, Melanie J. “State Electoral Institutions and Voter Turnout In Presidential Elections, 1920-2000.” State Politics & Policy Quarterly, vol. 12, no. 3, (2012): 252-283. (Study 9)

Appendix V: Bibliography
Page 118 GAO-16-630 Registering Voters and Administering Elections
Tolbert, Caroline; Todd Donovan; Bridgett King; and Shaun Bowler. “Election Day Registration, Competition, and Voter Turnout” in Democracy in the States: Experiments in Election Reform, ed. Bruce E. Cain, Todd Donovan, and Caroline J. Tolbert. Washington, D.C.: Brookings Institution Press, 2008. (Studies 8 and 16)
Springer, Melanie J. “State Electoral Institutions and Voter Turnout In Presidential Elections, 1920-2000.” State Politics & Policy Quarterly, vol. 12, no. 3, (2012): 252-283. (Study 2)
Wolfinger, Raymond E; Benjamin Highton; and Megan Mullin. “How Postregistration Laws Affect the Turnout of Citizens Registered to Vote.” State Politics & Policy Quarterly, vol. 5, no. 1, (2005): 1-23. (Study 1)
Fitzgerald, Mary. “Greater Convenience but Not Greater Turnout: The Impact of Alternative Voting Methods on Electoral Participation in the United States.” American Politics Research, vol. 33, no. 6, (2005): 842-867. (Studies 10 and 11)
Giammo, Joseph D. and Brian J. Brox. “Reducing the Costs of Participation: Are States Getting a Return on Early Voting.” Political Research Quarterly, vol. 63, no. 2, (2010): 295-303. (Study 17)
Gronke, Paul; Eva Galanes-Rosenbaum; and Peter A. Miller. “Early Voting and Voter Turnout” in Democracy in the States: Experiments in Election Reform, ed. Bruce E. Cain, Todd Donovan, and Caroline J. Tolbert. Washington, D.C.: Brookings Institution Press, 2008. (Studies 13 and 18)
Larocca, Roger and John S. Klemanski. “U.S. State Election Reform and Turnout in Presidential Elections.” State Politics & Policy Quarterly, vol. 11, no. 1, (2011): 76-101. (Studies 4–6)
Leighley, Jan E. and Jonathan Nagler. Who Votes Now? Demographics, Issues, Inequality, and Turnout in the United States. Princeton, New Jersey: Princeton University Press, 2013. (Study 1)
Martinez, Michael D. and Daniel A. Smith. “Your Ballot’s in the Mail: The Effects of Unsolicited Absentee Ballots.” Prepared for the 2015 Annual Meetings of the American Political Science Association, September 3-6, 2015. (Study 3)
Hours Available for Voting
No-Excuse Absentee Voting
Appendix V: Bibliography
Page 119 GAO-16-630 Registering Voters and Administering Elections
McDonald, Michael P.; Enrijeta Shino; and Daniel A. Smith. “Convenience Voting and Turnout: Reassessing the Effects of Election Reforms.” Prepared for the New Research on Election Administration and Reform Conference at MIT, June 8, 2015. (Studies 8 and 12)
Menger, Andrew; Robert M. Stein; and Greg Vonnahme. “Turnout Effects from Vote by Mail Elections.” Prepared for the 2015 Annual Meetings of the American Political Science Association, September 3-6, 2015. (Study 2)
Pellissier, Allyson. “In Line or Online? American Voter Registration in the Digital Era.” Working paper, Caltech/MIT Voting Technology Project, February 18, 2014 (Study 7)
Rocha, Rene R. and Tetsuya Matsubayashi. “The Politics of Race and Voter ID Laws in the States: The Return of Jim Crow?” Political Research Quarterly, vol. 67, no. 3, (2014): 666-679. (Study 9)
Springer, Melanie J. “State Electoral Institutions and Voter Turnout In Presidential Elections, 1920-2000.” State Politics & Policy Quarterly, vol. 12, no. 3, (2012): 252-283. (Study 14)
Tolbert, Caroline; Todd Donovan; Bridgett King; and Shaun Bowler. “Election Day Registration, Competition, and Voter Turnout” in Democracy in the States: Experiments in Election Reform, ed. Bruce E. Cain, Todd Donovan, and Caroline J. Tolbert. Washington, D.C.: Brookings Institution Press, 2008. (Studies 15 and 16)
Juenke, Eric Gonzalez and Julie Marie Shepherd. “Vote Centers and Voter Turnout” in Democracy in the States: Experiments in Election Reform, ed. Bruce E. Cain, Todd Donovan, and Caroline J. Tolbert. Washington, D.C.: Brookings Institution Press, 2008. (Study 6)
Stein, Robert M. and Greg Vonnahme, “Effect of Election Day Vote Centers on Voter Participation.” Election Law Journal, vol. 11, no. 3, (2012): 291-301. (Studies 3–5)
Stein, Robert M. and Greg Vonnahme. “Engaging the Unengaged Voter: Vote Centers and Voter Turnout.” The Journal of Politics, vol. 70, no. 2, (2008): 487-497. (Study 1)
Vote Centers
Appendix V: Bibliography
Page 120 GAO-16-630 Registering Voters and Administering Elections
Vonnahme, Greg; Lonna Atkeson; Lisa Bryant; Christopher Mann; and Robert Stein. “Election Day Vote Centers, Voter Participation, and the Spatial Distribution of Voting.” Prepared for the 12th Annual Meeting of the State Politics and Policy Conference, February 16-18, 2012. (Study 2)

Appendix VI: GAO Contact and Staff Acknowledgments
Page 121 GAO-16-630 Registering Voters and Administering Elections
Rebecca Gambler, (202) 512-8777 or [email protected]
In addition to the contact named above, Tom Jessor (Assistant Director), David Alexander, Carl Barden, Chuck Bausell, Colleen Candrl, Katherine Davis, William Egar, Michele Fejfar, Alana Finley, Daniel Friess, Eric Hauswirth, Jeff Jensen, Jan Montgomery, Heidi Nielson, Anna Maria Ortiz, Amanda Parker, Kelsey Sagawa, Natalie Swabb, Janet Temko-Blinder, and Jeff Tessin made significant contributions to this report.
Appendix VI: GAO Contact and Staff Acknowledgments
GAO Contact
Staff Acknowledgments
(441285)

The Government Accountability Office, the audit, evaluation, and investigative arm of Congress, exists to support Congress in meeting its constitutional responsibilities and to help improve the performance and accountability of the federal government for the American people. GAO examines the use of public funds; evaluates federal programs and policies; and provides analyses, recommendations, and other assistance to help Congress make informed oversight, policy, and funding decisions. GAO’s commitment to good government is reflected in its core values of accountability, integrity, and reliability.
The fastest and easiest way to obtain copies of GAO documents at no cost is through GAO’s website (http://www.gao.gov). Each weekday afternoon, GAO posts on its website newly released reports, testimony, and correspondence. To have GAO e-mail you a list of newly posted products, go to http://www.gao.gov and select “E-mail Updates.”
The price of each GAO publication reflects GAO’s actual cost of production and distribution and depends on the number of pages in the publication and whether the publication is printed in color or black and white. Pricing and ordering information is posted on GAO’s website, http://www.gao.gov/ordering.htm.
Place orders by calling (202) 512-6000, toll free (866) 801-7077, or TDD (202) 512-2537.
Orders may be paid for using American Express, Discover Card, MasterCard, Visa, check, or money order. Call for additional information.
Connect with GAO on Facebook, Flickr, Twitter, and YouTube. Subscribe to our RSS Feeds or E-mail Updates. Listen to our Podcasts and read The Watchblog. Visit GAO on the web at www.gao.gov.
Contact:
Website: http://www.gao.gov/fraudnet/fraudnet.htm E-mail: [email protected] Automated answering system: (800) 424-5454 or (202) 512-7470
Katherine Siggerud, Managing Director, [email protected], (202) 512-4400, U.S. Government Accountability Office, 441 G Street NW, Room 7125, Washington, DC 20548
Chuck Young, Managing Director, [email protected], (202) 512-4800 U.S. Government Accountability Office, 441 G Street NW, Room 7149 Washington, DC 20548
GAO’s Mission
Obtaining Copies of GAO Reports and Testimony
Order by Phone
Connect with GAO
To Report Fraud, Waste, and Abuse in Federal Programs
Congressional Relations
Public Affairs
Please Print on Recycled Paper.