Embed Size (px)
Citation preview

Co
mm
en
tary
June’s historic meeting between OPEC and the European Union
marks yet another milestone in the pursuit of co-operation and
dialogue between oil producers and consumers.
This is precisely the kind of contact that OPEC has always
supported over the years. It has championed the need for OPEC/
non-OPEC co-operation, as well as dialogue with consumers
and these efforts have borne fruit, for example, in the estab-
lishment of the International Energy Forum.
Now, through the creation of a proper framework for talks
to take place with the EU — OPEC’s largest trading partner —
both parties have agreed to study many of the complex issues
that surround the international oil market and explore ways of
addressing them jointly.
Both parties stand to benefit: for the EU, this important new
initiative is seen as part of a broader approach to strengthen
energy dialogues with the main oil and gas suppliers; and for
OPEC, this is a significant further step in its continued efforts
to encourage dialogue and co-operation among oil producers
and consumers.
Both have recognized the importance of an effective
framework enabling an exchange of views on energy issues
of common interest, including oil market developments, and
the potential this has for contributing to stability, transparency
and predictability in the international oil market. In addition,
they have agreed on the importance of greater data transpar-
ency and an enhanced exchange of views on trends in supply
and demand, future policies and their implications, technology
developments and other related issues.
Both shared the view that oil price increases over the last
year were the result of the convergence of a number of factors.
Also, while acknowledging OPEC’s response in raising output
and speeding up the implementation of capacity expansion
plans, the participants nevertheless recognized that uncertain-
ties, particularly associated with the level of future oil demand,
will remain substantial.
It has become clear that producers and consumers cannot
operate in isolation — a belief OPEC has held for many years. It is
only by engaging directly with consumers and governments and
institutions about the oil market that stability can be secured.
As the decision in June to raise the production ceiling dem-
onstrated (see page 8), OPEC is prepared to do whatever it can
to address market volatility. However, it cannot be reasonably
expected that OPEC bears this responsibility alone — that is why
co-operation is so important.
Another Milestone
Co
nte
nts
PublishersOPEC
Organization of the Petroleum Exporting Countries
Obere Donaustrasse 93
1020 Vienna, Austria
Telephone: +43 1 211 12/0
Telefax: +43 1 216 4320
Public Relations & Information
Department fax: +43 1 214 9827
E-mail: [email protected]
Web site: www.opec.orgVisit the OPEC Web site for the latest news and infor-
mation about the Organization and back issues of the
OPEC Bulletin which is also available free of charge
in PDF format.
Hard copy subscription: $70/year
Membership and aimsOPEC is a permanent, intergovernmental
Organization, established in Baghdad, September
10–14, 1960, by IR Iran, Iraq, Kuwait, Saudi Arabia
and Venezuela. Its objective is to co-ordinate and
unify petroleum policies among Member Countries,
in order to secure fair and stable prices for petroleum
producers; an efficient, economic and regular supply
of petroleum to consuming nations; and a fair return
on capital to those investing in the industry. The
Organization comprises the five Founding Members
and six other Full Members: Qatar (joined in 1961);
Indonesia (1962); SP Libyan AJ (1962); United Arab
Emirates (Abu Dhabi, 1967); Algeria (1969); and
Nigeria (1971). Ecuador joined the Organization in
1973 and left in 1992; Gabon joined in 1975 and left
in 1995.
CoverEU/OPEC (see story on pp4–7).Photo: Reuters/OPEC
OP
EC
bu
lle
tin
Vol XXXVI, No 6, June 2005, ISSN 0474–6279
Features 4
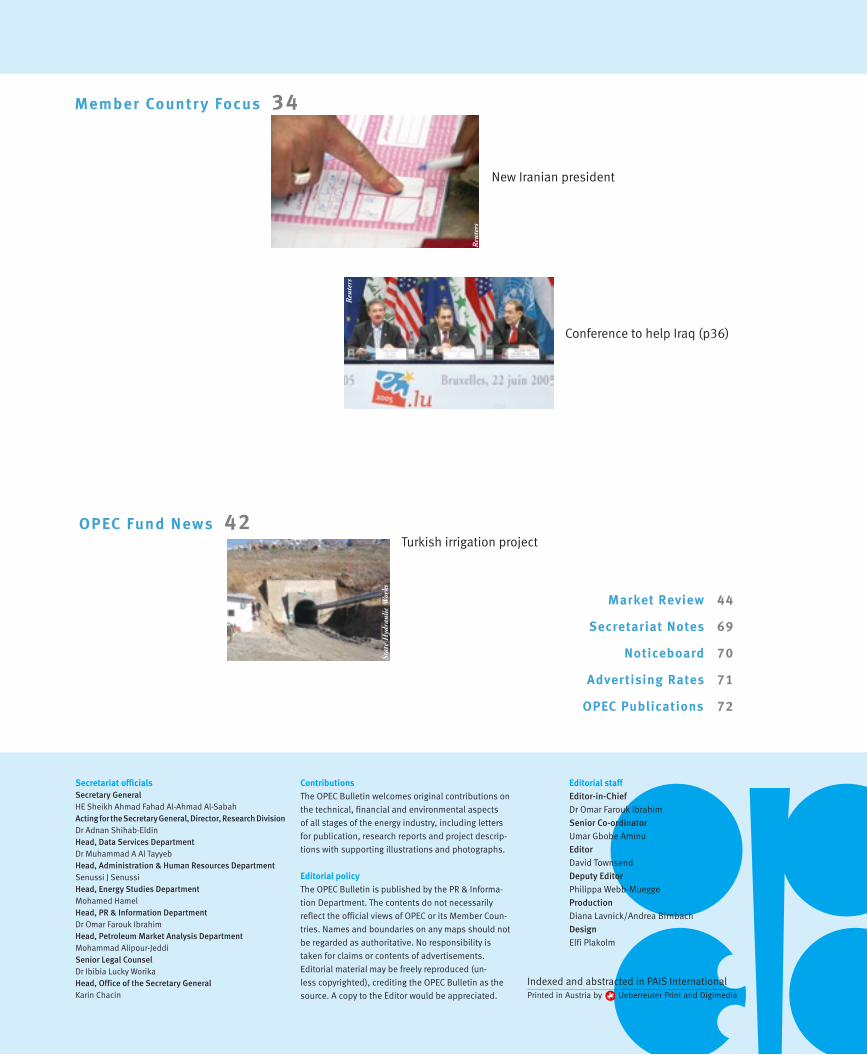
OPEC pumps more oilamid refining concerns (p8)
Newsline 22
Project Kuwait update (p22)
Indonesian licensing round (p24)
Saudi Aramco production (p26)
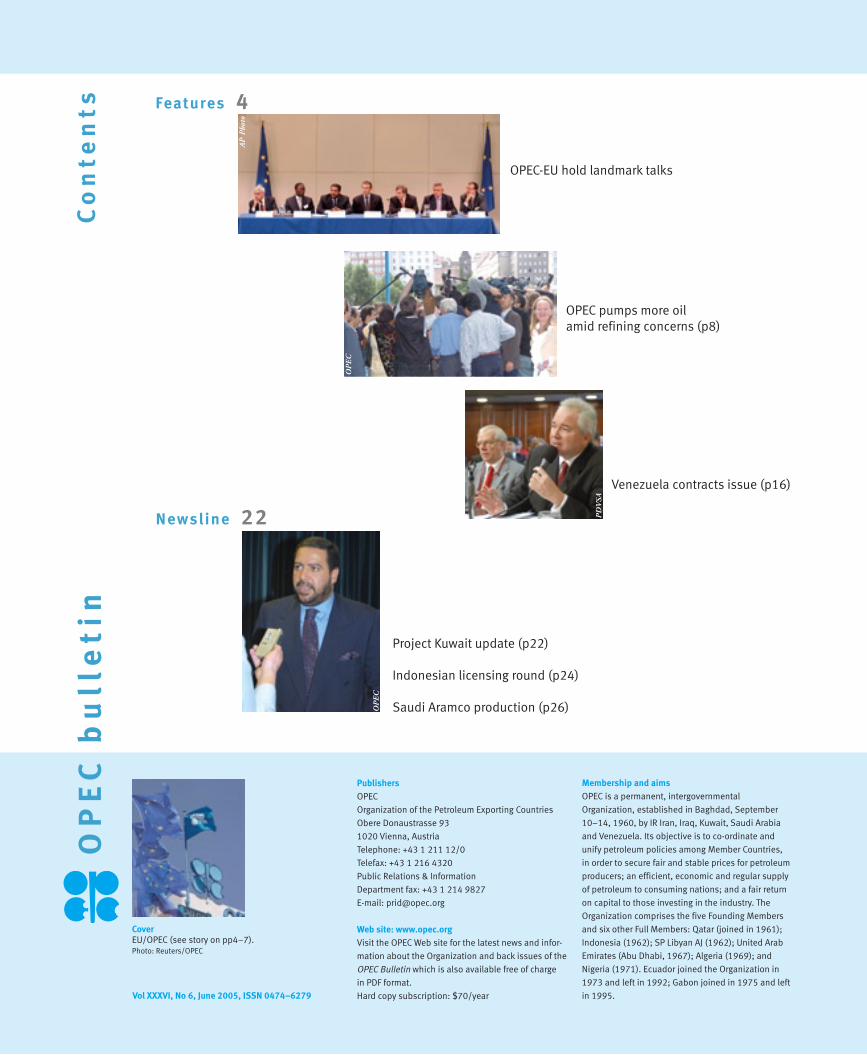
OPEC-EU hold landmark talks
AP
Pho
to
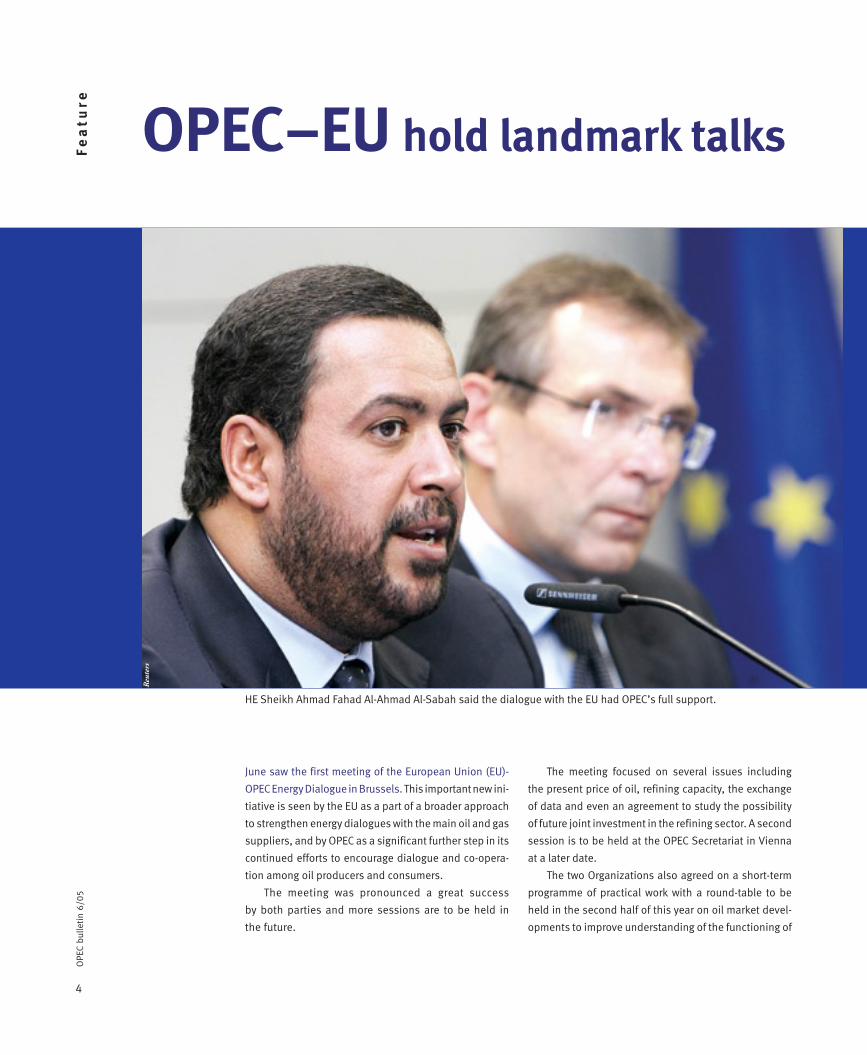
Venezuela contracts issue (p16)
AP
Pho
to
OP
EC
PD
VSA
OP
EC
Printed in Austria by Ueberreuter Print and Digimedia
Indexed and abstracted in PAIS International
ContributionsThe OPEC Bulletin welcomes original contributions on
the technical, financial and environmental aspects
of all stages of the energy industry, including letters
for publication, research reports and project descrip-
tions with supporting illustrations and photographs.
Editorial policyThe OPEC Bulletin is published by the PR & Informa-
tion Department. The contents do not necessarily
reflect the official views of OPEC or its Member Coun-
tries. Names and boundaries on any maps should not
be regarded as authoritative. No responsibility is
taken for claims or contents of advertisements.
Editorial material may be freely reproduced (un-
less copyrighted), crediting the OPEC Bulletin as the
source. A copy to the Editor would be appreciated.
Secretariat officialsSecretary GeneralHE Sheikh Ahmad Fahad Al-Ahmad Al-SabahActing for the Secretary General, Director, Research DivisionDr Adnan Shihab-EldinHead, Data Services DepartmentDr Muhammad A Al TayyebHead, Administration & Human Resources DepartmentSenussi J SenussiHead, Energy Studies DepartmentMohamed HamelHead, PR & Information DepartmentDr Omar Farouk IbrahimHead, Petroleum Market Analysis DepartmentMohammad Alipour-JeddiSenior Legal CounselDr Ibibia Lucky WorikaHead, Office of the Secretary GeneralKarin Chacin
Editorial staffEditor-in-Chief
Dr Omar Farouk Ibrahim
Senior Co-ordinator
Umar Gbobe Aminu
Editor
David Townsend
Deputy Editor
Philippa Webb-Muegge
Production
Diana Lavnick/Andrea Birnbach
Design
Elfi Plakolm
Turkish irrigation project
Market Review 44
Secretariat Notes 69
Noticeboard 70
Advertising Rates 71
OPEC Publications 72
OPEC Fund News 42
Member Countr y Focus 34
New Iranian president
Conference to help Iraq (p36)
Reu
ters
Reu
ters
Stat
e H
ydra
ulic
Wor
ks
4
OPE
C bu
lleti
n 6/
05F
ea
ture
June saw the first meeting of the European Union (EU)-
OPEC Energy Dialogue in Brussels. This important new ini-
tiative is seen by the EU as a part of a broader approach
to strengthen energy dialogues with the main oil and gas
suppliers, and by OPEC as a significant further step in its
continued efforts to encourage dialogue and co-opera-
tion among oil producers and consumers.
The meeting was pronounced a great success
by both parties and more sessions are to be held in
the future.
OPEC–EU hold landmark talks
The meeting focused on several issues including
the present price of oil, refining capacity, the exchange
of data and even an agreement to study the possibility
of future joint investment in the refining sector. A second
session is to be held at the OPEC Secretariat in Vienna
at a later date.
The two Organizations also agreed on a short-term
programme of practical work with a round-table to be
held in the second half of this year on oil market devel-
opments to improve understanding of the functioning of
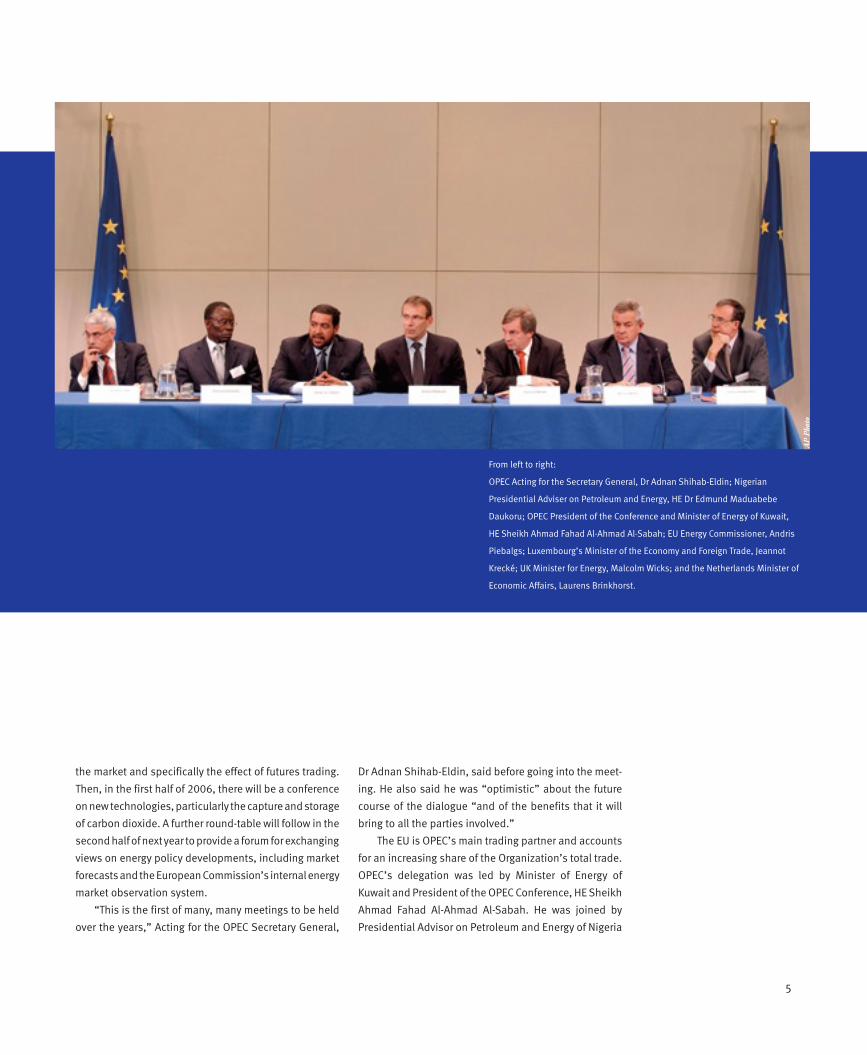
HE Sheikh Ahmad Fahad Al-Ahmad Al-Sabah said the dialogue with the EU had OPEC’s full support.
Reu
ters
5
the market and specifically the effect of futures trading.
Then, in the first half of 2006, there will be a conference
on new technologies, particularly the capture and storage
of carbon dioxide. A further round-table will follow in the
second half of next year to provide a forum for exchanging
views on energy policy developments, including market
forecasts and the European Commission’s internal energy
market observation system.
“This is the first of many, many meetings to be held
over the years,” Acting for the OPEC Secretary General,
Dr Adnan Shihab-Eldin, said before going into the meet-
ing. He also said he was “optimistic” about the future
course of the dialogue “and of the benefits that it will
bring to all the parties involved.”
The EU is OPEC’s main trading partner and accounts
for an increasing share of the Organization’s total trade.
OPEC’s delegation was led by Minister of Energy of
Kuwait and President of the OPEC Conference, HE Sheikh
Ahmad Fahad Al-Ahmad Al-Sabah. He was joined by
Presidential Advisor on Petroleum and Energy of Nigeria
AP
Pho
to
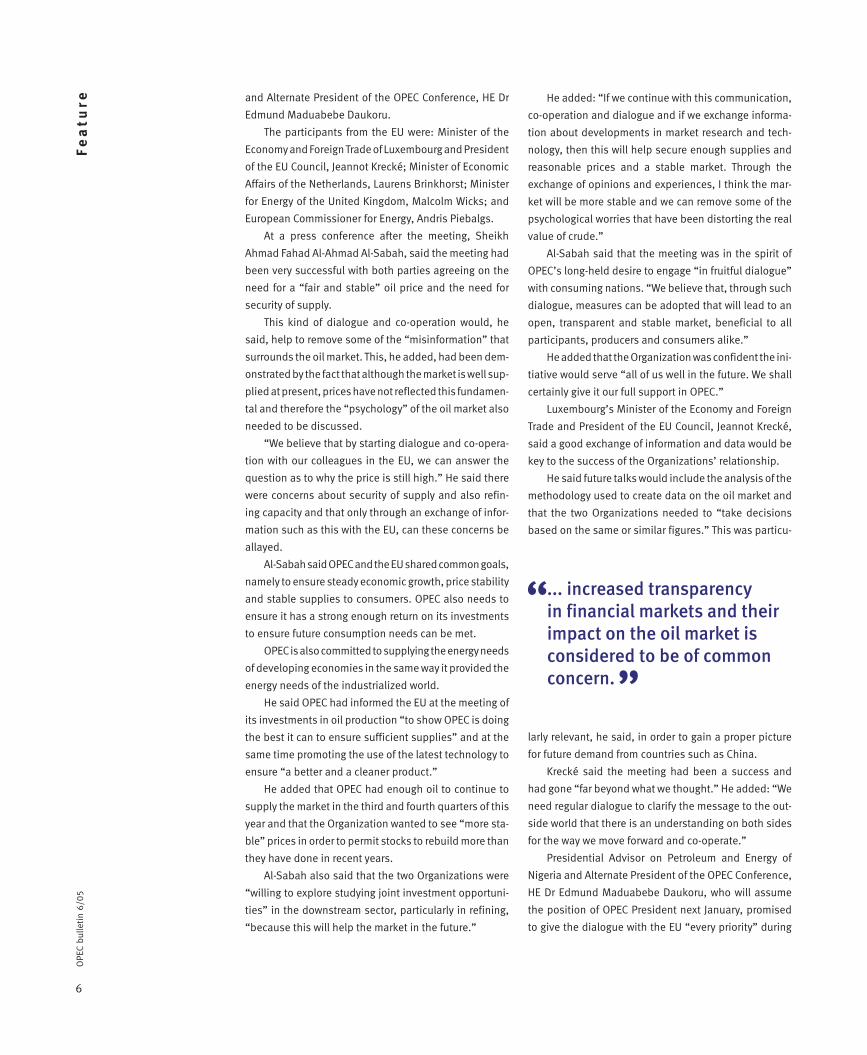
From left to right:
OPEC Acting for the Secretary General, Dr Adnan Shihab-Eldin; Nigerian
Presidential Adviser on Petroleum and Energy, HE Dr Edmund Maduabebe
Daukoru; OPEC President of the Conference and Minister of Energy of Kuwait,
HE Sheikh Ahmad Fahad Al-Ahmad Al-Sabah; EU Energy Commissioner, Andris
Piebalgs; Luxembourg’s Minister of the Economy and Foreign Trade, Jeannot
Krecké; UK Minister for Energy, Malcolm Wicks; and the Netherlands Minister of
Economic Affairs, Laurens Brinkhorst.
6
OPE
C bu
lleti
n 6/
05F
ea
ture
larly relevant, he said, in order to gain a proper picture
for future demand from countries such as China.
Krecké said the meeting had been a success and
had gone “far beyond what we thought.” He added: “We
need regular dialogue to clarify the message to the out-
side world that there is an understanding on both sides
for the way we move forward and co-operate.”
Presidential Advisor on Petroleum and Energy of
Nigeria and Alternate President of the OPEC Conference,
HE Dr Edmund Maduabebe Daukoru, who will assume
the position of OPEC President next January, promised
to give the dialogue with the EU “every priority” during
and Alternate President of the OPEC Conference, HE Dr
Edmund Maduabebe Daukoru.
The participants from the EU were: Minister of the
Economy and Foreign Trade of Luxembourg and President
of the EU Council, Jeannot Krecké; Minister of Economic
Affairs of the Netherlands, Laurens Brinkhorst; Minister
for Energy of the United Kingdom, Malcolm Wicks; and
European Commissioner for Energy, Andris Piebalgs.
At a press conference after the meeting, Sheikh
Ahmad Fahad Al-Ahmad Al-Sabah, said the meeting had
been very successful with both parties agreeing on the
need for a “fair and stable” oil price and the need for
security of supply.
This kind of dialogue and co-operation would, he
said, help to remove some of the “misinformation” that
surrounds the oil market. This, he added, had been dem-
onstrated by the fact that although the market is well sup-
plied at present, prices have not reflected this fundamen-
tal and therefore the “psychology” of the oil market also
needed to be discussed.
“We believe that by starting dialogue and co-opera-
tion with our colleagues in the EU, we can answer the
question as to why the price is still high.” He said there
were concerns about security of supply and also refin-
ing capacity and that only through an exchange of infor-
mation such as this with the EU, can these concerns be
allayed.
Al-Sabah said OPEC and the EU shared common goals,
namely to ensure steady economic growth, price stability
and stable supplies to consumers. OPEC also needs to
ensure it has a strong enough return on its investments
to ensure future consumption needs can be met.
OPEC is also committed to supplying the energy needs
of developing economies in the same way it provided the
energy needs of the industrialized world.
He said OPEC had informed the EU at the meeting of
its investments in oil production “to show OPEC is doing
the best it can to ensure sufficient supplies” and at the
same time promoting the use of the latest technology to
ensure “a better and a cleaner product.”
He added that OPEC had enough oil to continue to
supply the market in the third and fourth quarters of this
year and that the Organization wanted to see “more sta-
ble” prices in order to permit stocks to rebuild more than
they have done in recent years.
Al-Sabah also said that the two Organizations were
“willing to explore studying joint investment opportuni-
ties” in the downstream sector, particularly in refining,
“because this will help the market in the future.”
He added: “If we continue with this communication,
co-operation and dialogue and if we exchange informa-
tion about developments in market research and tech-
nology, then this will help secure enough supplies and
reasonable prices and a stable market. Through the
exchange of opinions and experiences, I think the mar-
ket will be more stable and we can remove some of the
psychological worries that have been distorting the real
value of crude.”
Al-Sabah said that the meeting was in the spirit of
OPEC’s long-held desire to engage “in fruitful dialogue”
with consuming nations. “We believe that, through such
dialogue, measures can be adopted that will lead to an
open, transparent and stable market, beneficial to all
participants, producers and consumers alike.”
He added that the Organization was confident the ini-
tiative would serve “all of us well in the future. We shall
certainly give it our full support in OPEC.”
Luxembourg’s Minister of the Economy and Foreign
Trade and President of the EU Council, Jeannot Krecké,
said a good exchange of information and data would be
key to the success of the Organizations’ relationship.
He said future talks would include the analysis of the
methodology used to create data on the oil market and
that the two Organizations needed to “take decisions
based on the same or similar figures.” This was particu-
... increased transparencyin financial markets and theirimpact on the oil market isconsidered to be of commonconcern.
“
”
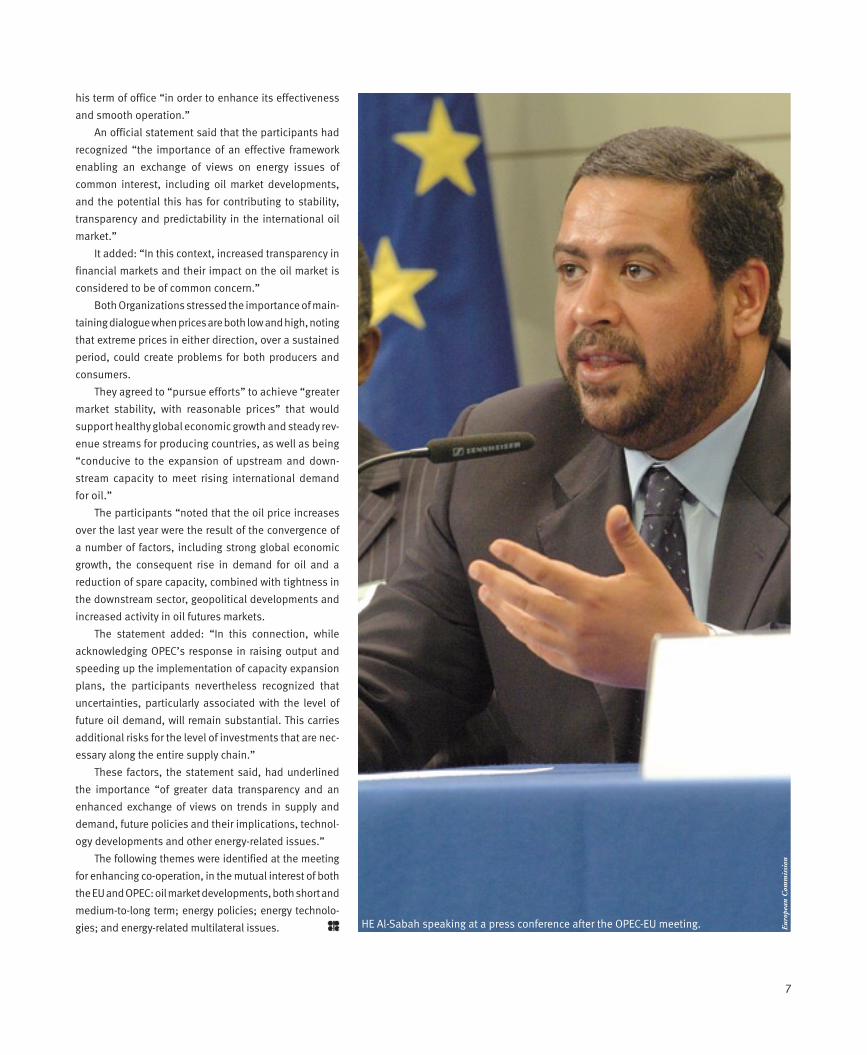
7
HE Al-Sabah speaking at a press conference after the OPEC-EU meeting. Euro
pean
Com
mis
sion
his term of office “in order to enhance its effectiveness
and smooth operation.”
An official statement said that the participants had
recognized “the importance of an effective framework
enabling an exchange of views on energy issues of
common interest, including oil market developments,
and the potential this has for contributing to stability,
transparency and predictability in the international oil
market.”
It added: “In this context, increased transparency in
financial markets and their impact on the oil market is
considered to be of common concern.”
Both Organizations stressed the importance of main-
taining dialogue when prices are both low and high, noting
that extreme prices in either direction, over a sustained
period, could create problems for both producers and
consumers.
They agreed to “pursue efforts” to achieve “greater
market stability, with reasonable prices” that would
support healthy global economic growth and steady rev-
enue streams for producing countries, as well as being
“conducive to the expansion of upstream and down-
stream capacity to meet rising international demand
for oil.”
The participants “noted that the oil price increases
over the last year were the result of the convergence of
a number of factors, including strong global economic
growth, the consequent rise in demand for oil and a
reduction of spare capacity, combined with tightness in
the downstream sector, geopolitical developments and
increased activity in oil futures markets.
The statement added: “In this connection, while
acknowledging OPEC’s response in raising output and
speeding up the implementation of capacity expansion
plans, the participants nevertheless recognized that
uncertainties, particularly associated with the level of
future oil demand, will remain substantial. This carries
additional risks for the level of investments that are nec-
essary along the entire supply chain.”
These factors, the statement said, had underlined
the importance “of greater data transparency and an
enhanced exchange of views on trends in supply and
demand, future policies and their implications, technol-
ogy developments and other energy-related issues.”
The following themes were identified at the meeting
for enhancing co-operation, in the mutual interest of both
the EU and OPEC: oil market developments, both short and
medium-to-long term; energy policies; energy technolo-
gies; and energy-related multilateral issues.
8
OPE
C bu
lleti
n 6/
05
OPEC in June agreed to raise its production ceiling
by up to an extra one million barrels per day of oil over
the coming months to boost supplies to a market which
has an apparently inexhaustible demand for crude. At
the same time, the Organization expressed its concerns
about a lack of sufficient global refining capacity and
OPECpumps more oilamid refining concerns
Co
nfe
ren
ce
No
tes
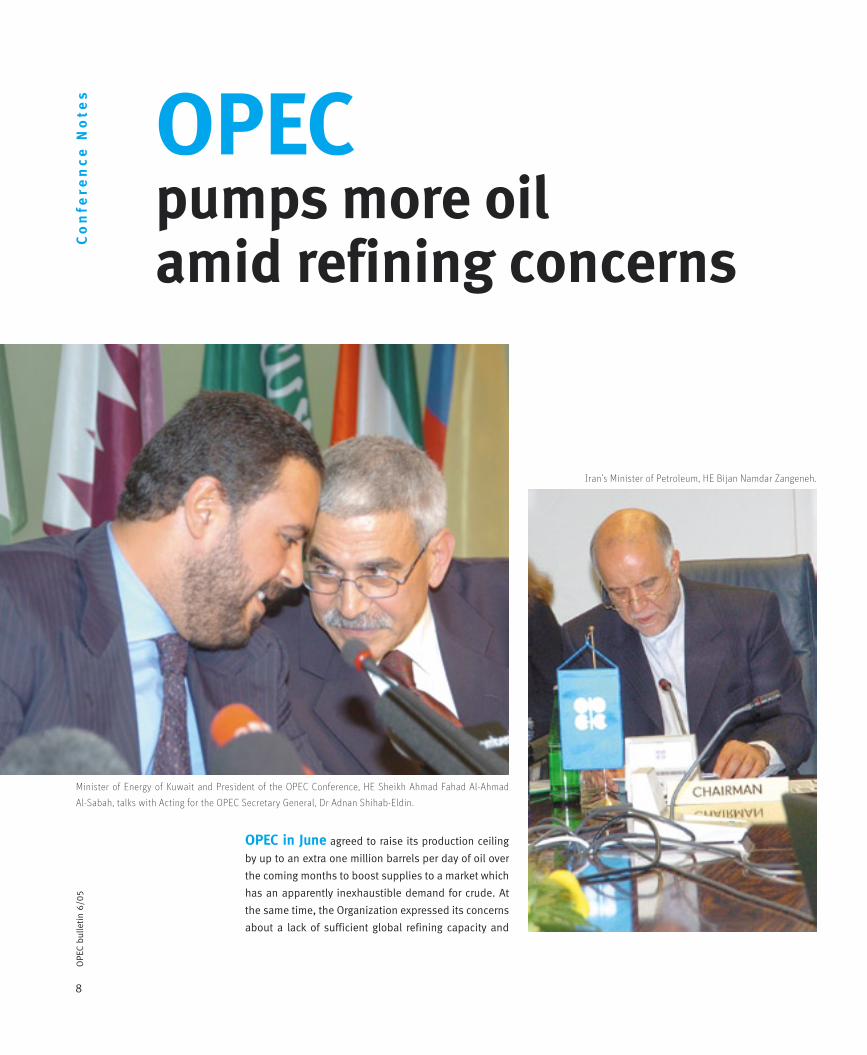
Minister of Energy of Kuwait and President of the OPEC Conference, HE Sheikh Ahmad Fahad Al-Ahmad
Al-Sabah, talks with Acting for the OPEC Secretary General, Dr Adnan Shihab-Eldin.
Iran’s Minister of Petroleum, HE Bijan Namdar Zangeneh.

9
OPE
C bu
lleti
n 6/
05
Old production Increase New production
Algeria 878,000 16,000 894,000
Indonesia 1,425,000 26,000 1,451,000
IR Iran 4,037,000 73,000 4,110,000
Kuwait 2,207,000 40,000 2,247,000
SP Libyan AJ 1,473,000 27,000 1,500,000
Nigeria 2,265,000 41,000 2,306,000
Qatar 713,000 13,000 726,000
Saudi Arabia 8,937,000 162,000 9,099,000
United Arab Emirates 2,400,000 44,000 2,444,000
Venezuela 3,165,000 58,000 3,223,000
Total 27,500,000 500,000 28,000,000
Individual production levels of OPEC Member Countries (excluding Iraq) as of July 2005 barrels/day
warned that this fundamental is one of the main factors
behind the persistent rise in prices.
The 136th (Extraordinary) Meeting of the OPEC
Conference, held in Vienna on June 15, concluded that
the market was “well supplied” with crude following the
Organization’s decision to raise its production ceiling to
27.5m b/d in Isfahan, Iran, in March.
As a result of this, commercial crude and product
stocks had continued to build “to comfortable levels”,
around a five-year average in terms of days of forward
cover. However, the Organization said that world crude
prices have remained high and volatile because of a “con-
cern about a lack of effective global oil refining capacity,
in particular possible shortages of middle distillates in
key consuming regions.”
The official statement added: “Refineries, whilst
already running at high utilization rates, are facing dif-
ficulties in coping with strong distillate demand-growth.
The situation is being further exacerbated by geopoliti-
cal developments and increased speculation in the oil
futures markets.”
This was giving cause for “particular concern” within
the Organization, with a shortage of effective refining
capacity to meet future demand growth due to under-
investment in the sector, especially in conversion capac-
ity, as well as excessive regulation. The Conference All photos Diana Golpashin, OPEC.
10
OPE
C bu
lleti
n 6/
05
repeated its earlier calls to industry and consumer gov-
ernments to “urgently address this challenge which, if
left unresolved, will exacerbate oil price volatility.”
Despite the fact that it believes there is sufficient
crude supply at present, the Organization said it had
decided to increase the production ceiling by 500,000
b/d to 28.0m b/d, effective July 1, because of expected
strong global oil demand for the remainder of the year, in
particular during the fourth quarter. (See previous page
for new production levels).
Furthermore, the Conference authorized its President
to announce an additional 500,000 b/d increase in the
ceiling before its next meeting if oil prices remained at
current levels or continued to rise further.
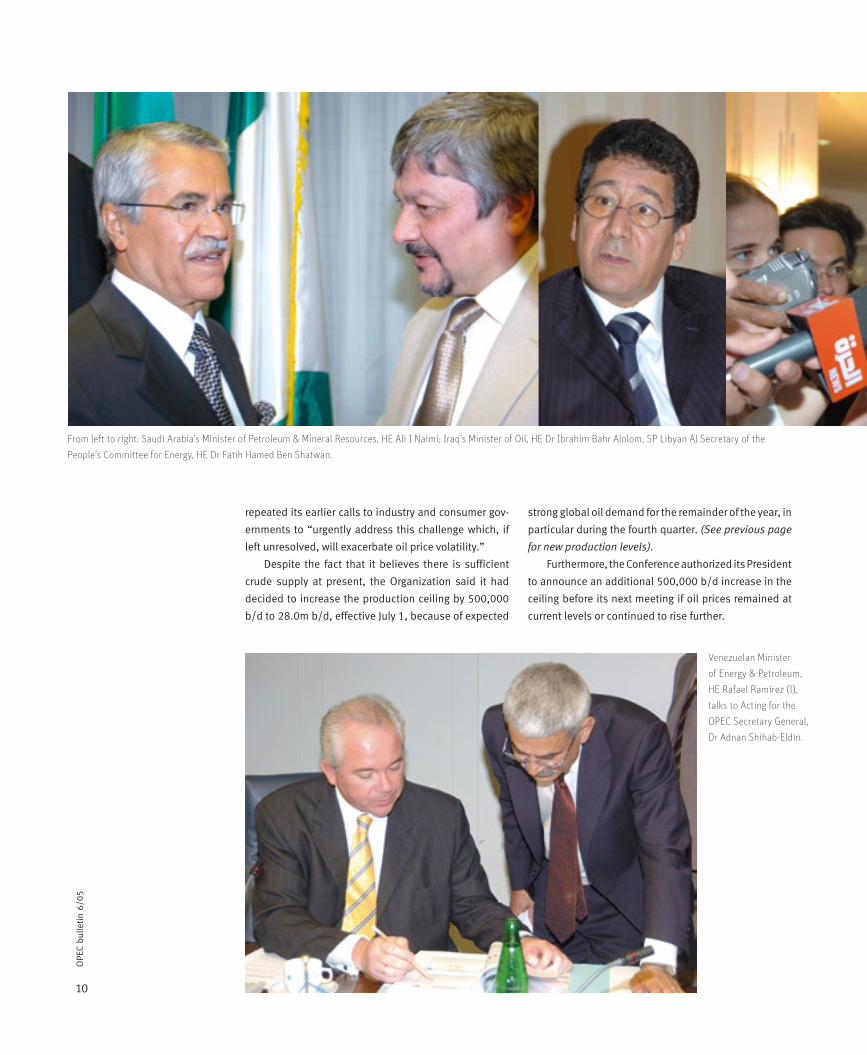
From left to right: Saudi Arabia’s Minister of Petroleum & Mineral Resources, HE Ali I Naimi; Iraq’s Minister of Oil, HE Dr Ibrahim Bahr Alolom; SP Libyan AJ Secretary of the
People’s Committee for Energy, HE Dr Fatih Hamed Ben Shatwan.
Venezuelan Minister
of Energy & Petroleum,
HE Rafael Ramírez (l),
talks to Acting for the
OPEC Secretary General,
Dr Adnan Shihab-Eldin.

11
The statement added: “In taking this
decision, the Conference re-affirmed the
Organization’s commitment to market
stability, a commitment clearly expressed
in Member Countries’ (MCs) repeated rais-
ing of output levels and the acceleration of
their production capacity expansion plans
aimed at meeting growth in global demand
for crude and at maintaining adequate spare
capacity.”
To this end, the Conference also urged
“all parties concerned to join efforts to main-
tain market stability, with reasonable prices
consistent with robust economic growth,
in particular in the emerging economies
of the developing world, as well as steady
revenue streams, for producing countries
and the industry, conducive to the expan-
sion of upstream and downstream capacity
to meet rising international demand for oil
and products.”
As always, the Conference agreed to con-
tinue to closely monitor market developments
and to take any appropriate and prompt
action as and when the need arises.
Left to right: Qatar’s Second Deputy Prime Minister and Minister of Energy and Industry, HE Abdullah bin Hamad Al Attiyah; Venezuelan Minister of Energy & Petroleum,
HE Rafael Ramírez; Algerian Minister of Energy & Mines, HE Dr Chakib Khelil; Saudi Arabia’s Minister of Petroleum & Mineral Resources, HE Ali I Naimi;
Iraq’s Minister of Oil, HE Dr Ibrahim Bahr Alolom.
Minister of Energy of Kuwait and President of the OPEC Conference, HE Sheikh Ahmad Fahad Al-Ahmad Al-Sabah; and
Nigerian Presidential Adviser on Petroleum & Energy, HE Dr Edmund Maduabebe Daukoru (r).

12
OPE
C bu
lleti
n 6/
05F
ea
ture
Left to right: Nigerian Presidential Adviser on Petroleum & Energy, HE Dr Edmund Maduabebe Daukoru; Indonesian
Governor for OPEC, Dr Maizar Rahman; and UAE Minister of Energy, HE Mohamed Bin Dhaen Al Hamli.
The next Conference is scheduled to be held on September 19, 2005, in Vienna.
13
OPE
C bu
lleti
n 6/
05
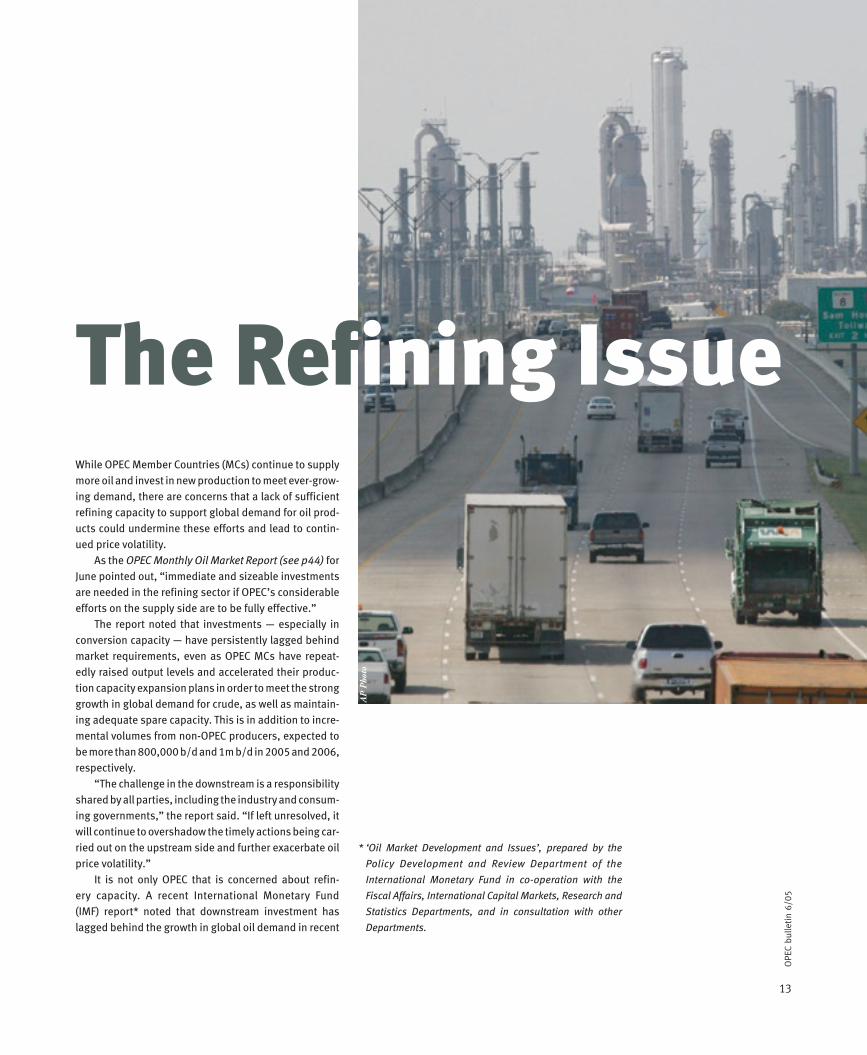
The Refining IssueWhile OPEC Member Countries (MCs) continue to supply more oil and invest in new production to meet ever-grow-ing demand, there are concerns that a lack of sufficient refining capacity to support global demand for oil prod-ucts could undermine these efforts and lead to contin-ued price volatility. As the OPEC Monthly Oil Market Report (see p44) for June pointed out, “immediate and sizeable investments are needed in the refining sector if OPEC’s considerable efforts on the supply side are to be fully effective.” The report noted that investments — especially in conversion capacity — have persistently lagged behind market requirements, even as OPEC MCs have repeat-edly raised output levels and accelerated their produc-tion capacity expansion plans in order to meet the strong growth in global demand for crude, as well as maintain-ing adequate spare capacity. This is in addition to incre-mental volumes from non-OPEC producers, expected to be more than 800,000 b/d and 1m b/d in 2005 and 2006, respectively. “The challenge in the downstream is a responsibility shared by all parties, including the industry and consum-ing governments,” the report said. “If left unresolved, it will continue to overshadow the timely actions being car-ried out on the upstream side and further exacerbate oil price volatility.” It is not only OPEC that is concerned about refin-ery capacity. A recent International Monetary Fund (IMF) report* noted that downstream investment has lagged behind the growth in global oil demand in recent
AP
Pho
to
* ‘Oil Market Development and Issues’, prepared by the
Policy Development and Review Department of the
International Monetary Fund in co-operation with the
Fiscal Affairs, International Capital Markets, Research and
Statistics Departments, and in consultation with other
Departments.
14
OPE
C bu
lleti
n 6/
05F
ea
ture years contributing to bottlenecks in derivative products
markets — such as gasoline and distillates — “and weak-ening the ability of the oil market to deal with temporary imbalances.” The report said the current scarcity of refining capac-ity “reflects not only low investment but also a mismatch between available refineries and the type of crude oil being pumped at the margin.” The lack of refining capacity is particularly acute in heavy crude oil. This, as the IMF noted, “has contributed to a significant rise in light-heavy crude oil price spreads in the past year, when the marginal barrel from OPEC was heavy, and light sweet crudes were in limited supply due to temporary supply disruptions.” In addition, environmental issues have made it dif-ficult for new refining capacity to be brought on stream, particularly in the United States, where strict environ-mental standards “made it difficult to justify new refin-eries.” The last refinery built in the US was in 1976 and even when investment is allowed, environmental regu-lations and policies “may drive up capital cost.” Environmental issues are likely to continue to limit the addition of new refineries in industrial countries in the future and therefore, the IMF report noted, any new capac-ity will “likely be concentrated in developing countries.” This view is supported by the US Department of Energy’s Energy Information Administration which said in its Annual Energy Outlook 2005 that “financial and legal considerations make it unlikely that new refineries will be built in the US.” However, additions at existing refineries are expected to increase total capacity over the next 20 years — mainly at facilities on the Gulf Coast. In particular, refining capacity limitations are impact-ing the supply of middle distillates at present and “fuel-ling a counter-seasonal rally in distillate prices” as the UK-based Centre for Global Energy Studies noted in its latest monthly oil report. It added: “With OPEC production at its highest for 25 years, a substantial build in global inventories is now likely over the second and third quarters. However, the bottleneck that is pushing up prices again [...] is not a lack of crude supply but a shortage of refining capacity to process it. In particular, demand for middle distillates — jet fuel, diesel and heating oil — is outstripping the ability of the refining system to produce it.” The report continued: “The problem refiners face is that middle distillates are both summer and winter fuels. Jet and diesel demand tends to peak to during the sum-mer, when transport fuel consumption is highest, while heating oil and kerosene are used for heating in the win-ter. Refineries thus need to make enough distillates to meet current demand while rebuilding stocks ahead of next winter.”
Meanwhile, several OPEC MCs are planning to add to their existing refining capacity. Kuwait wants to raise total capacity to over 1.2m b/d by 2010 from 930,000 b/d at present while Saudi Aramco is expanding existing facilities and also wants to build grassroots refineries. Algeria plans to build a new integrated production and refining project in Adrar and is also considering re-com-missioning an existing facility at In Amenas while neigh-bouring Libya also wants to increase capacity. Venezuela (see page 20) plans to add 600,000 b/d from two new refineries to its existing 3.3m b/d, both of which will be used to process heavier crude grades. Iran has also announced plans to increase refining capacity, to as much as 2.2m b/d by 2008 — also pro-moting heavier crude processing facilities — and Nigeria expects three smaller, independent refineries to be com-missioned in 2008 with more to follow in the future. For its part, the United Arab Emirates is involved in a project to increase its Ruwais refinery from the current 145,000 b/d to 500,000 b/d by the end of this year and Indonesia is also expanding capacity. But with existing refining capacity struggling to meet current demand, there are fears that increased product consumption could further pressure an already tight refin-ing sector. This is particularly true for China and India where product demand is expected to be amongst the strongest in the years ahead.
The refining capacity issue is now
becoming widespread, even prompt-
ing talk of action at government level
to address the problem.
A statement issued in June by the G-8 Finance Ministers ahead of their July summit in Scotland urged “oil produc-ing countries and companies and consumers to recognize their common interest in ensuring investment in sufficient future supplies of oil and refining capacity.” It also called on “countries and international insti-tutions to work to remove barriers and create a climate conducive to investment throughout the supply chain.” The issue also emerged during OPEC’s landmark talks with the EU in June with the two Organizations saying they were willing to explore studying joint downstream investment opportunities, particularly in refining to help the oil market in the future.
15
OPE
C bu
lleti
n 6/
05
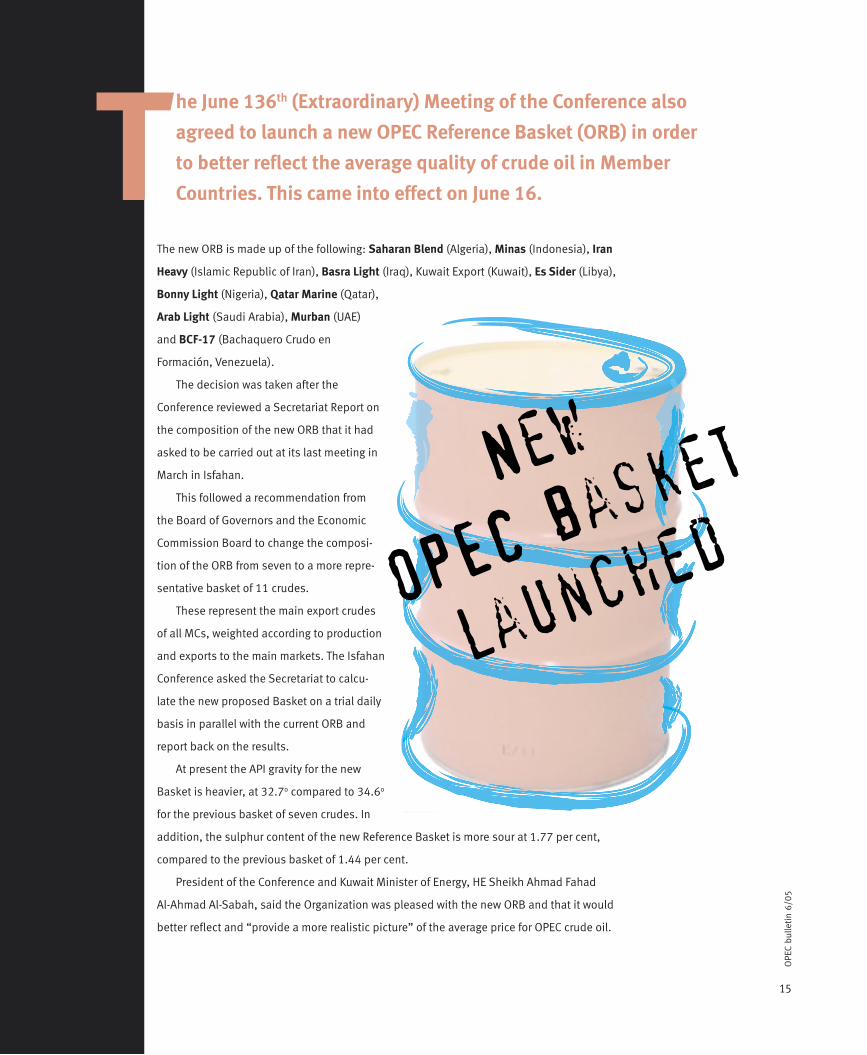
The new ORB is made up of the following: Saharan Blend (Algeria), Minas (Indonesia), Iran
Heavy (Islamic Republic of Iran), Basra Light (Iraq), Kuwait Export (Kuwait), Es Sider (Libya),
Bonny Light (Nigeria), Qatar Marine (Qatar),
Arab Light (Saudi Arabia), Murban (UAE)
and BCF-17 (Bachaquero Crudo en
Formación, Venezuela).
The decision was taken after the
Conference reviewed a Secretariat Report on
the composition of the new ORB that it had
asked to be carried out at its last meeting in
March in Isfahan.
This followed a recommendation from
the Board of Governors and the Economic
Commission Board to change the composi-
tion of the ORB from seven to a more repre-
sentative basket of 11 crudes.
These represent the main export crudes
of all MCs, weighted according to production
and exports to the main markets. The Isfahan
Conference asked the Secretariat to calcu-
late the new proposed Basket on a trial daily
basis in parallel with the current ORB and
report back on the results.
At present the API gravity for the new
Basket is heavier, at 32.7o compared to 34.6o
for the previous basket of seven crudes. In
addition, the sulphur content of the new Reference Basket is more sour at 1.77 per cent,
compared to the previous basket of 1.44 per cent.
President of the Conference and Kuwait Minister of Energy, HE Sheikh Ahmad Fahad
Al-Ahmad Al-Sabah, said the Organization was pleased with the new ORB and that it would
better reflect and “provide a more realistic picture” of the average price for OPEC crude oil.
New
OPEC basket
launched
he June 136th (Extraordinary) Meeting of the Conference also
agreed to launch a new OPEC Reference Basket (ORB) in order
to better reflect the average quality of crude oil in Member
Countries. This came into effect on June 16.T

16
OPE
C bu
lleti
n 6/
05
Venezuela has moved to address anomalies in
several contracts signed with foreign operators in
the 1990s. It says these contracts contain terms
and conditions that run counter to the national
interest and also need to be brought into line
with the new legislation affecting hydrocarbon
exploitation and production.
2. The Sincor OR CerroNegro synthetic crude plant
in the Orinoco Basin.
Source: PDVSARighting Wrongs
OPEC Bulletin spoke to the Minister of Energy
and Petroleum and President of Petróleos
de Venezuela (PDVSA), Rafael Ramírez, dur-
ing the 136th (Extraordinary) OPEC Ministerial
Conference in Vienna in June about the contracts’
issue and on his wider plans for the oil and gas
sector in Venezuela.
PD
VSA
Fe
atu
re
17
OPE
C bu
lleti
n 6/
05
Sour
ce: P
DV
SA
Ramírez is confident that these 32 contracts will comply
with the new legislation in Venezuela by the end of this
year. He says this must happen in order to ensure that
the contracts are fair and that the royalty and taxation
system they contain are aligned to the interests of the
Venezuelan state.
The affected contracts date back to the 1990s. There
are 32 in total: 31 resulting from three bidding rounds
held in 1992, 1993 and 1997; and one relating to a direct
operating contract for the Boscán field.
Co n t r a c t i r r e g u l a r i t i e s
Ramírez argues that the contracts have in effect become
operating agreements rather than the “simple service”
contracts they should have been originally and adds that,
as well as not being compliant with existing legislation
they also fell foul of the legislation in place at the time
they were awarded.
As Ramírez noted in a recent speech to the Venezuelan
National Assembly: “Contractors were clearly not meant
to acquire any rights over volumes, reserves or prices…
however, it has been demonstrated that…PDVSA quite
simply turned over to third parties the activities of explo-
ration or production that has been expressly reserved
by the nationalization law either for state enterprises or
for association agreements carried out by a state enter-
prise.”
The first round of contracts awarded in 1992 was
designed to boost production from marginal or abandoned
fields and, as such, the contracts reflected the nature of
these fields.
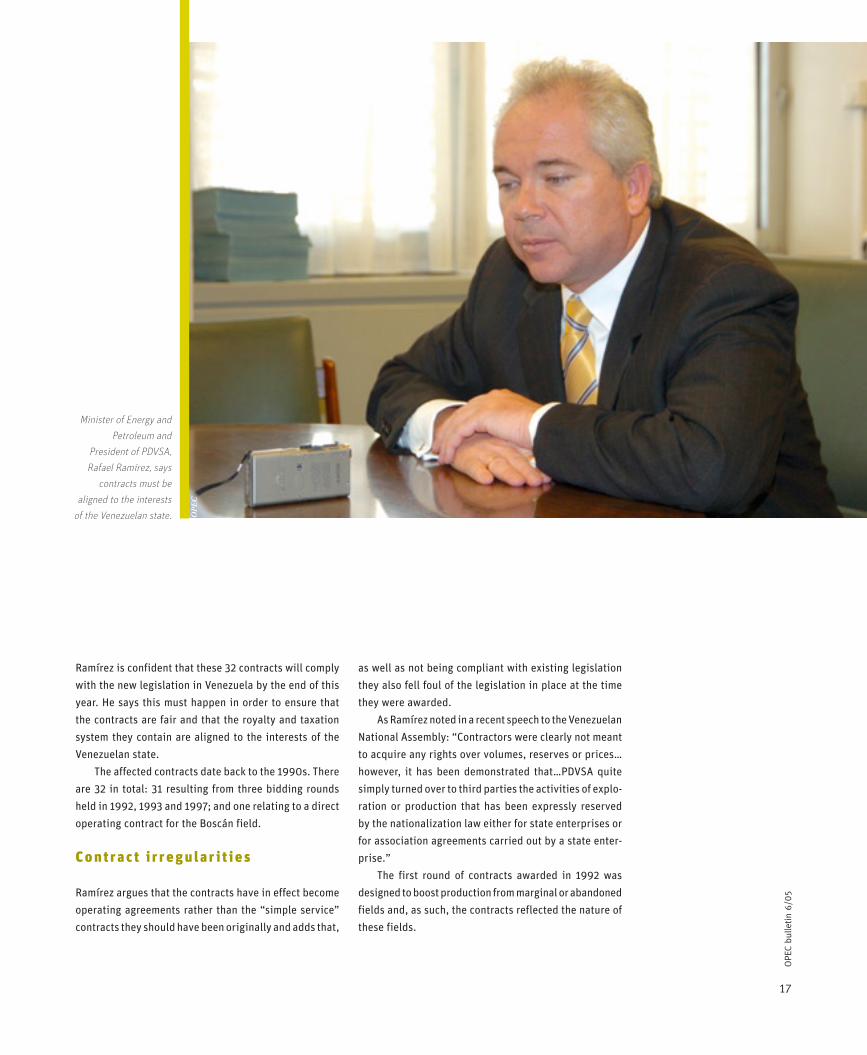
Minister of Energy and
Petroleum and
President of PDVSA,
Rafael Ramírez, says
contracts must be
aligned to the interests
of the Venezuelan state. OP
EC
18
OPE
C bu
lleti
n 6/
05
By the time of the second round in 1993, most of the
fields were still marginal but the Boscán field (contract
signed in 1995 as part of the second round) was produc-
ing 80,000 barrels per day — some way off marginal field
status.
By the third round in 1997, all the fields involved were
producing and this, Ramírez believes, amounted to the
“active privatization” by PDVSA of national oil interests
— something prohibited under the legislation of the time
and definitely not envisaged by the current legislation.
“With each successive bidding round…the operating con-
tracts became even more illegal,” he says.
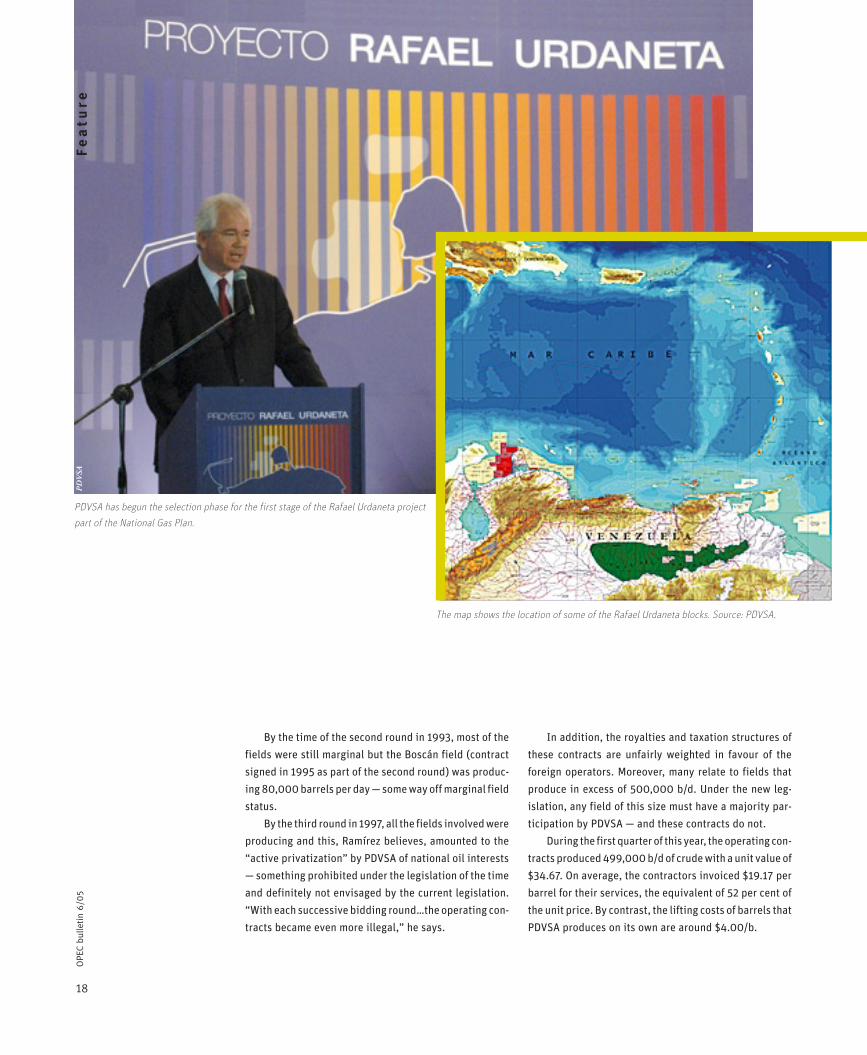
PDVSA has begun the selection phase for the first stage of the Rafael Urdaneta project
part of the National Gas Plan.
In addition, the royalties and taxation structures of
these contracts are unfairly weighted in favour of the
foreign operators. Moreover, many relate to fields that
produce in excess of 500,000 b/d. Under the new leg-
islation, any field of this size must have a majority par-
ticipation by PDVSA — and these contracts do not.
During the first quarter of this year, the operating con-
tracts produced 499,000 b/d of crude with a unit value of
$34.67. On average, the contractors invoiced $19.17 per
barrel for their services, the equivalent of 52 per cent of
the unit price. By contrast, the lifting costs of barrels that
PDVSA produces on its own are around $4.00/b.
The map shows the location of some of the Rafael Urdaneta blocks. Source: PDVSA.
PD
VSA
F
ea
ture
19
OPE
C bu
lleti
n 6/
05
Sour
ce: P
DV
SA
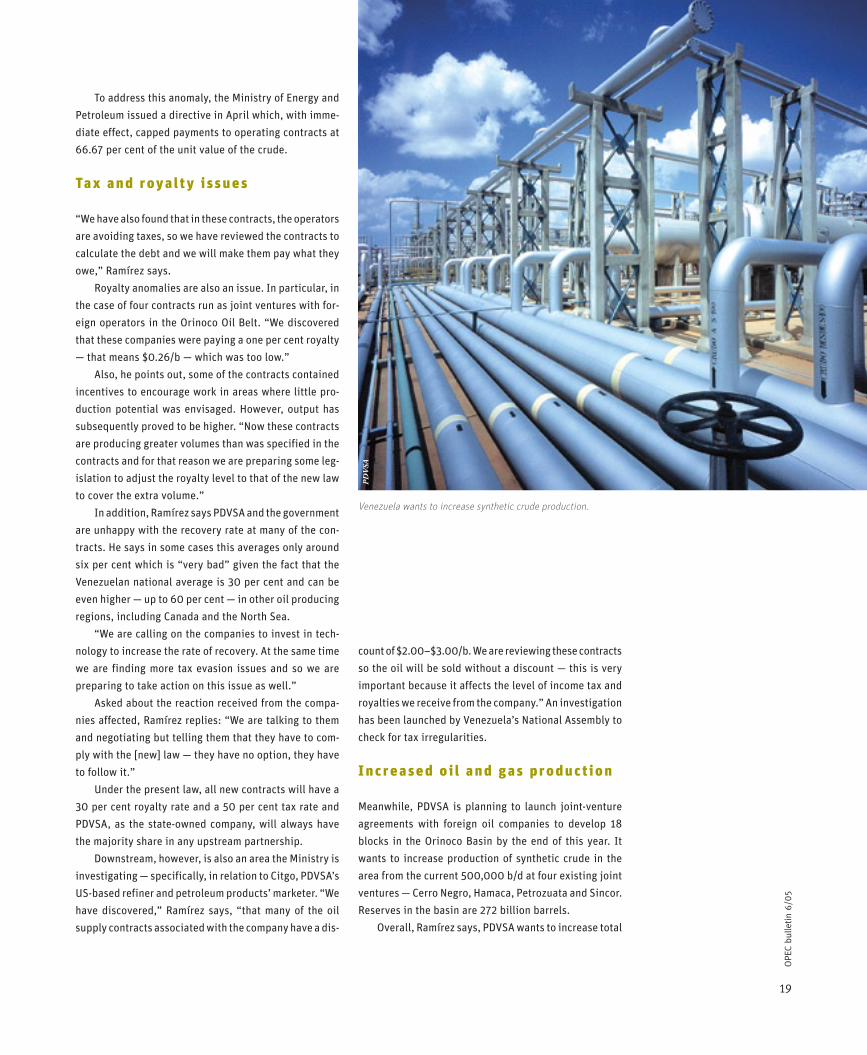
Venezuela wants to increase synthetic crude production.
To address this anomaly, the Ministry of Energy and
Petroleum issued a directive in April which, with imme-
diate effect, capped payments to operating contracts at
66.67 per cent of the unit value of the crude.
Ta x a n d r oy a l t y i ss u e s
“We have also found that in these contracts, the operators
are avoiding taxes, so we have reviewed the contracts to
calculate the debt and we will make them pay what they
owe,” Ramírez says.
Royalty anomalies are also an issue. In particular, in
the case of four contracts run as joint ventures with for-
eign operators in the Orinoco Oil Belt. “We discovered
that these companies were paying a one per cent royalty
— that means $0.26/b — which was too low.”
Also, he points out, some of the contracts contained
incentives to encourage work in areas where little pro-
duction potential was envisaged. However, output has
subsequently proved to be higher. “Now these contracts
are producing greater volumes than was specified in the
contracts and for that reason we are preparing some leg-
islation to adjust the royalty level to that of the new law
to cover the extra volume.”
In addition, Ramírez says PDVSA and the government
are unhappy with the recovery rate at many of the con-
tracts. He says in some cases this averages only around
six per cent which is “very bad” given the fact that the
Venezuelan national average is 30 per cent and can be
even higher — up to 60 per cent — in other oil producing
regions, including Canada and the North Sea.
“We are calling on the companies to invest in tech-
nology to increase the rate of recovery. At the same time
we are finding more tax evasion issues and so we are
preparing to take action on this issue as well.”
Asked about the reaction received from the compa-
nies affected, Ramírez replies: “We are talking to them
and negotiating but telling them that they have to com-
ply with the [new] law — they have no option, they have
to follow it.”
Under the present law, all new contracts will have a
30 per cent royalty rate and a 50 per cent tax rate and
PDVSA, as the state-owned company, will always have
the majority share in any upstream partnership.
Downstream, however, is also an area the Ministry is
investigating — specifically, in relation to Citgo, PDVSA’s
US-based refiner and petroleum products’ marketer. “We
have discovered,” Ramírez says, “that many of the oil
supply contracts associated with the company have a dis-
count of $2.00–$3.00/b. We are reviewing these contracts
so the oil will be sold without a discount — this is very
important because it affects the level of income tax and
royalties we receive from the company.” An investigation
has been launched by Venezuela’s National Assembly to
check for tax irregularities.
I n c r e a se d o i l a n d g a s p r o d u c t i o n
Meanwhile, PDVSA is planning to launch joint-venture
agreements with foreign oil companies to develop 18
blocks in the Orinoco Basin by the end of this year. It
wants to increase production of synthetic crude in the
area from the current 500,000 b/d at four existing joint
ventures — Cerro Negro, Hamaca, Petrozuata and Sincor.
Reserves in the basin are 272 billion barrels.
Overall, Ramírez says, PDVSA wants to increase total
PD
VSA
20
OPE
C bu
lleti
n 6/
05
oil production in the country to five million b/d by 2009.
Downstream, he also wants to increase refining through-
put by adding 600,000 b/d from two new refineries to
the existing 3.3m b/d capacity. These new facilities will
be used to process heavier crude grades.
While Venezuela wants to maintain majority state
control in any oil joint ventures, it’s a different story for
gas. Here, private investors can participate in projects
up to 100 per cent and these contracts are subject to a
different law than the one relating to oil.
In April, PDVSA began the selection phase for the
first stage of the Rafael Urdaneta project part of the
National Gas Plan. A total of 29 blocks are to be offered
for development — 18 offshore in the Gulf of Venezuela
and 11 north-east of Falcón which overall cover around
300,000 square km.
“We are planning to finish by September,” Ramírez
says. “We have had interest from 33 companies from
around the world including Russia, the US and Brazil and
they now have all the data.”
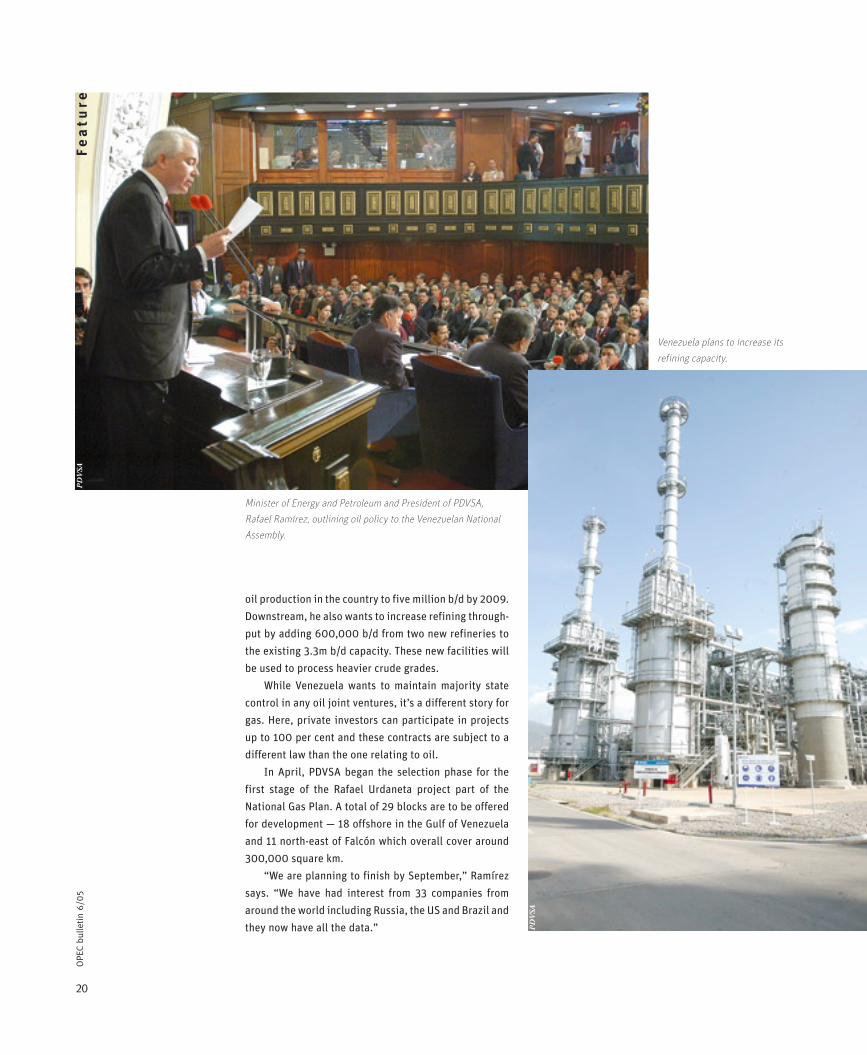
Minister of Energy and Petroleum and President of PDVSA,
Rafael Ramírez, outlining oil policy to the Venezuelan National
Assembly.
Venezuela plans to increase its
refining capacity.
PD
VSA
PD
VSA
Fe
atu
re
21
OPE
C bu
lleti
n 6/
05
More details on the issue of the renegotiation of
contracts and the Ministry of Energy and Petroleum’s
policy for oil can be found in a publication entitled
‘Full Sovereignty Over Oil — A National, Popular
and Revolutionary Oil Policy’. This is based on a
recent address given by the Minister of Energy and
Petroleum and President of PDVSA, Rafael Ramírez,
to the National Assembly of the Bolivarian Republic
of Venezuela.
Full copies of the document can be obtained at
www.pdvsa.com/en/
or
www.mem.gov.ve/noticias/prensa/index.php.
He says that 27 trillion cubic feet of
gas needs to be exploited and commer-
cialized from this area. Any gas produced
will initially be used to supply the domes-
tic market and once that is satisfied, then
a liquefied natural gas (lng) export mar-
ket will be developed along with the five
blocks in the Plataforma area currently
being explored by ConocoPhillips and
Statoil amongst others.
“We have a total of 147 tcf of proven
gas reserves but most of our production
is consumed by PDVSA for use in oil pro-
duction and so we are looking for more
gas for local industry and domestic sup-
plies but also for lng exports in the long
term.” Ramírez says he hopes a two-train
lng facility, each with a capacity of 4.7
million tonnes per year, will be commis-
sioned by 2009.
PD
VSA
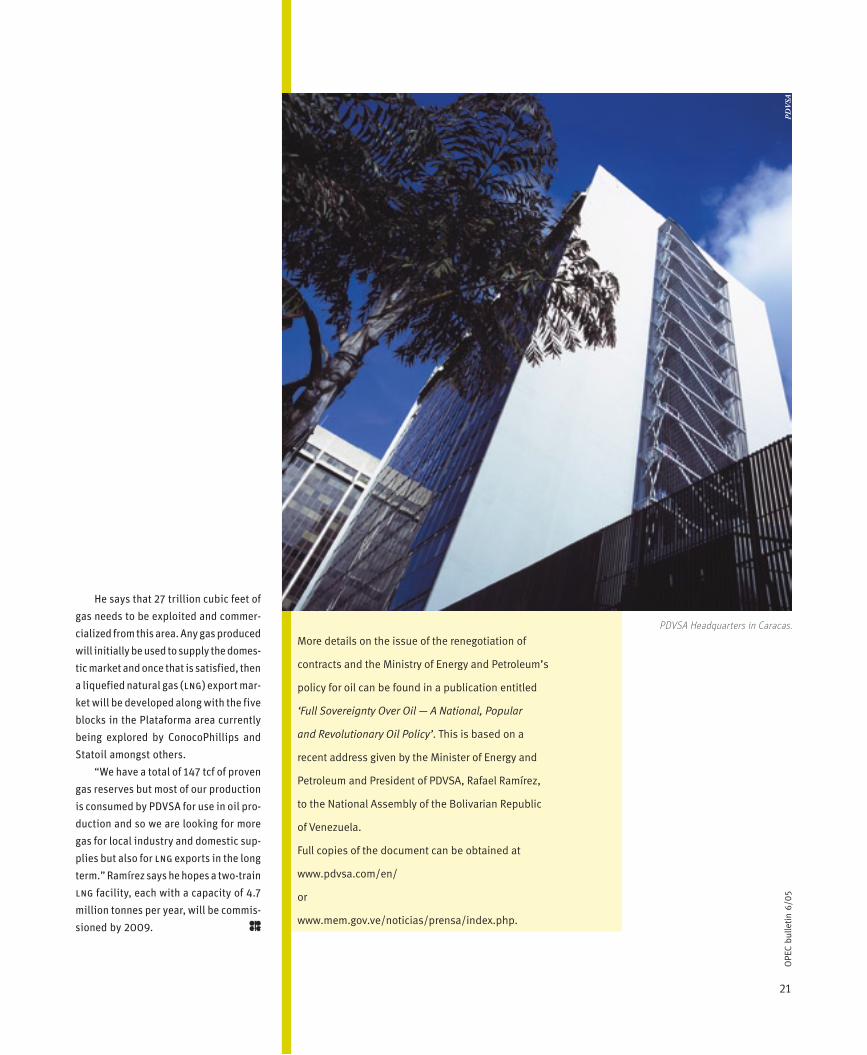
PDVSA Headquarters in Caracas.

22
OPE
C bu
lleti
n 6/
05N
ew
sli
ne
Project Kuwait approval due this year
Kuwait’s Minister of Energy and President of the
OPEC Conference, His Excellency Sheikh Ahmad
Fahad Al-Ahmad Al-Sabah, is confident
Project Kuwait will finally be launched
by the end of this year.
Project Kuwait — the plan to increase oil
production from Kuwait’s northern fields —
is expected to be given the go-ahead by the
end of this year, Kuwait’s Minister of Energy
and President of the OPEC Conference, His
Excellency Sheikh Ahmad Fahad Al-Ahmad
Al-Sabah, has said.
The possibility that Project Kuwait will
be finally launched came a step closer in
June when the Finance and Economic Affairs
Committee of Kuwait’s National Assembly
unanimously approved the draft law for the
project.
Al-Sabah told the OPEC Bulletin during
the 136th Meeting of the OPEC Conference
in Vienna that the project was now at an
advanced stage. “The Finance Committee
report on the draft law is being prepared and I
hope that it will be added to the agenda of our
National Assembly as soon as possible.”
The law will require Assembly approval
in order to be enacted and the current ses-
sion was to end on July 1. “I hope it will make
it onto the agenda by then and that we can
hold a special session to discuss the north-
ern fields,” Al-Sabah said.
Failing that, the vote would be held during
the next Assembly session, which begins in the
middle of October. “In any case, either deadline
means that we will have the approval before
OP
EC
23
OPE
C bu
lleti
n 6/
05
the end of this year. We have a lot of support
in the parliament and we are more than satis-
fied with the new model and agreement.”
Once approved, Al-Sabah said it would
take half a year for the project to be officially
launched. “We will need six months year to
prepare the documents and then go through
the process of tenders.”
Project Kuwait was first launched in 1997
by Kuwait’s Supreme Petroleum Council (SPC).
It was envisaged as a $7 billion project to
boost domestic production with the help of
international oil companies (IOCs) as part of
an overall plan to boost crude output to 4 mil-
lion barrels per day by 2020.
The draft law approved in June covers
only four fields in the north (less than had
been originally proposed in 1997), includ-
ing, Abdali, Ratqa, Raudhatain and Sabriya.
Production capacity at these fields will be
increased to 900,000 b/d for a 20-year
period.
Chairman of the Finance and Economic
Affairs Committee and Member of Parliament
Abdel-Wahab Al-Haroun told the Kuwait News
Agency (KUNA) that separate legislation would
be required for the development of other fields
in the north.
He added that the three IOC bidding
consortia which the SPC approved in 2003
(see below) were not allowed “to ignore this
change.” Responsibility for the develop-
ment of other fields would lie with Kuwait Oil
Company, he said.
Al-Haroun told KUNA that these four fields
were expected to produce 5bn b of oil over
20 years. Other elements in the draft law
include: an increase in the level of employ-
ment of Kuwaiti nationals to 80 per cent and
an income tax rate of 25 per cent on IOC prof-
its. Tenders for the project would, he said, be
handled by an independent committee.
The three consortia entitled to bid by
the SPC for Project Kuwait are: Chevron,
Total, PetroCanada, Sibneft, Sinopec; BP,
Occidental, ONGC/Indian Oil Corporation;
and ExxonMobil, Shell, ConocoPhillips,
Maersk.
Gas import plans
Meanwhile, Al-Sabah told the OPEC Bulletin
that Kuwait continues to negotiate on two
projects to import gas into the country.
He said talks were at an advanced stage
with Iran for a pipeline into Kuwait, which is
expected to carry up to 10bn cubic feet of gas
per day from late 2007 or early 2008 and cost
around $7bn to build. “I think in August maybe
we will sign the last agreement and then the
project will start,” Al-Sabah said.
He added that talks on another project for
an export pipeline from Qatar to Kuwait were
also continuing. “I hope we will soon have the
approval of all the authorities in those areas
the pipeline passes through.”
AP
Pho
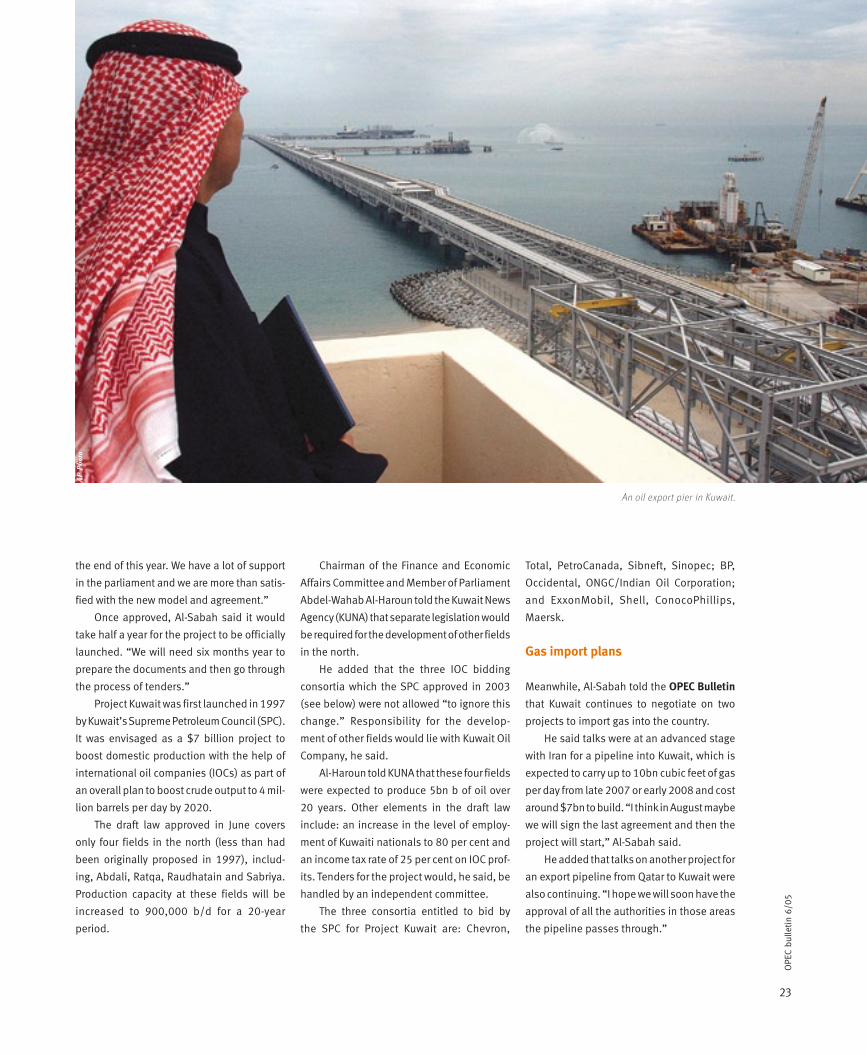
to
An oil export pier in Kuwait.
24
OPE
C bu
lleti
n 6/
05N
ew
sli
ne
Ne
ws
lin
e
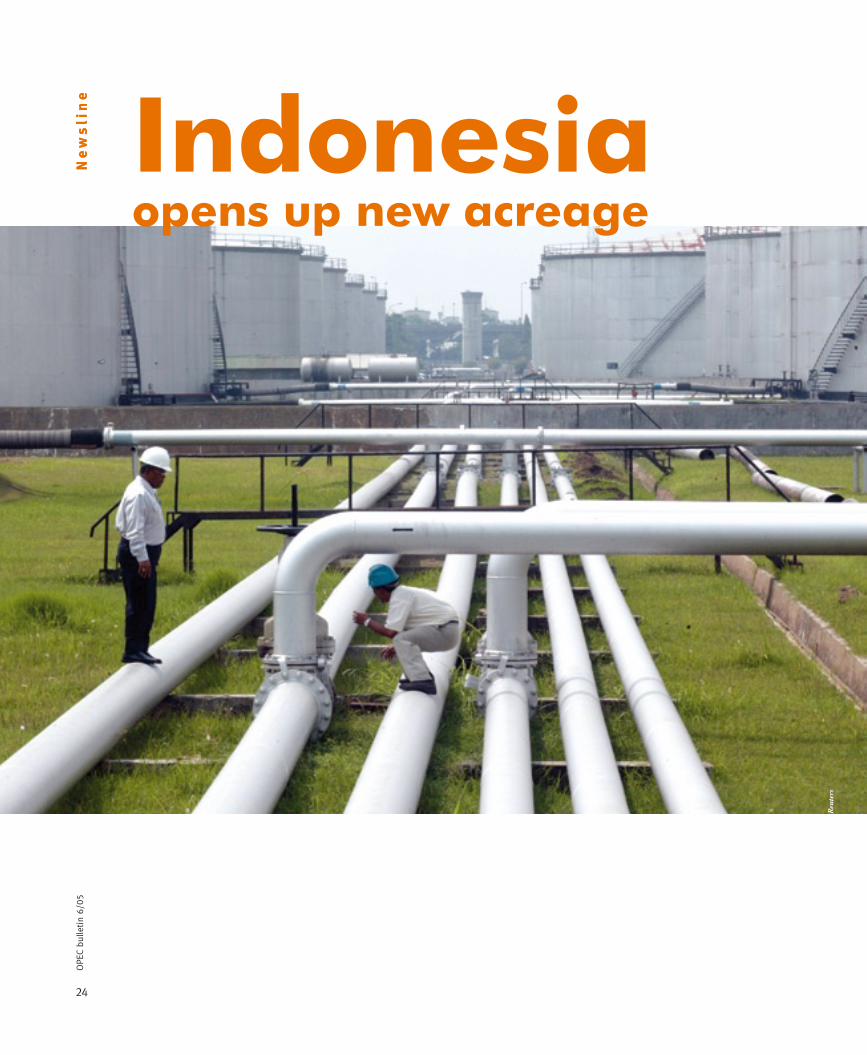
Indonesia opens up new acreage
Reu
ters
25
OPE
C bu
lleti
n 6/
05
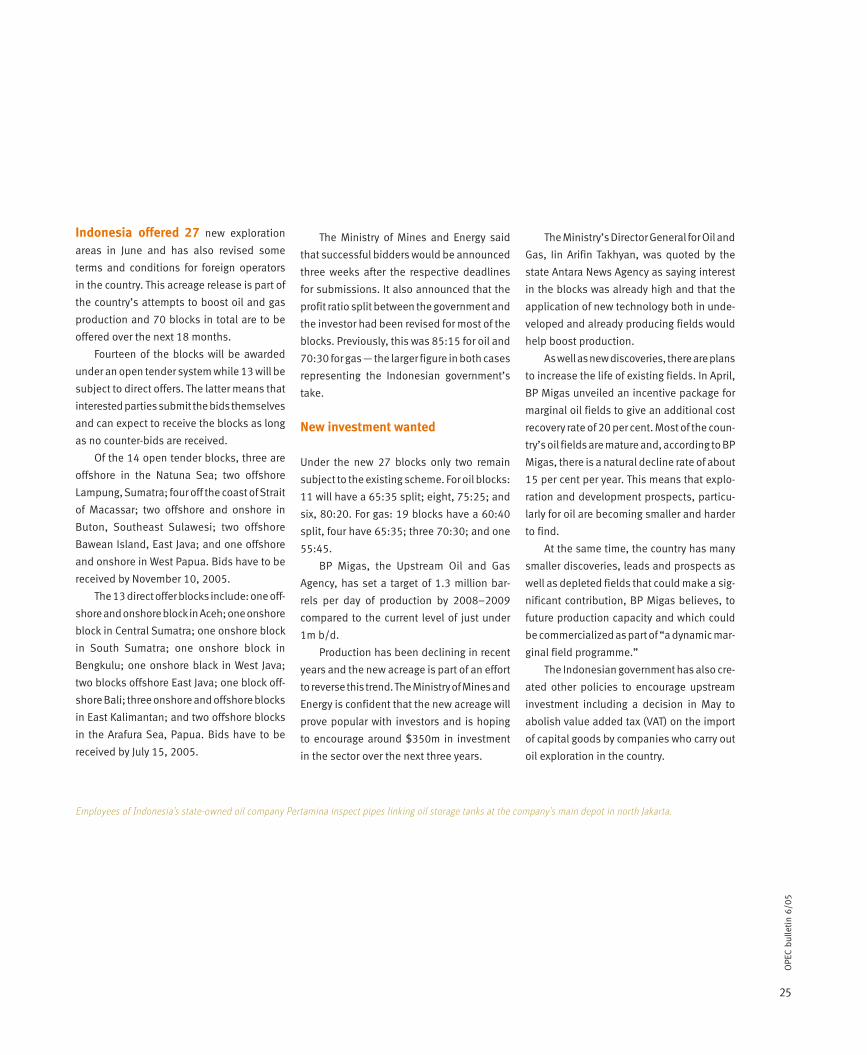
Indonesia offered 27 new exploration
areas in June and has also revised some
terms and conditions for foreign operators
in the country. This acreage release is part of
the country’s attempts to boost oil and gas
production and 70 blocks in total are to be
offered over the next 18 months.
Fourteen of the blocks will be awarded
under an open tender system while 13 will be
subject to direct offers. The latter means that
interested parties submit the bids themselves
and can expect to receive the blocks as long
as no counter-bids are received.
Of the 14 open tender blocks, three are
offshore in the Natuna Sea; two offshore
Lampung, Sumatra; four off the coast of Strait
of Macassar; two offshore and onshore in
Buton, Southeast Sulawesi; two offshore
Bawean Island, East Java; and one offshore
and onshore in West Papua. Bids have to be
received by November 10, 2005.
The 13 direct offer blocks include: one off-
shore and onshore block in Aceh; one onshore
block in Central Sumatra; one onshore block
in South Sumatra; one onshore block in
Bengkulu; one onshore black in West Java;
two blocks offshore East Java; one block off-
shore Bali; three onshore and offshore blocks
in East Kalimantan; and two offshore blocks
in the Arafura Sea, Papua. Bids have to be
received by July 15, 2005.
The Ministry of Mines and Energy said
that successful bidders would be announced
three weeks after the respective deadlines
for submissions. It also announced that the
profit ratio split between the government and
the investor had been revised for most of the
blocks. Previously, this was 85:15 for oil and
70:30 for gas — the larger figure in both cases
representing the Indonesian government’s
take.
New investment wanted
Under the new 27 blocks only two remain
subject to the existing scheme. For oil blocks:
11 will have a 65:35 split; eight, 75:25; and
six, 80:20. For gas: 19 blocks have a 60:40
split, four have 65:35; three 70:30; and one
55:45.
BP Migas, the Upstream Oil and Gas
Agency, has set a target of 1.3 million bar-
rels per day of production by 2008–2009
compared to the current level of just under
1m b/d.
Production has been declining in recent
years and the new acreage is part of an effort
to reverse this trend. The Ministry of Mines and
Energy is confident that the new acreage will
prove popular with investors and is hoping
to encourage around $350m in investment
in the sector over the next three years.
The Ministry’s Director General for Oil and
Gas, Iin Arifin Takhyan, was quoted by the
state Antara News Agency as saying interest
in the blocks was already high and that the
application of new technology both in unde-
veloped and already producing fields would
help boost production.
As well as new discoveries, there are plans
to increase the life of existing fields. In April,
BP Migas unveiled an incentive package for
marginal oil fields to give an additional cost
recovery rate of 20 per cent. Most of the coun-
try’s oil fields are mature and, according to BP
Migas, there is a natural decline rate of about
15 per cent per year. This means that explo-
ration and development prospects, particu-
larly for oil are becoming smaller and harder
to find.
At the same time, the country has many
smaller discoveries, leads and prospects as
well as depleted fields that could make a sig-
nificant contribution, BP Migas believes, to
future production capacity and which could
be commercialized as part of “a dynamic mar-
ginal field programme.”
The Indonesian government has also cre-
ated other policies to encourage upstream
investment including a decision in May to
abolish value added tax (VAT) on the import
of capital goods by companies who carry out
oil exploration in the country.
Employees of Indonesia’s state-owned oil company Pertamina inspect pipes linking oil storage tanks at the company’s main depot in north Jakarta.
26
OPE
C bu
lleti
n 6/
05N
ew
sli
ne
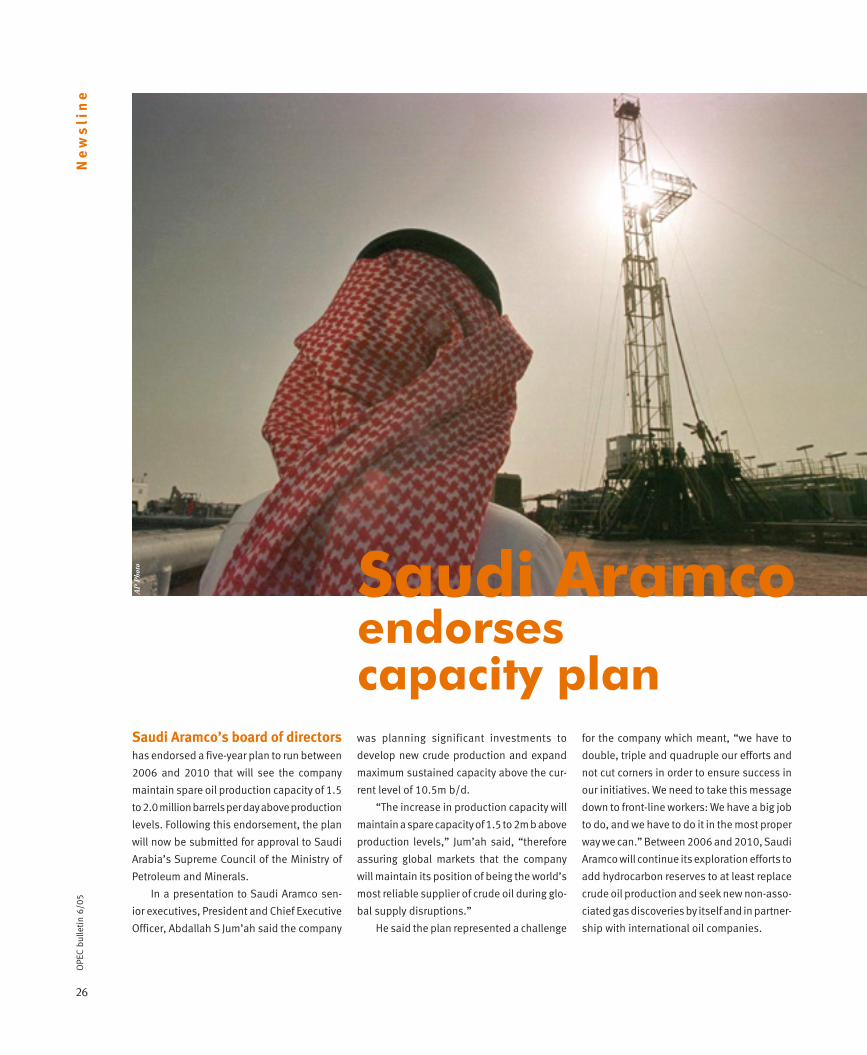
Saudi Aramco’s board of directors
has endorsed a five-year plan to run between
2006 and 2010 that will see the company
maintain spare oil production capacity of 1.5
to 2.0 million barrels per day above production
levels. Following this endorsement, the plan
will now be submitted for approval to Saudi
Arabia’s Supreme Council of the Ministry of
Petroleum and Minerals.
In a presentation to Saudi Aramco sen-
ior executives, President and Chief Executive
Officer, Abdallah S Jum’ah said the company
was planning significant investments to
develop new crude production and expand
maximum sustained capacity above the cur-
rent level of 10.5m b/d.
“The increase in production capacity will
maintain a spare capacity of 1.5 to 2m b above
production levels,” Jum’ah said, “therefore
assuring global markets that the company
will maintain its position of being the world’s
most reliable supplier of crude oil during glo-
bal supply disruptions.”
He said the plan represented a challenge
Saudi Aramco endorses capacity plan
AP
Pho
to
for the company which meant, “we have to
double, triple and quadruple our efforts and
not cut corners in order to ensure success in
our initiatives. We need to take this message
down to front-line workers: We have a big job
to do, and we have to do it in the most proper
way we can.” Between 2006 and 2010, Saudi
Aramco will continue its exploration efforts to
add hydrocarbon reserves to at least replace
crude oil production and seek new non-asso-
ciated gas discoveries by itself and in partner-
ship with international oil companies.
27
OPE
C bu
lleti
n 6/
05
i n b r i e f It will also focus on opportunities that
“will facilitate development of the Kingdom’s
industrial sector by providing new business
opportunities and creating jobs”, Jum’ah said,
adding human resources would be developed
and efficiency and productivity increased.
Optimization
By focusing on high-realization markets
and maintaining a diverse presence in major
crude oil markets, Saudi Aramco believes it
will “optimize revenues” and protect its inter-
national oil markets. Moreover, it wants to
optimize its assets portfolio “to improve pro-
ductivity and enhance revenue generation,”
maximize revenues to the Kingdom and pro-
mote the local economy.
Saudi Aramco is forecasting a healthy
economic and oil-demand outlook with
crude supplies expected to decline from
mature areas and increase from new pro-
duction areas mostly from countries outside
the Organization for Economic Cooperation
Development.
The company says its “spare capacity
cushion” is “a critical source of stability
in oil markets and, consequently, to
the health and prosperity of the
global economy.”
Saud
i Ara
mco
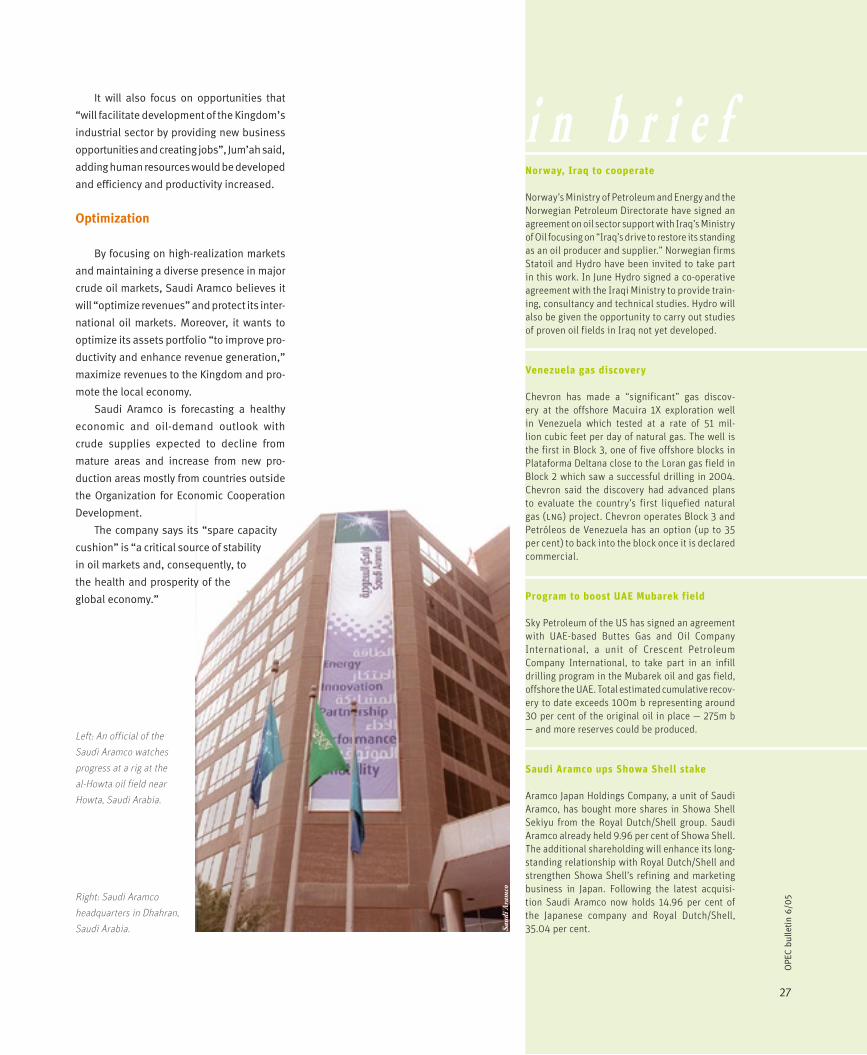
Left: An official of the
Saudi Aramco watches
progress at a rig at the
al-Howta oil field near
Howta, Saudi Arabia.
Right: Saudi Aramco
headquarters in Dhahran,
Saudi Arabia.
Norway, Iraq to cooperate
Norway’s Ministry of Petroleum and Energy and the Norwegian Petroleum Directorate have signed an agreement on oil sector support with Iraq’s Ministry of Oil focusing on “Iraq’s drive to restore its standing as an oil producer and supplier.” Norwegian firms Statoil and Hydro have been invited to take part in this work. In June Hydro signed a co-operative agreement with the Iraqi Ministry to provide train-ing, consultancy and technical studies. Hydro will also be given the opportunity to carry out studies of proven oil fields in Iraq not yet developed.
Venezuela gas discovery
Chevron has made a “significant” gas discov-ery at the offshore Macuira 1X exploration well in Venezuela which tested at a rate of 51 mil-lion cubic feet per day of natural gas. The well is the first in Block 3, one of five offshore blocks in Plataforma Deltana close to the Loran gas field in Block 2 which saw a successful drilling in 2004. Chevron said the discovery had advanced plans to evaluate the country’s first liquefied natural gas (lng) project. Chevron operates Block 3 and Petróleos de Venezuela has an option (up to 35 per cent) to back into the block once it is declared commercial.
Program to boost UAE Mubarek field
Sky Petroleum of the US has signed an agreement with UAE-based Buttes Gas and Oil Company International, a unit of Crescent Petroleum Company International, to take part in an infill drilling program in the Mubarek oil and gas field, offshore the UAE. Total estimated cumulative recov-ery to date exceeds 100m b representing around 30 per cent of the original oil in place — 275m b — and more reserves could be produced.
Saudi Aramco ups Showa Shell stake
Aramco Japan Holdings Company, a unit of Saudi Aramco, has bought more shares in Showa Shell Sekiyu from the Royal Dutch/Shell group. Saudi Aramco already held 9.96 per cent of Showa Shell. The additional shareholding will enhance its long-standing relationship with Royal Dutch/Shell and strengthen Showa Shell’s refining and marketing business in Japan. Following the latest acquisi-tion Saudi Aramco now holds 14.96 per cent of the Japanese company and Royal Dutch/Shell, 35.04 per cent.

28
OPE
C bu
lleti
n 6/
05N
ew
sli
ne
The contract for the first phase of the
Medgaz Algeria-Spain gas export pipeline
project was signed in early June by Algeria’s
Sonatrach and the Algerian-Spanish group
Cosider-Masa.
The first phase covering 302 kilometres
and costing 7.14 billion dinars will link the
gas fields of Hassi R’Mel with the town of
Sougeur.
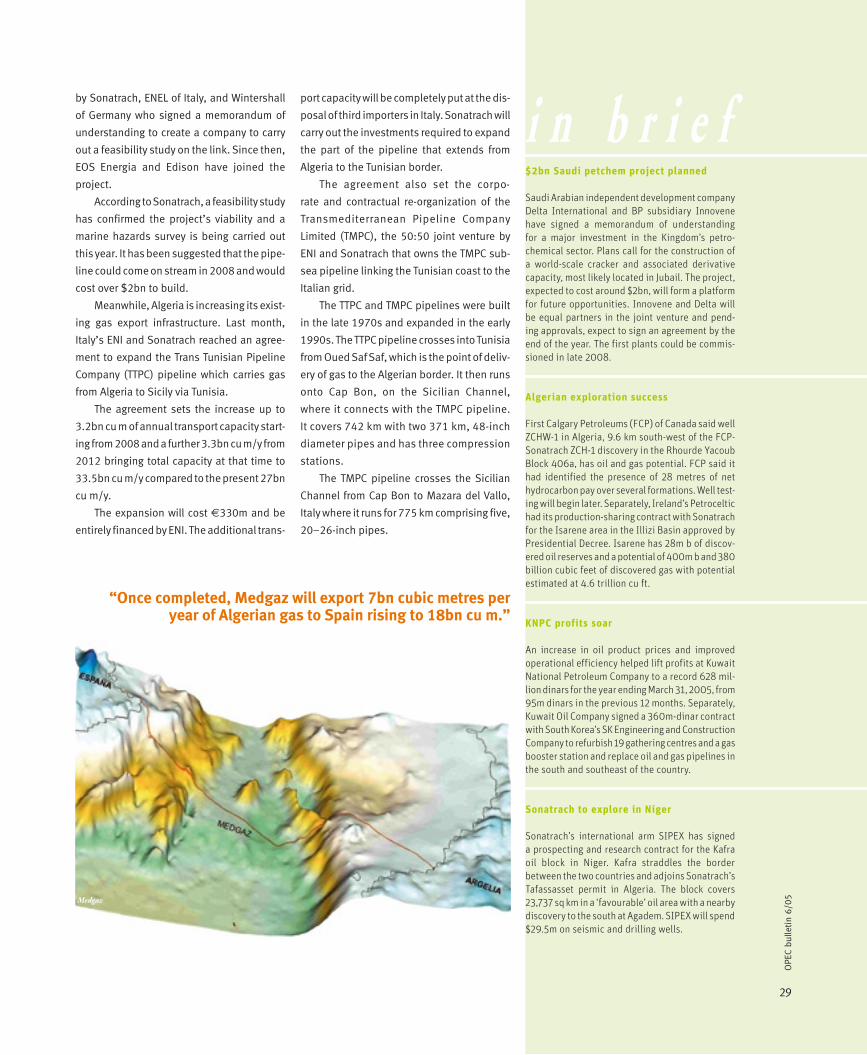
Once completed, the Medgaz pipeline will
initially export 7bn cubic metres per year of
Algerian gas to Spain eventually rising to 18bn
cu m. Work on the first phase is expected to
start this summer and take around 20 months
to complete.
At a ceremony to mark the signing,
Sonatrach’s President Mohamed Meziane
said that the contract represented the first
important step for the Medgaz project “which
Algeriasigns first Medgaz pipe deal
will reinforce and strengthen our exports in
the Mediterranean Basin gas market.”
This first stage of the pipeline will also
feed a 1,200 MW electric power plant at
Hadjeret Ennouss and boost supplies of gas
to local communities along its path.
The contract for the second phase, which
will link the pipeline to Arzew, is being put
out to national and international tender,
Meziane said. The third phase will be a link
between Relizane and Beni Saf on Algeria’s
Mediterranean coast from where the pipeline
will go underwater before reaching Almeria in
Spain.
Meziane said the signing of this first con-
tract was strategically important and “demon-
strated once again the political desire of our
sector to ensure its historic role as a moti-
vator for national development and to cre-
ate wealth. Indeed, the economic and social
benefits of this project will affect everybody.
We are also using this, our own natural gas
energy, for the benefit of the domestic popula-
tion, for small and medium-sized businesses
as well as major industry. This project will
establish Sonatrach and thereby Algeria as
an important player in the European energy
supply market.”
Medgaz was launched in 2001 and first
gas is expected in the second half of 2008.
It is run as a consortium comprising seven
international companies including found-
ing partners and core shareholders, Spain’s
CEPSA and Sonatrach, along with BP, Endesa,
Gaz de France, Iberdrola and Total.
Algeria also has another new gas export
project dubbed GALSI (Gazoduc Algeria-
Sardinia-Italy). This was launched in 2001
The official contract signing ceremony in Algeria.
Med
gaz/
Sona
trac
h
29
OPE
C bu
lleti
n 6/
05
i n b r i e f
“Once completed, Medgaz will export 7bn cubic metres per year of Algerian gas to Spain rising to 18bn cu m.”
by Sonatrach, ENEL of Italy, and Wintershall
of Germany who signed a memorandum of
understanding to create a company to carry
out a feasibility study on the link. Since then,
EOS Energia and Edison have joined the
project.
According to Sonatrach, a feasibility study
has confirmed the project’s viability and a
marine hazards survey is being carried out
this year. It has been suggested that the pipe-
line could come on stream in 2008 and would
cost over $2bn to build.
Meanwhile, Algeria is increasing its exist-
ing gas export infrastructure. Last month,
Italy’s ENI and Sonatrach reached an agree-
ment to expand the Trans Tunisian Pipeline
Company (TTPC) pipeline which carries gas
from Algeria to Sicily via Tunisia.
The agreement sets the increase up to
3.2bn cu m of annual transport capacity start-
ing from 2008 and a further 3.3bn cu m/y from
2012 bringing total capacity at that time to
33.5bn cu m/y compared to the present 27bn
cu m/y.
The expansion will cost €330m and be
entirely financed by ENI. The additional trans-
port capacity will be completely put at the dis-
posal of third importers in Italy. Sonatrach will
carry out the investments required to expand
the part of the pipeline that extends from
Algeria to the Tunisian border.
The agreement also set the corpo-
rate and contractual re-organization of the
Transmediterranean Pipeline Company
Limited (TMPC), the 50:50 joint venture by
ENI and Sonatrach that owns the TMPC sub-
sea pipeline linking the Tunisian coast to the
Italian grid.
The TTPC and TMPC pipelines were built
in the late 1970s and expanded in the early
1990s. The TTPC pipeline crosses into Tunisia
from Oued Saf Saf, which is the point of deliv-
ery of gas to the Algerian border. It then runs
onto Cap Bon, on the Sicilian Channel,
where it connects with the TMPC pipeline.
It covers 742 km with two 371 km, 48-inch
diameter pipes and has three compression
stations.
The TMPC pipeline crosses the Sicilian
Channel from Cap Bon to Mazara del Vallo,
Italy where it runs for 775 km comprising five,
20–26-inch pipes.
$2bn Saudi petchem project planned
Saudi Arabian independent development company Delta International and BP subsidiary Innovene have signed a memorandum of understanding for a major investment in the Kingdom’s petro-chemical sector. Plans call for the construction of a world-scale cracker and associated derivative capacity, most likely located in Jubail. The project, expected to cost around $2bn, will form a platform for future opportunities. Innovene and Delta will be equal partners in the joint venture and pend-ing approvals, expect to sign an agreement by the end of the year. The first plants could be commis-sioned in late 2008.
Algerian exploration success
First Calgary Petroleums (FCP) of Canada said well ZCHW-1 in Algeria, 9.6 km south-west of the FCP-Sonatrach ZCH-1 discovery in the Rhourde Yacoub Block 406a, has oil and gas potential. FCP said it had identified the presence of 28 metres of net hydrocarbon pay over several formations. Well test-ing will begin later. Separately, Ireland’s Petroceltic had its production-sharing contract with Sonatrach for the Isarene area in the Illizi Basin approved by Presidential Decree. Isarene has 28m b of discov-ered oil reserves and a potential of 400m b and 380 billion cubic feet of discovered gas with potential estimated at 4.6 trillion cu ft.
KNPC profits soar
An increase in oil product prices and improved operational efficiency helped lift profits at Kuwait National Petroleum Company to a record 628 mil-lion dinars for the year ending March 31, 2005, from 95m dinars in the previous 12 months. Separately, Kuwait Oil Company signed a 360m-dinar contract with South Korea’s SK Engineering and Construction Company to refurbish 19 gathering centres and a gas booster station and replace oil and gas pipelines in the south and southeast of the country.
Sonatrach to explore in Niger
Sonatrach’s international arm SIPEX has signed a prospecting and research contract for the Kafra oil block in Niger. Kafra straddles the border between the two countries and adjoins Sonatrach’s Tafassasset permit in Algeria. The block covers 23,737 sq km in a ‘favourable’ oil area with a nearby discovery to the south at Agadem. SIPEX will spend $29.5m on seismic and drilling wells.
Medgaz
30
OPE
C bu
lleti
n 6/
05N
ew
sli
ne
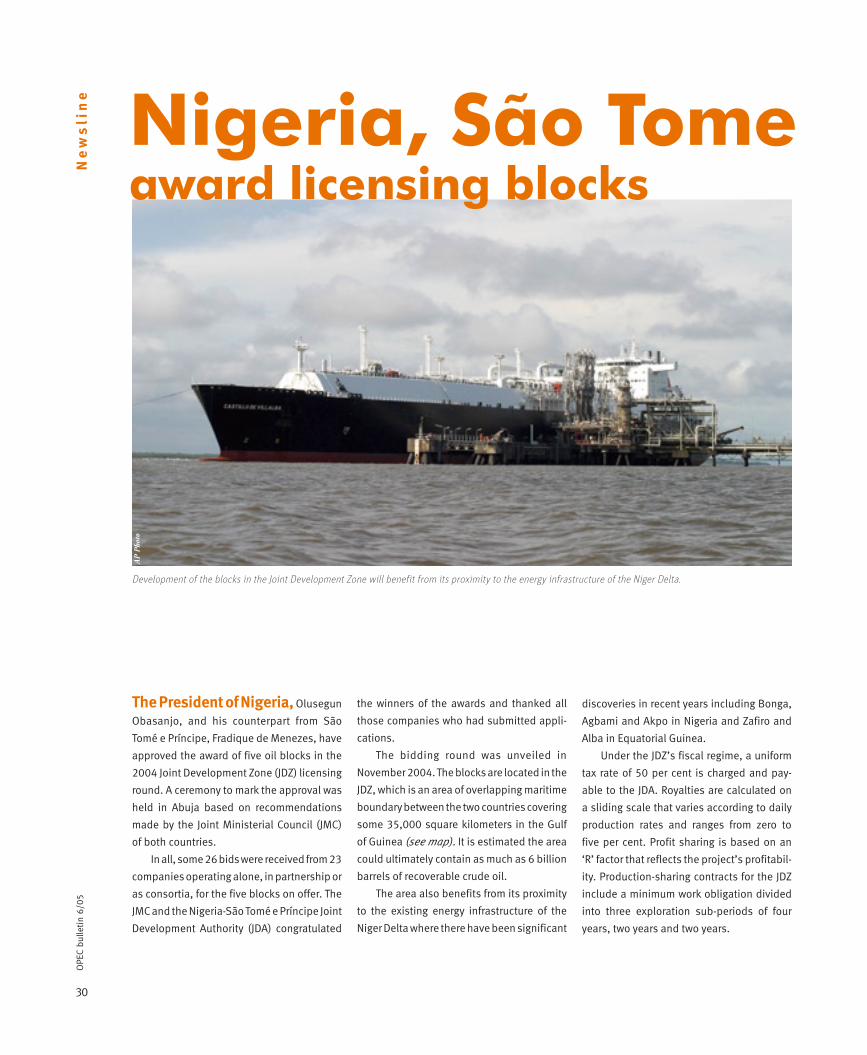
Development of the blocks in the Joint Development Zone will benefit from its proximity to the energy infrastructure of the Niger Delta.
the winners of the awards and thanked all
those companies who had submitted appli-
cations.
The bidding round was unveiled in
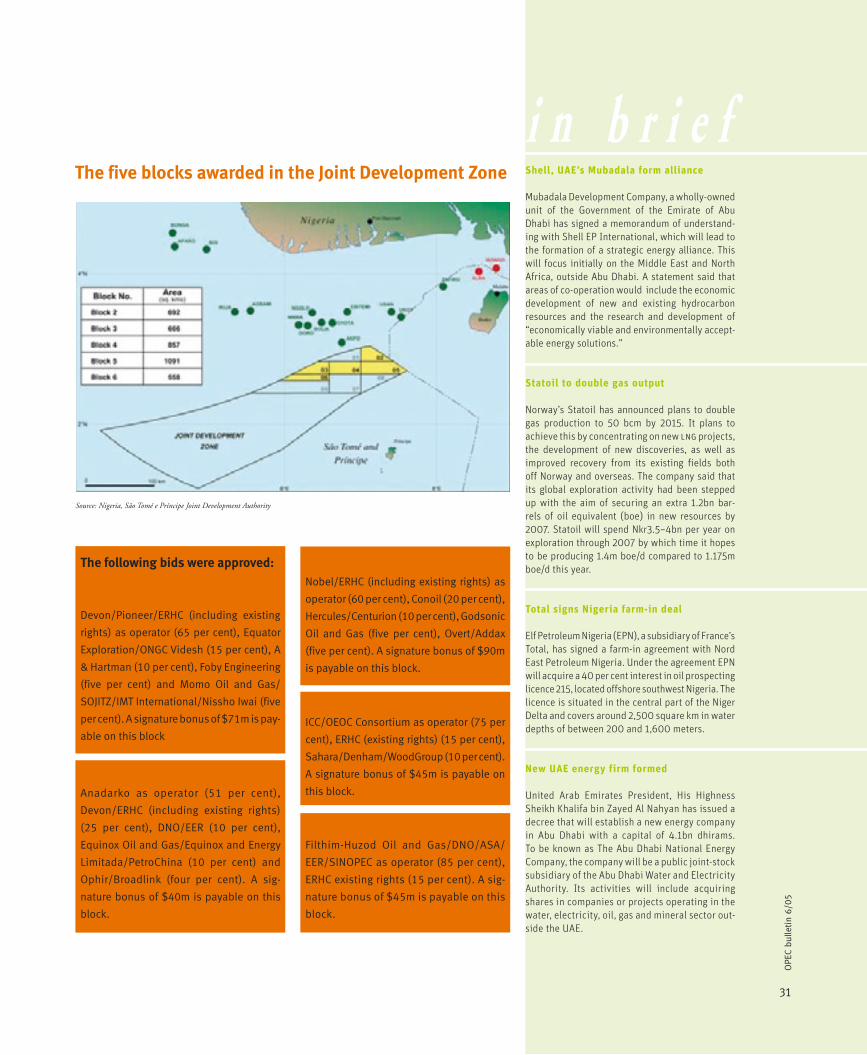
November 2004. The blocks are located in the
JDZ, which is an area of overlapping maritime
boundary between the two countries covering
some 35,000 square kilometers in the Gulf
of Guinea (see map). It is estimated the area
could ultimately contain as much as 6 billion
barrels of recoverable crude oil.
The area also benefits from its proximity
to the existing energy infrastructure of the
Niger Delta where there have been significant
AP
Pho
toNigeria, São Tomeaward licensing blocks
The President of Nigeria, Olusegun
Obasanjo, and his counterpart from São
Tomé e Príncipe, Fradique de Menezes, have
approved the award of five oil blocks in the
2004 Joint Development Zone (JDZ) licensing
round. A ceremony to mark the approval was
held in Abuja based on recommendations
made by the Joint Ministerial Council (JMC)
of both countries.
In all, some 26 bids were received from 23
companies operating alone, in partnership or
as consortia, for the five blocks on offer. The
JMC and the Nigeria-São Tomé e Príncipe Joint
Development Authority (JDA) congratulated
discoveries in recent years including Bonga,
Agbami and Akpo in Nigeria and Zafiro and
Alba in Equatorial Guinea.
Under the JDZ’s fiscal regime, a uniform
tax rate of 50 per cent is charged and pay-
able to the JDA. Royalties are calculated on
a sliding scale that varies according to daily
production rates and ranges from zero to
five per cent. Profit sharing is based on an
‘R’ factor that reflects the project’s profitabil-
ity. Production-sharing contracts for the JDZ
include a minimum work obligation divided
into three exploration sub-periods of four
years, two years and two years.
31
OPE
C bu
lleti
n 6/
05
i n b r i e fThe five blocks awarded in the Joint Development Zone
Source: Nigeria, São Tomé e Príncipe Joint Development Authority
Shell, UAE’s Mubadala form alliance
Mubadala Development Company, a wholly-owned unit of the Government of the Emirate of Abu Dhabi has signed a memorandum of understand-ing with Shell EP International, which will lead to the formation of a strategic energy alliance. This will focus initially on the Middle East and North Africa, outside Abu Dhabi. A statement said that areas of co-operation would include the economic development of new and existing hydrocarbon resources and the research and development of “economically viable and environmentally accept-able energy solutions.”
Statoil to double gas output
Norway’s Statoil has announced plans to double gas production to 50 bcm by 2015. It plans to achieve this by concentrating on new lng projects, the development of new discoveries, as well as improved recovery from its existing fields both off Norway and overseas. The company said that its global exploration activity had been stepped up with the aim of securing an extra 1.2bn bar-rels of oil equivalent (boe) in new resources by 2007. Statoil will spend Nkr3.5–4bn per year on exploration through 2007 by which time it hopes to be producing 1.4m boe/d compared to 1.175m boe/d this year.
Total signs Nigeria farm-in deal
Elf Petroleum Nigeria (EPN), a subsidiary of France’s Total, has signed a farm-in agreement with Nord East Petroleum Nigeria. Under the agreement EPN will acquire a 40 per cent interest in oil prospecting licence 215, located offshore southwest Nigeria. The licence is situated in the central part of the Niger Delta and covers around 2,500 square km in water depths of between 200 and 1,600 meters.
New UAE energy firm formed
United Arab Emirates President, His Highness Sheikh Khalifa bin Zayed Al Nahyan has issued a decree that will establish a new energy company in Abu Dhabi with a capital of 4.1bn dhirams. To be known as The Abu Dhabi National Energy Company, the company will be a public joint-stock subsidiary of the Abu Dhabi Water and Electricity Authority. Its activities will include acquiring shares in companies or projects operating in the water, electricity, oil, gas and mineral sector out-side the UAE.
Block 3
Anadarko as operator (51 per cent),
Devon/ERHC (including existing rights)
(25 per cent), DNO/EER (10 per cent),
Equinox Oil and Gas/Equinox and Energy
Limitada/PetroChina (10 per cent) and
Ophir/Broadlink (four per cent). A sig-
nature bonus of $40m is payable on this
block.
The following bids were approved:
Block 2Devon/Pioneer/ERHC (including existing
rights) as operator (65 per cent), Equator
Exploration/ONGC Videsh (15 per cent), A
& Hartman (10 per cent), Foby Engineering
(five per cent) and Momo Oil and Gas/
SOJITZ/IMT International/Nissho Iwai (five
per cent). A signature bonus of $71m is pay-
able on this block
Block 4
Nobel/ERHC (including existing rights) as
operator (60 per cent), Conoil (20 per cent),
Hercules/Centurion (10 per cent), Godsonic
Oil and Gas (five per cent), Overt/Addax
(five per cent). A signature bonus of $90m
is payable on this block.
Block 5
ICC/OEOC Consortium as operator (75 per
cent), ERHC (existing rights) (15 per cent),
Sahara/Denham/WoodGroup (10 per cent).
A signature bonus of $45m is payable on
this block.
Block 6
Filthim-Huzod Oil and Gas/DNO/ASA/
EER/SINOPEC as operator (85 per cent),
ERHC existing rights (15 per cent). A sig-
nature bonus of $45m is payable on this
block.
32
OPE
C bu
lleti
n 6/
05N
ew
sli
ne
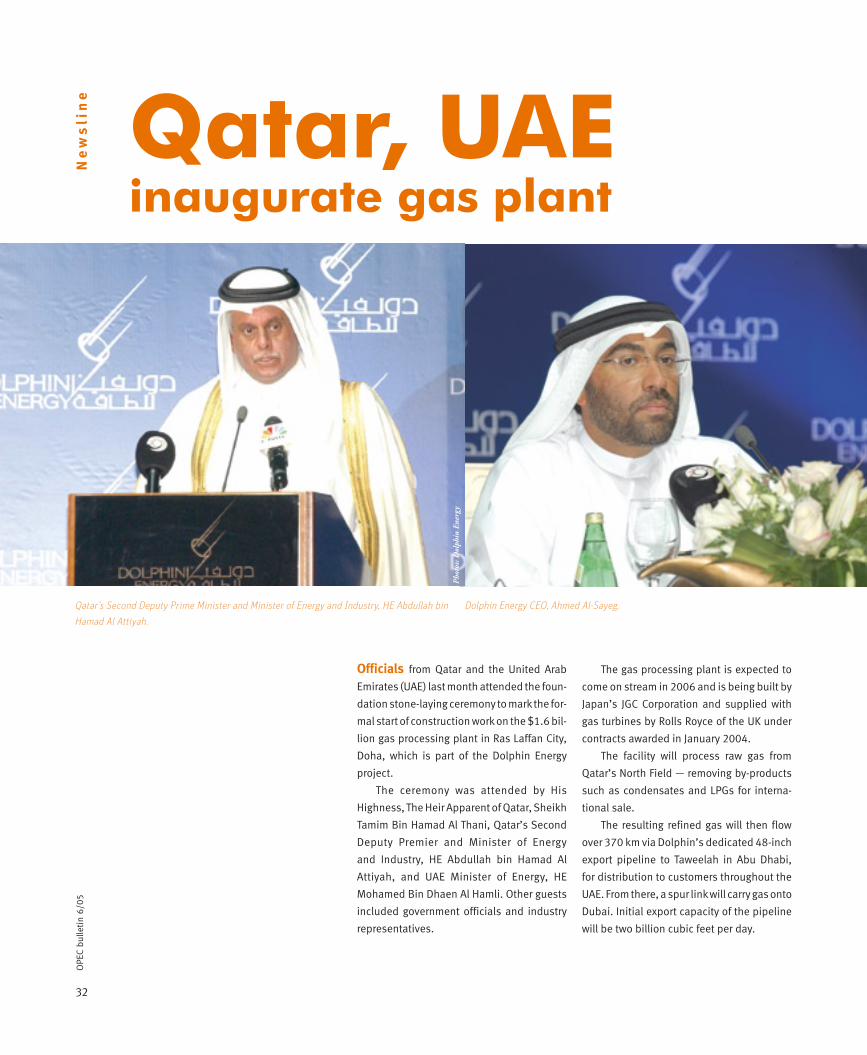
Officials from Qatar and the United Arab
Emirates (UAE) last month attended the foun-
dation stone-laying ceremony to mark the for-
mal start of construction work on the $1.6 bil-
lion gas processing plant in Ras Laffan City,
Doha, which is part of the Dolphin Energy
project.
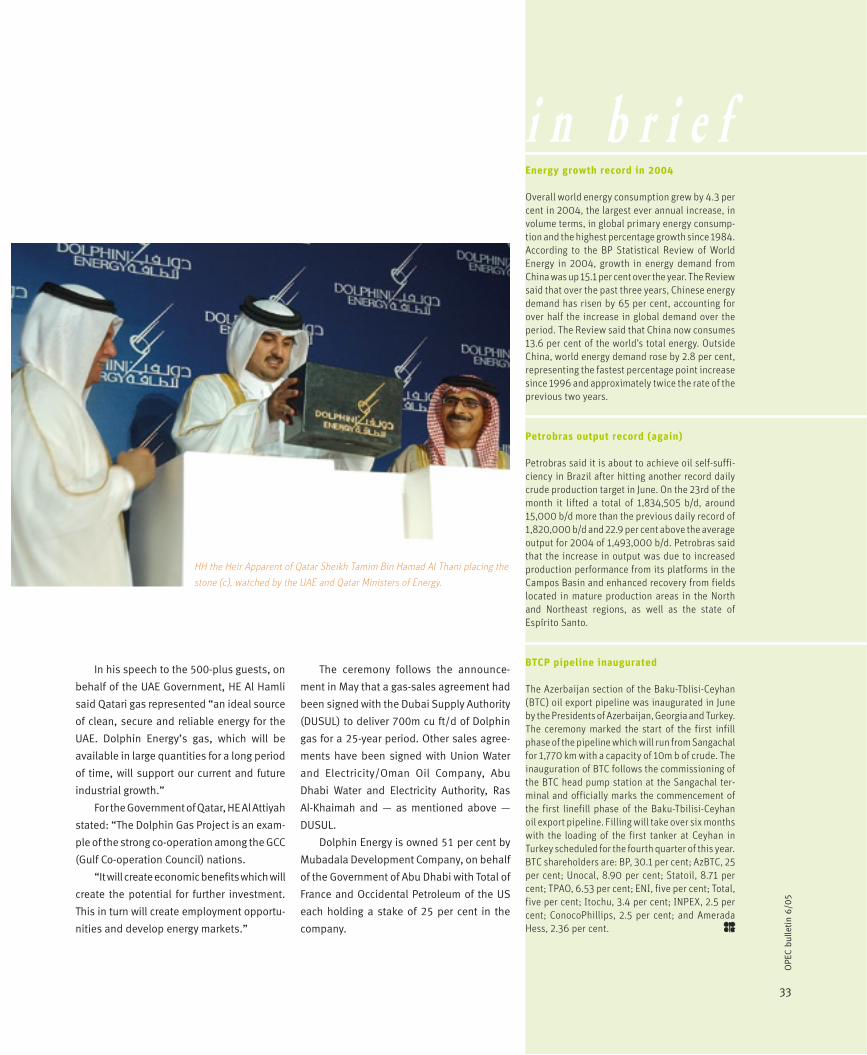
The ceremony was attended by His
Highness, The Heir Apparent of Qatar, Sheikh
Tamim Bin Hamad Al Thani, Qatar’s Second
Deputy Premier and Minister of Energy
and Industry, HE Abdullah bin Hamad Al
Attiyah, and UAE Minister of Energy, HE
Mohamed Bin Dhaen Al Hamli. Other guests
included government officials and industry
representatives.
The gas processing plant is expected to
come on stream in 2006 and is being built by
Japan’s JGC Corporation and supplied with
gas turbines by Rolls Royce of the UK under
contracts awarded in January 2004.
The facility will process raw gas from
Qatar’s North Field — removing by-products
such as condensates and LPGs for interna-
tional sale.
The resulting refined gas will then flow
over 370 km via Dolphin’s dedicated 48-inch
export pipeline to Taweelah in Abu Dhabi,
for distribution to customers throughout the
UAE. From there, a spur link will carry gas onto
Dubai. Initial export capacity of the pipeline
will be two billion cubic feet per day.
Dolphin Energy CEO, Ahmed Al-Sayeg.Qatar’s Second Deputy Prime Minister and Minister of Energy and Industry, HE Abdullah bin
Hamad Al Attiyah.
Pho
tos:
Dol
phin
Ene
rgy
Qatar, UAEinaugurate gas plant
33
OPE
C bu
lleti
n 6/
05
In his speech to the 500-plus guests, on
behalf of the UAE Government, HE Al Hamli
said Qatari gas represented “an ideal source
of clean, secure and reliable energy for the
UAE. Dolphin Energy’s gas, which will be
available in large quantities for a long period
of time, will support our current and future
industrial growth.”
For the Government of Qatar, HE Al Attiyah
stated: “The Dolphin Gas Project is an exam-
ple of the strong co-operation among the GCC
(Gulf Co-operation Council) nations.
“It will create economic benefits which will
create the potential for further investment.
This in turn will create employment opportu-
nities and develop energy markets.”
HH the Heir Apparent of Qatar Sheikh Tamim Bin Hamad Al Thani placing the
stone (c), watched by the UAE and Qatar Ministers of Energy.
The ceremony follows the announce-
ment in May that a gas-sales agreement had
been signed with the Dubai Supply Authority
(DUSUL) to deliver 700m cu ft/d of Dolphin
gas for a 25-year period. Other sales agree-
ments have been signed with Union Water
and Electricity/Oman Oil Company, Abu
Dhabi Water and Electricity Authority, Ras
Al-Khaimah and — as mentioned above —
DUSUL.
Dolphin Energy is owned 51 per cent by
Mubadala Development Company, on behalf
of the Government of Abu Dhabi with Total of
France and Occidental Petroleum of the US
each holding a stake of 25 per cent in the
company.
i n b r i e fEnergy growth record in 2004
Overall world energy consumption grew by 4.3 per cent in 2004, the largest ever annual increase, in volume terms, in global primary energy consump-tion and the highest percentage growth since 1984. According to the BP Statistical Review of World Energy in 2004, growth in energy demand from China was up 15.1 per cent over the year. The Review said that over the past three years, Chinese energy demand has risen by 65 per cent, accounting for over half the increase in global demand over the period. The Review said that China now consumes 13.6 per cent of the world’s total energy. Outside China, world energy demand rose by 2.8 per cent, representing the fastest percentage point increase since 1996 and approximately twice the rate of the previous two years.
Petrobras output record (again)
Petrobras said it is about to achieve oil self-suffi-ciency in Brazil after hitting another record daily crude production target in June. On the 23rd of the month it lifted a total of 1,834,505 b/d, around 15,000 b/d more than the previous daily record of 1,820,000 b/d and 22.9 per cent above the average output for 2004 of 1,493,000 b/d. Petrobras said that the increase in output was due to increased production performance from its platforms in the Campos Basin and enhanced recovery from fields located in mature production areas in the North and Northeast regions, as well as the state of Espírito Santo.
BTCP pipeline inaugurated
The Azerbaijan section of the Baku-Tblisi-Ceyhan (BTC) oil export pipeline was inaugurated in June by the Presidents of Azerbaijan, Georgia and Turkey. The ceremony marked the start of the first infill phase of the pipeline which will run from Sangachal for 1,770 km with a capacity of 10m b of crude. The inauguration of BTC follows the commissioning of the BTC head pump station at the Sangachal ter-minal and officially marks the commencement of the first linefill phase of the Baku-Tbilisi-Ceyhan oil export pipeline. Filling will take over six months with the loading of the first tanker at Ceyhan in Turkey scheduled for the fourth quarter of this year. BTC shareholders are: BP, 30.1 per cent; AzBTC, 25 per cent; Unocal, 8.90 per cent; Statoil, 8.71 per cent; TPAO, 6.53 per cent; ENI, five per cent; Total, five per cent; Itochu, 3.4 per cent; INPEX, 2.5 per cent; ConocoPhillips, 2.5 per cent; and Amerada Hess, 2.36 per cent.
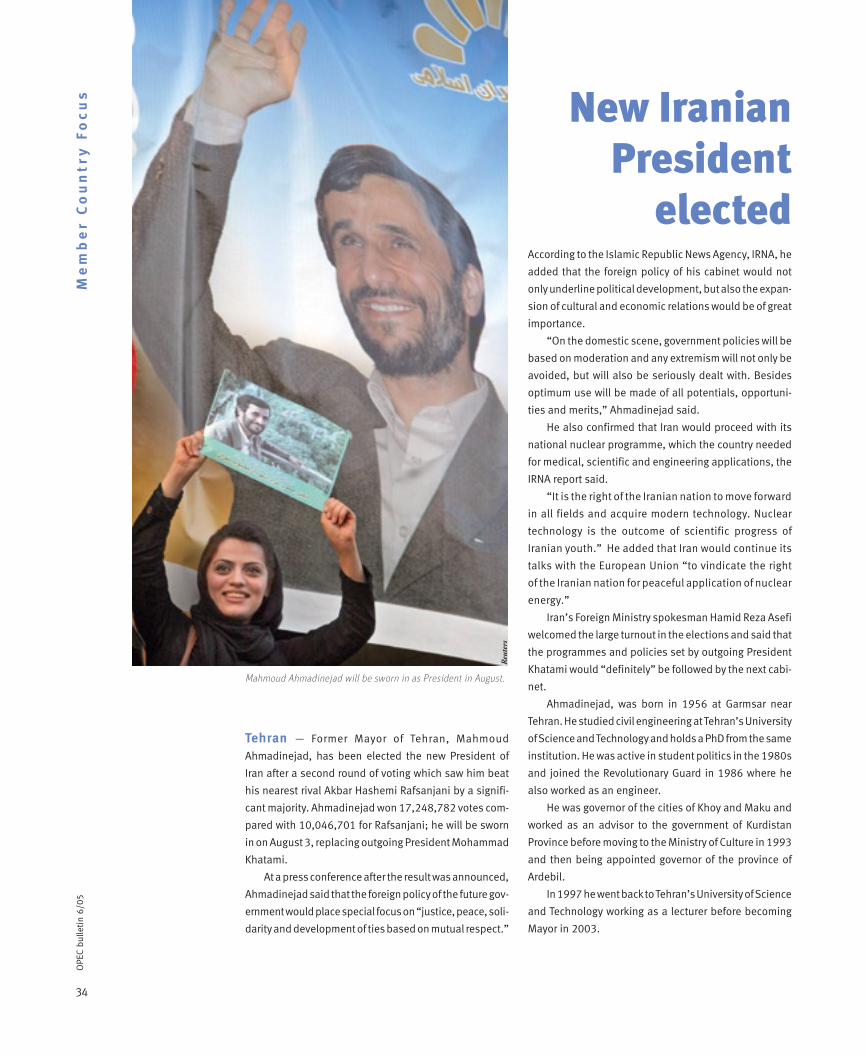
34
OPE
C bu
lleti
n 6/
05M
em
be
r C
ou
ntr
y F
oc
us
Tehran — Former Mayor of Tehran, Mahmoud
Ahmadinejad, has been elected the new President of
Iran after a second round of voting which saw him beat
his nearest rival Akbar Hashemi Rafsanjani by a signifi-
cant majority. Ahmadinejad won 17,248,782 votes com-
pared with 10,046,701 for Rafsanjani; he will be sworn
in on August 3, replacing outgoing President Mohammad
Khatami.
At a press conference after the result was announced,
Ahmadinejad said that the foreign policy of the future gov-
ernment would place special focus on “justice, peace, soli-
darity and development of ties based on mutual respect.”
New Iranian President
electedAccording to the Islamic Republic News Agency, IRNA, he
added that the foreign policy of his cabinet would not
only underline political development, but also the expan-
sion of cultural and economic relations would be of great
importance.
“On the domestic scene, government policies will be
based on moderation and any extremism will not only be
avoided, but will also be seriously dealt with. Besides
optimum use will be made of all potentials, opportuni-
ties and merits,” Ahmadinejad said.
He also confirmed that Iran would proceed with its
national nuclear programme, which the country needed
for medical, scientific and engineering applications, the
IRNA report said.
“It is the right of the Iranian nation to move forward
in all fields and acquire modern technology. Nuclear
technology is the outcome of scientific progress of
Iranian youth.” He added that Iran would continue its
talks with the European Union “to vindicate the right
of the Iranian nation for peaceful application of nuclear
energy.”
Iran’s Foreign Ministry spokesman Hamid Reza Asefi
welcomed the large turnout in the elections and said that
the programmes and policies set by outgoing President
Khatami would “definitely” be followed by the next cabi-
net.
Ahmadinejad, was born in 1956 at Garmsar near
Tehran. He studied civil engineering at Tehran’s University
of Science and Technology and holds a PhD from the same
institution. He was active in student politics in the 1980s
and joined the Revolutionary Guard in 1986 where he
also worked as an engineer.
He was governor of the cities of Khoy and Maku and
worked as an advisor to the government of Kurdistan
Province before moving to the Ministry of Culture in 1993
and then being appointed governor of the province of
Ardebil.
In 1997 he went back to Tehran’s University of Science
and Technology working as a lecturer before becoming
Mayor in 2003.
Mahmoud Ahmadinejad will be sworn in as President in August.
Reu
ters
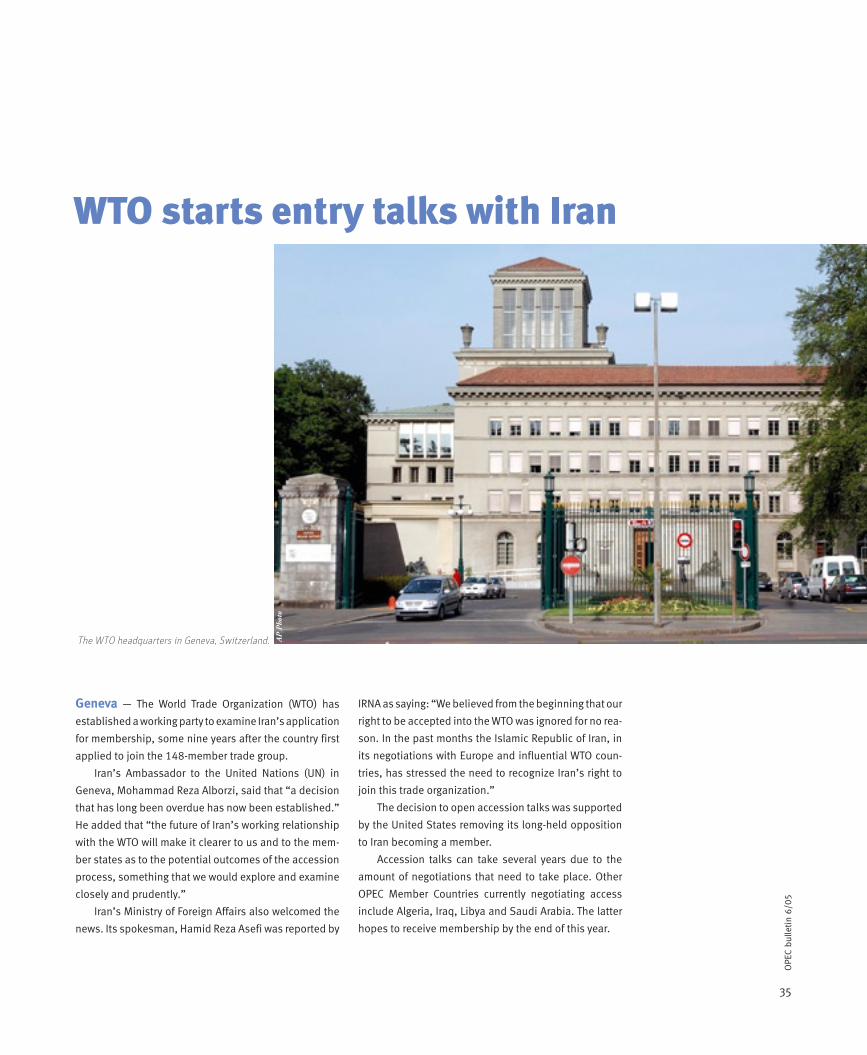
35
OPE
C bu
lleti
n 6/
05
Geneva — The World Trade Organization (WTO) has
established a working party to examine Iran’s application
for membership, some nine years after the country first
applied to join the 148-member trade group.
Iran’s Ambassador to the United Nations (UN) in
Geneva, Mohammad Reza Alborzi, said that “a decision
that has long been overdue has now been established.”
He added that “the future of Iran’s working relationship
with the WTO will make it clearer to us and to the mem-
ber states as to the potential outcomes of the accession
process, something that we would explore and examine
closely and prudently.”
Iran’s Ministry of Foreign Affairs also welcomed the
news. Its spokesman, Hamid Reza Asefi was reported by
WTO starts entry talks with Iran
The WTO headquarters in Geneva, Switzerland.
IRNA as saying: “We believed from the beginning that our
right to be accepted into the WTO was ignored for no rea-
son. In the past months the Islamic Republic of Iran, in
its negotiations with Europe and influential WTO coun-
tries, has stressed the need to recognize Iran’s right to
join this trade organization.”
The decision to open accession talks was supported
by the United States removing its long-held opposition
to Iran becoming a member.
Accession talks can take several years due to the
amount of negotiations that need to take place. Other
OPEC Member Countries currently negotiating access
include Algeria, Iraq, Libya and Saudi Arabia. The latter
hopes to receive membership by the end of this year.
AP
Pho
to
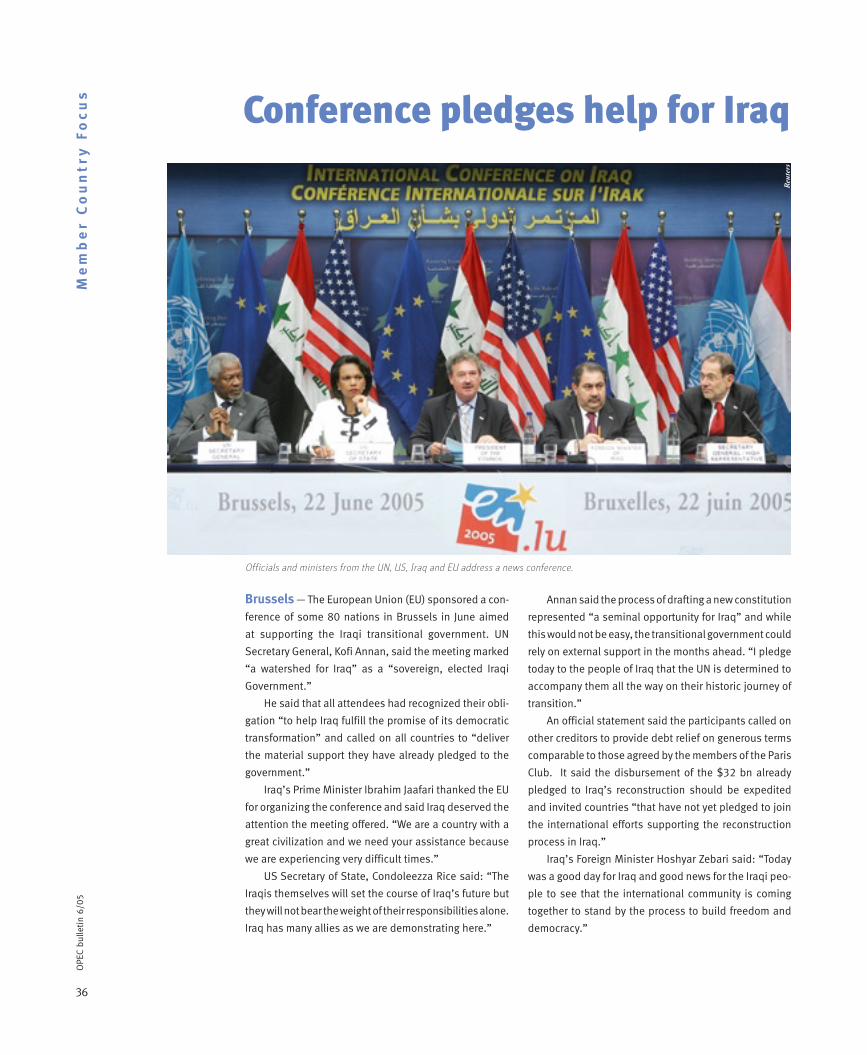
36
OPE
C bu
lleti
n 6/
05M
em
be
r C
ou
ntr
y F
oc
us
Brussels — The European Union (EU) sponsored a con-
ference of some 80 nations in Brussels in June aimed
at supporting the Iraqi transitional government. UN
Secretary General, Kofi Annan, said the meeting marked
“a watershed for Iraq” as a “sovereign, elected Iraqi
Government.”
He said that all attendees had recognized their obli-
gation “to help Iraq fulfill the promise of its democratic
transformation” and called on all countries to “deliver
the material support they have already pledged to the
government.”
Iraq’s Prime Minister Ibrahim Jaafari thanked the EU
for organizing the conference and said Iraq deserved the
attention the meeting offered. “We are a country with a
great civilization and we need your assistance because
we are experiencing very difficult times.”
US Secretary of State, Condoleezza Rice said: “The
Iraqis themselves will set the course of Iraq’s future but
they will not bear the weight of their responsibilities alone.
Iraq has many allies as we are demonstrating here.”
Annan said the process of drafting a new constitution
represented “a seminal opportunity for Iraq” and while
this would not be easy, the transitional government could
rely on external support in the months ahead. “I pledge
today to the people of Iraq that the UN is determined to
accompany them all the way on their historic journey of
transition.”
An official statement said the participants called on
other creditors to provide debt relief on generous terms
comparable to those agreed by the members of the Paris
Club. It said the disbursement of the $32 bn already
pledged to Iraq’s reconstruction should be expedited
and invited countries “that have not yet pledged to join
the international efforts supporting the reconstruction
process in Iraq.”
Iraq’s Foreign Minister Hoshyar Zebari said: “Today
was a good day for Iraq and good news for the Iraqi peo-
ple to see that the international community is coming
together to stand by the process to build freedom and
democracy.”
Conference pledges help for Iraq
Officials and ministers from the UN, US, Iraq and EU address a news conference.
Reu
ters
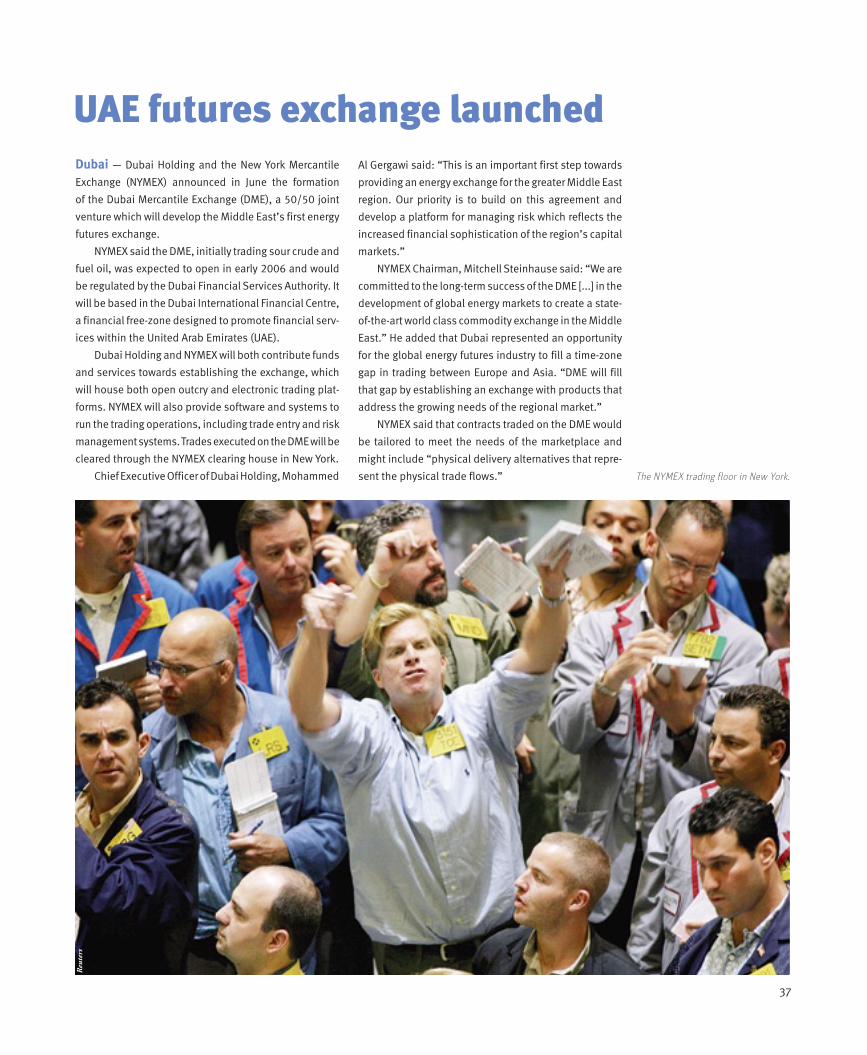
37
UAE futures exchange launchedDubai — Dubai Holding and the New York Mercantile
Exchange (NYMEX) announced in June the formation
of the Dubai Mercantile Exchange (DME), a 50/50 joint
venture which will develop the Middle East’s first energy
futures exchange.
NYMEX said the DME, initially trading sour crude and
fuel oil, was expected to open in early 2006 and would
be regulated by the Dubai Financial Services Authority. It
will be based in the Dubai International Financial Centre,
a financial free-zone designed to promote financial serv-
ices within the United Arab Emirates (UAE).
Dubai Holding and NYMEX will both contribute funds
and services towards establishing the exchange, which
will house both open outcry and electronic trading plat-
forms. NYMEX will also provide software and systems to
run the trading operations, including trade entry and risk
management systems. Trades executed on the DME will be
cleared through the NYMEX clearing house in New York.
Chief Executive Officer of Dubai Holding, Mohammed
Reu
ters
The NYMEX trading floor in New York.
Al Gergawi said: “This is an important first step towards
providing an energy exchange for the greater Middle East
region. Our priority is to build on this agreement and
develop a platform for managing risk which reflects the
increased financial sophistication of the region’s capital
markets.”
NYMEX Chairman, Mitchell Steinhause said: “We are
committed to the long-term success of the DME [...] in the
development of global energy markets to create a state-
of-the-art world class commodity exchange in the Middle
East.” He added that Dubai represented an opportunity
for the global energy futures industry to fill a time-zone
gap in trading between Europe and Asia. “DME will fill
that gap by establishing an exchange with products that
address the growing needs of the regional market.”
NYMEX said that contracts traded on the DME would
be tailored to meet the needs of the marketplace and
might include “physical delivery alternatives that repre-
sent the physical trade flows.”
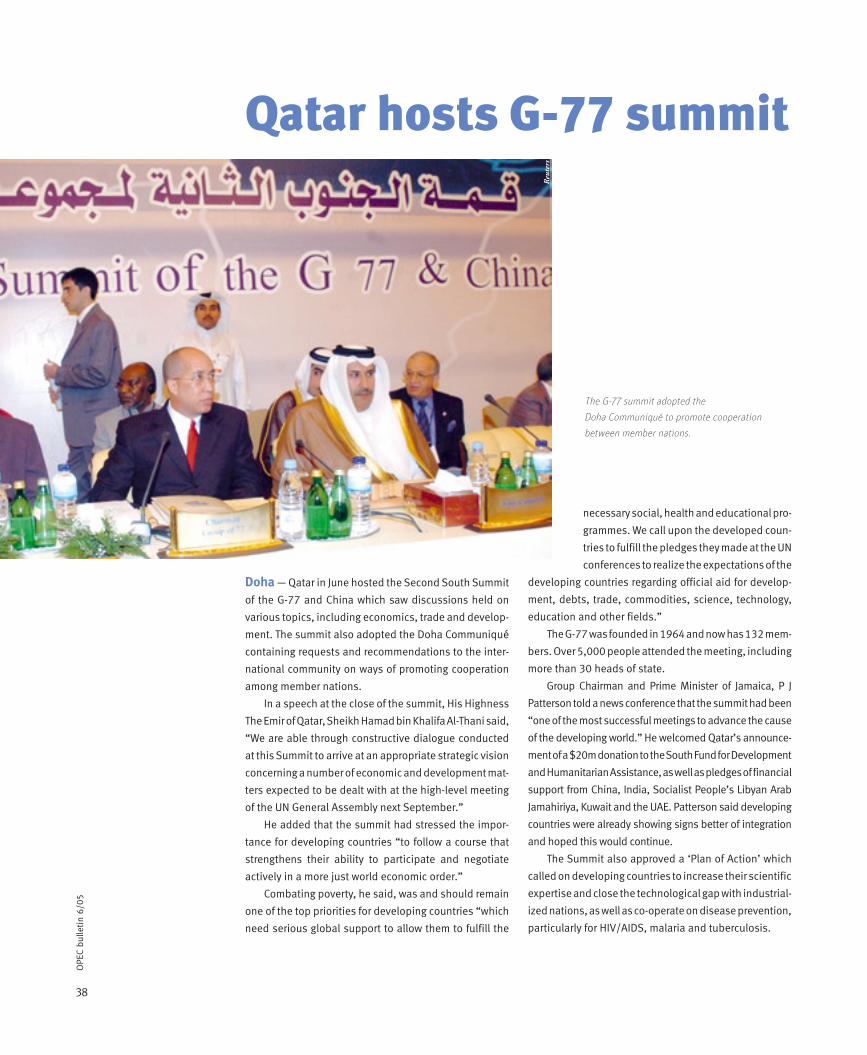
38
OPE
C bu
lleti
n 6/
05
Qatar hosts G-77 summit
Doha — Qatar in June hosted the Second South Summit
of the G-77 and China which saw discussions held on
various topics, including economics, trade and develop-
ment. The summit also adopted the Doha Communiqué
containing requests and recommendations to the inter-
national community on ways of promoting cooperation
among member nations.
In a speech at the close of the summit, His Highness
The Emir of Qatar, Sheikh Hamad bin Khalifa Al-Thani said,
“We are able through constructive dialogue conducted
at this Summit to arrive at an appropriate strategic vision
concerning a number of economic and development mat-
ters expected to be dealt with at the high-level meeting
of the UN General Assembly next September.”
He added that the summit had stressed the impor-
tance for developing countries “to follow a course that
strengthens their ability to participate and negotiate
actively in a more just world economic order.”
Combating poverty, he said, was and should remain
one of the top priorities for developing countries “which
need serious global support to allow them to fulfill the
necessary social, health and educational pro-
grammes. We call upon the developed coun-
tries to fulfill the pledges they made at the UN
conferences to realize the expectations of the
developing countries regarding official aid for develop-
ment, debts, trade, commodities, science, technology,
education and other fields.”
The G-77 was founded in 1964 and now has 132 mem-
bers. Over 5,000 people attended the meeting, including
more than 30 heads of state.
Group Chairman and Prime Minister of Jamaica, P J
Patterson told a news conference that the summit had been
“one of the most successful meetings to advance the cause
of the developing world.” He welcomed Qatar’s announce-
ment of a $20m donation to the South Fund for Development
and Humanitarian Assistance, as well as pledges of financial
support from China, India, Socialist People’s Libyan Arab
Jamahiriya, Kuwait and the UAE. Patterson said developing
countries were already showing signs better of integration
and hoped this would continue.
The Summit also approved a ‘Plan of Action’ which
called on developing countries to increase their scientific
expertise and close the technological gap with industrial-
ized nations, as well as co-operate on disease prevention,
particularly for HIV/AIDS, malaria and tuberculosis.
The G-77 summit adopted the
Doha Communiqué to promote cooperation
between member nations.
Reu
ters
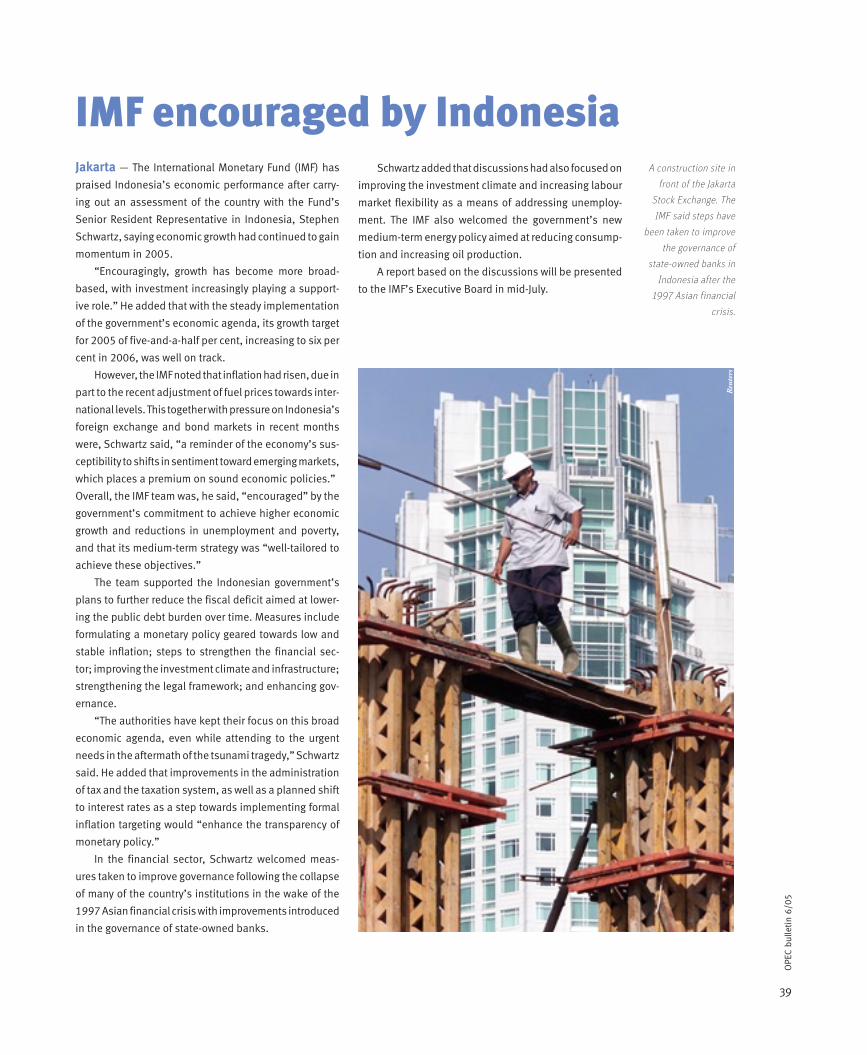
39
OPE
C bu
lleti
n 6/
05
IMF encouraged by IndonesiaJakarta — The International Monetary Fund (IMF) has
praised Indonesia’s economic performance after carry-
ing out an assessment of the country with the Fund’s
Senior Resident Representative in Indonesia, Stephen
Schwartz, saying economic growth had continued to gain
momentum in 2005.
“Encouragingly, growth has become more broad-
based, with investment increasingly playing a support-
ive role.” He added that with the steady implementation
of the government’s economic agenda, its growth target
for 2005 of five-and-a-half per cent, increasing to six per
cent in 2006, was well on track.
However, the IMF noted that inflation had risen, due in
part to the recent adjustment of fuel prices towards inter-
national levels. This together with pressure on Indonesia’s
foreign exchange and bond markets in recent months
were, Schwartz said, “a reminder of the economy’s sus-
ceptibility to shifts in sentiment toward emerging markets,
which places a premium on sound economic policies.”
Overall, the IMF team was, he said, “encouraged” by the
government’s commitment to achieve higher economic
growth and reductions in unemployment and poverty,
and that its medium-term strategy was “well-tailored to
achieve these objectives.”
The team supported the Indonesian government’s
plans to further reduce the fiscal deficit aimed at lower-
ing the public debt burden over time. Measures include
formulating a monetary policy geared towards low and
stable inflation; steps to strengthen the financial sec-
tor; improving the investment climate and infrastructure;
strengthening the legal framework; and enhancing gov-
ernance.
“The authorities have kept their focus on this broad
economic agenda, even while attending to the urgent
needs in the aftermath of the tsunami tragedy,” Schwartz
said. He added that improvements in the administration
of tax and the taxation system, as well as a planned shift
to interest rates as a step towards implementing formal
inflation targeting would “enhance the transparency of
monetary policy.”
In the financial sector, Schwartz welcomed meas-
ures taken to improve governance following the collapse
of many of the country’s institutions in the wake of the
1997 Asian financial crisis with improvements introduced
in the governance of state-owned banks.
Schwartz added that discussions had also focused on
improving the investment climate and increasing labour
market flexibility as a means of addressing unemploy-
ment. The IMF also welcomed the government’s new
medium-term energy policy aimed at reducing consump-
tion and increasing oil production.
A report based on the discussions will be presented
to the IMF’s Executive Board in mid-July.
A construction site in
front of the Jakarta
Stock Exchange. The
IMF said steps have
been taken to improve
the governance of
state-owned banks in
Indonesia after the
1997 Asian financial
crisis.
Reu
ters
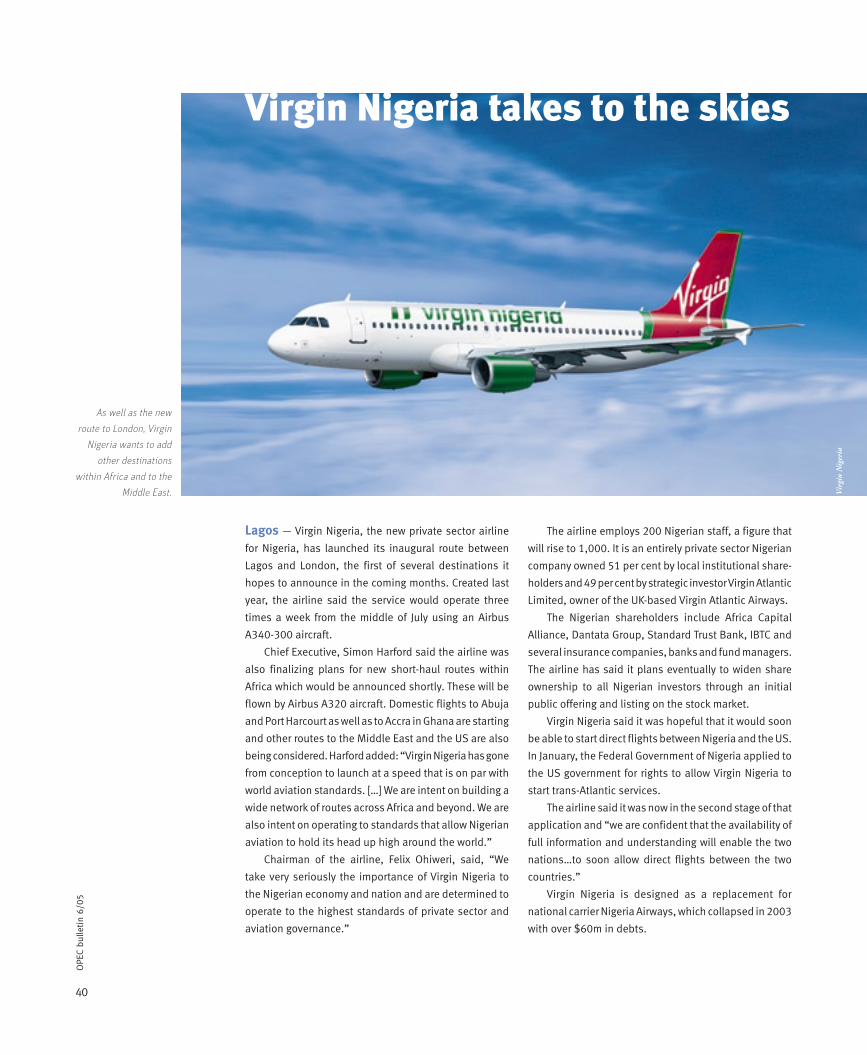
40
OPE
C bu
lleti
n 6/
05
Lagos — Virgin Nigeria, the new private sector airline
for Nigeria, has launched its inaugural route between
Lagos and London, the first of several destinations it
hopes to announce in the coming months. Created last
year, the airline said the service would operate three
times a week from the middle of July using an Airbus
A340-300 aircraft.
Chief Executive, Simon Harford said the airline was
also finalizing plans for new short-haul routes within
Africa which would be announced shortly. These will be
flown by Airbus A320 aircraft. Domestic flights to Abuja
and Port Harcourt as well as to Accra in Ghana are starting
and other routes to the Middle East and the US are also
being considered. Harford added: “Virgin Nigeria has gone
from conception to launch at a speed that is on par with
world aviation standards. […] We are intent on building a
wide network of routes across Africa and beyond. We are
also intent on operating to standards that allow Nigerian
aviation to hold its head up high around the world.”
Chairman of the airline, Felix Ohiweri, said, “We
take very seriously the importance of Virgin Nigeria to
the Nigerian economy and nation and are determined to
operate to the highest standards of private sector and
aviation governance.”
The airline employs 200 Nigerian staff, a figure that
will rise to 1,000. It is an entirely private sector Nigerian
company owned 51 per cent by local institutional share-
holders and 49 per cent by strategic investor Virgin Atlantic
Limited, owner of the UK-based Virgin Atlantic Airways.
The Nigerian shareholders include Africa Capital
Alliance, Dantata Group, Standard Trust Bank, IBTC and
several insurance companies, banks and fund managers.
The airline has said it plans eventually to widen share
ownership to all Nigerian investors through an initial
public offering and listing on the stock market.
Virgin Nigeria said it was hopeful that it would soon
be able to start direct flights between Nigeria and the US.
In January, the Federal Government of Nigeria applied to
the US government for rights to allow Virgin Nigeria to
start trans-Atlantic services.
The airline said it was now in the second stage of that
application and “we are confident that the availability of
full information and understanding will enable the two
nations…to soon allow direct flights between the two
countries.”
Virgin Nigeria is designed as a replacement for
national carrier Nigeria Airways, which collapsed in 2003
with over $60m in debts.
As well as the new
route to London, Virgin
Nigeria wants to add
other destinations
within Africa and to the
Middle East. Vir
gin
Nig
eria
Virgin Nigeria takes to the skies

41
OPE
C bu
lleti
n 6/
05
Abuja — World Bank President Paul Wolfowitz visited
Nigeria in June and said he was hopeful that a deal on
the country’s debt would be forthcoming. Wolfowitz
arrived in Nigeria from the G-8 Finance Ministers meet-
ing in London which saw an agreement to cancel $40bn
worth of debt owed by 18 of the world’s poorest nations
mainly to the World Bank Group, the African Development
Bank and the IMF.
Wolfowitz said he was “delighted” about the agree-
ment, adding that creditor nations “will hopefully come
up with a deal to forgive Nigeria’s debt. I’m very positive
that something will happen.”
Wolfowitz spent two days in Nigeria. He visited a
power sector project and met with the Nigerian govern-
ment’s economic team headed by Finance Minister Ngozi
Okonjo-Iweala as well as legislators and representa-
tives of civil society groups. He also met with Nigerian
President Olusegun Obasanjo.
Oil money funds housing in VenezuelaCaracas — Venezuela’s National Executive, via PDVSA
subsidiary, the Venezuelan Oil Corporation (CVP), has
transferred 1.44 trillion bolivars to BANDES, the Economic
and Social Development Bank, to finance housing projects
across the country.
The Venezuelan government has created the Housing
and Infrastructure Development Fund whereby surplus oil
revenues are to be used to provide funding to build up to
30,000 residences as well as associated infrastructure
including educational, health and water projects.
The funding has been allocated as follows: Fondur,
893,146 million bolivars; National Housing Bank
(BANAVI), 193,504m bolivars; Inavi, 128,248m bolivars;
Corpovargas, 43,313m bolivars; Fundabarrios, 36,671m
bolivars’ Savir, 28,902m bolivars; and Corpozulia,
3,095m bolivars.
Using oil revenues to fund housing development and
social projects is a provision contained in Venezuela’s new
Organic Law on Hydrocarbons “aimed at enhancing the
economic and social development of all Venezuelans.”
World Bank head in Nigeria
A mural depicts Venezuelans working in their oil fields at the entrance of a state-funded cooperative in
Caracas, Venezuela.
World Bank Chief Paul Wolfowitz meets with locals at the venue of a World
Bank-assisted project in Bauchi, Nigeria.
AP
Pho
to
AP
Pho
to
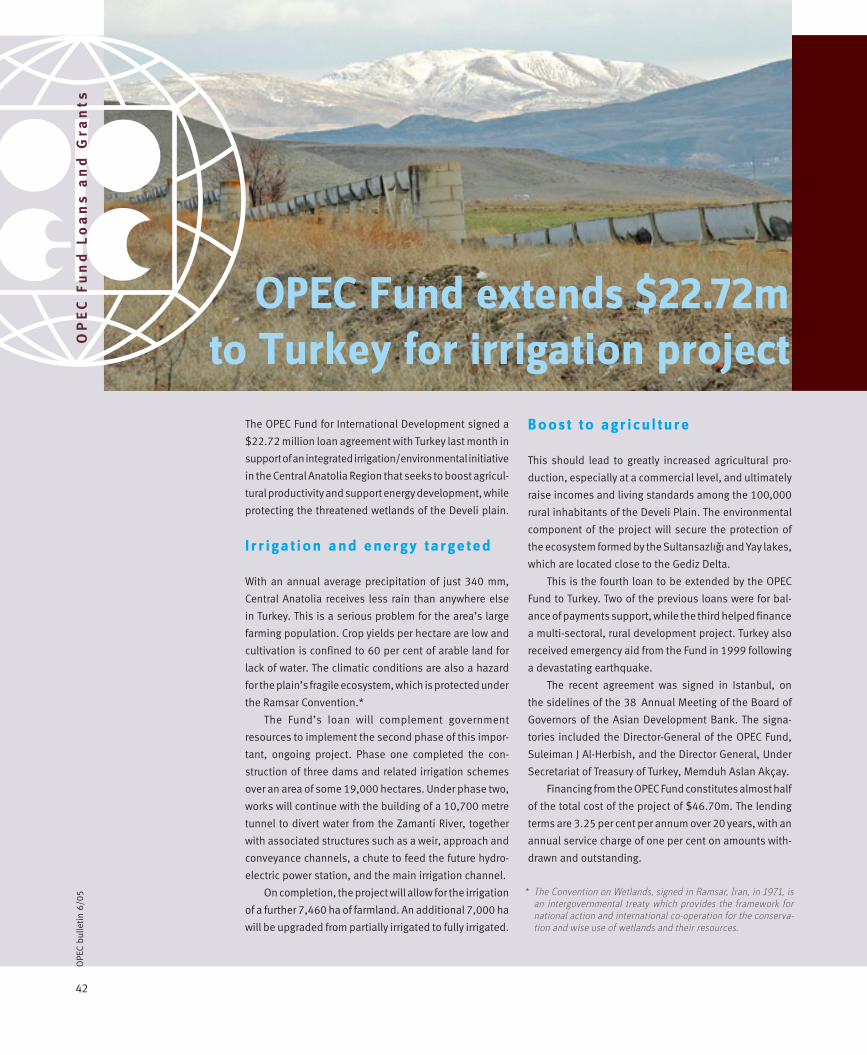
42
OPE
C bu
lleti
n 6/
05
The OPEC Fund for International Development signed a
$22.72 million loan agreement with Turkey last month in
support of an integrated irrigation/environmental initiative
in the Central Anatolia Region that seeks to boost agricul-
tural productivity and support energy development, while
protecting the threatened wetlands of the Develi plain.
I r r iga t ion and energy targeted
With an annual average precipitation of just 340 mm,
Central Anatolia receives less rain than anywhere else
in Turkey. This is a serious problem for the area’s large
farming population. Crop yields per hectare are low and
cultivation is confined to 60 per cent of arable land for
lack of water. The climatic conditions are also a hazard
for the plain’s fragile ecosystem, which is protected under
the Ramsar Convention.*
The Fund’s loan will complement government
resources to implement the second phase of this impor-
tant, ongoing project. Phase one completed the con-
struction of three dams and related irrigation schemes
over an area of some 19,000 hectares. Under phase two,
works will continue with the building of a 10,700 metre
tunnel to divert water from the Zamanti River, together
with associated structures such as a weir, approach and
conveyance channels, a chute to feed the future hydro-
electric power station, and the main irrigation channel.
On completion, the project will allow for the irrigation
of a further 7,460 ha of farmland. An additional 7,000 ha
will be upgraded from partially irrigated to fully irrigated.
Boost to agr icu l ture
This should lead to greatly increased agricultural pro-
duction, especially at a commercial level, and ultimately
raise incomes and living standards among the 100,000
rural inhabitants of the Develi Plain. The environmental
component of the project will secure the protection of
the ecosystem formed by the Sultansazlıgı and Yay lakes,
which are located close to the Gediz Delta.
This is the fourth loan to be extended by the OPEC
Fund to Turkey. Two of the previous loans were for bal-
ance of payments support, while the third helped finance
a multi-sectoral, rural development project. Turkey also
received emergency aid from the Fund in 1999 following
a devastating earthquake.
The recent agreement was signed in Istanbul, on
the sidelines of the 38 Annual Meeting of the Board of
Governors of the Asian Development Bank. The signa-
tories included the Director-General of the OPEC Fund,
Suleiman J Al-Herbish, and the Director General, Under
Secretariat of Treasury of Turkey, Memduh Aslan Akçay.
Financing from the OPEC Fund constitutes almost half
of the total cost of the project of $46.70m. The lending
terms are 3.25 per cent per annum over 20 years, with an
annual service charge of one per cent on amounts with-
drawn and outstanding.
* The Convention on Wetlands, signed in Ramsar, Iran, in 1971, is an intergovernmental treaty which provides the framework for national action and international co-operation for the conserva-tion and wise use of wetlands and their resources.
OPEC Fund extends $22.72mto Turkey for irrigation projectO
PE
C F
un
d L
oa
ns
an
d G
ran
ts

43
OPE
C bu
lleti
n 6/
05
The Republic of the Philippines in
June bestowed its Congressional
Medal of Achievement on Director-
General of the OPEC Fund for
International Development, Suleiman
Jasir Al-Herbish, describing him as
an accomplished manager and admin-
istrator.
The citation for the Congressional
Medal to Al-Herbish said it was
being conferred on him “in recogni-
tion of his distinguished administra-
tion of the 12-Member OPEC Fund”
and the key role, in the institution, of
Saudi Arabia.
The citation spoke of the long service
of Al-Herbish in the global oil indus-
try, including Governorship for Saudi
Arabia at OPEC and Directorship of
several key Saudi public and private
enterprises.
Furthermore, Al-Herbish was being
honoured for “his personal interest in
the welfare of the oil-importing coun-
tries of the developing world, whose
plight … the OPEC Fund seeks to
alleviate.”
The award was presented, on behalf of
the Philippine nation by the Speaker of
the Congress of the Philippine House
of Representatives the Honorable Jose
de Venecia, Jr. Accompanied by sev-
eral Members of Congress and ranking
national officials, including the Philippine Ambassador to Austria, HE Victor
G Garcia III, de Venecia told Al-Herbish and assembled OPEC Fund staff
that the Philippines was appreciative of the Fund’s contributions to social and
economic development in the country.
He disclosed that Saudi Arabia, Al-Herbish’s home country and Fund Member
State had, over many years, provided major support to the Philippines, employ-
ing close to one million Philippine nationals in, especially, the health sector.
Al-Herbish remarked that relations between the Philippines and the OPEC
Fund were excellent. He thanked the Speaker, the Congress and House
of Representatives, as well as the People and Federal Government of the
Philippines for the award. He added that the OPEC Fund intended to continue
with its projects and programmes of co-operation with the Philippines.
Co-operation with the Philippines began in August 1977 when the Fund
extended a first, road project loan to the country; it is involved in several eco-
nomic sectors, including energy, transportation, education, agriculture and
agro-industry.
The Award is the Congress highest medal of honour. Recent recipients have
included South Africa’s Nelson Mandela; President of Pakistan, HE Pervez
Musharraf; President of China, HE Hu Jintao; and Minister of Petroleum
and Natural Resources of Saudi Arabia, HE Ali I Naimi.
Award for Director-General
OP
EC
44
OPE
C bu
lleti
n 6/
05
Crude oil price movements
M a y
OPEC Reference Basket1
The OPEC Reference Basket saw a strong
start in April following a speculative investment
bank report forecasting the possibility that oil
prices might double amid fear of tightness in
summer fuels. Although the sustained closure
of outbound arbitrage barrels continued to pres-
sure regional markets, healthy refining margins
and perception of surging demand supported
prices. The Basket rallied in the first week in
April by nearly six per cent for a rise of almost
$3 to close at the highest weekly average on
record at $52.07/barrel. However, the rise was
short-lived and the market turned bearish.
The lack of arbitrage opportunities continued
to pressure regional markets at a time when
US crude oil inventories continued to build to
comfortable levels on high OPEC production.
Moreover, a downward revision by the IEA of
its world demand forecast kept bearishness
intact sending oil futures downward, while the
flow of western crude eastward kept the Asian
market bearish. Hence, the Basket plunged six
per cent or $3.21 in the second week to close
at $48.86/b (see Table A).
The third weekly period in the month saw
mixed movement. It began with a strengthen-
ing of the US dollar, which inspired fund sell-
offs in the futures market. This helped crude oil
prices to ease while OPEC supplies continued
to rise. Hence, the Basket slipped to $46.52/b,
the lowest level since March 1. However, new
developments in the Yukos saga tipped fears
of a possible supply shortfall amid a series of
refinery setbacks in the US in the run up to the
US driving season, which helped to strengthen
market bullishness. This was enhanced by the
surprise draw on US crude oil stocks for the
first time in ten weeks. Accordingly, the Basket
jumped over five per cent or $2.50/b in the last
two days of the third weekly period; however,
the weekly average closed down 1.8 per cent
at $48/b.
The final week of the month was marked
by concern over bottlenecks in downstream
capacity amid continued refinery outages in the
USA. The Basket rallied above the $50/b level
for the first time in two weeks, surging nearly
three per cent. However, prices reversed the
previous four-day rise, sustaining the down-
ward streak. Plentiful OPEC supplies amid the
closure of the arbitrage opportunities pressured
regional markets and sustained bearishness
in the marketplace. Yet, in the final week, the
Basket saw a hefty rise of well over three per
cent or $1.60 to close at $49.60/b. On the final
day of the month, the Basket eased further on
weak economic data in the USA amid an amply
supplied market. The Basket closed at $47.90,
down $2.3 or 4.6 per cent on the month.
In April, the Basket saw mixed movement.
Perception of tightness in the downstream
capacity and the release of a speculative invest-
ment bank report claiming that the market had
entered a ‘super-spike’ period that could boost
prices to $105/b pushed up oil prices to a record
weekly high early in the month. However, prices
tipped downward later in the month on ris-
ing OPEC output and persistent crude stock-
builds in the USA, although continued concern
over refinery outages in the USA kept prices
in check. As a result of these movements, the
monthly average closed over 1 per cent higher at
$49.63/b, marking a slowdown from the rates
seen in the last four months.
The calm sentiment continued into May as
strong exports from OPEC Members and rising
USA crude oil inventories at the highest level in
nearly six years suggested that the downward
movement could remain. These trends helped
ease the Basket’s weekly average to $47.55/b,
although concern over summer fuels kept some
tension in the market.
US market The US cash crude oil market eased earlier
in the month on swelling crude oil supplies,
while a widening of the sweet-sour spread sup-
1. An average of Saharan Blend, Minas, Bonny Light, Arabian Light, Dubai, Tia Juana Light and Isthmus.Note to reader: The new OPEC Reference Basket will be introduced as of the next issue of the report.
This section includes the OPEC Monthly Oil Market Reports (MOMR)
for both May and June published by the Research Division of the
Secretariat, containing up-to-date analysis, additional information,
graphs and tables.
The publication may be downloaded in PDF format from our Web site
(www.opec.org), provided OPEC is credited as the source for any usage.
Ma
rke
t R
ev
iew
May
/Ju
ne
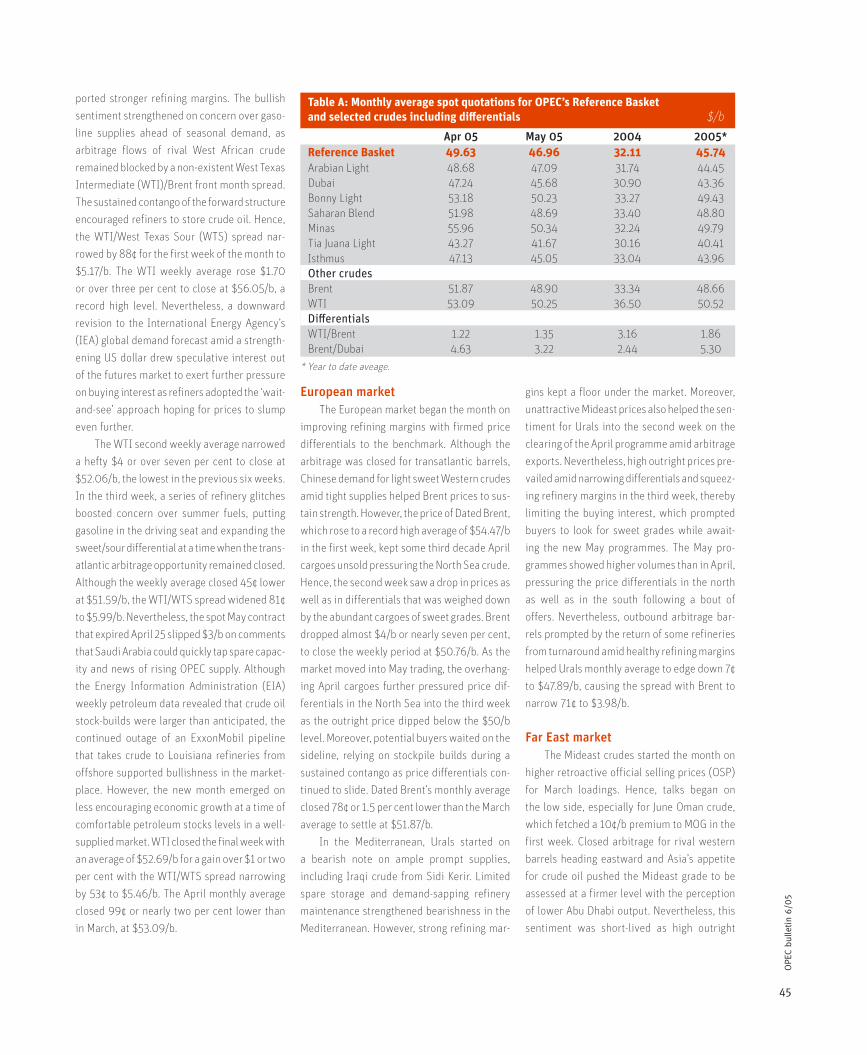
45
OPE
C bu
lleti
n 6/
05
ported stronger refining margins. The bullish
sentiment strengthened on concern over gaso-
line supplies ahead of seasonal demand, as
arbitrage flows of rival West African crude
remained blocked by a non-existent West Texas
Intermediate (WTI)/Brent front month spread.
The sustained contango of the forward structure
encouraged refiners to store crude oil. Hence,
the WTI/West Texas Sour (WTS) spread nar-
rowed by 88¢ for the first week of the month to
$5.17/b. The WTI weekly average rose $1.70
or over three per cent to close at $56.05/b, a
record high level. Nevertheless, a downward
revision to the International Energy Agency’s
(IEA) global demand forecast amid a strength-
ening US dollar drew speculative interest out
of the futures market to exert further pressure
on buying interest as refiners adopted the ‘wait-
and-see’ approach hoping for prices to slump
even further.
The WTI second weekly average narrowed
a hefty $4 or over seven per cent to close at
$52.06/b, the lowest in the previous six weeks.
In the third week, a series of refinery glitches
boosted concern over summer fuels, putting
gasoline in the driving seat and expanding the
sweet/sour differential at a time when the trans-
atlantic arbitrage opportunity remained closed.
Although the weekly average closed 45¢ lower
at $51.59/b, the WTI/WTS spread widened 81¢
to $5.99/b. Nevertheless, the spot May contract
that expired April 25 slipped $3/b on comments
that Saudi Arabia could quickly tap spare capac-
ity and news of rising OPEC supply. Although
the Energy Information Administration (EIA)
weekly petroleum data revealed that crude oil
stock-builds were larger than anticipated, the
continued outage of an ExxonMobil pipeline
that takes crude to Louisiana refineries from
offshore supported bullishness in the market-
place. However, the new month emerged on
less encouraging economic growth at a time of
comfortable petroleum stocks levels in a well-
supplied market. WTI closed the final week with
an average of $52.69/b for a gain over $1 or two
per cent with the WTI/WTS spread narrowing
by 53¢ to $5.46/b. The April monthly average
closed 99¢ or nearly two per cent lower than
in March, at $53.09/b.
European market The European market began the month on
improving refining margins with firmed price
differentials to the benchmark. Although the
arbitrage was closed for transatlantic barrels,
Chinese demand for light sweet Western crudes
amid tight supplies helped Brent prices to sus-
tain strength. However, the price of Dated Brent,
which rose to a record high average of $54.47/b
in the first week, kept some third decade April
cargoes unsold pressuring the North Sea crude.
Hence, the second week saw a drop in prices as
well as in differentials that was weighed down
by the abundant cargoes of sweet grades. Brent
dropped almost $4/b or nearly seven per cent,
to close the weekly period at $50.76/b. As the
market moved into May trading, the overhang-
ing April cargoes further pressured price dif-
ferentials in the North Sea into the third week
as the outright price dipped below the $50/b
level. Moreover, potential buyers waited on the
sideline, relying on stockpile builds during a
sustained contango as price differentials con-
tinued to slide. Dated Brent’s monthly average
closed 78¢ or 1.5 per cent lower than the March
average to settle at $51.87/b.
In the Mediterranean, Urals started on
a bearish note on ample prompt supplies,
including Iraqi crude from Sidi Kerir. Limited
spare storage and demand-sapping refinery
maintenance strengthened bearishness in the
Mediterranean. However, strong refining mar-
gins kept a floor under the market. Moreover,
unattractive Mideast prices also helped the sen-
timent for Urals into the second week on the
clearing of the April programme amid arbitrage
exports. Nevertheless, high outright prices pre-
vailed amid narrowing differentials and squeez-
ing refinery margins in the third week, thereby
limiting the buying interest, which prompted
buyers to look for sweet grades while await-
ing the new May programmes. The May pro-
grammes showed higher volumes than in April,
pressuring the price differentials in the north
as well as in the south following a bout of
offers. Nevertheless, outbound arbitrage bar-
rels prompted by the return of some refineries
from turnaround amid healthy refining margins
helped Urals monthly average to edge down 7¢
to $47.89/b, causing the spread with Brent to
narrow 71¢ to $3.98/b.
Far East market The Mideast crudes started the month on
higher retroactive official selling prices (OSP)
for March loadings. Hence, talks began on
the low side, especially for June Oman crude,
which fetched a 10¢/b premium to MOG in the
first week. Closed arbitrage for rival western
barrels heading eastward and Asia’s appetite
for crude oil pushed the Mideast grade to be
assessed at a firmer level with the perception
of lower Abu Dhabi output. Nevertheless, this
sentiment was short-lived as high outright
Table A: Monthly average spot quotations for OPEC’s Reference Basketand selected crudes including differentials $/b
Apr 05 May 05 2004 2005*Reference Basket 49.63 46.96 32.11 45.74Arabian Light 48.68 47.09 31.74 44.45Dubai 47.24 45.68 30.90 43.36Bonny Light 53.18 50.23 33.27 49.43Saharan Blend 51.98 48.69 33.40 48.80Minas 55.96 50.34 32.24 49.79Tia Juana Light 43.27 41.67 30.16 40.41Isthmus 47.13 45.05 33.04 43.96Other crudesBrent 51.87 48.90 33.34 48.66WTI 53.09 50.25 36.50 50.52DifferentialsWTI/Brent 1.22 1.35 3.16 1.86Brent/Dubai 4.63 3.22 2.44 5.30
* Year to date aveage.
46
OPE
C bu
lleti
n 6/
05M
ark
et
Re
vie
w prices inspired Chinese procurement of West
African crudes at a time when hope was grow-
ing that Russian Urals could find its way to Asia
while some North African crude was steaming
eastward. June Oman flipped to sell at a 5¢/b
discount, with Abu Dhabi Murban assessed at
an 80¢–90¢/b premium to ADNOC’s OSP. The
bearishness deepened on ample OPEC sup-
plies that pressured market sentiment, caus-
ing Oman June-loading barrels to trade at the
steepest discount in eight months of 18¢/b to
MOG. Nevertheless, as the arbitrage became
uneconomical for Russia’s Urals heading to
Asia, June Oman saw some strength traded at
a lower discount of 15¢/b. June Murban was
also under pressure, trading at a premium of
less than 40¢/b to the OSP. The Mideast crude
weakened due to the amply supplied regional
market at a time when Taiwan’s CPC did not
purchase Mideast crude in its latest buy-ten-
der (see Table B).
Asian market The Asian-Pacific regional crude market
saw healthy demand for Indonesia’s grades
with Japan snapping them up for direct burning
at thermal power plants. Minas was assessed
at a $1.80/b premium to the Indonesian Crude
Pricing (ICP). However, high outright prices
encouraged Asian refiners to use the more
lucrative East African grade Sudanese Nile
Blend. Malaysia sold a May Kidurong cargo at
a premium of 70¢/b to Tapis Asian Petroleum
Price Index (APPI), which was 35¢ lower than
the deal done in the third decade of March.
Nevertheless, although Japan’s TEPCO demand
was declining, that of other utilities was seen
remaining steady. This helped May Minas to
trade at a stronger premium of $2.30/b. Later
in the month, the focus was on Taiwan’s CPC
buy-tender that left the regional market amply
supplied after it secured an allotment of West
African crude.
J u n e
OPEC Reference Basket The calm sentiment from the previous
month continued into May as persistent OPEC
supplies helped US crude oil inventories to
reach the highest level in nearly six years. As
a result, prices averaged $47.59/b in the first
week of the month, down four per cent or $2/b
from the week before. This was due in part to
the eastward flow of western crude inspired by
the deep contango in western markets and high
outright prices in Asia. However, concern over
summer fuels revived the bulls, somewhat bal-
ancing the earlier bears amid seasonal demand
for light sweet grades, which boosted prices in
Europe. Bearish trends continued in the sec-
ond week on comments by the IEA that higher
fuel costs and a weakening economic picture
were denting global demand. The rise in crude
stocks in the USA, the outlook for weaker global
demand growth and an OPEC output rise on the
horizon all helped to support calmness in the
marketplace. Accordingly, the OPEC Reference
Basket slipped 21¢ to $47.38/b. Continued
builds in US crude oil inventories to almost
six-year highs kept the market bears alive at a
time when arbitrage opportunities remained
closed suggesting continued high OPEC supply.
The Basket fell further in the third week, losing
$2.11 or 4.5 per cent to close at $45.25/b, sup-
ported by a stronger US dollar (see Table A).
Market bullishness revived following a
strike at Total’s five European refineries, which
raised fears of a possible shortfall in refined
products. This was exacerbated by the approach
of the US driving season at a time when US
crude oil stocks experienced a surprise draw
for the first time in five weeks. Further upward
pressure came from a general perception that
supplies in the USA would fall as refineries
boosted operating rates to produce gasoline
for the peak demand summer driving season.
The OPEC Reference Basket surged in the fourth
week by nearly two per cent for a rise of 78¢ to
close at $46.02/b. The Basket closed the month
on bullish sentiment peaking to $47.62/b.
On a monthly basis, the OPEC Basket ended
lower for the first time in six months, dropping
$2.67 or 5.4 per cent to close the month at
$46.96/b. The first days of June saw renewed
upward pressure as a hefty draw on US crude
oil inventories and the appearance of Tropical
Storm Arlene in the US Gulf Coast revived con-
cerns of possible supply disruptions. This helped
the Basket to rally in June, breaking above the
$50/b level for the first time since April.
US market Cash crude differentials in the US market
strengthened on lack of competing West African
barrels and the continued outage of a pipeline
that takes crude to Louisiana refineries from
offshore. Nevertheless, the expectation for less
encouraging economic growth figures from the
USA at a time of comfortable stocks levels in
a well-supplied market helped to balance this
bullish momentum. Hence, the WTI weekly aver-
age slipped five per cent or $2.63/b to settle at
$50.06/b on May 5. The contract also fell below
Dated Brent for the first few days in May. The
WTI/WTS spread narrowed $1.40 to $4.05/b.
Continued weak arbitrage for transatlantic bar-
rels overwhelmed news of the twelfth build in
thirteen weeks in the US crude oil inventories.
The cash crude differentials weakened on softer
refining margins in the second week. However,
the EIA warned that US crude oil prices are
expected to stay above $50/b through 2006
and gasoline costs will remain high due to tight
refining conditions and a lack of spare crude
oil production capacity. WTI gained 76¢ or 1.5
per cent to average $50.82/b for the second
week, with the WTI/WTS spread narrowing
to $3.14/b. However, the sentiment changed
in the third week on a further rise in the US
crude oil stocks to a six-year high amid ample
OPEC barrels.
Moreover, sufficient supply of South
American crude prompted sellers to get rid of
barrels while there was still enough storage
capacity. WTI saw a hefty drop of $2.81 or 5.5
per cent to close the third week at $48.01/b,
and even fell below Dated Brent for two days.
The WTI/WTS spread narrowed to $2.86/b on
a continued lack of West African crude. The
revived concern over summer fuel supply once
again put pressure on the marketplace and
WTI’s weekly average surged $1.49 or over
three per cent to close at $49.50 with the WTI/
WTS spread narrowing further to $2.73/b. Yet,
the monthly average for WTI closed down 5.4
per cent or $2.89 in May to settle at $50.20/b.
47
OPE
C bu
lleti
n 6/
05
European market North Sea crudes began May on a bearish
note as unsold prompt cargoes weighed on a
market awaiting the release of the new load
programmes. Accordingly, the contango for
benchmark crudes widened further as dealers
struggled to shift a heavy overhang of undis-
posed May barrels. The weekly average for
Dated Brent slipped $2.12 or over four per cent
to settle at 49.81/b The benchmark remained
under pressure on the perception that there
was an abundance of crude and the threat of
barrels coming out of storage, stalling the rally
on the front end of the curve. Brent dipped 49¢
in the second week to average $49.32/b. The
slide in prices prompted buying interest that
helped to firm differentials as the glut in May
cargoes cleared amid thinning market avail-
ability for June barrels. Nevertheless, the mar-
ket only saw a short-lived rise as strike-induced
refinery outages in France late in the second
decade of May alerted the market to additional
available cargoes. Brent slipped a further five
per cent or $2.31/b to average $47.01/b for
the week. Differentials continued to slide, yet
concern over tight refined products due to the
strike at Total’s five refineries revived market
bullishness as second half June stems clearing
with some sweet barrels heading east. Hence,
Brent surged $1.11 or 2.4 per cent to close the
fourth week at $48.12/b. Nevertheless, the last
few days in the month were quiet on holidays in
most of Europe amid firm sentiment yet avail-
able supplies dwindled, limiting activities.
Dated closed 78¢ or 1.5 per cent lower than the
March average to settle at $51.87/b.
The Mediterranean crude began the month
with plentiful availability which prompted some
refiners to hold off buying while others switched
to sweeter grades. Urals dropped $2.21 or 4.5 per
cent to settle at a weekly average of $46.44/b.
However, this bearish sentiment was
buoyed by a sharp hike in Mideast price dif-
ferentials to Europe, as well as strong refining
margins amid aggressive bidding. Urals second
weekly average inched 39¢ higher to close at
$46.83/b as buyers continued to mop up the
May programme amid prompt demand from
Europe’s largest refiner. However, the bulls
started to fade as Total withdrew interest due to
an impending strike. In the third week, although
sentiment seemingly revived on tight May avails
and the possibility of arbitrage to Asia, this was
short-lived as falling products prices started
to bite into refining margins. Hence, sellers
reduced the differentials to move cargoes out of
the region with Urals plunging $2.5 or over five
per cent to settle at $44.33/b. Moreover, with
a widening strike closing three more of Total’s
refineries, buyers stayed on the sideline await-
ing a further price decline. However, the rising
healthy refining margins encouraged buying
interest in the fourth week amid clearing May
barrels with Urals fetching a 81¢ rise to aver-
age $45.14/b. Moreover, news that June Urals
supply from the Black Sea port of Novorossiysk
would fall by ten per cent from the May level
inspired prices to rise significantly in the final
days of the month to peak at $50.18/b. Still, the
monthly average declined, dropping $1.65 from
the previous month to stand at $46.24/b.
Far East market Mideast crude began the month with June
Oman trading at a 15¢/b discount to MOG with
the July new month trade notionally at a 4¢–8¢/b
premium. However, the market was seen pres-
sured by a discount late in the previous month
amid the reselling of barrels from Chinese trad-
ers on procurement of attractive West African
crude. Moreover, the higher-than-expected OSP
pushed the Mideast sour benchmark into nega-
tive territory, offered at 1¢–4¢/b discount for
Oman July-loading. Although Abu Dhabi July
Murban was assessed at 20¢–30¢/b premium to
OSP, full contract volumes amid high OSP pres-
sured Abu Dhabi crude to trade at lower levels.
The narrowing Brent/Dubai EFS spread in the
second half of the month prompted Asian buy-
ers to switch to cheaper West African grades,
while Mediterranean crudes headed eastward,
pressuring the Mideast grades. This was boosted
by the weakening differential of Urals in the
Mediterranean. July Oman traded at a steeper
discount of 20¢–30¢/b to MOG with Abu Dhabi
Murban at a discount of 25¢/b to ADNOC’s OSP
in the fourth week. However, in the final days
of the month, the market flipped into the posi-
tive territory amid diminishing avails on nar-
rowing Brent/Dubai EFS. July Oman was heard
to trade at a 5¢–10¢/b premium to MOG with
Abu Dhabi Murban heard sold at a $1/b discount
to the OSP on high outright prices.
Asian market The Asian market began the month on a
quiet note amid the Golden-Week holiday in
Japan. Taiwan CPC was awarded hefty lots of
West African crude in its buy-tender as loom-
ing gasoline demand bolstered the light sweet
market at the expense of Asia-Pacific rivals.
This exerted downward pressure on the regional
crude market amid narrowing EFS spreads.
Malaysia’s June Tapis traded at a 70¢ premium
to the APPI compared to May loading which sold
at +$1/b. Later in the second decade, regional
crude started to clear at a slower pace amid buy-
ers adopting a wait-and-see approach. However,
high outright prices and continued narrowing of
the EFS spread only sustained the pressure on
the regional crude in May. July Tapis was heard
sold at a 10¢ premium to the APPI compared
to a 60¢/b premium for the last June-loading
deal.
Product markets and refinery operations
M a y
Refinery outages in the Atlantic Basin and
robust demand in Asia have strengthened
sentiment in the product markets in April,
and refinery margins surged across the globe.
More recently, a combination of high US gaso-
line stocks, resumption of normal operations
by US refiners after spring maintenance and
lower product demand from south-east Asian
countries have changed market momentum
and put pressure on product prices. With the
switch in US refinery operations to a gasoline-
producing mode and the need to build gaso-
line stocks, clean product and possibly crude
oil prices may face further pressure, but the
heavy maintenance schedule in Europe during
May could remove this risk. Additionally, due
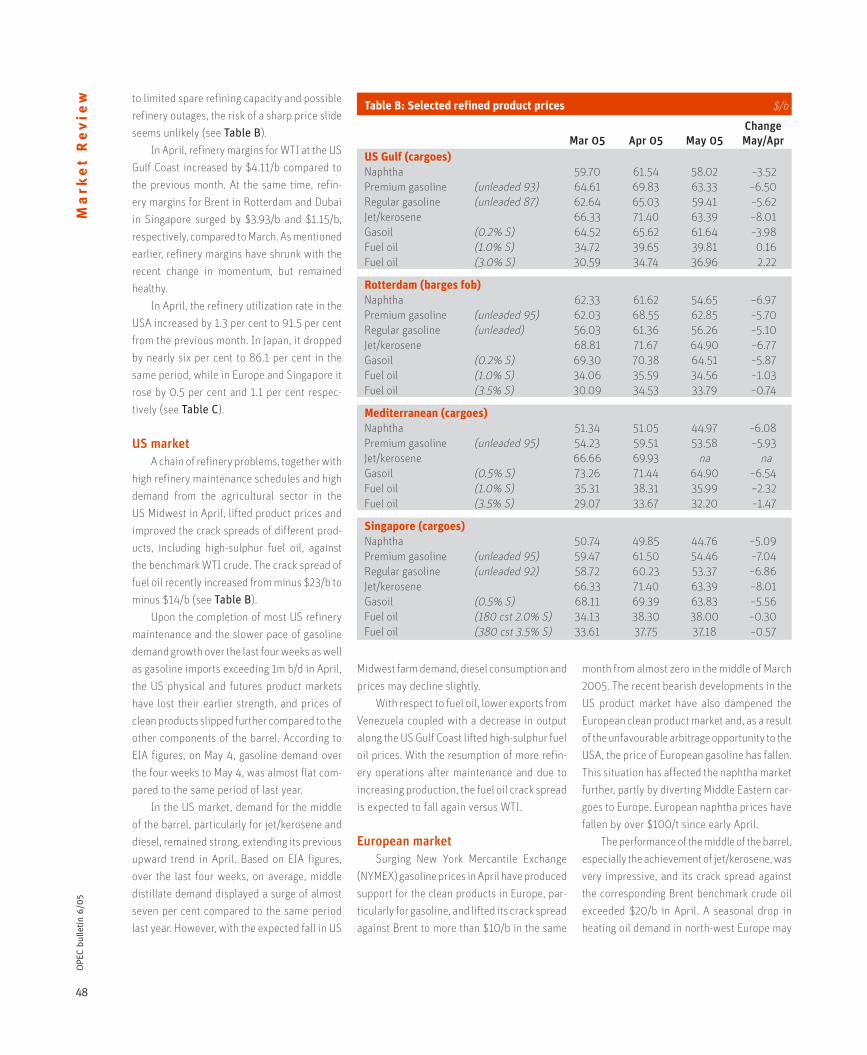
48
OPE
C bu
lleti
n 6/
05M
ark
et
Re
vie
w to limited spare refining capacity and possible
refinery outages, the risk of a sharp price slide
seems unlikely (see Table B).
In April, refinery margins for WTI at the US
Gulf Coast increased by $4.11/b compared to
the previous month. At the same time, refin-
ery margins for Brent in Rotterdam and Dubai
in Singapore surged by $3.93/b and $1.15/b,
respectively, compared to March. As mentioned
earlier, refinery margins have shrunk with the
recent change in momentum, but remained
healthy.
In April, the refinery utilization rate in the
USA increased by 1.3 per cent to 91.5 per cent
from the previous month. In Japan, it dropped
by nearly six per cent to 86.1 per cent in the
same period, while in Europe and Singapore it
rose by 0.5 per cent and 1.1 per cent respec-
tively (see Table C).
US market A chain of refinery problems, together with
high refinery maintenance schedules and high
demand from the agricultural sector in the
US Midwest in April, lifted product prices and
improved the crack spreads of different prod-
ucts, including high-sulphur fuel oil, against
the benchmark WTI crude. The crack spread of
fuel oil recently increased from minus $23/b to
minus $14/b (see Table B).
Upon the completion of most US refinery
maintenance and the slower pace of gasoline
demand growth over the last four weeks as well
as gasoline imports exceeding 1m b/d in April,
the US physical and futures product markets
have lost their earlier strength, and prices of
clean products slipped further compared to the
other components of the barrel. According to
EIA figures, on May 4, gasoline demand over
the four weeks to May 4, was almost flat com-
pared to the same period of last year.
In the US market, demand for the middle
of the barrel, particularly for jet/kerosene and
diesel, remained strong, extending its previous
upward trend in April. Based on EIA figures,
over the last four weeks, on average, middle
distillate demand displayed a surge of almost
seven per cent compared to the same period
last year. However, with the expected fall in US
Midwest farm demand, diesel consumption and
prices may decline slightly.
With respect to fuel oil, lower exports from
Venezuela coupled with a decrease in output
along the US Gulf Coast lifted high-sulphur fuel
oil prices. With the resumption of more refin-
ery operations after maintenance and due to
increasing production, the fuel oil crack spread
is expected to fall again versus WTI.
European market Surging New York Mercantile Exchange
(NYMEX) gasoline prices in April have produced
support for the clean products in Europe, par-
ticularly for gasoline, and lifted its crack spread
against Brent to more than $10/b in the same
month from almost zero in the middle of March
2005. The recent bearish developments in the
US product market have also dampened the
European clean product market and, as a result
of the unfavourable arbitrage opportunity to the
USA, the price of European gasoline has fallen.
This situation has affected the naphtha market
further, partly by diverting Middle Eastern car-
goes to Europe. European naphtha prices have
fallen by over $100/t since early April.
The performance of the middle of the barrel,
especially the achievement of jet/kerosene, was
very impressive, and its crack spread against
the corresponding Brent benchmark crude oil
exceeded $20/b in April. A seasonal drop in
heating oil demand in north-west Europe may
Table B: Selected refined product prices $/b
Mar 05 Apr 05 May 05ChangeMay/Apr
US Gulf (cargoes)Naphtha 59.70 61.54 58.02 –3.52Premium gasoline (unleaded 93) 64.61 69.83 63.33 –6.50Regular gasoline (unleaded 87) 62.64 65.03 59.41 –5.62Jet/kerosene 66.33 71.40 63.39 –8.01Gasoil (0.2% S) 64.52 65.62 61.64 –3.98Fuel oil (1.0% S) 34.72 39.65 39.81 0.16Fuel oil (3.0% S) 30.59 34.74 36.96 2.22
Rotterdam (barges fob)Naphtha 62.33 61.62 54.65 –6.97Premium gasoline (unleaded 95) 62.03 68.55 62.85 –5.70Regular gasoline (unleaded) 56.03 61.36 56.26 –5.10Jet/kerosene 68.81 71.67 64.90 –6.77Gasoil (0.2% S) 69.30 70.38 64.51 –5.87Fuel oil (1.0% S) 34.06 35.59 34.56 –1.03Fuel oil (3.5% S) 30.09 34.53 33.79 –0.74
Mediterranean (cargoes)Naphtha 51.34 51.05 44.97 –6.08Premium gasoline (unleaded 95) 54.23 59.51 53.58 –5.93Jet/kerosene 66.66 69.93 na naGasoil (0.5% S) 73.26 71.44 64.90 –6.54Fuel oil (1.0% S) 35.31 38.31 35.99 –2.32Fuel oil (3.5% S) 29.07 33.67 32.20 –1.47
Singapore (cargoes)Naphtha 50.74 49.85 44.76 –5.09Premium gasoline (unleaded 95) 59.47 61.50 54.46 –7.04Regular gasoline (unleaded 92) 58.72 60.23 53.37 –6.86Jet/kerosene 66.33 71.40 63.39 –8.01Gasoil (0.5% S) 68.11 69.39 63.83 –5.56Fuel oil (180 cst 2.0% S) 34.13 38.30 38.00 –0.30Fuel oil (380 cst 3.5% S) 33.61 37.75 37.18 –0.57
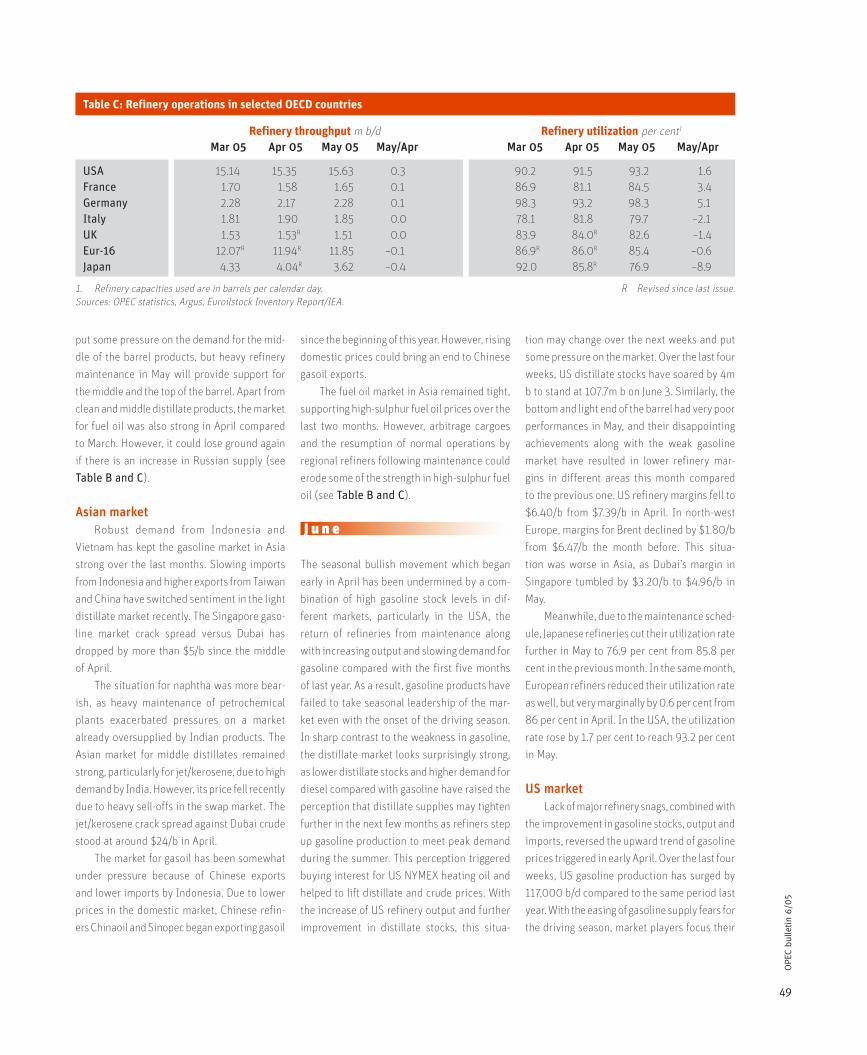
49
OPE
C bu
lleti
n 6/
05
put some pressure on the demand for the mid-
dle of the barrel products, but heavy refinery
maintenance in May will provide support for
the middle and the top of the barrel. Apart from
clean and middle distillate products, the market
for fuel oil was also strong in April compared
to March. However, it could lose ground again
if there is an increase in Russian supply (see
Table B and C).
Asian market Robust demand from Indonesia and
Vietnam has kept the gasoline market in Asia
strong over the last months. Slowing imports
from Indonesia and higher exports from Taiwan
and China have switched sentiment in the light
distillate market recently. The Singapore gaso-
line market crack spread versus Dubai has
dropped by more than $5/b since the middle
of April.
The situation for naphtha was more bear-
ish, as heavy maintenance of petrochemical
plants exacerbated pressures on a market
already oversupplied by Indian products. The
Asian market for middle distillates remained
strong, particularly for jet/kerosene, due to high
demand by India. However, its price fell recently
due to heavy sell-offs in the swap market. The
jet/kerosene crack spread against Dubai crude
stood at around $24/b in April.
The market for gasoil has been somewhat
under pressure because of Chinese exports
and lower imports by Indonesia. Due to lower
prices in the domestic market, Chinese refin-
ers Chinaoil and Sinopec began exporting gasoil
since the beginning of this year. However, rising
domestic prices could bring an end to Chinese
gasoil exports.
The fuel oil market in Asia remained tight,
supporting high-sulphur fuel oil prices over the
last two months. However, arbitrage cargoes
and the resumption of normal operations by
regional refiners following maintenance could
erode some of the strength in high-sulphur fuel
oil (see Table B and C).
J u n e
The seasonal bullish movement which began
early in April has been undermined by a com-
bination of high gasoline stock levels in dif-
ferent markets, particularly in the USA, the
return of refineries from maintenance along
with increasing output and slowing demand for
gasoline compared with the first five months
of last year. As a result, gasoline products have
failed to take seasonal leadership of the mar-
ket even with the onset of the driving season.
In sharp contrast to the weakness in gasoline,
the distillate market looks surprisingly strong,
as lower distillate stocks and higher demand for
diesel compared with gasoline have raised the
perception that distillate supplies may tighten
further in the next few months as refiners step
up gasoline production to meet peak demand
during the summer. This perception triggered
buying interest for US NYMEX heating oil and
helped to lift distillate and crude prices. With
the increase of US refinery output and further
improvement in distillate stocks, this situa-
tion may change over the next weeks and put
some pressure on the market. Over the last four
weeks, US distillate stocks have soared by 4m
b to stand at 107.7m b on June 3. Similarly, the
bottom and light end of the barrel had very poor
performances in May, and their disappointing
achievements along with the weak gasoline
market have resulted in lower refinery mar-
gins in different areas this month compared
to the previous one. US refinery margins fell to
$6.40/b from $7.39/b in April. In north-west
Europe, margins for Brent declined by $1.80/b
from $6.47/b the month before. This situa-
tion was worse in Asia, as Dubai’s margin in
Singapore tumbled by $3.20/b to $4.96/b in
May.
Meanwhile, due to the maintenance sched-
ule, Japanese refineries cut their utilization rate
further in May to 76.9 per cent from 85.8 per
cent in the previous month. In the same month,
European refiners reduced their utilization rate
as well, but very marginally by 0.6 per cent from
86 per cent in April. In the USA, the utilization
rate rose by 1.7 per cent to reach 93.2 per cent
in May.
US market Lack of major refinery snags, combined with
the improvement in gasoline stocks, output and
imports, reversed the upward trend of gasoline
prices triggered in early April. Over the last four
weeks, US gasoline production has surged by
117,000 b/d compared to the same period last
year. With the easing of gasoline supply fears for
the driving season, market players focus their
Table C: Refinery operations in selected OECD countries
Refinery throughput m b/d Refinery utilization per cent1
Mar 05 Apr 05 May 05 May/Apr Mar 05 Apr 05 May 05 May/Apr
USA 15.14 15.35 15.63 0.3 90.2 91.5 93.2 1.6France 1.70 1.58 1.65 0.1 86.9 81.1 84.5 3.4Germany 2.28 2.17 2.28 0.1 98.3 93.2 98.3 5.1Italy 1.81 1.90 1.85 0.0 78.1 81.8 79.7 –2.1UK 1.53 1.53R 1.51 0.0 83.9 84.0R 82.6 –1.4Eur-16 12.07R 11.94R 11.85 –0.1 86.9R 86.0R 85.4 –0.6Japan 4.33 4.04R 3.62 –0.4 92.0 85.8R 76.9 –8.9
1. Refinery capacities used are in barrels per calendar day. R Revised since last issue.Sources: OPEC statistics, Argus, Euroilstock Inventory Report/IEA.
50
OPE
C bu
lleti
n 6/
05M
ark
et
Re
vie
w attention on a possible future shortage of heat-
ing oil. This has led to an unusual situation at
this time of year of heating oil futures leading
the market. Although distillate demand in the
US market is stronger than gasoline demand,
some market analysts are skeptical about the
recent strong momentum in distillates which
appears to be manipulated by speculators.
Increasing output and improved distillate
stocks may cause distillates to lose their cur-
rent strength. Indeed, over the last four weeks,
US distillate production rose by 325,000 b/d or
8.5 per cent above the corresponding period last
year. At the same time, distillate stocks surged
by 4m b to reach 107.7m b on June 3.
With respect to fuel oil, fundamentals con-
tinue to be bearish both for low- and high-sul-
phur grades, as sluggish demand from utility
plants and bunkers weighed on the market, and
the crack spread of high-sulphur crude oil in the
US Gulf Coast against WTI benchmark crude oil
fell sharply, from –$9/b in the middle of May to
–$15/b recently.
European market With the narrowing of arbitrage econom-
ics for European gasoline to the USA, gasoline
exports were expected to decrease sharply
in May and put pressure on gasoline prices.
However, according to preliminary data, this
did not have much impact on traders’ schedules
as they fixed further gasoline cargoes for the
USA. In May, traders exported about 1.4–1.6m
tonnes, up from 1.3–1.4m tonnes in April, which
prevented a further fall in the gasoline crack
spread against Brent benchmark crude, which
remained around $14/b in the same month.
The European distillate market also
received some support from unseasonable buy-
ing interest in IPE gasoil and NYMEX heating oil
as well as tertiary stock-building in Germany.
The European low-sulphur gasoil crack spread
in May outpaced the gasoline crack spread ver-
sus Brent crude oil, which is quite unusual at this
time of the year. Despite the bullish sentiment for
gasoil, jet/kero prices dropped due to the influx
of arbitrage cargoes from the Middle East.
Furthermore, as was expected, the European
high sulphur fuel oil (hsfo) market also lost
ground, and has recently been dampened by
increasing exports from Russia and higher
regional outputs. The hsfo crack spread against
Brent crude oil widened to –$17/b in early June
from –$13/b in the middle of May.
Asian market The continuation of slowing imports by
Indonesia and higher exports from China and
Taiwan put further pressure on gasoline prices
in Asia in May. The gasoline crack spread in the
Singapore market against the Dubai bench-
mark decreased by more than $8/b since early
March and reached $7/b on June 2. This bearish
momentum in the Asian gasoline market may
recover slightly with the entering of Chinese
refineries for maintenance and increasing
Japanese imports during the driving season.
The market for naphtha looks more disap-
pointing, as prices for petrochemical products,
particularly for ethylene, are plunging and mar-
ket sentiment was dominated by hefty regional
supplies.
Moreover, despite their strength in the
Atlantic Basins, middle distillates in Asia
recently lost their earlier strong momentum
as Chinese traders will not import diesel from
June through mid-September due to the fishing
ban, as well as on lower imports by Vietnam
and Indonesia.
Similarly, the jet/kerosene crack spread
versus Dubai crude oil fell sharply to $15/b in
May from $25/b in the previous month due to
ample supply from the Middle East.
Over the last few weeks, the high-sulphur
fuel oil market in Asia also weakened signifi-
cantly because of a lack of Chinese buying
interest and high imports of arbitrage cargoes
from Europe and the Caribbean. However, solid
demand from Japanese utilities helped low-
sulphur fuel oil to remain strong.
The oil futures market
M a y
The NYMEX crude futures contract started
April on a bullish note, although bearishness
dominated most of the month. The WTI prompt
month contract surged over six per cent in two
days after an investment bank report suggested
that the oil market had entered a new ‘super-
spike’ period which could see crude prices
reaching as high as $105/b. The CFTC weekly
data for April 5, revealed that non-commercials
increased long positions to some 174,000 con-
tracts, the highest level since last May, while
reducing short positions to 84,000. Hence,
net long positions widened by a hefty 15,000
lots to 89,000 with open interest peaking at
an all time high of 860,000 contracts. The
front-month contract peaked at over $57/b,
the highest recorded level ever. Nonetheless,
OPEC’s resumption of consultations on boost-
ing supplies amid crude oil stock builds for
the eight consecutive weeks as well as a cut
in the official EU growth forecast drew money
out of the energy market on fund sell-offs for
profit-taking. The front month contract started
to retreat towards the $50/b level inspired by
the strengthening US dollar. The CFTC report
for the week ending April 12, revealed non-
commercials hade reduced long positions by a
hefty 19,000 contracts while increasing shorts
by 10,000 contracts, leaving net long positions
down 29,000 lots at 60,000.
The bearishness continued to sustain
strength on the release of a bearish IEA report
with a downwardly revised demand forecast
amid steady OPEC output with crude oil stocks
in the US remaining above two-year highs.
Accordingly, the NYMEX front month contract
hovered around the $50/b level into the third
week. However, bulls revived on a spate of refin-
ery troubles in the USA, which ignited supply
worries ahead of the driving season. NYMEX
WTI rallied ahead of the prompt month expiry
that surged nearly four per cent on April 19
with the new front month emerging in a con-
tango structure hovering around the $55/b
level. Nonetheless, non-commercials reduced
their long positions by another hefty 29,000
lots with a moderate reduction of shorts as
well. Net longs fell to their lowest level in nine
weeks to 33,000 lots.
In the final week in April, the downward
movement in WTI, which was sustained on the
51
OPE
C bu
lleti
n 6/
05
meeting between Saudi Arabia’s Crown Prince
and the US President to discuss possible ways
to bring down high oil prices, helped to defuse
market pressure. This was coupled with com-
ments from Saudi Arabia that it could quickly
tap spare capacity and news of rising OPEC sup-
ply. NYMEX WTI slipped over three per cent in
the final week on another hefty crude oil stock-
build in the USA, followed by another $2/b slash
in the last day of the month on less encourag-
ing economic growth. Accordingly, the front
month slipped below $50/b for the first time
since February 18. Hence, the CFTC report for
the last week of the month revealed non-com-
mercials continued to reduce long exposure and
increased shorts. The net long positions were
down by some 7,000 lots to 32,000, the low-
est since January 18, and open interest was at
810,000 lots the lowest since March 1, while
the monthly average for open interest stood at
some 146,000 contracts over the same period
last year. The general perception appears to be
that crude prices are trending downward due
to an amply supplied market. Tightness in the
downstream capacity might still keep prices
in check, although divergence with the main
petroleum products is on the horizon.
The futures contract forward curve sus-
tained the contango structure for the sixth con-
secutive month. The contango extended even
further into the 18 month when compared to the
front end of the curve. The 1st/2nd month average
spread was 70¢ wider at minus $1.38/b with the
1st/6th month spread expanding a further $1.85
to reach $2.55/b. The contango moved into the
later months with the 1st/12th month at minus
$1.38 versus +$1.19 in March and the 1st/18th
month spread at minus 17¢ versus $2.82/b in
March. Persistent healthy US crude inventories
reached 327 million barrels in the last week of
April, an increase of 28m b over same period
last year to mark a six-year high.
J u n e
The crude oil futures contract had a bearish
start to the month continuing the downward
trend in late April on less encouraging eco-
nomic growth data in the USA. The first week
was somewhat quiet as the NYMEX futures mar-
ket reacted to a hefty fund sell off on May 3, on
revived concern over weak economic data amid
a six-year high in US crude oil stocks backed
by increased OPEC supply. However, concern
for the last quarter of the year emerged amid
tight refining capacity. The first weekly CFTC
data revealed that non-commercials drew out
of the energy market for a hefty drop in long
positions of some 15,000 lots to 107,000 from
record peak in early April of 174,000 contracts.
Accordingly, net long positions narrowed to
8,000 contracts, some 18,000 lots lower than
the previous week. However, open interest was
little changed at 811,000 lots. The NYMEX WTI
front-month weekly average fell nearly $2/b
to $50.47/b.
The second week turned bullish on concerns
that refiners might not be able to meet demand
in the second half of the year. However, the
bears revived as US stocks continued to build
and the IEA reported that higher fuel costs and
the weakening economic picture were denting
global demand. Persistent higher OPEC supply
amid a strengthened US dollar tempted fund
sells-offs. Accordingly, NYMEX WTI prompt
month plunged nearly seven per cent in two
days with the weekly average at $50.35/b. The
CFTC data for the weekly period to May 10,
revealed that the net long positions narrowed
to nearly flat at 85 lots amid a decline in long
positions and a build in shorts. Some of these
changes were also reflected in the commercial
sector as open interest saw a build of 21,000
lots to 832,000 contracts.
During the third week, the futures market
was affected by a series of bearish trends with
US crude oil stocks continuing to rise, OPEC out-
put steady and a weakening economic picture.
Indeed, US crude oil stocks experienced only
four declines in nineteen weeks and one draw in
the last fourteen consecutive weeks. The NYMEX
WTI front-month contract, which expired on 20
May, dropped to $46.80/b, a three-month low,
while the weekly average slipped over $2.50 to
$47.71/b. The futures contract volume showed
that net long positions flipped into net shorts
by 2,300 lots amid a hefty drop in the longs
to 88,000 lots while shorts stood at 90,000
contracts. Meanwhile, open interest experi-
enced a significant drop of 41,000 lots to reach
791,000, below the 800,000 level for the first
time since March 1.
The sentiment reversed in the fourth week
as the new front-month contract emerged higher
in a contango market. Worry over gasoline
demand amid the emerging driving season re-
ignited concern that higher refinery runs would
start to eat into crude oil inventories as a sur-
prise drop in US crude oil stocks stirred the
bulls. Hence, the NYMEX front-month contract
for WTI was $3.20 higher in the first five days
as the new front-month, for a weekly average
of $50.53/b. Nevertheless, net short positions
continued to widen further to 14,000 lots as
shorts increased to 95,000 while longs dropped
to 81,000. Open interest declined by another
hefty 28,000 contracts to 763,000. The last
trade day of May 31, saw a build in non-com-
mercial long positions although at a slower pace
than shorts, which widened net short positions
to 17,400 lots, a level last seen on December
17. Open interest also increased by a healthy
20,000 contracts to 783,000 as commercials
increased longs and dropped short positions.
The futures market appeared poised in early
June amid market volatility, awaiting direction
on concern over tight downstream capacity.
NYMEX WTI forward curve remained in con-
tango in its seventh straight month. The 1st/2nd
month average spread widened slightly into
negative territory by 4¢ to $1.42/b. The spread
peaked on May 18, at a high of –$1.88/b on
continued healthy crude oil stock builds in the
USA to a six-year high. However, the contango
spread eased later in the month to below $1/b
levels and bottomed at –51¢/b on May 27, on
speculations that refiners will boost process-
ing to produce gasoline for the summer driv-
ing season. The 1st/6th month spread followed
suit and widened 23¢ to –$2.78/b on renewed
worries that rising global oil demand may out-
strip supply during the second half of the year.
Moreover, the contango steepened further into
the 12th and 18th month forward contracts. The
1st/12th month spread widened at a faster rate
of 76¢ to –$2.15/b, while the 1st/18th month
spread outpaced all the movements at $1.31/b

52
OPE
C bu
lleti
n 6/
05M
ark
et
Re
vie
w or $1.14/b wider on the perception that supply
tightness would not ease into the next year.
Tanker market
M a y
OPEC spot fixtures increased by only 100,000
b/d in April to reach 14.2m b/d, despite a rise of
280,000 b/d in OPEC production, but remained
2.4m b/d above the same period last year. With
this minor increase, OPEC’s share of total spot
chartering fell to 61 per cent against 67 per
cent in the previous month, the lowest level in
a year. The major contributor to the growth in
OPEC spot fixtures was the Middle East, which
saw an increase in share from 53 per cent in
March to 56 per cent in April. Middle East/West
long-haul fixtures increased by 500,000 b/d to
2.26m b/d, while Middle East/East long-haul
fixtures remained almost unchanged at 5.65m
b/d. The zero growth in fixtures to the East was
due to the fact that charterers refrained from
fixing more vessels from the Middle East ahead
of refinery maintenance and sought light sweet
crude out of the Middle East.
In contrast to OPEC, non-OPEC spot fix-
tures soared by 1.86m b/d or 26 per cent to
8.9m b/d, which corresponded to the high-
est growth since January 2004. Consequently,
global spot chartering increased by almost
2m b/d or nine per cent to average 23.1m b/d.
Compared to the same month last year, glo-
bal spot chartering was up by nearly 3.5m
b/d. Preliminary estimates showed that sail-
ings from the OPEC area fell by 800,000 b/d
to stand at an average of around 22.7m b/d,
with Middle Eastern countries, which rep-
resented 72 per cent of OPEC’s sailing, con-
tributing almost 500,000 b/d to the decline.
Preliminary data shows that arrivals in the USA
and the Caribbean increased by 400,000 b/d
to reach a record high of over 11m b/d, confirm-
ing the surge in US stocks. However, arrivals in
north-west Europe and Japan declined by around
500,000 b/d each to register 7.4m b/d and 3.9m
b/d, respectively, while arrivals in the Euromed
region remained unchanged at 4m b/d.
Crude oil spot freight rates declined
sharply in April due to plentiful tonnage avail-
ability, essentially the result of lower seasonal
demand for crude oil and the expansion in the
fleet capacity since the beginning of the year
of 5–7m dwt, according to secondary sources.
Freight rates usually reach their lowest level
of the year in April due to the lower seasonal
demand. Freight rates for the very large crude
carriers (VLCC) sector continued to drop for the
second consecutive month with Middle East/
eastbound long-haul rates falling 17 points or
16 per cent to average Worldscale 88 due to
refining maintenance in Asia, while the Middle
East/westbound long-haul rates declined by 13
points or 14 per cent to settle at a monthly aver-
age of W79 as a result of refining maintenance in
the Atlantic Basin. In addition to lower demand,
the growing need for North and West African
light sweet crude exerted downward pressure
on freight rates for vessels moving from the
Middle East. Freight rates in the Suezmax sec-
tor dropped significantly — by 26 per cent — to
stand at an average of W123, the lowest level in
one year for vessels moving from West Africa to
the US Gulf Coast, while reaching W128 on the
NW Europe/US East and Gulf Coasts, the lowest
level in 18 months. The declines on these two
routes of 43 points and 31 points, respectively,
compared to the previous month were due to
lower activity since stocks in the USA were at
their highest level since July 1999. Similarly,
freight rates in the Aframax sector fell on all
routes, especially on those to the USA. Freight
rates on the Indonesia/US West Coast route
declined by 53 points to an average of W186
after a long period of high levels. At the same
time freight rates on the Caribbean/US East
Coast route moved down by 60 points to stand
at an average of W198, due to ample tonnage
in the USA as mentioned previously. Similarly,
freight rates in the Mediterranean and from
there to NW Europe continued to decline for the
fifth consecutive month to settle at W197 and
W153, respectively as a result of lack of activ-
ity from charterers due to refining maintenance,
which is seen to be heavier than expected in
Europe. Except for the Aframax sector, freight rates
for the other sectors were lower than last year.
As for crude oil, product freight rates moved
down along all routes, reversing the gain of
the previous month. The decline ranged from
eight to 35 points on average due to lack of
activity resulting from a slowdown in trade.
Furthermore, holidays, mainly in Asia, put down-
ward pressure on freight rates. Tankers carrying
30,000–50,000 dwt along the Middle East/
East route lost 23 points to stand at an average
of W280. With 27 points, the Singapore/East
route dropped by almost the same magnitude
to stand at an average of W320. The Caribbean/
US Gulf Coast route showed a slight decline of
eight points or three per cent to average W294.
The NW Europe/US East and Gulf Coasts route
lost 19 points to stand at an average of W310.
Freight rates within the Mediterranean region
and from there to North-West Europe declined
by 35 points and 11 points to average W278
and W324, respectively. Despite these declines,
freight rates remained higher than last year’s
figures along all routes.
J u n e
OPEC spot fixtures declined by 1.2m b/d or nine
per cent to 12.79m b/d in May, the lowest level
since last June. Compared to the same month of
the previous year, OPEC spot fixtures were 3m
b/d lower, which implies that the share of the
spot fixtures declined sharply in one year.
However, despite this drop in fixtures, OPEC’s
share of total spot chartering increased slightly
from 61 per cent in April to 62 per cent in May.
Middle East eastbound long-haul fixtures were
the major contributor to the decline in OPEC
area spot chartering, falling by 720,000 b/d to
4.8m b/d, corresponding to a contribution of
60 per cent to total OPEC’s decline. However,
Middle East westbound fixtures dropped by
220,000 b/d or ten per cent to 1.97m b/d.
Together, Middle East/East and westbound fix-
tures accounted for 53 per cent of total OPEC
fixtures against 55 per cent in the previous
month. Similarly, non-OPEC spot fixtures fell
by nearly 1.1m b/d or 12 per cent to 7.78m b/d,
keeping their share in global spot chartering
almost unchanged at 38 per cent. The decline
in both OPEC and non-OPEC fixtures led to
53
OPE
C bu
lleti
n 6/
05
a fall of 2.27m b/d in global spot-chartering,
which reached 20.57m b/d, the lowest level
so far in 2005. Compared to the same month
of last year, global spot chartering was down
4.5m b/d. Preliminary estimates showed that
sailings from the OPEC area remained stable
at 27.1m b/d compared to the previous month.
Middle Eastern countries, which represented
70 per cent of OPEC sailings, also remained
at the same level of 19m b/d. However, com-
pared to last year sailings from OPEC were 4.3m
b/d higher than the May 2004 level, reflect-
ing growth in OPEC production of almost 2m
b/d over May 2004. Preliminary data shows
that arrivals to the USA and Caribbean contin-
ued to increase to reach a record of 11.6m b/
d, which corresponds to a growth of 750,000
b/d over last month and 1.5m b/d y-o-y growth.
This significant increase led to a six-year high
in US stock levels. Arrivals at the Euromed
region also increased by almost 500,000 b/d
to reach 4.76m b/d, the highest level in more
than two years. In contrast, arrivals in north-
west Europe and Japan continued to fall for the
second consecutive month by 130,000 b/d and
270,000 b/d to stand at 7.58m b/d and 3.82m
b/d, respectively, corresponding to nearly the
same level as in May 2004.
Crude oil spot freight rates showed
mixed developments in May among the dif-
ferent sectors with VLCC rates continuing to
weaken, hitting 19-month lows, whilst rates
for Suezmax and Aframax improved, except
on the Indonesia/US West Coast. Freight rates
for VLCCs moving from the Middle East to the
East and westbound declined by 18 points and
ten points respectively to stand at monthly
averages of around W70. This very low level
was due to a significant ample tonnage result-
ing from an increase in tanker capacity of
around seven per cent according to secondary
sources, coupled with a slowdown in fixtures,
especially from Asian countries because of
refining maintenance and the lack of desul-
phurization capacity to use heavy sour crude
from the Middle East. In contrast to the VLCC
sector, Suezmax rates to the USA improved
due to growing demand for light sweet crudes.
However, arbitrage opportunities supported by
the differential between WTI and Brent and the
end of the refining maintenance season in the
USA supported the increase in trade from West
Africa and north-west Europe to the USA and
therefore to the growth in freight rates. On the
West Africa/US Gulf Coast route, freight rates
recovered by five points to an average of W128,
while on the north-west Europe/US East and US
Gulf Coasts routes rates increased by 18 points
to settle at an average of W146. Compared to
the same month last year, freight rates in the
Suezmax sector remained almost unchanged.
With the exception of the Indonesia/US West
Coast route, freight rates in the Aframax, sup-
ported by healthy activity from charterers, rose
significantly, reversing the huge decline dis-
played in the previous month. Freight rates from
the Caribbean to the US East Coast soared by
73 points or 37 per cent to W271, while in the
Mediterranean region and from there to north-
west Europe, rates increased by 17 points and
69 points respectively to stand at W214 and
W222 due to healthy activity with the approach-
ing end of the refining maintenance season. For
the Mediterranean/north-west Europe route, the
level reached in May was the highest so far in
2005. In contrast, along the Indonesia/US West
Coast route, freight rates plunged by 62 points
to W124, the lowest level since October 2003.
Compared to May 2004, freight rates on the
Caribbean/US East Coast route were up 107
points and 56 points on the Mediterranean/NW
Europe route.
Product freight rates experienced further
declines for the second consecutive month
as a result of little activity from charterers in
combination with the huge availability of ton-
nage. Freight rates for tankers carrying 30,000–
50,000 dwt along the Middle East/East route
slid by 44 points to settle at an average of W236,
while on the Singapore/East route rates dropped
by 34 points to a monthly average of W286 due
essentially to the slowdown in Chinese distillate
imports following the increase in the refining
throughputs to new highs and refining main-
tenance in the petrochemical sector. Similarly,
freight rates on the Caribbean/US Gulf Coast
route declined by 44 points or 15 per cent to
average W250 and the north-west Europe/US
East and Gulf Coasts route lost 27 points to stand
at an average of W283. However, freight rates
across the Mediterranean region remained sta-
ble at W277, whilst from the Mediterranean to
north-west Europe, they declined by 34 points
in May to average W290. Despite these declines,
freight rates remained higher than last year’s
figures, except for the Caribbean/US Gulf Coast
route.
World oil demand
M a y
Forecast for 2004
World Compared with the last report, the world
oil demand estimate for 2004 has been
revised down a marginal 10,000 b/d to aver-
age 83.12m b/d. OECD and non-OECD countries
saw adjustments in different directions. Both
North America and OECD Europe were revised
up by 10,000 b/d, while developing countries
and ‘Other regions’ saw downward revisions
of 20,000 b/d and 10,000 b/d, respectively.
Within the developing countries, the ‘Other
Asia’ region was revised down by 60,000 b/d,
which offset a 40,000 b/d increase in the
Middle East region.
Forecast for 2005 Based on lower-than-anticipated consump-
tion in the first quarter, world oil demand growth
was revised down by 80,000 b/d to 1.82m b/d
or 2.2 per cent from last month’s forecast to
average 83.94m b/d. The first-quarter down-
ward revisions in European demand and China
surpassed the upward revision in Other Asia
and FSU, leading to a cumulative downward
change of 260,000 b/d.
OECD Total OECD demand has been revised
down by 120,000 b/d from the forecast in the
last report and is expected to see 250,000
b/d or 0.5 per cent growth to average 49.8m
b/d. With detailed data for January and February
54
OPE
C bu
lleti
n 6/
05M
ark
et
Re
vie
w and preliminary data for March, OECD consump-
tion is now estimated to grow by 530,000 b/d
or 1.1 per cent. Western Europe’s demand was
revised down as new data indicated a contrac-
tion of 120,000 b/d or 0.8 per cent despite
the late winter. Germany alone experienced
a decrease of six per cent in the first quarter
partly reflecting the impact of high prices on
demand. The main fall was in the light heating
oil sector, when demand decreased by almost
11 per cent compared with the correspond-
ing period of 2004. Diesel also fell by five per
cent on lower sales due to the fact that the first
quarter of this year has two fewer working days
than the same period in 2004. The slow-down
in product demand in OECD Europe was in line
with the lower GDP growth which occurred in
those countries. In contrast, preliminary data
for the first three months of 2005 for the OECD
Pacific region suggests an upward revision in
oil demand to now stand at 210,000 b/d or
2.2 per cent. Much of this increase came from
cold temperatures that contrasted with the mild
weather last year. Demand for kerosene/jet
fuel which is used as heating oil in this region
grew by 4.5 per cent during the first quarter
compared with the same period last year. In
Japan crude oil imports increased by 2.7 per
cent in March from February, while oil product
imports saw strong growth of 6.7 per cent from
the same month last year due to the strength in
demand. Furthermore, nuclear power produc-
tion remains depressed as only ten of TEPCO’s
17 nuclear plants are on line. This boosted oil
demand for thermal power by ten per cent in
March versus the same period a year ago. South
Korea, the world’s fourth biggest oil importer,
also saw a rise of 4.5 per cent in 1Q as industrial
production experienced a healthy increase. The
monthly figures for March showed more impres-
sive growth as crude imports rose about 30 per
cent y-o-y, implying demand growth of eight per
cent. It should be noted that the strong import
figure was also due in part to low volumes seen
a year ago. Still, this year is not yet over and the
question is whether South Korean demand can
keep up at such a high pace. This will depend
on how the consumption of transportation
fuels develops if the government implements
a new regime which would increase diesel
prices. Recently, the government announced
that it plans to raise the domestic transporta-
tion tax on diesel by more than 14 per cent in
July as part of the effort to reduce air pollution.
Preliminary indication for the first quarter of
2005 puts North American oil demand growth
at 440,000 b/d or 1.8 per cent as cold tem-
perature hit the US north-east in mid February
which lasted during March. The below-normal
temperatures boosted demand despite high oil
prices. Total US demand grew by 1.1 per cent
during the first three month of this year, lower
than the 1.7 per cent experienced in the same
period last year. US gasoline demand growth
has been 1.1 per cent, which is far below the
growth of 3.1 per cent experienced in the first
quarter of 2004. These numbers are significant
when linked to weaker US economic growth dur-
ing the first quarter of this year. The slow-down
in gasoline demand was also observed in pre-
liminary April data increasing by only 0.9 per
cent compared to the 2.9 per cent observed in
the same month last year. On the whole, North
American oil demand is projected to increase
340,000 b/d or 1.3 per cent to average 25.5m
b/d, far from the 620,000 b/d or 2.5 per cent
experienced a year ago.
Developing countries Oil demand in developing countries is fore-
cast to grow by 890,000 b/d or 4.2 per cent to
total 22.2m b/d. Compared to the last report,
oil demand has been revised up 60,000 b/d,
mainly from Other Asia as early indications for
1Q show higher than anticipated growth. This is
also in line with healthy economic expansion of
5.5 per cent in the region. Within this group and
based on preliminary data, India’s consumption
registered an increase of five per cent in 1Q of
2005; however, this growth is still below that
experienced in 1Q 2004. The reduction in oil
demand in India came from improvement in
road conditions and the increase of electricity
in railways as well as the increase in gasoline
prices. The switch to gas should also cut oil
consumption, mainly in the power and indus-
try sector. For the first two months of this year,
Thailand saw a strong increase of 6.6 per cent
in oil demand compared to the same period
last year. The increase was mainly in the trans-
portation sector as diesel consumption jumped
by almost 11 per cent, while gasoline demand
climbed about four per cent. Early indication
for Indonesia’s demand also showed a growth
of 5.5 per cent. Consumption in Latin America
is forecast to rise 130,000 b/d or 2.6 per cent
to average 5.0m b/d, slightly down from last
month’s report due to a downward revision
in GDP growth as well as lower first-quarter
actual data in Brazil. The expectation of high
GDP growth in the Middle East of 7.5 per cent,
driven by high oil prices, was behind the strong
forecast of growth in oil demand of 290,000
b/d or 5.4 per cent to a total of 5.7m b/d.
Healthy demand growth of 7.2 per cent and
6.4 per cent in 1Q of this year based on actual
data from Iran and Saudi Arabia confirms the
observation above.
Other regions Apparent demand in the Other regions
group is now forecast at 11.9m b/d, an increase
of 680,000 b/d or 6.1 per cent over last year.
Demand growth was revised down marginally
as the upward revision in the FSU offset the
downward one for China. Preliminary data for
March for China combined with more detailed
information for January and February indicated
that 1Q apparent demand only increased by 4.4
per cent compared to a 15.1 per cent gain in the
first quarter of 2004. After a sharp reduction in
the first two months, Chinese crude oil imports
rebounded in March. The slowdown in appar-
ent demand growth in the first quarter reflects
the sharp reduction in crude oil stocks follow-
ing high imports at the end of last year, com-
bined partially with higher product exports as
companies preferred to export products rather
than sell them at lower domestic prices. Also,
China car sales were down 7.7 per cent in 1Q
from a year ago as the government tightened
credit policies and pushed companies to reduce
spending. Demand for fuel oil in power genera-
tion also declined due to the shift in electricity
pricing to a cost-plus basis which was made to
address negative margins that power produc-
ers have been experiencing because of soaring
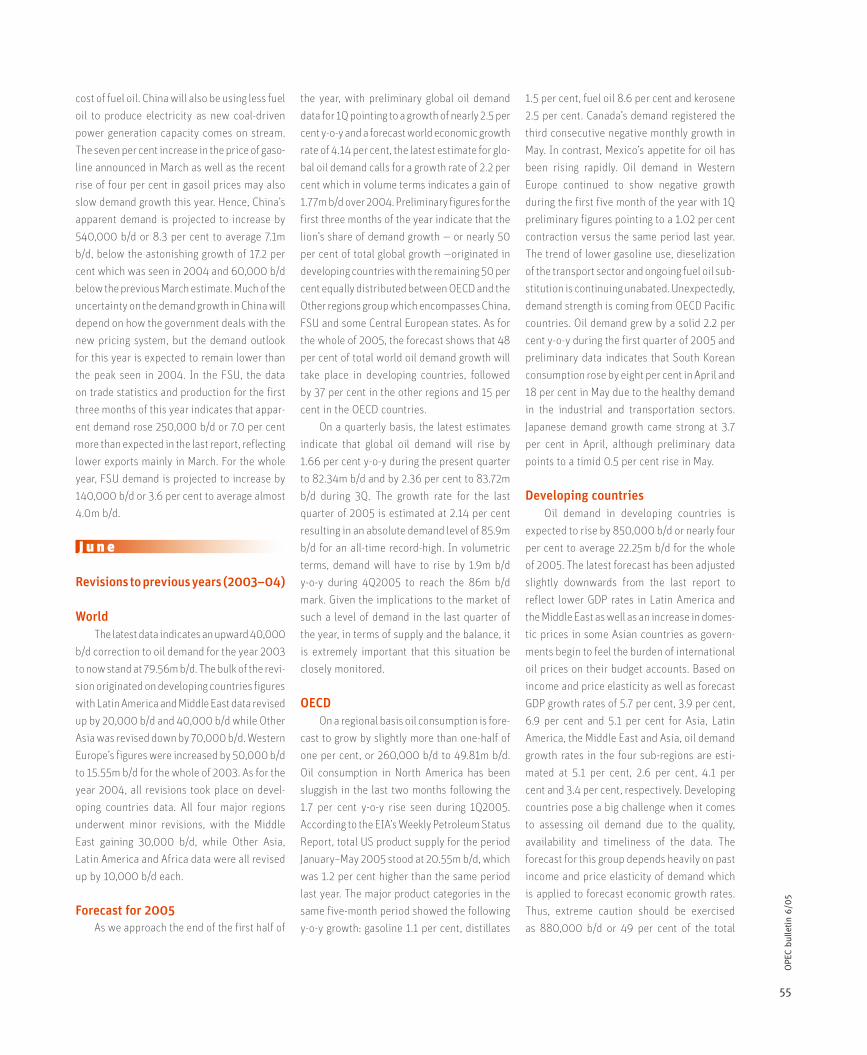
55
OPE
C bu
lleti
n 6/
05
cost of fuel oil. China will also be using less fuel
oil to produce electricity as new coal-driven
power generation capacity comes on stream.
The seven per cent increase in the price of gaso-
line announced in March as well as the recent
rise of four per cent in gasoil prices may also
slow demand growth this year. Hence, China’s
apparent demand is projected to increase by
540,000 b/d or 8.3 per cent to average 7.1m
b/d, below the astonishing growth of 17.2 per
cent which was seen in 2004 and 60,000 b/d
below the previous March estimate. Much of the
uncertainty on the demand growth in China will
depend on how the government deals with the
new pricing system, but the demand outlook
for this year is expected to remain lower than
the peak seen in 2004. In the FSU, the data
on trade statistics and production for the first
three months of this year indicates that appar-
ent demand rose 250,000 b/d or 7.0 per cent
more than expected in the last report, reflecting
lower exports mainly in March. For the whole
year, FSU demand is projected to increase by
140,000 b/d or 3.6 per cent to average almost
4.0m b/d.
J u n e
Revisions to previous years (2003–04)
World The latest data indicates an upward 40,000
b/d correction to oil demand for the year 2003
to now stand at 79.56m b/d. The bulk of the revi-
sion originated on developing countries figures
with Latin America and Middle East data revised
up by 20,000 b/d and 40,000 b/d while Other
Asia was revised down by 70,000 b/d. Western
Europe’s figures were increased by 50,000 b/d
to 15.55m b/d for the whole of 2003. As for the
year 2004, all revisions took place on devel-
oping countries data. All four major regions
underwent minor revisions, with the Middle
East gaining 30,000 b/d, while Other Asia,
Latin America and Africa data were all revised
up by 10,000 b/d each.
Forecast for 2005 As we approach the end of the first half of
the year, with preliminary global oil demand
data for 1Q pointing to a growth of nearly 2.5 per
cent y-o-y and a forecast world economic growth
rate of 4.14 per cent, the latest estimate for glo-
bal oil demand calls for a growth rate of 2.2 per
cent which in volume terms indicates a gain of
1.77m b/d over 2004. Preliminary figures for the
first three months of the year indicate that the
lion’s share of demand growth — or nearly 50
per cent of total global growth —originated in
developing countries with the remaining 50 per
cent equally distributed between OECD and the
Other regions group which encompasses China,
FSU and some Central European states. As for
the whole of 2005, the forecast shows that 48
per cent of total world oil demand growth will
take place in developing countries, followed
by 37 per cent in the other regions and 15 per
cent in the OECD countries.
On a quarterly basis, the latest estimates
indicate that global oil demand will rise by
1.66 per cent y-o-y during the present quarter
to 82.34m b/d and by 2.36 per cent to 83.72m
b/d during 3Q. The growth rate for the last
quarter of 2005 is estimated at 2.14 per cent
resulting in an absolute demand level of 85.9m
b/d for an all-time record-high. In volumetric
terms, demand will have to rise by 1.9m b/d
y-o-y during 4Q2005 to reach the 86m b/d
mark. Given the implications to the market of
such a level of demand in the last quarter of
the year, in terms of supply and the balance, it
is extremely important that this situation be
closely monitored.
OECD On a regional basis oil consumption is fore-
cast to grow by slightly more than one-half of
one per cent, or 260,000 b/d to 49.81m b/d.
Oil consumption in North America has been
sluggish in the last two months following the
1.7 per cent y-o-y rise seen during 1Q2005.
According to the EIA’s Weekly Petroleum Status
Report, total US product supply for the period
January–May 2005 stood at 20.55m b/d, which
was 1.2 per cent higher than the same period
last year. The major product categories in the
same five-month period showed the following
y-o-y growth: gasoline 1.1 per cent, distillates
1.5 per cent, fuel oil 8.6 per cent and kerosene
2.5 per cent. Canada’s demand registered the
third consecutive negative monthly growth in
May. In contrast, Mexico’s appetite for oil has
been rising rapidly. Oil demand in Western
Europe continued to show negative growth
during the first five month of the year with 1Q
preliminary figures pointing to a 1.02 per cent
contraction versus the same period last year.
The trend of lower gasoline use, dieselization
of the transport sector and ongoing fuel oil sub-
stitution is continuing unabated. Unexpectedly,
demand strength is coming from OECD Pacific
countries. Oil demand grew by a solid 2.2 per
cent y-o-y during the first quarter of 2005 and
preliminary data indicates that South Korean
consumption rose by eight per cent in April and
18 per cent in May due to the healthy demand
in the industrial and transportation sectors.
Japanese demand growth came strong at 3.7
per cent in April, although preliminary data
points to a timid 0.5 per cent rise in May.
Developing countries Oil demand in developing countries is
expected to rise by 850,000 b/d or nearly four
per cent to average 22.25m b/d for the whole
of 2005. The latest forecast has been adjusted
slightly downwards from the last report to
reflect lower GDP rates in Latin America and
the Middle East as well as an increase in domes-
tic prices in some Asian countries as govern-
ments begin to feel the burden of international
oil prices on their budget accounts. Based on
income and price elasticity as well as forecast
GDP growth rates of 5.7 per cent, 3.9 per cent,
6.9 per cent and 5.1 per cent for Asia, Latin
America, the Middle East and Asia, oil demand
growth rates in the four sub-regions are esti-
mated at 5.1 per cent, 2.6 per cent, 4.1 per
cent and 3.4 per cent, respectively. Developing
countries pose a big challenge when it comes
to assessing oil demand due to the quality,
availability and timeliness of the data. The
forecast for this group depends heavily on past
income and price elasticity of demand which
is applied to forecast economic growth rates.
Thus, extreme caution should be exercised
as 880,000 b/d or 49 per cent of the total
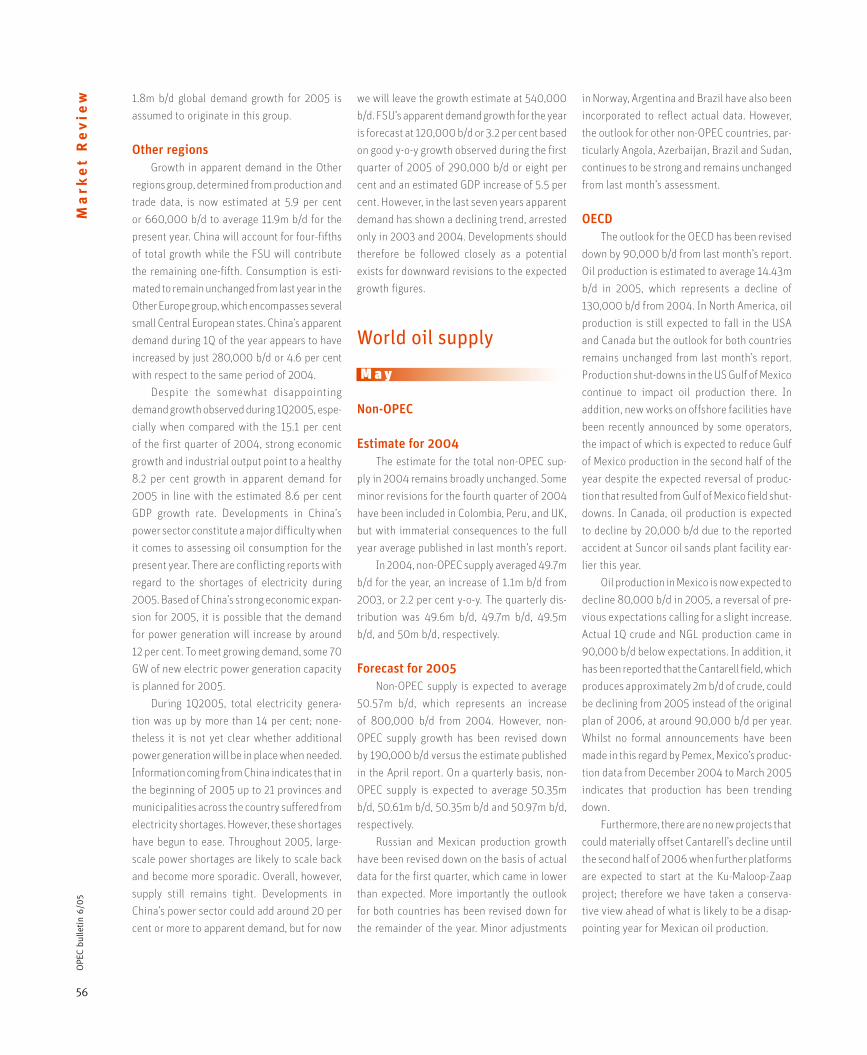
56
OPE
C bu
lleti
n 6/
05M
ark
et
Re
vie
w 1.8m b/d global demand growth for 2005 is
assumed to originate in this group.
Other regions Growth in apparent demand in the Other
regions group, determined from production and
trade data, is now estimated at 5.9 per cent
or 660,000 b/d to average 11.9m b/d for the
present year. China will account for four-fifths
of total growth while the FSU will contribute
the remaining one-fifth. Consumption is esti-
mated to remain unchanged from last year in the
Other Europe group, which encompasses several
small Central European states. China’s apparent
demand during 1Q of the year appears to have
increased by just 280,000 b/d or 4.6 per cent
with respect to the same period of 2004.
Despite the somewhat disappointing
demand growth observed during 1Q2005, espe-
cially when compared with the 15.1 per cent
of the first quarter of 2004, strong economic
growth and industrial output point to a healthy
8.2 per cent growth in apparent demand for
2005 in line with the estimated 8.6 per cent
GDP growth rate. Developments in China’s
power sector constitute a major difficulty when
it comes to assessing oil consumption for the
present year. There are conflicting reports with
regard to the shortages of electricity during
2005. Based of China’s strong economic expan-
sion for 2005, it is possible that the demand
for power generation will increase by around
12 per cent. To meet growing demand, some 70
GW of new electric power generation capacity
is planned for 2005.
During 1Q2005, total electricity genera-
tion was up by more than 14 per cent; none-
theless it is not yet clear whether additional
power generation will be in place when needed.
Information coming from China indicates that in
the beginning of 2005 up to 21 provinces and
municipalities across the country suffered from
electricity shortages. However, these shortages
have begun to ease. Throughout 2005, large-
scale power shortages are likely to scale back
and become more sporadic. Overall, however,
supply still remains tight. Developments in
China’s power sector could add around 20 per
cent or more to apparent demand, but for now
we will leave the growth estimate at 540,000
b/d. FSU’s apparent demand growth for the year
is forecast at 120,000 b/d or 3.2 per cent based
on good y-o-y growth observed during the first
quarter of 2005 of 290,000 b/d or eight per
cent and an estimated GDP increase of 5.5 per
cent. However, in the last seven years apparent
demand has shown a declining trend, arrested
only in 2003 and 2004. Developments should
therefore be followed closely as a potential
exists for downward revisions to the expected
growth figures.
World oil supply
M a y
Non-OPEC
Estimate for 2004 The estimate for the total non-OPEC sup-
ply in 2004 remains broadly unchanged. Some
minor revisions for the fourth quarter of 2004
have been included in Colombia, Peru, and UK,
but with immaterial consequences to the full
year average published in last month’s report.
In 2004, non-OPEC supply averaged 49.7m
b/d for the year, an increase of 1.1m b/d from
2003, or 2.2 per cent y-o-y. The quarterly dis-
tribution was 49.6m b/d, 49.7m b/d, 49.5m
b/d, and 50m b/d, respectively.
Forecast for 2005 Non-OPEC supply is expected to average
50.57m b/d, which represents an increase
of 800,000 b/d from 2004. However, non-
OPEC supply growth has been revised down
by 190,000 b/d versus the estimate published
in the April report. On a quarterly basis, non-
OPEC supply is expected to average 50.35m
b/d, 50.61m b/d, 50.35m b/d and 50.97m b/d,
respectively.
Russian and Mexican production growth
have been revised down on the basis of actual
data for the first quarter, which came in lower
than expected. More importantly the outlook
for both countries has been revised down for
the remainder of the year. Minor adjustments
in Norway, Argentina and Brazil have also been
incorporated to reflect actual data. However,
the outlook for other non-OPEC countries, par-
ticularly Angola, Azerbaijan, Brazil and Sudan,
continues to be strong and remains unchanged
from last month’s assessment.
OECD The outlook for the OECD has been revised
down by 90,000 b/d from last month’s report.
Oil production is estimated to average 14.43m
b/d in 2005, which represents a decline of
130,000 b/d from 2004. In North America, oil
production is still expected to fall in the USA
and Canada but the outlook for both countries
remains unchanged from last month’s report.
Production shut-downs in the US Gulf of Mexico
continue to impact oil production there. In
addition, new works on offshore facilities have
been recently announced by some operators,
the impact of which is expected to reduce Gulf
of Mexico production in the second half of the
year despite the expected reversal of produc-
tion that resulted from Gulf of Mexico field shut-
downs. In Canada, oil production is expected
to decline by 20,000 b/d due to the reported
accident at Suncor oil sands plant facility ear-
lier this year.
Oil production in Mexico is now expected to
decline 80,000 b/d in 2005, a reversal of pre-
vious expectations calling for a slight increase.
Actual 1Q crude and NGL production came in
90,000 b/d below expectations. In addition, it
has been reported that the Cantarell field, which
produces approximately 2m b/d of crude, could
be declining from 2005 instead of the original
plan of 2006, at around 90,000 b/d per year.
Whilst no formal announcements have been
made in this regard by Pemex, Mexico’s produc-
tion data from December 2004 to March 2005
indicates that production has been trending
down.
Furthermore, there are no new projects that
could materially offset Cantarell’s decline until
the second half of 2006 when further platforms
are expected to start at the Ku-Maloop-Zaap
project; therefore we have taken a conserva-
tive view ahead of what is likely to be a disap-
pointing year for Mexican oil production.
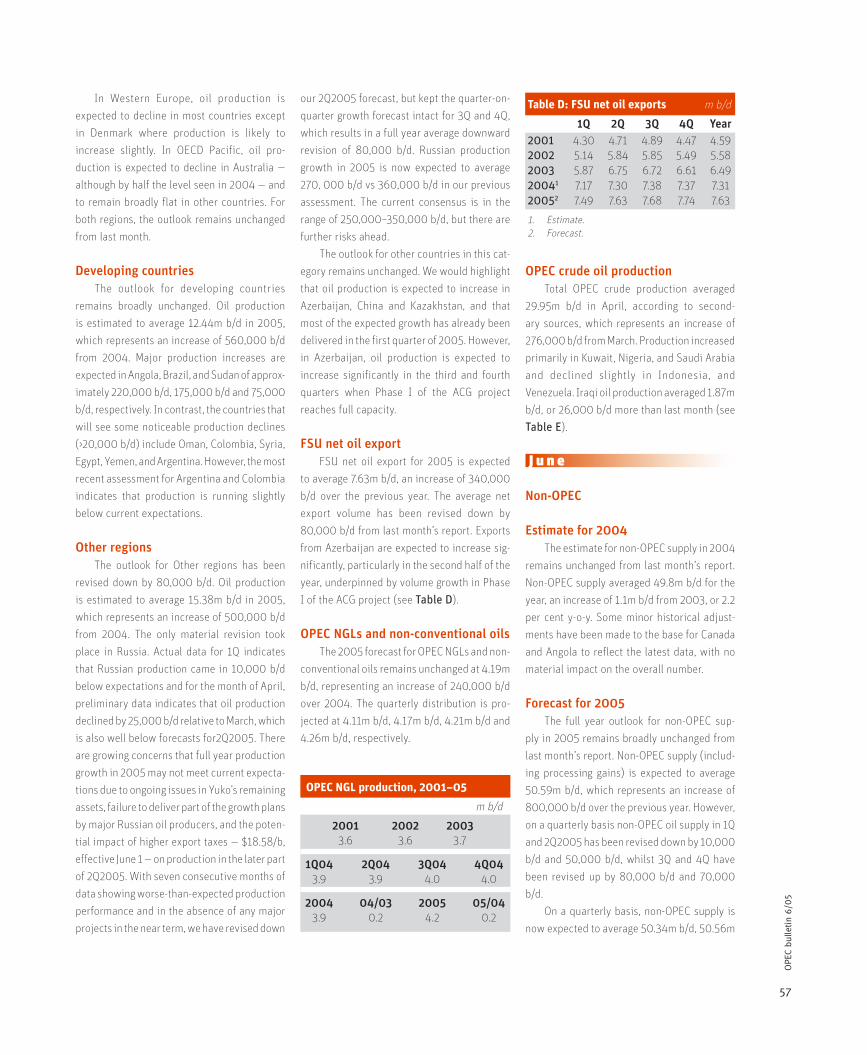
57
OPE
C bu
lleti
n 6/
05
In Western Europe, oil production is
expected to decline in most countries except
in Denmark where production is likely to
increase slightly. In OECD Pacific, oil pro-
duction is expected to decline in Australia —
although by half the level seen in 2004 — and
to remain broadly flat in other countries. For
both regions, the outlook remains unchanged
from last month.
Developing countries The outlook for developing countries
remains broadly unchanged. Oil production
is estimated to average 12.44m b/d in 2005,
which represents an increase of 560,000 b/d
from 2004. Major production increases are
expected in Angola, Brazil, and Sudan of approx-
imately 220,000 b/d, 175,000 b/d and 75,000
b/d, respectively. In contrast, the countries that
will see some noticeable production declines
(>20,000 b/d) include Oman, Colombia, Syria,
Egypt, Yemen, and Argentina. However, the most
recent assessment for Argentina and Colombia
indicates that production is running slightly
below current expectations.
Other regions The outlook for Other regions has been
revised down by 80,000 b/d. Oil production
is estimated to average 15.38m b/d in 2005,
which represents an increase of 500,000 b/d
from 2004. The only material revision took
place in Russia. Actual data for 1Q indicates
that Russian production came in 10,000 b/d
below expectations and for the month of April,
preliminary data indicates that oil production
declined by 25,000 b/d relative to March, which
is also well below forecasts for2Q2005. There
are growing concerns that full year production
growth in 2005 may not meet current expecta-
tions due to ongoing issues in Yuko’s remaining
assets, failure to deliver part of the growth plans
by major Russian oil producers, and the poten-
tial impact of higher export taxes — $18.58/b,
effective June 1 — on production in the later part
of 2Q2005. With seven consecutive months of
data showing worse-than-expected production
performance and in the absence of any major
projects in the near term, we have revised down
our 2Q2005 forecast, but kept the quarter-on-
quarter growth forecast intact for 3Q and 4Q,
which results in a full year average downward
revision of 80,000 b/d. Russian production
growth in 2005 is now expected to average
270, 000 b/d vs 360,000 b/d in our previous
assessment. The current consensus is in the
range of 250,000–350,000 b/d, but there are
further risks ahead.
The outlook for other countries in this cat-
egory remains unchanged. We would highlight
that oil production is expected to increase in
Azerbaijan, China and Kazakhstan, and that
most of the expected growth has already been
delivered in the first quarter of 2005. However,
in Azerbaijan, oil production is expected to
increase significantly in the third and fourth
quarters when Phase I of the ACG project
reaches full capacity.
FSU net oil export FSU net oil export for 2005 is expected
to average 7.63m b/d, an increase of 340,000
b/d over the previous year. The average net
export volume has been revised down by
80,000 b/d from last month’s report. Exports
from Azerbaijan are expected to increase sig-
nificantly, particularly in the second half of the
year, underpinned by volume growth in Phase
I of the ACG project (see Table D).
OPEC NGLs and non-conventional oils The 2005 forecast for OPEC NGLs and non-
conventional oils remains unchanged at 4.19m
b/d, representing an increase of 240,000 b/d
over 2004. The quarterly distribution is pro-
jected at 4.11m b/d, 4.17m b/d, 4.21m b/d and
4.26m b/d, respectively.
OPEC crude oil production Total OPEC crude production averaged
29.95m b/d in April, according to second-
ary sources, which represents an increase of
276,000 b/d from March. Production increased
primarily in Kuwait, Nigeria, and Saudi Arabia
and declined slightly in Indonesia, and
Venezuela. Iraqi oil production averaged 1.87m
b/d, or 26,000 b/d more than last month (see
Table E).
J u n e
Non-OPEC
Estimate for 2004 The estimate for non-OPEC supply in 2004
remains unchanged from last month’s report.
Non-OPEC supply averaged 49.8m b/d for the
year, an increase of 1.1m b/d from 2003, or 2.2
per cent y-o-y. Some minor historical adjust-
ments have been made to the base for Canada
and Angola to reflect the latest data, with no
material impact on the overall number.
Forecast for 2005 The full year outlook for non-OPEC sup-
ply in 2005 remains broadly unchanged from
last month’s report. Non-OPEC supply (includ-
ing processing gains) is expected to average
50.59m b/d, which represents an increase of
800,000 b/d over the previous year. However,
on a quarterly basis non-OPEC oil supply in 1Q
and 2Q2005 has been revised down by 10,000
b/d and 50,000 b/d, whilst 3Q and 4Q have
been revised up by 80,000 b/d and 70,000
b/d.
On a quarterly basis, non-OPEC supply is
now expected to average 50.34m b/d, 50.56m
Table D: FSU net oil exports m b/d
1Q 2Q 3Q 4Q Year2001 4.30 4.71 4.89 4.47 4.592002 5.14 5.84 5.85 5.49 5.582003 5.87 6.75 6.72 6.61 6.4920041 7.17 7.30 7.38 7.37 7.3120052 7.49 7.63 7.68 7.74 7.63
1. Estimate.2. Forecast.
OPEC NGL production, 2001–05
2001 2002 2003 3.6 3.6 3.7
1Q04 2Q04 3Q04 4Q04 3.9 3.9 4.0 4.0
2004 04/03 2005 05/04 3.9 0.2 4.2 0.2
m b/d
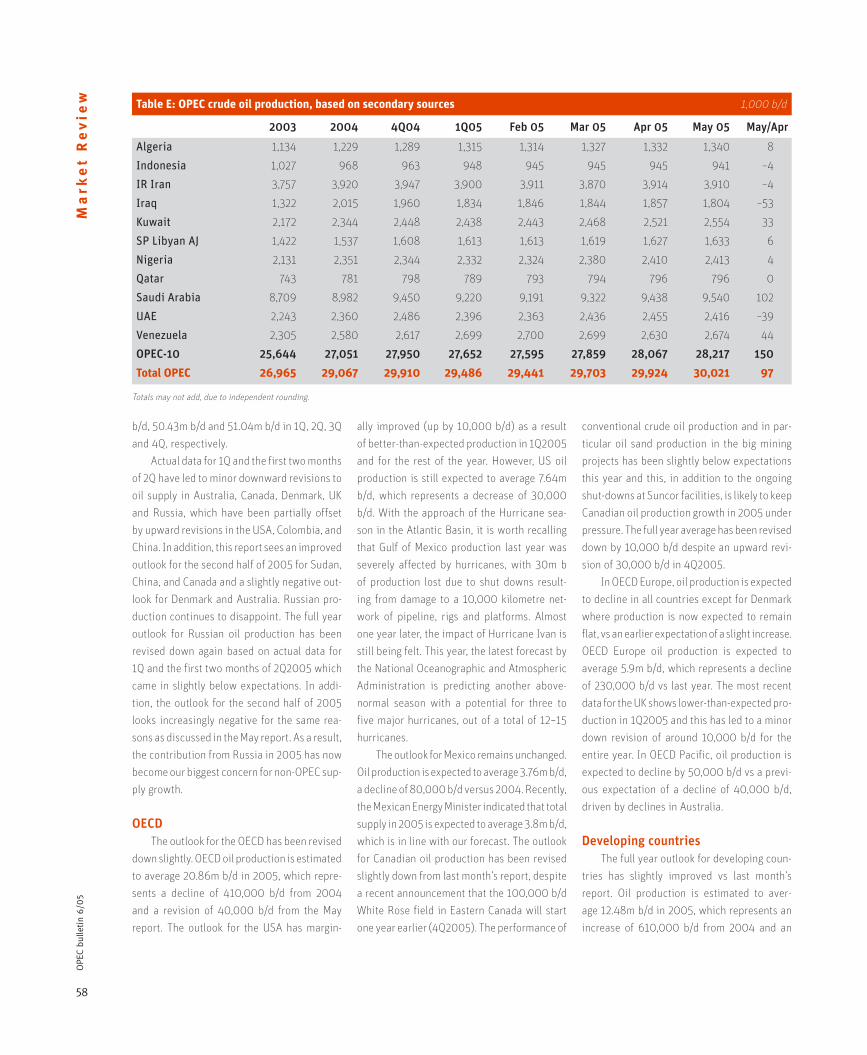
58
OPE
C bu
lleti
n 6/
05M
ark
et
Re
vie
w
b/d, 50.43m b/d and 51.04m b/d in 1Q, 2Q, 3Q
and 4Q, respectively.
Actual data for 1Q and the first two months
of 2Q have led to minor downward revisions to
oil supply in Australia, Canada, Denmark, UK
and Russia, which have been partially offset
by upward revisions in the USA, Colombia, and
China. In addition, this report sees an improved
outlook for the second half of 2005 for Sudan,
China, and Canada and a slightly negative out-
look for Denmark and Australia. Russian pro-
duction continues to disappoint. The full year
outlook for Russian oil production has been
revised down again based on actual data for
1Q and the first two months of 2Q2005 which
came in slightly below expectations. In addi-
tion, the outlook for the second half of 2005
looks increasingly negative for the same rea-
sons as discussed in the May report. As a result,
the contribution from Russia in 2005 has now
become our biggest concern for non-OPEC sup-
ply growth.
OECD The outlook for the OECD has been revised
down slightly. OECD oil production is estimated
to average 20.86m b/d in 2005, which repre-
sents a decline of 410,000 b/d from 2004
and a revision of 40,000 b/d from the May
report. The outlook for the USA has margin-
ally improved (up by 10,000 b/d) as a result
of better-than-expected production in 1Q2005
and for the rest of the year. However, US oil
production is still expected to average 7.64m
b/d, which represents a decrease of 30,000
b/d. With the approach of the Hurricane sea-
son in the Atlantic Basin, it is worth recalling
that Gulf of Mexico production last year was
severely affected by hurricanes, with 30m b
of production lost due to shut downs result-
ing from damage to a 10,000 kilometre net-
work of pipeline, rigs and platforms. Almost
one year later, the impact of Hurricane Ivan is
still being felt. This year, the latest forecast by
the National Oceanographic and Atmospheric
Administration is predicting another above-
normal season with a potential for three to
five major hurricanes, out of a total of 12–15
hurricanes.
The outlook for Mexico remains unchanged.
Oil production is expected to average 3.76m b/d,
a decline of 80,000 b/d versus 2004. Recently,
the Mexican Energy Minister indicated that total
supply in 2005 is expected to average 3.8m b/d,
which is in line with our forecast. The outlook
for Canadian oil production has been revised
slightly down from last month’s report, despite
a recent announcement that the 100,000 b/d
White Rose field in Eastern Canada will start
one year earlier (4Q2005). The performance of
conventional crude oil production and in par-
ticular oil sand production in the big mining
projects has been slightly below expectations
this year and this, in addition to the ongoing
shut-downs at Suncor facilities, is likely to keep
Canadian oil production growth in 2005 under
pressure. The full year average has been revised
down by 10,000 b/d despite an upward revi-
sion of 30,000 b/d in 4Q2005.
In OECD Europe, oil production is expected
to decline in all countries except for Denmark
where production is now expected to remain
flat, vs an earlier expectation of a slight increase.
OECD Europe oil production is expected to
average 5.9m b/d, which represents a decline
of 230,000 b/d vs last year. The most recent
data for the UK shows lower-than-expected pro-
duction in 1Q2005 and this has led to a minor
down revision of around 10,000 b/d for the
entire year. In OECD Pacific, oil production is
expected to decline by 50,000 b/d vs a previ-
ous expectation of a decline of 40,000 b/d,
driven by declines in Australia.
Developing countries The full year outlook for developing coun-
tries has slightly improved vs last month’s
report. Oil production is estimated to aver-
age 12.48m b/d in 2005, which represents an
increase of 610,000 b/d from 2004 and an
Table E: OPEC crude oil production, based on secondary sources 1,000 b/d
2003 2004 4Q04 1Q05 Feb 05 Mar 05 Apr 05 May 05 May/Apr
Algeria 1,134 1,229 1,289 1,315 1,314 1,327 1,332 1,340 8
Indonesia 1,027 968 963 948 945 945 945 941 –4
IR Iran 3,757 3,920 3,947 3,900 3,911 3,870 3,914 3,910 –4
Iraq 1,322 2,015 1,960 1,834 1,846 1,844 1,857 1,804 –53
Kuwait 2,172 2,344 2,448 2,438 2,443 2,468 2,521 2,554 33
SP Libyan AJ 1,422 1,537 1,608 1,613 1,613 1,619 1,627 1,633 6
Nigeria 2,131 2,351 2,344 2,332 2,324 2,380 2,410 2,413 4
Qatar 743 781 798 789 793 794 796 796 0
Saudi Arabia 8,709 8,982 9,450 9,220 9,191 9,322 9,438 9,540 102
UAE 2,243 2,360 2,486 2,396 2,363 2,436 2,455 2,416 –39
Venezuela 2,305 2,580 2,617 2,699 2,700 2,699 2,630 2,674 44
OPEC-10 25,644 27,051 27,950 27,652 27,595 27,859 28,067 28,217 150
Total OPEC 26,965 29,067 29,910 29,486 29,441 29,703 29,924 30,021 97
Totals may not add, due to independent rounding.
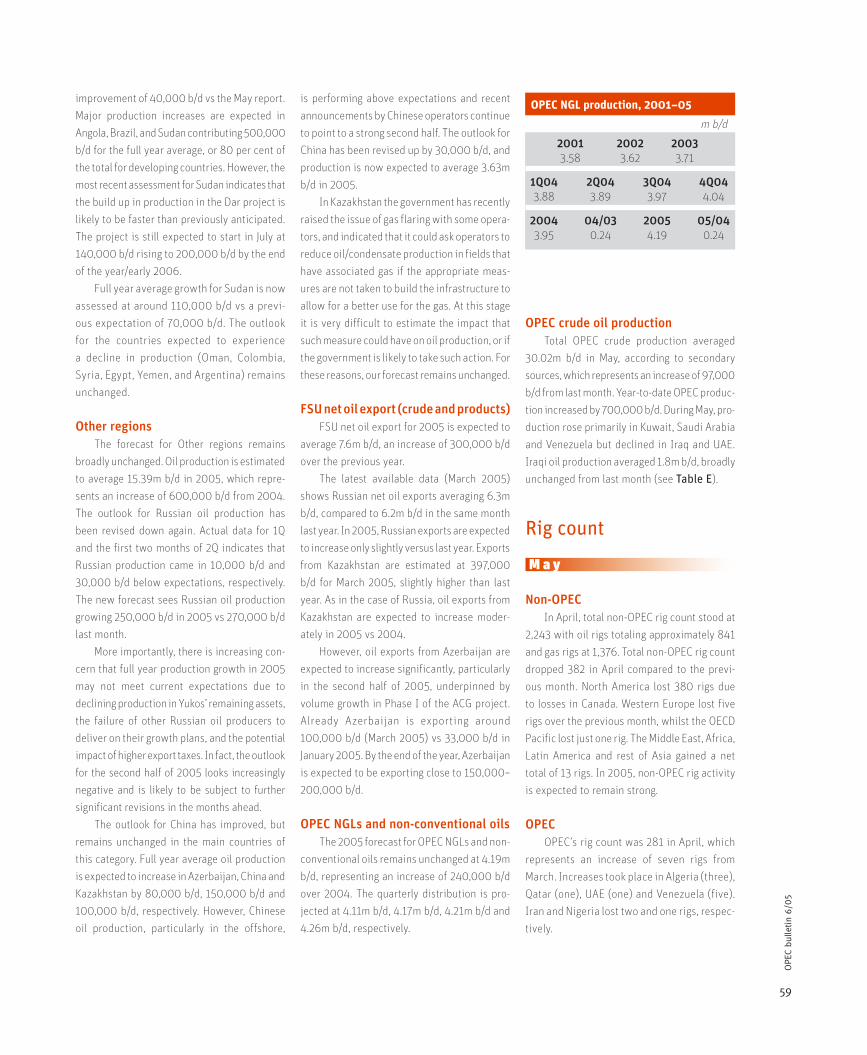
59
OPE
C bu
lleti
n 6/
05
improvement of 40,000 b/d vs the May report.
Major production increases are expected in
Angola, Brazil, and Sudan contributing 500,000
b/d for the full year average, or 80 per cent of
the total for developing countries. However, the
most recent assessment for Sudan indicates that
the build up in production in the Dar project is
likely to be faster than previously anticipated.
The project is still expected to start in July at
140,000 b/d rising to 200,000 b/d by the end
of the year/early 2006.
Full year average growth for Sudan is now
assessed at around 110,000 b/d vs a previ-
ous expectation of 70,000 b/d. The outlook
for the countries expected to experience
a decline in production (Oman, Colombia,
Syria, Egypt, Yemen, and Argentina) remains
unchanged.
Other regions The forecast for Other regions remains
broadly unchanged. Oil production is estimated
to average 15.39m b/d in 2005, which repre-
sents an increase of 600,000 b/d from 2004.
The outlook for Russian oil production has
been revised down again. Actual data for 1Q
and the first two months of 2Q indicates that
Russian production came in 10,000 b/d and
30,000 b/d below expectations, respectively.
The new forecast sees Russian oil production
growing 250,000 b/d in 2005 vs 270,000 b/d
last month.
More importantly, there is increasing con-
cern that full year production growth in 2005
may not meet current expectations due to
declining production in Yukos’ remaining assets,
the failure of other Russian oil producers to
deliver on their growth plans, and the potential
impact of higher export taxes. In fact, the outlook
for the second half of 2005 looks increasingly
negative and is likely to be subject to further
significant revisions in the months ahead.
The outlook for China has improved, but
remains unchanged in the main countries of
this category. Full year average oil production
is expected to increase in Azerbaijan, China and
Kazakhstan by 80,000 b/d, 150,000 b/d and
100,000 b/d, respectively. However, Chinese
oil production, particularly in the offshore,
is performing above expectations and recent
announcements by Chinese operators continue
to point to a strong second half. The outlook for
China has been revised up by 30,000 b/d, and
production is now expected to average 3.63m
b/d in 2005.
In Kazakhstan the government has recently
raised the issue of gas flaring with some opera-
tors, and indicated that it could ask operators to
reduce oil/condensate production in fields that
have associated gas if the appropriate meas-
ures are not taken to build the infrastructure to
allow for a better use for the gas. At this stage
it is very difficult to estimate the impact that
such measure could have on oil production, or if
the government is likely to take such action. For
these reasons, our forecast remains unchanged.
FSU net oil export (crude and products) FSU net oil export for 2005 is expected to
average 7.6m b/d, an increase of 300,000 b/d
over the previous year.
The latest available data (March 2005)
shows Russian net oil exports averaging 6.3m
b/d, compared to 6.2m b/d in the same month
last year. In 2005, Russian exports are expected
to increase only slightly versus last year. Exports
from Kazakhstan are estimated at 397,000
b/d for March 2005, slightly higher than last
year. As in the case of Russia, oil exports from
Kazakhstan are expected to increase moder-
ately in 2005 vs 2004.
However, oil exports from Azerbaijan are
expected to increase significantly, particularly
in the second half of 2005, underpinned by
volume growth in Phase I of the ACG project.
Already Azerbaijan is exporting around
100,000 b/d (March 2005) vs 33,000 b/d in
January 2005. By the end of the year, Azerbaijan
is expected to be exporting close to 150,000–
200,000 b/d.
OPEC NGLs and non-conventional oils The 2005 forecast for OPEC NGLs and non-
conventional oils remains unchanged at 4.19m
b/d, representing an increase of 240,000 b/d
over 2004. The quarterly distribution is pro-
jected at 4.11m b/d, 4.17m b/d, 4.21m b/d and
4.26m b/d, respectively.
OPEC crude oil production Total OPEC crude production averaged
30.02m b/d in May, according to secondary
sources, which represents an increase of 97,000
b/d from last month. Year-to-date OPEC produc-
tion increased by 700,000 b/d. During May, pro-
duction rose primarily in Kuwait, Saudi Arabia
and Venezuela but declined in Iraq and UAE.
Iraqi oil production averaged 1.8m b/d, broadly
unchanged from last month (see Table E).
Rig count
M a y
Non-OPEC In April, total non-OPEC rig count stood at
2,243 with oil rigs totaling approximately 841
and gas rigs at 1,376. Total non-OPEC rig count
dropped 382 in April compared to the previ-
ous month. North America lost 380 rigs due
to losses in Canada. Western Europe lost five
rigs over the previous month, whilst the OECD
Pacific lost just one rig. The Middle East, Africa,
Latin America and rest of Asia gained a net
total of 13 rigs. In 2005, non-OPEC rig activity
is expected to remain strong.
OPEC OPEC’s rig count was 281 in April, which
represents an increase of seven rigs from
March. Increases took place in Algeria (three),
Qatar (one), UAE (one) and Venezuela (five).
Iran and Nigeria lost two and one rigs, respec-
tively.
OPEC NGL production, 2001–05
2001 2002 2003 3.58 3.62 3.71
1Q04 2Q04 3Q04 4Q04 3.88 3.89 3.97 4.04
2004 04/03 2005 05/04 3.95 0.24 4.19 0.24
m b/d
60
OPE
C bu
lleti
n 6/
05M
ark
et
Re
vie
w J u n e
Non-OPEC In May, non-OPEC rig count stood at 2,186,
which represents an increase of 71 rigs from the
revised April figure of 2,115. Of the total, 277
rigs were operating offshore and 1,909 onshore.
Regionally, North America added 53 rigs due
to gains in Canada and Mexico, which offset a
decline of 15 rigs in the USA. The volatility in
rig numbers in North America can generally be
attributed to Canadian rig activity which tends
to vary significantly from month to month.
Western Europe gained six rigs over the pre-
vious month, whilst OECD Pacific added three
rigs. The Middle East, Africa, Latin America and
rest of Asia gained a total of nine rigs. In terms
of the oil and gas split, non-OPEC had 608 oil
rigs and 1,331 gas rigs.
OPEC OPEC rig count dropped to 280 in May,
down one rig from last month. Increases
took place in Indonesia (three), Qatar (one),
and Venezuela (three), while Algeria, Kuwait,
Libya, Saudi Arabia, and UAE saw losses which
resulted in a net decrease for the total OPEC
rig count. Of the total, 216 rigs were operating
onshore and 64 rigs offshore. In terms of oil
and gas split, OPEC had 222 oil rigs whilst the
remainder was gas and other rigs.
Stock movements
M a y
USA US commercial oil stocks observed a sig-
nificant build of 16.3m b or 580,000 b/d to
stand at 972.2m b in the period April 1–29,
2005. Crude oil and all other products, except
distillates and fuel oil, contributed to this build,
particularly crude which accounted for about
two thirds of this rise.
Increasing crude oil imports, which rose
from 9.89m b/d to 10.26m b/d over the period,
as well as lower refinery runs, which fell by
1.99 per cent to 91.72 per cent due to refiner-
ies outages, helped crude oil stocks to add 9.9m
b or 350,000 b/d over the period to stand at
327.04m b, a level not seen since July 1999.
This level widened both the y-o-y and the five-
year average surplus by one per cent to nine
per cent and seven per cent, respectively. Days
of forward cover also increased from 20.9 days
to 21.5 over the period.
Gasoline inventories followed the same
pattern but at a slower pace, building up by
1.2m b or 40,000 b/d to stand at 213.5m b on
the back of higher gasoline imports and refin-
ery throughput, which showed an increase of
150,000 b/d to 1.05m b/d and 130,000 b/d to
8.75m b/d, respectively. Relatively weak implied
demand of gasoline, which declined by 9.10m
b/d to 9.02m b/d, also contributed to this stock-
build. Despite this rise in gasoline stocks, the y-
o-y surplus narrowed to 4.7 per cent or 1.4 per
cent lower than the previous period, while the
five-year average shrank by one per cent to four
per cent. In terms of days of forward consump-
tion, gasoline inventories remained unchanged
at 23.3 days at the end of this period.
Distillate stocks followed a different trend,
declining by 1.8m b or 60,000 b/d to 102.3m
b, mainly due to slightly improved implied
demand which observed a minor increase to
stand at 4.24m b/d. Lower production added
to the draw as distillate output fell by 100,000
b/d to 4.03m b/d.
Distillate imports remained stable at
290,000 b/d, minimizing the draw on inven-
tories. Such a moderate stock-draw failed to
dent the y-o-y deficit which widened consid-
erably by three per cent to four per cent while
the five-year average shortage was extended by
one per cent to two per cent. Days of forward
cover improved slightly from 24.1 days to 24.3
over the period.
The Strategic Petroleum Reserve (SPR)
added 3.7m b to stand at 691.2m b. The SPR is
now about four months away from reaching its
full capacity of 700m b with the rate of crude
oil flow estimated to be less than 100,000 b/d
following the return at the end of April of the
5.4m b crude loan given last year to some US
Gulf Coast refineries due to Hurricane Ivan.
US commercial oil stocks in the week end-
ing May 6, witnessed a further build of 6.92m
b to stand at 979.12m b. Crude oil and gaso-
line inventories continued to contribute to this
build as the first added 2.67m b to 329.70m
b and the second moved up by 190,000 b
to 213.69m b. Distillate inventories changed
direction, increasing 1.70m b to 103.98m b as
implied demand started to ease with the end
of winter, declining by 330,000 b/d compared
with the last week of April (see Table F).
Western Europe Total oil stocks in Eur-16 (EU plus Norway)
experienced a moderate draw in April, falling by
8.1m b or 270,000 b/d to stand at 1,099.9m b.
This level was 22.6m b or two per cent higher
than that registered a year ago. The draw was
split almost equally between crude oil and prod-
uct inventories with the latter showing a mixed
trend although draws on middle distillate and
gasoline were bigger than the builds in fuel oil
and naphtha stocks.
Higher refinery runs, which were at 12.15m
b/d or 70,000 b/d above the previous month’s
level, forced refineries to draw down stocks
especially those which returned from main-
tenance shut-downs. This draw could also be
attributed to the fact that transatlantic arbitrage
was closed as the WTI price was below that
of Brent which encouraged traders to redirect
North Sea cargoes to the Asian market to meet
strong demand, especially for light and sweet
grades. This led to a draw of 3.3m b or 110,000
b/d on crude oil stocks to stand at 470.6m b.
Middle distillate inventories gave up the
previous month’s build on the back of strong
diesel demand and lower imports from Russia.
Middle distillate stocks stood at 347.6m b which
represented a decline of 6.0m b or about two
per cent from the downwardly revised March
figure. Despite this significant drop, inventories
remained well above last year’s level by 15.6m
b or about five per cent.
The draw on gasoline stocks of 2.6m b
or 90,000 b/d to 144.2m b was not due to
healthy demand or slower production, but
rather to strong exports mainly to the US mar-
ket where high gasoline prices due to robust
US demand encouraged European producers
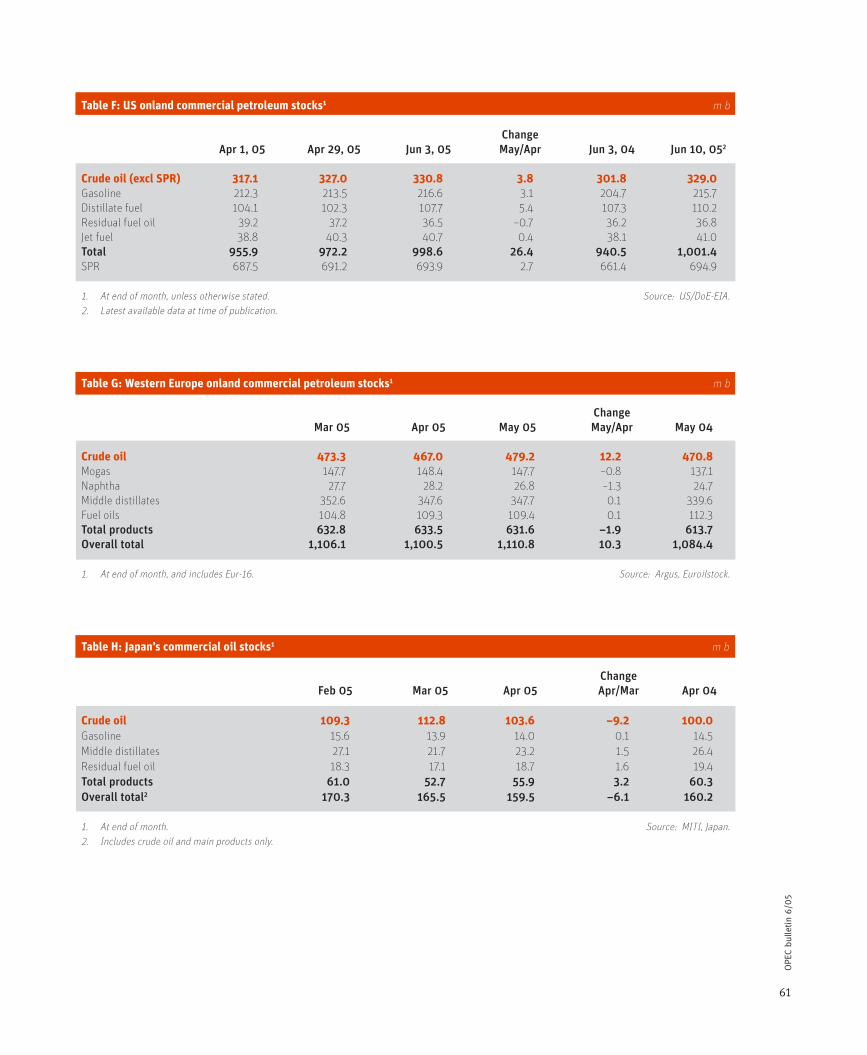
61
OPE
C bu
lleti
n 6/
05
Table F: US onland commercial petroleum stocks1 m b
Change Apr 1, 05 Apr 29, 05 Jun 3, 05 May/Apr Jun 3, 04 Jun 10, 052
Crude oil (excl SPR) 317.1 327.0 330.8 3.8 301.8 329.0Gasoline 212.3 213.5 216.6 3.1 204.7 215.7Distillate fuel 104.1 102.3 107.7 5.4 107.3 110.2Residual fuel oil 39.2 37.2 36.5 –0.7 36.2 36.8Jet fuel 38.8 40.3 40.7 0.4 38.1 41.0Total 955.9 972.2 998.6 26.4 940.5 1,001.4SPR 687.5 691.2 693.9 2.7 661.4 694.9
1. At end of month, unless otherwise stated. Source: US/DoE-EIA.2. Latest available data at time of publication.
Table G: Western Europe onland commercial petroleum stocks1 m b
Change Mar 05 Apr 05 May 05 May/Apr May 04
Crude oil 473.3 467.0 479.2 12.2 470.8Mogas 147.7 148.4 147.7 –0.8 137.1Naphtha 27.7 28.2 26.8 –1.3 24.7Middle distillates 352.6 347.6 347.7 0.1 339.6Fuel oils 104.8 109.3 109.4 0.1 112.3Total products 632.8 633.5 631.6 –1.9 613.7Overall total 1,106.1 1,100.5 1,110.8 10.3 1,084.4
1. At end of month, and includes Eur-16. Source: Argus, Euroilstock.
Table H: Japan’s commercial oil stocks1 m b
Change Feb 05 Mar 05 Apr 05 Apr/Mar Apr 04
Crude oil 109.3 112.8 103.6 –9.2 100.0Gasoline 15.6 13.9 14.0 0.1 14.5Middle distillates 27.1 21.7 23.2 1.5 26.4Residual fuel oil 18.3 17.1 18.7 1.6 19.4Total products 61.0 52.7 55.9 3.2 60.3Overall total2 170.3 165.5 159.5 –6.1 160.2
1. At end of month. Source: MITI, Japan.2. Includes crude oil and main products only.
62
OPE
C bu
lleti
n 6/
05M
ark
et
Re
vie
w to send as much as possible to increase prof-
itability. The y-o-y surplus stood at 8.1m b or
six per cent which was quite a comfortable
level not only to meet domestic demand but
also to satisfy other markets such as the USA
(see Table G).
Japan Total commercial oil inventories in Japan
experienced a further draw for the fourth con-
secutive month, falling by 4.8m b or 150,000
b/d to stand at 165.5m b in March. This level of
total oil stocks has not been seen since August
last year. All main product inventories contrib-
uted to this draw especially middle distillates,
while a moderate build in crude oil stocks dimin-
ished the fall.
The stock-build in crude oil inventories
came on the back of a massive drop in refinery
utilization which fell by 10.7 per cent to 83.3
per cent in March due to refinery shut-downs
for maintenance. Crude oil stocks rose by 3.5m
b or 110,000 b/d to 112.8m b. Compared with
last year, the surplus rose from less than one
per cent to four per cent.
Middle distillate inventories accounted for
two thirds of the total draw on refined product
stocks, falling by 5.5m b or 170,000 b/d to 21.7m
b which was slightly above the mandatory mini-
mum level. A period of lingering cold weather,
particularly in the second half of March, stim-
ulated heating fuel consumption coupled with
lower output as some refineries were in their
scheduled maintenance. The y-o-y deficit wid-
ened from 2.5 per cent to six per cent to stand
at 1.4m b.
Lower refinery runs also affected gasoline
stocks as production was lower, while implied
demand continued to improve. Gasoline inven-
tories moved down by 1.7m b or 0.05m b/d to
stand at 13.9m b. The y-o-y surplus narrowed
to only 400,000 b or about three per cent (see
Table H).
J u n e
USA US commercial oil stocks continued their
upward trend increasing by 26.4m b or 940,000
b/d to stand at 998.6m b during the period April
29–June 3, 2005. The bulk of this build came
from total products, which rose by 22.6m b,
while crude oil experienced a moderate build
of 3.8m b.
The build in crude oil commercial stocks
came as crude oil imports averaged 10.5m b/d
in May, an increase of 292,000 b/d from the
previous month and 132,000 b/d over the same
period last year. Refineries operated at 94.4 per
cent of their operable capacity in May having
recovered from last month’s refinery outages to
stand 2.9 per cent above the previous month.
This corresponds to crude oil refinery inputs
of 15.8m b/d, an increase of 500,000 b/d over
the previous month. In the week ending June
3, US crude oil inventories fell by 3.0m b from
the previous week, an indication of the start of
the driving season.
Traditionally at this period, crude oil stocks
are at their yearly peak, and we could see crude
beginning to be drawn down again. However, at
330.8m b, US crude oil inventories remained
well above the upper end of the average range
for this time of the year. Indeed, crude stocks
were 28.7m b or nine per cent above a year ago,
and 22.4m b or seven per cent more than the
last five-year average.
During the period April 29–June 3, 2005,
gasoline inventories showed a build of 3.1m b
to 216.6m b, mainly due to strong production,
increasing by almost 300,000 b/d to average
9.04m b/d. This build occurred although healthy
demand reached 9.4m b/d, a rise of 2.4 per cent
above the same period last year.
Gasoline stocks were 6.7 per cent above
last year’s level at this time, registering a five
per cent y-o-y surplus. In terms of day cover-
age, gasoline inventories stood at 23.3 days
almost unchanged from last month and could
be considered comfortable at the beginning of
the driving season.Distillate stocks followed the
same pattern as crude and gasoline, building up
by 5.4m b to 107.7m b, close to the level observed
a year ago at this time and two per cent below
the five-year average.
The higher domestic output combined
with relatively lower apparent demand, which
decreased by 110,000 b/d, contributed to this
build. By the week ending June 3, distillate
stocks climbed by 1.3m b compared to the pre-
vious week, with all the increase coming from
low-sulphur distillate fuel (diesel fuel), while
high-sulphur distillate fuel (heavy oil) inven-
tories remained unchanged from the previous
week. Despite being the beginning of the sum-
mer, the lack of growth in heating oil stocks was
seen by many as contributing towards the cur-
rent strength in the front-month NYMEX heat-
ing oil contract.
During the same period, the Strategic
Petroleum Reserve (SPR) continued to fill its
storage capacity of 700m b, increasing by 2.7m
b to 693.9m b, which was 32.5m b above last
year’s level at this time. The US Department of
Energy is still considering whether to boost the
stockpile to 727m b.
Total commercial stocks are now just
about reaching the 1,000m b mark, a total last
seen in the week ending September 20, 2002.
Combined with the SPR approaching 700m b,
total oil has never been higher at 1,700m b (see
Table F).
Western Europe Total oil stocks in Eur-16 (EU plus Norway)
reversed the downward trend observed last
month, increasing by 10.3m b or 340,000 b/d.
Crude oil inventories rose sharply by 12.2m b
to 479.2m b, while product stocks fell by 1.9m
b to 631.6m b. Total oil stocks are now 26.3m
b or 2.4 per cent above this time last year.
The considerable build in crude oil invento-
ries came as major refineries underwent spring
maintenance in preparation for heavy summer
production schedules. Indeed, crude runs fell
90,000 b/d to 11.85m b/d to stand 350,000
b/d below the previous year. This corresponds
to a utilization rate of 90.5 per cent compared
to the downwardly revised April utilization rate
of 91.2 per cent, which was the lowest since
June 2003. Crude oil stocks are now 7.1 per cent
higher than the previous five-year average.
On the product side, gasoline inventories
fell slightly by 800,000 b to 747.7m b, but
remained 10.6m b or 7.7 per cent higher than
a year earlier when refineries extended main-
tenance in preparation for the new product
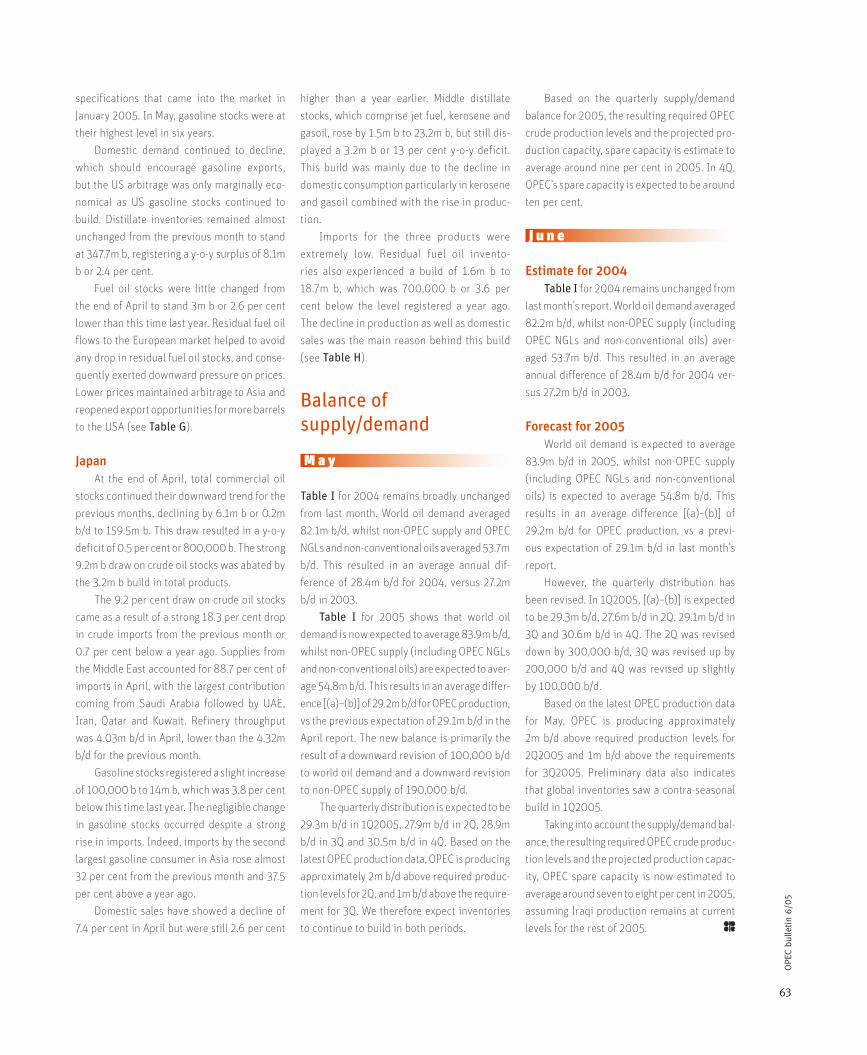
63
OPE
C bu
lleti
n 6/
05
specifications that came into the market in
January 2005. In May, gasoline stocks were at
their highest level in six years.
Domestic demand continued to decline,
which should encourage gasoline exports,
but the US arbitrage was only marginally eco-
nomical as US gasoline stocks continued to
build. Distillate inventories remained almost
unchanged from the previous month to stand
at 347.7m b, registering a y-o-y surplus of 8.1m
b or 2.4 per cent.
Fuel oil stocks were little changed from
the end of April to stand 3m b or 2.6 per cent
lower than this time last year. Residual fuel oil
flows to the European market helped to avoid
any drop in residual fuel oil stocks, and conse-
quently exerted downward pressure on prices.
Lower prices maintained arbitrage to Asia and
reopened export opportunities for more barrels
to the USA (see Table G).
Japan At the end of April, total commercial oil
stocks continued their downward trend for the
previous months, declining by 6.1m b or 0.2m
b/d to 159.5m b. This draw resulted in a y-o-y
deficit of 0.5 per cent or 800,000 b. The strong
9.2m b draw on crude oil stocks was abated by
the 3.2m b build in total products.
The 9.2 per cent draw on crude oil stocks
came as a result of a strong 18.3 per cent drop
in crude imports from the previous month or
0.7 per cent below a year ago. Supplies from
the Middle East accounted for 88.7 per cent of
imports in April, with the largest contribution
coming from Saudi Arabia followed by UAE,
Iran, Qatar and Kuwait. Refinery throughput
was 4.03m b/d in April, lower than the 4.32m
b/d for the previous month.
Gasoline stocks registered a slight increase
of 100,000 b to 14m b, which was 3.8 per cent
below this time last year. The negligible change
in gasoline stocks occurred despite a strong
rise in imports. Indeed, imports by the second
largest gasoline consumer in Asia rose almost
32 per cent from the previous month and 37.5
per cent above a year ago.
Domestic sales have showed a decline of
7.4 per cent in April but were still 2.6 per cent
higher than a year earlier. Middle distillate
stocks, which comprise jet fuel, kerosene and
gasoil, rose by 1.5m b to 23.2m b, but still dis-
played a 3.2m b or 13 per cent y-o-y deficit.
This build was mainly due to the decline in
domestic consumption particularly in kerosene
and gasoil combined with the rise in produc-
tion.
Imports for the three products were
extremely low. Residual fuel oil invento-
ries also experienced a build of 1.6m b to
18.7m b, which was 700,000 b or 3.6 per
cent below the level registered a year ago.
The decline in production as well as domestic
sales was the main reason behind this build
(see Table H).
Balance ofsupply/demand
M a y
Table I for 2004 remains broadly unchanged
from last month. World oil demand averaged
82.1m b/d, whilst non-OPEC supply and OPEC
NGLs and non-conventional oils averaged 53.7m
b/d. This resulted in an average annual dif-
ference of 28.4m b/d for 2004, versus 27.2m
b/d in 2003.
Table I for 2005 shows that world oil
demand is now expected to average 83.9m b/d,
whilst non-OPEC supply (including OPEC NGLs
and non-conventional oils) are expected to aver-
age 54.8m b/d. This results in an average differ-
ence [(a)–(b)] of 29.2m b/d for OPEC production,
vs the previous expectation of 29.1m b/d in the
April report. The new balance is primarily the
result of a downward revision of 100,000 b/d
to world oil demand and a downward revision
to non-OPEC supply of 190,000 b/d.
The quarterly distribution is expected to be
29.3m b/d in 1Q2005, 27.9m b/d in 2Q, 28.9m
b/d in 3Q and 30.5m b/d in 4Q. Based on the
latest OPEC production data, OPEC is producing
approximately 2m b/d above required produc-
tion levels for 2Q, and 1m b/d above the require-
ment for 3Q. We therefore expect inventories
to continue to build in both periods.
Based on the quarterly supply/demand
balance for 2005, the resulting required OPEC
crude production levels and the projected pro-
duction capacity, spare capacity is estimate to
average around nine per cent in 2005. In 4Q,
OPEC’s spare capacity is expected to be around
ten per cent.
J u n e
Estimate for 2004 Table I for 2004 remains unchanged from
last month’s report. World oil demand averaged
82.2m b/d, whilst non-OPEC supply (including
OPEC NGLs and non-conventional oils) aver-
aged 53.7m b/d. This resulted in an average
annual difference of 28.4m b/d for 2004 ver-
sus 27.2m b/d in 2003.
Forecast for 2005 World oil demand is expected to average
83.9m b/d in 2005, whilst non-OPEC supply
(including OPEC NGLs and non-conventional
oils) is expected to average 54.8m b/d. This
results in an average difference [(a)–(b)] of
29.2m b/d for OPEC production, vs a previ-
ous expectation of 29.1m b/d in last month’s
report.
However, the quarterly distribution has
been revised. In 1Q2005, [(a)–(b)] is expected
to be 29.3m b/d, 27.6m b/d in 2Q, 29.1m b/d in
3Q and 30.6m b/d in 4Q. The 2Q was revised
down by 300,000 b/d, 3Q was revised up by
200,000 b/d and 4Q was revised up slightly
by 100,000 b/d.
Based on the latest OPEC production data
for May, OPEC is producing approximately
2m b/d above required production levels for
2Q2005 and 1m b/d above the requirements
for 3Q2005. Preliminary data also indicates
that global inventories saw a contra-seasonal
build in 1Q2005.
Taking into account the supply/demand bal-
ance, the resulting required OPEC crude produc-
tion levels and the projected production capac-
ity, OPEC spare capacity is now estimated to
average around seven to eight per cent in 2005,
assuming Iraqi production remains at current
levels for the rest of 2005.
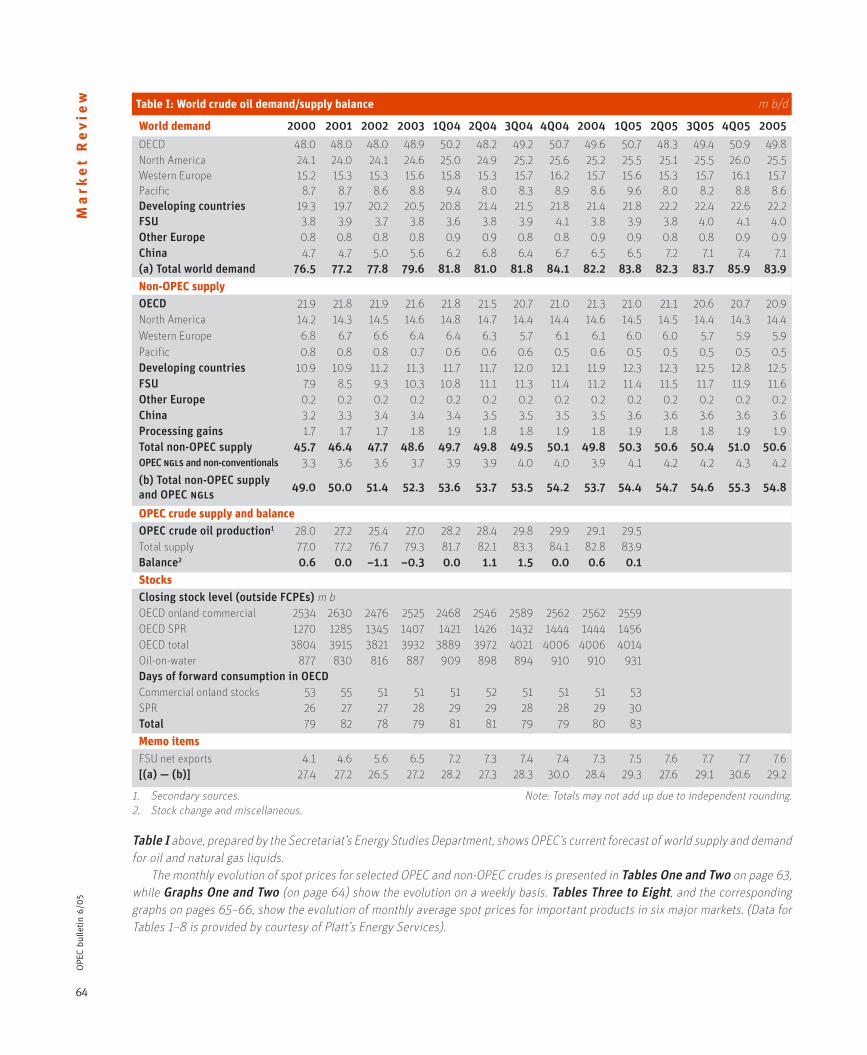
64
OPE
C bu
lleti
n 6/
05M
ark
et
Re
vie
w Table I: World crude oil demand/supply balance m b/d
1. Secondary sources. Note: Totals may not add up due to independent rounding.2. Stock change and miscellaneous.
Table I above, prepared by the Secretariat’s Energy Studies Department, shows OPEC’s current forecast of world supply and demand for oil and natural gas liquids. The monthly evolution of spot prices for selected OPEC and non-OPEC crudes is presented in Tables One and Two on page 63, while Graphs One and Two (on page 64) show the evolution on a weekly basis. Tables Three to Eight, and the corresponding graphs on pages 65–66, show the evolution of monthly average spot prices for important products in six major markets. (Data for Tables 1–8 is provided by courtesy of Platt’s Energy Services).
World demand 2000 2001 2002 2003 1Q04 2Q04 3Q04 4Q04 2004 1Q05 2Q05 3Q05 4Q05 2005
OECD 48.0 48.0 48.0 48.9 50.2 48.2 49.2 50.7 49.6 50.7 48.3 49.4 50.9 49.8North America 24.1 24.0 24.1 24.6 25.0 24.9 25.2 25.6 25.2 25.5 25.1 25.5 26.0 25.5Western Europe 15.2 15.3 15.3 15.6 15.8 15.3 15.7 16.2 15.7 15.6 15.3 15.7 16.1 15.7Pacific 8.7 8.7 8.6 8.8 9.4 8.0 8.3 8.9 8.6 9.6 8.0 8.2 8.8 8.6Developing countries 19.3 19.7 20.2 20.5 20.8 21.4 21.5 21.8 21.4 21.8 22.2 22.4 22.6 22.2FSU 3.8 3.9 3.7 3.8 3.6 3.8 3.9 4.1 3.8 3.9 3.8 4.0 4.1 4.0Other Europe 0.8 0.8 0.8 0.8 0.9 0.9 0.8 0.8 0.9 0.9 0.8 0.8 0.9 0.9China 4.7 4.7 5.0 5.6 6.2 6.8 6.4 6.7 6.5 6.5 7.2 7.1 7.4 7.1(a) Total world demand 76.5 77.2 77.8 79.6 81.8 81.0 81.8 84.1 82.2 83.8 82.3 83.7 85.9 83.9
Non-OPEC supplyOECD 21.9 21.8 21.9 21.6 21.8 21.5 20.7 21.0 21.3 21.0 21.1 20.6 20.7 20.9North America 14.2 14.3 14.5 14.6 14.8 14.7 14.4 14.4 14.6 14.5 14.5 14.4 14.3 14.4Western Europe 6.8 6.7 6.6 6.4 6.4 6.3 5.7 6.1 6.1 6.0 6.0 5.7 5.9 5.9Pacific 0.8 0.8 0.8 0.7 0.6 0.6 0.6 0.5 0.6 0.5 0.5 0.5 0.5 0.5Developing countries 10.9 10.9 11.2 11.3 11.7 11.7 12.0 12.1 11.9 12.3 12.3 12.5 12.8 12.5FSU 7.9 8.5 9.3 10.3 10.8 11.1 11.3 11.4 11.2 11.4 11.5 11.7 11.9 11.6Other Europe 0.2 0.2 0.2 0.2 0.2 0.2 0.2 0.2 0.2 0.2 0.2 0.2 0.2 0.2China 3.2 3.3 3.4 3.4 3.4 3.5 3.5 3.5 3.5 3.6 3.6 3.6 3.6 3.6Processing gains 1.7 1.7 1.7 1.8 1.9 1.8 1.8 1.9 1.8 1.9 1.8 1.8 1.9 1.9Total non-OPEC supply 45.7 46.4 47.7 48.6 49.7 49.8 49.5 50.1 49.8 50.3 50.6 50.4 51.0 50.6OPEC ngls and non-conventionals 3.3 3.6 3.6 3.7 3.9 3.9 4.0 4.0 3.9 4.1 4.2 4.2 4.3 4.2
(b) Total non-OPEC supply and OPEC ngls
49.0 50.0 51.4 52.3 53.6 53.7 53.5 54.2 53.7 54.4 54.7 54.6 55.3 54.8
OPEC crude supply and balanceOPEC crude oil production1 28.0 27.2 25.4 27.0 28.2 28.4 29.8 29.9 29.1 29.5Total supply 77.0 77.2 76.7 79.3 81.7 82.1 83.3 84.1 82.8 83.9Balance2 0.6 0.0 –1.1 –0.3 0.0 1.1 1.5 0.0 0.6 0.1
StocksClosing stock level (outside FCPEs) m bOECD onland commercial 2534 2630 2476 2525 2468 2546 2589 2562 2562 2559OECD SPR 1270 1285 1345 1407 1421 1426 1432 1444 1444 1456OECD total 3804 3915 3821 3932 3889 3972 4021 4006 4006 4014Oil-on-water 877 830 816 887 909 898 894 910 910 931Days of forward consumption in OECDCommercial onland stocks 53 55 51 51 51 52 51 51 51 53SPR 26 27 27 28 29 29 28 28 29 30Total 79 82 78 79 81 81 79 79 80 83
Memo itemsFSU net exports 4.1 4.6 5.6 6.5 7.2 7.3 7.4 7.4 7.3 7.5 7.6 7.7 7.7 7.6[(a) — (b)] 27.4 27.2 26.5 27.2 28.2 27.3 28.3 30.0 28.4 29.3 27.6 29.1 30.6 29.2
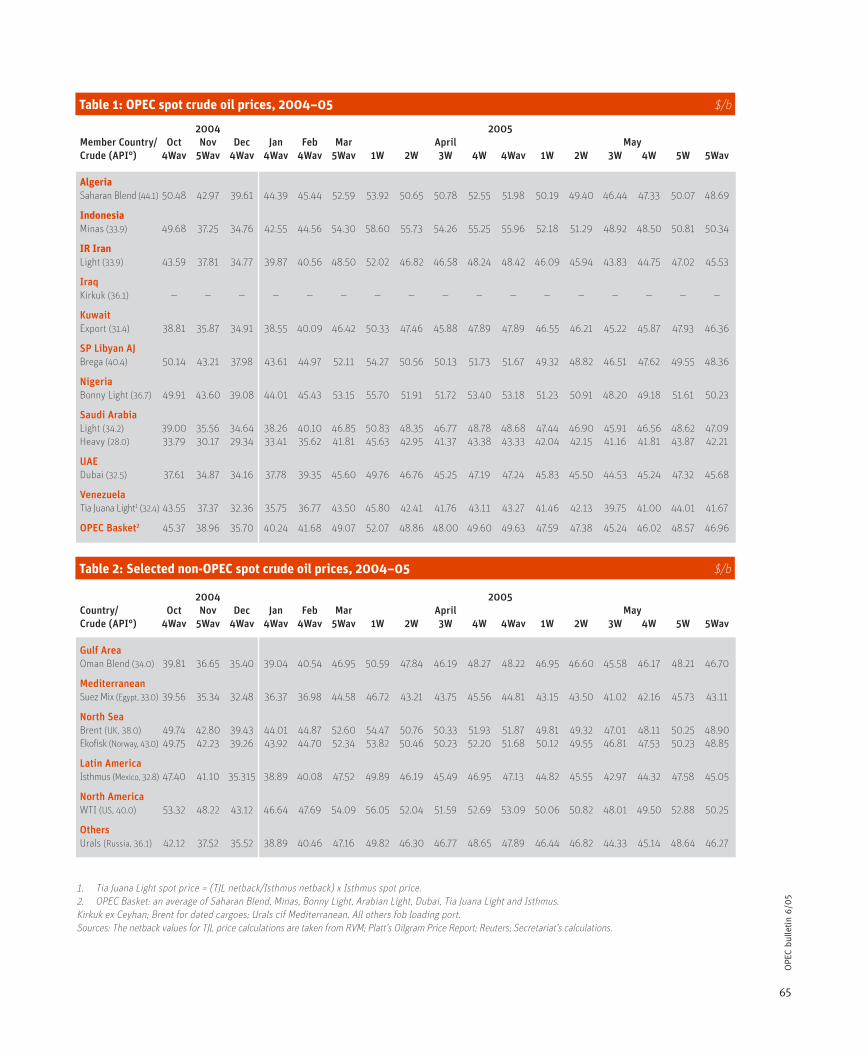
65
OPE
C bu
lleti
n 6/
05
1. Tia Juana Light spot price = (TJL netback/Isthmus netback) x Isthmus spot price.2. OPEC Basket: an average of Saharan Blend, Minas, Bonny Light, Arabian Light, Dubai, Tia Juana Light and Isthmus.Kirkuk ex Ceyhan; Brent for dated cargoes; Urals cif Mediterranean. All others fob loading port.Sources: The netback values for TJL price calculations are taken from RVM; Platt’s Oilgram Price Report; Reuters; Secretariat’s calculations.
2004 2005Member Country/ Oct Nov Dec Jan Feb Mar April MayCrude (API°) 4Wav 5Wav 4Wav 4Wav 4Wav 5Wav 1W 2W 3W 4W 4Wav 1W 2W 3W 4W 5W 5Wav
AlgeriaSaharan Blend (44.1) 50.48 42.97 39.61 44.39 45.44 52.59 53.92 50.65 50.78 52.55 51.98 50.19 49.40 46.44 47.33 50.07 48.69
IndonesiaMinas (33.9) 49.68 37.25 34.76 42.55 44.56 54.30 58.60 55.73 54.26 55.25 55.96 52.18 51.29 48.92 48.50 50.81 50.34
IR IranLight (33.9) 43.59 37.81 34.77 39.87 40.56 48.50 52.02 46.82 46.58 48.24 48.42 46.09 45.94 43.83 44.75 47.02 45.53
IraqKirkuk (36.1) — — — — — — — — — — — — — — — — —
KuwaitExport (31.4) 38.81 35.87 34.91 38.55 40.09 46.42 50.33 47.46 45.88 47.89 47.89 46.55 46.21 45.22 45.87 47.93 46.36
SP Libyan AJBrega (40.4) 50.14 43.21 37.98 43.61 44.97 52.11 54.27 50.56 50.13 51.73 51.67 49.32 48.82 46.51 47.62 49.55 48.36
NigeriaBonny Light (36.7) 49.91 43.60 39.08 44.01 45.43 53.15 55.70 51.91 51.72 53.40 53.18 51.23 50.91 48.20 49.18 51.61 50.23
Saudi ArabiaLight (34.2) 39.00 35.56 34.64 38.26 40.10 46.85 50.83 48.35 46.77 48.78 48.68 47.44 46.90 45.91 46.56 48.62 47.09Heavy (28.0) 33.79 30.17 29.34 33.41 35.62 41.81 45.63 42.95 41.37 43.38 43.33 42.04 42.15 41.16 41.81 43.87 42.21
UAEDubai (32.5) 37.61 34.87 34.16 37.78 39.35 45.60 49.76 46.76 45.25 47.19 47.24 45.83 45.50 44.53 45.24 47.32 45.68
VenezuelaTia Juana Light1 (32.4) 43.55 37.37 32.36 35.75 36.77 43.50 45.80 42.41 41.76 43.11 43.27 41.46 42.13 39.75 41.00 44.01 41.67
OPEC Basket2 45.37 38.96 35.70 40.24 41.68 49.07 52.07 48.86 48.00 49.60 49.63 47.59 47.38 45.24 46.02 48.57 46.96
2004 2005Country/ Oct Nov Dec Jan Feb Mar April MayCrude (API°) 4Wav 5Wav 4Wav 4Wav 4Wav 5Wav 1W 2W 3W 4W 4Wav 1W 2W 3W 4W 5W 5Wav
Gulf AreaOman Blend (34.0) 39.81 36.65 35.40 39.04 40.54 46.95 50.59 47.84 46.19 48.27 48.22 46.95 46.60 45.58 46.17 48.21 46.70
MediterraneanSuez Mix (Egypt, 33.0) 39.56 35.34 32.48 36.37 36.98 44.58 46.72 43.21 43.75 45.56 44.81 43.15 43.50 41.02 42.16 45.73 43.11
North SeaBrent (UK, 38.0) 49.74 42.80 39.43 44.01 44.87 52.60 54.47 50.76 50.33 51.93 51.87 49.81 49.32 47.01 48.11 50.25 48.90Ekofisk (Norway, 43.0) 49.75 42.23 39.26 43.92 44.70 52.34 53.82 50.46 50.23 52.20 51.68 50.12 49.55 46.81 47.53 50.23 48.85
Latin AmericaIsthmus (Mexico, 32.8) 47.40 41.10 35.315 38.89 40.08 47.52 49.89 46.19 45.49 46.95 47.13 44.82 45.55 42.97 44.32 47.58 45.05
North AmericaWTI (US, 40.0) 53.32 48.22 43.12 46.64 47.69 54.09 56.05 52.04 51.59 52.69 53.09 50.06 50.82 48.01 49.50 52.88 50.25
OthersUrals (Russia, 36.1) 42.12 37.52 35.52 38.89 40.46 47.16 49.82 46.30 46.77 48.65 47.89 46.44 46.82 44.33 45.14 48.64 46.27
Table 1: OPEC spot crude oil prices, 2004–05 $/b
Table 2: Selected non-OPEC spot crude oil prices, 2004–05 $/b
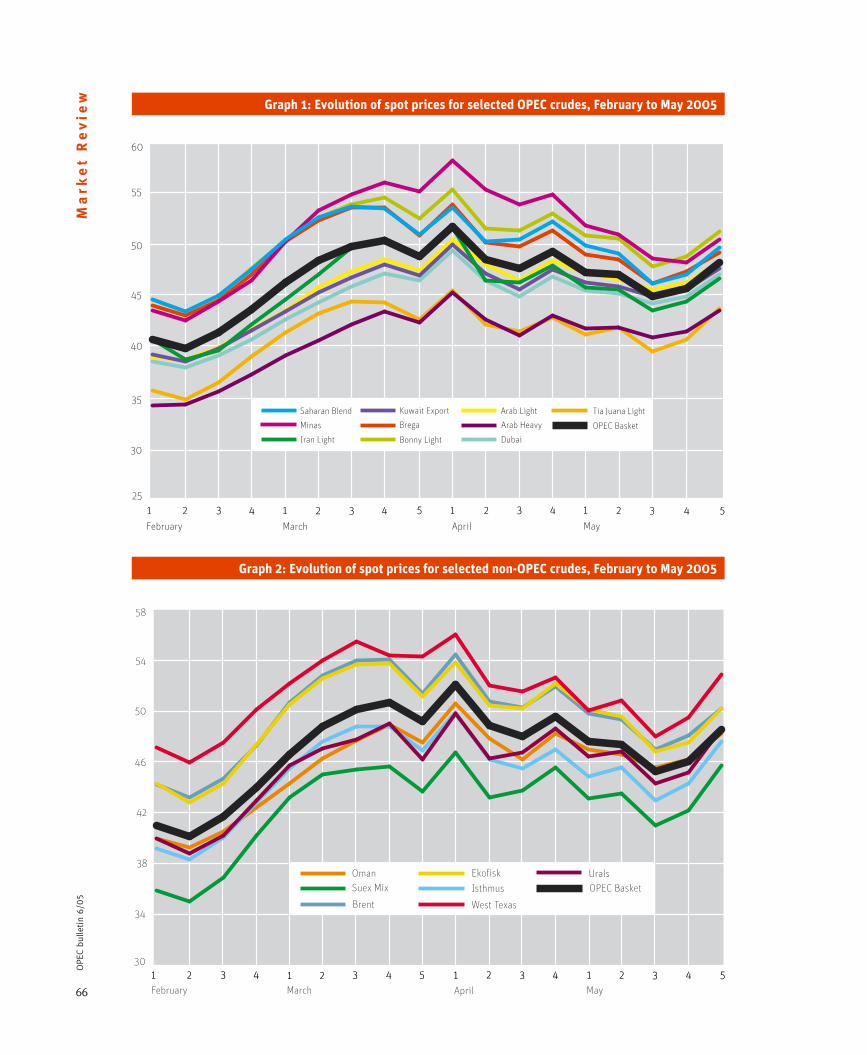
66
OPE
C bu
lleti
n 6/
05M
ark
et
Re
vie
w
��
��
��
��
��
��
��
��
���������������������
����������������
����������
�������
�������
�����
������������
�� �� �� �� �� �� �� �� �� �� �� �� �� �� �� �� ����
��
��
��
��
��
��
��
��
�����������
���������������
�����
����������
����������
�����������
�����
�������������
����������
�����
�������������
���������������������
�� �� �� �� �� �� �� �� �� �� �� �� �� �� �� �� ����
Graph 1: Evolution of spot prices for selected OPEC crudes, February to May 2005
Graph 2: Evolution of spot prices for selected non-OPEC crudes, February to May 2005
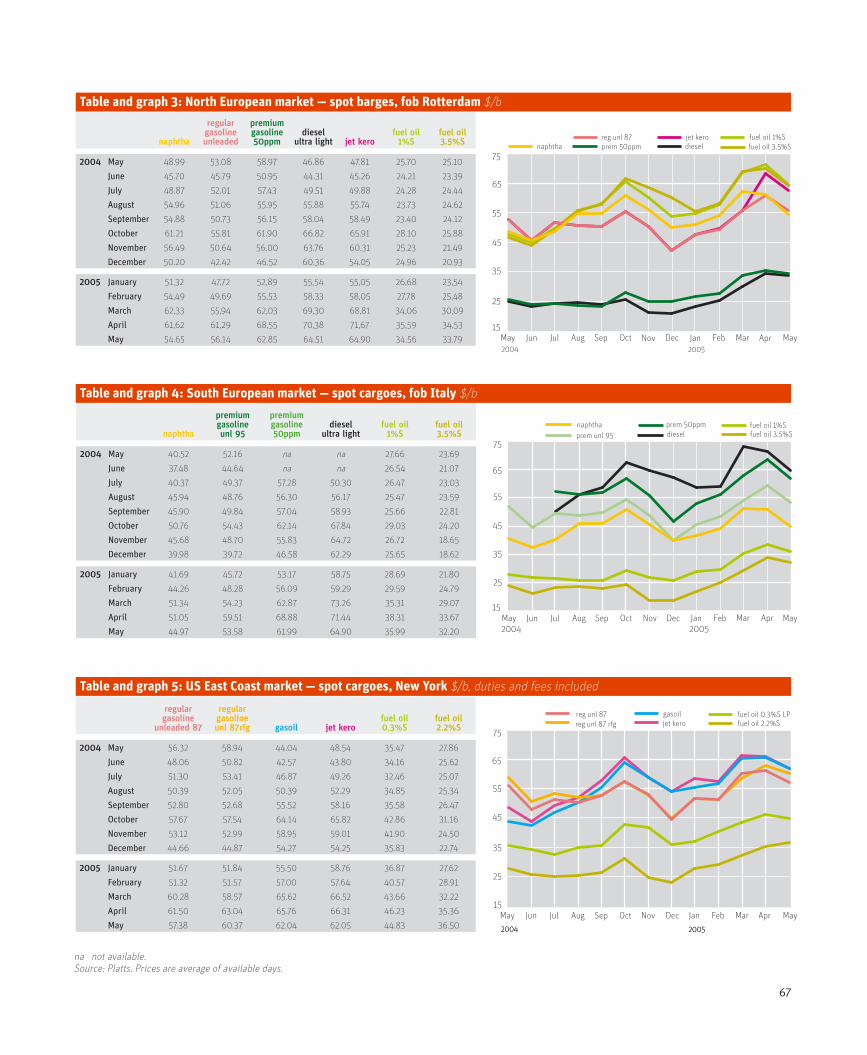
67
naphtha
regular gasoline unleaded
premium gasoline 50ppm
dieselultra light jet kero
fuel oil1%S
fuel oil3.5%S
2004 May 48.99 53.08 58.97 46.86 47.81 25.70 25.10
June 45.70 45.79 50.95 44.31 45.26 24.21 23.39
July 48.87 52.01 57.43 49.51 49.88 24.28 24.44
August 54.96 51.06 55.95 55.88 55.74 23.73 24.62
September 54.88 50.73 56.15 58.04 58.49 23.40 24.12
October 61.21 55.81 61.90 66.82 65.91 28.10 25.88
November 56.49 50.64 56.00 63.76 60.31 25.23 21.49
December 50.20 42.42 46.52 60.36 54.05 24.96 20.93
2005 January 51,32 47,72 52,89 55,54 55,05 26,68 23,54
February 54,49 49,69 55,53 58,33 58,05 27,78 25,48
March 62,33 55,94 62,03 69,30 68,81 34,06 30,09
April 61,62 61,29 68,55 70,38 71,67 35,59 34,53
May 54.65 56.14 62.85 64.51 64.90 34.56 33.79
Table and graph 5: US East Coast market — spot cargoes, New York $/b, duties and fees included
naphtha
premium gasoline unl 95
premium gasoline50ppm
diesel ultra light
fuel oil1%S
fuel oil3.5%S
2004 May 40.52 52.16 na na 27.66 23.69
June 37.48 44.64 na na 26.54 21.07
July 40.37 49.37 57.28 50.30 26.47 23.03
August 45.94 48.76 56.30 56.17 25.47 23.59
September 45.90 49.84 57.04 58.93 25.66 22.81
October 50.76 54.43 62.14 67.84 29.03 24.20
November 45.68 48.70 55.83 64.72 26.72 18.65
December 39.98 39.72 46.58 62.29 25.65 18.62
2005 January 41.69 45.72 53.17 58.75 28.69 21.80
February 44.26 48.28 56.09 59.29 29.59 24.79
March 51.34 54.23 62.87 73.26 35.31 29.07
April 51.05 59.51 68.88 71.44 38.31 33.67
May 44.97 53.58 61.99 64.90 35.99 32.20
regular gasoline
unleaded 87
regular gasoline unl 87rfg gasoil jet kero
fuel oil0.3%S
fuel oil2.2%S
2004 May 56.32 58.94 44.04 48.54 35.47 27.86
June 48.06 50.82 42.57 43.80 34.16 25.62
July 51.30 53.41 46.87 49.26 32.46 25.07
August 50.39 52.05 50.39 52.29 34.85 25.34
September 52.80 52.68 55.52 58.16 35.58 26.47
October 57.67 57.54 64.14 65.82 42.86 31.16
November 53.12 52.99 58.95 59.01 41.90 24.50
December 44.66 44.87 54.27 54.25 35.83 22.74
2005 January 51.67 51.84 55.50 58.76 36.87 27.62
February 51.32 51.57 57.00 57.64 40.57 28.91
March 60.28 58.57 65.62 66.52 43.66 32.22
April 61.50 63.04 65.76 66.31 46.23 35.36
May 57.38 60.37 62.04 62.05 44.83 36.50
Table and graph 3: North European market — spot barges, fob Rotterdam $/b
Table and graph 4: South European market — spot cargoes, fob Italy $/b
��
��
��
��
��
��
������������������������������������
��������������������������
�������
�������������������������������������������� ����
�����������������
��
��
��
��
��
��
����������������������������
����������������
������������������
���������������������������������������
�����������������
���� ����
��
��
��
��
��
��
���������������������������������
��������������
�������������������������
���������������������������������������
��������������������
�������� ��������
na not available.Source: Platts. Prices are average of available days.
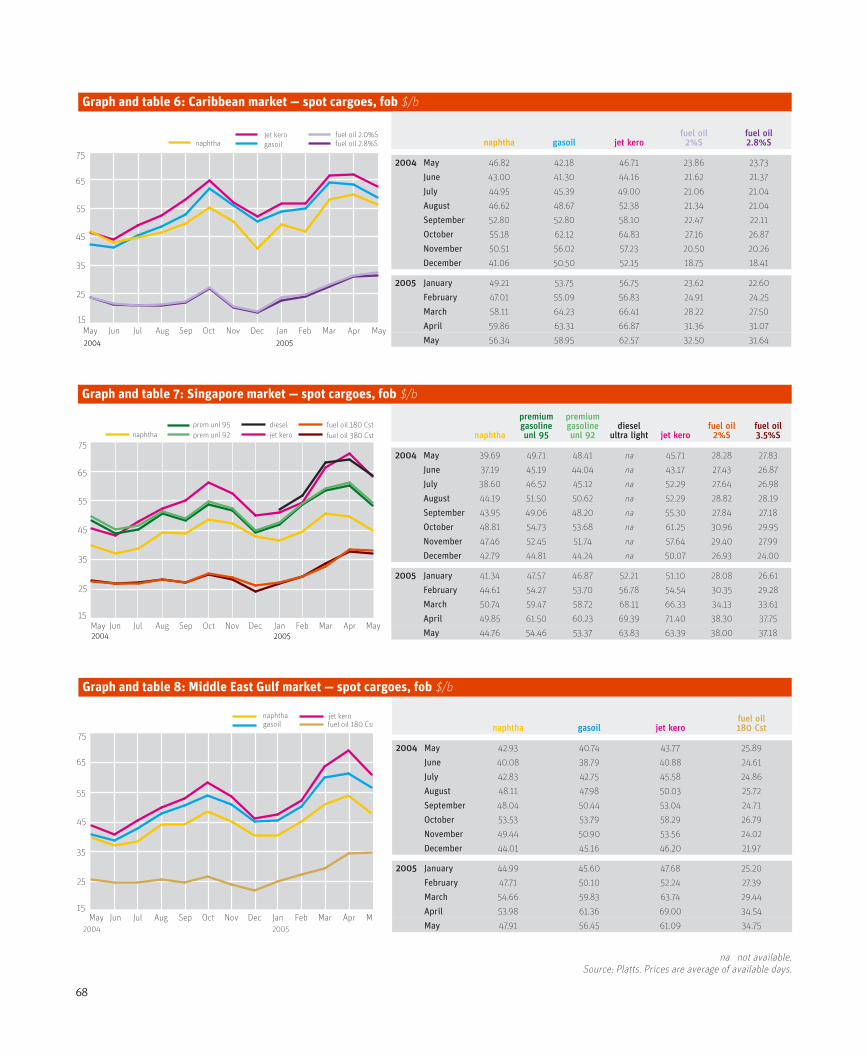
68
Graph and table 6: Caribbean market — spot cargoes, fob $/b
Graph and table 7: Singapore market — spot cargoes, fob $/b
Graph and table 8: Middle East Gulf market — spot cargoes, fob $/b
naphtha gasoil jet kerofuel oil
2%Sfuel oil2.8%S
2004 May 46.82 42.18 46.71 23.86 23.73
June 43.00 41.30 44.16 21.62 21.37
July 44.95 45.39 49.00 21.06 21.04
August 46.62 48.67 52.38 21.34 21.04
September 52.80 52.80 58.10 22.47 22.11
October 55.18 62.12 64.83 27.16 26.87
November 50.51 56.02 57.23 20.50 20.26
December 41.06 50.50 52.15 18.75 18.41
2005 January 49.21 53.75 56.75 23.62 22.60
February 47.01 55.09 56.83 24.91 24.25
March 58.11 64.23 66.41 28.22 27.50
April 59.86 63.31 66.87 31.36 31.07
May 56.34 58.95 62.57 32.50 31.64
naphtha
premium gasoline unl 95
premium gasoline unl 92
dieselultra light jet kero
fuel oil2%S
fuel oil3.5%S
2004 May 39.69 49.71 48.41 na 45.71 28.28 27.83
June 37.19 45.19 44.04 na 43.17 27.43 26.87
July 38.60 46.52 45.12 na 52.29 27.64 26.98
August 44.19 51.50 50.62 na 52.29 28.82 28.19
September 43.95 49.06 48.20 na 55.30 27.84 27.18
October 48.81 54.73 53.68 na 61.25 30.96 29.95
November 47.46 52.45 51.74 na 57.64 29.40 27.99
December 42.79 44.81 44.24 na 50.07 26.93 24.00
2005 January 41.34 47.57 46.87 52.21 51.10 28.08 26.61
February 44.61 54.27 53.70 56.78 54.54 30.35 29.28
March 50.74 59.47 58.72 68.11 66.33 34.13 33.61
April 49.85 61.50 60.23 69.39 71.40 38.30 37.75
May 44.76 54.46 53.37 63.83 63.39 38.00 37.18
naphtha gasoil jet kerofuel oil180 Cst
2004 May 42.93 40.74 43.77 25.89
June 40.08 38.79 40.88 24.61
July 42.83 42.75 45.58 24.86
August 48.11 47.98 50.03 25.72
September 48.04 50.44 53.04 24.71
October 53.53 53.79 58.29 26.79
November 49.44 50.90 53.56 24.02
December 44.01 45.16 46.20 21.97
2005 January 44.99 45.60 47.68 25.20
February 47.71 50.10 52.24 27.39
March 54.66 59.83 63.74 29.44
April 53.98 61.36 69.00 34.54
May 47.91 56.45 61.09 34.75
na not available.Source: Platts. Prices are average of available days.
��
��
��
��
��
��
��������������������������������������
�������������
���������������������������������������
�����������������
�������� ��������
��
��
��
��
��
��
����������������������������������
��������������
����������������������
�������
�����������������������������������������������
�����������
��������
��
��
��
��
��
��
��������������������������
�������������
���������������������������������������
���������������
���� ����

69
OPE
C bu
lleti
n 6/
05
Fuad Al-Zayerhas been appointed the new head of OPEC’s
Data Services Department. He replaces Dr
Muhammed Al-Tayyeb who has come to the
end of his five-year term of office. Al-Zayer
officially assumed his new responsibilities on
July 4, 2005.
Al-Zayer joins OPEC from Saudi Aramco
where he has worked for the last 20 years pro-
viding IT and Data Services Solutions to the
company. Fuad has extensive management
experience and prior to that worked as an
Information Technology (IT) engineer for the
Arabian Bechtel Company in Saudi Arabia.
During his career at Saudi Aramco, Al-Zayer
worked in several departments in the IT and
Data Services area — most recently as IT Senior
Consultant in the IT Planning Division where
he was leading a corporate team to develop
the Saudi Aramco Master Plan for IT. He also
worked in the Corporate Planning Department
as part of a corporate team to develop Saudi
Aramco’s Five-Year Business Plan and was part
of the corporate initiative to strengthen the
Strategic Planning element at Saudi Aramco.
Fuad has extensive experience in provid-
O P E C n a m e s n e w h e a d o f d a t a
ing IT Technology and Data Services in the Oil
Business. He also worked briefly in the United
Kingdom where he was responsible for the engi-
neering of a portion of a multi-billion dollar
refinery project. Fuad also worked at Aramco
Services Company in the United States, pro-
viding technical support to the IT organization
as a technology link to the North American IT
products and services marketplace. Al-Zayer
holds a Bachelor of Science degree in Electrical
Engineering received in 1981 from Bradley
University in the US and a Masters in Industrial
Management received in 1982 from the Central
Michigan University also in the US.
He is a senior member of the Institute
of Electrical and Electronic Engineers and
has given different presentations on IT, Data
Services and on the subject of Strategic
Planning at various international forums.
Married with three children, aged 17, 16
and nine, Al-Zayer enjoys reading, writing,
classical music and sports and is looking for-
ward to a productive and dynamic assignment
at the OPEC Secretariat and an enriching cul-
tural experience living in Austria.
Se
cre
tari
at
No
tes

70
OPE
C bu
lleti
n 6/
05N
oti
ce
bo
ard
Introduction to the natural gas industry … from wellhead to burner-tip, July 18–19, 2005, Calgary, Canada. Details: Canadian Energy Research Institute, #150, 3512–33 Street, NW Calgary T2L 2A6, Canada. Tel: +1 403 220 2357; fax: +1 403 284 181; e-mail: [email protected]; Web site: www.ceri.ca.
Corrosion monitoring, prevention and control, July 18–19, 2005, Kuala Lumpur, Malaysia. Details: Centre for Management Technology, Lot 7.03, 7th Floor, North Block, The Ampwalk, 218 Jalan Ampang, 50450 Kuala Lumpur, Malaysia. Tel: +60 3 2162 7322; fax: +60 3 2162 6393; e-mail: [email protected]; Web site: www.cmtevents.com.
Contract risk management in upstream oil and gas, July 19–20, 2005, Houston, TX, USA. Details: IQPC Worldwide Ltd, 555 Route 1 South Iselin, NJ 08830 USA. Tel: +1 973 256 0211; fax: +1 973 256 0205; e-mail: [email protected]; Web site: www.oilandgasiq.com/2476a.
Multilateral wells, July 24–27, 2005, Bangkok, Thailand. Details: Society of Petroleum Engineers, Suite B–11–11, Level 11, Block B, Plaza Mont’Kiara, Jalan Bukit Kiara, Mont’Kiara, Kuala Lumpur 50480, Malaysia. Tel: +60 3 6201 2330; fax: +60 3 6201 3220; e-mail: [email protected]; Web site: www.spe.org.
Continuous distillation in the refining and petrochemical indus-try, July 25–26, 2005, Kuala Lumpur, Malaysia. Details: Centre for Management Technology, Lot 7.03, 7th Floor, North Block, The Ampwalk, 218 Jalan Ampang, 50450 Kuala Lumpur, Malaysia. Tel: +60 3 2162 7322; fax: +60 3 2162 6393; e-mail: [email protected]; Web site: www.cmtevents.com.
Oil and gas mini MBA, July 25–August 5, 2005, London, UK. Details: CWC School for Energy Ltd, 3 Tyers Gate, London SE1 3HX, UK. Tel: +44 20 7089 4200; fax: +44 20 7089 4201; e-mail: [email protected]; Web site:www.thecwcgroup.com.
LNG terminals China, July 26–27, 2005, Guangzhou City, China. Details: IQPC Worldwide Pte Ltd, 1 Shenton Way #13–07, 068803 Singapore. Tel: +65 6722 9388; fax: +65 6720 3804; e-mail: [email protected]; Web site: www.iqpc.com.sg/AS-3105.
Drilling fluids and cuttings management, July 26–27, 2005, Houston, TX, USA. Details: IQPC Worldwide Ltd, 555 Route 1 South Iselin, NJ 08830, USA. Tel: +1 973 256 0211; fax: +1 973 256 0205; e-mail: [email protected]; Web site: www.oilandgasiq.com.
Sand control and management US 2005, July 26–27, 2005, Houston, TX, USA. Details: IQPC Worldwide Ltd, 150 Clove Road, PO Box 401, Little Falls, 07424–0401, USA. Tel: +1 973 256 0211; fax: +1 973 256 0205; e-mail: [email protected]; Web site: www.oil-andgasIQ.com/2446a.
Unconventional gas, July 26–27, 2005, Houston, TX, USA. Details: IQPC Worldwide Ltd, 555 Route 1 South Iselin, NJ 08830, USA. Tel: +1
973 256 0211; fax: +1 973 256 0205; e-mail: [email protected]; Web site: www.oilandgasiq.com.
Strategic asset management, July 26–27, 2005, Kuala Lumpur, Malaysia. Details: Centre for Management Technology, Lot 7.03, 7th
Floor, North Block, The Ampwalk, 218 Jalan Ampang, 50450 Kuala Lumpur, Malaysia. Tel: +60 3 2162 7322; fax: +60 3 2162 6393; e-mail: [email protected]; Web site: www.cmtevents.com.
Drilling safety management in oil and gas, July 26–27, 2005, Kuala Lumpur, Malaysia. Details: IQPC Worldwide Pte Ltd, 1 Shenton Way #13–07, 068803 Singapore. Tel: +65 6722 9388; fax: +65 6720 3804; e-mail: [email protected]; Web site: www.iqpc.com.
Reducing exploratory uncertainty through effective basin anal-ysis, July 26–27, 2005, Kuala Lumpur, Malaysia. Details: IQPC Worldwide Pte Ltd, 1 Shenton Way #13–07, 068803 Singapore. Tel: +65 6722 9388; fax: +65 6720 3804; e-mail: [email protected]; Web site: www.iqpc.com.sg/AS-3095.
Wellbore stability in challenging reservoirs, July 28–29, 2005, Aberdeen, UK. Details: IQPC Worldwide Ltd, Anchor House, 15–19 Britten Street, London SW3 3QL, UK. Tel: +44 20 7368 9300; fax: +44 20 7368 9301; e-mail: [email protected]; Web site: www.oil-andgasIQ.com/2494a.
Upstream government petroleum contracts, August 1–2, 2005, Rio de Janeiro, Brazil. Details: The Conference Connection Inc, PO Box 1736, Raffles City, 911758 Singapore. Tel: +65 6222 0230; fax: +65 6222 0121; e-mail: [email protected]; Web site: www.cconnection.org.
Production sharing contracts and international petroleum fis-cal systems, August 3–5, 2005, Rio de Janeiro, Brazil. Details: The Conference Connection Inc, PO Box 1736, Raffles City, 911758 Singapore. Tel: +65 6222 0230; fax: +65 6222 0121; e-mail: [email protected].
Natural gas market fundamentals, August 8–9, 2005, Calgary, Canada. Details: Canadian Energy Research Institute, #150, 3512–33 Street, NW Calgary T2L 2A6, Canada. Tel: +1 403 220 2357; fax: +1 403 284 4181; e-mail: [email protected]; Web site: www.ceri.ca/Training.
Petrochemicals — from economics to markets, August 10–11, 2005, Singapore. Details: Centre for Management Technology, 80 Marine Parade Rd, #13–02 Parkway Parade, 449269 Singapore. Tel: +65 6345 7322; fax: +65 6345 5928; e-mail: [email protected]; Web site: www.cmtevents.com.
Call for papers
2nd Kuwait international petroleum conference and exhibition, KIPCE 2005, December 10–12, 2005, Kuwait City, Kuwait. Details: Department of Petroleum Engineering, Kuwait University, PO Box 5969, Safat 13060, Kuwait. Tel: +965 481 1188-5212; fax: +965 484 9558; e-mail: [email protected]; Web site: www.kipce.net.
Forthcoming events
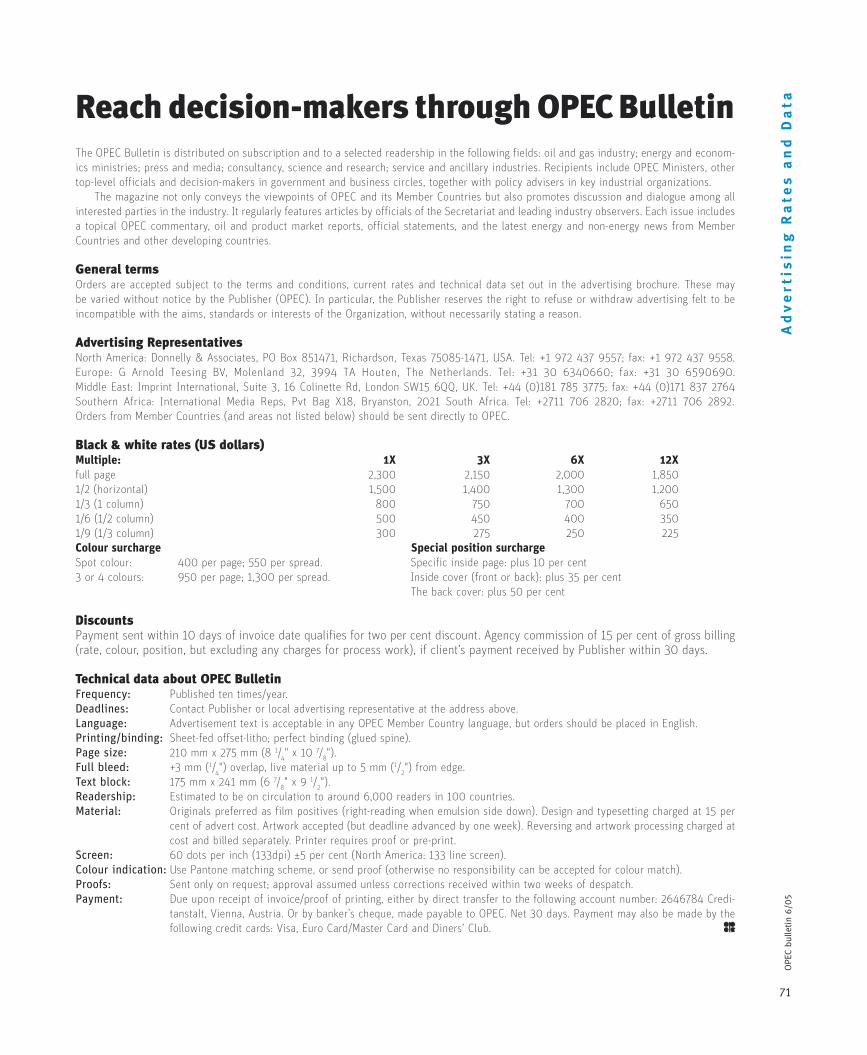
71
OPE
C bu
lleti
n 6/
05A
dv
ert
isin
g R
ate
s a
nd
Da
taReach decision-makers through OPEC BulletinThe OPEC Bulletin is distributed on subscription and to a selected readership in the following fields: oil and gas industry; energy and econom-ics ministries; press and media; consultancy, science and research; service and ancillary industries. Recipients include OPEC Ministers, other top-level officials and decision-makers in government and business circles, together with policy advisers in key industrial organizations. The magazine not only conveys the viewpoints of OPEC and its Member Countries but also promotes discussion and dialogue among all interested parties in the industry. It regularly features articles by officials of the Secretariat and leading industry observers. Each issue includes a topical OPEC commentary, oil and product market reports, official statements, and the latest energy and non-energy news from Member Countries and other developing countries.
General termsOrders are accepted subject to the terms and conditions, current rates and technical data set out in the advertising brochure. These may be varied without notice by the Publisher (OPEC). In particular, the Publisher reserves the right to refuse or withdraw advertising felt to be incompatible with the aims, standards or interests of the Organization, without necessarily stating a reason.
Advertising RepresentativesNorth America: Donnelly & Associates, PO Box 851471, Richardson, Texas 75085-1471, USA. Tel: +1 972 437 9557; fax: +1 972 437 9558.Europe: G Arnold Teesing BV, Molenland 32, 3994 TA Houten, The Netherlands. Tel: +31 30 6340660; fax: +31 30 6590690.Middle East: Imprint International, Suite 3, 16 Colinette Rd, London SW15 6QQ, UK. Tel: +44 (0)181 785 3775; fax: +44 (0)171 837 2764Southern Africa: International Media Reps, Pvt Bag X18, Bryanston, 2021 South Africa. Tel: +2711 706 2820; fax: +2711 706 2892.Orders from Member Countries (and areas not listed below) should be sent directly to OPEC.
Black & white rates (US dollars)Multiple: 1X 3X 6X 12Xfull page 2,300 2,150 2,000 1,8501/2 (horizontal) 1,500 1,400 1,300 1,2001/3 (1 column) 800 750 700 6501/6 (1/2 column) 500 450 400 3501/9 (1/3 column) 300 275 250 225Colour surcharge Special position surchargeSpot colour: 400 per page; 550 per spread. Specific inside page: plus 10 per cent 3 or 4 colours: 950 per page; 1,300 per spread. Inside cover (front or back): plus 35 per cent The back cover: plus 50 per cent
DiscountsPayment sent within 10 days of invoice date qualifies for two per cent discount. Agency commission of 15 per cent of gross billing (rate, colour, position, but excluding any charges for process work), if client’s payment received by Publisher within 30 days.
Technical data about OPEC BulletinFrequency: Published ten times/year.Deadlines: Contact Publisher or local advertising representative at the address above.Language: Advertisement text is acceptable in any OPEC Member Country language, but orders should be placed in English.Printing/binding: Sheet-fed offset-litho; perfect binding (glued spine).Page size: 210 mm x 275 mm (8 1/
4" x 10 7/
8").
Full bleed: +3 mm (1/4") overlap, live material up to 5 mm (1/
2") from edge.
Text block: 175 mm x 241 mm (6 7/8" x 9 1/
2").
Readership: Estimated to be on circulation to around 6,000 readers in 100 countries.Material: Originals preferred as film positives (right-reading when emulsion side down). Design and typesetting charged at 15 per
cent of advert cost. Artwork accepted (but deadline advanced by one week). Reversing and artwork processing charged at cost and billed separately. Printer requires proof or pre-print.
Screen: 60 dots per inch (133dpi) ±5 per cent (North America: 133 line screen).Colour indication: Use Pantone matching scheme, or send proof (otherwise no responsibility can be accepted for colour match).Proofs: Sent only on request; approval assumed unless corrections received within two weeks of despatch.Payment: Due upon receipt of invoice/proof of printing, either by direct transfer to the following account number: 2646784 Credi-
tanstalt, Vienna, Austria. Or by banker’s cheque, made payable to OPEC. Net 30 days. Payment may also be made by the following credit cards: Visa, Euro Card/Master Card and Diners’ Club.
72
OPE
C bu
lleti
n 6/
05O
rde
r F
orm OPEC Annual Statistical Bulletin 2003
This 144-page book, including colour graphs and tables, comes with a CD-ROM featuring all the data in the book and more (for Microsoft Windows only).
The book with CD-ROM package costs $85.
❐ Please send me ................. copies of the OPEC Annual Statistical Bulletin 2003 (book plus CD-ROM)
OPEC Bulletinis published ten times/year and a subscription costs $70. Subscription commences with the current issue (unless otherwise requested) after receipt of
payment.
❐ I wish to subscribe to the OPEC Bulletin for a one-year period
OPEC Monthly Oil Market ReportPublished monthly, this source of key information about OPEC Member Country output also contains the Secretariat’s analyses of oil and product price
movements, futures markets, the energy supply/demand balance, stock movements and global economic trends. $525 per year for an annual subscription
of 12 issues.
❐ I wish to subscribe to the MOMR for a one-year period ❐ Please send me a sample copy
OPEC Reviewcontains research papers by international experts on energy, the oil market, economic development and the environment.
Available quarterly only from the commercial publisher.
For details contact: Blackwell Publishing Ltd, 9600 Garsington Road, Oxford OX4 2DQ, UK.
Tel: +44 (0)1865 776868; fax: +44 (0)1865 714591; e-mail: [email protected]; www.blackwellpublishing.com.
Institutional subscribers £265/yr (North/South America $429); Individuals £117/yr (North/South America $126).
Shipping address (please print in block letters): Invoicing address (if different from shipping address):
Name: Name:Address: Address:
How to pay:Invoice me ❐ Credit card ❐ (Visa, Eurocard/MasterCard and Diners Club)Credit card company: Credit card no: Expiry date:
Holder: Signature:
Please mail this form to: PR & Information Department or telefax to:OPEC Secretariat PR & Information Department Obere Donaustrasse 93, A-1020 Vienna, Austria +43 1 214 98 27
All prices include airmail delivery. Windows™ is a trademark of the Microsoft Corporation
OP
EC
Pu
bli
ca
tio
nsOPEC offers a range of publications that reflect its activities. Single copies and subscrip-
tions can be obtained by contacting this Department, which regular readers shouldalso notify in the event of a change of address:
PR & Information Department, OPEC SecretariatObere Donaustrasse 93, A-1020 Vienna, AustriaTel: +43 1 211 12-0; fax: +43 1 214 98 27; e-mail: [email protected]
OPEC Monthly Oil Market Report
Crude oil and product prices analysis Member Country output figures Stocks and supply/demand analysisAnnual subscription $525 (12 issues)
To order, please fill in the form
Annual Report 2003Free of charge
OPEC Review(published quarterly)
annual subscription rates for 2004: Institutional subscribers £265/yr
(North/South America $429);Individuals £117/yr
(North/South America $126).Orders and enquiries:
Blackwell Publishing Journals, 9600 Garsington Road,
Oxford OX4 2DQ, UK.Tel: +44 (0)1865 776868; fax: +44
(0)1865 714591;e-mail: jnlinfo@
blackwellpublishers.co.uk;www.blackwellpublishing.com
OPEC Annual Statistical Bulletin 2003144-page book with CD-ROM
Single issue $85The CD-ROM (for Microsoft
Windows only) contains all thedata in the book and much more.
• Easy to install and display• Easy to manipulate and query
• Easy to export to spreadsheets such as Excel
OPEC BulletinAnnual subscription $70
Vol XXIX, No 2 June 2005
Towards a more coherent oil policy in Russia?
Energy conservation:an alternative for investment
in the oil sector forOPEC Member Countries
Energy partnership: China and the Gulf States
Explaining the so-called “price premium” in oil markets
Sadek Boussena and Catherine Locatelli
Mehrzad Zamani
Gawdat Bahgat
Antonio Merino and Álvaro Ortiz