Embed Size (px)
Citation preview
June 14, 2001 1 of 38
Technical Charting
By Leeland Artra
June 14, 2001 2 of 38
Why am I here?
• Wrote Navy Top Quality Leadership requirements for “Systems Operators”
• Wrote more then a few policies, procedures and computing site manuals
• Have a CPA for a Mother (made me keep my own books since I was 7).
• Hacker for 16 years.• Systems Admin for 16 yrs.• Programmer for 8 years.
June 14, 2001 3 of 38
So Why Are You Here?
• Learn about various types of documentation methods.
• Have a good idea of what type of document should be used for various situations.
• Understand how various business and technical documents interrelate.
• Know where to go for more detailed information.
June 14, 2001 4 of 38
Do You Wonder
• Why programs and systems are now not really worth using until the third or forth major release?
• Why you and your colleagues always seem to be 20 hours or more behind while working so many extra hours?
• Why fire control management of time and resources is reaching epidemic proportions?

June 14, 2001 5 of 38
Its Simple
You wish the industry would
“Do what I want,
not what I do.”
June 14, 2001 6 of 38
What do you Mean by that!
Things are just not getting done effectively.This is because:• Time to completion is given unrealistically
high priority (because)• Time for “delivery of profits” is set
unreasonably soon
This is creating a ‘Just get it done.’ Environment.
June 14, 2001 7 of 38
So What?
• My point exactly.
• Back to work.
June 14, 2001 8 of 38
OK, But What Can Be Done?
• Fix the attitude, get a “release is important, but doing it correctly is more important.”
• Recognize that deadlines are usually just random guesses that can be changed.
• Work better.
June 14, 2001 9 of 38
Work Better? How?
By doing something that is very hard:
• Become self disciplined to think things through.
• Become self disciplined to plan things out well (technical specifications, flowcharts, project descriptions, procedural manuals)
Good planning and using technical charts has never been easy. But, it has historically been worth the effort.
June 14, 2001 10 of 38
So Why Are You Here Really?
June 14, 2001 11 of 38
Because, Grandpa always said
Prior Proper Planning
Prevents Poor Performance
June 14, 2001 12 of 38
Ouch
June 14, 2001 13 of 38
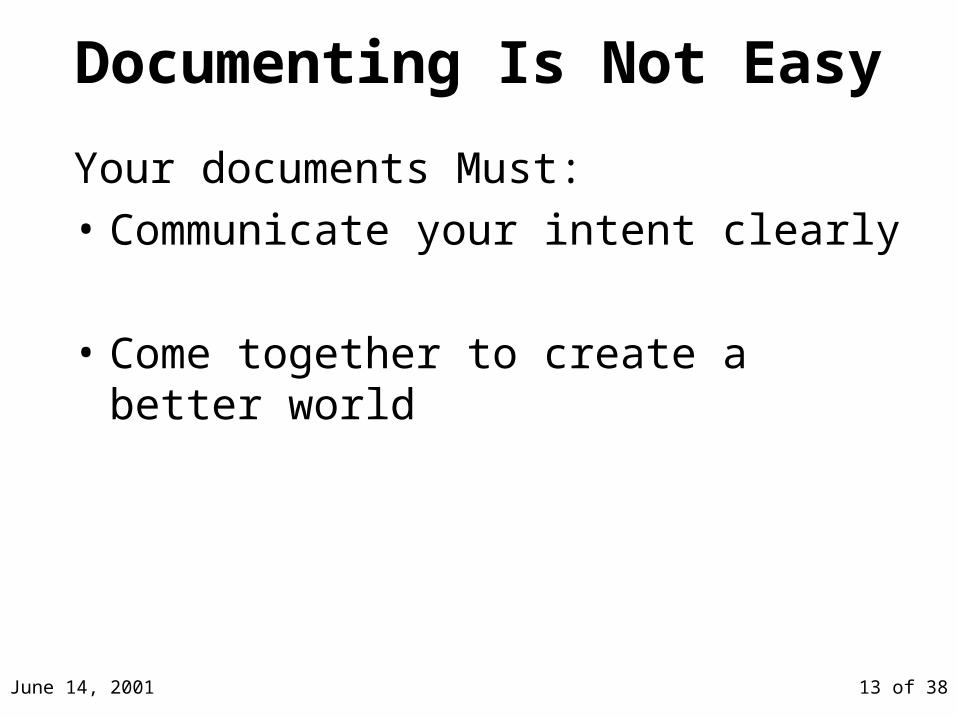
Documenting Is Not Easy
Your documents Must:
• Communicate your intent clearly
• Come together to create a better world
June 14, 2001 14 of 38
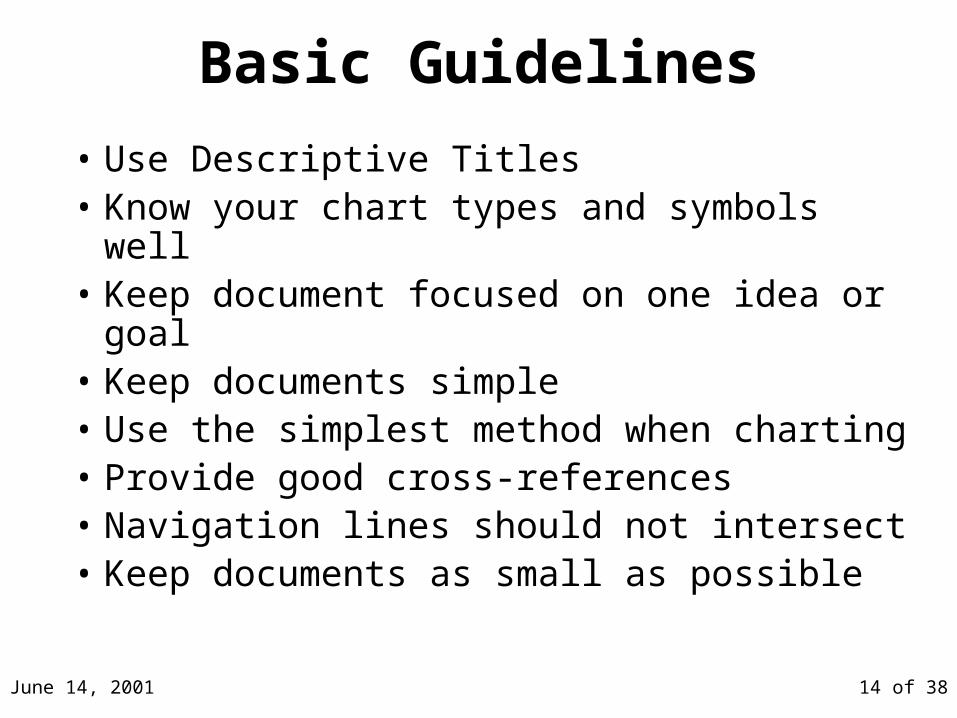
Basic Guidelines
• Use Descriptive Titles• Know your chart types and symbols well• Keep document focused on one idea or
goal• Keep documents simple• Use the simplest method when charting• Provide good cross-references• Navigation lines should not intersect• Keep documents as small as possible
June 14, 2001 15 of 38
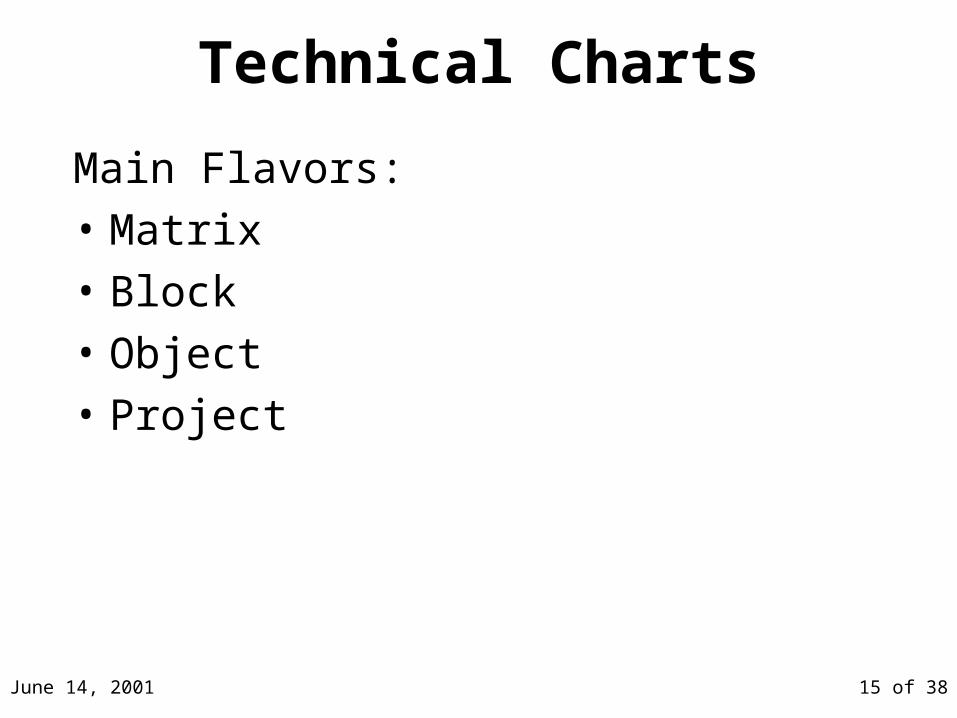
Technical Charts
Main Flavors:
• Matrix
• Block
• Object
• Project
June 14, 2001 16 of 38
Matrixes
• Organizes information systematically
• Allows for comparison and grouping
• Have been used for as long as we know
• Are easily understood
• Tables or charts come in a few flavors (L, Y, T, X)
• There are others
June 14, 2001 17 of 38
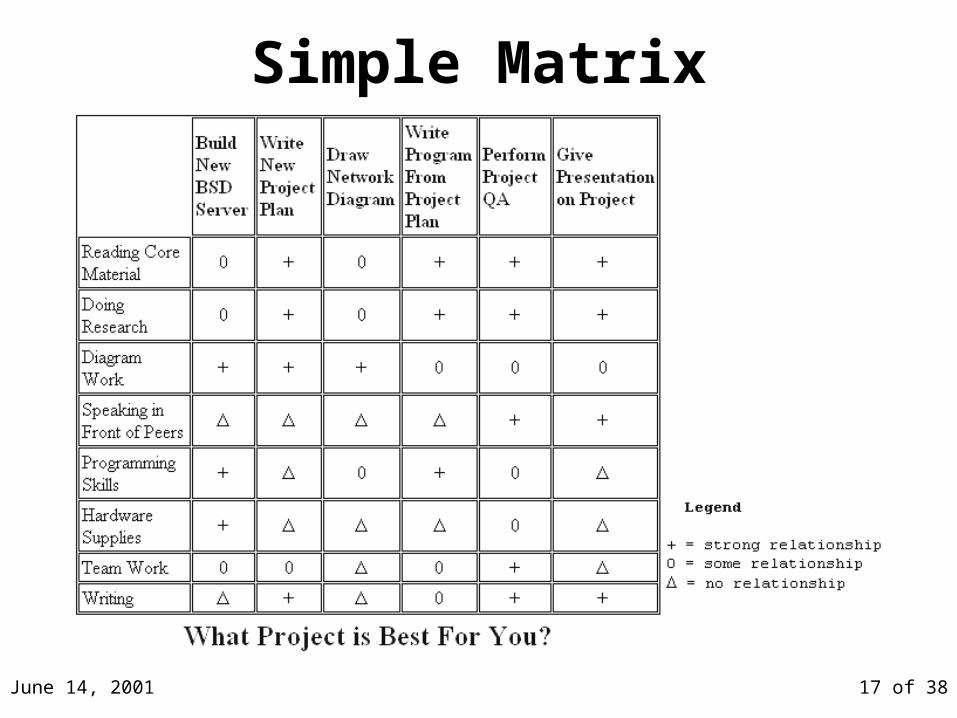
Simple Matrix
June 14, 2001 18 of 38
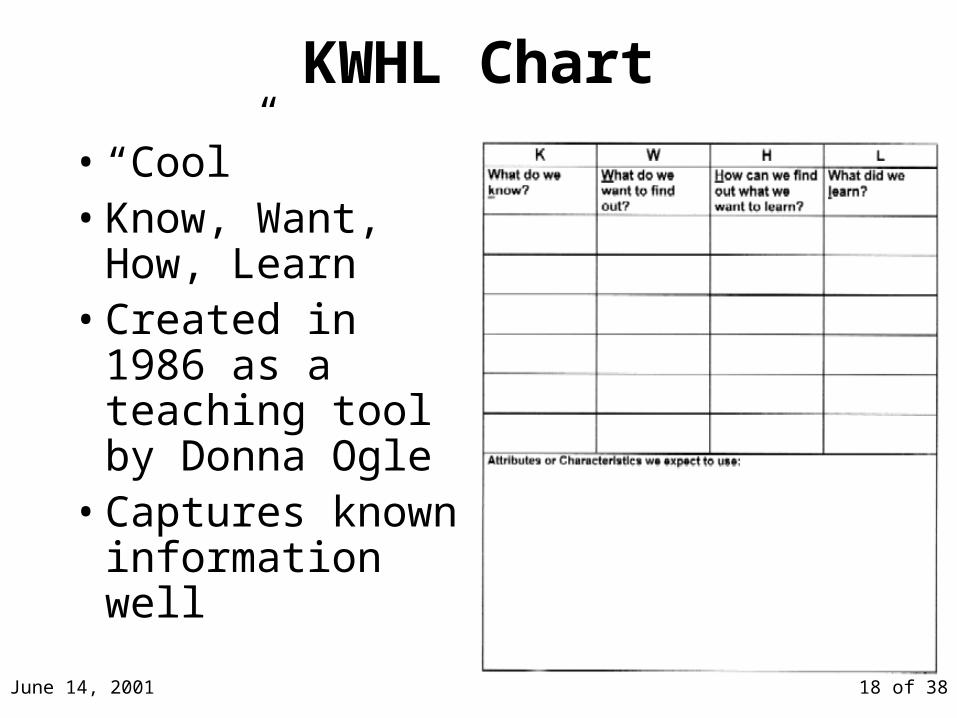
KWHL Chart
• “Cool”• Know, Want,
How, Learn• Created in 1986
as a teaching tool by Donna Ogle
• Captures known information well

June 14, 2001 19 of 38
Venn Diagrams
• Pretty Basic
• No one else in the history of math has been known so well for so little
June 14, 2001 20 of 38
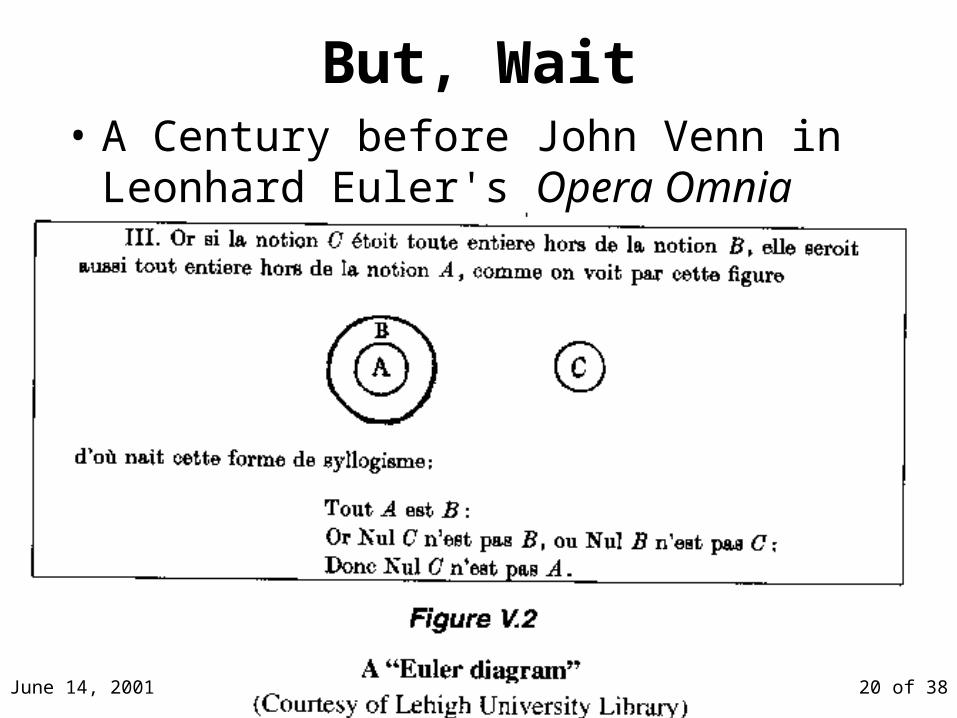
But, Wait• A Century before John Venn in Leonhard
Euler's Opera Omnia
June 14, 2001 21 of 38
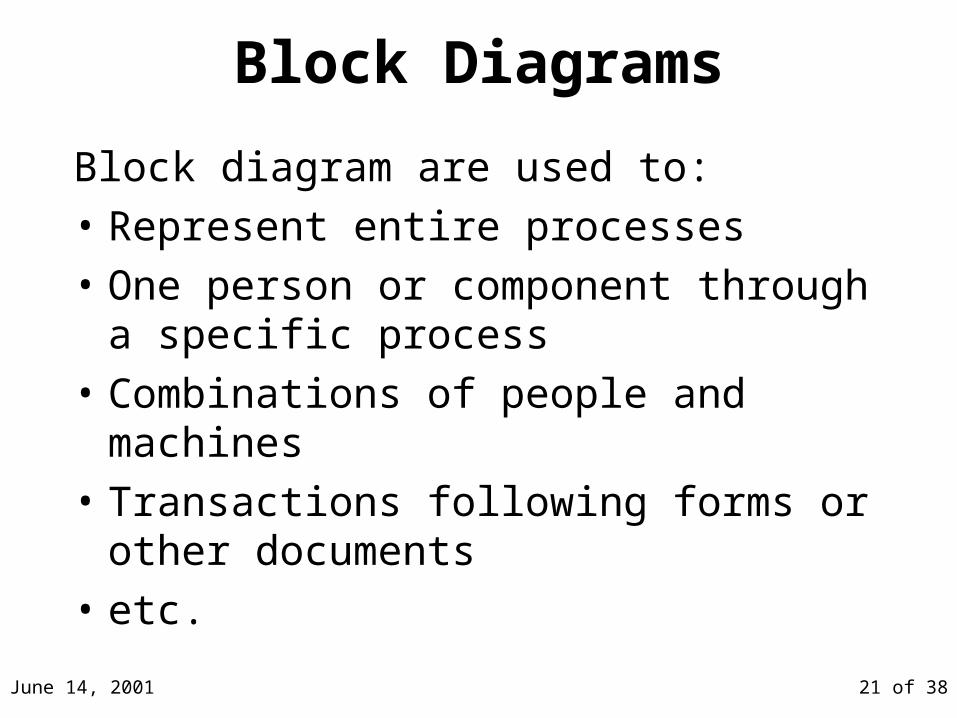
Block Diagrams
Block diagram are used to:
• Represent entire processes
• One person or component through a specific process
• Combinations of people and machines
• Transactions following forms or other documents
• etc.
June 14, 2001 22 of 38
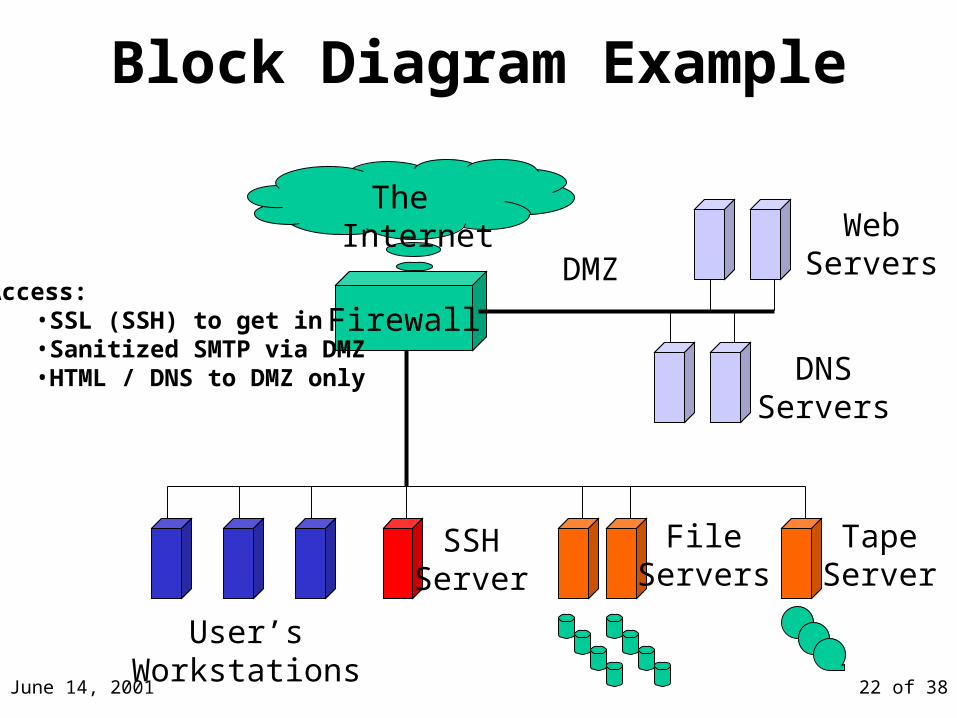
Block Diagram Example
The Internet
Firewall
DMZ
WebServers
DNSServers
SSHServer
User’sWorkstations
FileServers
TapeServer
Access:•SSL (SSH) to get in•Sanitized SMTP via DMZ•HTML / DNS to DMZ only
June 14, 2001 23 of 38
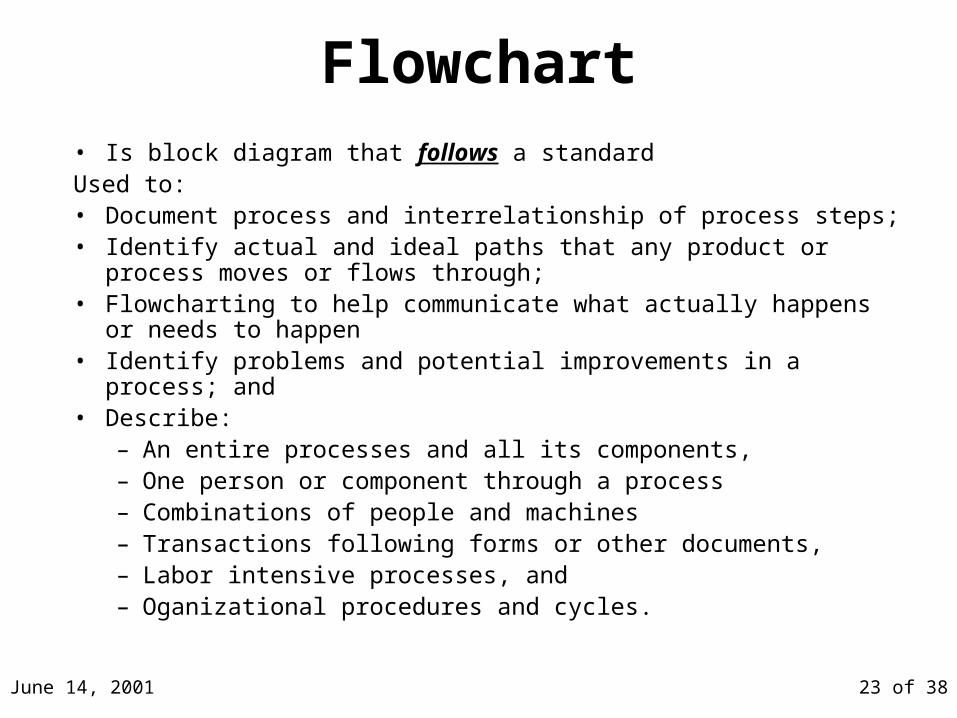
Flowchart• Is block diagram that follows a standardUsed to:• Document process and interrelationship of process steps;• Identify actual and ideal paths that any product or process moves
or flows through;• Flowcharting to help communicate what actually happens or needs
to happen• Identify problems and potential improvements in a process; and• Describe:
– An entire processes and all its components,– One person or component through a process– Combinations of people and machines– Transactions following forms or other documents,– Labor intensive processes, and– Oganizational procedures and cycles.
June 14, 2001 24 of 38
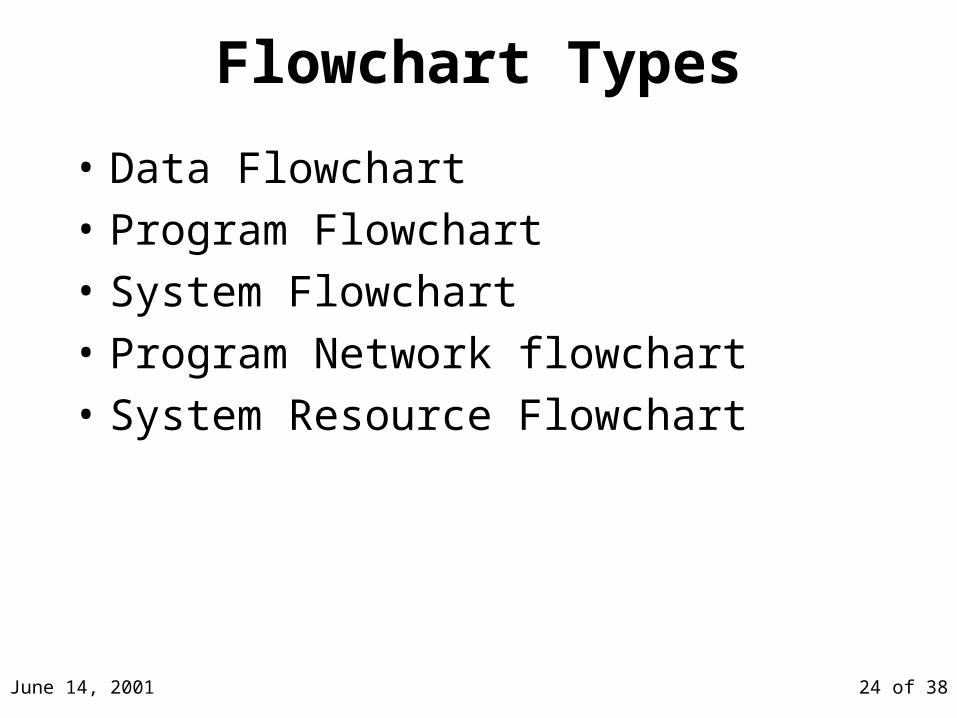
Flowchart Types
• Data Flowchart
• Program Flowchart
• System Flowchart
• Program Network flowchart
• System Resource Flowchart
June 14, 2001 25 of 38
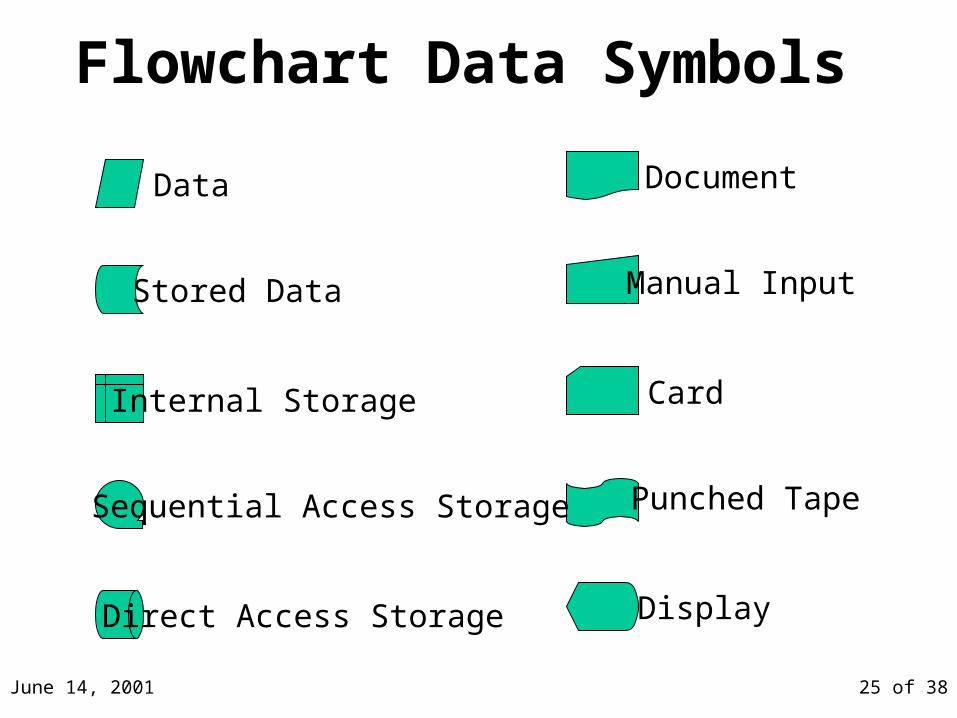
Flowchart Data Symbols
Stored Data
Data
Internal Storage
Sequential Access Storage
Direct Access Storage
Manual Input
Document
Card
Punched Tape
Display

June 14, 2001 26 of 38
Flowchart Process Symbols
Specific Process Symbol
Basic Process Symbol
Manual Operation
Preparation
Decision
Parallel Mode
Loop Limit
June 14, 2001 27 of 38
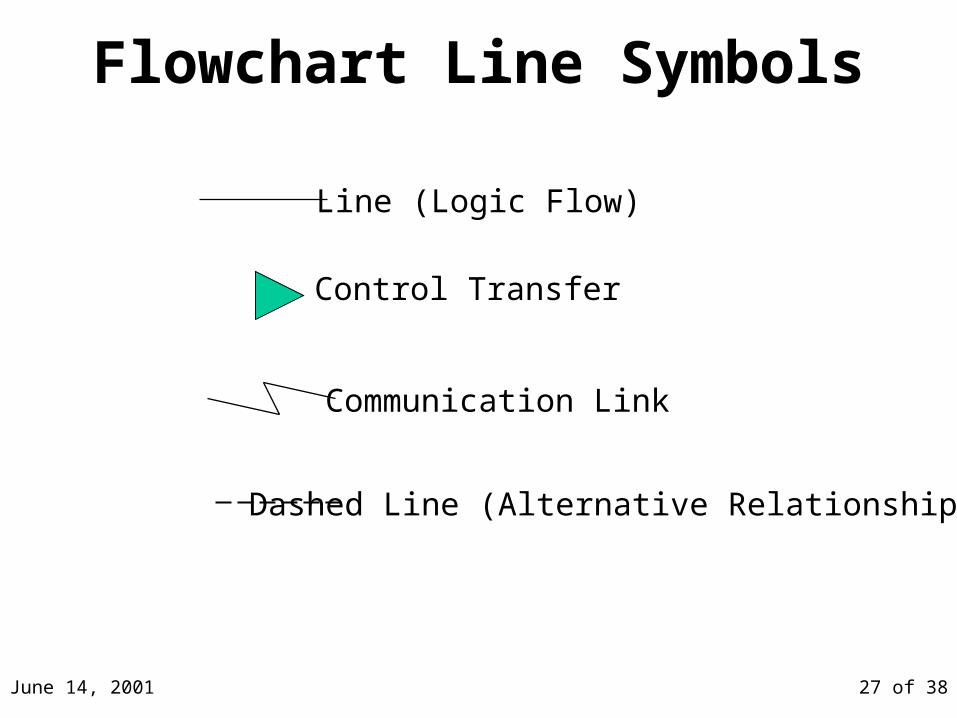
Flowchart Line Symbols
Control Transfer
Communication Link
Line (Logic Flow)
Dashed Line (Alternative Relationship)
June 14, 2001 28 of 38
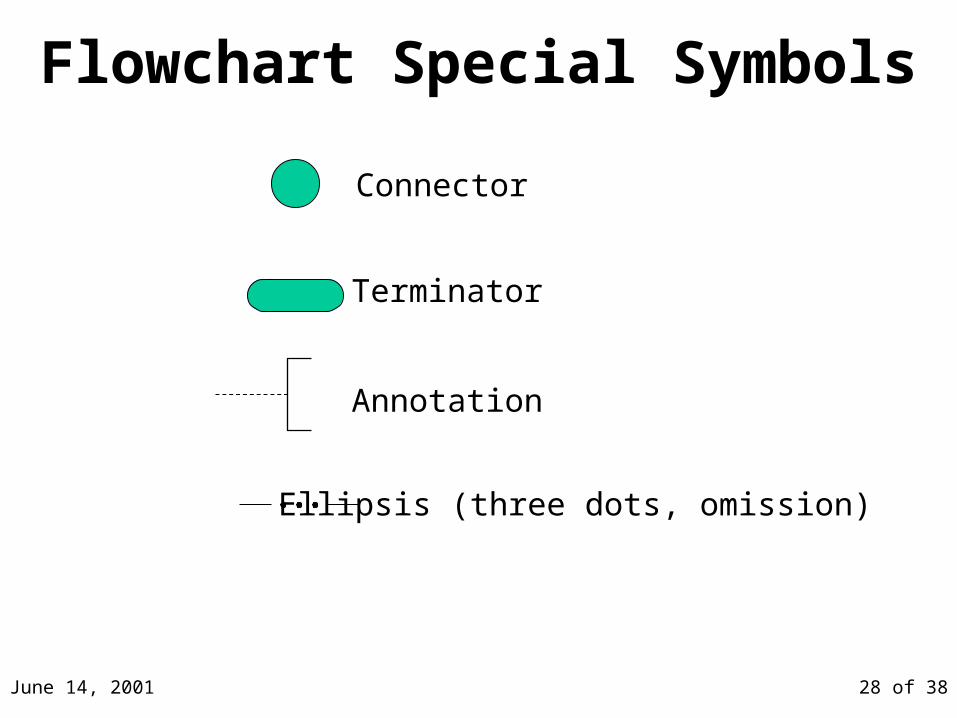
Flowchart Special Symbols
Terminator
Connector
Annotation
Ellipsis (three dots, omission)
June 14, 2001 29 of 38
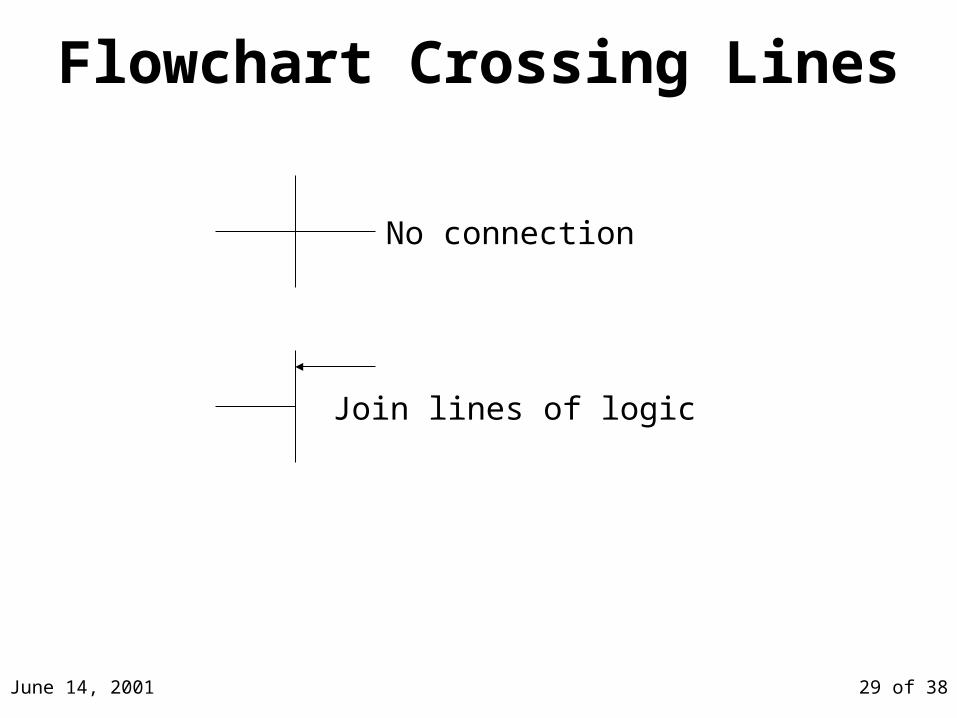
Flowchart Crossing Lines
No connection
Join lines of logic
June 14, 2001 30 of 38
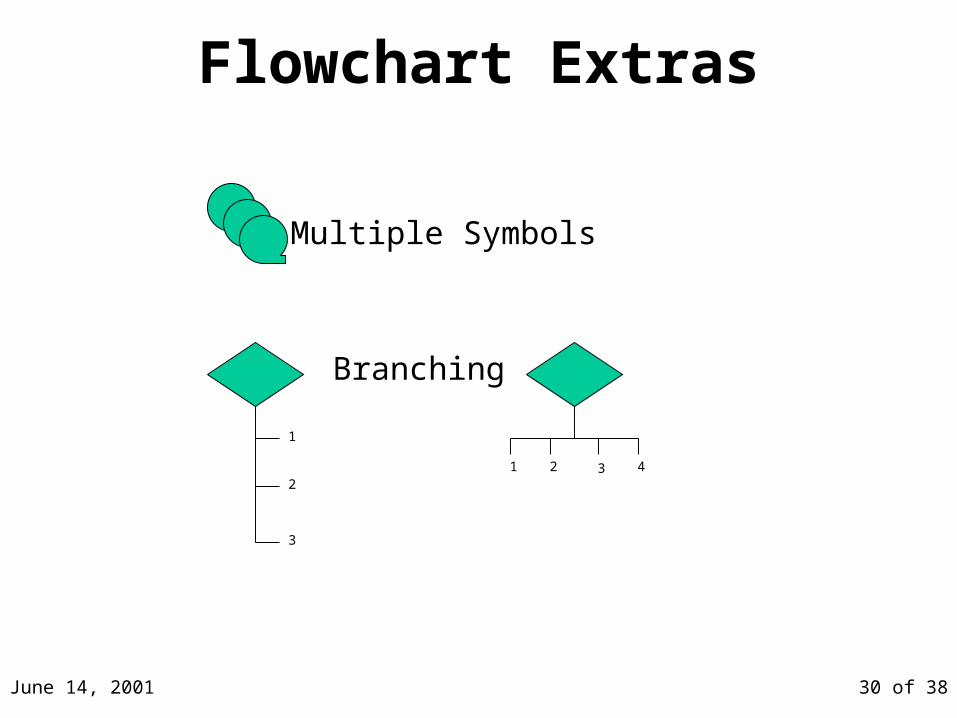
Flowchart Extras
Multiple Symbols
1
2
3
Branching
4321
June 14, 2001 31 of 38
Flowchart Recommended Policies
• Drawn on white, unlined 8 1/2" x 11" paper on one side only.• Place name, and the title at the top of each page, along with the
page number• Use only standard flowcharting symbols• If possible draw using a template or program• Print the contents of each symbol legibly• Flowcharts start on the top of the page and flow down and to the
right• Comments are in English, not programming languages• Each subroutine is flowcharted on a separate page• Each subroutine begins with a terminal symbol labeled with its
name and a terminal symbol labeled return at the end• Flow lines between symbols use arrowheads to indicate the
direction of the logic flow
June 14, 2001 32 of 38
Unified Modeling Language (UML)
• Graphs of object interactions and relationships
• “Modeling Language” (not a method)– Expresses design– Defines interactions
June 14, 2001 33 of 38
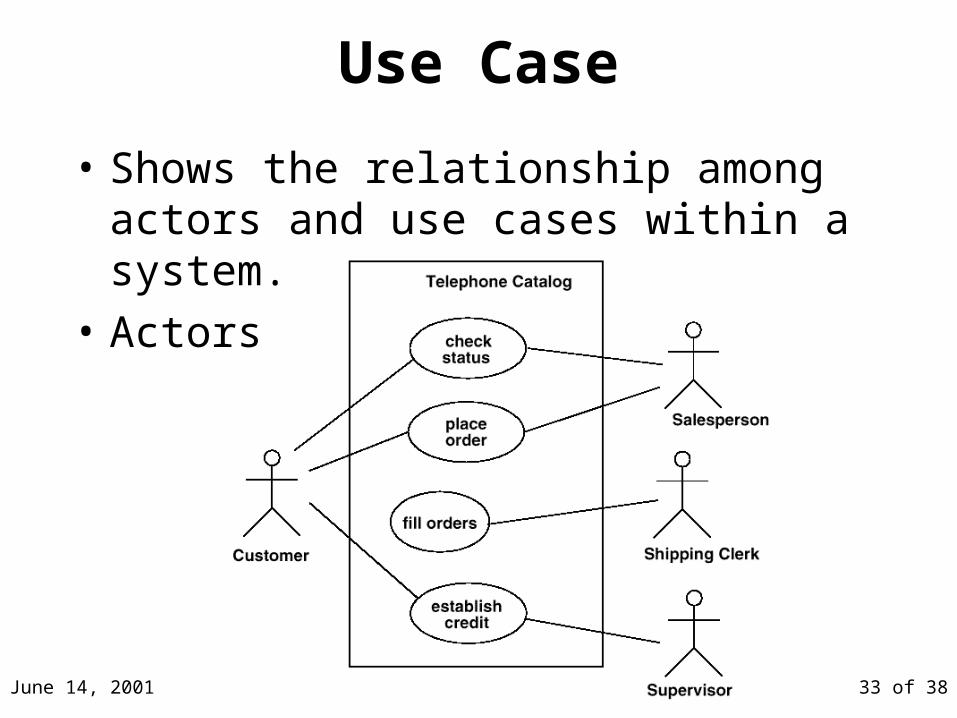
Use Case
• Shows the relationship among actors and use cases within a system.
• Actors
June 14, 2001 34 of 38
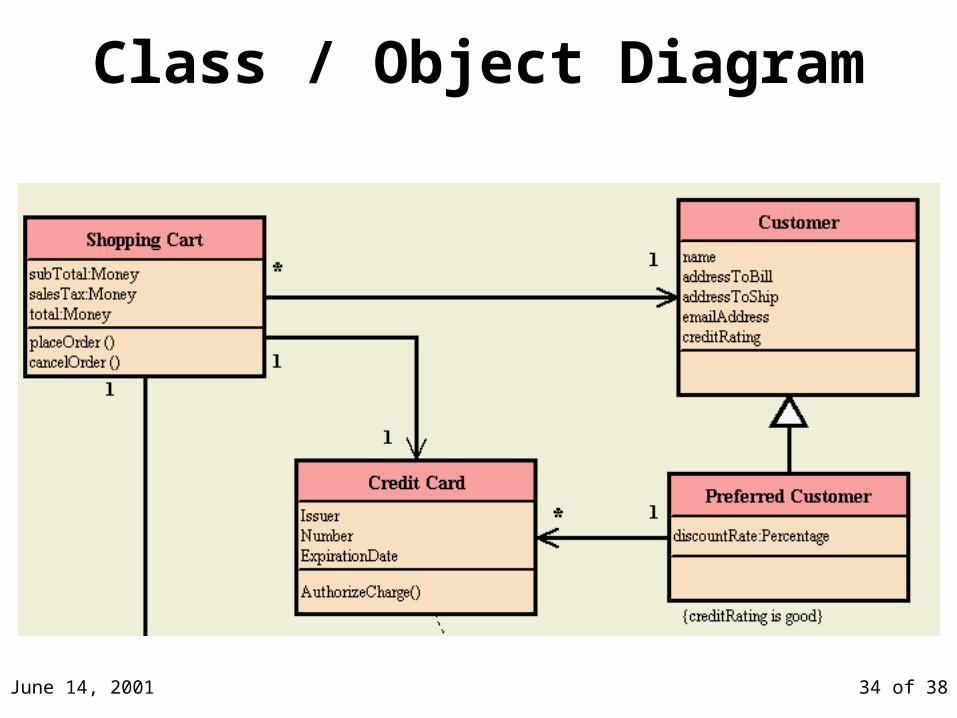
Class / Object Diagram
June 14, 2001 35 of 38
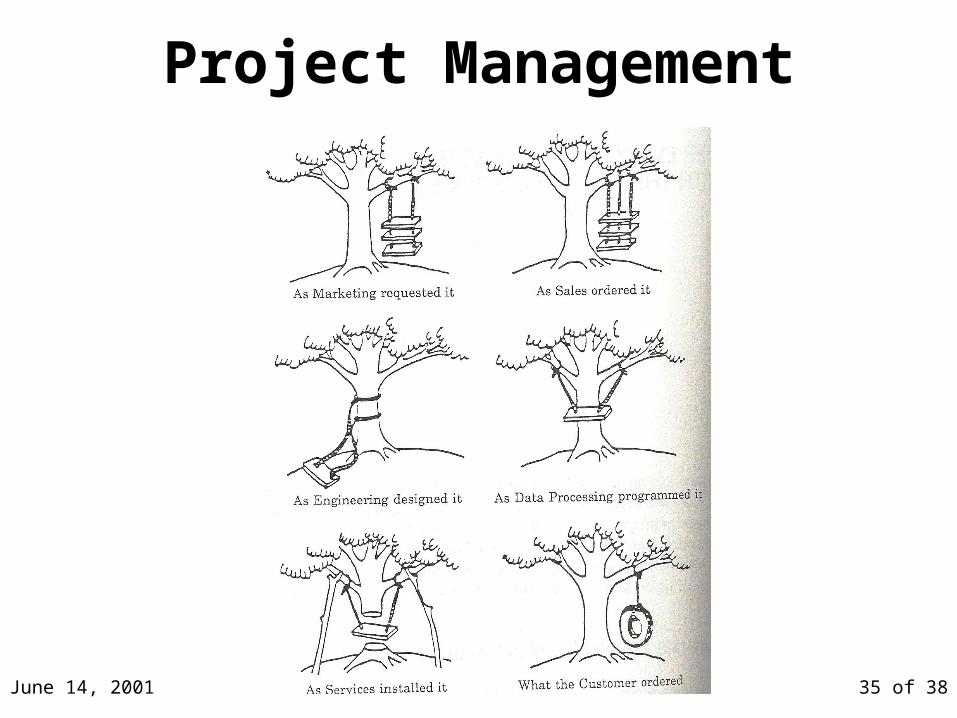
Project Management
June 14, 2001 36 of 38
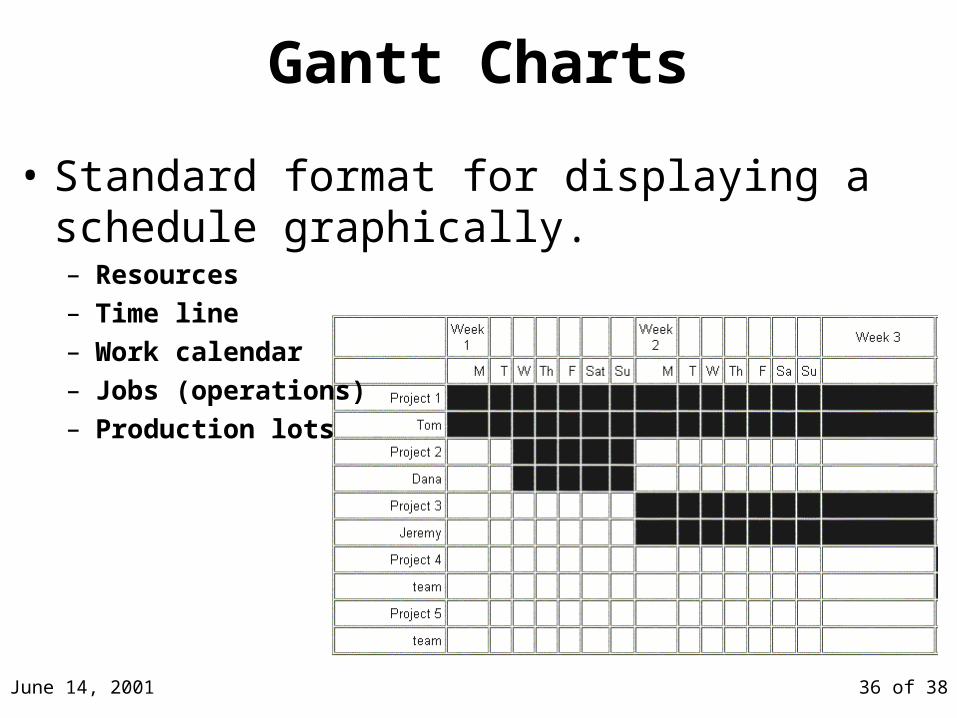
Gantt Charts
• Standard format for displaying a schedule graphically.– Resources– Time line– Work calendar– Jobs (operations)– Production lots
June 14, 2001 37 of 38
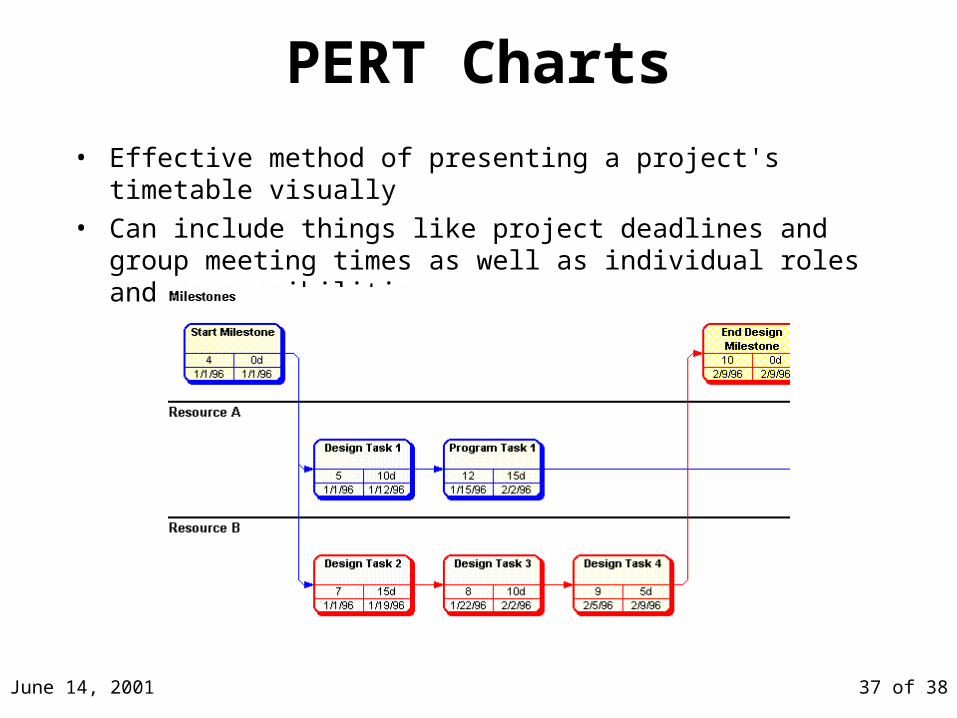
PERT Charts
• Effective method of presenting a project's timetable visually• Can include things like project deadlines and group meeting times
as well as individual roles and responsibilities
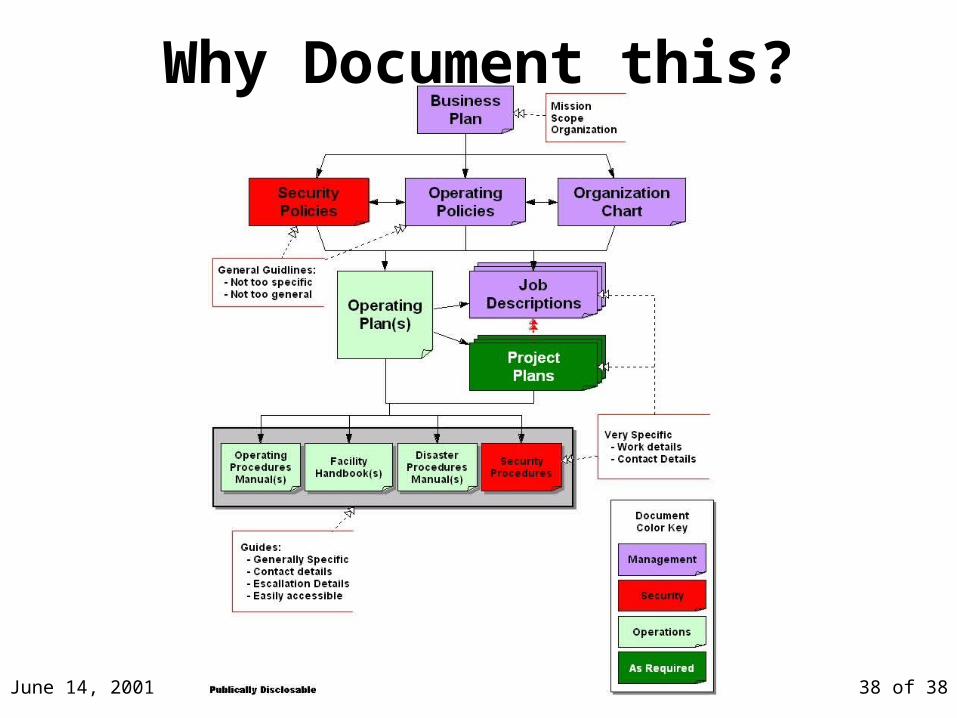
June 14, 2001 38 of 38
Why Document this?