Embed Size (px)
Citation preview
JULY 2014 LRFD BRIDGE DESIGN 5-1
5. CONCRETE STRUCTURES
5.1 Materials
5.1.1 Concrete
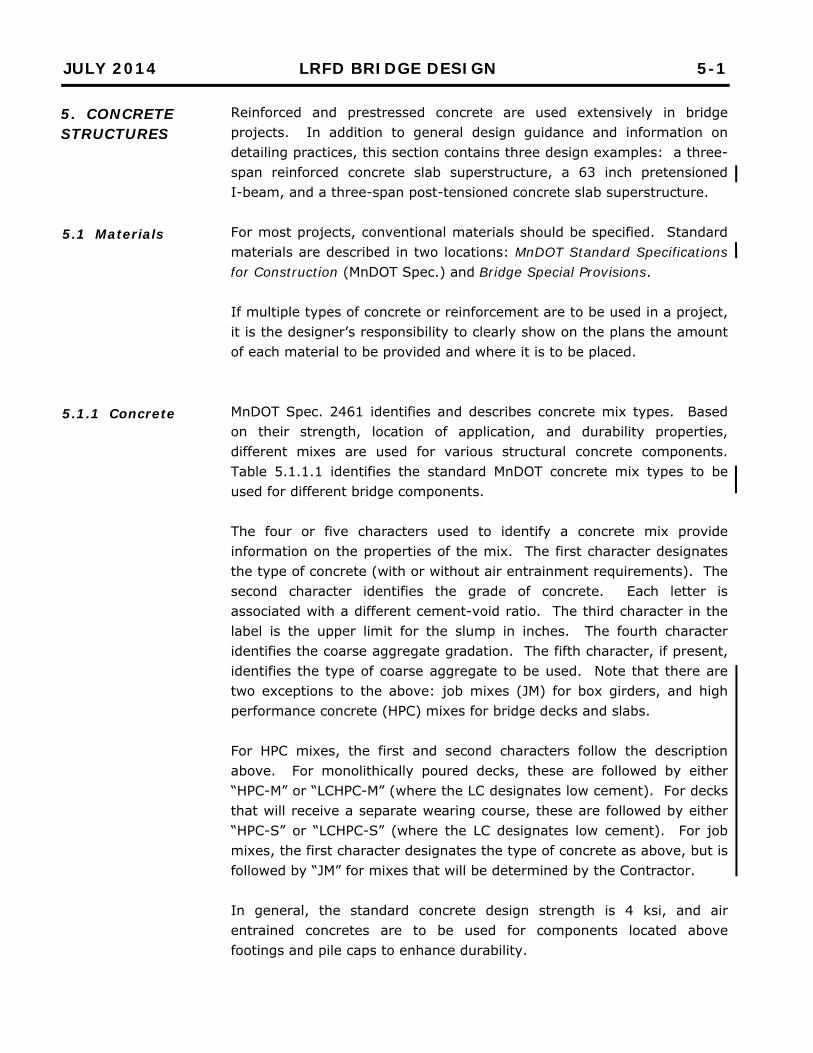
Reinforced and prestressed concrete are used extensively in bridge projects. In addition to general design guidance and information on detailing practices, this section contains three design examples: a three-span reinforced concrete slab superstructure, a 63 inch pretensioned I-beam, and a three-span post-tensioned concrete slab superstructure. For most projects, conventional materials should be specified. Standard materials are described in two locations: MnDOT Standard Specifications for Construction (MnDOT Spec.) and Bridge Special Provisions. If multiple types of concrete or reinforcement are to be used in a project, it is the designer’s responsibility to clearly show on the plans the amount of each material to be provided and where it is to be placed.
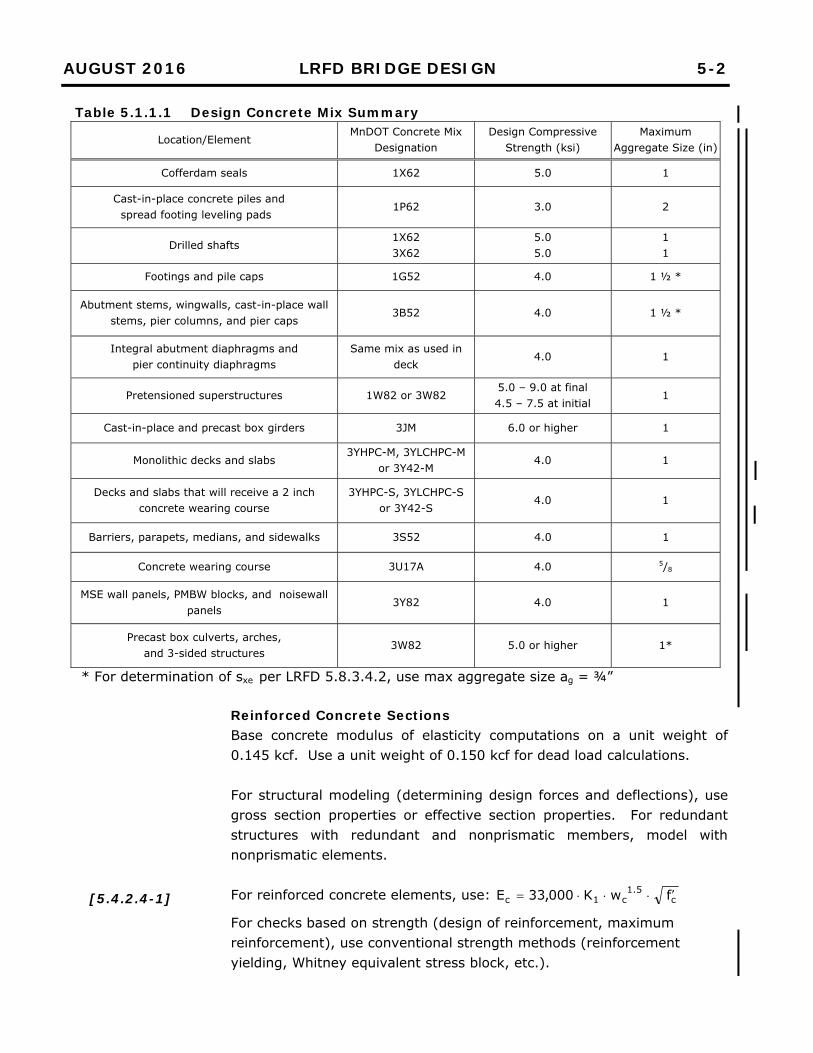
MnDOT Spec. 2461 identifies and describes concrete mix types. Based on their strength, location of application, and durability properties, different mixes are used for various structural concrete components. Table 5.1.1.1 identifies the standard MnDOT concrete mix types to be used for different bridge components. The four or five characters used to identify a concrete mix provide information on the properties of the mix. The first character designates the type of concrete (with or without air entrainment requirements). The second character identifies the grade of concrete. Each letter is associated with a different cement-void ratio. The third character in the label is the upper limit for the slump in inches. The fourth character identifies the coarse aggregate gradation. The fifth character, if present, identifies the type of coarse aggregate to be used. Note that there are two exceptions to the above: job mixes (JM) for box girders, and high performance concrete (HPC) mixes for bridge decks and slabs. For HPC mixes, the first and second characters follow the description above. For monolithically poured decks, these are followed by either “HPC-M” or “LCHPC-M” (where the LC designates low cement). For decks that will receive a separate wearing course, these are followed by either “HPC-S” or “LCHPC-S” (where the LC designates low cement). For job mixes, the first character designates the type of concrete as above, but is followed by “JM” for mixes that will be determined by the Contractor. In general, the standard concrete design strength is 4 ksi, and air entrained concretes are to be used for components located above footings and pile caps to enhance durability.
AUGUST 2016 LRFD BRIDGE DESIGN 5-2
Table 5.1.1.1 Design Concrete Mix Summary
Location/Element MnDOT Concrete Mix
Designation Design Compressive
Strength (ksi) Maximum
Aggregate Size (in)
Cofferdam seals 1X62 5.0 1
Cast-in-place concrete piles and spread footing leveling pads
1P62 3.0 2
Drilled shafts 1X62 3X62
5.0 5.0
1 1
Footings and pile caps 1G52 4.0 1 ½ *
Abutment stems, wingwalls, cast-in-place wall stems, pier columns, and pier caps
3B52 4.0 1 ½ *
Integral abutment diaphragms and pier continuity diaphragms
Same mix as used in deck
4.0 1
Pretensioned superstructures 1W82 or 3W82 5.0 – 9.0 at final 4.5 – 7.5 at initial
1
Cast-in-place and precast box girders 3JM 6.0 or higher 1
Monolithic decks and slabs 3YHPC-M, 3YLCHPC-M
or 3Y42-M 4.0 1
Decks and slabs that will receive a 2 inch concrete wearing course
3YHPC-S, 3YLCHPC-S or 3Y42-S
4.0 1
Barriers, parapets, medians, and sidewalks 3S52 4.0 1
Concrete wearing course 3U17A 4.0 5/8
MSE wall panels, PMBW blocks, and noisewall panels
3Y82 4.0 1
Precast box culverts, arches, and 3-sided structures
3W82 5.0 or higher 1*
* For determination of sxe per LRFD 5.8.3.4.2, use max aggregate size ag = ¾” Reinforced Concrete Sections Base concrete modulus of elasticity computations on a unit weight of 0.145 kcf. Use a unit weight of 0.150 kcf for dead load calculations. For structural modeling (determining design forces and deflections), use gross section properties or effective section properties. For redundant structures with redundant and nonprismatic members, model with nonprismatic elements. For reinforced concrete elements, use: c
5.1c1c fwK000,33E
For checks based on strength (design of reinforcement, maximum reinforcement), use conventional strength methods (reinforcement yielding, Whitney equivalent stress block, etc.).
[5.4.2.4-1]
JULY 2014 LRFD BRIDGE DESIGN 5-3
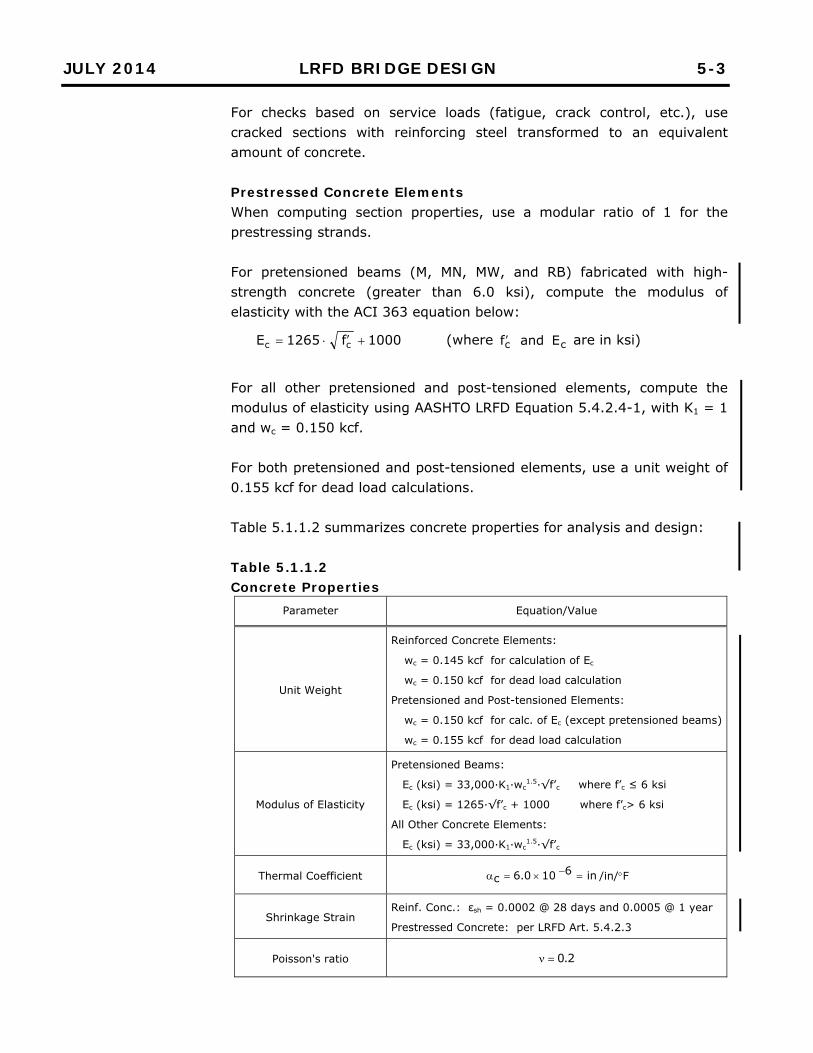
For checks based on service loads (fatigue, crack control, etc.), use cracked sections with reinforcing steel transformed to an equivalent amount of concrete. Prestressed Concrete Elements When computing section properties, use a modular ratio of 1 for the prestressing strands. For pretensioned beams (M, MN, MW, and RB) fabricated with high-strength concrete (greater than 6.0 ksi), compute the modulus of elasticity with the ACI 363 equation below:
1000f1265E cc (where cc Eandf are in ksi)
For all other pretensioned and post-tensioned elements, compute the modulus of elasticity using AASHTO LRFD Equation 5.4.2.4-1, with K1 = 1 and wc = 0.150 kcf. For both pretensioned and post-tensioned elements, use a unit weight of 0.155 kcf for dead load calculations. Table 5.1.1.2 summarizes concrete properties for analysis and design: Table 5.1.1.2 Concrete Properties
Parameter Equation/Value
Unit Weight
Reinforced Concrete Elements:
wc = 0.145 kcf for calculation of Ec
wc = 0.150 kcf for dead load calculation
Pretensioned and Post-tensioned Elements:
wc = 0.150 kcf for calc. of Ec (except pretensioned beams)
wc = 0.155 kcf for dead load calculation
Modulus of Elasticity
Pretensioned Beams:
Ec (ksi) = 33,000·K1·wc1.5·√f’c where f’c ≤ 6 ksi
Ec (ksi) = 1265·√f’c + 1000 where f’c> 6 ksi
All Other Concrete Elements:
Ec (ksi) = 33,000·K1·wc1.5·√f’c
Thermal Coefficient in6100.6c /in/F
Shrinkage Strain Reinf. Conc.: εsh = 0.0002 @ 28 days and 0.0005 @ 1 year
Prestressed Concrete: per LRFD Art. 5.4.2.3
Poisson's ratio 2.0
JULY 2014 LRFD BRIDGE DESIGN 5-4
5.1.2 Reinforcing Steel
5.1.3 Reinforcement Bar Couplers
5.1.4 Prestressing Steel
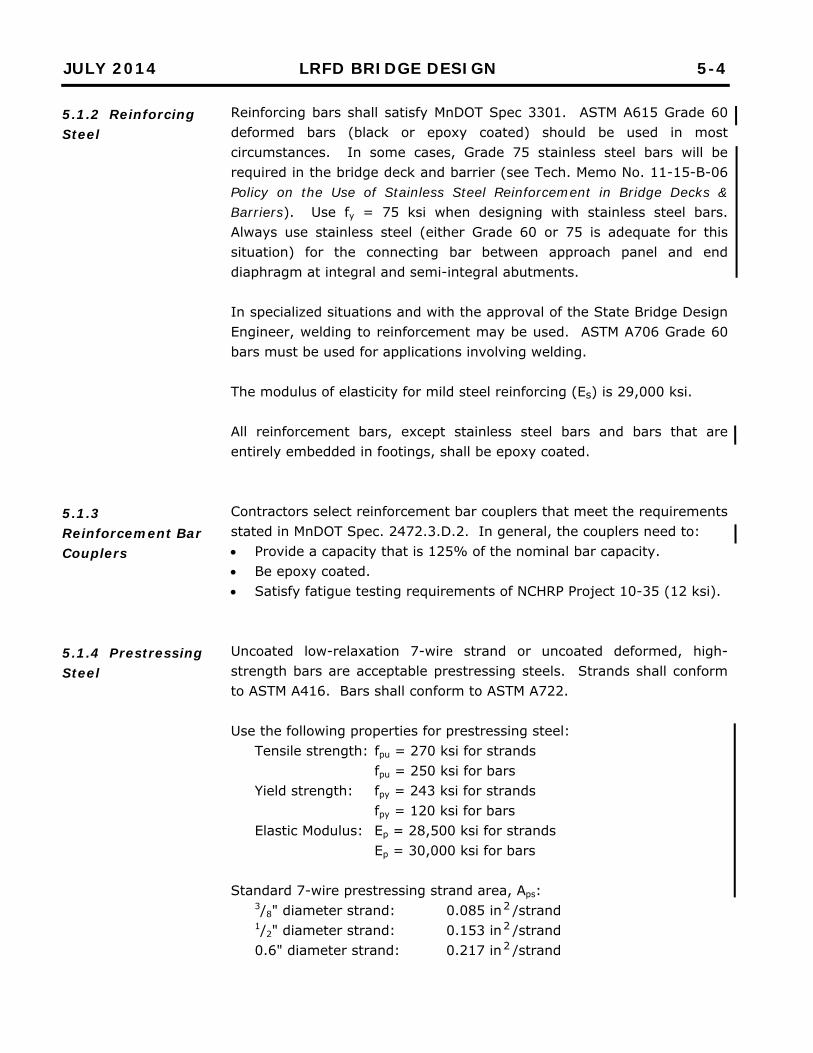
Reinforcing bars shall satisfy MnDOT Spec 3301. ASTM A615 Grade 60 deformed bars (black or epoxy coated) should be used in most circumstances. In some cases, Grade 75 stainless steel bars will be required in the bridge deck and barrier (see Tech. Memo No. 11-15-B-06 Policy on the Use of Stainless Steel Reinforcement in Bridge Decks & Barriers). Use fy = 75 ksi when designing with stainless steel bars. Always use stainless steel (either Grade 60 or 75 is adequate for this situation) for the connecting bar between approach panel and end diaphragm at integral and semi-integral abutments. In specialized situations and with the approval of the State Bridge Design Engineer, welding to reinforcement may be used. ASTM A706 Grade 60 bars must be used for applications involving welding. The modulus of elasticity for mild steel reinforcing (Es) is 29,000 ksi. All reinforcement bars, except stainless steel bars and bars that are entirely embedded in footings, shall be epoxy coated. Contractors select reinforcement bar couplers that meet the requirements stated in MnDOT Spec. 2472.3.D.2. In general, the couplers need to: Provide a capacity that is 125% of the nominal bar capacity. Be epoxy coated. Satisfy fatigue testing requirements of NCHRP Project 10-35 (12 ksi). Uncoated low-relaxation 7-wire strand or uncoated deformed, high-strength bars are acceptable prestressing steels. Strands shall conform to ASTM A416. Bars shall conform to ASTM A722. Use the following properties for prestressing steel:
Tensile strength: fpu = 270 ksi for strands fpu = 250 ksi for bars
Yield strength: fpy = 243 ksi for strands fpy = 120 ksi for bars
Elastic Modulus: Ep = 28,500 ksi for strands Ep = 30,000 ksi for bars
Standard 7-wire prestressing strand area, Aps:
3/8" diameter strand: 0.085 in2 /strand 1/2" diameter strand: 0.153 in2 /strand 0.6" diameter strand: 0.217 in2 /strand
JULY 2014 LRFD BRIDGE DESIGN 5-5
5.1.5 Post-tensioning Hardware
5.2 Reinforcement Details
5.2.1 Minimum Clear Cover and Clear Spacing
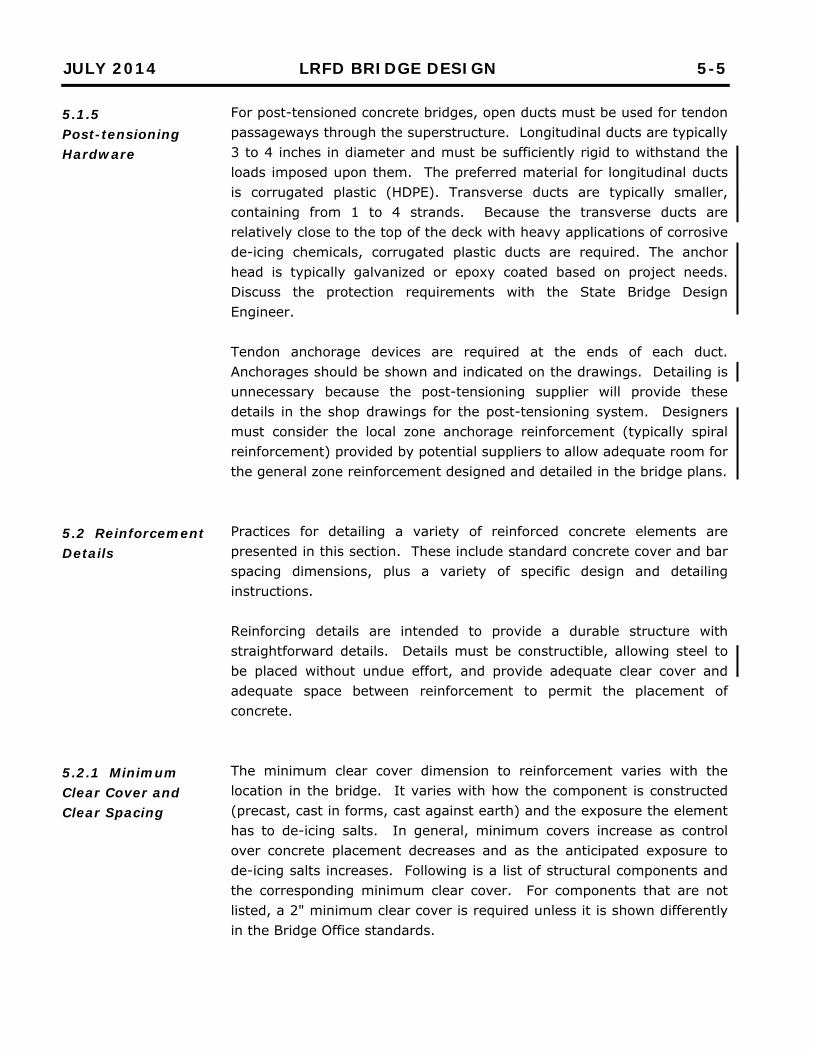
For post-tensioned concrete bridges, open ducts must be used for tendon passageways through the superstructure. Longitudinal ducts are typically 3 to 4 inches in diameter and must be sufficiently rigid to withstand the loads imposed upon them. The preferred material for longitudinal ducts is corrugated plastic (HDPE). Transverse ducts are typically smaller, containing from 1 to 4 strands. Because the transverse ducts are relatively close to the top of the deck with heavy applications of corrosive de-icing chemicals, corrugated plastic ducts are required. The anchor head is typically galvanized or epoxy coated based on project needs. Discuss the protection requirements with the State Bridge Design Engineer. Tendon anchorage devices are required at the ends of each duct. Anchorages should be shown and indicated on the drawings. Detailing is unnecessary because the post-tensioning supplier will provide these details in the shop drawings for the post-tensioning system. Designers must consider the local zone anchorage reinforcement (typically spiral reinforcement) provided by potential suppliers to allow adequate room for the general zone reinforcement designed and detailed in the bridge plans. Practices for detailing a variety of reinforced concrete elements are presented in this section. These include standard concrete cover and bar spacing dimensions, plus a variety of specific design and detailing instructions. Reinforcing details are intended to provide a durable structure with straightforward details. Details must be constructible, allowing steel to be placed without undue effort, and provide adequate clear cover and adequate space between reinforcement to permit the placement of concrete. The minimum clear cover dimension to reinforcement varies with the location in the bridge. It varies with how the component is constructed (precast, cast in forms, cast against earth) and the exposure the element has to de-icing salts. In general, minimum covers increase as control over concrete placement decreases and as the anticipated exposure to de-icing salts increases. Following is a list of structural components and the corresponding minimum clear cover. For components that are not listed, a 2" minimum clear cover is required unless it is shown differently in the Bridge Office standards.
JULY 2014 LRFD BRIDGE DESIGN 5-6
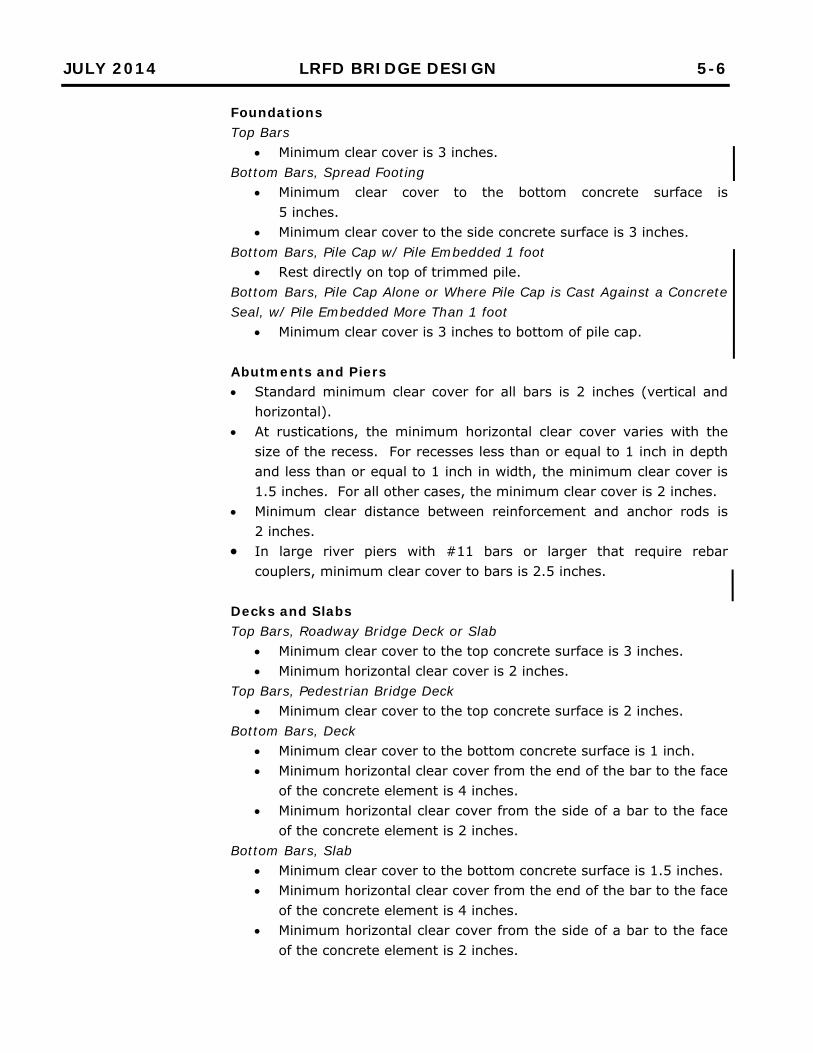
Foundations Top Bars
Minimum clear cover is 3 inches. Bottom Bars, Spread Footing
Minimum clear cover to the bottom concrete surface is 5 inches.
Minimum clear cover to the side concrete surface is 3 inches. Bottom Bars, Pile Cap w/ Pile Embedded 1 foot
Rest directly on top of trimmed pile. Bottom Bars, Pile Cap Alone or Where Pile Cap is Cast Against a Concrete Seal, w/ Pile Embedded More Than 1 foot
Minimum clear cover is 3 inches to bottom of pile cap. Abutments and Piers Standard minimum clear cover for all bars is 2 inches (vertical and
horizontal). At rustications, the minimum horizontal clear cover varies with the
size of the recess. For recesses less than or equal to 1 inch in depth and less than or equal to 1 inch in width, the minimum clear cover is 1.5 inches. For all other cases, the minimum clear cover is 2 inches.
Minimum clear distance between reinforcement and anchor rods is 2 inches.
In large river piers with #11 bars or larger that require rebar couplers, minimum clear cover to bars is 2.5 inches.
Decks and Slabs Top Bars, Roadway Bridge Deck or Slab
Minimum clear cover to the top concrete surface is 3 inches. Minimum horizontal clear cover is 2 inches.
Top Bars, Pedestrian Bridge Deck Minimum clear cover to the top concrete surface is 2 inches.
Bottom Bars, Deck Minimum clear cover to the bottom concrete surface is 1 inch. Minimum horizontal clear cover from the end of the bar to the face
of the concrete element is 4 inches. Minimum horizontal clear cover from the side of a bar to the face
of the concrete element is 2 inches. Bottom Bars, Slab
Minimum clear cover to the bottom concrete surface is 1.5 inches. Minimum horizontal clear cover from the end of the bar to the face
of the concrete element is 4 inches. Minimum horizontal clear cover from the side of a bar to the face
of the concrete element is 2 inches.
JULY 2014 LRFD BRIDGE DESIGN 5-7
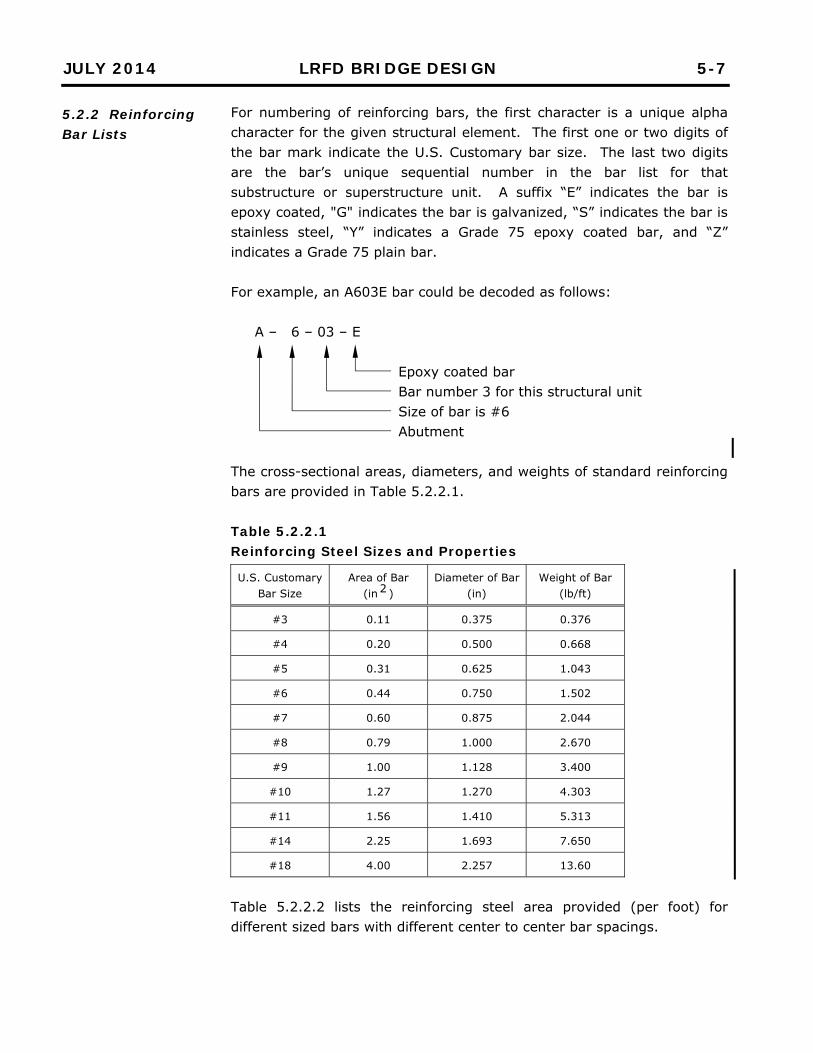
5.2.2 Reinforcing Bar Lists
For numbering of reinforcing bars, the first character is a unique alpha character for the given structural element. The first one or two digits of the bar mark indicate the U.S. Customary bar size. The last two digits are the bar’s unique sequential number in the bar list for that substructure or superstructure unit. A suffix “E” indicates the bar is epoxy coated, "G" indicates the bar is galvanized, “S” indicates the bar is stainless steel, “Y” indicates a Grade 75 epoxy coated bar, and “Z” indicates a Grade 75 plain bar. For example, an A603E bar could be decoded as follows:
A – 6 – 03 – E
Epoxy coated bar Bar number 3 for this structural unit Size of bar is #6 Abutment
The cross-sectional areas, diameters, and weights of standard reinforcing bars are provided in Table 5.2.2.1. Table 5.2.2.1 Reinforcing Steel Sizes and Properties
U.S. Customary Bar Size
Area of Bar (in 2 )
Diameter of Bar (in)
Weight of Bar (lb/ft)
#3 0.11 0.375 0.376
#4 0.20 0.500 0.668
#5 0.31 0.625 1.043
#6 0.44 0.750 1.502
#7 0.60 0.875 2.044
#8 0.79 1.000 2.670
#9 1.00 1.128 3.400
#10 1.27 1.270 4.303
#11 1.56 1.410 5.313
#14 2.25 1.693 7.650
#18 4.00 2.257 13.60
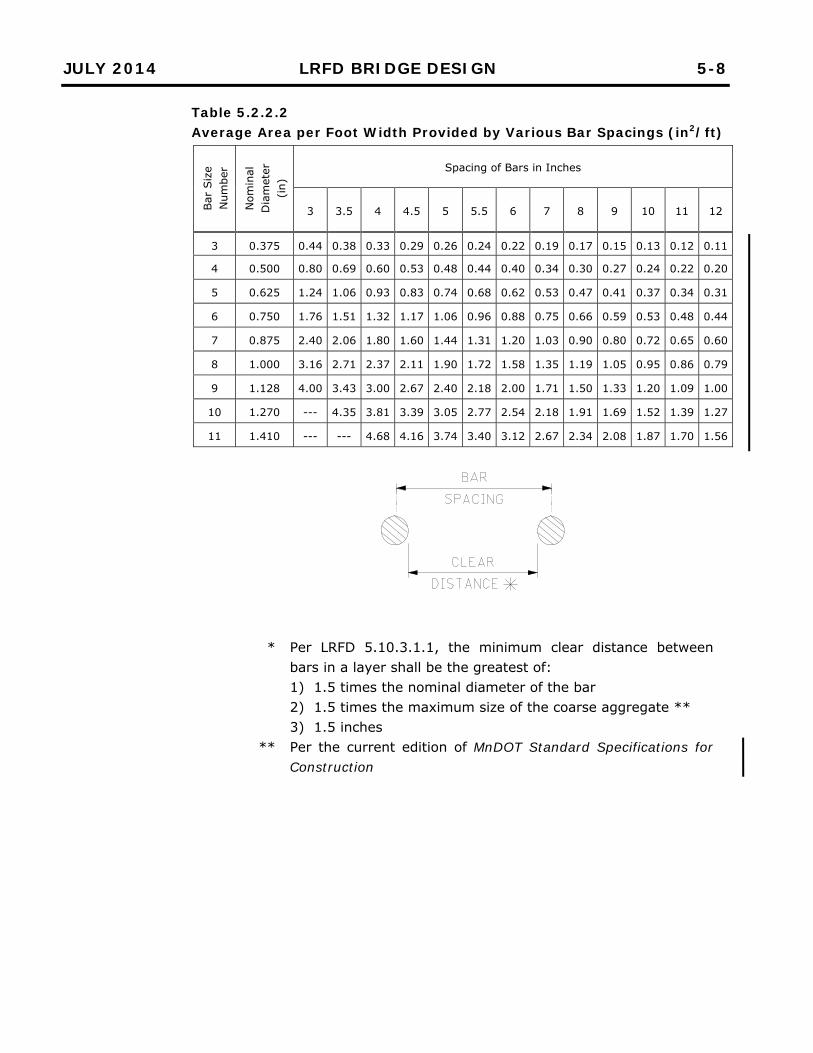
Table 5.2.2.2 lists the reinforcing steel area provided (per foot) for different sized bars with different center to center bar spacings.
JULY 2014 LRFD BRIDGE DESIGN 5-8
Table 5.2.2.2 Average Area per Foot Width Provided by Various Bar Spacings (in2/ft)
Bar
Siz
e N
umbe
r
Nom
inal
D
iam
eter
(i
n)
Spacing of Bars in Inches
3 3.5 4 4.5 5 5.5 6 7 8 9 10 11 12
3 0.375 0.44 0.38 0.33 0.29 0.26 0.24 0.22 0.19 0.17 0.15 0.13 0.12 0.11
4 0.500 0.80 0.69 0.60 0.53 0.48 0.44 0.40 0.34 0.30 0.27 0.24 0.22 0.20
5 0.625 1.24 1.06 0.93 0.83 0.74 0.68 0.62 0.53 0.47 0.41 0.37 0.34 0.31
6 0.750 1.76 1.51 1.32 1.17 1.06 0.96 0.88 0.75 0.66 0.59 0.53 0.48 0.44
7 0.875 2.40 2.06 1.80 1.60 1.44 1.31 1.20 1.03 0.90 0.80 0.72 0.65 0.60
8 1.000 3.16 2.71 2.37 2.11 1.90 1.72 1.58 1.35 1.19 1.05 0.95 0.86 0.79
9 1.128 4.00 3.43 3.00 2.67 2.40 2.18 2.00 1.71 1.50 1.33 1.20 1.09 1.00
10 1.270 --- 4.35 3.81 3.39 3.05 2.77 2.54 2.18 1.91 1.69 1.52 1.39 1.27
11 1.410 --- --- 4.68 4.16 3.74 3.40 3.12 2.67 2.34 2.08 1.87 1.70 1.56
* Per LRFD 5.10.3.1.1, the minimum clear distance between
bars in a layer shall be the greatest of: 1) 1.5 times the nominal diameter of the bar 2) 1.5 times the maximum size of the coarse aggregate ** 3) 1.5 inches
** Per the current edition of MnDOT Standard Specifications for Construction
AUGUST 2016 LRFD BRIDGE DESIGN 5-9
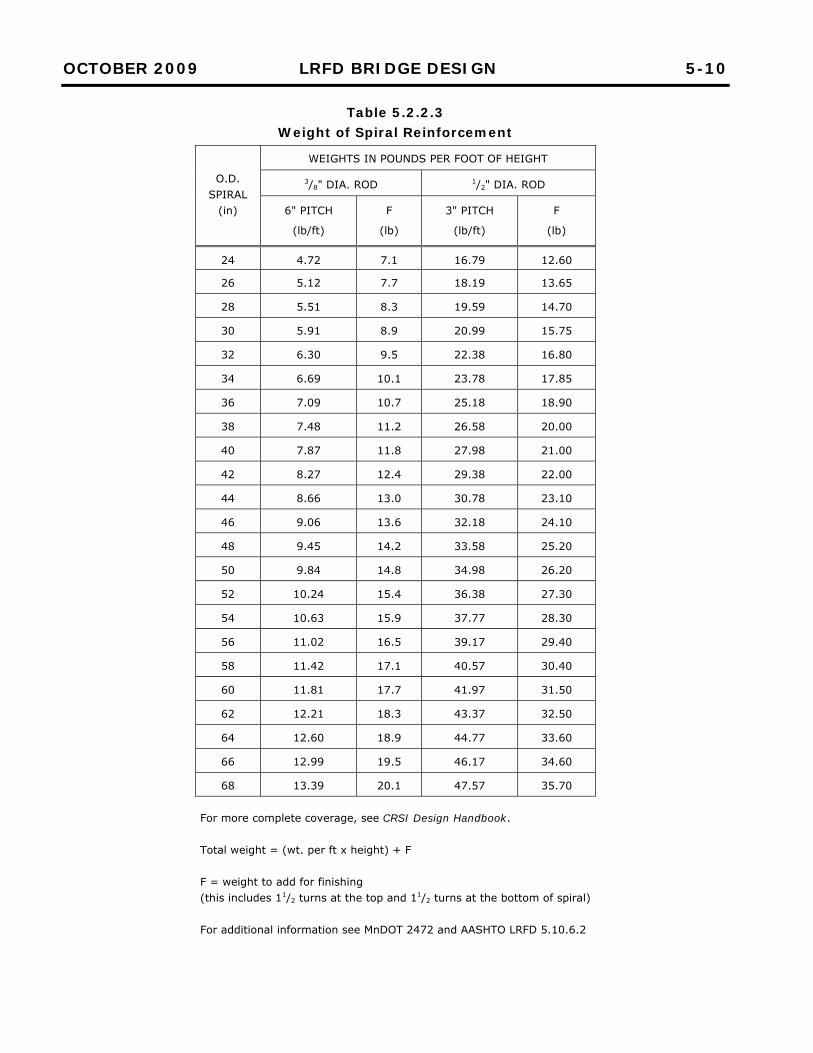
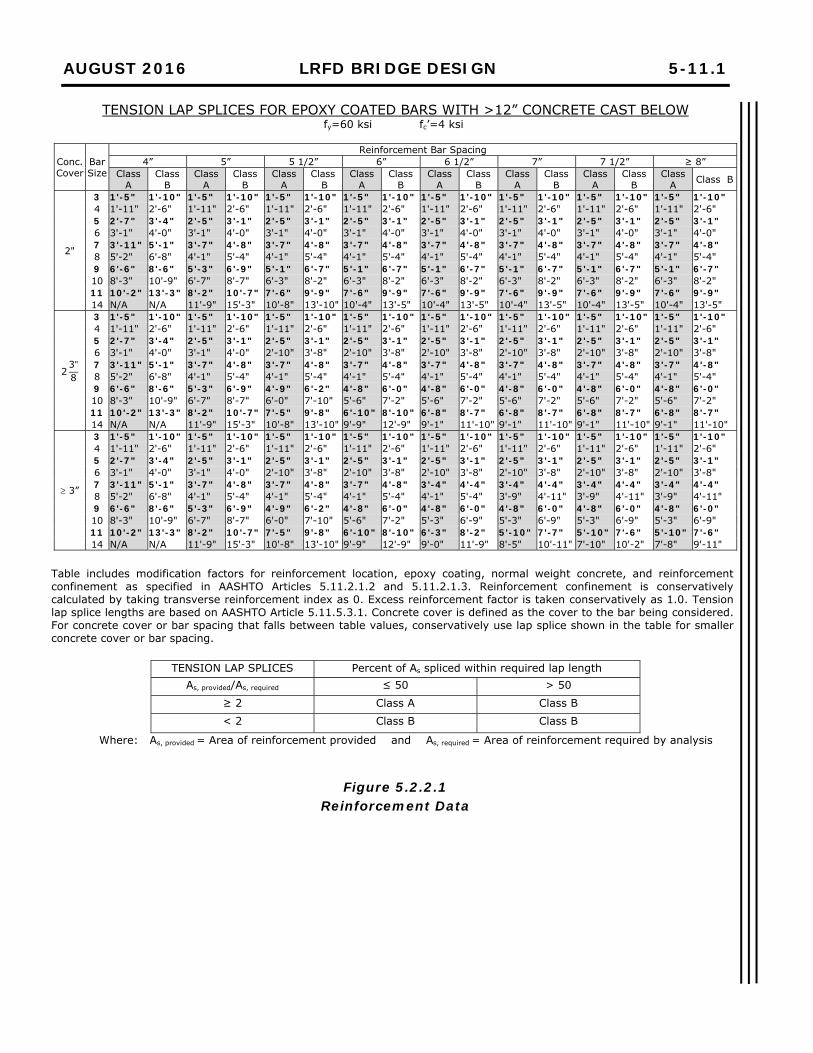
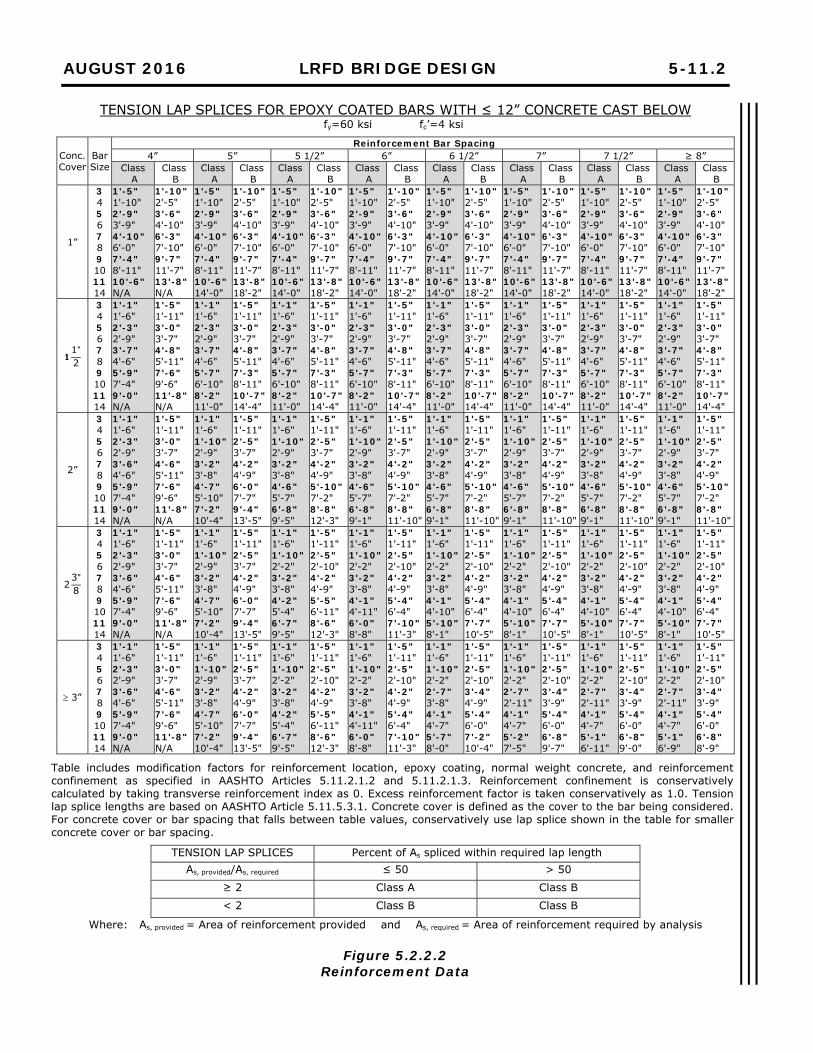
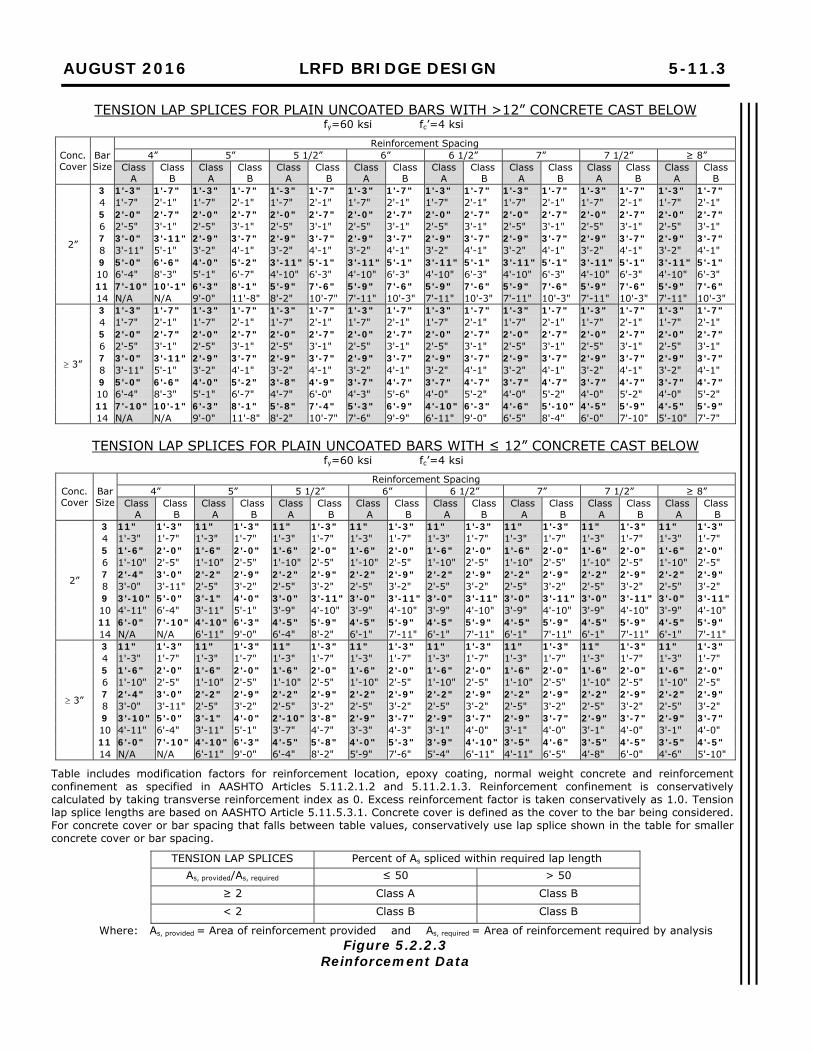
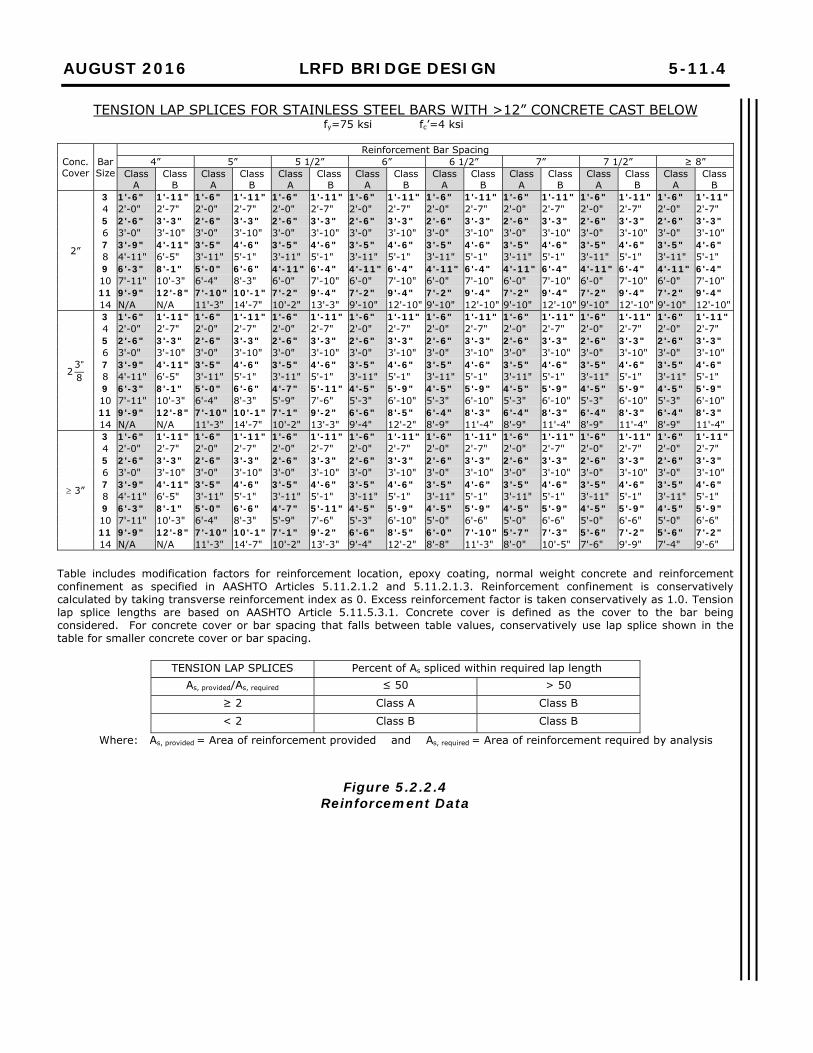
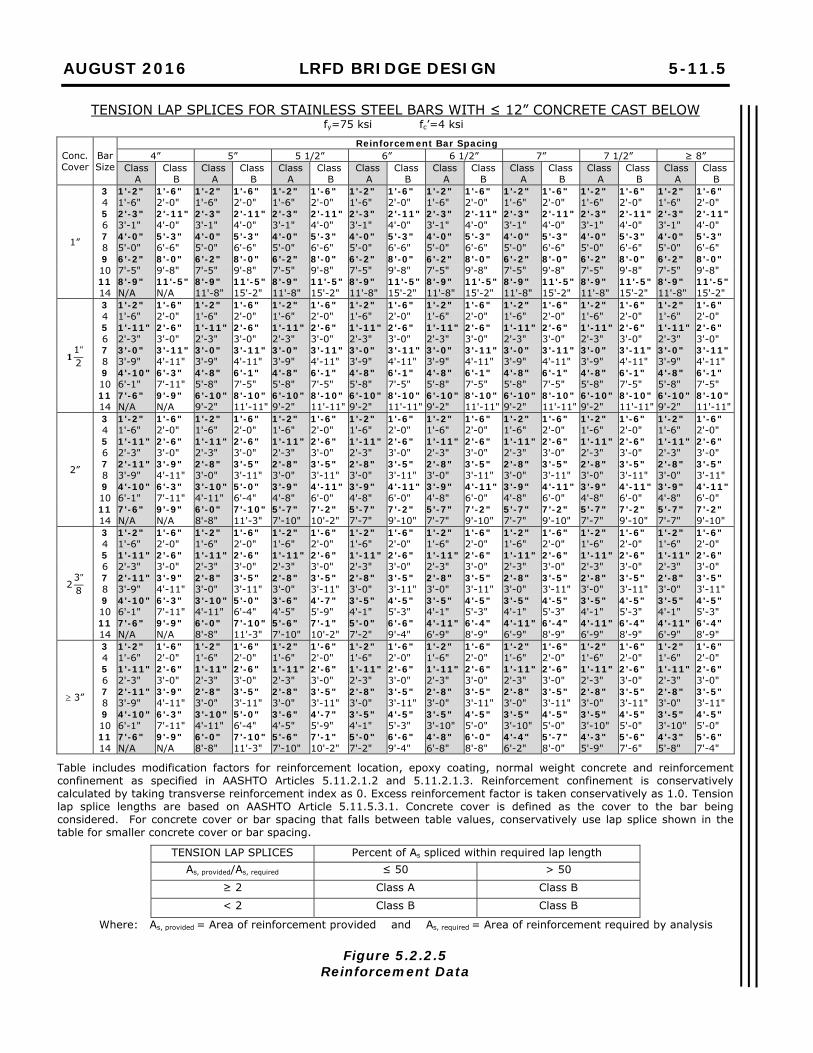
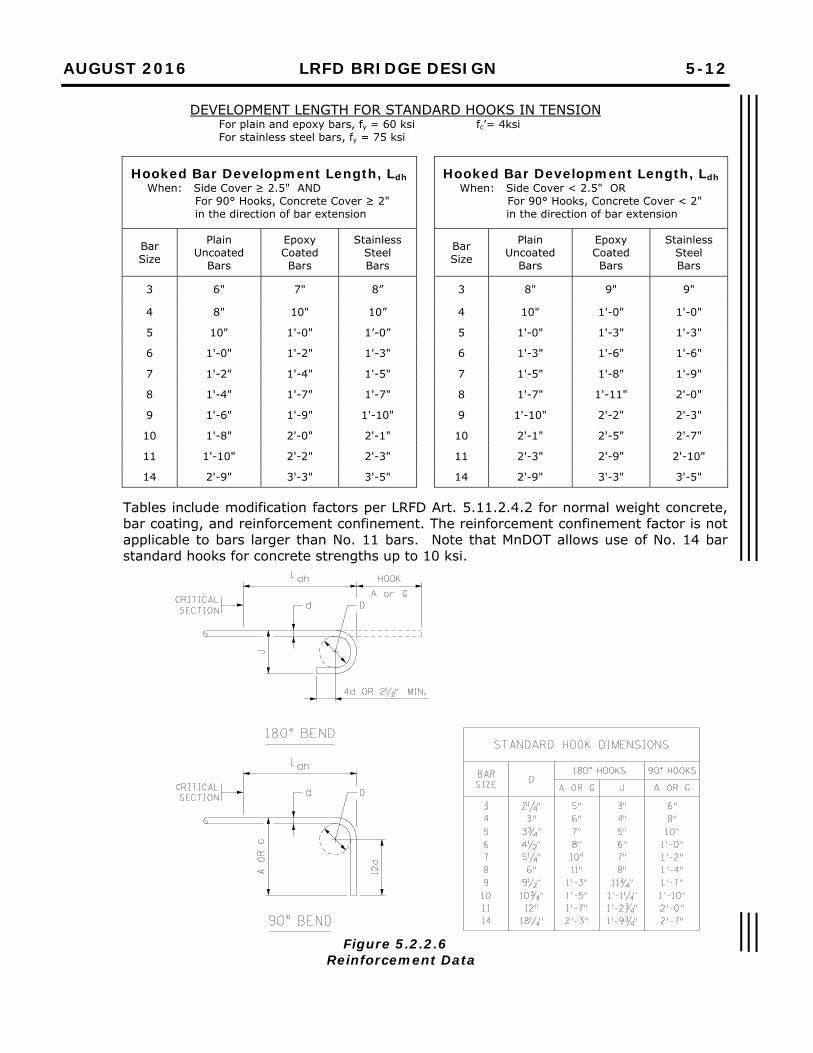
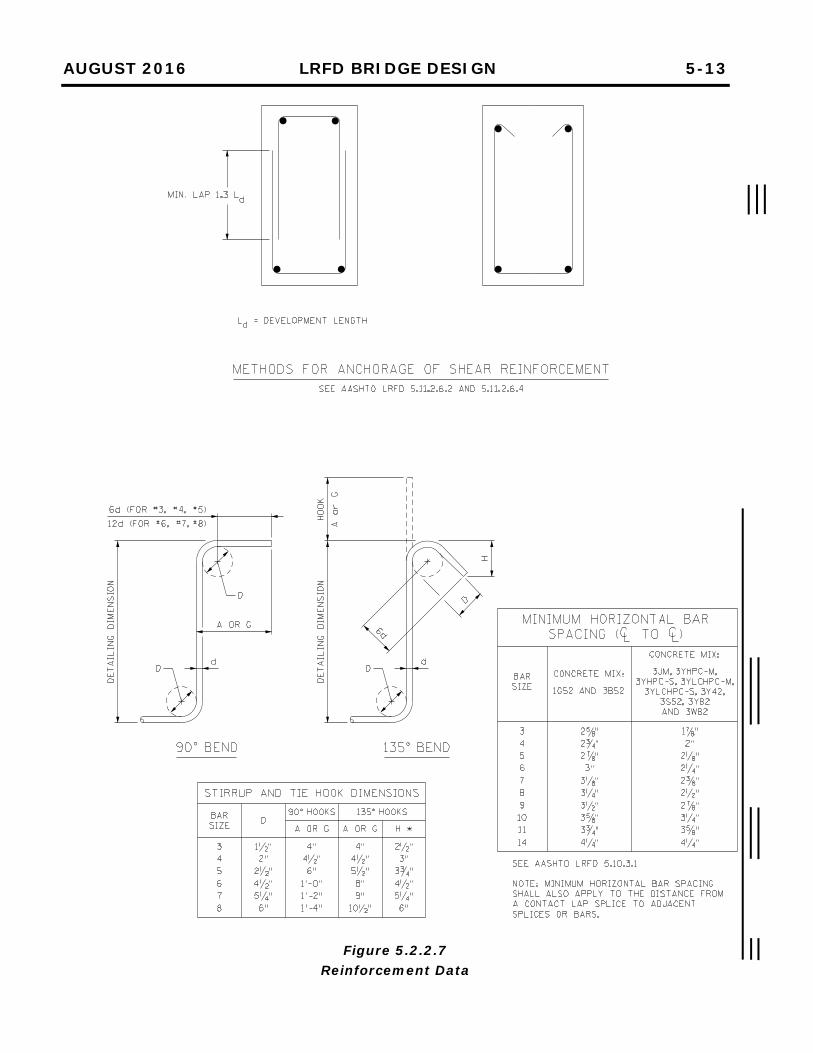
The weight of spiral reinforcement on a per foot basis is provided in Table 5.2.2.3. The standard spiral reinforcement is 1/2 inch diameter with a 3 inch pitch. When selecting the size of round columns, use outside dimensions that are consistent with cover requirements and standard spiral outside diameters. Figure 5.2.2.1 through 5.2.2.5 contain development length (Class A lap) and tension lap splice design tables for epoxy coated, plain uncoated, and stainless steel reinforcement bars. Knowing the bar size, location, concrete cover, bar spacing, and class of splice, designers can readily find the appropriate lap length. The tables are based on 4 ksi concrete. Figure 5.2.2.6 contains development length tables for bars with standard hooks. Values are provided for epoxy coated, plain uncoated, and stainless steel reinforcement bars. Standard hook dimensions are also included. Figure 5.2.2.7 contains graphics that illustrate acceptable methods for anchoring or lapping stirrup reinforcement. Open stirrups must have the “open” end anchored in the compression side of the member. This anchorage consists of development of the bar or hook prior to reaching a depth of d/2 or placing the hooks around longitudinal reinforcement. Detail closed double stirrups with a Class B lap. Also included in Figure 5.2.2.7 are stirrup and tie hook dimensions and a table showing minimum horizontal bar spacings for various concrete mixes.
OCTOBER 2009 LRFD BRIDGE DESIGN 5-10
Table 5.2.2.3 Weight of Spiral Reinforcement
O.D. SPIRAL
(in)
WEIGHTS IN POUNDS PER FOOT OF HEIGHT
3/8" DIA. ROD 1/2" DIA. ROD
6" PITCH
(lb/ft)
F
(lb)
3" PITCH
(lb/ft)
F
(lb)
24 4.72 7.1 16.79 12.60
26 5.12 7.7 18.19 13.65
28 5.51 8.3 19.59 14.70
30 5.91 8.9 20.99 15.75
32 6.30 9.5 22.38 16.80
34 6.69 10.1 23.78 17.85
36 7.09 10.7 25.18 18.90
38 7.48 11.2 26.58 20.00
40 7.87 11.8 27.98 21.00
42 8.27 12.4 29.38 22.00
44 8.66 13.0 30.78 23.10
46 9.06 13.6 32.18 24.10
48 9.45 14.2 33.58 25.20
50 9.84 14.8 34.98 26.20
52 10.24 15.4 36.38 27.30
54 10.63 15.9 37.77 28.30
56 11.02 16.5 39.17 29.40
58 11.42 17.1 40.57 30.40
60 11.81 17.7 41.97 31.50
62 12.21 18.3 43.37 32.50
64 12.60 18.9 44.77 33.60
66 12.99 19.5 46.17 34.60
68 13.39 20.1 47.57 35.70
For more complete coverage, see CRSI Design Handbook. Total weight = (wt. per ft x height) + F F = weight to add for finishing (this includes 11/2 turns at the top and 11/2 turns at the bottom of spiral) For additional information see MnDOT 2472 and AASHTO LRFD 5.10.6.2
AUGUST 2016 LRFD BRIDGE DESIGN 5-11.1
TENSION LAP SPLICES FOR EPOXY COATED BARS WITH >12” CONCRETE CAST BELOW fy=60 ksi fc’=4 ksi
Conc. Cover
Bar Size
Reinforcement Bar Spacing 4” 5” 5 1/2” 6” 6 1/2” 7” 7 1/2” ≥ 8”
Class A
Class B
Class A
Class B
Class A
Class B
Class A
Class B
Class A
Class B
Class A
Class B
Class A
Class B
Class A Class B
2"
3 1'-5" 1'-10" 1'-5" 1'-10" 1'-5" 1'-10" 1'-5" 1'-10" 1'-5" 1'-10" 1'-5" 1'-10" 1'-5" 1'-10" 1'-5" 1'-10" 4 1'-11" 2'-6" 1'-11" 2'-6" 1'-11" 2'-6" 1'-11" 2'-6" 1'-11" 2'-6" 1'-11" 2'-6" 1'-11" 2'-6" 1'-11" 2'-6" 5 2'-7" 3'-4" 2'-5" 3'-1" 2'-5" 3'-1" 2'-5" 3'-1" 2'-5" 3'-1" 2'-5" 3'-1" 2'-5" 3'-1" 2'-5" 3'-1" 6 3'-1" 4'-0" 3'-1" 4'-0" 3'-1" 4'-0" 3'-1" 4'-0" 3'-1" 4'-0" 3'-1" 4'-0" 3'-1" 4'-0" 3'-1" 4'-0" 7 3'-11" 5'-1" 3'-7" 4'-8" 3'-7" 4'-8" 3'-7" 4'-8" 3'-7" 4'-8" 3'-7" 4'-8" 3'-7" 4'-8" 3'-7" 4'-8" 8 5'-2" 6'-8" 4'-1" 5'-4" 4'-1" 5'-4" 4'-1" 5'-4" 4'-1" 5'-4" 4'-1" 5'-4" 4'-1" 5'-4" 4'-1" 5'-4" 9 6'-6" 8'-6" 5'-3" 6'-9" 5'-1" 6'-7" 5'-1" 6'-7" 5'-1" 6'-7" 5'-1" 6'-7" 5'-1" 6'-7" 5'-1" 6'-7" 10 8'-3" 10'-9" 6'-7" 8'-7" 6'-3" 8'-2" 6'-3" 8'-2" 6'-3" 8'-2" 6'-3" 8'-2" 6'-3" 8'-2" 6'-3" 8'-2" 11 10'-2" 13'-3" 8'-2" 10'-7" 7'-6" 9'-9" 7'-6" 9'-9" 7'-6" 9'-9" 7'-6" 9'-9" 7'-6" 9'-9" 7'-6" 9'-9" 14 N/A N/A 11'-9" 15'-3" 10'-8" 13'-10" 10'-4" 13'-5" 10'-4" 13'-5" 10'-4" 13'-5" 10'-4" 13'-5" 10'-4" 13'-5"
23"8
3 1'-5" 1'-10" 1'-5" 1'-10" 1'-5" 1'-10" 1'-5" 1'-10" 1'-5" 1'-10" 1'-5" 1'-10" 1'-5" 1'-10" 1'-5" 1'-10" 4 1'-11" 2'-6" 1'-11" 2'-6" 1'-11" 2'-6" 1'-11" 2'-6" 1'-11" 2'-6" 1'-11" 2'-6" 1'-11" 2'-6" 1'-11" 2'-6" 5 2'-7" 3'-4" 2'-5" 3'-1" 2'-5" 3'-1" 2'-5" 3'-1" 2'-5" 3'-1" 2'-5" 3'-1" 2'-5" 3'-1" 2'-5" 3'-1" 6 3'-1" 4'-0" 3'-1" 4'-0" 2'-10" 3'-8" 2'-10" 3'-8" 2'-10" 3'-8" 2'-10" 3'-8" 2'-10" 3'-8" 2'-10" 3'-8" 7 3'-11" 5'-1" 3'-7" 4'-8" 3'-7" 4'-8" 3'-7" 4'-8" 3'-7" 4'-8" 3'-7" 4'-8" 3'-7" 4'-8" 3'-7" 4'-8" 8 5'-2" 6'-8" 4'-1" 5'-4" 4'-1" 5'-4" 4'-1" 5'-4" 4'-1" 5'-4" 4'-1" 5'-4" 4'-1" 5'-4" 4'-1" 5'-4" 9 6'-6" 8'-6" 5'-3" 6'-9" 4'-9" 6'-2" 4'-8" 6'-0" 4'-8" 6'-0" 4'-8" 6'-0" 4'-8" 6'-0" 4'-8" 6'-0" 10 8'-3" 10'-9" 6'-7" 8'-7" 6'-0" 7'-10" 5'-6" 7'-2" 5'-6" 7'-2" 5'-6" 7'-2" 5'-6" 7'-2" 5'-6" 7'-2" 11 10'-2" 13'-3" 8'-2" 10'-7" 7'-5" 9'-8" 6'-10" 8'-10" 6'-8" 8'-7" 6'-8" 8'-7" 6'-8" 8'-7" 6'-8" 8'-7" 14 N/A N/A 11'-9" 15'-3" 10'-8" 13'-10" 9'-9" 12'-9" 9'-1" 11'-10" 9'-1" 11'-10" 9'-1" 11'-10" 9'-1" 11'-10"
3”
3 1'-5" 1'-10" 1'-5" 1'-10" 1'-5" 1'-10" 1'-5" 1'-10" 1'-5" 1'-10" 1'-5" 1'-10" 1'-5" 1'-10" 1'-5" 1'-10" 4 1'-11" 2'-6" 1'-11" 2'-6" 1'-11" 2'-6" 1'-11" 2'-6" 1'-11" 2'-6" 1'-11" 2'-6" 1'-11" 2'-6" 1'-11" 2'-6" 5 2'-7" 3'-4" 2'-5" 3'-1" 2'-5" 3'-1" 2'-5" 3'-1" 2'-5" 3'-1" 2'-5" 3'-1" 2'-5" 3'-1" 2'-5" 3'-1" 6 3'-1" 4'-0" 3'-1" 4'-0" 2'-10" 3'-8" 2'-10" 3'-8" 2'-10" 3'-8" 2'-10" 3'-8" 2'-10" 3'-8" 2'-10" 3'-8" 7 3'-11" 5'-1" 3'-7" 4'-8" 3'-7" 4'-8" 3'-7" 4'-8" 3'-4" 4'-4" 3'-4" 4'-4" 3'-4" 4'-4" 3'-4" 4'-4" 8 5'-2" 6'-8" 4'-1" 5'-4" 4'-1" 5'-4" 4'-1" 5'-4" 4'-1" 5'-4" 3'-9" 4'-11" 3'-9" 4'-11" 3'-9" 4'-11" 9 6'-6" 8'-6" 5'-3" 6'-9" 4'-9" 6'-2" 4'-8" 6'-0" 4'-8" 6'-0" 4'-8" 6'-0" 4'-8" 6'-0" 4'-8" 6'-0" 10 8'-3" 10'-9" 6'-7" 8'-7" 6'-0" 7'-10" 5'-6" 7'-2" 5'-3" 6'-9" 5'-3" 6'-9" 5'-3" 6'-9" 5'-3" 6'-9" 11 10'-2" 13'-3" 8'-2" 10'-7" 7'-5" 9'-8" 6'-10" 8'-10" 6'-3" 8'-2" 5'-10" 7'-7" 5'-10" 7'-6" 5'-10" 7'-6" 14 N/A N/A 11'-9" 15'-3" 10'-8" 13'-10" 9'-9" 12'-9" 9'-0" 11'-9" 8'-5" 10'-11" 7'-10" 10'-2" 7'-8" 9'-11"
Table includes modification factors for reinforcement location, epoxy coating, normal weight concrete, and reinforcement confinement as specified in AASHTO Articles 5.11.2.1.2 and 5.11.2.1.3. Reinforcement confinement is conservatively calculated by taking transverse reinforcement index as 0. Excess reinforcement factor is taken conservatively as 1.0. Tension lap splice lengths are based on AASHTO Article 5.11.5.3.1. Concrete cover is defined as the cover to the bar being considered. For concrete cover or bar spacing that falls between table values, conservatively use lap splice shown in the table for smaller concrete cover or bar spacing.
TENSION LAP SPLICES Percent of As spliced within required lap length
As, provided/As, required ≤ 50 > 50
≥ 2 Class A Class B < 2 Class B Class B
Where: As, provided = Area of reinforcement provided and As, required = Area of reinforcement required by analysis
Figure 5.2.2.1
Reinforcement Data
AUGUST 2016 LRFD BRIDGE DESIGN 5-11.2
TENSION LAP SPLICES FOR EPOXY COATED BARS WITH ≤ 12” CONCRETE CAST BELOW fy=60 ksi fc’=4 ksi
Conc. Cover
Bar Size
Reinforcement Bar Spacing 4” 5” 5 1/2” 6” 6 1/2” 7” 7 1/2” ≥ 8”
Class A
Class B
Class A
Class B
Class A
Class B
Class A
Class B
Class A
Class B
Class A
Class B
Class A
Class B
Class A
Class B
1”
3 1'-5" 1'-10" 1'-5" 1'-10" 1'-5" 1'-10" 1'-5" 1'-10" 1'-5" 1'-10" 1'-5" 1'-10" 1'-5" 1'-10" 1'-5" 1'-10" 4 1'-10" 2'-5" 1'-10" 2'-5" 1'-10" 2'-5" 1'-10" 2'-5" 1'-10" 2'-5" 1'-10" 2'-5" 1'-10" 2'-5" 1'-10" 2'-5" 5 2'-9" 3'-6" 2'-9" 3'-6" 2'-9" 3'-6" 2'-9" 3'-6" 2'-9" 3'-6" 2'-9" 3'-6" 2'-9" 3'-6" 2'-9" 3'-6" 6 3'-9" 4'-10" 3'-9" 4'-10" 3'-9" 4'-10" 3'-9" 4'-10" 3'-9" 4'-10" 3'-9" 4'-10" 3'-9" 4'-10" 3'-9" 4'-10" 7 4'-10" 6'-3" 4'-10" 6'-3" 4'-10" 6'-3" 4'-10" 6'-3" 4'-10" 6'-3" 4'-10" 6'-3" 4'-10" 6'-3" 4'-10" 6'-3" 8 6'-0" 7'-10" 6'-0" 7'-10" 6'-0" 7'-10" 6'-0" 7'-10" 6'-0" 7'-10" 6'-0" 7'-10" 6'-0" 7'-10" 6'-0" 7'-10" 9 7'-4" 9'-7" 7'-4" 9'-7" 7'-4" 9'-7" 7'-4" 9'-7" 7'-4" 9'-7" 7'-4" 9'-7" 7'-4" 9'-7" 7'-4" 9'-7" 10 8'-11" 11'-7" 8'-11" 11'-7" 8'-11" 11'-7" 8'-11" 11'-7" 8'-11" 11'-7" 8'-11" 11'-7" 8'-11" 11'-7" 8'-11" 11'-7" 11 10'-6" 13'-8" 10'-6" 13'-8" 10'-6" 13'-8" 10'-6" 13'-8" 10'-6" 13'-8" 10'-6" 13'-8" 10'-6" 13'-8" 10'-6" 13'-8" 14 N/A N/A 14'-0" 18'-2" 14'-0" 18'-2" 14'-0" 18'-2" 14'-0" 18'-2" 14'-0" 18'-2" 14'-0" 18'-2" 14'-0" 18'-2"
1"2
3 1'-1" 1'-5" 1'-1" 1'-5" 1'-1" 1'-5" 1'-1" 1'-5" 1'-1" 1'-5" 1'-1" 1'-5" 1'-1" 1'-5" 1'-1" 1'-5" 4 1'-6" 1'-11" 1'-6" 1'-11" 1'-6" 1'-11" 1'-6" 1'-11" 1'-6" 1'-11" 1'-6" 1'-11" 1'-6" 1'-11" 1'-6" 1'-11" 5 2'-3" 3'-0" 2'-3" 3'-0" 2'-3" 3'-0" 2'-3" 3'-0" 2'-3" 3'-0" 2'-3" 3'-0" 2'-3" 3'-0" 2'-3" 3'-0" 6 2'-9" 3'-7" 2'-9" 3'-7" 2'-9" 3'-7" 2'-9" 3'-7" 2'-9" 3'-7" 2'-9" 3'-7" 2'-9" 3'-7" 2'-9" 3'-7" 7 3'-7" 4'-8" 3'-7" 4'-8" 3'-7" 4'-8" 3'-7" 4'-8" 3'-7" 4'-8" 3'-7" 4'-8" 3'-7" 4'-8" 3'-7" 4'-8" 8 4'-6" 5'-11" 4'-6" 5'-11" 4'-6" 5'-11" 4'-6" 5'-11" 4'-6" 5'-11" 4'-6" 5'-11" 4'-6" 5'-11" 4'-6" 5'-11" 9 5'-9" 7'-6" 5'-7" 7'-3" 5'-7" 7'-3" 5'-7" 7'-3" 5'-7" 7'-3" 5'-7" 7'-3" 5'-7" 7'-3" 5'-7" 7'-3" 10 7'-4" 9'-6" 6'-10" 8'-11" 6'-10" 8'-11" 6'-10" 8'-11" 6'-10" 8'-11" 6'-10" 8'-11" 6'-10" 8'-11" 6'-10" 8'-11" 11 9'-0" 11'-8" 8'-2" 10'-7" 8'-2" 10'-7" 8'-2" 10'-7" 8'-2" 10'-7" 8'-2" 10'-7" 8'-2" 10'-7" 8'-2" 10'-7" 14 N/A N/A 11'-0" 14'-4" 11'-0" 14'-4" 11'-0" 14'-4" 11'-0" 14'-4" 11'-0" 14'-4" 11'-0" 14'-4" 11'-0" 14'-4"
2”
3 1'-1" 1'-5" 1'-1" 1'-5" 1'-1" 1'-5" 1'-1" 1'-5" 1'-1" 1'-5" 1'-1" 1'-5" 1'-1" 1'-5" 1'-1" 1'-5" 4 1'-6" 1'-11" 1'-6" 1'-11" 1'-6" 1'-11" 1'-6" 1'-11" 1'-6" 1'-11" 1'-6" 1'-11" 1'-6" 1'-11" 1'-6" 1'-11" 5 2'-3" 3'-0" 1'-10" 2'-5" 1'-10" 2'-5" 1'-10" 2'-5" 1'-10" 2'-5" 1'-10" 2'-5" 1'-10" 2'-5" 1'-10" 2'-5" 6 2'-9" 3'-7" 2'-9" 3'-7" 2'-9" 3'-7" 2'-9" 3'-7" 2'-9" 3'-7" 2'-9" 3'-7" 2'-9" 3'-7" 2'-9" 3'-7" 7 3'-6" 4'-6" 3'-2" 4'-2" 3'-2" 4'-2" 3'-2" 4'-2" 3'-2" 4'-2" 3'-2" 4'-2" 3'-2" 4'-2" 3'-2" 4'-2" 8 4'-6" 5'-11" 3'-8" 4'-9" 3'-8" 4'-9" 3'-8" 4'-9" 3'-8" 4'-9" 3'-8" 4'-9" 3'-8" 4'-9" 3'-8" 4'-9" 9 5'-9" 7'-6" 4'-7" 6'-0" 4'-6" 5'-10" 4'-6" 5'-10" 4'-6" 5'-10" 4'-6" 5'-10" 4'-6" 5'-10" 4'-6" 5'-10" 10 7'-4" 9'-6" 5'-10" 7'-7" 5'-7" 7'-2" 5'-7" 7'-2" 5'-7" 7'-2" 5'-7" 7'-2" 5'-7" 7'-2" 5'-7" 7'-2" 11 9'-0" 11'-8" 7'-2" 9'-4" 6'-8" 8'-8" 6'-8" 8'-8" 6'-8" 8'-8" 6'-8" 8'-8" 6'-8" 8'-8" 6'-8" 8'-8" 14 N/A N/A 10'-4" 13'-5" 9'-5" 12'-3" 9'-1" 11'-10" 9'-1" 11'-10" 9'-1" 11'-10" 9'-1" 11'-10" 9'-1" 11'-10"
23"8
3 1'-1" 1'-5" 1'-1" 1'-5" 1'-1" 1'-5" 1'-1" 1'-5" 1'-1" 1'-5" 1'-1" 1'-5" 1'-1" 1'-5" 1'-1" 1'-5" 4 1'-6" 1'-11" 1'-6" 1'-11" 1'-6" 1'-11" 1'-6" 1'-11" 1'-6" 1'-11" 1'-6" 1'-11" 1'-6" 1'-11" 1'-6" 1'-11" 5 2'-3" 3'-0" 1'-10" 2'-5" 1'-10" 2'-5" 1'-10" 2'-5" 1'-10" 2'-5" 1'-10" 2'-5" 1'-10" 2'-5" 1'-10" 2'-5" 6 2'-9" 3'-7" 2'-9" 3'-7" 2'-2" 2'-10" 2'-2" 2'-10" 2'-2" 2'-10" 2'-2" 2'-10" 2'-2" 2'-10" 2'-2" 2'-10" 7 3'-6" 4'-6" 3'-2" 4'-2" 3'-2" 4'-2" 3'-2" 4'-2" 3'-2" 4'-2" 3'-2" 4'-2" 3'-2" 4'-2" 3'-2" 4'-2" 8 4'-6" 5'-11" 3'-8" 4'-9" 3'-8" 4'-9" 3'-8" 4'-9" 3'-8" 4'-9" 3'-8" 4'-9" 3'-8" 4'-9" 3'-8" 4'-9" 9 5'-9" 7'-6" 4'-7" 6'-0" 4'-2" 5'-5" 4'-1" 5'-4" 4'-1" 5'-4" 4'-1" 5'-4" 4'-1" 5'-4" 4'-1" 5'-4" 10 7'-4" 9'-6" 5'-10" 7'-7" 5'-4" 6'-11" 4'-11" 6'-4" 4'-10" 6'-4" 4'-10" 6'-4" 4'-10" 6'-4" 4'-10" 6'-4" 11 9'-0" 11'-8" 7'-2" 9'-4" 6'-7" 8'-6" 6'-0" 7'-10" 5'-10" 7'-7" 5'-10" 7'-7" 5'-10" 7'-7" 5'-10" 7'-7" 14 N/A N/A 10'-4" 13'-5" 9'-5" 12'-3" 8'-8" 11'-3" 8'-1" 10'-5" 8'-1" 10'-5" 8'-1" 10'-5" 8'-1" 10'-5"
3”
3 1'-1" 1'-5" 1'-1" 1'-5" 1'-1" 1'-5" 1'-1" 1'-5" 1'-1" 1'-5" 1'-1" 1'-5" 1'-1" 1'-5" 1'-1" 1'-5" 4 1'-6" 1'-11" 1'-6" 1'-11" 1'-6" 1'-11" 1'-6" 1'-11" 1'-6" 1'-11" 1'-6" 1'-11" 1'-6" 1'-11" 1'-6" 1'-11" 5 2'-3" 3'-0" 1'-10" 2'-5" 1'-10" 2'-5" 1'-10" 2'-5" 1'-10" 2'-5" 1'-10" 2'-5" 1'-10" 2'-5" 1'-10" 2'-5" 6 2'-9" 3'-7" 2'-9" 3'-7" 2'-2" 2'-10" 2'-2" 2'-10" 2'-2" 2'-10" 2'-2" 2'-10" 2'-2" 2'-10" 2'-2" 2'-10" 7 3'-6" 4'-6" 3'-2" 4'-2" 3'-2" 4'-2" 3'-2" 4'-2" 2'-7" 3'-4" 2'-7" 3'-4" 2'-7" 3'-4" 2'-7" 3'-4" 8 4'-6" 5'-11" 3'-8" 4'-9" 3'-8" 4'-9" 3'-8" 4'-9" 3'-8" 4'-9" 2'-11" 3'-9" 2'-11" 3'-9" 2'-11" 3'-9" 9 5'-9" 7'-6" 4'-7" 6'-0" 4'-2" 5'-5" 4'-1" 5'-4" 4'-1" 5'-4" 4'-1" 5'-4" 4'-1" 5'-4" 4'-1" 5'-4" 10 7'-4" 9'-6" 5'-10" 7'-7" 5'-4" 6'-11" 4'-11" 6'-4" 4'-7" 6'-0" 4'-7" 6'-0" 4'-7" 6'-0" 4'-7" 6'-0" 11 9'-0" 11'-8" 7'-2" 9'-4" 6'-7" 8'-6" 6'-0" 7'-10" 5'-7" 7'-2" 5'-2" 6'-8" 5'-1" 6'-8" 5'-1" 6'-8" 14 N/A N/A 10'-4" 13'-5" 9'-5" 12'-3" 8'-8" 11'-3" 8'-0" 10'-4" 7'-5" 9'-7" 6'-11" 9'-0" 6'-9" 8'-9"
Table includes modification factors for reinforcement location, epoxy coating, normal weight concrete, and reinforcement confinement as specified in AASHTO Articles 5.11.2.1.2 and 5.11.2.1.3. Reinforcement confinement is conservatively calculated by taking transverse reinforcement index as 0. Excess reinforcement factor is taken conservatively as 1.0. Tension lap splice lengths are based on AASHTO Article 5.11.5.3.1. Concrete cover is defined as the cover to the bar being considered. For concrete cover or bar spacing that falls between table values, conservatively use lap splice shown in the table for smaller concrete cover or bar spacing.
TENSION LAP SPLICES Percent of As spliced within required lap length As, provided/As, required ≤ 50 > 50
≥ 2 Class A Class B
< 2 Class B Class B
Where: As, provided = Area of reinforcement provided and As, required = Area of reinforcement required by analysis
Figure 5.2.2.2 Reinforcement Data
AUGUST 2016 LRFD BRIDGE DESIGN 5-11.3
TENSION LAP SPLICES FOR PLAIN UNCOATED BARS WITH >12” CONCRETE CAST BELOW fy=60 ksi fc’=4 ksi
Conc. Cover
Bar Size
Reinforcement Spacing 4” 5” 5 1/2” 6” 6 1/2” 7” 7 1/2” ≥ 8”
Class A
Class B
Class A
Class B
Class A
Class B
Class A
Class B
Class A
Class B
Class A
Class B
Class A
Class B
Class A
Class B
2”
3 1'-3" 1'-7" 1'-3" 1'-7" 1'-3" 1'-7" 1'-3" 1'-7" 1'-3" 1'-7" 1'-3" 1'-7" 1'-3" 1'-7" 1'-3" 1'-7" 4 1'-7" 2'-1" 1'-7" 2'-1" 1'-7" 2'-1" 1'-7" 2'-1" 1'-7" 2'-1" 1'-7" 2'-1" 1'-7" 2'-1" 1'-7" 2'-1" 5 2'-0" 2'-7" 2'-0" 2'-7" 2'-0" 2'-7" 2'-0" 2'-7" 2'-0" 2'-7" 2'-0" 2'-7" 2'-0" 2'-7" 2'-0" 2'-7" 6 2'-5" 3'-1" 2'-5" 3'-1" 2'-5" 3'-1" 2'-5" 3'-1" 2'-5" 3'-1" 2'-5" 3'-1" 2'-5" 3'-1" 2'-5" 3'-1" 7 3'-0" 3'-11" 2'-9" 3'-7" 2'-9" 3'-7" 2'-9" 3'-7" 2'-9" 3'-7" 2'-9" 3'-7" 2'-9" 3'-7" 2'-9" 3'-7" 8 3'-11" 5'-1" 3'-2" 4'-1" 3'-2" 4'-1" 3'-2" 4'-1" 3'-2" 4'-1" 3'-2" 4'-1" 3'-2" 4'-1" 3'-2" 4'-1" 9 5'-0" 6'-6" 4'-0" 5'-2" 3'-11" 5'-1" 3'-11" 5'-1" 3'-11" 5'-1" 3'-11" 5'-1" 3'-11" 5'-1" 3'-11" 5'-1" 10 6'-4" 8'-3" 5'-1" 6'-7" 4'-10" 6'-3" 4'-10" 6'-3" 4'-10" 6'-3" 4'-10" 6'-3" 4'-10" 6'-3" 4'-10" 6'-3" 11 7'-10" 10'-1" 6'-3" 8'-1" 5'-9" 7'-6" 5'-9" 7'-6" 5'-9" 7'-6" 5'-9" 7'-6" 5'-9" 7'-6" 5'-9" 7'-6" 14 N/A N/A 9'-0" 11'-8" 8'-2" 10'-7" 7'-11" 10'-3" 7'-11" 10'-3" 7'-11" 10'-3" 7'-11" 10'-3" 7'-11" 10'-3"
3”
3 1'-3" 1'-7" 1'-3" 1'-7" 1'-3" 1'-7" 1'-3" 1'-7" 1'-3" 1'-7" 1'-3" 1'-7" 1'-3" 1'-7" 1'-3" 1'-7" 4 1'-7" 2'-1" 1'-7" 2'-1" 1'-7" 2'-1" 1'-7" 2'-1" 1'-7" 2'-1" 1'-7" 2'-1" 1'-7" 2'-1" 1'-7" 2'-1" 5 2'-0" 2'-7" 2'-0" 2'-7" 2'-0" 2'-7" 2'-0" 2'-7" 2'-0" 2'-7" 2'-0" 2'-7" 2'-0" 2'-7" 2'-0" 2'-7" 6 2'-5" 3'-1" 2'-5" 3'-1" 2'-5" 3'-1" 2'-5" 3'-1" 2'-5" 3'-1" 2'-5" 3'-1" 2'-5" 3'-1" 2'-5" 3'-1" 7 3'-0" 3'-11" 2'-9" 3'-7" 2'-9" 3'-7" 2'-9" 3'-7" 2'-9" 3'-7" 2'-9" 3'-7" 2'-9" 3'-7" 2'-9" 3'-7" 8 3'-11" 5'-1" 3'-2" 4'-1" 3'-2" 4'-1" 3'-2" 4'-1" 3'-2" 4'-1" 3'-2" 4'-1" 3'-2" 4'-1" 3'-2" 4'-1" 9 5'-0" 6'-6" 4'-0" 5'-2" 3'-8" 4'-9" 3'-7" 4'-7" 3'-7" 4'-7" 3'-7" 4'-7" 3'-7" 4'-7" 3'-7" 4'-7" 10 6'-4" 8'-3" 5'-1" 6'-7" 4'-7" 6'-0" 4'-3" 5'-6" 4'-0" 5'-2" 4'-0" 5'-2" 4'-0" 5'-2" 4'-0" 5'-2" 11 7'-10" 10'-1" 6'-3" 8'-1" 5'-8" 7'-4" 5'-3" 6'-9" 4'-10" 6'-3" 4'-6" 5'-10" 4'-5" 5'-9" 4'-5" 5'-9" 14 N/A N/A 9'-0" 11'-8" 8'-2" 10'-7" 7'-6" 9'-9" 6'-11" 9'-0" 6'-5" 8'-4" 6'-0" 7'-10" 5'-10" 7'-7"
TENSION LAP SPLICES FOR PLAIN UNCOATED BARS WITH ≤ 12” CONCRETE CAST BELOW
fy=60 ksi fc’=4 ksi
Conc. Cover
Bar Size
Reinforcement Spacing 4” 5” 5 1/2” 6” 6 1/2” 7” 7 1/2” ≥ 8”
Class A
Class B
Class A
Class B
Class A
Class B
Class A
Class B
Class A
Class B
Class A
Class B
Class A
Class B
Class A
Class B
2”
3 11" 1'-3" 11" 1'-3" 11" 1'-3" 11" 1'-3" 11" 1'-3" 11" 1'-3" 11" 1'-3" 11" 1'-3" 4 1'-3" 1'-7" 1'-3" 1'-7" 1'-3" 1'-7" 1'-3" 1'-7" 1'-3" 1'-7" 1'-3" 1'-7" 1'-3" 1'-7" 1'-3" 1'-7" 5 1'-6" 2'-0" 1'-6" 2'-0" 1'-6" 2'-0" 1'-6" 2'-0" 1'-6" 2'-0" 1'-6" 2'-0" 1'-6" 2'-0" 1'-6" 2'-0" 6 1'-10" 2'-5" 1'-10" 2'-5" 1'-10" 2'-5" 1'-10" 2'-5" 1'-10" 2'-5" 1'-10" 2'-5" 1'-10" 2'-5" 1'-10" 2'-5" 7 2'-4" 3'-0" 2'-2" 2'-9" 2'-2" 2'-9" 2'-2" 2'-9" 2'-2" 2'-9" 2'-2" 2'-9" 2'-2" 2'-9" 2'-2" 2'-9" 8 3'-0" 3'-11" 2'-5" 3'-2" 2'-5" 3'-2" 2'-5" 3'-2" 2'-5" 3'-2" 2'-5" 3'-2" 2'-5" 3'-2" 2'-5" 3'-2" 9 3'-10" 5'-0" 3'-1" 4'-0" 3'-0" 3'-11" 3'-0" 3'-11" 3'-0" 3'-11" 3'-0" 3'-11" 3'-0" 3'-11" 3'-0" 3'-11" 10 4'-11" 6'-4" 3'-11" 5'-1" 3'-9" 4'-10" 3'-9" 4'-10" 3'-9" 4'-10" 3'-9" 4'-10" 3'-9" 4'-10" 3'-9" 4'-10" 11 6'-0" 7'-10" 4'-10" 6'-3" 4'-5" 5'-9" 4'-5" 5'-9" 4'-5" 5'-9" 4'-5" 5'-9" 4'-5" 5'-9" 4'-5" 5'-9" 14 N/A N/A 6'-11" 9'-0" 6'-4" 8'-2" 6'-1" 7'-11" 6'-1" 7'-11" 6'-1" 7'-11" 6'-1" 7'-11" 6'-1" 7'-11"
3”
3 11" 1'-3" 11" 1'-3" 11" 1'-3" 11" 1'-3" 11" 1'-3" 11" 1'-3" 11" 1'-3" 11" 1'-3" 4 1'-3" 1'-7" 1'-3" 1'-7" 1'-3" 1'-7" 1'-3" 1'-7" 1'-3" 1'-7" 1'-3" 1'-7" 1'-3" 1'-7" 1'-3" 1'-7" 5 1'-6" 2'-0" 1'-6" 2'-0" 1'-6" 2'-0" 1'-6" 2'-0" 1'-6" 2'-0" 1'-6" 2'-0" 1'-6" 2'-0" 1'-6" 2'-0" 6 1'-10" 2'-5" 1'-10" 2'-5" 1'-10" 2'-5" 1'-10" 2'-5" 1'-10" 2'-5" 1'-10" 2'-5" 1'-10" 2'-5" 1'-10" 2'-5" 7 2'-4" 3'-0" 2'-2" 2'-9" 2'-2" 2'-9" 2'-2" 2'-9" 2'-2" 2'-9" 2'-2" 2'-9" 2'-2" 2'-9" 2'-2" 2'-9" 8 3'-0" 3'-11" 2'-5" 3'-2" 2'-5" 3'-2" 2'-5" 3'-2" 2'-5" 3'-2" 2'-5" 3'-2" 2'-5" 3'-2" 2'-5" 3'-2" 9 3'-10" 5'-0" 3'-1" 4'-0" 2'-10" 3'-8" 2'-9" 3'-7" 2'-9" 3'-7" 2'-9" 3'-7" 2'-9" 3'-7" 2'-9" 3'-7" 10 4'-11" 6'-4" 3'-11" 5'-1" 3'-7" 4'-7" 3'-3" 4'-3" 3'-1" 4'-0" 3'-1" 4'-0" 3'-1" 4'-0" 3'-1" 4'-0" 11 6'-0" 7'-10" 4'-10" 6'-3" 4'-5" 5'-8" 4'-0" 5'-3" 3'-9" 4'-10" 3'-5" 4'-6" 3'-5" 4'-5" 3'-5" 4'-5" 14 N/A N/A 6'-11" 9'-0" 6'-4" 8'-2" 5'-9" 7'-6" 5'-4" 6'-11" 4'-11" 6'-5" 4'-8" 6'-0" 4'-6" 5'-10"
Table includes modification factors for reinforcement location, epoxy coating, normal weight concrete and reinforcement confinement as specified in AASHTO Articles 5.11.2.1.2 and 5.11.2.1.3. Reinforcement confinement is conservatively calculated by taking transverse reinforcement index as 0. Excess reinforcement factor is taken conservatively as 1.0. Tension lap splice lengths are based on AASHTO Article 5.11.5.3.1. Concrete cover is defined as the cover to the bar being considered. For concrete cover or bar spacing that falls between table values, conservatively use lap splice shown in the table for smaller concrete cover or bar spacing.
TENSION LAP SPLICES Percent of As spliced within required lap length As, provided/As, required ≤ 50 > 50
≥ 2 Class A Class B
< 2 Class B Class B
Where: As, provided = Area of reinforcement provided and As, required = Area of reinforcement required by analysis Figure 5.2.2.3
Reinforcement Data
AUGUST 2016 LRFD BRIDGE DESIGN 5-11.4
TENSION LAP SPLICES FOR STAINLESS STEEL BARS WITH >12” CONCRETE CAST BELOW fy=75 ksi fc’=4 ksi
Conc. Cover
Bar Size
Reinforcement Bar Spacing 4” 5” 5 1/2” 6” 6 1/2” 7” 7 1/2” ≥ 8”
Class A
Class B
Class A
Class B
Class A
Class B
Class A
Class B
Class A
Class B
Class A
Class B
Class A
Class B
Class A
Class B
2”
3 1'-6" 1'-11" 1'-6" 1'-11" 1'-6" 1'-11" 1'-6" 1'-11" 1'-6" 1'-11" 1'-6" 1'-11" 1'-6" 1'-11" 1'-6" 1'-11" 4 2'-0" 2'-7" 2'-0" 2'-7" 2'-0" 2'-7" 2'-0" 2'-7" 2'-0" 2'-7" 2'-0" 2'-7" 2'-0" 2'-7" 2'-0" 2'-7" 5 2'-6" 3'-3" 2'-6" 3'-3" 2'-6" 3'-3" 2'-6" 3'-3" 2'-6" 3'-3" 2'-6" 3'-3" 2'-6" 3'-3" 2'-6" 3'-3" 6 3'-0" 3'-10" 3'-0" 3'-10" 3'-0" 3'-10" 3'-0" 3'-10" 3'-0" 3'-10" 3'-0" 3'-10" 3'-0" 3'-10" 3'-0" 3'-10" 7 3'-9" 4'-11" 3'-5" 4'-6" 3'-5" 4'-6" 3'-5" 4'-6" 3'-5" 4'-6" 3'-5" 4'-6" 3'-5" 4'-6" 3'-5" 4'-6" 8 4'-11" 6'-5" 3'-11" 5'-1" 3'-11" 5'-1" 3'-11" 5'-1" 3'-11" 5'-1" 3'-11" 5'-1" 3'-11" 5'-1" 3'-11" 5'-1" 9 6'-3" 8'-1" 5'-0" 6'-6" 4'-11" 6'-4" 4'-11" 6'-4" 4'-11" 6'-4" 4'-11" 6'-4" 4'-11" 6'-4" 4'-11" 6'-4" 10 7'-11" 10'-3" 6'-4" 8'-3" 6'-0" 7'-10" 6'-0" 7'-10" 6'-0" 7'-10" 6'-0" 7'-10" 6'-0" 7'-10" 6'-0" 7'-10" 11 9'-9" 12'-8" 7'-10" 10'-1" 7'-2" 9'-4" 7'-2" 9'-4" 7'-2" 9'-4" 7'-2" 9'-4" 7'-2" 9'-4" 7'-2" 9'-4" 14 N/A N/A 11'-3" 14'-7" 10'-2" 13'-3" 9'-10" 12'-10" 9'-10" 12'-10" 9'-10" 12'-10" 9'-10" 12'-10" 9'-10" 12'-10"
23"8
3 1'-6" 1'-11" 1'-6" 1'-11" 1'-6" 1'-11" 1'-6" 1'-11" 1'-6" 1'-11" 1'-6" 1'-11" 1'-6" 1'-11" 1'-6" 1'-11" 4 2'-0" 2'-7" 2'-0" 2'-7" 2'-0" 2'-7" 2'-0" 2'-7" 2'-0" 2'-7" 2'-0" 2'-7" 2'-0" 2'-7" 2'-0" 2'-7" 5 2'-6" 3'-3" 2'-6" 3'-3" 2'-6" 3'-3" 2'-6" 3'-3" 2'-6" 3'-3" 2'-6" 3'-3" 2'-6" 3'-3" 2'-6" 3'-3" 6 3'-0" 3'-10" 3'-0" 3'-10" 3'-0" 3'-10" 3'-0" 3'-10" 3'-0" 3'-10" 3'-0" 3'-10" 3'-0" 3'-10" 3'-0" 3'-10" 7 3'-9" 4'-11" 3'-5" 4'-6" 3'-5" 4'-6" 3'-5" 4'-6" 3'-5" 4'-6" 3'-5" 4'-6" 3'-5" 4'-6" 3'-5" 4'-6" 8 4'-11" 6'-5" 3'-11" 5'-1" 3'-11" 5'-1" 3'-11" 5'-1" 3'-11" 5'-1" 3'-11" 5'-1" 3'-11" 5'-1" 3'-11" 5'-1" 9 6'-3" 8'-1" 5'-0" 6'-6" 4'-7" 5'-11" 4'-5" 5'-9" 4'-5" 5'-9" 4'-5" 5'-9" 4'-5" 5'-9" 4'-5" 5'-9" 10 7'-11" 10'-3" 6'-4" 8'-3" 5'-9" 7'-6" 5'-3" 6'-10" 5'-3" 6'-10" 5'-3" 6'-10" 5'-3" 6'-10" 5'-3" 6'-10" 11 9'-9" 12'-8" 7'-10" 10'-1" 7'-1" 9'-2" 6'-6" 8'-5" 6'-4" 8'-3" 6'-4" 8'-3" 6'-4" 8'-3" 6'-4" 8'-3" 14 N/A N/A 11'-3" 14'-7" 10'-2" 13'-3" 9'-4" 12'-2" 8'-9" 11'-4" 8'-9" 11'-4" 8'-9" 11'-4" 8'-9" 11'-4"
3”
3 1'-6" 1'-11" 1'-6" 1'-11" 1'-6" 1'-11" 1'-6" 1'-11" 1'-6" 1'-11" 1'-6" 1'-11" 1'-6" 1'-11" 1'-6" 1'-11" 4 2'-0" 2'-7" 2'-0" 2'-7" 2'-0" 2'-7" 2'-0" 2'-7" 2'-0" 2'-7" 2'-0" 2'-7" 2'-0" 2'-7" 2'-0" 2'-7" 5 2'-6" 3'-3" 2'-6" 3'-3" 2'-6" 3'-3" 2'-6" 3'-3" 2'-6" 3'-3" 2'-6" 3'-3" 2'-6" 3'-3" 2'-6" 3'-3" 6 3'-0" 3'-10" 3'-0" 3'-10" 3'-0" 3'-10" 3'-0" 3'-10" 3'-0" 3'-10" 3'-0" 3'-10" 3'-0" 3'-10" 3'-0" 3'-10" 7 3'-9" 4'-11" 3'-5" 4'-6" 3'-5" 4'-6" 3'-5" 4'-6" 3'-5" 4'-6" 3'-5" 4'-6" 3'-5" 4'-6" 3'-5" 4'-6" 8 4'-11" 6'-5" 3'-11" 5'-1" 3'-11" 5'-1" 3'-11" 5'-1" 3'-11" 5'-1" 3'-11" 5'-1" 3'-11" 5'-1" 3'-11" 5'-1" 9 6'-3" 8'-1" 5'-0" 6'-6" 4'-7" 5'-11" 4'-5" 5'-9" 4'-5" 5'-9" 4'-5" 5'-9" 4'-5" 5'-9" 4'-5" 5'-9" 10 7'-11" 10'-3" 6'-4" 8'-3" 5'-9" 7'-6" 5'-3" 6'-10" 5'-0" 6'-6" 5'-0" 6'-6" 5'-0" 6'-6" 5'-0" 6'-6" 11 9'-9" 12'-8" 7'-10" 10'-1" 7'-1" 9'-2" 6'-6" 8'-5" 6'-0" 7'-10" 5'-7" 7'-3" 5'-6" 7'-2" 5'-6" 7'-2" 14 N/A N/A 11'-3" 14'-7" 10'-2" 13'-3" 9'-4" 12'-2" 8'-8" 11'-3" 8'-0" 10'-5" 7'-6" 9'-9" 7'-4" 9'-6"
Table includes modification factors for reinforcement location, epoxy coating, normal weight concrete and reinforcement confinement as specified in AASHTO Articles 5.11.2.1.2 and 5.11.2.1.3. Reinforcement confinement is conservatively calculated by taking transverse reinforcement index as 0. Excess reinforcement factor is taken conservatively as 1.0. Tension lap splice lengths are based on AASHTO Article 5.11.5.3.1. Concrete cover is defined as the cover to the bar being considered. For concrete cover or bar spacing that falls between table values, conservatively use lap splice shown in the table for smaller concrete cover or bar spacing.
TENSION LAP SPLICES Percent of As spliced within required lap length As, provided/As, required ≤ 50 > 50
≥ 2 Class A Class B < 2 Class B Class B
Where: As, provided = Area of reinforcement provided and As, required = Area of reinforcement required by analysis
Figure 5.2.2.4 Reinforcement Data
AUGUST 2016 LRFD BRIDGE DESIGN 5-11.5
TENSION LAP SPLICES FOR STAINLESS STEEL BARS WITH ≤ 12” CONCRETE CAST BELOW fy=75 ksi fc’=4 ksi
Conc. Cover
Bar Size
Reinforcement Bar Spacing 4” 5” 5 1/2” 6” 6 1/2” 7” 7 1/2” ≥ 8”
Class A
Class B
Class A
Class B
Class A
Class B
Class A
Class B
Class A
Class B
Class A
Class B
Class A
Class B
Class A
Class B
1”
3 1'-2" 1'-6" 1'-2" 1'-6" 1'-2" 1'-6" 1'-2" 1'-6" 1'-2" 1'-6" 1'-2" 1'-6" 1'-2" 1'-6" 1'-2" 1'-6" 4 1'-6" 2'-0" 1'-6" 2'-0" 1'-6" 2'-0" 1'-6" 2'-0" 1'-6" 2'-0" 1'-6" 2'-0" 1'-6" 2'-0" 1'-6" 2'-0" 5 2'-3" 2'-11" 2'-3" 2'-11" 2'-3" 2'-11" 2'-3" 2'-11" 2'-3" 2'-11" 2'-3" 2'-11" 2'-3" 2'-11" 2'-3" 2'-11" 6 3'-1" 4'-0" 3'-1" 4'-0" 3'-1" 4'-0" 3'-1" 4'-0" 3'-1" 4'-0" 3'-1" 4'-0" 3'-1" 4'-0" 3'-1" 4'-0" 7 4'-0" 5'-3" 4'-0" 5'-3" 4'-0" 5'-3" 4'-0" 5'-3" 4'-0" 5'-3" 4'-0" 5'-3" 4'-0" 5'-3" 4'-0" 5'-3" 8 5'-0" 6'-6" 5'-0" 6'-6" 5'-0" 6'-6" 5'-0" 6'-6" 5'-0" 6'-6" 5'-0" 6'-6" 5'-0" 6'-6" 5'-0" 6'-6" 9 6'-2" 8'-0" 6'-2" 8'-0" 6'-2" 8'-0" 6'-2" 8'-0" 6'-2" 8'-0" 6'-2" 8'-0" 6'-2" 8'-0" 6'-2" 8'-0" 10 7'-5" 9'-8" 7'-5" 9'-8" 7'-5" 9'-8" 7'-5" 9'-8" 7'-5" 9'-8" 7'-5" 9'-8" 7'-5" 9'-8" 7'-5" 9'-8" 11 8'-9" 11'-5" 8'-9" 11'-5" 8'-9" 11'-5" 8'-9" 11'-5" 8'-9" 11'-5" 8'-9" 11'-5" 8'-9" 11'-5" 8'-9" 11'-5" 14 N/A N/A 11'-8" 15'-2" 11'-8" 15'-2" 11'-8" 15'-2" 11'-8" 15'-2" 11'-8" 15'-2" 11'-8" 15'-2" 11'-8" 15'-2"
1"2
3 1'-2" 1'-6" 1'-2" 1'-6" 1'-2" 1'-6" 1'-2" 1'-6" 1'-2" 1'-6" 1'-2" 1'-6" 1'-2" 1'-6" 1'-2" 1'-6" 4 1'-6" 2'-0" 1'-6" 2'-0" 1'-6" 2'-0" 1'-6" 2'-0" 1'-6" 2'-0" 1'-6" 2'-0" 1'-6" 2'-0" 1'-6" 2'-0" 5 1'-11" 2'-6" 1'-11" 2'-6" 1'-11" 2'-6" 1'-11" 2'-6" 1'-11" 2'-6" 1'-11" 2'-6" 1'-11" 2'-6" 1'-11" 2'-6" 6 2'-3" 3'-0" 2'-3" 3'-0" 2'-3" 3'-0" 2'-3" 3'-0" 2'-3" 3'-0" 2'-3" 3'-0" 2'-3" 3'-0" 2'-3" 3'-0" 7 3'-0" 3'-11" 3'-0" 3'-11" 3'-0" 3'-11" 3'-0" 3'-11" 3'-0" 3'-11" 3'-0" 3'-11" 3'-0" 3'-11" 3'-0" 3'-11" 8 3'-9" 4'-11" 3'-9" 4'-11" 3'-9" 4'-11" 3'-9" 4'-11" 3'-9" 4'-11" 3'-9" 4'-11" 3'-9" 4'-11" 3'-9" 4'-11" 9 4'-10" 6'-3" 4'-8" 6'-1" 4'-8" 6'-1" 4'-8" 6'-1" 4'-8" 6'-1" 4'-8" 6'-1" 4'-8" 6'-1" 4'-8" 6'-1" 10 6'-1" 7'-11" 5'-8" 7'-5" 5'-8" 7'-5" 5'-8" 7'-5" 5'-8" 7'-5" 5'-8" 7'-5" 5'-8" 7'-5" 5'-8" 7'-5" 11 7'-6" 9'-9" 6'-10" 8'-10" 6'-10" 8'-10" 6'-10" 8'-10" 6'-10" 8'-10" 6'-10" 8'-10" 6'-10" 8'-10" 6'-10" 8'-10" 14 N/A N/A 9'-2" 11'-11" 9'-2" 11'-11" 9'-2" 11'-11" 9'-2" 11'-11" 9'-2" 11'-11" 9'-2" 11'-11" 9'-2" 11'-11"
2”
3 1'-2" 1'-6" 1'-2" 1'-6" 1'-2" 1'-6" 1'-2" 1'-6" 1'-2" 1'-6" 1'-2" 1'-6" 1'-2" 1'-6" 1'-2" 1'-6" 4 1'-6" 2'-0" 1'-6" 2'-0" 1'-6" 2'-0" 1'-6" 2'-0" 1'-6" 2'-0" 1'-6" 2'-0" 1'-6" 2'-0" 1'-6" 2'-0" 5 1'-11" 2'-6" 1'-11" 2'-6" 1'-11" 2'-6" 1'-11" 2'-6" 1'-11" 2'-6" 1'-11" 2'-6" 1'-11" 2'-6" 1'-11" 2'-6" 6 2'-3" 3'-0" 2'-3" 3'-0" 2'-3" 3'-0" 2'-3" 3'-0" 2'-3" 3'-0" 2'-3" 3'-0" 2'-3" 3'-0" 2'-3" 3'-0" 7 2'-11" 3'-9" 2'-8" 3'-5" 2'-8" 3'-5" 2'-8" 3'-5" 2'-8" 3'-5" 2'-8" 3'-5" 2'-8" 3'-5" 2'-8" 3'-5" 8 3'-9" 4'-11" 3'-0" 3'-11" 3'-0" 3'-11" 3'-0" 3'-11" 3'-0" 3'-11" 3'-0" 3'-11" 3'-0" 3'-11" 3'-0" 3'-11" 9 4'-10" 6'-3" 3'-10" 5'-0" 3'-9" 4'-11" 3'-9" 4'-11" 3'-9" 4'-11" 3'-9" 4'-11" 3'-9" 4'-11" 3'-9" 4'-11" 10 6'-1" 7'-11" 4'-11" 6'-4" 4'-8" 6'-0" 4'-8" 6'-0" 4'-8" 6'-0" 4'-8" 6'-0" 4'-8" 6'-0" 4'-8" 6'-0" 11 7'-6" 9'-9" 6'-0" 7'-10" 5'-7" 7'-2" 5'-7" 7'-2" 5'-7" 7'-2" 5'-7" 7'-2" 5'-7" 7'-2" 5'-7" 7'-2" 14 N/A N/A 8'-8" 11'-3" 7'-10" 10'-2" 7'-7" 9'-10" 7'-7" 9'-10" 7'-7" 9'-10" 7'-7" 9'-10" 7'-7" 9'-10"
23"8
3 1'-2" 1'-6" 1'-2" 1'-6" 1'-2" 1'-6" 1'-2" 1'-6" 1'-2" 1'-6" 1'-2" 1'-6" 1'-2" 1'-6" 1'-2" 1'-6" 4 1'-6" 2'-0" 1'-6" 2'-0" 1'-6" 2'-0" 1'-6" 2'-0" 1'-6" 2'-0" 1'-6" 2'-0" 1'-6" 2'-0" 1'-6" 2'-0" 5 1'-11" 2'-6" 1'-11" 2'-6" 1'-11" 2'-6" 1'-11" 2'-6" 1'-11" 2'-6" 1'-11" 2'-6" 1'-11" 2'-6" 1'-11" 2'-6" 6 2'-3" 3'-0" 2'-3" 3'-0" 2'-3" 3'-0" 2'-3" 3'-0" 2'-3" 3'-0" 2'-3" 3'-0" 2'-3" 3'-0" 2'-3" 3'-0" 7 2'-11" 3'-9" 2'-8" 3'-5" 2'-8" 3'-5" 2'-8" 3'-5" 2'-8" 3'-5" 2'-8" 3'-5" 2'-8" 3'-5" 2'-8" 3'-5" 8 3'-9" 4'-11" 3'-0" 3'-11" 3'-0" 3'-11" 3'-0" 3'-11" 3'-0" 3'-11" 3'-0" 3'-11" 3'-0" 3'-11" 3'-0" 3'-11" 9 4'-10" 6'-3" 3'-10" 5'-0" 3'-6" 4'-7" 3'-5" 4'-5" 3'-5" 4'-5" 3'-5" 4'-5" 3'-5" 4'-5" 3'-5" 4'-5" 10 6'-1" 7'-11" 4'-11" 6'-4" 4'-5" 5'-9" 4'-1" 5'-3" 4'-1" 5'-3" 4'-1" 5'-3" 4'-1" 5'-3" 4'-1" 5'-3" 11 7'-6" 9'-9" 6'-0" 7'-10" 5'-6" 7'-1" 5'-0" 6'-6" 4'-11" 6'-4" 4'-11" 6'-4" 4'-11" 6'-4" 4'-11" 6'-4" 14 N/A N/A 8'-8" 11'-3" 7'-10" 10'-2" 7'-2" 9'-4" 6'-9" 8'-9" 6'-9" 8'-9" 6'-9" 8'-9" 6'-9" 8'-9"
3”
3 1'-2" 1'-6" 1'-2" 1'-6" 1'-2" 1'-6" 1'-2" 1'-6" 1'-2" 1'-6" 1'-2" 1'-6" 1'-2" 1'-6" 1'-2" 1'-6" 4 1'-6" 2'-0" 1'-6" 2'-0" 1'-6" 2'-0" 1'-6" 2'-0" 1'-6" 2'-0" 1'-6" 2'-0" 1'-6" 2'-0" 1'-6" 2'-0" 5 1'-11" 2'-6" 1'-11" 2'-6" 1'-11" 2'-6" 1'-11" 2'-6" 1'-11" 2'-6" 1'-11" 2'-6" 1'-11" 2'-6" 1'-11" 2'-6" 6 2'-3" 3'-0" 2'-3" 3'-0" 2'-3" 3'-0" 2'-3" 3'-0" 2'-3" 3'-0" 2'-3" 3'-0" 2'-3" 3'-0" 2'-3" 3'-0" 7 2'-11" 3'-9" 2'-8" 3'-5" 2'-8" 3'-5" 2'-8" 3'-5" 2'-8" 3'-5" 2'-8" 3'-5" 2'-8" 3'-5" 2'-8" 3'-5" 8 3'-9" 4'-11" 3'-0" 3'-11" 3'-0" 3'-11" 3'-0" 3'-11" 3'-0" 3'-11" 3'-0" 3'-11" 3'-0" 3'-11" 3'-0" 3'-11" 9 4'-10" 6'-3" 3'-10" 5'-0" 3'-6" 4'-7" 3'-5" 4'-5" 3'-5" 4'-5" 3'-5" 4'-5" 3'-5" 4'-5" 3'-5" 4'-5" 10 6'-1" 7'-11" 4'-11" 6'-4" 4'-5" 5'-9" 4'-1" 5'-3" 3'-10" 5'-0" 3'-10" 5'-0" 3'-10" 5'-0" 3'-10" 5'-0" 11 7'-6" 9'-9" 6'-0" 7'-10" 5'-6" 7'-1" 5'-0" 6'-6" 4'-8" 6'-0" 4'-4" 5'-7" 4'-3" 5'-6" 4'-3" 5'-6" 14 N/A N/A 8'-8" 11'-3" 7'-10" 10'-2" 7'-2" 9'-4" 6'-8" 8'-8" 6'-2" 8'-0" 5'-9" 7'-6" 5'-8" 7'-4"
Table includes modification factors for reinforcement location, epoxy coating, normal weight concrete and reinforcement confinement as specified in AASHTO Articles 5.11.2.1.2 and 5.11.2.1.3. Reinforcement confinement is conservatively calculated by taking transverse reinforcement index as 0. Excess reinforcement factor is taken conservatively as 1.0. Tension lap splice lengths are based on AASHTO Article 5.11.5.3.1. Concrete cover is defined as the cover to the bar being considered. For concrete cover or bar spacing that falls between table values, conservatively use lap splice shown in the table for smaller concrete cover or bar spacing.
TENSION LAP SPLICES Percent of As spliced within required lap length As, provided/As, required ≤ 50 > 50
≥ 2 Class A Class B
< 2 Class B Class B
Where: As, provided = Area of reinforcement provided and As, required = Area of reinforcement required by analysis
Figure 5.2.2.5 Reinforcement Data
AUGUST 2016 LRFD BRIDGE DESIGN 5-12
DEVELOPMENT LENGTH FOR STANDARD HOOKS IN TENSION For plain and epoxy bars, fy = 60 ksi fc’= 4ksi For stainless steel bars, fy = 75 ksi
Tables include modification factors per LRFD Art. 5.11.2.4.2 for normal weight concrete, bar coating, and reinforcement confinement. The reinforcement confinement factor is not applicable to bars larger than No. 11 bars. Note that MnDOT allows use of No. 14 bar standard hooks for concrete strengths up to 10 ksi.
Figure 5.2.2.6 Reinforcement Data
Hooked Bar Development Length, Ldh When: Side Cover ≥ 2.5" AND
For 90° Hooks, Concrete Cover ≥ 2" in the direction of bar extension
Hooked Bar Development Length, Ldh
When: Side Cover < 2.5" OR For 90° Hooks, Concrete Cover < 2" in the direction of bar extension
Bar Size
Plain Uncoated
Bars
Epoxy Coated Bars
Stainless Steel Bars
Bar Size
Plain Uncoated
Bars
Epoxy Coated Bars
Stainless Steel Bars
3 6" 7" 8” 3 8" 9" 9"
4 8" 10" 10” 4 10" 1'-0" 1'-0"
5 10" 1'-0" 1’-0” 5 1'-0" 1'-3" 1'-3"
6 1'-0" 1'-2" 1'-3" 6 1'-3" 1'-6" 1'-6"
7 1'-2" 1'-4" 1'-5" 7 1'-5" 1'-8" 1'-9"
8 1'-4" 1'-7" 1'-7" 8 1'-7" 1'-11" 2'-0"
9 1'-6" 1'-9" 1'-10" 9 1'-10" 2'-2" 2'-3"
10 1'-8" 2'-0" 2'-1" 10 2'-1" 2'-5" 2'-7"
11 1'-10" 2'-2" 2'-3" 11 2'-3" 2'-9" 2'-10"
14 2'-9" 3'-3" 3'-5" 14 2'-9" 3'-3" 3'-5"
AUGUST 2016 LRFD BRIDGE DESIGN 5-13
Figure 5.2.2.7
Reinforcement Data
JULY 2014 LRFD BRIDGE DESIGN 5-14
5.2.3 General Reinforcement Practices
5.2.4 Reinforcement Bar Couplers
5.2.5 Adhesive Anchors
Reinforcement practices follow those shown by the Concrete Reinforcing Steel Institute (C.R.S.I.) in the Manual of Standard Practice. These practices include: 1) For bent bars, omit the last length dimension on reinforcement bar
details. 2) Use standard length bars for all but the last bar in long bar runs. 3) Use a maximum length of 60 feet for #4 deck or slab bars and
40 feet for other applications. 4) Use a maximum length of 60 feet for bars #5 and larger. 5) Recognize that bar cutting and bending tolerances are 1 inch for bars
and that this tolerance is important for long straight bars that do not have lap splices to provide dimensional flexibility. Refer to MnDOT document Suggested Reinforcement Detailing Practices, which is located at http://www.dot.state.mn.us/bridge/standards.html, for more guidance on rebar detailing to account for tolerances.
6) Reinforcement bars longer than 60 feet or larger than #11 are available only on special order, and should be avoided. Designers should check with the State Bridge Design Engineer before using special order sizes or lengths.
Reinforcement bar couplers are expensive compared to conventional lap splices. Where lap splices cannot be readily used (bridge widening projects, staged construction, large river pier longitudinal bars—anywhere that the available space for a rebar projection is limited), couplers should be considered. Where possible, stagger reinforcement bar couplers in order to distribute the stiffness of the couplers. There are numerous coupler types and sizes. For members that require couplers, consider the coupler outside diameter and length when detailing reinforcement, in order to avoid congestion and clear cover issues. Similar to bar couplers, adhesive anchors are expensive. Adhesive anchors are typically used to attach secondary structural members to new concrete or primary structural members to existing (old) concrete. A typical use is to attach a metal rail to a concrete base. See Article 13.3.2 of this manual for an adhesive anchor design example. Adhesive anchors shall not be used for constant tension applications.
JULY 2014 LRFD BRIDGE DESIGN 5-15
5.2.6 Shrinkage and Temperature Reinforcement [5.10.8]
5.3 Concrete Slabs
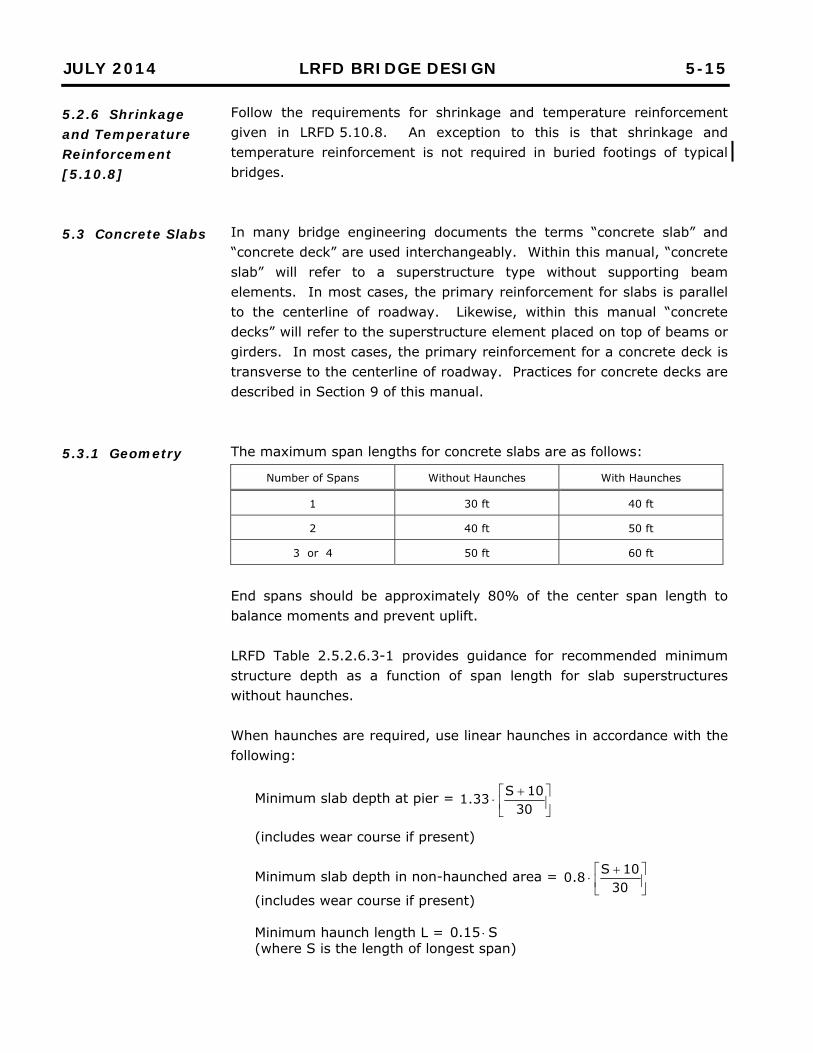
5.3.1 Geometry
Follow the requirements for shrinkage and temperature reinforcement given in LRFD 5.10.8. An exception to this is that shrinkage and temperature reinforcement is not required in buried footings of typical bridges. In many bridge engineering documents the terms “concrete slab” and “concrete deck” are used interchangeably. Within this manual, “concrete slab” will refer to a superstructure type without supporting beam elements. In most cases, the primary reinforcement for slabs is parallel to the centerline of roadway. Likewise, within this manual “concrete decks” will refer to the superstructure element placed on top of beams or girders. In most cases, the primary reinforcement for a concrete deck is transverse to the centerline of roadway. Practices for concrete decks are described in Section 9 of this manual. The maximum span lengths for concrete slabs are as follows:
Number of Spans Without Haunches With Haunches
1 30 ft 40 ft
2 40 ft 50 ft
3 or 4 50 ft 60 ft
End spans should be approximately 80% of the center span length to balance moments and prevent uplift. LRFD Table 2.5.2.6.3-1 provides guidance for recommended minimum structure depth as a function of span length for slab superstructures without haunches. When haunches are required, use linear haunches in accordance with the following:
Minimum slab depth at pier =
3010S33.1
(includes wear course if present)
Minimum slab depth in non-haunched area =
3010S8.0
(includes wear course if present) Minimum haunch length L = S15.0 (where S is the length of longest span)
JULY 2014 LRFD BRIDGE DESIGN 5-16
5.3.2 Design/Analysis
[5.14.4.1]
[5.7.3.4]
Skew can be ignored for slab bridges with skew angles of 20° or less. Place transverse reinforcement parallel to substructures. For slab bridges with skew angles between 20 and 45 Perform a two-dimensional plate analysis. Place transverse reinforcement normal to the bridge centerline. Slab type bridges are not allowed for bridges with skew angles greater than 45. Slab bridges curved in plan may be designed as if straight. Designers should consider and investigate the need for providing additional reinforcement in the portion of the slab outside of chord lines connecting substructure units. Do not include the concrete wearing course in section properties when performing strength and serviceability checks. This will ensure that the slab has adequate capacity if traffic is carried on the bridge during operations associated with milling off the old wearing course and the placement of a new wearing course. An exception to this is when checking the top reinforcement in the negative moment region for flexural crack control. When checking crack control for slabs and decks, use the Class 2 exposure condition (γe = 0.75). Although the actual clear cover may exceed 2 inches for the slab/deck top bars, calculate dc using a maximum clear concrete cover equal to 2 inches. Determine reinforcement bar cutoff points based on strength, serviceability, and minimum reinforcement requirements. Although not required by AASHTO, MnDOT requires a check of one-way shear in slab bridges. For determination of the live load distribution factor for shear, assume that the live load is distributed over the entire width of the superstructure. Load all lanes and use the appropriate multiple presence factor. For determination of factored shear resistance, use 0.2 . If shear reinforcement is needed, try thickening the slab to eliminate it. If shear reinforcement must be used, calculate the appropriate and values using LRFD Article 5.8.3.4.2.
OCTOBER 2009 LRFD BRIDGE DESIGN 5-17
5.3.4 Reinforcement Layout
5.3.3 Exterior Strip [4.6.2.1.4b]
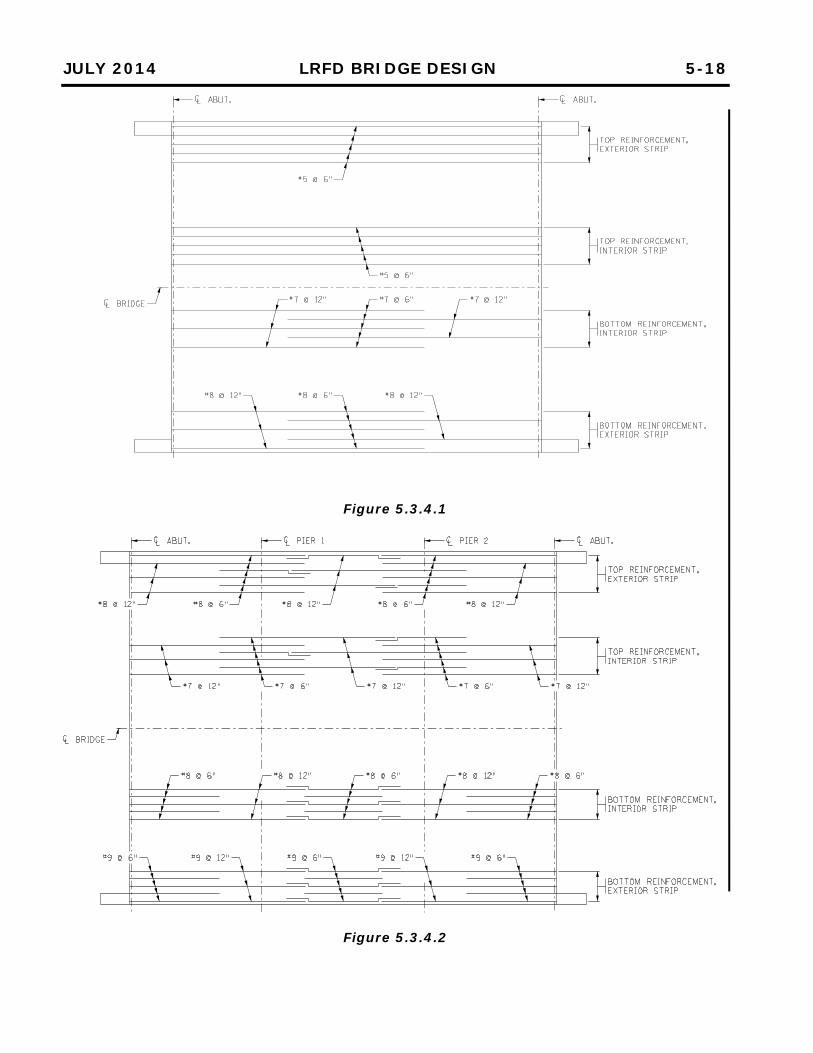
Outside edges of slab bridges contain the exterior strip or edge beam. At a minimum, the exterior strip reinforcement must match that of the interior portions of the bridge. Special consideration for the design of edge beams is required for bridges with sidewalks. Separately poured sidewalks may be considered to act compositely with the slab when adequate means of shear transfer at the interface is provided. Use the following guidelines for layout of reinforcement in a simple span slab bridge (see example in Figure 5.3.4.1):
Interior strip reinforcement Top longitudinal – 1 spacing, 1 bar size Bottom longitudinal – 2 spacings, 1 bar size Exterior strip reinforcement Top longitudinal – 1 spacing, 1 bar size Bottom longitudinal – 2 spacings, 1 bar size Transverse reinforcement – 1 spacing, 1 bar size
Use the following guidelines for layout of reinforcement in a continuous slab bridge: Option 1 (see example in Figure 5.3.4.2):
Interior strip reinforcement Top longitudinal – 2 spacings, 1 bar size Bottom longitudinal – 2 spacings, 1 bar size Exterior strip reinforcement Top longitudinal – 2 spacings, 1 bar size Bottom longitudinal – 2 spacings, 1 bar size Transverse reinforcement – 1 spacing, 1 bar size
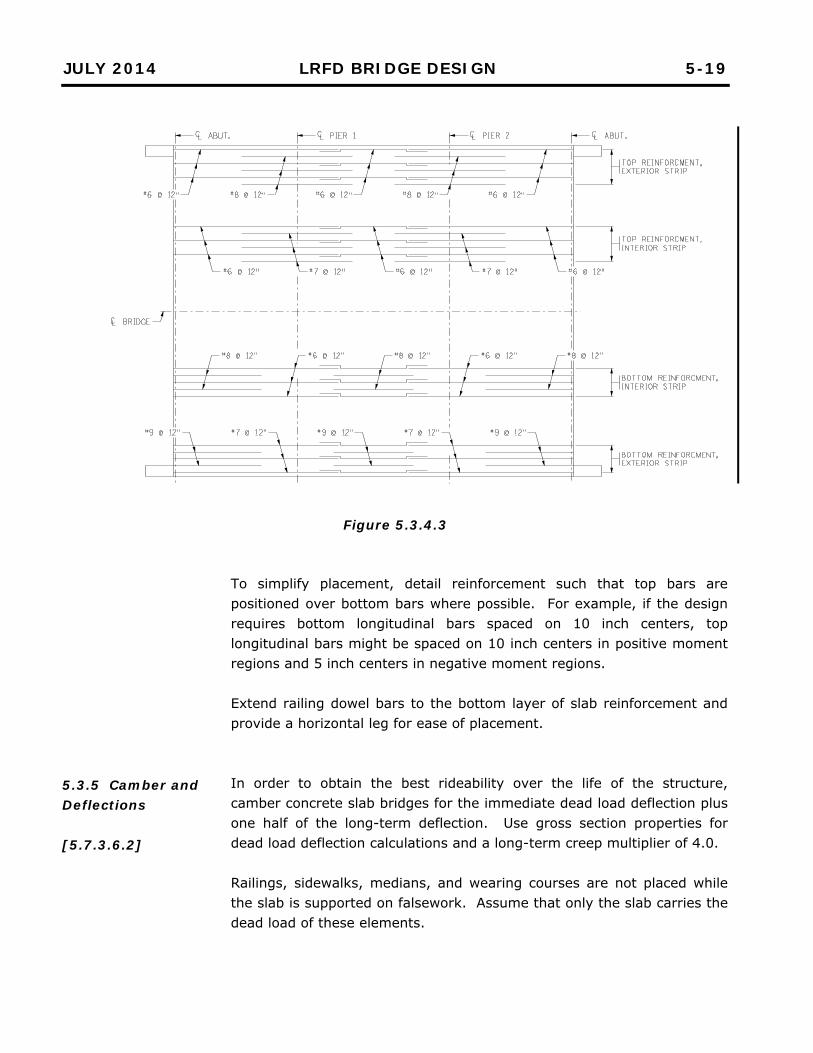
Option 2 (see example in Figure 5.3.4.3):
Interior strip reinforcement Top longitudinal – 2 spacings, 2 bar sizes Bottom longitudinal – 2 spacings, 2 bar sizes Exterior strip reinforcement Top longitudinal – 2 spacings, 2 bar sizes Bottom longitudinal – 2 spacings, 2 bar sizes Transverse reinforcement - 1 spacing, 1 bar size
JULY 2014 LRFD BRIDGE DESIGN 5-18
Figure 5.3.4.1
Figure 5.3.4.2
JULY 2014 LRFD BRIDGE DESIGN 5-19
5.3.5 Camber and Deflections [5.7.3.6.2]
Figure 5.3.4.3
To simplify placement, detail reinforcement such that top bars are positioned over bottom bars where possible. For example, if the design requires bottom longitudinal bars spaced on 10 inch centers, top longitudinal bars might be spaced on 10 inch centers in positive moment regions and 5 inch centers in negative moment regions. Extend railing dowel bars to the bottom layer of slab reinforcement and provide a horizontal leg for ease of placement. In order to obtain the best rideability over the life of the structure, camber concrete slab bridges for the immediate dead load deflection plus one half of the long-term deflection. Use gross section properties for dead load deflection calculations and a long-term creep multiplier of 4.0. Railings, sidewalks, medians, and wearing courses are not placed while the slab is supported on falsework. Assume that only the slab carries the dead load of these elements.
JULY 2014 LRFD BRIDGE DESIGN 5-20
5.4 Pretensioned Concrete
5.4.1 Geometry
Check live load deflections using the effective moment of inertia. The effective moment of inertia may be approximated as one half of the gross moment of inertia. The maximum live load deflection is L/800 for vehicular bridges that do not carry pedestrians and L/1000 for vehicular bridges that carry pedestrians. Consider the concrete wearing course to be functioning compositely with the slab for live load deflection. Assume the riding surface has lost 1/2 inch of thickness due to wear. Use a live load distribution factor equal to the number of lanes times the multiple presence factor and divide by the width of the slab for the deflection check. The details of pretensioned concrete beams are presented on standard Bridge Details Part II sheets incorporated into a set of plans. Prepare a separate sheet for each type of beam in the project. Beams are identical if they have the same cross-section, strand layout, concrete strengths, and a similar length. To simplify fabrication and construction, try to minimize the number of beam types incorporated into a project. Design exterior beams with a strength equal to or greater than the interior beams. Provide a minimum stool along centerline of beam that is based on 11/2 inches of minimum stool at edge of flange. For dead load computations assume an average stool height equal to the minimum stool height plus 1 inch. Deck cross slopes, horizontal curves, and vertical curves all impact the stool height. There are several Bridge Office practices regarding the type and location of diaphragms or cross frames for prestressed beam bridges: 1) Design prestressed I-beam bridges without continuity over the piers,
except in the following situations: a) Bridge is over water with pile bent piers supported by unstable
soils such as fat clay. b) Bridge is over water with pile bent piers at risk for large ice or
debris loading and pier does not have an encasement wall. 2) Intermediate diaphragms are not required for 14RB, 18RB, 22RB, and
27M beams. For all other beam sizes, the following applies. Intermediate diaphragms are not required for single spans of 45'-0" or less. Provide one diaphragm per every 45 feet of span length, spaced evenly along the span as stated in Table 5.4.1.1.
JULY 2014 LRFD BRIDGE DESIGN 5-21
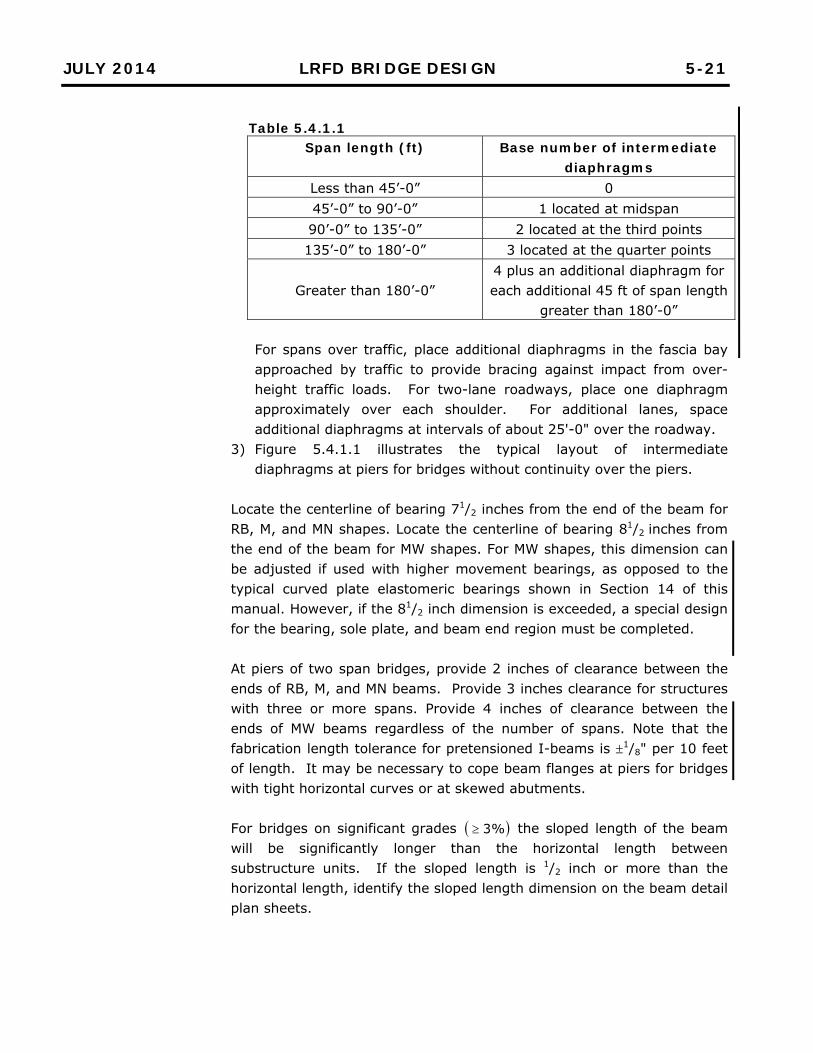
Table 5.4.1.1
Span length (ft) Base number of intermediate diaphragms
Less than 45’-0” 0 45’-0” to 90’-0” 1 located at midspan 90’-0” to 135’-0” 2 located at the third points 135’-0” to 180’-0” 3 located at the quarter points
Greater than 180’-0” 4 plus an additional diaphragm for each additional 45 ft of span length
greater than 180’-0”
For spans over traffic, place additional diaphragms in the fascia bay approached by traffic to provide bracing against impact from over-height traffic loads. For two-lane roadways, place one diaphragm approximately over each shoulder. For additional lanes, space additional diaphragms at intervals of about 25'-0" over the roadway.
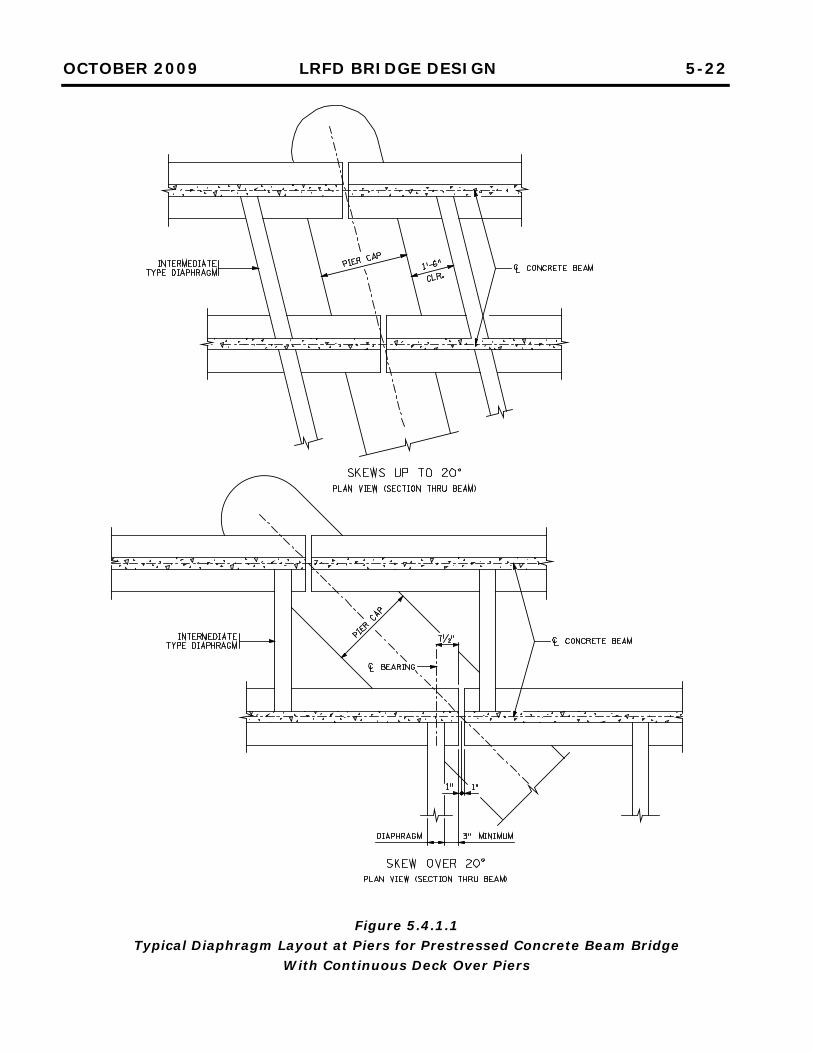
3) Figure 5.4.1.1 illustrates the typical layout of intermediate diaphragms at piers for bridges without continuity over the piers.
Locate the centerline of bearing 71/2 inches from the end of the beam for RB, M, and MN shapes. Locate the centerline of bearing 81/2 inches from the end of the beam for MW shapes. For MW shapes, this dimension can be adjusted if used with higher movement bearings, as opposed to the typical curved plate elastomeric bearings shown in Section 14 of this manual. However, if the 81/2 inch dimension is exceeded, a special design for the bearing, sole plate, and beam end region must be completed. At piers of two span bridges, provide 2 inches of clearance between the ends of RB, M, and MN beams. Provide 3 inches clearance for structures with three or more spans. Provide 4 inches of clearance between the ends of MW beams regardless of the number of spans. Note that the fabrication length tolerance for pretensioned I-beams is 1/8" per 10 feet of length. It may be necessary to cope beam flanges at piers for bridges with tight horizontal curves or at skewed abutments. For bridges on significant grades %3 the sloped length of the beam will be significantly longer than the horizontal length between substructure units. If the sloped length is 1/2 inch or more than the horizontal length, identify the sloped length dimension on the beam detail plan sheets.
OCTOBER 2009 LRFD BRIDGE DESIGN 5-22
Figure 5.4.1.1 Typical Diaphragm Layout at Piers for Prestressed Concrete Beam Bridge
With Continuous Deck Over Piers
OCTOBER 2009 LRFD BRIDGE DESIGN 5-23
5.4.3 Design/Analysis
5.4.2 Stress Limits [5.9.3] [5.9.4]
Similar to the Standard Specifications, the LRFD Specifications identify service load stress limits for different elements and locations. For typical prestressed beams, check tension and compression service load stresses at two stages. The first stage is when the prestress force is transferred to the beams in the fabricator’s yard. The second stage is after all losses have occurred and the beam is in the fully constructed bridge. Design pretensioned beams with a maximum tension at transfer (after initial losses) of:
ksi2.0f0948.0 ci (where cif is in ksi)
Design pretensioned beams with a maximum tension after all losses of:
cf19.0 (where cf is in ksi)
Use the "approximate method" provided in LRFD Article 5.9.5.3 to compute prestress losses. Design all pretensioned beams using uncoated low relaxation 0.6 inch ( 2
s in217.0A ) diameter strands and epoxy coated mild reinforcement. At the time of prestress transfer (initial), the minimum required concrete strength ( cif ) is 4.5 ksi and the maximum is limited to 7.5 ksi. At the termination of the curing period (final), the minimum concrete strength ( cf ) is 5 ksi and the maximum strength is 9 ksi. Higher initial or final strengths may be used with approval from the Bridge Design Engineer. An initial concrete strength greater than 7 ksi may add cost to the beam. The fabricator cannot remove the beam from the bed until a cylinder break indicates the concrete has reached its specified initial strength. With strengths higher than 7 ksi, the fabricator may have to leave the beam in the bed longer than the normal 16-18 hours or add increased amounts of superplastizer and cement, thereby increasing the cost of the beam. If possible, the initial concrete strength should be 0.5 to 1.0 ksi lower than the final concrete strength. Since concrete naturally gains strength with age, the final strength of the beam will be more efficiently utilized.
JULY 2014 LRFD BRIDGE DESIGN 5-24
If the calculated initial or final strengths differ by more than 0.3 ksi from those used in the analysis, reanalyze the beam with the new values. Reanalysis is needed because changes to the concrete strengths cif and
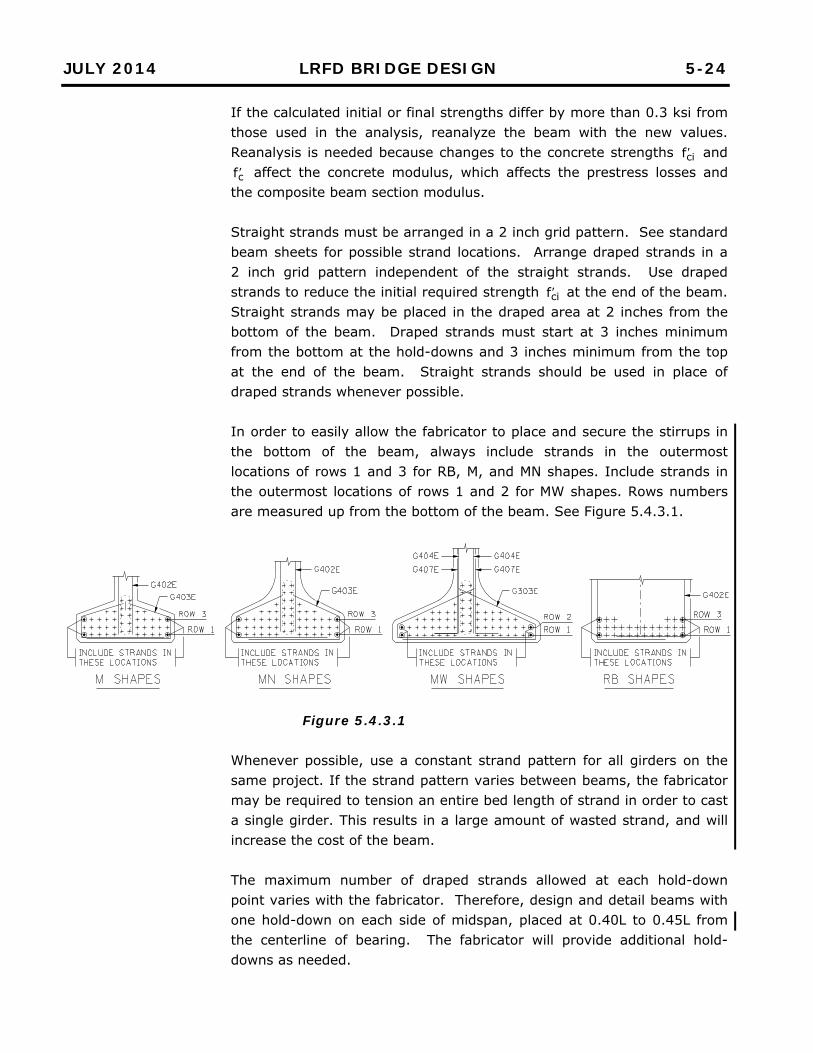
cf affect the concrete modulus, which affects the prestress losses and the composite beam section modulus. Straight strands must be arranged in a 2 inch grid pattern. See standard beam sheets for possible strand locations. Arrange draped strands in a 2 inch grid pattern independent of the straight strands. Use draped strands to reduce the initial required strength cif at the end of the beam. Straight strands may be placed in the draped area at 2 inches from the bottom of the beam. Draped strands must start at 3 inches minimum from the bottom at the hold-downs and 3 inches minimum from the top at the end of the beam. Straight strands should be used in place of draped strands whenever possible. In order to easily allow the fabricator to place and secure the stirrups in the bottom of the beam, always include strands in the outermost locations of rows 1 and 3 for RB, M, and MN shapes. Include strands in the outermost locations of rows 1 and 2 for MW shapes. Rows numbers are measured up from the bottom of the beam. See Figure 5.4.3.1.
Figure 5.4.3.1
Whenever possible, use a constant strand pattern for all girders on the same project. If the strand pattern varies between beams, the fabricator may be required to tension an entire bed length of strand in order to cast a single girder. This results in a large amount of wasted strand, and will increase the cost of the beam. The maximum number of draped strands allowed at each hold-down point varies with the fabricator. Therefore, design and detail beams with one hold-down on each side of midspan, placed at 0.40L to 0.45L from the centerline of bearing. The fabricator will provide additional hold-downs as needed.
JULY 2014 LRFD BRIDGE DESIGN 5-25
The following guidance is provided to designers to evaluate initial and final stresses to optimize their designs:
Final Stresses Midpoint Strength at Bottom of Beam
If tension stress is greater than cf19.0 (0.570 ksi for 9 ksi concrete), lower the stress by: 1) Add 2 strands to the bottom row of straight and move the
draped strands up 1 inch at midpoint (bottom row of draped at 4 inches).
2) Add 2 strands to the second row of straight and move the draped strands up 2 inches at midpoint (bottom row of draped at 6 inches) or add 2 draped strands (bottom row of draped at 4 inches).
3) Continue to add strands as stated above until 6 straight and 4 draped have been added. If the tension stress is still greater than 0.570 ksi, consider adding another line of beams to the bridge. If the tension stress is less than 0.570 ksi, two strands (either straight or draped) may be removed and the beam reanalyzed. If the stress becomes greater than 0.570 ksi, return to the original number of strands.
Initial Stresses Midpoint Strength at Bottom of Beam
If the required initial strength is greater than 7.0 ksi: 1) Move the center of gravity of the strands up at midpoint of the
beam until either the final concrete strength becomes 9.0 ksi or the initial strength is 0.5 to 1.0 ksi lower than the final strength.
2) Remove 2 strands (preferably draped) from the beam and reanalyze. Keep in mind that changes will affect the required final strength. If the removing of strands increases the final concrete strength above 9.0 ksi, do not remove the strands but consider other changes in the strand pattern.
End Strength at Bottom of Beam
If the required initial strength is greater than 7.0 ksi and greater than that calculated at the midpoint: 1) Strands may be draped to decrease the required strength.
Keep in mind that changes to strand locations at the end of the beam may affect the mid-beam stresses.
2) If the initial strength is lower than calculated at the midpoint, draped strands may be placed straight thereby decreasing the
JULY 2014 LRFD BRIDGE DESIGN 5-26
hold-down force and the number of draped strands required. Keep in mind that changes may affect the mid-beam stresses.
End Strength at Top of Beam
If the required initial strength is greater than 7.0 ksi, raise the center of gravity of the strands at the end of the beam. This can be accomplished by draping strands that were previously straight or increasing the height of the draped strands.
Midpoint Strength at Top of Beam If the required initial strength is greater than calculated at the bottom end or midpoint: 1) The center of gravity of the strands may be moved higher at
the center. 2) The number of strands may be reduced to decrease the
required strength.
If the guidance above results in an initial concrete strength greater than 7.0 ksi, the initial strength may be increased up to a maximum value of 7.5 ksi. Note that this will likely increase the beam cost.
Ensure that adequate shear and splitting reinforcement is provided in the ends of beams. The maximum size for stirrup bars is #5. Based on the concrete mix used for prestressed beams, the minimum stirrup spacing is 21/2 inches. If the required amount of reinforcement cannot be provided within h/4 of the end of the beam, provide the remainder at a 21/2 inch spacing. Design shear reinforcement using the “General Procedure” provisions given in LRFD Article 5.8.3.4.2. Horizontal shear reinforcement must be provided to ensure composite action between the beam and deck. MnDOT standard beam sheets accomplish this by extending the beam stirrups into the deck (G402E & G508E with 7” projection for RB, M, MN shapes and G404E & G508E with 7¼” projection for MW shapes). In order to ensure composite action, the shear reinforcement must extend into the deck far enough to engage the deck bottom mat of reinforcement. Check the stool heights over the length of the beams. For regions where stool heights are found greater than 5 inches at beam centerline, do not increase the stirrup length or pull up the stirrups, but rather provide #4 “hat” shaped bars as shown in Figure 5.4.3.2. Set the leg depth to provide 2 inches minimum clear to the bottom of deck and 3 inches clear to the top of deck for the upper hook, and 1 inch clear from the bottom of the bar to the beam flange. In
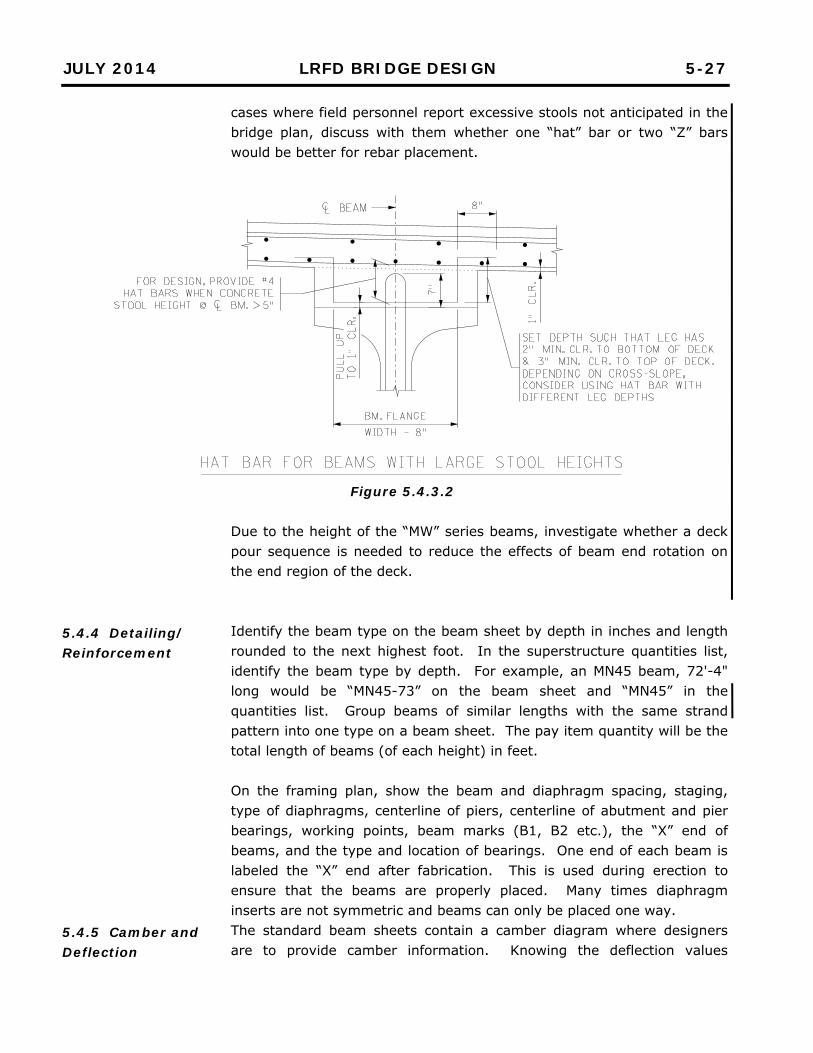
JULY 2014 LRFD BRIDGE DESIGN 5-27
5.4.4 Detailing/ Reinforcement
5.4.5 Camber and Deflection
cases where field personnel report excessive stools not anticipated in the bridge plan, discuss with them whether one “hat” bar or two “Z” bars would be better for rebar placement.
Figure 5.4.3.2 Due to the height of the “MW” series beams, investigate whether a deck pour sequence is needed to reduce the effects of beam end rotation on the end region of the deck.
Identify the beam type on the beam sheet by depth in inches and length rounded to the next highest foot. In the superstructure quantities list, identify the beam type by depth. For example, an MN45 beam, 72'-4" long would be “MN45-73” on the beam sheet and “MN45” in the quantities list. Group beams of similar lengths with the same strand pattern into one type on a beam sheet. The pay item quantity will be the total length of beams (of each height) in feet. On the framing plan, show the beam and diaphragm spacing, staging, type of diaphragms, centerline of piers, centerline of abutment and pier bearings, working points, beam marks (B1, B2 etc.), the “X” end of beams, and the type and location of bearings. One end of each beam is labeled the “X” end after fabrication. This is used during erection to ensure that the beams are properly placed. Many times diaphragm inserts are not symmetric and beams can only be placed one way. The standard beam sheets contain a camber diagram where designers are to provide camber information. Knowing the deflection values
JULY 2014 LRFD BRIDGE DESIGN 5-28
associated with prestressing and different dead load components, camber values can be obtained. MnDOT camber multipliers are used to approximately convert the prestress and selfweight deflections at the time of prestress transfer to the deflections at the time of erection. Use a camber multiplier of 1.40 for the prestress deflection component. Use a camber multiplier of 1.40 for the selfweight of the member. No multiplier is used for diaphragm dead loads, deck and stool dead loads or parapet and median dead loads. These camber multipliers differ from the PCI multipliers as they are based on research specific to MnDOT beams. They are based on a time lapse of 30 to 180 days between the time of prestress transfer and the time of beam erection for deck placement. Use of the MnDOT camber multipliers does not apply to the “MW” series beams. Complete a refined camber analysis using an appropriate creep model for “MW” series camber determination. Then report the estimated camber values for various girder ages in the bridge plan. The “Erection Camber” is the camber of the beam at the time of erection after the diaphragms are in place. The “Est. Dead Load Deflection” is the sum of deflections associated with the placement of the deck, railings, sidewalks, and stool. Do not include the weight of the future wearing surface when computing the dead load deflection.
JULY 2014 LRFD BRIDGE DESIGN 5-29
5.4.6 Standard I-Beams
5.4.7 Rectangular Beams
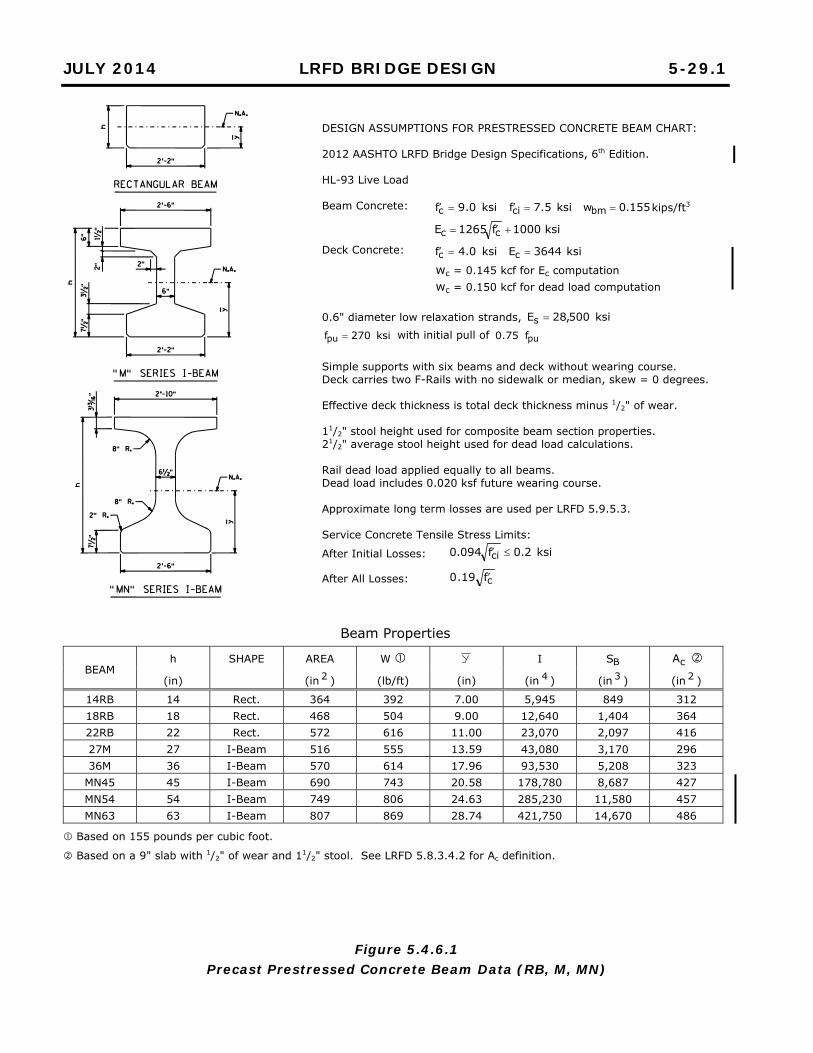
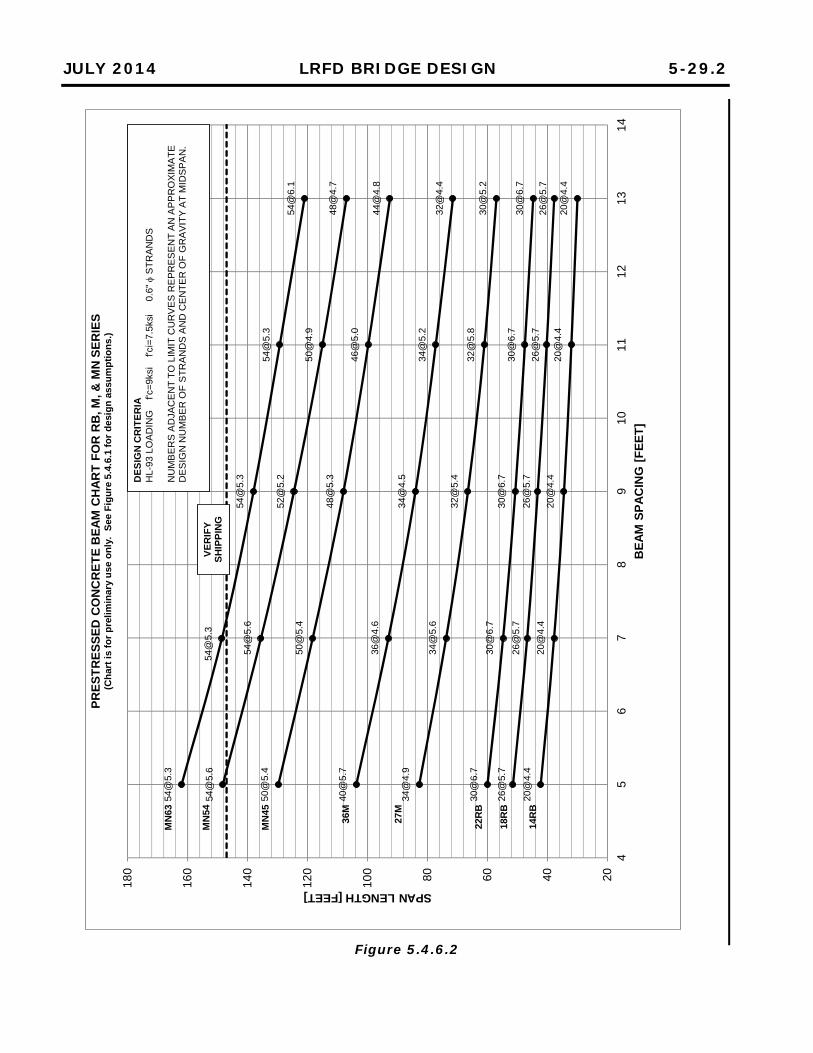
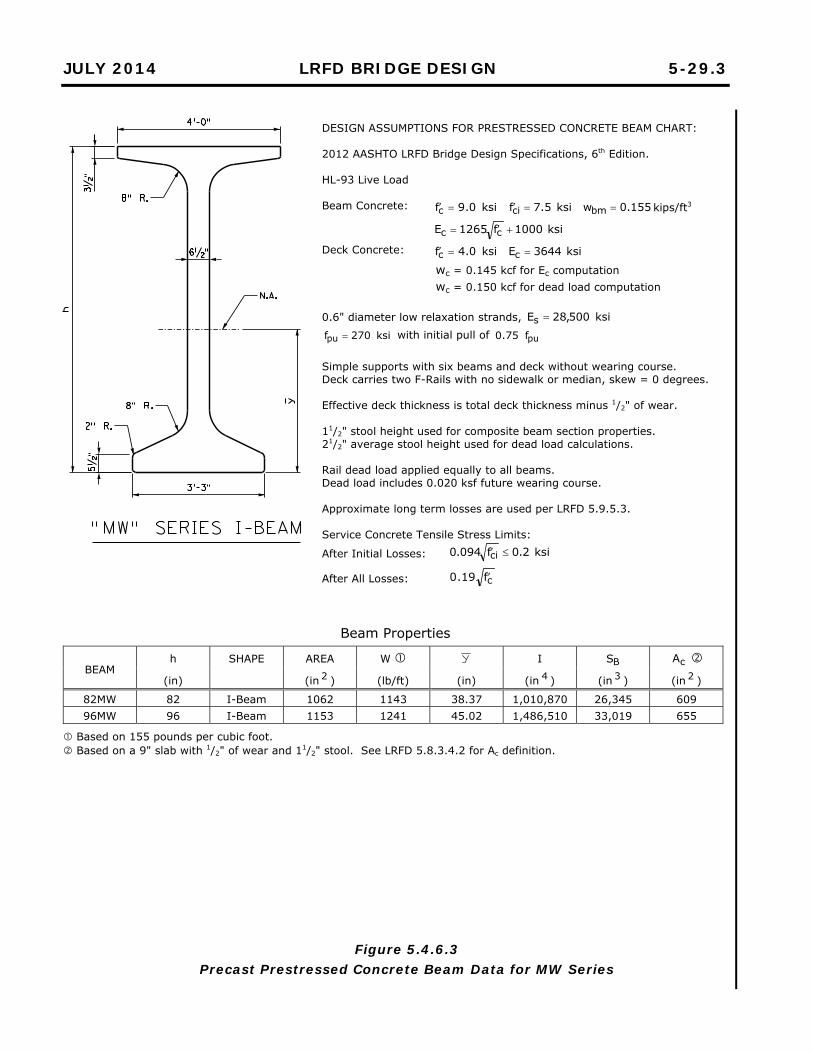
I-beam sections available for use in Minnesota include the “M” series, ”MN” series, and “MW” series. The “M” series sections range in depth from 27 inches to 36 inches and have identical top and bottom flange dimensions along with a 6 inch thick web. The “MN” series sections range in depth from 45 inches to 63 inches. The “MN” series sections are more efficient than the “M” series due to wider top and bottom flanges and a 61/2 inch thick web. Due to the development of the MN45, MN54, MN63, and 82MW shapes, most of the M shapes (45M, 54M, 63M, 72M, and 81M) have been archived. The 27M and 36M shapes continue to be available as there is no corresponding MN shape at those depths. The “MW” series sections allow for spans in the range of 150 to 200 feet. Figures 5.4.6.1 through 5.4.6.4 contain section properties and preliminary beam spacing vs. span length curves for all standard I-beam shapes. Solid rectangular prestressed beams may be used on short span bridges. These units are most appropriate for short span structures requiring a low profile or where construction of falsework for a slab structure would be difficult or unwanted. Figure 5.4.6.1 and 5.4.6.2 contain section properties and preliminary beam spacing vs. span length curves for the standard rectangular beams.
JULY 2014 LRFD BRIDGE DESIGN 5-29.1
Beam Properties
BEAM h SHAPE AREA W I BS cA
(in) (in 2 ) (lb/ft) (in) (in 4 ) (in 3 ) (in 2 )
14RB 14 Rect. 364 392 7.00 5,945 849 312 18RB 18 Rect. 468 504 9.00 12,640 1,404 364 22RB 22 Rect. 572 616 11.00 23,070 2,097 416 27M 27 I-Beam 516 555 13.59 43,080 3,170 296 36M 36 I-Beam 570 614 17.96 93,530 5,208 323
MN45 45 I-Beam 690 743 20.58 178,780 8,687 427 MN54 54 I-Beam 749 806 24.63 285,230 11,580 457 MN63 63 I-Beam 807 869 28.74 421,750 14,670 486
Based on 155 pounds per cubic foot. Based on a 9" slab with 1/2" of wear and 11/2" stool. See LRFD 5.8.3.4.2 for Ac definition.
DESIGN ASSUMPTIONS FOR PRESTRESSED CONCRETE BEAM CHART: 2012 AASHTO LRFD Bridge Design Specifications, 6th Edition. HL-93 Live Load Beam Concrete: ksi0.9fc ksi5.7fci 155.0wbm kips/ft3
ksi1000f1265E cc
Deck Concrete: ksi0.4fc ksi3644Ec
wc = 0.145 kcf for Ec computation wc = 0.150 kcf for dead load computation
0.6" diameter low relaxation strands, ksi500,28Es
ksi270fpu with initial pull of puf75.0
Simple supports with six beams and deck without wearing course. Deck carries two F-Rails with no sidewalk or median, skew = 0 degrees. Effective deck thickness is total deck thickness minus 1/2" of wear. 11/2" stool height used for composite beam section properties. 21/2" average stool height used for dead load calculations. Rail dead load applied equally to all beams. Dead load includes 0.020 ksf future wearing course. Approximate long term losses are used per LRFD 5.9.5.3. Service Concrete Tensile Stress Limits:
After Initial Losses: ksi2.0f094.0 ci
After All Losses: cf19.0
Figure 5.4.6.1 Precast Prestressed Concrete Beam Data (RB, M, MN)
JULY 2014 LRFD BRIDGE DESIGN 5-29.2
Figure 5.4.6.2
40@
5.7
36@
4.6
34@
4.5
34@
5.2
32@
4.4
34@
4.9
34@
5.6
32@
5.4
32@
5.8
30@
5.2
30@
6.7
30@
6.7
30@
6.7
30@
6.7
30@
6.7
26@
5.7
26@
5.7
26@
5.7
26@
5.7
26@
5.7
20@
4.4
20@
4.4
20@
4.4
20@
4.4
20@
4.4
50@
5.4
50@
5.4
48@
5.3
46@
5.0
44@
4.8
54@
5.6
54@
5.6
52@
5.2
50@
4.9
48@
4.7
54@
5.3
54@
5.3
54@
5.3
54@
5.3
54@
6.1
20406080
100
120
140
160
180
45
67
89
1011
1213
14
SPAN LENGTH [FEET]
BE
AM
SP
AC
ING
[F
EE
T]
PR
ES
TR
ES
SE
D C
ON
CR
ET
E B
EA
M C
HA
RT
FO
R R
B, M
, & M
N S
ER
IES
(Ch
art
is f
or
pre
lim
inar
y u
se o
nly
. S
ee F
igu
re 5
.4.6
.1 f
or
des
ign
ass
um
pti
on
s.)
DE
SIG
NC
RIT
ER
IAH
L-93
LO
AD
ING
f
'c=
9ksi
f
'ci=
7.5k
si
0.6
"
ST
RA
ND
S
NU
MB
ER
S A
DJA
CE
NT
TO
LIM
IT C
UR
VE
S R
EP
RE
SE
NT
AN
AP
PR
OX
IMA
TE
D
ES
IGN
NU
MB
ER
OF
ST
RA
ND
S A
ND
CE
NT
ER
OF
GR
AV
ITY
AT
MID
SP
AN
.
VE
RIF
Y
SH
IPP
ING
MN
63
MN
54
MN
45
36M
27M
22R
B
14R
B
18R
B
JULY 2014 LRFD BRIDGE DESIGN 5-29.3
DESIGN ASSUMPTIONS FOR PRESTRESSED CONCRETE BEAM CHART: 2012 AASHTO LRFD Bridge Design Specifications, 6th Edition. HL-93 Live Load Beam Concrete: ksi0.9fc ksi5.7fci 155.0wbm kips/ft3
ksi1000f1265E cc
Deck Concrete: ksi0.4fc ksi3644Ec
wc = 0.145 kcf for Ec computation wc = 0.150 kcf for dead load computation
0.6" diameter low relaxation strands, ksi500,28Es
ksi270fpu with initial pull of puf75.0
Simple supports with six beams and deck without wearing course. Deck carries two F-Rails with no sidewalk or median, skew = 0 degrees. Effective deck thickness is total deck thickness minus 1/2" of wear. 11/2" stool height used for composite beam section properties. 21/2" average stool height used for dead load calculations. Rail dead load applied equally to all beams. Dead load includes 0.020 ksf future wearing course. Approximate long term losses are used per LRFD 5.9.5.3. Service Concrete Tensile Stress Limits:
After Initial Losses: ksi2.0f094.0 ci
After All Losses: cf19.0
Beam Properties
BEAM h SHAPE AREA W I BS cA
(in) (in 2 ) (lb/ft) (in) (in 4 ) (in 3 ) (in 2 )
82MW 82 I-Beam 1062 1143 38.37 1,010,870 26,345 609 96MW 96 I-Beam 1153 1241 45.02 1,486,510 33,019 655
Based on 155 pounds per cubic foot. Based on a 9" slab with 1/2" of wear and 11/2" stool. See LRFD 5.8.3.4.2 for Ac definition.
Figure 5.4.6.3 Precast Prestressed Concrete Beam Data for MW Series
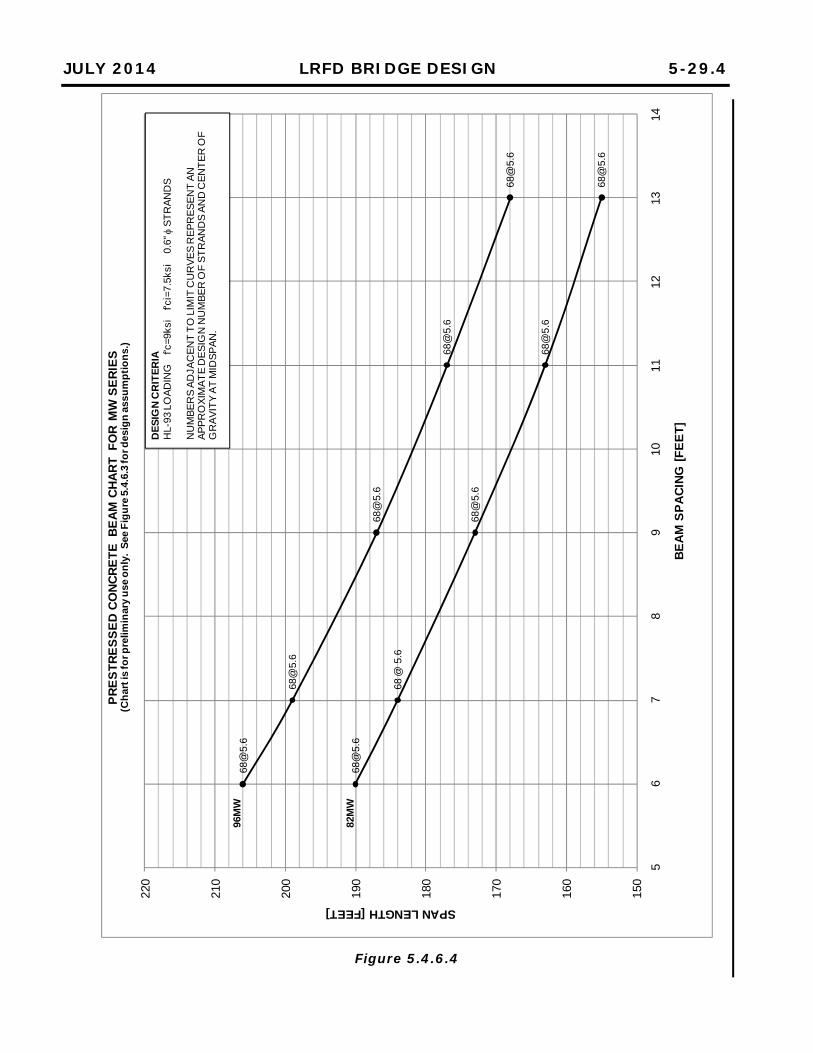
JULY 2014 LRFD BRIDGE DESIGN 5-29.4
68@
5.6
68 @
5.6
68@
5.6
68@
5.6
68@
5.6
68@
5.6
68@
5.6
68@
5.6
68@
5.6
68@
5.6
150
160
170
180
190
200
210
220
56
78
910
1112
1314
SPAN LENGTH [FEET]
BE
AM
SP
AC
ING
[F
EE
T]
PR
ES
TR
ES
SE
D C
ON
CR
ET
E B
EA
M C
HA
RT
FO
R M
W S
ER
IES
(Ch
art i
s fo
r pre
limin
ary
use
on
ly.
See
Fig
ure
5.4
.6.3
for d
esig
n a
ssu
mp
tio
ns.
)
DE
SIG
NC
RIT
ER
IAH
L-93
LO
AD
ING
f'
c=9k
si
f'ci
=7.5
ksi
0.
6"
ST
RA
ND
S
NU
MB
ER
S A
DJA
CE
NT
TO
LIM
IT C
UR
VE
S R
EP
RE
SE
NT
AN
A
PP
RO
XIM
AT
E D
ES
IGN
NU
MB
ER
OF
ST
RA
ND
S A
ND
CE
NT
ER
OF
G
RA
VIT
Y A
T M
IDS
PA
N.
96M
W
82M
W
Figure 5.4.6.4
JULY 2014 LRFD BRIDGE DESIGN 5-30
5.5 Post-Tensioned Concrete
5.5.1 PT Slab Bridges
5.5.2 PT I-Girders
5.5.3 PT Precast or Cast-In-Place Box Girders
5.4.8 Double-Tee Beams
Pretensioned double-tees are not used anymore on Minnesota bridges. The standard Bridge Details Part II Figures 5-397.525 and 5-397.526 were archived in 2009. Post-tensioned (PT) concrete structures have their prestressing steel stressed after the concrete has been placed and partially cured. Post-tensioned concrete bridges are specialty structures. Poor detailing and poor construction practices can greatly reduce the service life of these structures. Designers should follow current practices recommended by the American Segmental Bridge Institute (ASBI) and the Post-Tensioning Institute (PTI). Design segmental box girders and post-tensioned concrete slab bridges for zero tension under service loads. Post-tensioned concrete slab bridges are used for projects requiring spans longer than those efficiently accommodated with conventionally reinforced concrete slabs. The drawback to post-tensioned slabs is that they are more complex to design and construct. Elastic shortening and secondary bending moments due to post-tensioning are important design parameters for post-tensioned slab bridges. During construction a number of additional components are involved. They include the installation of post-tensioning ducts and anchorages, the pushing or pulling of strands through the ducts, the jacking of tendons, and grouting operations. Post-tensioned spliced I-girder bridges are not commonly used in Minnesota, but the MW series beams were developed with consideration of future use for spliced girder bridges. MnDOT will develop appropriate details as potential projects are identified. The depth of box girders should preferably be a minimum of 1/18 of the maximum span length. Place vertical webs of box girders monolithic with the bottom slab.
JULY 2014 LRFD BRIDGE DESIGN 5-31
5.6 Concrete Finishes and Coatings
The finish or coating to be used on concrete elements will usually be determined when the Preliminary Bridge Plan is assembled. In general, provide a finish or coating consistent with the guidance given in the Aesthetic Guidelines for Bridge Design Manual. A wide variety of surface finishes for concrete are used on bridge projects. These range from plain concrete to rubbed concrete to painted surfaces to form liners and stains. Plain concrete and rubbed concrete finishes are described in the MnDOT Spec. 2401. Painted and architectural surfaces must be described in the special provisions. Specify graffiti protection for concrete elements with a coating system that has more than one color.

JULY 2014 LRFD BRIDGE DESIGN 5-32
5.7 Design Examples
Three design examples complete Section 5. The examples consist of a three-span reinforced concrete slab superstructure, a prestressed I-beam superstructure, and a three-span post-tensioned slab superstructure.
OCTOBER 2009 LRFD BRIDGE DESIGN 5-33
5.7.1 Three-Span Haunched Reinforced Concrete Slab
This example illustrates the design of a haunched reinforced concrete slab bridge. The three continuous spans are 44'-0", 55'-0", and 44'-0" in length. The roadway width is 44'-0" with MnDOT Type F barrier railings for a total out-to-out width of 47'-4". The bridge is skewed 10 degrees. A plan view and typical sections of the bridge are shown in Figures 5.7.1.1 and 5.7.1.2. After determining live load distribution factors, dead and live loads are computed at span tenth points. Next the live load deflection and the shear capacity of the section is checked. Then using Strength I, Service I, and Fatigue design moments the flexural reinforcement is sized. This is accomplished by:
Providing adequate steel for strength Verifying that crack control checks are satisfied Checking fatigue stresses in the reinforcement Verifying that minimum reinforcement checks are satisfied
Finally, distribution and shrinkage and temperature reinforcement is sized. Material and design parameters used in this example are:
Concrete Strength at 28 Days, ksi0.4fc Concrete Unit Weight, kcf150.0wc (dead loads) kcf145.0wc (modulus)
Reinforcing Bars:
Yield Strength, ksi60fy Modulus of Elasticity, ksi000,29Es
Weight of Future Wearing Surface = 20 psf Weight of concrete rail = 0.439 kip/ft
For simplicity, the wearing course is assumed to extend from out-to-out of deck.
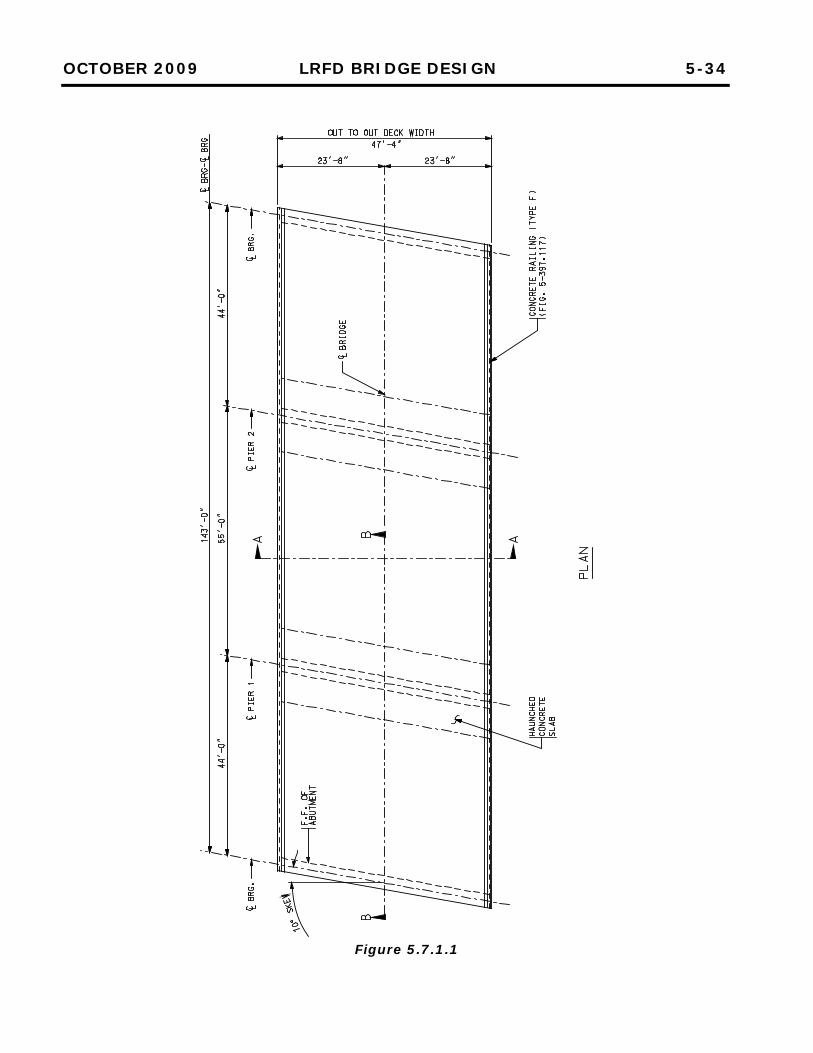
OCTOBER 2009 LRFD BRIDGE DESIGN 5-34
Figure 5.7.1.1
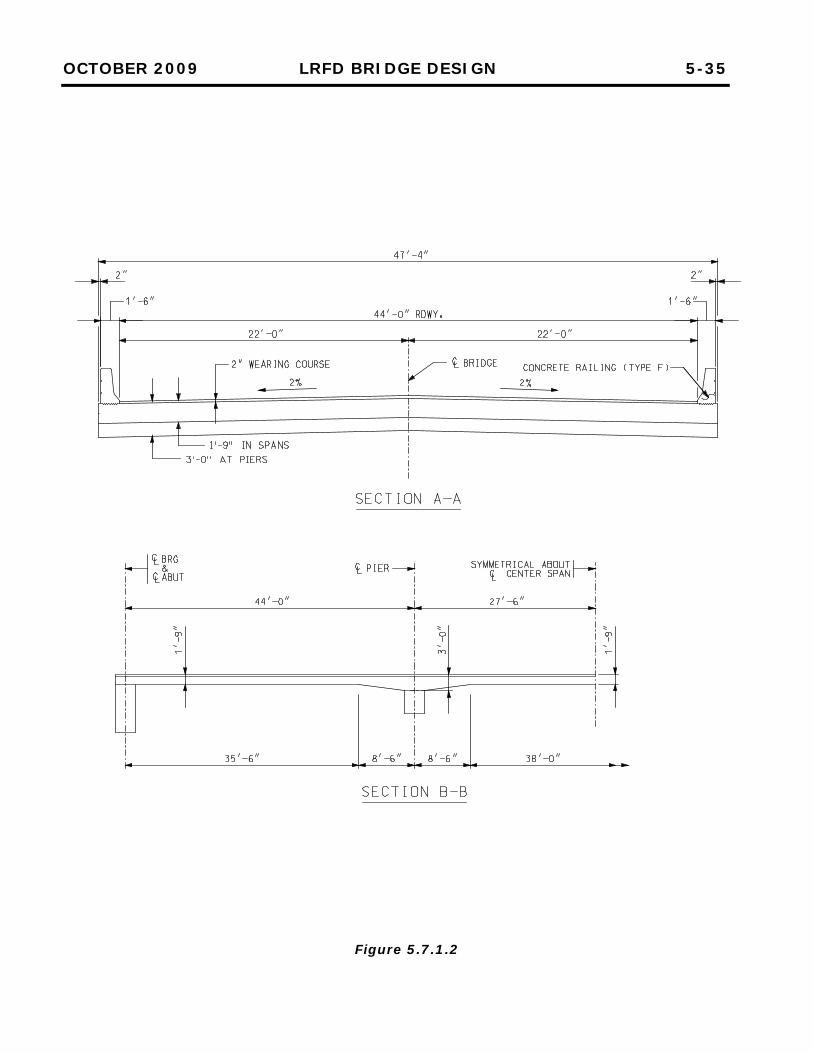
OCTOBER 2009 LRFD BRIDGE DESIGN 5-35
Figure 5.7.1.2
OCTOBER 2009 LRFD BRIDGE DESIGN 5-36
A. Determine Slab Depths
B. Determine Interior Live Load Strip Width [4.6.2.3] [3.6.1.1.1]
[Eqn. 4.6.2.3-1]
MnDOT’s practice is to use linear haunches, with the haunch length equal to 15 % of the longest span.
Haunch Length ft25.85515.0 Use 8.5 ft The minimum slab depth at midspan ( minh ) is also determined with the length of the longest span (S):
ft73.130
105580.030
10S80.0
ft75.1hUse min
The depth of the slab required at the pier ( maxh ) is determined with an equation based on the length of the longest span:
ft88.230
105533.130
10S33.1
ft00.3hUse max
The slab depth (h) includes the 2 inch wearing course. The LRFD Specifications contain equations to determine the strip width that carries a lane of live load. Slab designs are performed on a strip one foot wide. The strip widths found with the LRFD equations are inverted to arrive at the live load distribution factor for a 1 foot wide strip (LLDF). For interior strips multiple equations are evaluated to determine whether one or multiple live load lanes govern. Flexure – One Lane Loaded Multiple Presence Factors have been incorporated into the LRFD equations per LRFD C3.6.1.1.2. Equivalent strip width (in), 11 WL0.50.10E Where:
1L is the modified span length. It is equal to the span length, but can be no greater than 60.
1W is the modified bridge width. It is the minimum bridge width, but can be no greater than 30.
For the 44 ft side spans:
7.19130440.50.10E in/lane
Therefore 063.0
127.191
1LLDFSL
lanes/ft Governs
OCTOBER 2009 LRFD BRIDGE DESIGN 5-37
[Eqn. 4.6.2.3-2]
For the 55 ft center span:
1.21330550.50.10E in/lane
Therefore 056.0
121.213
1LLDFSL
lanes/ft
Flexure – Fatigue Loading Divide the one lane LLDF by 1.2 to remove the Multiple Presence Factor For the 44 ft side spans:
052.02.1
063.0LLDFFAT lanes/ft Governs
For the 55 ft center span:
047.02.1
056.0LLDFFAT lanes/ft
Flexure – Multiple Lanes Loaded Equivalent strip width (in),
L11 N
W12WL44.10.84E
1L = 44 ft or 55 ft
1W = 47.33 ft
W is the actual bridge width = 47.33 ft
7.31244NL Use 3
The upper limit on the equivalent strip width is:
3.1893
33.470.12N
W0.12L
in/lane
For the 44 ft side spans:
3.1897.14933.474444.10.84E in/lane
Therefore the 080.0
127.149
1LLDFML
lanes/ft Governs
OCTOBER 2009 LRFD BRIDGE DESIGN 5-38
[Eqn. 4.6.2.3-3]
C. Determine Exterior Live Load Strip Width [4.6.2.1.4]
[2.5.2.6.2]
[5.14.4.1]
For the 55 ft center span:
3.1895.15733.475544.10.84E in/lane
Therefore the 076.0
125.157
1LLDFML
lanes/ft
To simplify the process of arriving at design forces, the maximum distribution factor (0.080 lanes/ft) will be used for all locations. Shear and Deflection Although not required by AASHTO, MnDOT requires that slab type bridges be checked for shear using the same live load distribution factor calculated for deflection. All design lanes should be loaded and the entire slab assumed to resist the loads.
3NL 85.0m %33IM Dynamic load allowance (IM) is applied only to the truck portion of the live load. The distribution factor for the lane portion of the live load is:
054.0
33.4785.03
widthdeck MPFlanes of #LLDFs
lanes/ft
The distribution factor for the truck portion is:
072.033.01054.0IM1LLDFs lanes/ft
Reduction for Skew
006.110tan25.005.1tan25.005.1r No Reduction The exterior strip is assumed to carry one wheel line and a tributary portion of lane load. Check if the equivalent strip is less than the maximum width of 72 inches.
4E int. smallest12barrier) of inside to edge from (Distance E
in0.724.694
7.1491220 Use 69.4 in
OCTOBER 2009 LRFD BRIDGE DESIGN 5-39
D. Resistance Factors and Load Modifiers [5.5.4.2.1] [1.3.3-1.3.5]
E. Select Applicable Load Combinations and Load Factors [3.4.1]
Compute the distribution factor associated with one truck wheel line:
12/4.6922.11
12/Elines/lane wheel2MPFline wheel1LLDFEXTT
104.0 lanes/ft
Compute the distribution factor associated with lane load on a 69.4 inch wide exterior strip:
12/4.69
2.110
12/2012/4.69
width stripexterior
MPFwidth load ft 10loaded widthdeck
LLDFEXTL
085.0 lanes/ft
For simplicity, the larger value (0.104 lanes/ft) is used for both load types when assembling design forces. The following resistance factors will be used for this example:
90.0 for flexure and tension (assumed, must be checked) 90.0 for shear and torsion
The following load modifiers will be used for this example:
Strength Service Fatigue
Ductility D 1.0 1.0 1.0
Redundancy R 1.0 1.0 1.0
Importance I 1.0 n/a n/a
IRD 1.0 1.0 1.0
Three load combinations will be considered for the design example. STRENGTH I - Will be considered with a standard HL-93 loading.
IMLL75.1DC25.10.1U
SERVICE I - Will be used primarily for crack control checks.
IMLL0.1DC0.1U
FATIGUE - Will be used to evaluate the reinforcing steel.
IMLL75.0U
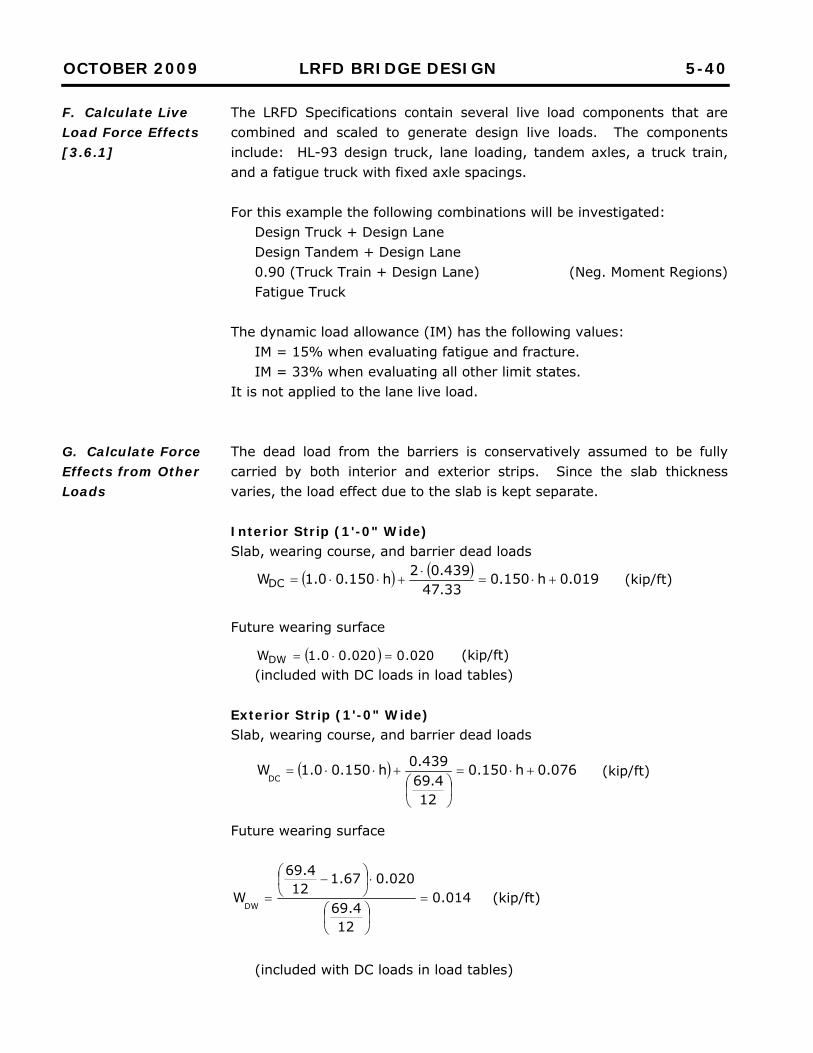
OCTOBER 2009 LRFD BRIDGE DESIGN 5-40
F. Calculate Live Load Force Effects [3.6.1]
G. Calculate Force Effects from Other Loads
The LRFD Specifications contain several live load components that are combined and scaled to generate design live loads. The components include: HL-93 design truck, lane loading, tandem axles, a truck train, and a fatigue truck with fixed axle spacings. For this example the following combinations will be investigated:
Design Truck + Design Lane Design Tandem + Design Lane 0.90 (Truck Train + Design Lane) (Neg. Moment Regions) Fatigue Truck
The dynamic load allowance (IM) has the following values:
IM = 15% when evaluating fatigue and fracture. IM = 33% when evaluating all other limit states.
It is not applied to the lane live load. The dead load from the barriers is conservatively assumed to be fully carried by both interior and exterior strips. Since the slab thickness varies, the load effect due to the slab is kept separate. Interior Strip (1'-0" Wide) Slab, wearing course, and barrier dead loads
019.0h150.033.47439.02h150.00.1WDC
(kip/ft)
Future wearing surface
020.0020.00.1WDW (kip/ft) (included with DC loads in load tables)
Exterior Strip (1'-0" Wide) Slab, wearing course, and barrier dead loads
076.0h150.0
124.69
439.0h150.00.1WDC
(kip/ft)
Future wearing surface
014.0
124.69
020.067.112
4.69
WDW
(kip/ft)
(included with DC loads in load tables)
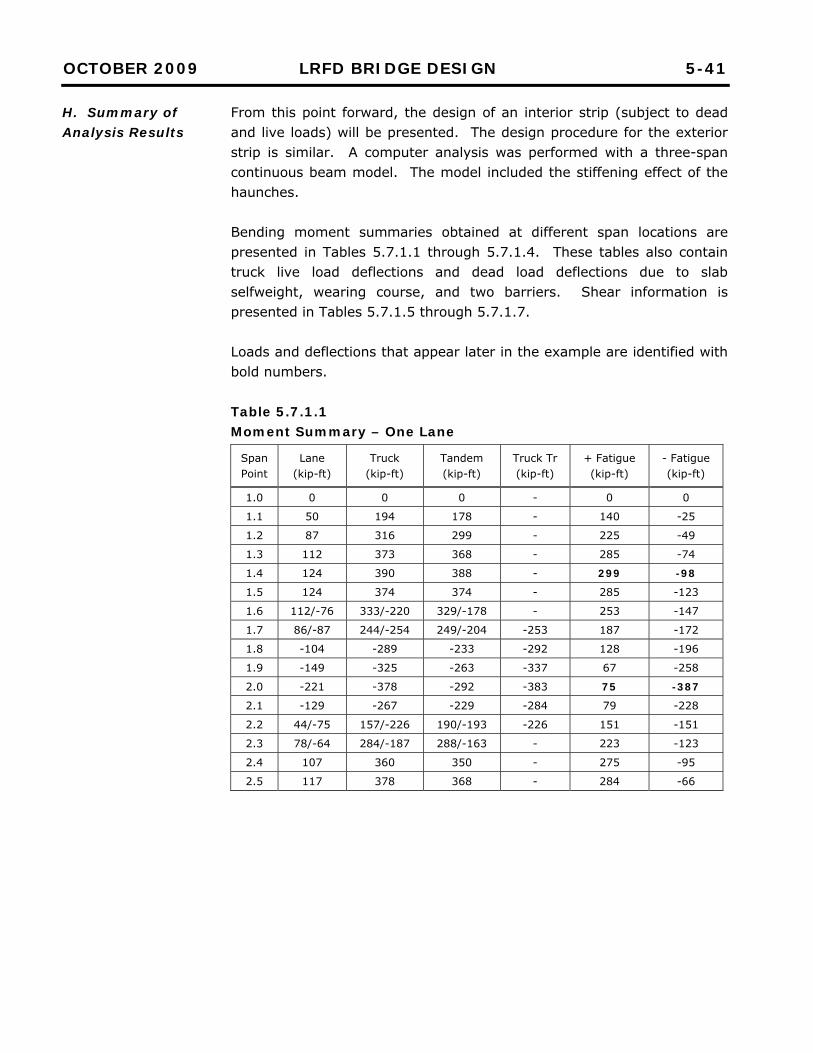
OCTOBER 2009 LRFD BRIDGE DESIGN 5-41
H. Summary of Analysis Results
From this point forward, the design of an interior strip (subject to dead and live loads) will be presented. The design procedure for the exterior strip is similar. A computer analysis was performed with a three-span continuous beam model. The model included the stiffening effect of the haunches. Bending moment summaries obtained at different span locations are presented in Tables 5.7.1.1 through 5.7.1.4. These tables also contain truck live load deflections and dead load deflections due to slab selfweight, wearing course, and two barriers. Shear information is presented in Tables 5.7.1.5 through 5.7.1.7. Loads and deflections that appear later in the example are identified with bold numbers. Table 5.7.1.1 Moment Summary – One Lane
Span Point
Lane (kip-ft)
Truck (kip-ft)
Tandem (kip-ft)
Truck Tr (kip-ft)
+ Fatigue (kip-ft)
- Fatigue (kip-ft)
1.0 0 0 0 - 0 0
1.1 50 194 178 - 140 -25
1.2 87 316 299 - 225 -49
1.3 112 373 368 - 285 -74
1.4 124 390 388 - 299 -98
1.5 124 374 374 - 285 -123
1.6 112/-76 333/-220 329/-178 - 253 -147
1.7 86/-87 244/-254 249/-204 -253 187 -172
1.8 -104 -289 -233 -292 128 -196
1.9 -149 -325 -263 -337 67 -258
2.0 -221 -378 -292 -383 75 -387
2.1 -129 -267 -229 -284 79 -228
2.2 44/-75 157/-226 190/-193 -226 151 -151
2.3 78/-64 284/-187 288/-163 - 223 -123
2.4 107 360 350 - 275 -95
2.5 117 378 368 - 284 -66
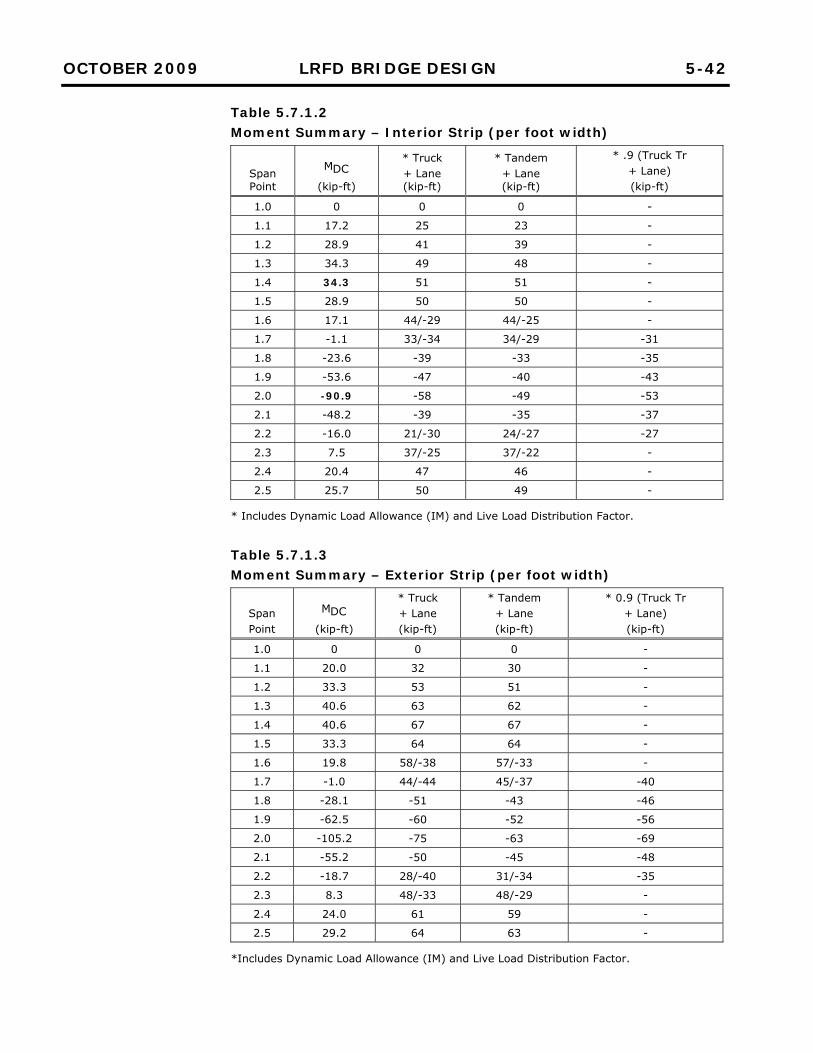
OCTOBER 2009 LRFD BRIDGE DESIGN 5-42
Table 5.7.1.2 Moment Summary – Interior Strip (per foot width)
Span Point
DCM
(kip-ft)
* Truck + Lane (kip-ft)
* Tandem + Lane (kip-ft)
* .9 (Truck Tr + Lane) (kip-ft)
1.0 0 0 0 -
1.1 17.2 25 23 -
1.2 28.9 41 39 -
1.3 34.3 49 48 -
1.4 34.3 51 51 -
1.5 28.9 50 50 -
1.6 17.1 44/-29 44/-25 -
1.7 -1.1 33/-34 34/-29 -31
1.8 -23.6 -39 -33 -35
1.9 -53.6 -47 -40 -43
2.0 -90.9 -58 -49 -53
2.1 -48.2 -39 -35 -37
2.2 -16.0 21/-30 24/-27 -27
2.3 7.5 37/-25 37/-22 -
2.4 20.4 47 46 -
2.5 25.7 50 49 -
* Includes Dynamic Load Allowance (IM) and Live Load Distribution Factor.
Table 5.7.1.3 Moment Summary – Exterior Strip (per foot width)
Span Point
DCM
(kip-ft)
* Truck + Lane (kip-ft)
* Tandem + Lane (kip-ft)
* 0.9 (Truck Tr + Lane) (kip-ft)
1.0 0 0 0 -
1.1 20.0 32 30 -
1.2 33.3 53 51 -
1.3 40.6 63 62 -
1.4 40.6 67 67 -
1.5 33.3 64 64 -
1.6 19.8 58/-38 57/-33 -
1.7 -1.0 44/-44 45/-37 -40
1.8 -28.1 -51 -43 -46
1.9 -62.5 -60 -52 -56
2.0 -105.2 -75 -63 -69
2.1 -55.2 -50 -45 -48
2.2 -18.7 28/-40 31/-34 -35
2.3 8.3 48/-33 48/-29 -
2.4 24.0 61 59 -
2.5 29.2 64 63 -
*Includes Dynamic Load Allowance (IM) and Live Load Distribution Factor.
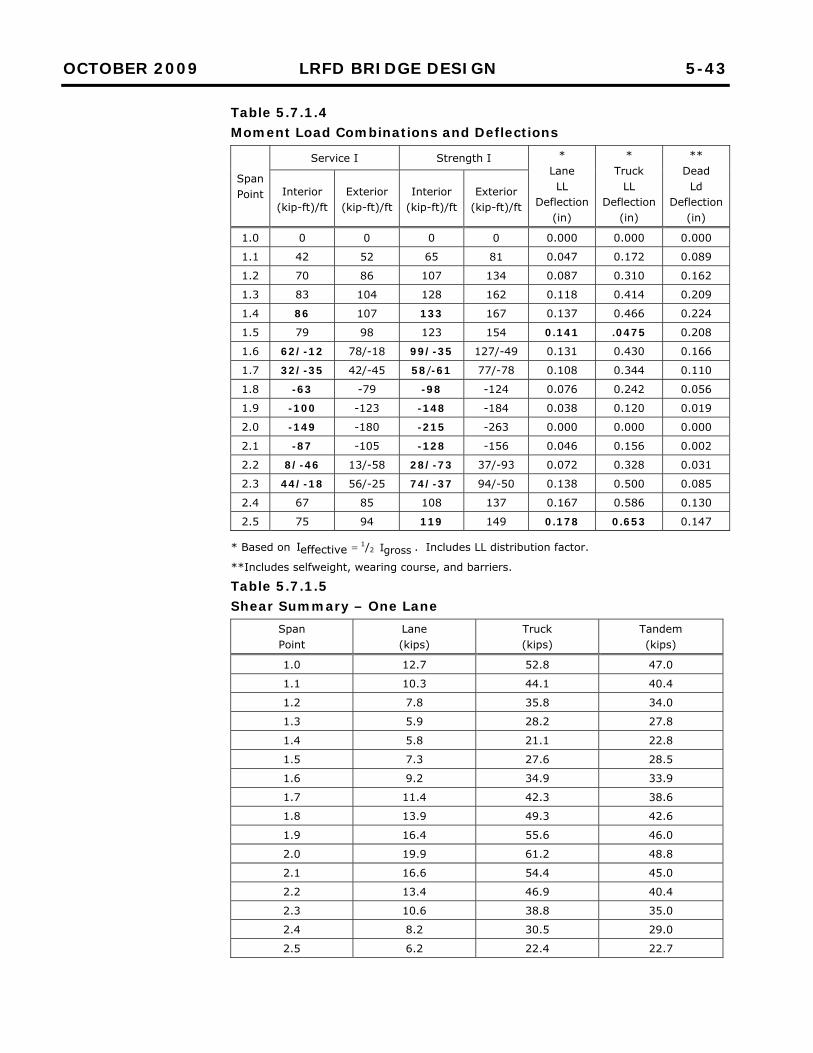
OCTOBER 2009 LRFD BRIDGE DESIGN 5-43
Table 5.7.1.4 Moment Load Combinations and Deflections
Span Point
Service I Strength I * Lane LL
Deflection (in)
* Truck
LL Deflection
(in)
** Dead
Ld Deflection
(in)
Interior (kip-ft)/ft
Exterior (kip-ft)/ft
Interior (kip-ft)/ft
Exterior (kip-ft)/ft
1.0 0 0 0 0 0.000 0.000 0.000
1.1 42 52 65 81 0.047 0.172 0.089
1.2 70 86 107 134 0.087 0.310 0.162
1.3 83 104 128 162 0.118 0.414 0.209
1.4 86 107 133 167 0.137 0.466 0.224
1.5 79 98 123 154 0.141 .0475 0.208
1.6 62/-12 78/-18 99/-35 127/-49 0.131 0.430 0.166
1.7 32/-35 42/-45 58/-61 77/-78 0.108 0.344 0.110
1.8 -63 -79 -98 -124 0.076 0.242 0.056
1.9 -100 -123 -148 -184 0.038 0.120 0.019
2.0 -149 -180 -215 -263 0.000 0.000 0.000
2.1 -87 -105 -128 -156 0.046 0.156 0.002
2.2 8/-46 13/-58 28/-73 37/-93 0.072 0.328 0.031
2.3 44/-18 56/-25 74/-37 94/-50 0.138 0.500 0.085
2.4 67 85 108 137 0.167 0.586 0.130
2.5 75 94 119 149 0.178 0.653 0.147
* Based on effectiveI 1/2 grossI . Includes LL distribution factor.
**Includes selfweight, wearing course, and barriers. Table 5.7.1.5 Shear Summary – One Lane
Span Point
Lane (kips)
Truck (kips)
Tandem (kips)
1.0 12.7 52.8 47.0
1.1 10.3 44.1 40.4
1.2 7.8 35.8 34.0
1.3 5.9 28.2 27.8
1.4 5.8 21.1 22.8
1.5 7.3 27.6 28.5
1.6 9.2 34.9 33.9
1.7 11.4 42.3 38.6
1.8 13.9 49.3 42.6
1.9 16.4 55.6 46.0
2.0 19.9 61.2 48.8
2.1 16.6 54.4 45.0
2.2 13.4 46.9 40.4
2.3 10.6 38.8 35.0
2.4 8.2 30.5 29.0
2.5 6.2 22.4 22.7
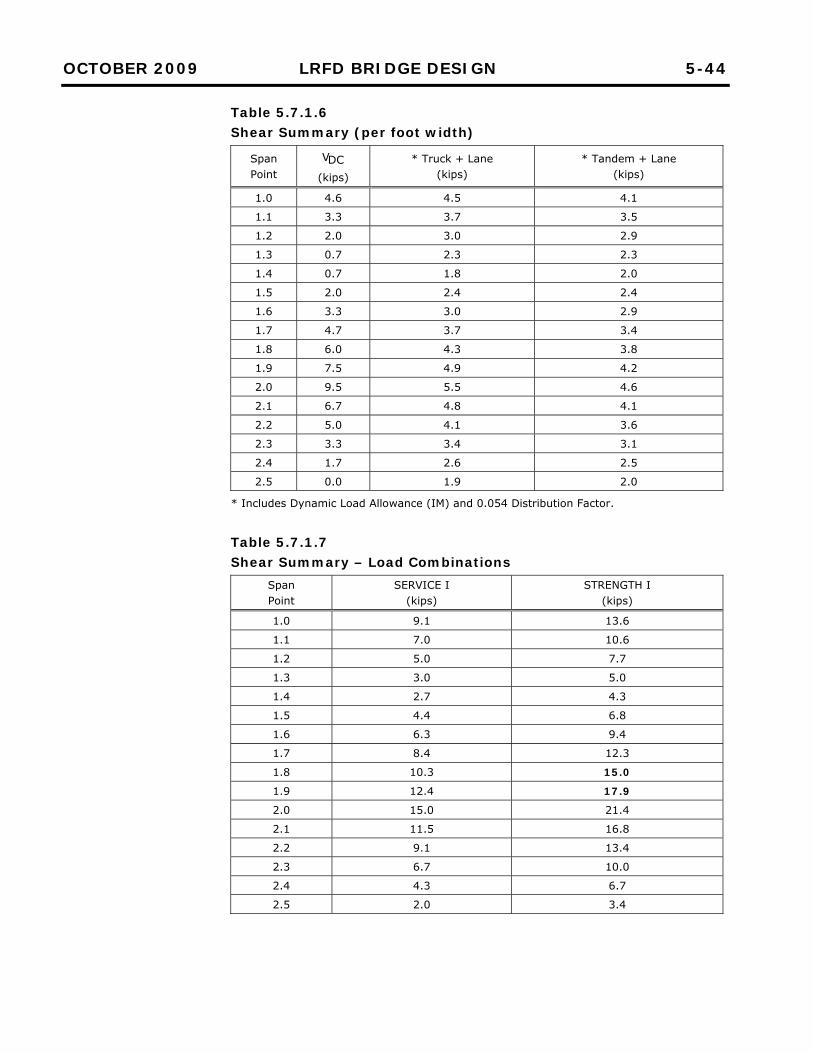
OCTOBER 2009 LRFD BRIDGE DESIGN 5-44
Table 5.7.1.6 Shear Summary (per foot width)
Span Point
DCV
(kips)
* Truck + Lane (kips)
* Tandem + Lane (kips)
1.0 4.6 4.5 4.1
1.1 3.3 3.7 3.5
1.2 2.0 3.0 2.9
1.3 0.7 2.3 2.3
1.4 0.7 1.8 2.0
1.5 2.0 2.4 2.4
1.6 3.3 3.0 2.9
1.7 4.7 3.7 3.4
1.8 6.0 4.3 3.8
1.9 7.5 4.9 4.2
2.0 9.5 5.5 4.6
2.1 6.7 4.8 4.1
2.2 5.0 4.1 3.6
2.3 3.3 3.4 3.1
2.4 1.7 2.6 2.5
2.5 0.0 1.9 2.0
* Includes Dynamic Load Allowance (IM) and 0.054 Distribution Factor.
Table 5.7.1.7 Shear Summary – Load Combinations
Span Point
SERVICE I (kips)
STRENGTH I (kips)
1.0 9.1 13.6
1.1 7.0 10.6
1.2 5.0 7.7
1.3 3.0 5.0
1.4 2.7 4.3
1.5 4.4 6.8
1.6 6.3 9.4
1.7 8.4 12.3
1.8 10.3 15.0
1.9 12.4 17.9
2.0 15.0 21.4
2.1 11.5 16.8
2.2 9.1 13.4
2.3 6.7 10.0
2.4 4.3 6.7
2.5 2.0 3.4
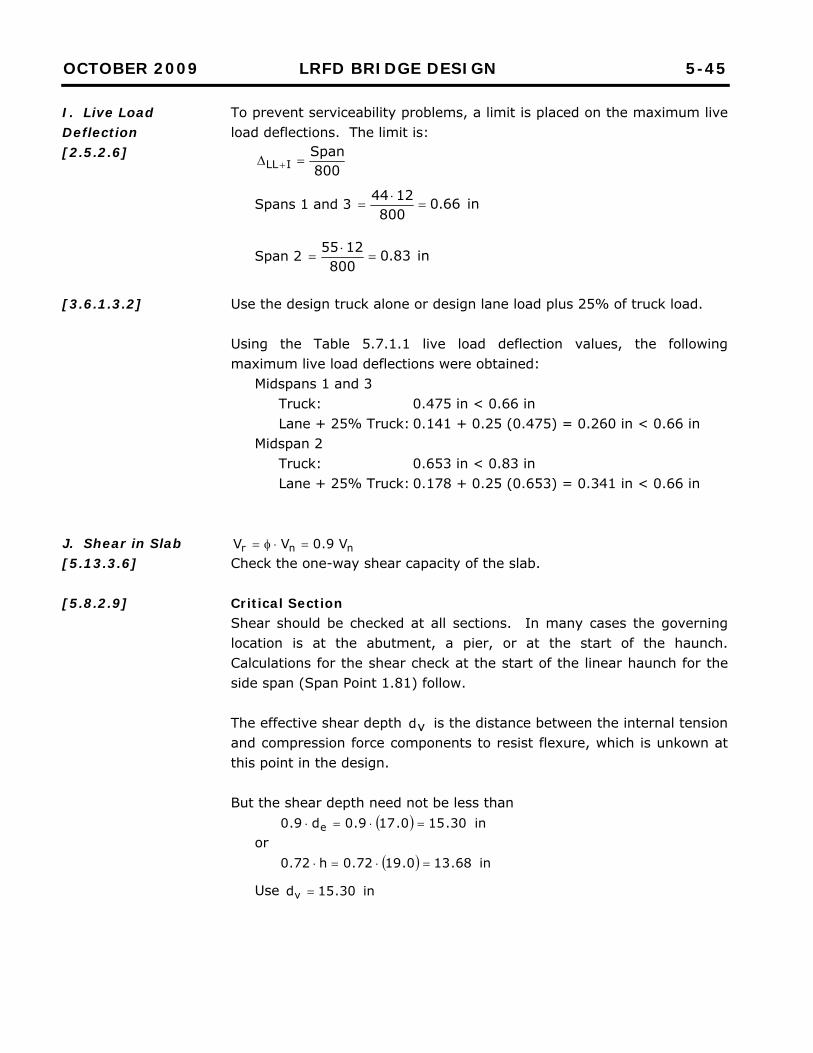
OCTOBER 2009 LRFD BRIDGE DESIGN 5-45
I. Live Load Deflection [2.5.2.6]
[3.6.1.3.2]
J. Shear in Slab [5.13.3.6]
[5.8.2.9]
To prevent serviceability problems, a limit is placed on the maximum live load deflections. The limit is:
800Span
ILL
Spans 1 and 3 in66.0800
1244
Span 2 in83.0800
1255
Use the design truck alone or design lane load plus 25% of truck load. Using the Table 5.7.1.1 live load deflection values, the following maximum live load deflections were obtained:
Midspans 1 and 3 Truck: 0.475 in < 0.66 in Lane + 25% Truck: 0.141 + 0.25 (0.475) = 0.260 in < 0.66 in
Midspan 2 Truck: 0.653 in < 0.83 in Lane + 25% Truck: 0.178 + 0.25 (0.653) = 0.341 in < 0.66 in
nnr V9.0VV Check the one-way shear capacity of the slab. Critical Section Shear should be checked at all sections. In many cases the governing location is at the abutment, a pier, or at the start of the haunch. Calculations for the shear check at the start of the linear haunch for the side span (Span Point 1.81) follow. The effective shear depth vd is the distance between the internal tension and compression force components to resist flexure, which is unkown at this point in the design. But the shear depth need not be less than
in30.150.179.0d9.0 e or
in68.130.1972.0h72.0
Use in30.15dv
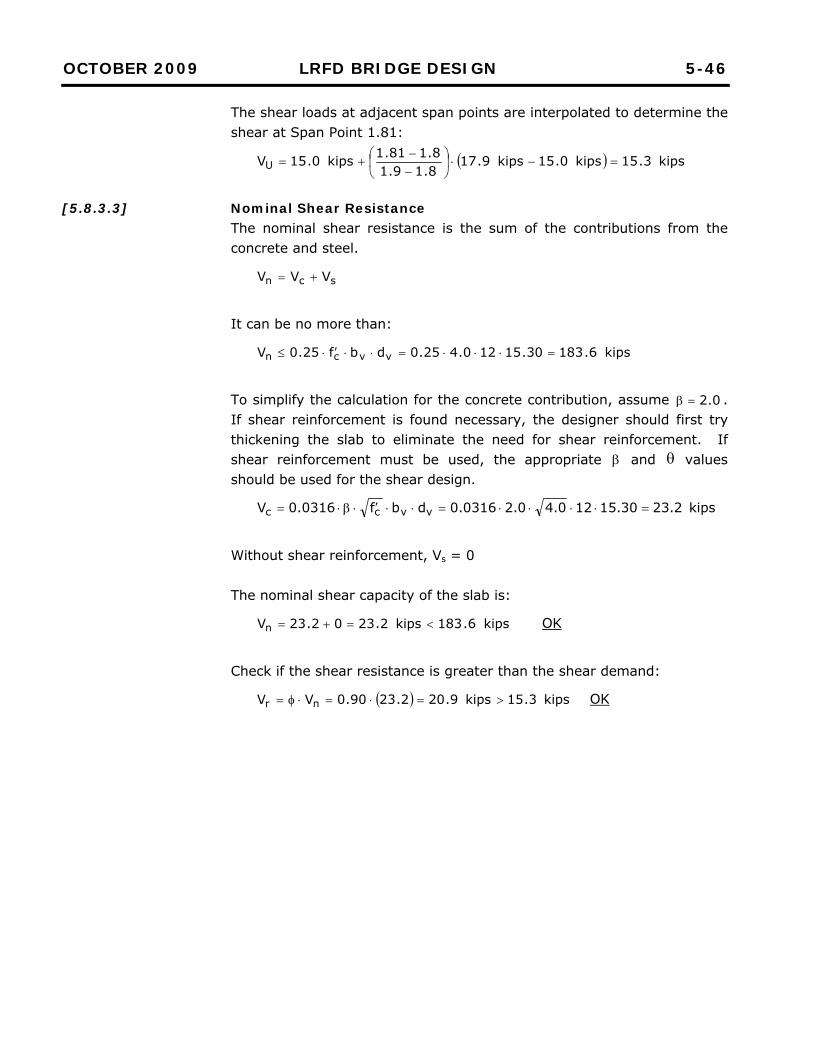
OCTOBER 2009 LRFD BRIDGE DESIGN 5-46
[5.8.3.3]
The shear loads at adjacent span points are interpolated to determine the shear at Span Point 1.81:
kips3.15kips0.15kips9.178.19.18.181.1kips0.15VU
Nominal Shear Resistance The nominal shear resistance is the sum of the contributions from the concrete and steel.
scn VVV
It can be no more than:
kips6.18330.15120.425.0dbf25.0V vvcn
To simplify the calculation for the concrete contribution, assume 0.2 . If shear reinforcement is found necessary, the designer should first try thickening the slab to eliminate the need for shear reinforcement. If shear reinforcement must be used, the appropriate and values should be used for the shear design.
kips2.2330.15120.40.20316.0dbf0.0316V vvcc
Without shear reinforcement, Vs = 0 The nominal shear capacity of the slab is:
kips6.183kips2.2302.23Vn OK
Check if the shear resistance is greater than the shear demand:
kips3.15kips9.202.2390.0VV nr OK
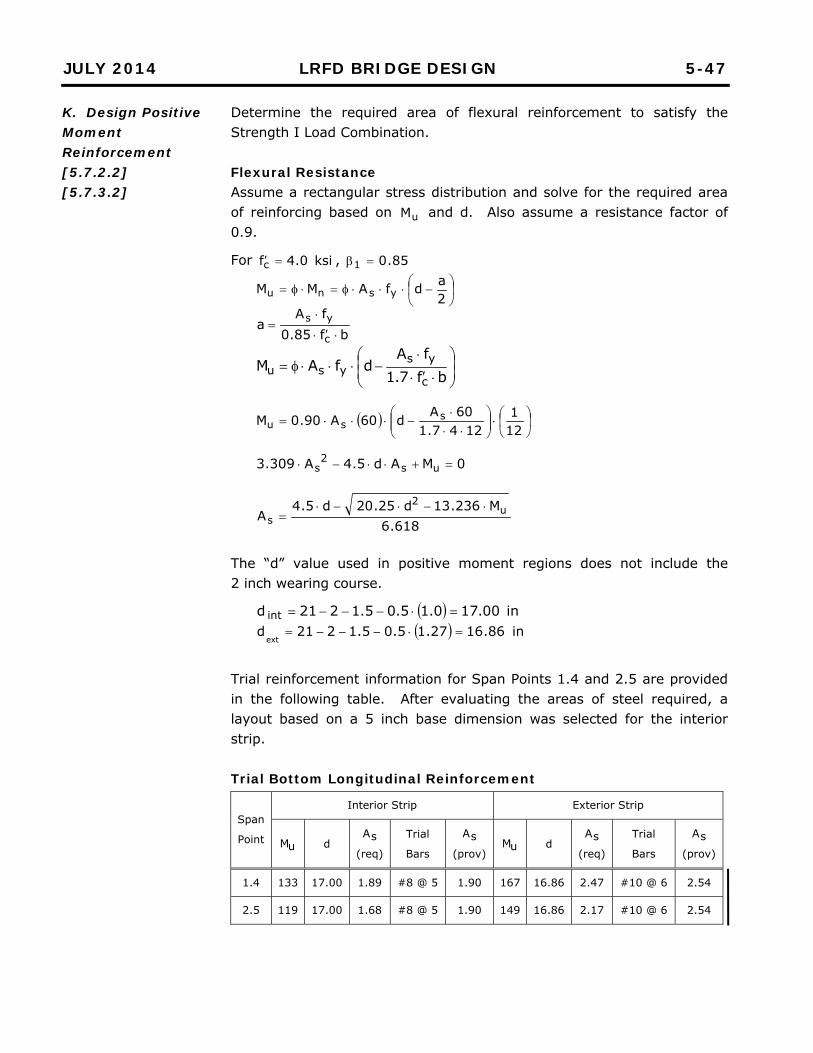
JULY 2014 LRFD BRIDGE DESIGN 5-47
K. Design Positive Moment Reinforcement [5.7.2.2] [5.7.3.2]
Determine the required area of flexural reinforcement to satisfy the Strength I Load Combination. Flexural Resistance Assume a rectangular stress distribution and solve for the required area of reinforcing based on uM and d. Also assume a resistance factor of 0.9.
For ksi0.4fc , 85.01
2adfAMM ysnu
bf85.0fA
ac
ys
bf7.1fA
dfAMc
ysysu
121
1247.160Ad60A90.0M s
su
0MAd5.4A309.3 us2
s
618.6M236.13d25.20d5.4
A u2
s
The “d” value used in positive moment regions does not include the 2 inch wearing course.
in00.170.15.05.1221d int in86.1627.15.05.1221d
ext
Trial reinforcement information for Span Points 1.4 and 2.5 are provided in the following table. After evaluating the areas of steel required, a layout based on a 5 inch base dimension was selected for the interior strip. Trial Bottom Longitudinal Reinforcement
Span
Point
Interior Strip Exterior Strip
uM d sA
(req)
Trial
Bars sA
(prov) uM d
sA
(req)
Trial
Bars sA
(prov)
1.4 133 17.00 1.89 #8 @ 5 1.90 167 16.86 2.47 #10 @ 6 2.54
2.5 119 17.00 1.68 #8 @ 5 1.90 149 16.86 2.17 #10 @ 6 2.54
OCTOBER 2009 LRFD BRIDGE DESIGN 5-48
[5.5.4.2.1]
Validate the assumption of 0.9 for resistance factor: Calculate the depth of the Whitney stress block.
79.212485.0
6090.1bf85.0
fAa '
c
ys
The depth of the section in compression is:
28.385.079.2ac
1
9.028.1128.300.1715.065.01
c
d15.065.0 t
Therefore, 9.0φ
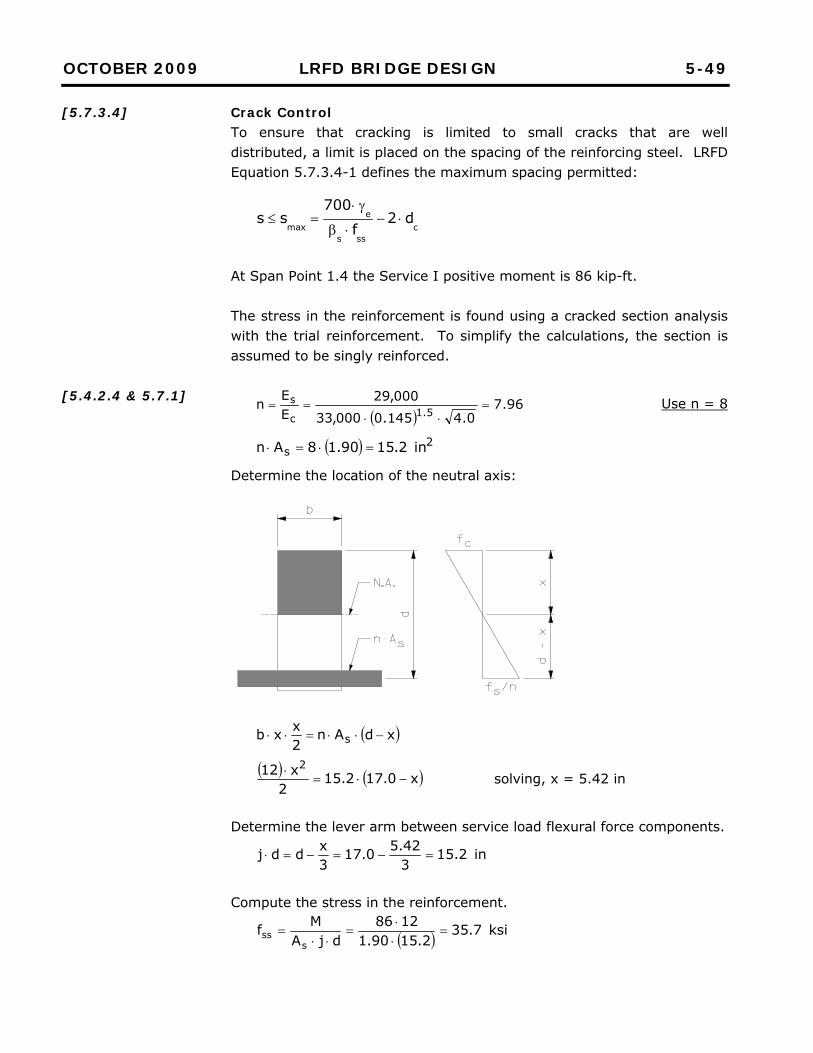
OCTOBER 2009 LRFD BRIDGE DESIGN 5-49
[5.7.3.4]
[5.4.2.4 & 5.7.1]
Crack Control To ensure that cracking is limited to small cracks that are well distributed, a limit is placed on the spacing of the reinforcing steel. LRFD Equation 5.7.3.4-1 defines the maximum spacing permitted:
csss
emax
d2f
700ss
At Span Point 1.4 the Service I positive moment is 86 kip-ft. The stress in the reinforcement is found using a cracked section analysis with the trial reinforcement. To simplify the calculations, the section is assumed to be singly reinforced.
96.7
0.4145.0000,33000,29
EE
n5.1c
s
Use n = 8
2s in2.1590.18An
Determine the location of the neutral axis:
xdAn2xxb s
x0.172.152
x12 2
solving, x = 5.42 in
Determine the lever arm between service load flexural force components.
in2.15342.50.17
3xddj
Compute the stress in the reinforcement.
ksi7.352.1590.1
1286djA
Mfs
ss
OCTOBER 2009 LRFD BRIDGE DESIGN 5-50
[5.5.3]
[Table 3.4.1-1]
[3.6.2.1]
For in00.2dc (1.5 in + 1/2 of #25 bar)
15.1)221(7.0
21)dh(7.0
d1
c
cs
75.0Usee
in5in8.8227.3515.1
75.0700d2f
700s
csss
emax
OK
Fatigue The stress range in the reinforcement is computed and compared against code limits to ensure adequate fatigue resistance is provided. U = 1.50 (LL + IM) IM = 15% At Span Point 1.4 the one lane fatigue moments are:
Maximum positive moment = 299 kip-ft Maximum negative moment = -98 kip-ft
Multiplying the one lane moments by the appropriate load factor, dynamic load allowance, and distribution factor results in the following fatigue moments: Fatigue 8.26052.015.150.1299MLL
max kip-ft
Fatigue 8.8052.015.150.198MLLmin
kip-ft
The unfactored dead load moment at Span Point 1.4 is 34.3 kip-ft. The moments on the cross section when fatigue loading is applied are:
Maximum moment = 34.3 + 26.8 = 61.1 kip-ft Minimum moment = 34.3 – 8.8 = 25.5 kip-ft
Plugging these moments into the equation used to compute the stress in the reinforcement for crack control results in: For the maximum moment:
ksi4.252.1590.1
121.61djA
Mfs
ss
For the minimum moment:
ksi6.102.1590.1
125.25djA
Mfs
ss
JULY 2014 LRFD BRIDGE DESIGN 5-51
[5.5.3.2]
[5.7.3.3.2]
[5.11.1.2.1] [5.11.1.2.2]
The stress range in the reinforcement ( ff ) is the difference between the two stresses
ksi8.146.104.25ff
The maximum stress range permitted is based on the minimum stress in the bar and the deformation pattern of the reinforcement.
6.1003324f33.024fmin(max)f
ksi8.145.20 OK
Check Minimum Reinforcement To prevent a brittle failure, adequate flexural reinforcement needs to be placed in the cross section. For this check, the thickness of the slab including the wearing course is used to be conservative.
ksi74.0437.0f37.0f cr
in0.21t
433g in92612112
121tb
121I
in5.10yt
4.54125.10
926174.0y
IfM
t
gr
cr
kip-ft
3.65M2.1 cr kip-ft
2adfAM ysr
121
279.20.176090.19.0Mr
4.133Mr kip-ft 3.65M2.1 cr kip-ft OK
Use #8 bars at 5 inches at Span Point 1.4
Bar Cutoff Location Determine the location where the 5 inch spacing can be increased to 10 inches. Assume that the bars will be dropped in non-haunched regions of the span. The moment capacity of #8 bars at 10 inches (As = 0.95 in2) for positive flexure is:
2adfAM ysr
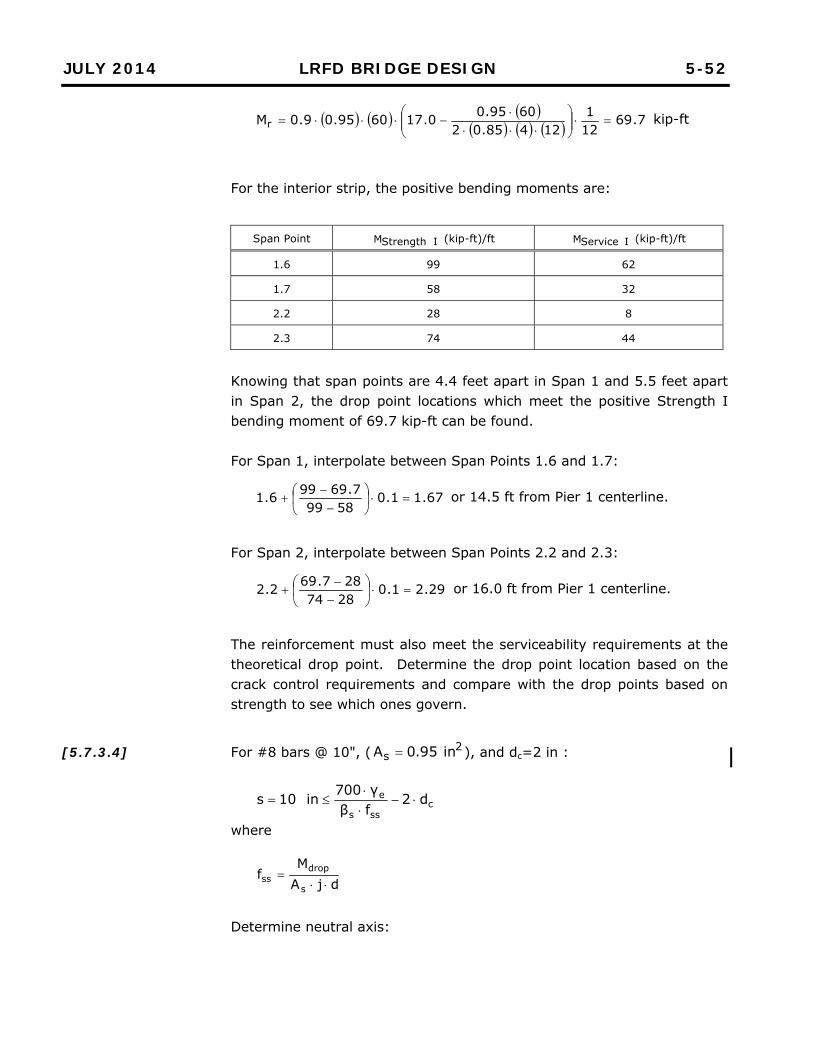
JULY 2014 LRFD BRIDGE DESIGN 5-52
[5.7.3.4]
7.69
121
12485.026095.00.176095.09.0Mr
kip-ft
For the interior strip, the positive bending moments are:
Span Point IStrengthM (kip-ft)/ft IServiceM (kip-ft)/ft
1.6 99 62
1.7 58 32
2.2 28 8
2.3 74 44
Knowing that span points are 4.4 feet apart in Span 1 and 5.5 feet apart in Span 2, the drop point locations which meet the positive Strength I bending moment of 69.7 kip-ft can be found. For Span 1, interpolate between Span Points 1.6 and 1.7:
67.11.05899
7.69996.1
or 14.5 ft from Pier 1 centerline.
For Span 2, interpolate between Span Points 2.2 and 2.3:
29.21.02874287.692.2
or 16.0 ft from Pier 1 centerline.
The reinforcement must also meet the serviceability requirements at the theoretical drop point. Determine the drop point location based on the crack control requirements and compare with the drop points based on strength to see which ones govern.
For #8 bars @ 10", ( 2
s in95.0A ), and dc=2 in :
csss
e d2fβγ700
in10s
where
djAM
fs
dropss
Determine neutral axis:
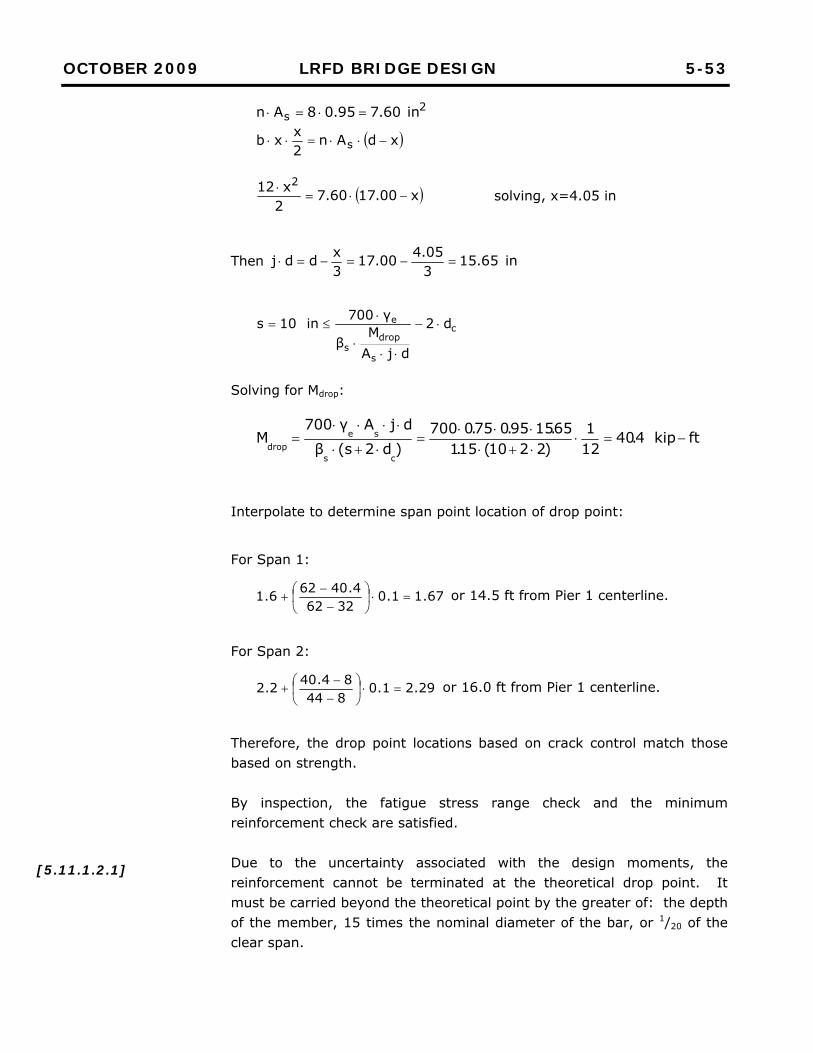
OCTOBER 2009 LRFD BRIDGE DESIGN 5-53
[5.11.1.2.1]
2s in60.795.08An
xdAn2xxb s
x00.1760.72x12 2
solving, x=4.05 in
Then in65.15305.400.17
3xddj
c
s
drops
e d2
djAM
β
γ700in10s
Solving for Mdrop:
ftkip4.40121
)2210(15.165.1595.075.0700
)d2(sβdjAγ700
Mcs
sedrop
Interpolate to determine span point location of drop point:
For Span 1:
67.11.03262
4.40626.1
or 14.5 ft from Pier 1 centerline.
For Span 2:
29.21.084484.402.2
or 16.0 ft from Pier 1 centerline.
Therefore, the drop point locations based on crack control match those based on strength. By inspection, the fatigue stress range check and the minimum reinforcement check are satisfied. Due to the uncertainty associated with the design moments, the reinforcement cannot be terminated at the theoretical drop point. It must be carried beyond the theoretical point by the greater of: the depth of the member, 15 times the nominal diameter of the bar, or 1/20 of the clear span.
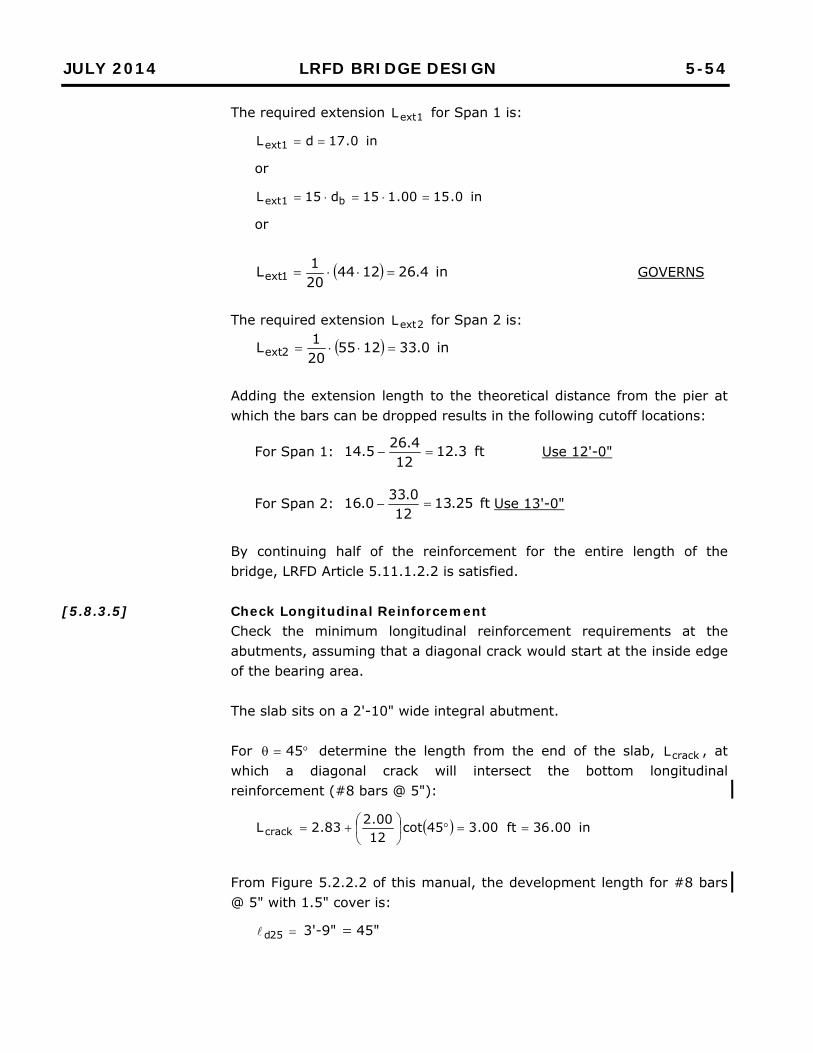
JULY 2014 LRFD BRIDGE DESIGN 5-54
[5.8.3.5]
The required extension 1extL for Span 1 is:
in0.17dL 1ext
or
in0.1500.115d15L b1ext
or
in4.261244201L 1ext GOVERNS
The required extension 2extL for Span 2 is:
in0.331255201L 2ext
Adding the extension length to the theoretical distance from the pier at which the bars can be dropped results in the following cutoff locations:
For Span 1: ft3.1212
4.265.14 Use 12'-0"
For Span 2: ft25.1312
0.330.16 Use 13'-0"
By continuing half of the reinforcement for the entire length of the bridge, LRFD Article 5.11.1.2.2 is satisfied. Check Longitudinal Reinforcement Check the minimum longitudinal reinforcement requirements at the abutments, assuming that a diagonal crack would start at the inside edge of the bearing area. The slab sits on a 2'-10" wide integral abutment. For 45 determine the length from the end of the slab, crackL , at which a diagonal crack will intersect the bottom longitudinal reinforcement (#8 bars @ 5"):
in00.36ft00.345cot1200.283.2Lcrack
From Figure 5.2.2.2 of this manual, the development length for #8 bars @ 5" with 1.5" cover is:
25d 3'-9" 45"
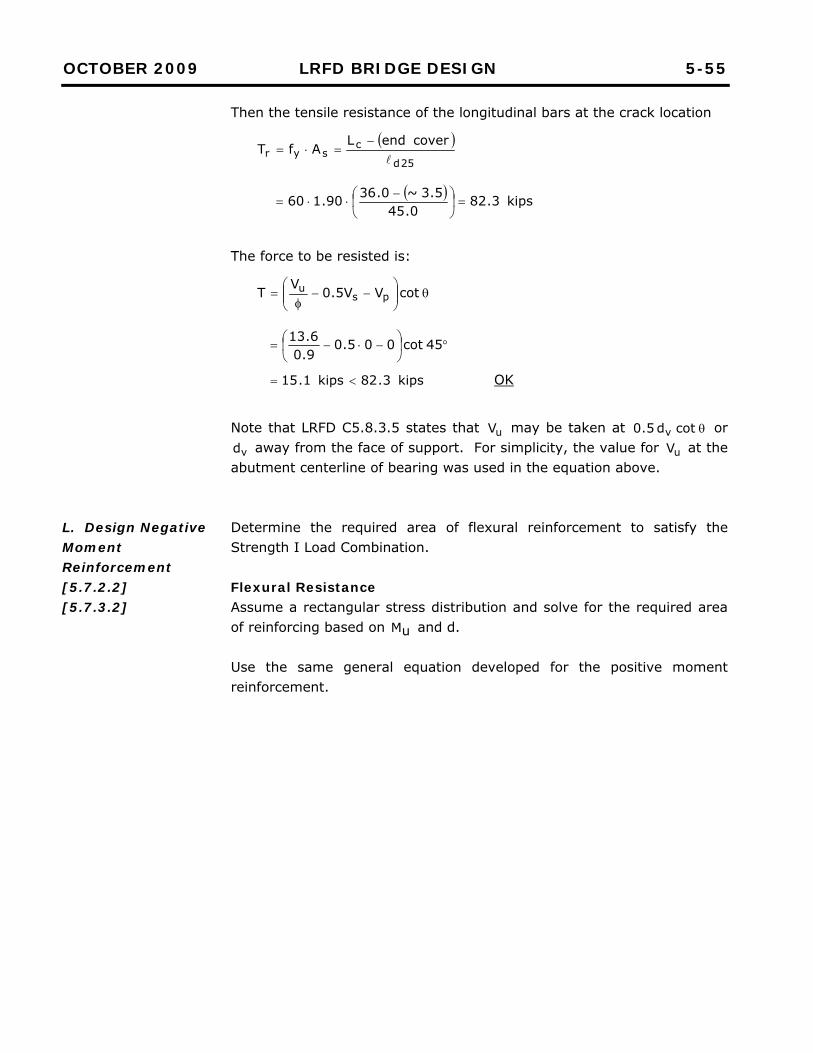
OCTOBER 2009 LRFD BRIDGE DESIGN 5-55
L. Design Negative Moment Reinforcement [5.7.2.2] [5.7.3.2]
Then the tensile resistance of the longitudinal bars at the crack location
25d
csyr
cover endLAfT
kips3.820.45
5.3~0.3690.160
The force to be resisted is:
cotVV5.0
VT ps
u
45cot005.0
9.06.13
kips3.82kips1.15 OK
Note that LRFD C5.8.3.5 states that uV may be taken at cotd5.0 v or
vd away from the face of support. For simplicity, the value for uV at the abutment centerline of bearing was used in the equation above. Determine the required area of flexural reinforcement to satisfy the Strength I Load Combination. Flexural Resistance Assume a rectangular stress distribution and solve for the required area of reinforcing based on uM and d. Use the same general equation developed for the positive moment reinforcement.
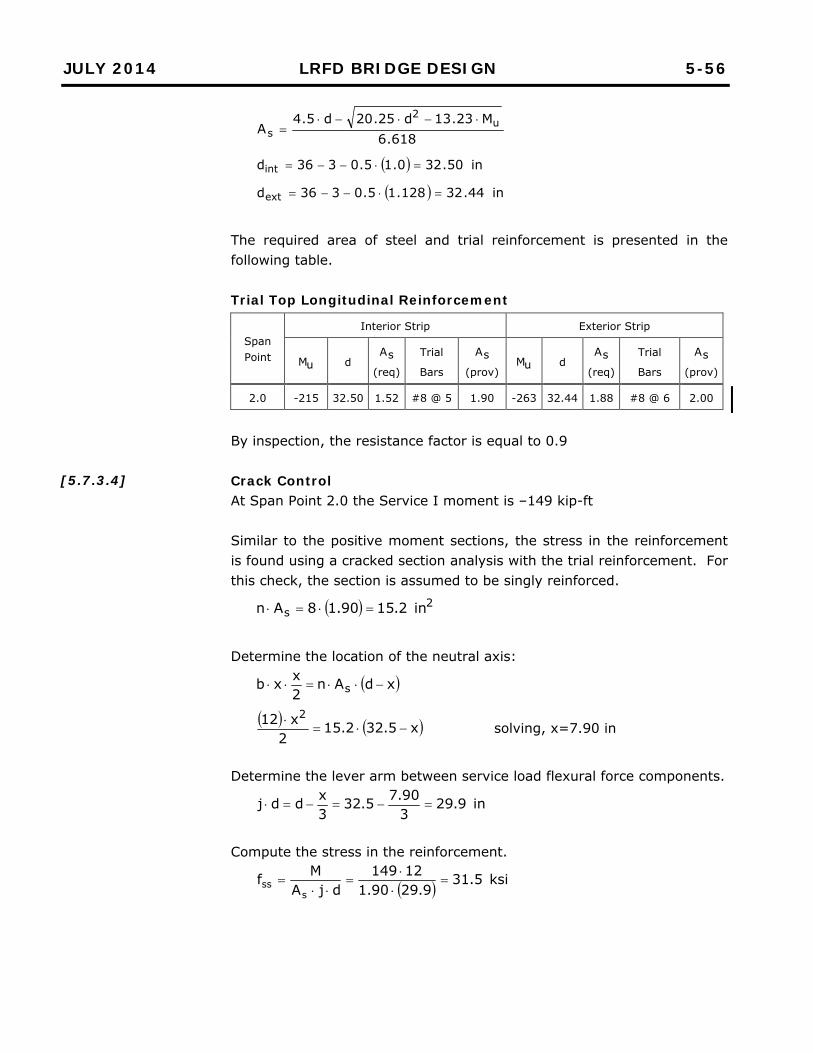
JULY 2014 LRFD BRIDGE DESIGN 5-56
[5.7.3.4]
618.6M23.13d25.20d5.4
A u2
s
in50.320.15.0336dint
in44.32128.15.0336dext
The required area of steel and trial reinforcement is presented in the following table. Trial Top Longitudinal Reinforcement
Span Point
Interior Strip Exterior Strip
uM d sA
(req)
Trial
Bars sA
(prov) uM d
sA
(req)
Trial
Bars sA
(prov)
2.0 -215 32.50 1.52 #8 @ 5 1.90 -263 32.44 1.88 #8 @ 6 2.00
By inspection, the resistance factor is equal to 0.9 Crack Control At Span Point 2.0 the Service I moment is –149 kip-ft Similar to the positive moment sections, the stress in the reinforcement is found using a cracked section analysis with the trial reinforcement. For this check, the section is assumed to be singly reinforced.
2s in2.1590.18An
Determine the location of the neutral axis:
xdAn2xxb s
x5.322.152
x12 2
solving, x=7.90 in
Determine the lever arm between service load flexural force components.
in9.29390.75.32
3xddj
Compute the stress in the reinforcement.
ksi5.319.2990.1
12149djA
Mfs
ss
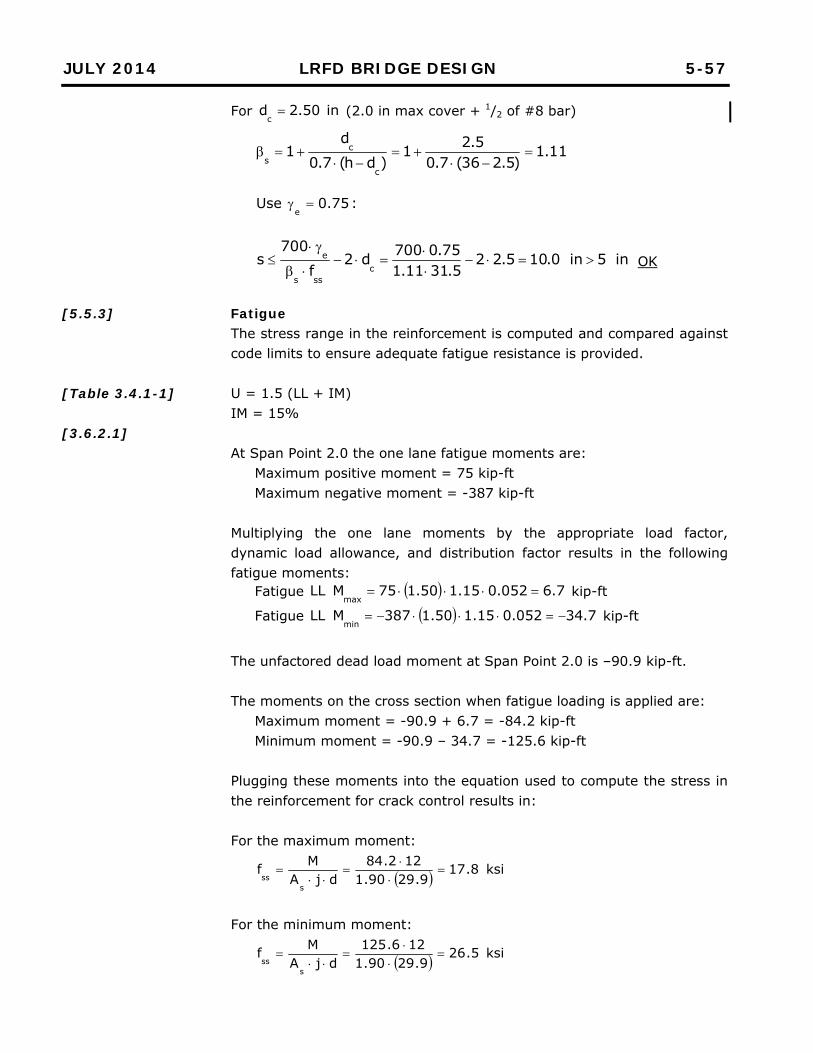
JULY 2014 LRFD BRIDGE DESIGN 5-57
[5.5.3]
[Table 3.4.1-1]
[3.6.2.1]
For in50.2dc (2.0 in max cover + 1/2 of #8 bar)
11.1)5.236(7.0
5.21)dh(7.0
d1
c
cs
:75.0Use
e
in5in0.105.225.3111.1
75.0700d2f
700s
csss
e
OK
Fatigue The stress range in the reinforcement is computed and compared against code limits to ensure adequate fatigue resistance is provided. U = 1.5 (LL + IM) IM = 15% At Span Point 2.0 the one lane fatigue moments are:
Maximum positive moment = 75 kip-ft Maximum negative moment = -387 kip-ft
Multiplying the one lane moments by the appropriate load factor, dynamic load allowance, and distribution factor results in the following fatigue moments:
Fatigue 7.6052.015.150.175MLLmax
kip-ft
Fatigue 7.34052.015.150.1387MLLmin
kip-ft
The unfactored dead load moment at Span Point 2.0 is –90.9 kip-ft. The moments on the cross section when fatigue loading is applied are:
Maximum moment = -90.9 + 6.7 = -84.2 kip-ft Minimum moment = -90.9 – 34.7 = -125.6 kip-ft
Plugging these moments into the equation used to compute the stress in the reinforcement for crack control results in: For the maximum moment:
ksi8.179.2990.1
122.84djA
Mfs
ss
For the minimum moment:
ksi5.269.2990.1
126.125djA
Mfs
ss
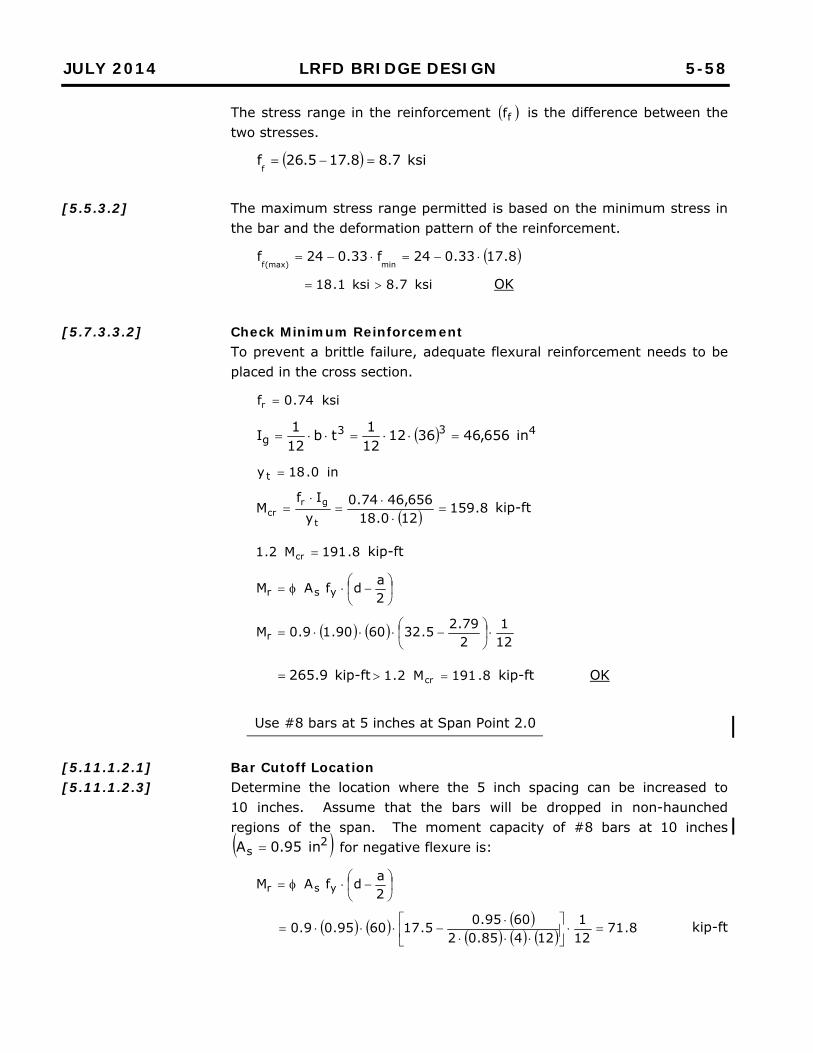
JULY 2014 LRFD BRIDGE DESIGN 5-58
[5.5.3.2]
[5.7.3.3.2]
[5.11.1.2.1] [5.11.1.2.3]
The stress range in the reinforcement ff is the difference between the two stresses.
ksi7.88.175.26ff
The maximum stress range permitted is based on the minimum stress in the bar and the deformation pattern of the reinforcement.
8.1733.024f33.024fmin(max)f
ksi7.8ksi1.18 OK
Check Minimum Reinforcement To prevent a brittle failure, adequate flexural reinforcement needs to be placed in the cross section.
ksi74.0fr
433g in656,463612
121tb
121I
in0.18yt
8.159120.18656,4674.0
yIf
Mt
grcr
kip-ft
8.191M2.1 cr kip-ft
2adfAM ysr
121
279.25.326090.19.0Mr
9.265 kip-ft 8.191M2.1 cr kip-ft OK
Use #8 bars at 5 inches at Span Point 2.0
Bar Cutoff Location Determine the location where the 5 inch spacing can be increased to 10 inches. Assume that the bars will be dropped in non-haunched regions of the span. The moment capacity of #8 bars at 10 inches 2
s in95.0A for negative flexure is:
2adfAM ysr
8.71
121
12485.026095.05.176095.09.0
kip-ft
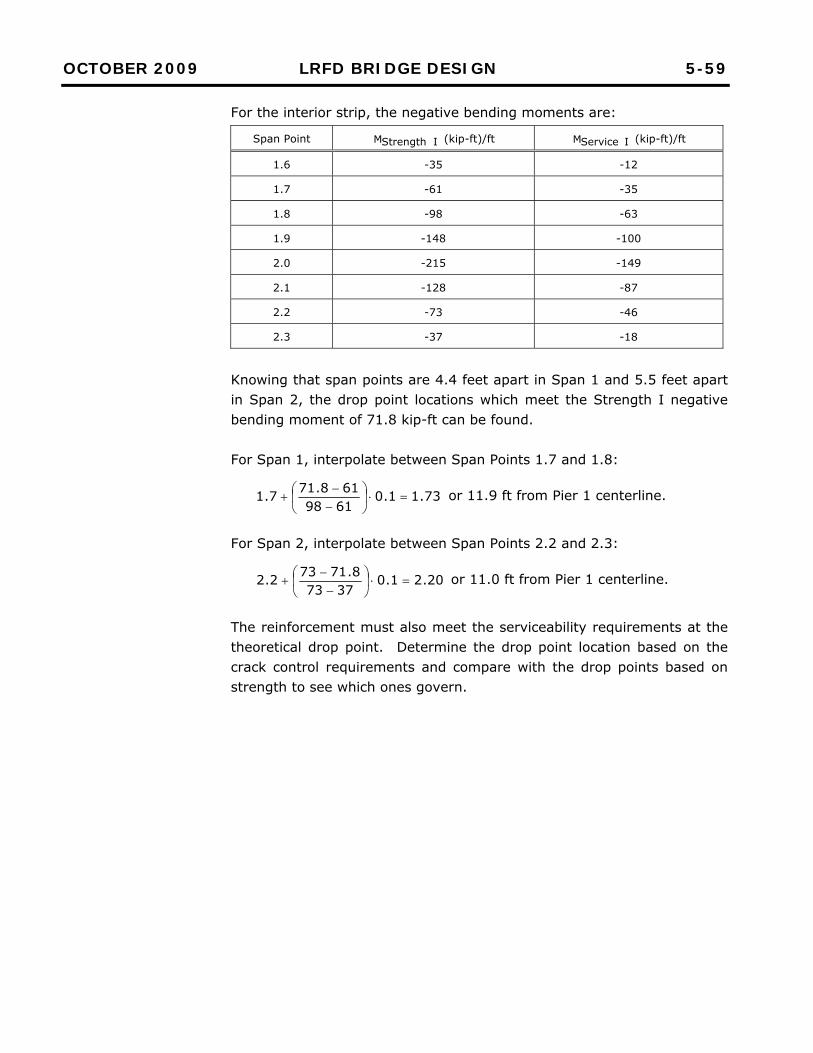
OCTOBER 2009 LRFD BRIDGE DESIGN 5-59
For the interior strip, the negative bending moments are:
Span Point IStrengthM (kip-ft)/ft IServiceM (kip-ft)/ft
1.6 -35 -12
1.7 -61 -35
1.8 -98 -63
1.9 -148 -100
2.0 -215 -149
2.1 -128 -87
2.2 -73 -46
2.3 -37 -18
Knowing that span points are 4.4 feet apart in Span 1 and 5.5 feet apart in Span 2, the drop point locations which meet the Strength I negative bending moment of 71.8 kip-ft can be found. For Span 1, interpolate between Span Points 1.7 and 1.8:
73.11.06198618.717.1
or 11.9 ft from Pier 1 centerline.
For Span 2, interpolate between Span Points 2.2 and 2.3:
20.21.03773
8.71732.2
or 11.0 ft from Pier 1 centerline.
The reinforcement must also meet the serviceability requirements at the theoretical drop point. Determine the drop point location based on the crack control requirements and compare with the drop points based on strength to see which ones govern.
JULY 2014 LRFD BRIDGE DESIGN 5-60
[5.7.3.4] For #8 bars @ 10", ( 2s in95.0A ), in50.2d
c :
Determine neutral axis:
2s in60.795.08An
xdAn2xxb s
x5.1760.72
x12 2
solving, x=4.12 in
Then in13.16312.45.17
3xddj
19.150.2217.0
50.21s
Solve for the moment at the drop point:
ftkip6.37121
)5.2210(19.113.1695.075.0700
)d2s(
djA700M
cs
scdrop
Interpolate to determine span point location of drop point:
For Span 1:
71.11.03563356.377.1
or 12.8 ft from Pier 1 centerline.
For Span 2:
23.21.01846
6.37462.2
or 12.7 ft from Pier 1 centerline
Therefore, the drop point locations based on crack control govern the bar cutoff locations.
OCTOBER 2009 LRFD BRIDGE DESIGN 5-61
M. Distribution Reinforcement [5.14.4.1]
[5.11.1.2.1]
By inspection, the fatigue stress range check and the minimum reinforcement check are satisfied. Due to the uncertainty associated with the design moments, the reinforcement cannot be terminated at the theoretical drop point. It must be carried beyond the theoretical point by the greater of: the depth of the member, 15 times the nominal diameter of the bar, or 1/20 of the clear span. The required extension 1extL for Span 1 is:
in5.170.15.0321dL 1ext
or
in0.1500.115d15L b1ext
or
in4.261244201L 1ext GOVERNS
The required extension 2extL for Span 2 is:
in0.331255201L 2ext
Adding the extension length to the theoretical distance from the pier at which the bars can be dropped results in the following cutoff locations from the pier:
For Span 1: ft0.1512
4.268.12 Use 15'-0"
For Span 2: ft5.1512
0.337.12 Use 15'-6"
By continuing half of the reinforcement for the entire length of the bridge, LRFD Article 5.11.1.2.3 is satisfied. The amount of transverse reinforcement may be taken as a percentage of the main reinforcement required:
%50L
100
%1.1544
100
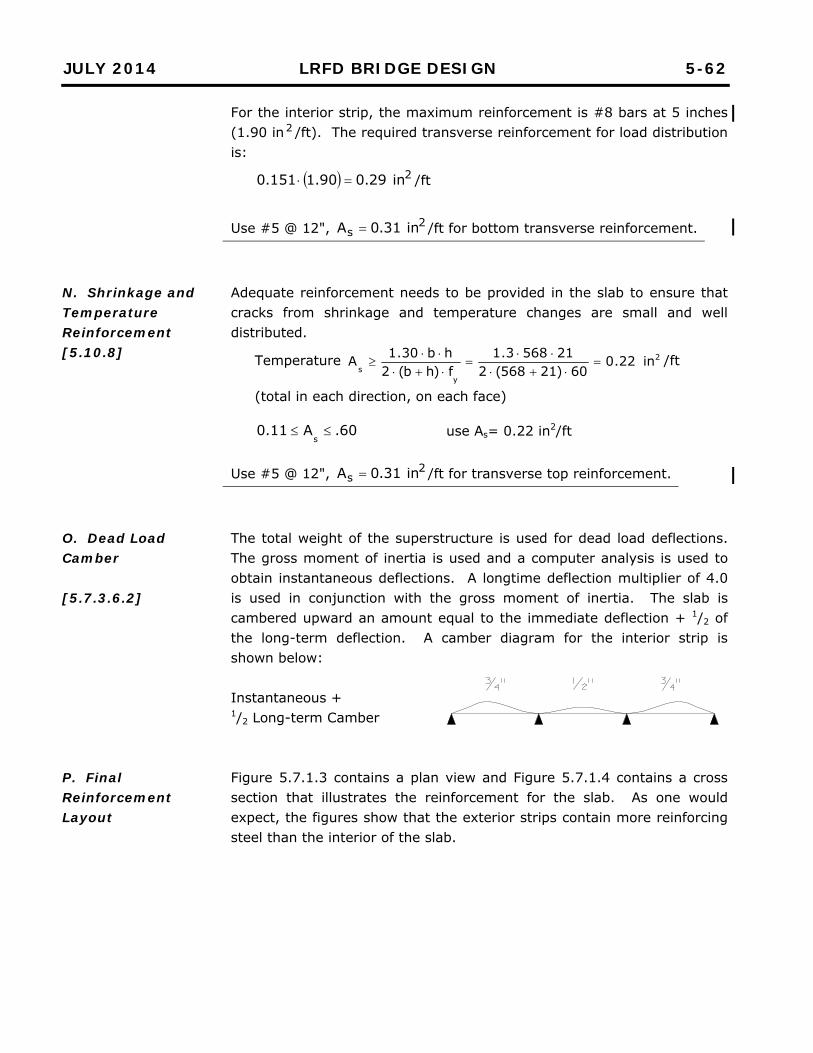
JULY 2014 LRFD BRIDGE DESIGN 5-62
N. Shrinkage and Temperature Reinforcement [5.10.8]
P. Final Reinforcement Layout
O. Dead Load Camber [5.7.3.6.2]
For the interior strip, the maximum reinforcement is #8 bars at 5 inches (1.90 in2 /ft). The required transverse reinforcement for load distribution is:
2in29.090.1151.0 /ft
Use #5 @ 12", 2
s in31.0A /ft for bottom transverse reinforcement.
Adequate reinforcement needs to be provided in the slab to ensure that cracks from shrinkage and temperature changes are small and well distributed.
Temperature 2
ys
in22.060)21568(2
215683.1f)hb(2hb30.1A
/ft
(total in each direction, on each face) 60.A11.0
s use As= 0.22 in2/ft
Use #5 @ 12", 2
s in31.0A /ft for transverse top reinforcement.
The total weight of the superstructure is used for dead load deflections. The gross moment of inertia is used and a computer analysis is used to obtain instantaneous deflections. A longtime deflection multiplier of 4.0 is used in conjunction with the gross moment of inertia. The slab is cambered upward an amount equal to the immediate deflection + 1/2 of the long-term deflection. A camber diagram for the interior strip is shown below: Instantaneous + 1/2 Long-term Camber Figure 5.7.1.3 contains a plan view and Figure 5.7.1.4 contains a cross section that illustrates the reinforcement for the slab. As one would expect, the figures show that the exterior strips contain more reinforcing steel than the interior of the slab.
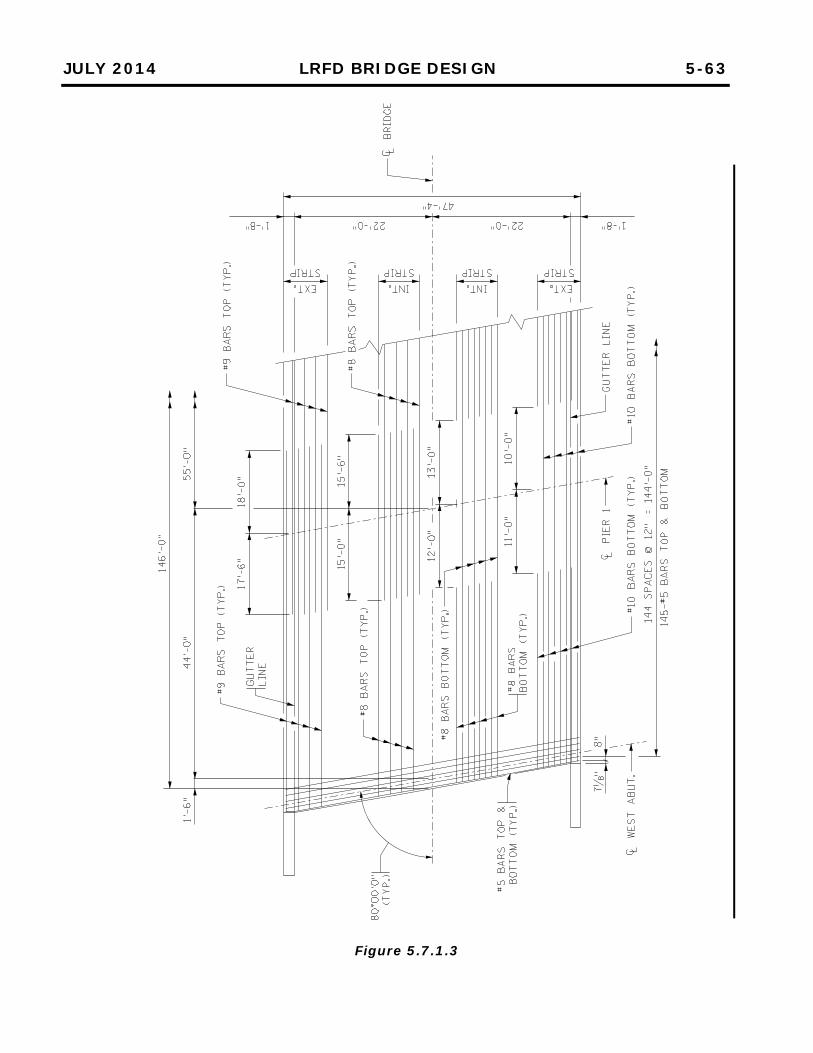
JULY 2014 LRFD BRIDGE DESIGN 5-63
Figure 5.7.1.3
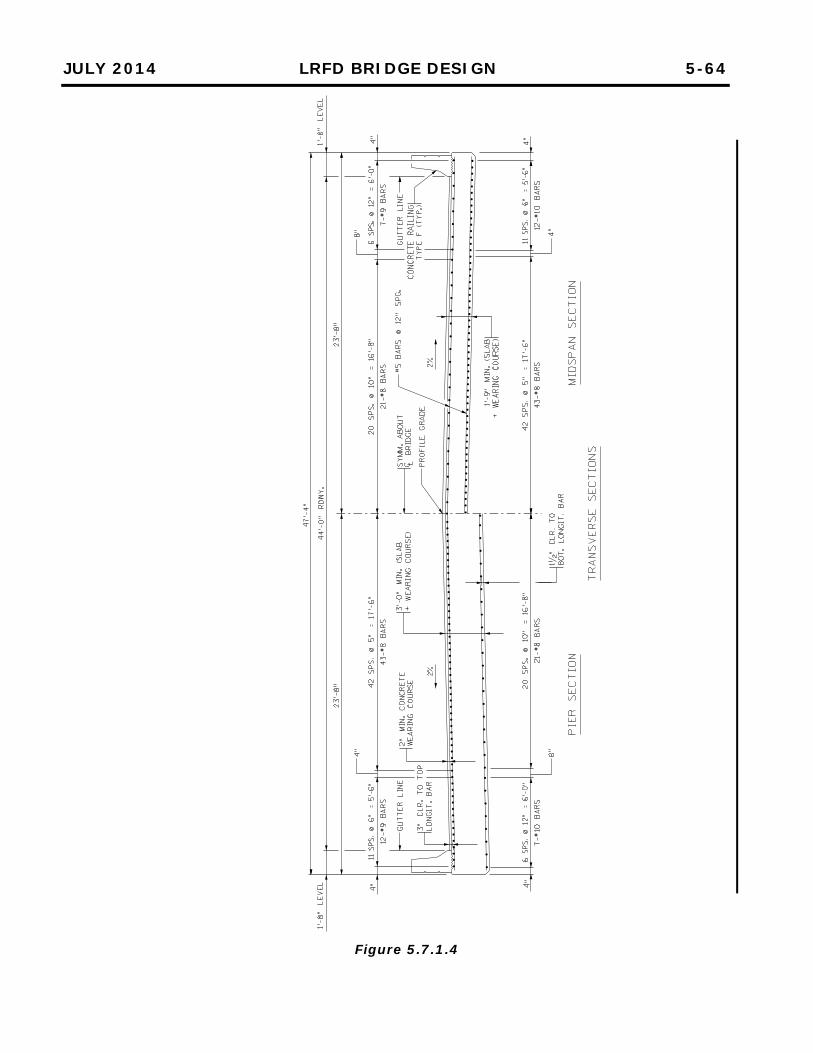
JULY 2014 LRFD BRIDGE DESIGN 5-64
Figure 5.7.1.4
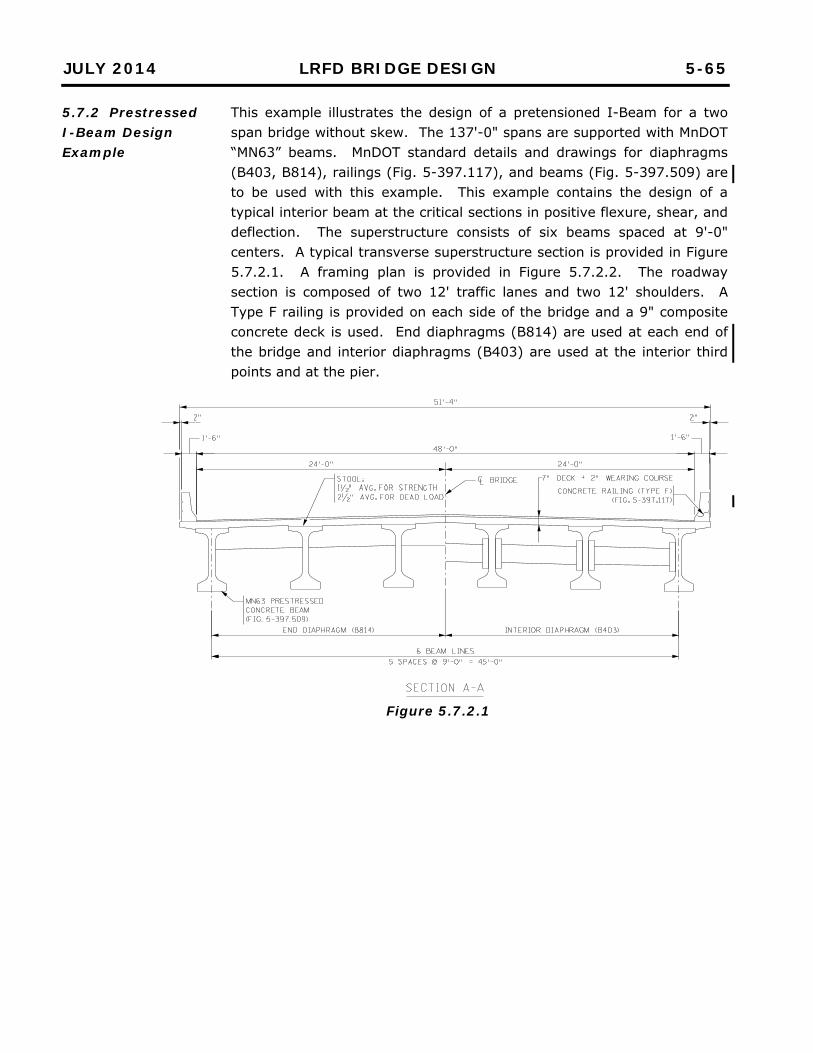
JULY 2014 LRFD BRIDGE DESIGN 5-65
5.7.2 Prestressed I-Beam Design Example
This example illustrates the design of a pretensioned I-Beam for a two span bridge without skew. The 137'-0" spans are supported with MnDOT “MN63” beams. MnDOT standard details and drawings for diaphragms (B403, B814), railings (Fig. 5-397.117), and beams (Fig. 5-397.509) are to be used with this example. This example contains the design of a typical interior beam at the critical sections in positive flexure, shear, and deflection. The superstructure consists of six beams spaced at 9'-0" centers. A typical transverse superstructure section is provided in Figure 5.7.2.1. A framing plan is provided in Figure 5.7.2.2. The roadway section is composed of two 12' traffic lanes and two 12' shoulders. A Type F railing is provided on each side of the bridge and a 9" composite concrete deck is used. End diaphragms (B814) are used at each end of the bridge and interior diaphragms (B403) are used at the interior third points and at the pier.
Figure 5.7.2.1
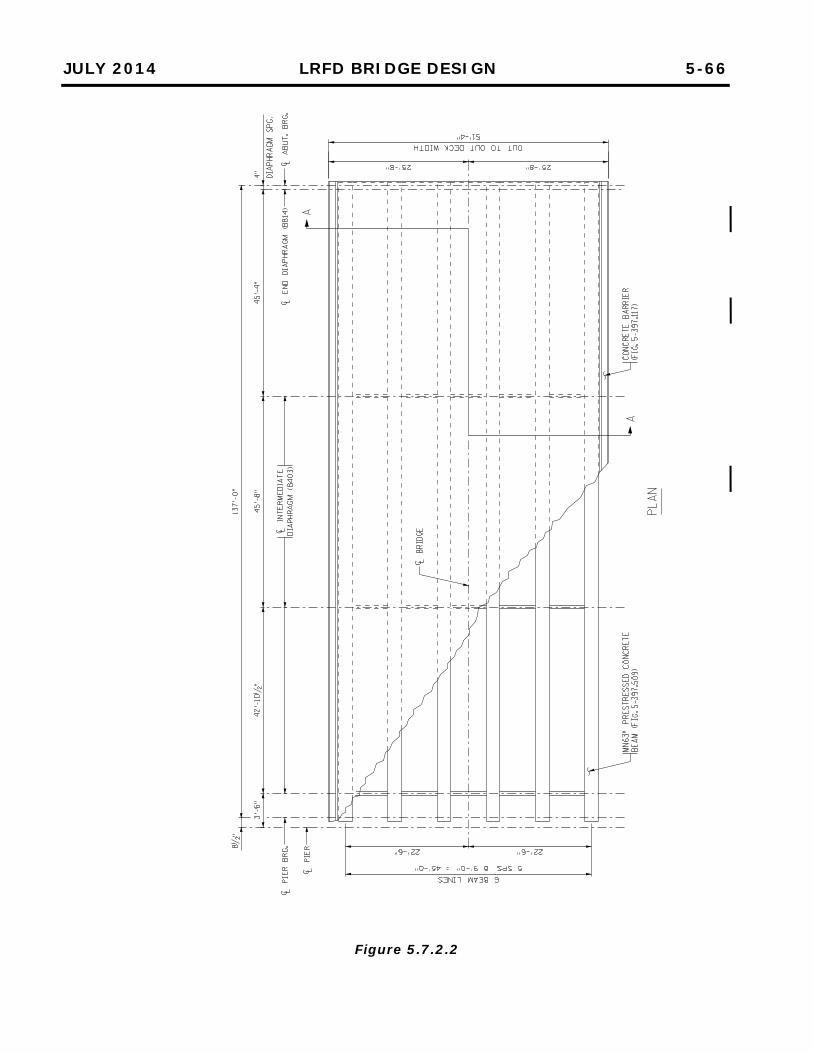
JULY 2014 LRFD BRIDGE DESIGN 5-66
Figure 5.7.2.2
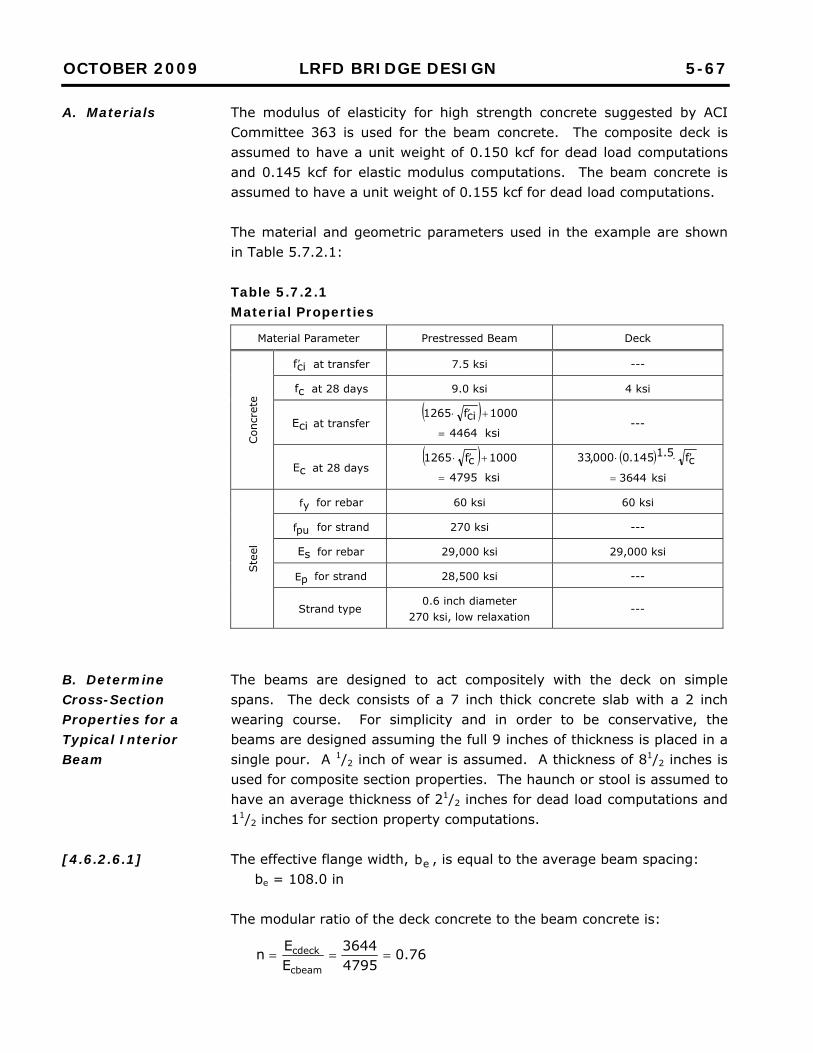
OCTOBER 2009 LRFD BRIDGE DESIGN 5-67
A. Materials
B. Determine Cross-Section Properties for a Typical Interior Beam
[4.6.2.6.1]
The modulus of elasticity for high strength concrete suggested by ACI Committee 363 is used for the beam concrete. The composite deck is assumed to have a unit weight of 0.150 kcf for dead load computations and 0.145 kcf for elastic modulus computations. The beam concrete is assumed to have a unit weight of 0.155 kcf for dead load computations. The material and geometric parameters used in the example are shown in Table 5.7.2.1: Table 5.7.2.1 Material Properties
Material Parameter Prestressed Beam Deck
Con
cret
e
cif at transfer 7.5 ksi ---
cf at 28 days 9.0 ksi 4 ksi
ciE at transfer 1000cif1265
ksi4464 ---
cE at 28 days 1000cf1265
ksi4795
cf5.1145.0000,33
ksi3644
Ste
el
yf for rebar 60 ksi 60 ksi
puf for strand 270 ksi ---
sE for rebar 29,000 ksi 29,000 ksi
pE for strand 28,500 ksi ---
Strand type 0.6 inch diameter
270 ksi, low relaxation ---
The beams are designed to act compositely with the deck on simple spans. The deck consists of a 7 inch thick concrete slab with a 2 inch wearing course. For simplicity and in order to be conservative, the beams are designed assuming the full 9 inches of thickness is placed in a single pour. A 1/2 inch of wear is assumed. A thickness of 81/2 inches is used for composite section properties. The haunch or stool is assumed to have an average thickness of 21/2 inches for dead load computations and 11/2 inches for section property computations. The effective flange width, eb , is equal to the average beam spacing:
be = 108.0 in The modular ratio of the deck concrete to the beam concrete is:
76.047953644
EEncbeam
cdeck
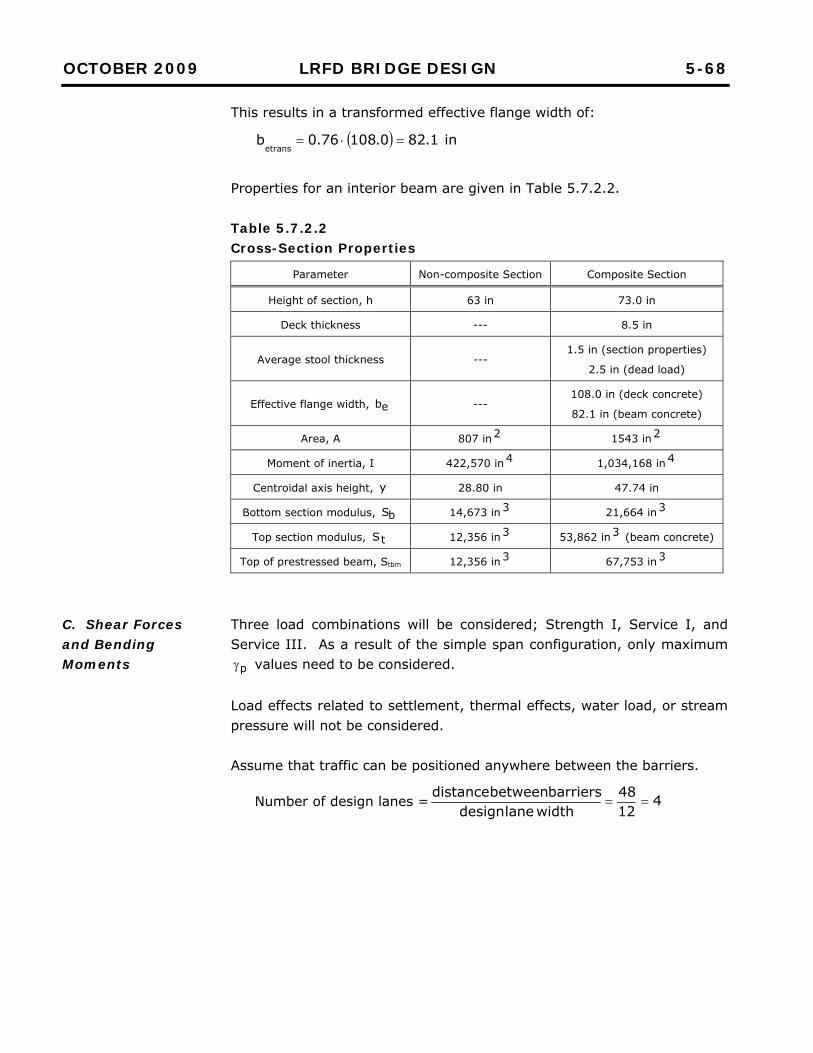
OCTOBER 2009 LRFD BRIDGE DESIGN 5-68
C. Shear Forces and Bending Moments
This results in a transformed effective flange width of:
in1.820.10876.0betrans
Properties for an interior beam are given in Table 5.7.2.2. Table 5.7.2.2 Cross-Section Properties
Parameter Non-composite Section Composite Section
Height of section, h 63 in 73.0 in
Deck thickness --- 8.5 in
Average stool thickness --- 1.5 in (section properties)
2.5 in (dead load)
Effective flange width, eb --- 108.0 in (deck concrete)
82.1 in (beam concrete)
Area, A 807 in2 1543 in2
Moment of inertia, I 422,570 in 4 1,034,168 in 4
Centroidal axis height, y 28.80 in 47.74 in
Bottom section modulus, bS 14,673 in 3 21,664 in3
Top section modulus, tS 12,356 in 3 53,862 in3 (beam concrete)
Top of prestressed beam, Stbm 12,356 in 3 67,753 in3
Three load combinations will be considered; Strength I, Service I, and Service III. As a result of the simple span configuration, only maximum
p values need to be considered. Load effects related to settlement, thermal effects, water load, or stream pressure will not be considered. Assume that traffic can be positioned anywhere between the barriers.
Number of design lanes = 41248
width lane designbarriers between distance
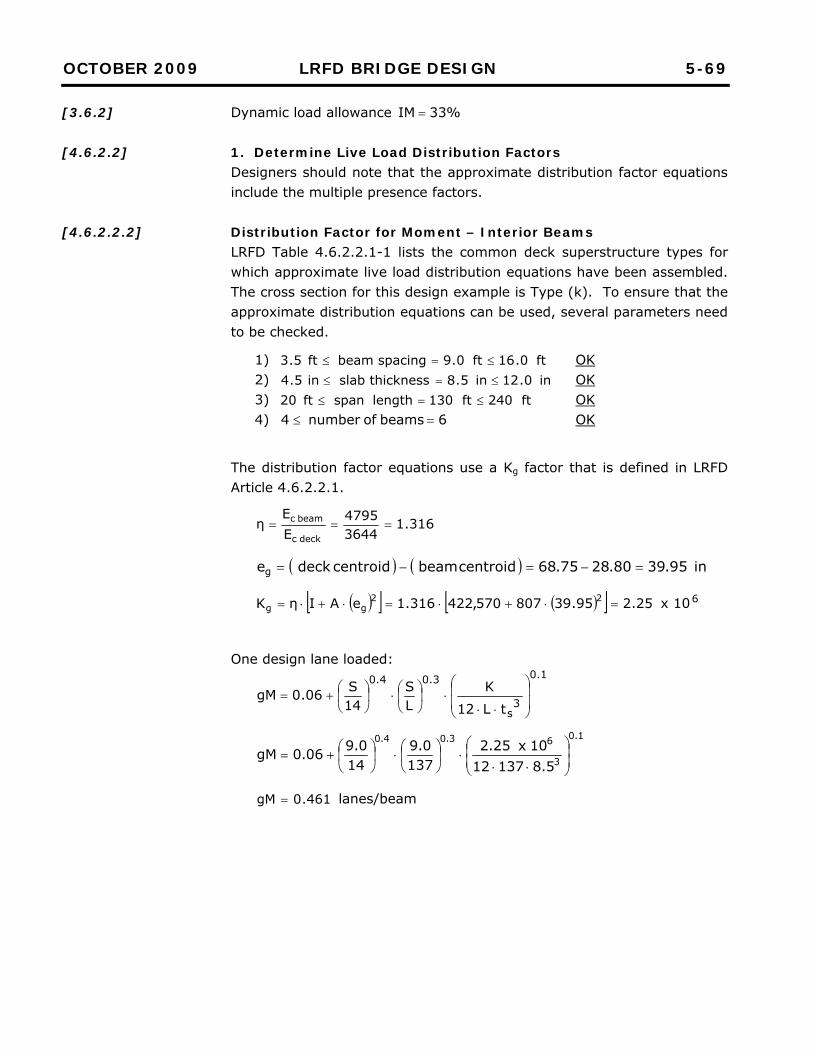
OCTOBER 2009 LRFD BRIDGE DESIGN 5-69
[3.6.2]
[4.6.2.2]
[4.6.2.2.2]
Dynamic load allowance %33IM 1. Determine Live Load Distribution Factors Designers should note that the approximate distribution factor equations include the multiple presence factors. Distribution Factor for Moment – Interior Beams LRFD Table 4.6.2.2.1-1 lists the common deck superstructure types for which approximate live load distribution equations have been assembled. The cross section for this design example is Type (k). To ensure that the approximate distribution equations can be used, several parameters need to be checked.
1) ft0.16ft0.9 spacing beam ft5.3 OK 2) in0.12in5.8 thickness slab in5.4 OK 3) ft240ft130 length span ft20 OK 4) 6 beams ofnumber 4 OK
The distribution factor equations use a Kg factor that is defined in LRFD Article 4.6.2.2.1.
316.136444795
EE
ηdeckc
beamc
in95.3980.2875.68 centroid beam centroiddeck eg
25.295.39807570,422316.1eAIηK 22gg x 106
One design lane loaded:
1.0
3s
3.04.0
tL12K
LS
14S06.0gM
1.0
3
63.04.0
5.81371210x25.2
1370.9
140.906.0gM
461.0gM lanes/beam
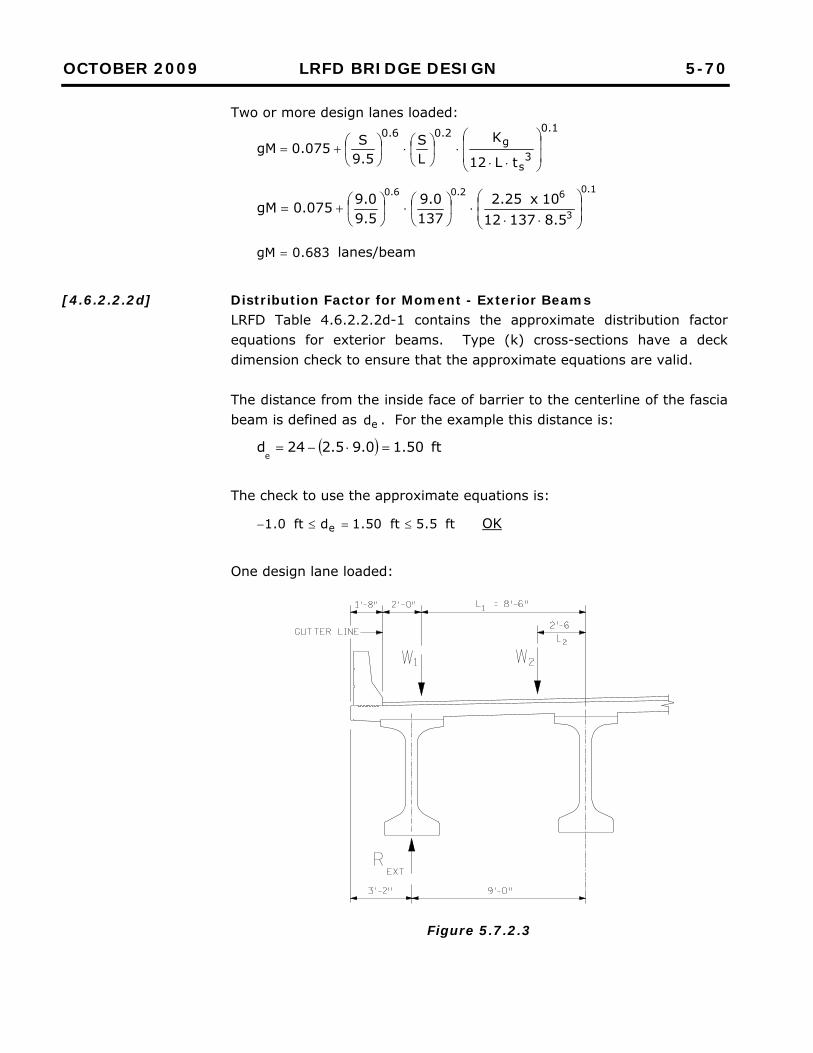
OCTOBER 2009 LRFD BRIDGE DESIGN 5-70
[4.6.2.2.2d]
Two or more design lanes loaded: 1.0
3s
g2.06.0
tL12
KLS
5.9S075.0gM
1.0
3
62.06.0
5.81371210x25.2
1370.9
5.90.9075.0gM
683.0gM lanes/beam
Distribution Factor for Moment - Exterior Beams LRFD Table 4.6.2.2.2d-1 contains the approximate distribution factor equations for exterior beams. Type (k) cross-sections have a deck dimension check to ensure that the approximate equations are valid. The distance from the inside face of barrier to the centerline of the fascia beam is defined as ed . For the example this distance is:
ft50.10.95.224de
The check to use the approximate equations is:
ft5.5ft50.1dft0.1 e OK
One design lane loaded:
Figure 5.7.2.3
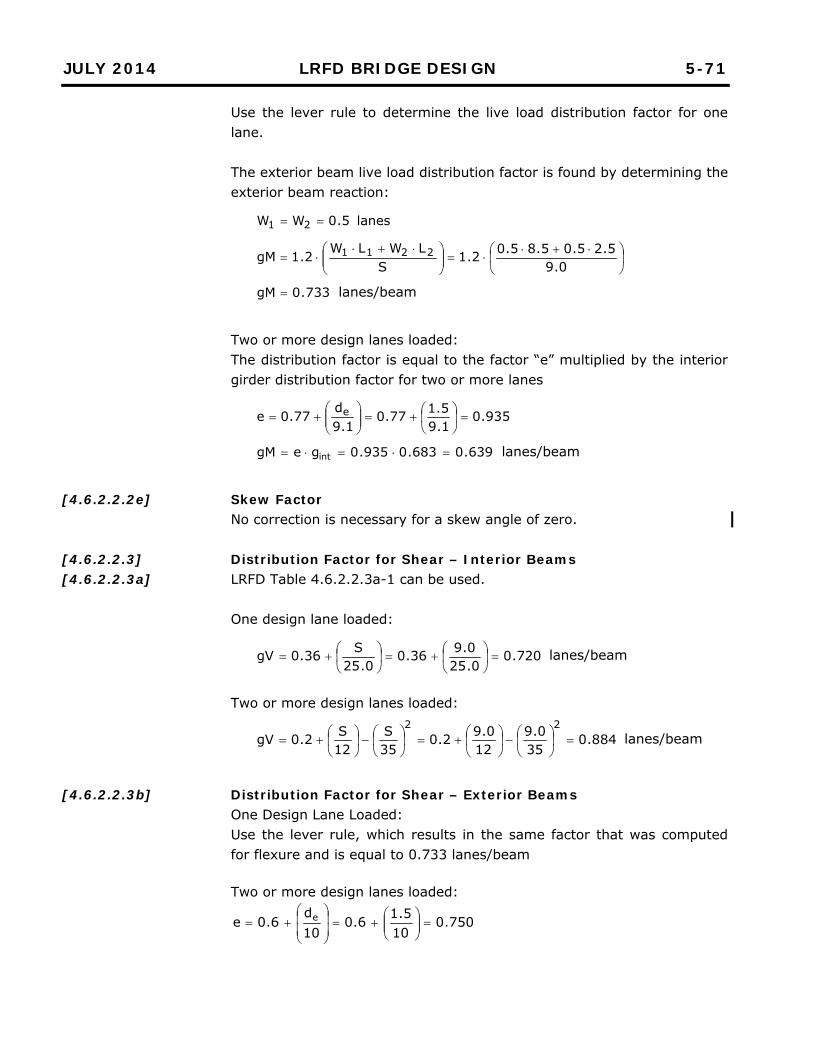
JULY 2014 LRFD BRIDGE DESIGN 5-71
[4.6.2.2.2e]
[4.6.2.2.3] [4.6.2.2.3a]
[4.6.2.2.3b]
Use the lever rule to determine the live load distribution factor for one lane. The exterior beam live load distribution factor is found by determining the exterior beam reaction:
lanes5.0WW 21
0.95.25.05.85.02.1
SLWLW2.1gM 2211
733.0gM lanes/beam
Two or more design lanes loaded: The distribution factor is equal to the factor “e” multiplied by the interior girder distribution factor for two or more lanes
935.01.95.177.0
1.9d
77.0e e
639.0683.0935.0gegM int lanes/beam
Skew Factor No correction is necessary for a skew angle of zero. Distribution Factor for Shear – Interior Beams LRFD Table 4.6.2.2.3a-1 can be used. One design lane loaded:
720.00.250.936.0
0.25S36.0gV
lanes/beam
Two or more design lanes loaded:
884.035
0.912
0.92.035S
12S2.0gV
22
lanes/beam
Distribution Factor for Shear – Exterior Beams One Design Lane Loaded: Use the lever rule, which results in the same factor that was computed for flexure and is equal to 0.733 lanes/beam
Two or more design lanes loaded:
750.010
5.16.010d
6.0e e
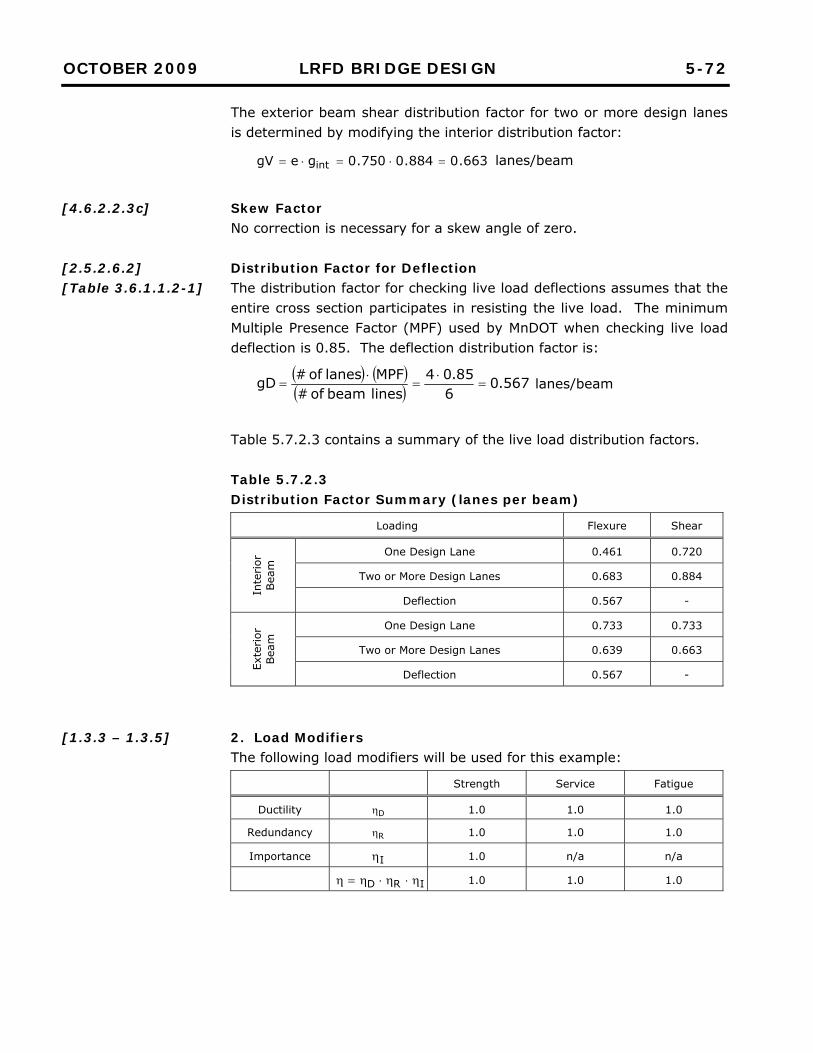
OCTOBER 2009 LRFD BRIDGE DESIGN 5-72
[4.6.2.2.3c]
[2.5.2.6.2] [Table 3.6.1.1.2-1]
[1.3.3 – 1.3.5]
The exterior beam shear distribution factor for two or more design lanes is determined by modifying the interior distribution factor:
663.0884.0750.0gegV int lanes/beam
Skew Factor No correction is necessary for a skew angle of zero. Distribution Factor for Deflection The distribution factor for checking live load deflections assumes that the entire cross section participates in resisting the live load. The minimum Multiple Presence Factor (MPF) used by MnDOT when checking live load deflection is 0.85. The deflection distribution factor is:
567.0
685.04
lines beam of #MPFlanes of #gD
lanes/beam
Table 5.7.2.3 contains a summary of the live load distribution factors. Table 5.7.2.3 Distribution Factor Summary (lanes per beam)
Loading Flexure Shear
Inte
rior
Bea
m One Design Lane 0.461 0.720
Two or More Design Lanes 0.683 0.884
Deflection 0.567 -
Exte
rior
Bea
m One Design Lane 0.733 0.733
Two or More Design Lanes 0.639 0.663
Deflection 0.567 -
2. Load Modifiers The following load modifiers will be used for this example:
Strength Service Fatigue
Ductility D 1.0 1.0 1.0
Redundancy R 1.0 1.0 1.0
Importance I 1.0 n/a n/a
IRD 1.0 1.0 1.0
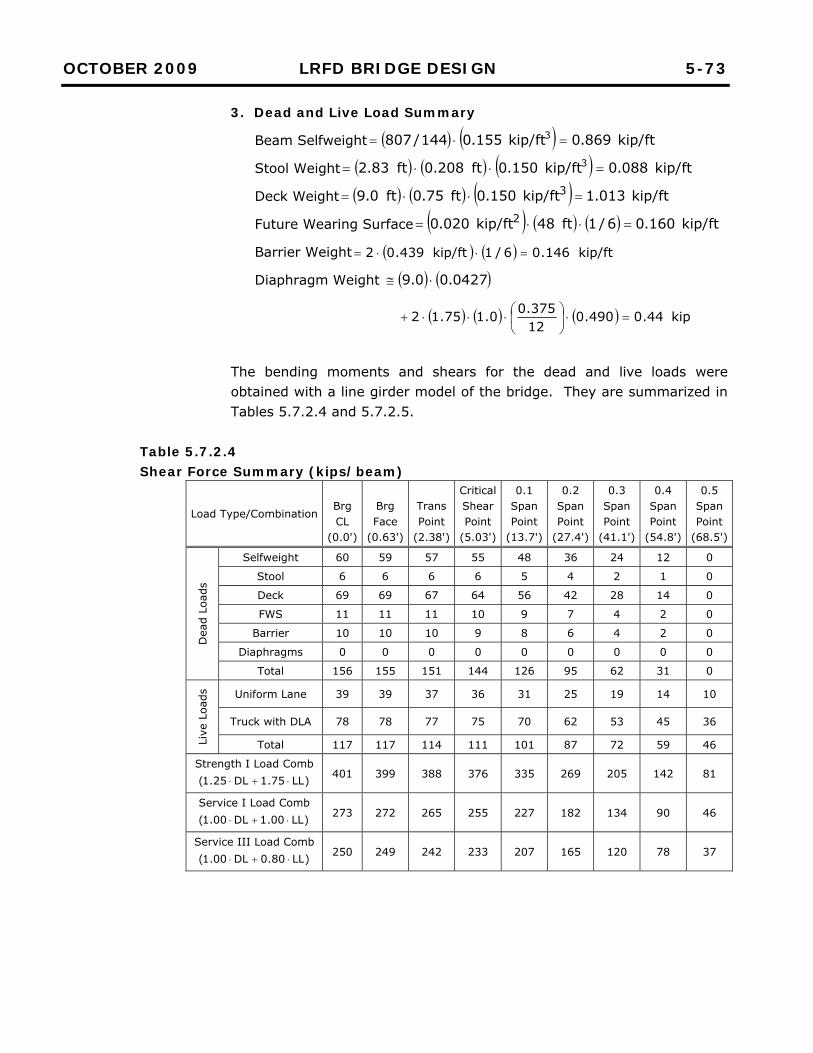
OCTOBER 2009 LRFD BRIDGE DESIGN 5-73
3. Dead and Live Load Summary
Beam Selfweight kip/ft 869.0kip/ft 155.0144/807 3
Stool Weight kip/ft 088.0kip/ft 150.0ft208.0ft83.2 3
Deck Weight kip/ft 013.1kip/ft 150.0ft75.0ft0.9 3
Future Wearing Surface kip/ft 160.06/1ft48kip/ft 020.0 2
Barrier Weight kip/ft 146.06/1kip/ft 439.02
Diaphragm Weight 0427.00.9
kip 44.0490.012375.00.175.12
The bending moments and shears for the dead and live loads were obtained with a line girder model of the bridge. They are summarized in Tables 5.7.2.4 and 5.7.2.5.
Table 5.7.2.4 Shear Force Summary (kips/beam)
Load Type/Combination Brg CL
(0.0')
Brg Face
(0.63')
Trans Point
(2.38')
Critical Shear Point
(5.03')
0.1 Span Point
(13.7')
0.2 Span Point
(27.4')
0.3 Span Point
(41.1')
0.4 Span Point
(54.8')
0.5 Span Point
(68.5')
Dea
d Lo
ads
Selfweight 60 59 57 55 48 36 24 12 0
Stool 6 6 6 6 5 4 2 1 0
Deck 69 69 67 64 56 42 28 14 0
FWS 11 11 11 10 9 7 4 2 0
Barrier 10 10 10 9 8 6 4 2 0
Diaphragms 0 0 0 0 0 0 0 0 0
Total 156 155 151 144 126 95 62 31 0
Live
Loa
ds
Uniform Lane 39 39 37 36 31 25 19 14 10
Truck with DLA 78 78 77 75 70 62 53 45 36
Total 117 117 114 111 101 87 72 59 46
Strength I Load Comb )LL75.1DL25.1( 401 399 388 376 335 269 205 142 81
Service I Load Comb )LL00.1DL00.1( 273 272 265 255 227 182 134 90 46
Service III Load Comb )LL80.0DL00.1( 250 249 242 233 207 165 120 78 37
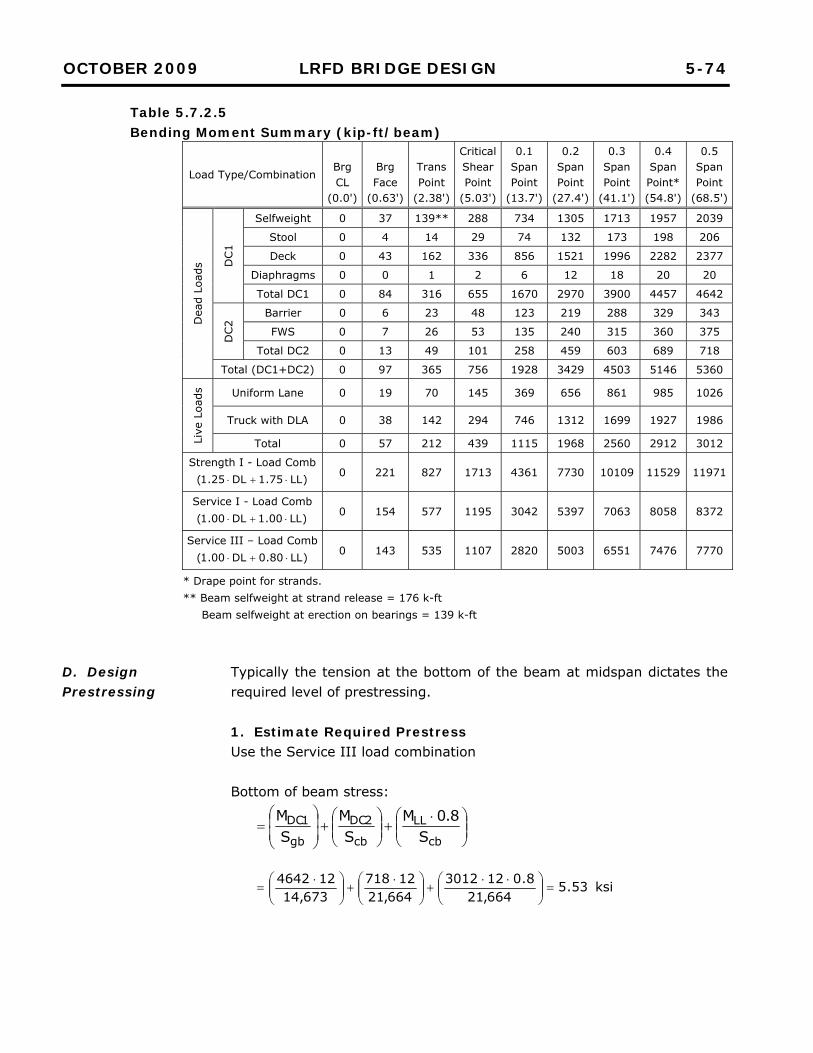
OCTOBER 2009 LRFD BRIDGE DESIGN 5-74
D. Design Prestressing
Table 5.7.2.5 Bending Moment Summary (kip-ft/beam)
Load Type/Combination Brg CL
(0.0')
Brg Face
(0.63')
Trans Point
(2.38')
Critical Shear Point
(5.03')
0.1 Span Point
(13.7')
0.2 Span Point
(27.4')
0.3 Span Point
(41.1')
0.4 Span Point* (54.8')
0.5 Span Point
(68.5') D
ead
Load
s DC1
Selfweight 0 37 139** 288 734 1305 1713 1957 2039
Stool 0 4 14 29 74 132 173 198 206
Deck 0 43 162 336 856 1521 1996 2282 2377
Diaphragms 0 0 1 2 6 12 18 20 20
Total DC1 0 84 316 655 1670 2970 3900 4457 4642
DC2
Barrier 0 6 23 48 123 219 288 329 343
FWS 0 7 26 53 135 240 315 360 375
Total DC2 0 13 49 101 258 459 603 689 718
Total (DC1+DC2) 0 97 365 756 1928 3429 4503 5146 5360
Live
Loa
ds
Uniform Lane 0 19 70 145 369 656 861 985 1026
Truck with DLA 0 38 142 294 746 1312 1699 1927 1986
Total 0 57 212 439 1115 1968 2560 2912 3012
Strength I - Load Comb )LL75.1DL25.1( 0 221 827 1713 4361 7730 10109 11529 11971
Service I - Load Comb )LL00.1DL00.1( 0 154 577 1195 3042 5397 7063 8058 8372
Service III – Load Comb )LL80.0DL00.1( 0 143 535 1107 2820 5003 6551 7476 7770
* Drape point for strands. ** Beam selfweight at strand release = 176 k-ft Beam selfweight at erection on bearings = 139 k-ft
Typically the tension at the bottom of the beam at midspan dictates the required level of prestressing. 1. Estimate Required Prestress Use the Service III load combination Bottom of beam stress:
cb
LL
cb
2DC
gb
1DCS
8.0MS
MSM
ksi53.5664,21
8.0123012664,21
12718673,14
124642
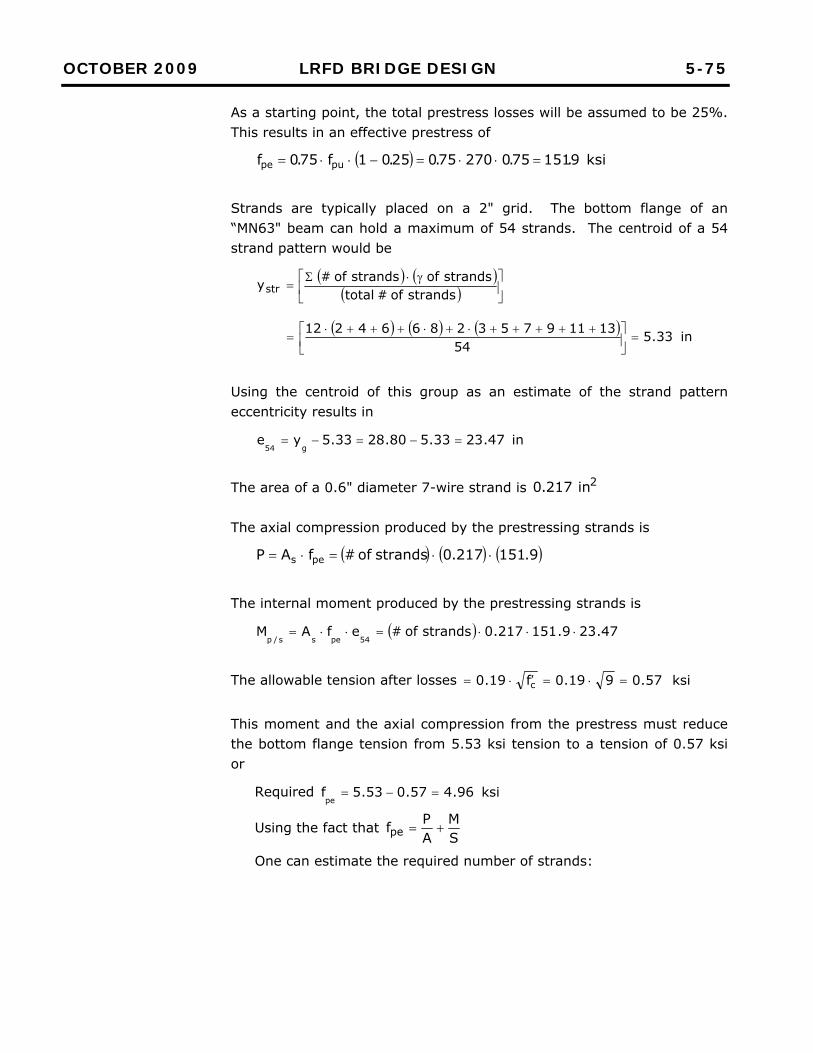
OCTOBER 2009 LRFD BRIDGE DESIGN 5-75
As a starting point, the total prestress losses will be assumed to be 25%. This results in an effective prestress of
ksi9.15175.027075.025.01f75.0f pupe
Strands are typically placed on a 2" grid. The bottom flange of an “MN63" beam can hold a maximum of 54 strands. The centroid of a 54 strand pattern would be
strands of # totalstrands of strands of #ystr
in33.554
1311975328664212
Using the centroid of this group as an estimate of the strand pattern eccentricity results in
in47.2333.580.2833.5yeg54
The area of a 0.6" diameter 7-wire strand is 2in217.0 The axial compression produced by the prestressing strands is
9.151217.0strands of #fAP pes
The internal moment produced by the prestressing strands is
47.239.151217.0strands of #efAM54pess/p
The allowable tension after losses ksi57.0919.0f19.0 c
This moment and the axial compression from the prestress must reduce the bottom flange tension from 5.53 ksi tension to a tension of 0.57 ksi or
Required ksi96.457.053.5fpe
Using the fact that SM
APfpe
One can estimate the required number of strands:
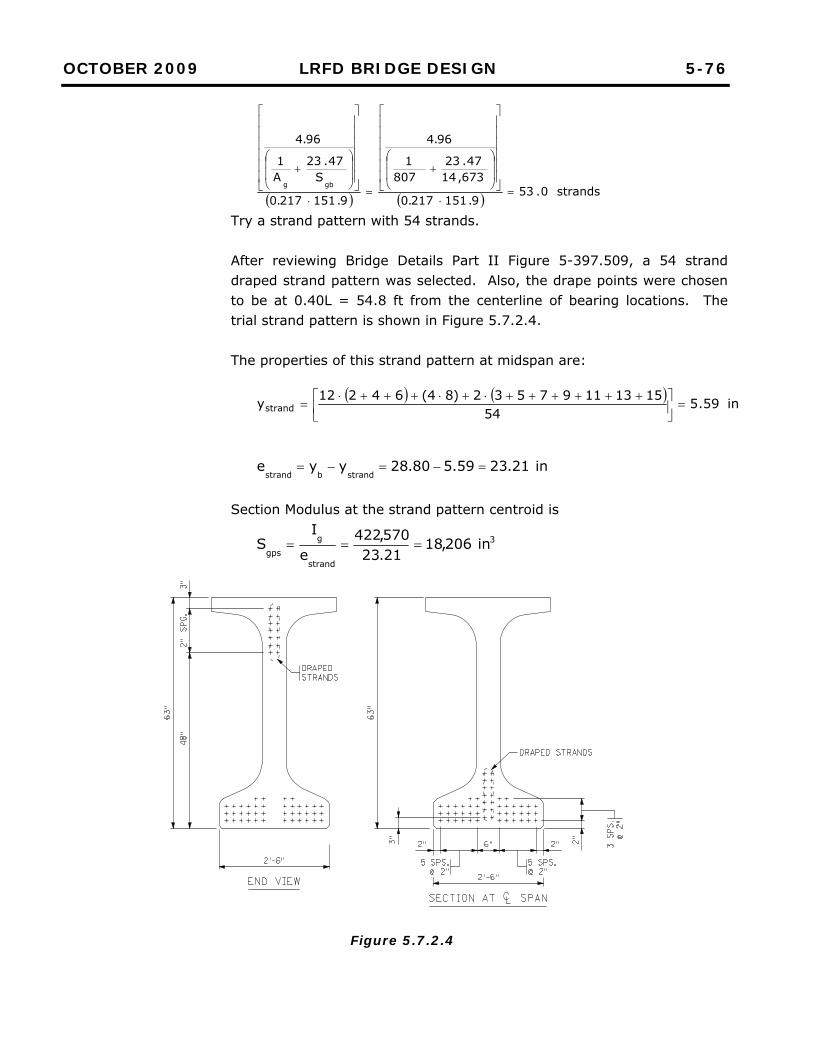
OCTOBER 2009 LRFD BRIDGE DESIGN 5-76
strands0.539.151217.0
673,1447.23
8071
96.4
9.151217.0
S47.23
A1
96.4
gbg
Try a strand pattern with 54 strands. After reviewing Bridge Details Part II Figure 5-397.509, a 54 strand draped strand pattern was selected. Also, the drape points were chosen to be at 0.40L = 54.8 ft from the centerline of bearing locations. The trial strand pattern is shown in Figure 5.7.2.4. The properties of this strand pattern at midspan are:
in59.554
15131197532)84(64212ystrand
in21.2359.580.28yyestrandbstrand
Section Modulus at the strand pattern centroid is
3
strand
g
gpsin206,18
21.23570,422
e
IS
Figure 5.7.2.4
OCTOBER 2009 LRFD BRIDGE DESIGN 5-77
[5.9.5]
[5.9.5.2.3]
[5.9.5.3]
[5.9.5.1]
2. Prestress Losses Prestress losses are computed using the approximate method. Elastic Shortening Loss Use the alternative equation presented in the LRFD C5.9.5.2.3a.
p
ciggg
2mgps
ggmg2
mgpbtpspES
EEIA
AeIA
AMeAeIfA∆f
2in72.11217.054astrand areds# of stranpsA
ksi50.202ff pjpbt
in21.23eestrandm
6
p
cigg in560,413,53500,28
4464570,422807E
EIA
62
g
2
mgpsin605,047,108072.23570,42272.11AeIA
ksi8.24560,413,53605,047,10
80712203921.23605,047,105.202fpES
Long Term Losses Use the approximate equation in the LRFD 5.9.5.3
pRsthsthg
pspi
pLTf0.12
A
Af0.10f
For an average humidity in Minnesota of 73% 97.07301.07.1H01.07.1
h
59.05.71
5'f1
5
cist
ksi1.264.259.097.00.1259.097.0
80772.115.2020.10f
pLT
Total Losses
ksi9.501.268.24fffpLTpESpt
ksi6.1519.505.202fffptpjpe
prestress loss percentage %1.2510050.2029.50100
f
f
pj
pt
OCTOBER 2009 LRFD BRIDGE DESIGN 5-78
[5.9.4.1]
initial prestress force
kips2083)8.245.202(72.11)f∆f(AP pESpjpsi
prestress force after all losses kips17776.15172.11fAP
pepse
3. Stresses at Transfer (compression +, tension -) Stress Limits for P/S Concrete at Release Compression in the concrete is limited to:
ksi50.45.760.0f60.0 ci
Tension in the concrete is limited to: The minimum of ksi26.05.70948.0f0948.0 ci
or ksi20.0 Tension limit = -0.20 ksi Check Release Stresses at Drape Point (0.40 Point of Span) The selfweight moment is calculated using the design length to simplify calculations. This is conservative for calculation of release stresses.
346,4821.232083ePstrandi
kip-in
Top stress due to P/S
356,12346,48
8072083
S
eP
AP
gt
strandi
g
i
ksi33.1
Bottom Stress due to P/S
673,14346,48
8072083
S
eP
AP
gb
strandi
g
i
ksi885.
Selfweight moment at drape point 1957M 40.0sw kip-ft
Top stress due to selfweight ksi90.1356,12
121957S
M
gt
40.0sw
Bottom stress due to selfweight ksi60.1673,14
121957S
M
gb
40.0sw
Top stress at drape point ksi20.0ksi57.090.133.1 OK
Bottom stress at drape point ksi50.4ksi28.460.188.5 OK
OCTOBER 2009 LRFD BRIDGE DESIGN 5-79
Check Release Stresses at End of Beam The strands need to be draped to raise the eccentricity of the prestress force and limit the potential for cracking the top of the beams. Stresses are checked at the transfer point (60 bar diameters from the end of the beam), using the total length of the beam for self weight moment calculations.
Centroid of strand pattern at the end of the beams:
544850525456586028464212y
strand
= 17.26 in
Centroid of strand at the transfer point:
in63.1659.526.17
215124.0137
6.06026.17ystrand
The eccentricity of the strand pattern is:
in17.1263.1680.28yyestrandbstrand
The internal prestress moment is:
350,2517.122083ePstrandi
kip-in
Top stress due to P/S
356,12350,25
8072083
S
eP
AP
gt
strandi
g
i
ksi53.0
Bottom stress due to P/S
673,14350,25
8072083
S
eP
AP
gb
strandi
g
i
ksi31.4
Top stress due to selfweight = ksi17.0356,12
12176S
M
gt
swtr
Bottom stress due to selfweight = ksi14.0673,14
12176S
M
gb
swtr
Top stress at transfer point ksi20.0ksi70.017.053.0 OK
OCTOBER 2009 LRFD BRIDGE DESIGN 5-80
[5.9.4.2]
Bottom stress at transfer point ksi50.4ksi17.414.031.4 OK
By back calculating the highest compressive stress at release, located at the drape point, it is found that the concrete compressive strength at release can be reduced:
ksi13.760.028.4'f
ci try ksi2.7'f
ci
When modifying the initial concrete strength, prestress losses must be recalculated. The new losses are summarized below.
ksi0.25f∆ pES p/s loss % at release = 12.3% ksi9.26f∆ pLT
ksi9.51fpt
p/s loss % after all losses = 25.6%
initial prestress force
kips2080)0.255.202(72.11)f∆f(AP pESpjpsi
prestress force after all losses
ksi6.1509.515.202fffptpjpe
kips17656.15072.11fAPpepse
The new bottom stress at the drape point = 4.27 < ksi32.4f60.0 ci OK 4. Stresses at Service Loads (compression +, tension -) Stress Limits for P/S Concrete after All Losses Compression in the concrete is limited to (Service I Load Combination):
ksi05.40.945.0f45.0 c (for prestress and permanent loads) Check the bottom stress at end of beam and the top stress at midspan against this limit.
ksi60.30.940.0f40.0 c (for live load and 1/2 of prestress and permanent loads) Check the top stress at midspan against this limit.
ksi40.50.90.160.0fQ60.0cw
(for live load, prestress, permanent loads, and transient loads) Check the top stress at midspan against this limit.
OCTOBER 2009 LRFD BRIDGE DESIGN 5-81
Tension in the concrete is limited to (Service III Load Combination): ksi570.00.919.0f19.0
c
Check the bottom stress at midspan against this limit.
Check Stresses at Midspan After Losses: Bottom stress
gb
strande
g
e
cb
LL
cb
2DC
gb
1DC
SeP
AP
S8.0M
SM
SM
673,1421.231765
8071765
664,218.0123012
664,2112718
673,14124642
ksi570.0ksi550.0 OK
Top stress due to all loads
gtc
LL2DC
gt
1DC
gt
strande
g
eS
MMS
MSeP
AP
753,67123012718
356,12124642
356,1221.231765
8071765
ksi40.5ksi04.4 OK
Top stress due to permanent loads
gtc
2DC
gt
1DC
gt
strande
g
eSM
SM
SeP
AP
753,6712718
356,12124642
356,1221.231765
8071765
ksi05.4ksi51.3 OK
Top stress due to live load plus ½ of prestress and permanent loads
gtc
LL
gtc
2DC
gt
1DC
gt
strande
g
eSM
SM
SM
SeP
AP
21
753,67
123012753,67
718356,12
124642356,12
21.2317658071765
21
ksi60.3ksi23.2 OK
Check the Compression Stresses at End of Beam After Losses
OCTOBER 2009 LRFD BRIDGE DESIGN 5-82
[5.5.4]
[5.7.3.1.1]
Bottom flange stress due to prestress and permanent loads. For simplicity, all loads are ignored for this calculation, which is conservative.
ksi05.4ksi65.3673,14
17.1217658071765
S
eP
A
P
gb
strande
g
e
OK
The final concrete stress may also be reduced by back calculating the bottom tensile stress under the Service III load condition. In this instance:
Min ksi38.819.0550.0'f
2
c
Try ksi50.8'fc
This change will not effect the computed losses, but the actual and allowable stresses must be recomputed and compared. At midspan: Bottom stress due to all loads = -0.545 ksi < -0.554 ksi OK (Service III) Top stress due to all loads = 4.02 ksi < 5.10 ksi OK Top stress due to permanent loads = 3.51 ksi < 3.83 ksi OK Top stress due to live load plus ½ (prestress + permanent loads) = 2.27 ksi < 3.40 ksi OK Therefore, use f’ci = 7.2 ksi and f’c = 8.5 ksi 5. Flexure – Strength Limit State Resistance factors at the strength limit state are:
00.1 for flexure and tension (assumed) 90.0 for shear and torsion 00.1 for tension in steel in anchorage zones
Strength I design moment is 11,971 kip-ft at midspan. From previous calculations, distance to strand centroid from bottom of the beam is:
in59.5ystrand
280.027024304.12
ff
04.12kpu
py
strandp ydeckstoolheight beam d
in41.6759.55.85.163
JULY 2014 LRFD BRIDGE DESIGN 5-83
[5.7.3.1.1-4]
[5.5.4.2.1]
[5.7.3.3.2]
p
pups1c
pups
df
Akbf85.0
fAc
in73.9
41.6727072.1128.010885.00.485.0
27072.11
ksi1.25941.6773.928.01270
dck1ffp
pups
in27.873.985.0cβa 1
Compression block depth is less than 8.5”, the thickness of the slab, so T-section behavior is not considered.
Internal lever arm between compression and tension flexural force components:
in28.63227.841.67
2ad
p
159,19228.631.25972.1128.63fAMpspsn
kip-in
013,16 kip-ft
013,16013,160.1Mn
kip-ft 971,11Mu kip-ft OK
Validate the assumption of 1.0 for the resistance factor:
107.2173.941.6725.0583.01
c
d25.0583.0 t
Therefore 0.1 , which matches the assumption
6. Minimum Reinforcement
ksi08.15.837.0f37.0fcr
gb
strande
g
epeb S
ePAP
f
ksi98.4673,14
21.2317658071765
1
SS
MSffMgb
cgb1DCcgbpebrcr
743,1041673,14664,21124642664,2198.408.1
kip-in
OCTOBER 2009 LRFD BRIDGE DESIGN 5-84
E. Design Reinforcement for Shear [5.8]
8729 kip-ft
013,16475,1087292.1M2.1cr
kip-ft provided OK
1. Vertical Shear Design Determine vd and Critical Section for Shear Begin by determining the effective shear depth vd at the critical section for shear.
2add pv
The effective shear depth is no less than:
in6.525.85.16372.0h72.0dv
Assume dv = 52.6 inches at critical section location of dv from face of support. The internal face is assumed to be at the inside edge of the 15 inch sole plate. Then the critical section will be at least 67.6 inches 15652 . or 5.63 feet away from the end of the beam. Find the centroid of the prestressing strands at this location:
The centroid of the prestressing strands is at:
drapeend
soleplateendd@str
yy
2
Lspan40.0
63.5yyv
in1.1659.526.17
1221513740.0
63.526.17
With this approximation to the strand centroid, pd can be computed:
in9.561.165.85.163yhdvd@strp
From the flexural strength computations, a = 8.27 inches at midspan. The value of “a” varies slightly along the beam length, but the value at midspan is close enough for design purposes.
OCTOBER 2009 LRFD BRIDGE DESIGN 5-85
[5.8.3.2]
in8.52227.89.56
2add
pv
But the effective shear depth vd need not be less than
in6.52h72.0dv
or
pev d9.0d9.0d in2.519.569.0 Therefore take ,inches8.52d
v which is sufficiently close to the original
assumption of in6.52dv
Then ft03.5in3.608.525.7d5.7x
vcritv from centerline of
bearing Check Maximum Factored Shear Limit From Table 5.7.2.4 the Strength I design shear at 5.03 ft is
kips376Vu
The amount of force carried by the draped strands at their effective prestress level is:
kips5.4576.150217.014P d14
The inclination of the draped strands is:
reesdeg87.343.55
12/954arctanφ
The vertical prestress component is:
kips9.3087.3sin5.457φsinPV d14p
The superstructure is supported by a parapet type abutment. Therefore, the nominal shear capacity of the section is limited to:
kips5569.305.68.525.818.0Vbdf18.0Vpvvcn
The maximum design shear the section can have is:
kips376kips50055690.0Vnv
OK
Determine Longitudinal Strain x Assume that minimum transverse reinforcement will be provided in the cross section.
OCTOBER 2009 LRFD BRIDGE DESIGN 5-86
[5.8.3.4.2]
First, determine psA . Note that psA computed here is different than the
psA computed earlier. This psA includes only the area of prestressing steel found on the flexural tension side of the member. Near the end of the beam, psA must also be reduced for development. Development length d is:
bpepsd df32fK
in4.1526.06.150321.2596.1
Transfer length tr is:
in0.366.060d60 btr
At the critical section in8.672/153.60x
critve from the beam end,
the strand development fraction is:
pu
pe
trd
trcritv
pu
pedev f
f1d
ff
F
68.0270
6.15010.364.1520.368.67
2706.150
The flexural tension side of the member is defined as:
in5.31263
2hcomp
At critve
x none of the draped strands fall on the flexural tension side.Therefore, devps Farea strandstr. straight #A
2in90.568.0217.040
Use equation 5.8.3.4.2-4 to compute the strain:
pspss
popspuuv
u
s AEAE
fAVVN5.0dM
ε
OCTOBER 2009 LRFD BRIDGE DESIGN 5-87
0020
90550028
270700905930376852121713
..,
....
Because the value is negative, the strain will be recalculated using an additional concrete term: From Figure 5.4.6.1 of this manual, 2
c in486A For ksi5.8'f
c , ksi468810005.81265E
c
pspsscc
popspuuv
u
s AEAEAE
fAVVN5.0dM
00016.0
486468890.5500,28
27070.090.59.303768.52121713
Computed strain limits: -0.0004 < -0.00016 < 0.006 OK Compute the tensile stress factor β using equation 5.8.3.4.2-1
45.500016.07501
8.47501
8.4
s
Compute the angle θ using equation 5.8.3.4.2-3 44.2800016.0350029350029
s degrees
Compute the concrete contribution:
kips3.1728.525.65.845.50316.0dbf0316.0Vvvcc
The required steel contribution is:
kips6.2149.303.17290.0
376VVV
VVVVpc
v
upcns
JULY 2014 LRFD BRIDGE DESIGN 5-88
[5.8.4]
[5.8.2.5]
[5.8.2.7]
Find the required spacing of double leg #4 stirrups:
in90.106.214
44.28cot8.526020.02V
θcotdfAs
s
vyv
Try double leg stirrups at a 10 inch spacing at the end of the beam.
ft/in48.010
124.0A 2v
kips0.234Vs
Check that the minimum transverse reinforcement requirement is satisfied:
y
vc
minv
fb
'f0316.0s
A
ftin48.0
ftin12.012
605.65.80316.0
22 OK
Check maximum stirrup spacing: vvcspac db'f125.0V
kips376kips7.3648.525.65.8125.0
Then the maximum spacing is the smaller of:
in1.218.524.0d4.0svmax
or in12smax
GOVERNS
in10in12smax
OK
Therefore use double leg #13 stirrups at 10 inch spacing. Other sections are investigated similarly.
2. Interface Shear Transfer Top flange width in34bv The Strength I vertical shear at the critical shear section due to all loads is:
376Vu
Interface shear force is:
5.85ftin12
8.52376
d
V
d
VV
v
u
e
uh
kip/ft
OCTOBER 2009 LRFD BRIDGE DESIGN 5-89
[ 5.8.4.4]
[5.8.4.3]
Required nominal interface design shear is:
0.9590.05.85
φVV
v
hnreq kip/ft
The interface area per 1 foot length of beam is:
2cv in0.4081234A /ft
A note on Bridge Details II Fig. 5-397.509 requires the top flanges of the beam to be roughened. Then: c= 0.28 ksi μ= 1.0 K1= 0.3 K2= 1.8 ksi The upper limits on nominal interface shear are:
kip/ft0.95kip/ft6.4890.40843.0AfK cvc1 OK
and
kip/ft0.95kip/ft4.7340.4088.1AK cv2 OK
The nominal interface shear resistance is:
cyvfcvn
PfAAcV
kip0.0Pc
Substitute and solve for required interface shear steel:
32.0600.1
0.40828.00.95fμ
AcVA
y
cvnreqvf
in2/ft
Calculated value is negative, so vfA is taken as zero Check minimum interface shear requirements:
2
y
vminvf in028.0
603405.0
fb05.0A
/in 2in34.0 /ft
The minimum requirement may be waived for girder-slab interfaces with the surface roughened to an amplitude of 0.25 in if the factored interface shear stress is less than 0.210 ksi.
ksi210.0ksi209.08.5234
0.376db
Vvvv
uiui
No additional reinforcement is required for interface shear. Other sections are investigated similarly.
OCTOBER 2009 LRFD BRIDGE DESIGN 5-90
[5.8.3.5] 3. Minimum Longitudinal Reinforcement Requirement The longitudinal reinforcement must be checked to ensure it is adequate to carry the tension caused by shear. The amount of strand development must be considered near the end of the beam. There are 2 cases to be checked: Case 1: From the inside edge of bearing at the end supports out to a distance dv, the following must be satisfied:
θcotVV5.0φVfA ps
v
upsps
A crack starting at the inside edge of the bearing sole plate will cross the center of gravity of the straight strands at:
in1.2344.28cot40.415θcotyLx strsoleplatecrack
The transfer length for 0.6" strands is: in0.36
tr
Interpolate to find the tensile capacity of the straight strands at the crack:
kips8.83836
1.23217.0406.150x
AfTtr
crackpsper
The force to carry is:
cotVV5.0VT ps
v
u
44.28cot9.300.2345.090.0
376
kips8.838kips3.498 OK
Case 2: At dv, the following must be satisfied:
θcotVV5.0φV
dφMfA ps
u
v
upsps
Based on the fraction of strands developed as calculated earlier:
2ps in90.568.0217.040A
Following steps shown earlier, fps at dv from the inside edge of bearing is:
ksi1.257fps
Then kips9.15161.25790.5fATpspsr
JULY 2014 LRFD BRIDGE DESIGN 5-91
F. Design Pretensioned Anchorage Zone Reinforcement [5.10.10.1]
3.4988.520.1
121713cotVV5.0V
d
MT
psv
u
v
u
kips9.1516kips6.887T OK Splitting Reinforcement To prevent cracking in the beam end due to the transfer of the prestressing force from the strands to the concrete, splitting steel needs to be provided in the anchorage zone. Use a load factor of 1.0 and lateral force component of 4% to determine the required amount of steel. The factored design bursting force is:
kips2.83208004.00.1P04.00.1P ib
The amount of resisting reinforcement is determined using a steel stress
sf of 20 ksi:
2
s
bs in16.4
202.83
fPA
This steel should be located at the end of the beam within a distance of:
in75.15463
4h
The number of #5 double legged stirrups necessary to provide this area is:
7.631.02
16.4A2
Ab
s
The first set of stirrups is located 2 inches from the end of the beam. Provide seven sets of #5 stirrups spaced at 2 1/2 inch centers.
in75.15in175.262xsplitting
Although the splitting reinforcement does not fit within h/4, #5 bars are the largest allowed and 2.5 inches is the tightest spacing allowed. This is OK per MnDOT practice.
JULY 2014 LRFD BRIDGE DESIGN 5-92
[5.10.10.2]
G. Determine Camber and Deflection [2.5.2.6.2] [3.6.1.3.2] [5.7.3.6.2]
Confinement Reinforcement Reinforcement is required at the ends of the beam to confine the prestressing steel in the bottom flange. G403E and G507E bars (see Figure 5.7.2.5) will be placed at a maximum spacing of 6 inches out to 1.5d from the ends of the beam. For simplicity in detailing and ease of tying the reinforcement, space the vertical shear reinforcement with the confinement reinforcement in this area.
in5.94635.1d5.1
Camber Due to Prestressing and Dead Load Deflection Using the PCI handbook (Figure 4.10.13 of the 3rd Edition), the camber due to prestress can be found. The centroid of the prestressing has an eccentricity mide of 23.21 inches at midspan. At the end of the beams the eccentricity ee is 12.17 inches. E is the initial concrete modulus (4394 ksi), oP equals the prestress force just after transfer (2080 kips). The drape points are at 0.4 of the span. The span length is 137.0 feet. Using the equation for the two point depressed strand pattern:
in04.1117.1221.23eee emid
6a
8L
EIeP
EI8LeP 22
o2
eops
6121374.0
812137
570,422439404.112080
570,422439481213717.122080 222
in89.7
Downward deflection due to selfweight
in71.3
570,4224394384
1213712869.05
IE384Lw5∆
44
sw
Camber at release in18.471.389.7∆∆∆ swpsrel To estimate camber at the time of erection the deflection components are multiplied by standard MnDOT multipliers. They are:
Release to Erection Multipliers: Prestress = 1.4 Selfweight = 1.4
Camber and selfweight deflection values at erection are:
Prestress: in11.057.891.4
JULY 2014 LRFD BRIDGE DESIGN 5-93
Selfweight: in19.571.34.1 Diaphragm DL: in04.0 Deck and stool DL: in41.4 Parapet: in24.0
The values to be placed in the camber diagram on the beam plan sheet are arrived at by combining the values above. “Erection Camber” = in82.504.019.505.11 say 5 7/8 in “Est. Dead Load Deflection” in65.424.041.4 say 4 5/8 in “Est. Residual Camber” = 5 7/8 – 4 5/8 = 1 1/4 in Live Load Deflection The deflection of the bridge is checked when subjected to live load and compared against the limiting values of L/800 for vehicle only bridges and L/1000 for bridges with bicycle or pedestrian traffic. Deflection due to lane load is:
in05.1
168,034,14688384
121371264.05
IE384Lw5∆
44
lane
Deflection due to a truck with dynamic load allowance is found using hand computations or computer tools to be:
in74.1∆ truck
Two deflections are computed and compared to the limiting values; that of the truck alone and that of the lane load plus 25% of the truck. Both deflections need to be adjusted with the distribution factor for deflection.
in99.074.1567.0∆DF∆ truck∆1
in84.074.125.005.1567.0∆25.0∆DF∆ trucklane∆2
There is no bicycle or pedestrian traffic on the bridge, so the deflection limit is:
21 ∆or∆thanin1.2800
12137800L
OK
JULY 2014 LRFD BRIDGE DESIGN 5-94
H. Detailing Items Approximate weight of each beam is:
tons0.6021155.0
14480725.138AL
Initial prestress force at jacking is:
kips237327075.0217.054
Figure 5.7.2.5 shows the detailed beam sheet for the bridge.
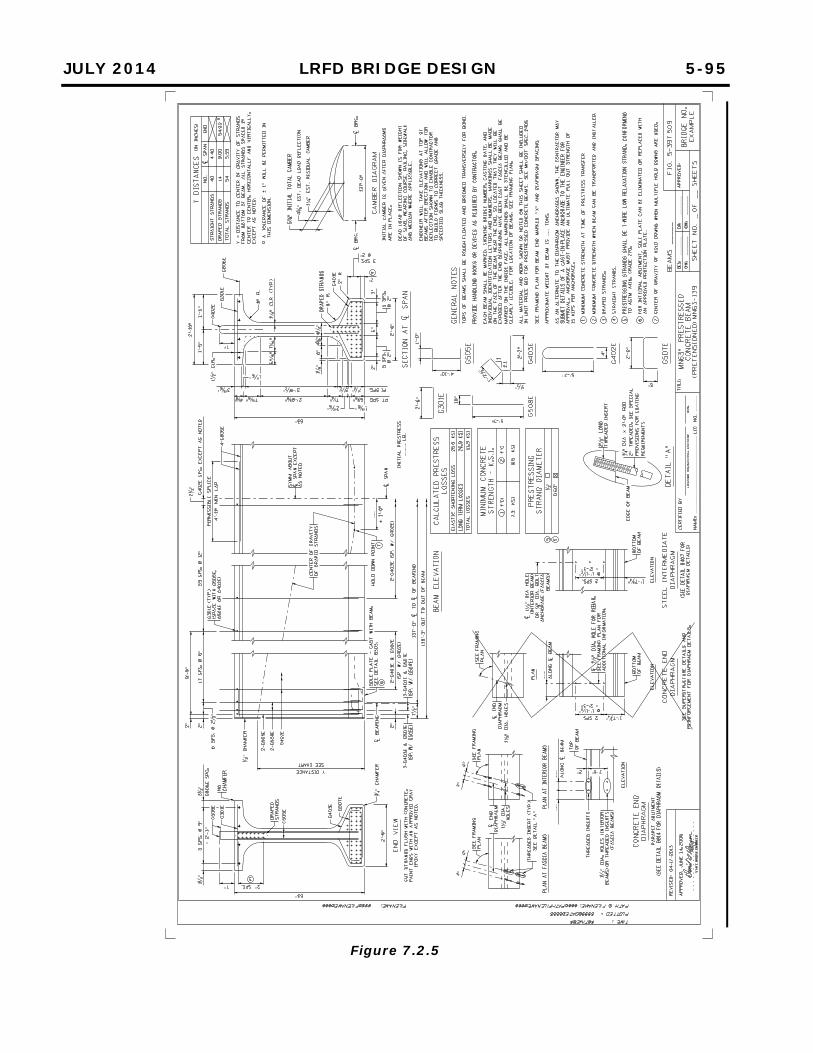
JULY 2014 LRFD BRIDGE DESIGN 5-95
Figure 7.2.5

OCTOBER 2009 LRFD BRIDGE DESIGN 5-96
[ This Page Intentionally Left Blank ]
OCTOBER 2009 LRFD BRIDGE DESIGN 5-97
5.7.3 Three-Span Haunched Post-Tensioned Concrete Slab Design Example
A. Material and Design Parameters [5.4.2.4] [Table 5.4.4.1-1] [5.4.4.2] [5.4.3.2]
This example illustrates the design of a haunched post-tensioned concrete slab bridge. The three continuous spans are 55'-0", 70'-0", and 55'-0" in length. The roadway width is 44'-0" with MnDOT Type F barrier railings for a total out-to-out width of 47'-4". A plan view and typical sections of the bridge are shown in Figures 5.7.3.1 and 5.7.3.2. After computing the dead and live loads, a preliminary tendon profile is developed. Prestress losses for the preliminary layout are computed for anchor set, friction, elastic shortening, creep, shrinkage, and relaxation. Subsequently, the load combinations are assembled (with the secondary post-tensioning force effects included). Flexural and shear strength checks are performed, after which deflection and camber calculations are assembled. Lastly, the design of the anchorage zone is performed. Single ended jacking is assumed for the design. The construction documents will require that the jacked end and the dead ends alternate. With the tendons stressed at alternating ends, the results for the friction losses and anchor set losses for tendons stressed at opposite ends will be averaged to obtain losses for a “typical” tendon. The following material and design parameters are used in this example: Table 5.7.3.1 Design Parameters
Material Parameter Value
Con
cret
e
Compressive Strength at Transfer, cif 4.5 ksi
Compressive Strength at 28 days, cf 5.0 ksi
Modulus of Elasticity at Transfer, ciE 3865 ksi
Modulus of Elasticity at 28 days, cE 4074 ksi
Ste
el R
einf
orce
men
t
Pres
tres
sing
7-wire Strand 0.60 in dia., low-lax
Area of one Strand 0.217 in2
Tensile Strength, puf 270.0 ksi
Yield Strength, pyf 243.0 ksi
Modulus of Elasticity, pE 28,500 ksi
Reb
ar
Yield Strength, yF 60 ksi
Modulus of Elasticity, sE 29,000 ksi
Additional Dead Loads Future Wearing Surface ksf020.0 Type F Barriers, 439.0w kip/ft/barrier
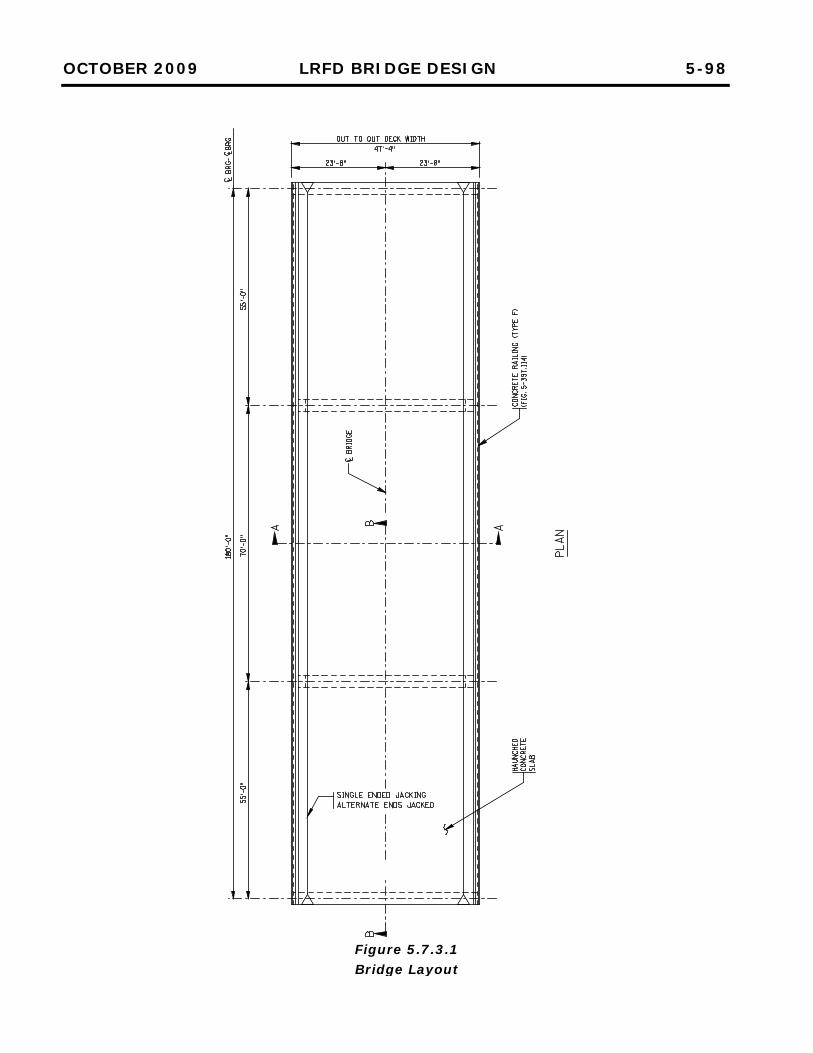
OCTOBER 2009 LRFD BRIDGE DESIGN 5-98
Figure 5.7.3.1 Bridge Layout
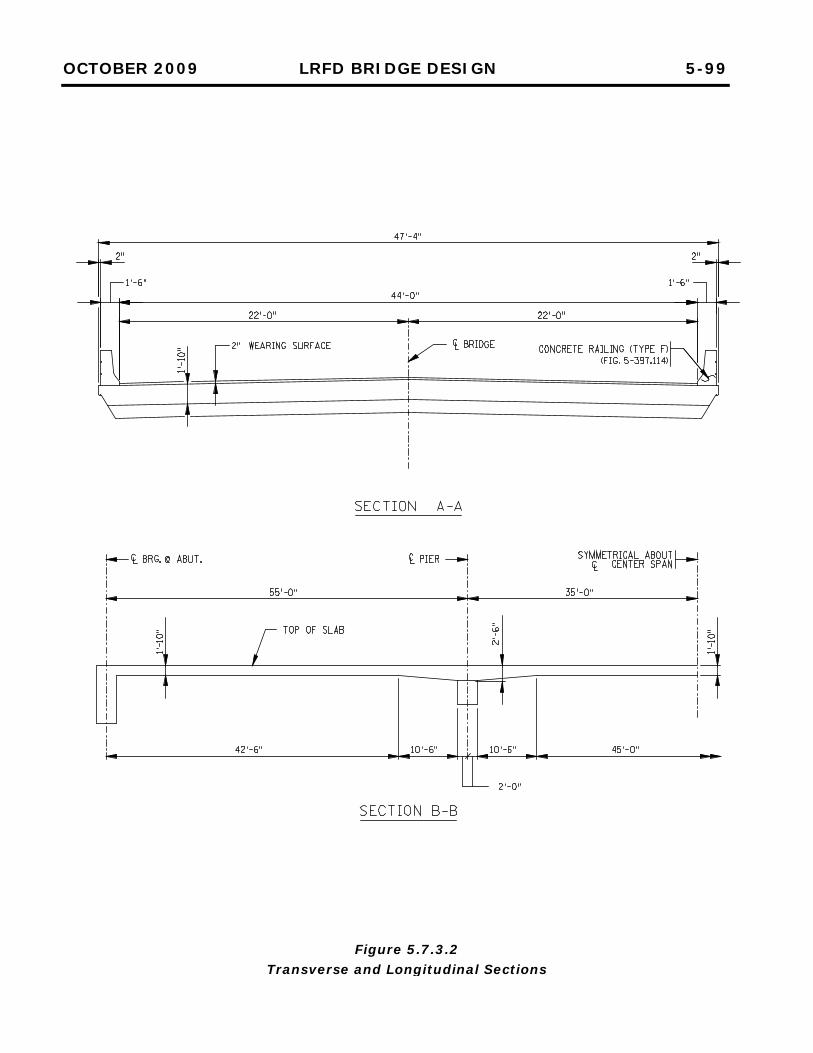
OCTOBER 2009 LRFD BRIDGE DESIGN 5-99
Figure 5.7.3.2 Transverse and Longitudinal Sections
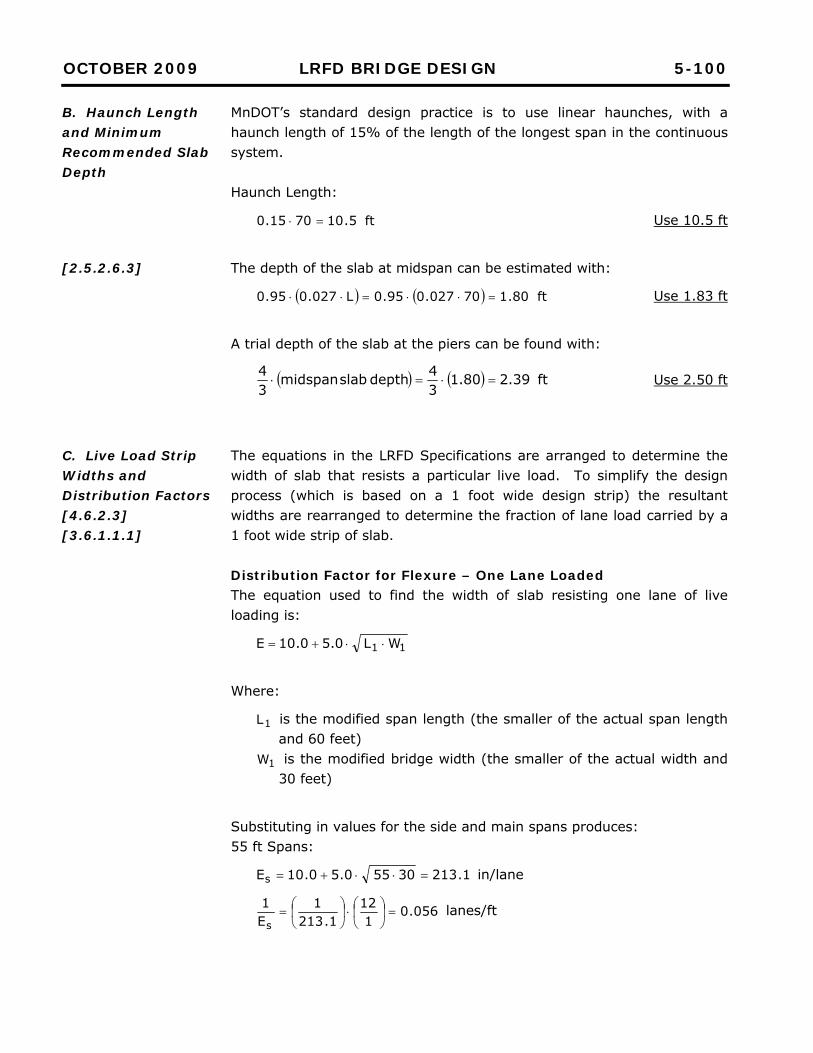
OCTOBER 2009 LRFD BRIDGE DESIGN 5-100
B. Haunch Length and Minimum Recommended Slab Depth
[2.5.2.6.3]
C. Live Load Strip Widths and Distribution Factors [4.6.2.3] [3.6.1.1.1]
MnDOT’s standard design practice is to use linear haunches, with a haunch length of 15% of the length of the longest span in the continuous system. Haunch Length:
ft5.107015.0 Use 10.5 ft
The depth of the slab at midspan can be estimated with:
ft80.170027.095.0L027.095.0 Use 1.83 ft
A trial depth of the slab at the piers can be found with:
ft39.280.134depth slab midspan
34
Use 2.50 ft
The equations in the LRFD Specifications are arranged to determine the width of slab that resists a particular live load. To simplify the design process (which is based on a 1 foot wide design strip) the resultant widths are rearranged to determine the fraction of lane load carried by a 1 foot wide strip of slab. Distribution Factor for Flexure – One Lane Loaded The equation used to find the width of slab resisting one lane of live loading is:
11 WL0.50.10E
Where:
1L is the modified span length (the smaller of the actual span length and 60 feet)
1W is the modified bridge width (the smaller of the actual width and 30 feet)
Substituting in values for the side and main spans produces: 55 ft Spans:
1.21330550.50.10Es in/lane
056.01
121.213
1E1s
lanes/ft
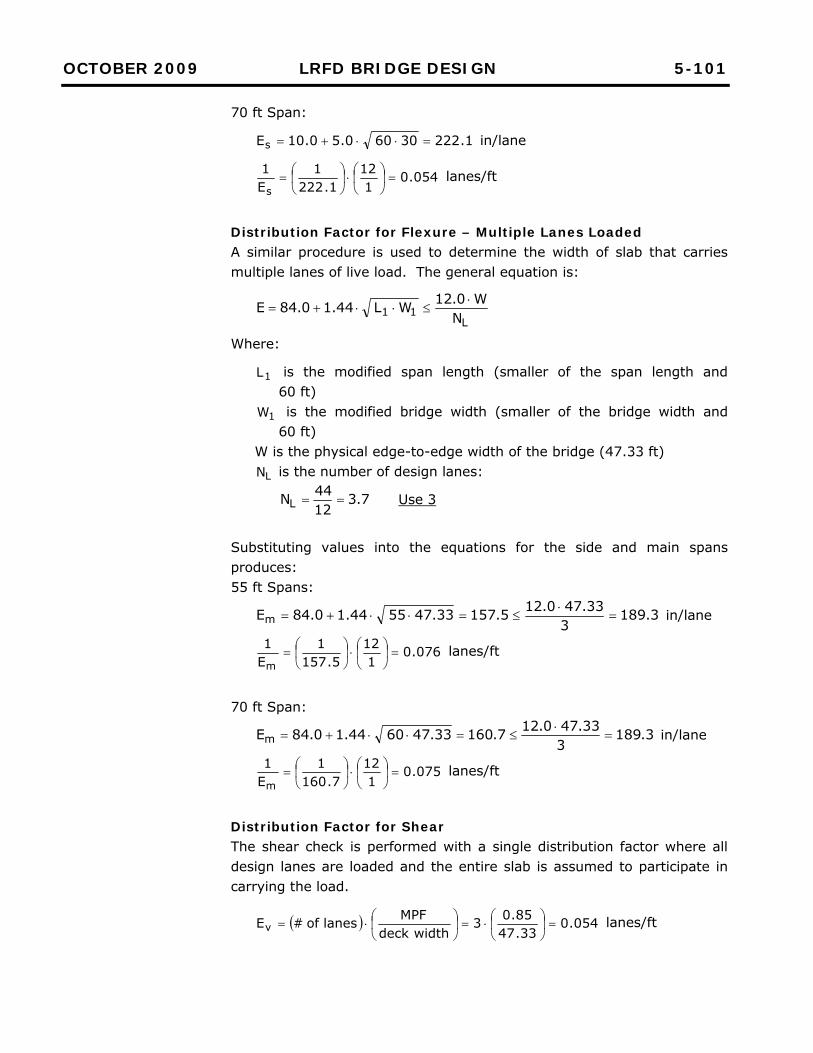
OCTOBER 2009 LRFD BRIDGE DESIGN 5-101
70 ft Span:
1.22230600.50.10Es in/lane
054.01
121.222
1E1s
lanes/ft
Distribution Factor for Flexure – Multiple Lanes Loaded A similar procedure is used to determine the width of slab that carries multiple lanes of live load. The general equation is:
L11 N
W0.12WL44.10.84E
Where:
1L is the modified span length (smaller of the span length and 60 ft)
1W is the modified bridge width (smaller of the bridge width and 60 ft)
W is the physical edge-to-edge width of the bridge (47.33 ft)
LN is the number of design lanes:
7.31244NL Use 3
Substituting values into the equations for the side and main spans produces: 55 ft Spans:
3.1893
33.470.125.15733.475544.10.84Em
in/lane
076.01
125.157
1E1m
lanes/ft
70 ft Span:
3.1893
33.470.127.16033.476044.10.84Em
in/lane
075.01
127.160
1E1m
lanes/ft
Distribution Factor for Shear The shear check is performed with a single distribution factor where all design lanes are loaded and the entire slab is assumed to participate in carrying the load.
054.033.4785.03
widthdeck MPFlanes of #Ev
lanes/ft
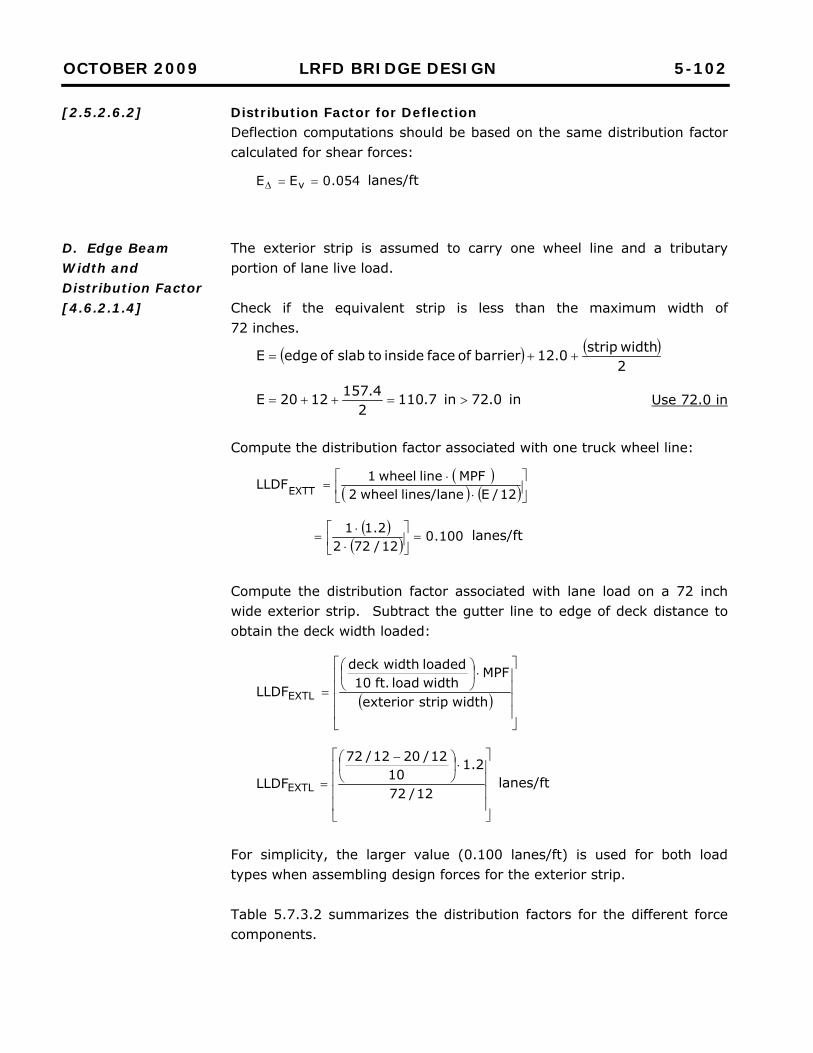
OCTOBER 2009 LRFD BRIDGE DESIGN 5-102
[2.5.2.6.2]
D. Edge Beam Width and Distribution Factor [4.6.2.1.4]
Distribution Factor for Deflection Deflection computations should be based on the same distribution factor calculated for shear forces:
054.0EE v lanes/ft
The exterior strip is assumed to carry one wheel line and a tributary portion of lane live load. Check if the equivalent strip is less than the maximum width of 72 inches.
2width strip0.12barrier of face inside to slab of edgeE
in0.72in7.1102
4.1571220E Use 72.0 in
Compute the distribution factor associated with one truck wheel line:
12/Elines/lane wheel 2MPFline wheel 1LLDFEXTT
100.0
12/7222.11
lanes/ft
Compute the distribution factor associated with lane load on a 72 inch wide exterior strip. Subtract the gutter line to edge of deck distance to obtain the deck width loaded:
width stripexterior
MPFwidth load ft. 10loaded widthdeck
LLDFEXTL
12/72
2.110
12/2012/72
LLDFEXTL lanes/ft
For simplicity, the larger value (0.100 lanes/ft) is used for both load types when assembling design forces for the exterior strip. Table 5.7.3.2 summarizes the distribution factors for the different force components.
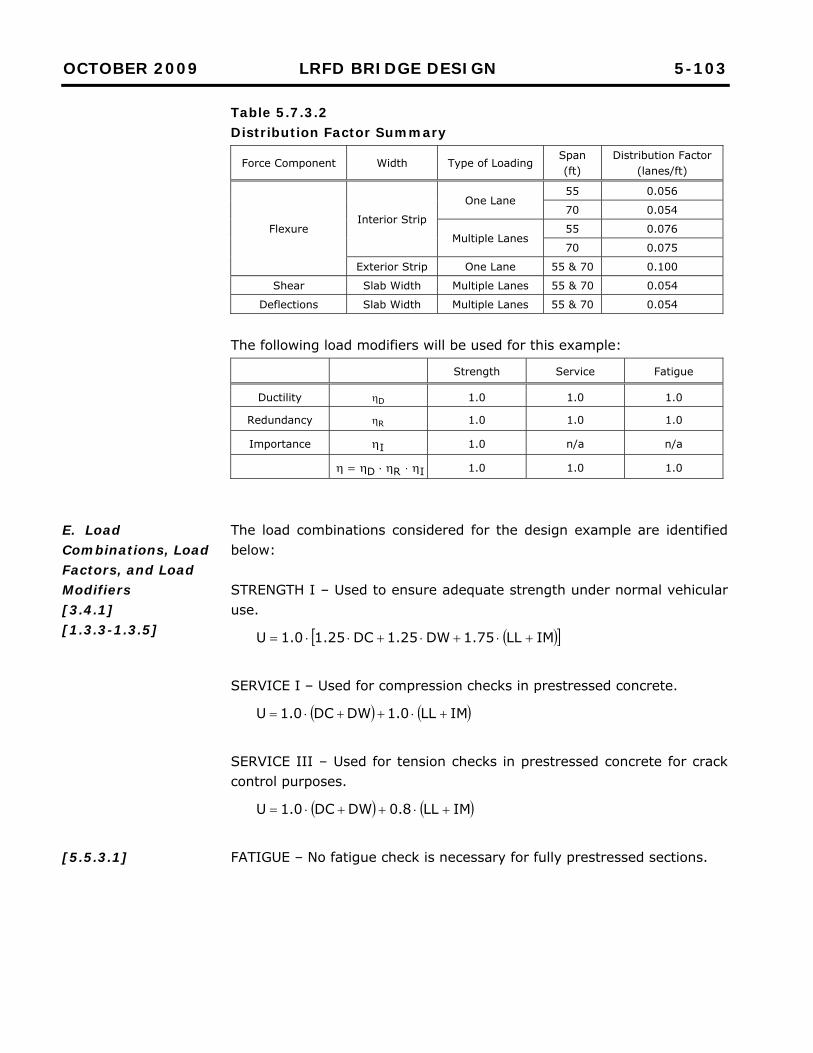
OCTOBER 2009 LRFD BRIDGE DESIGN 5-103
E. Load Combinations, Load Factors, and Load Modifiers [3.4.1] [1.3.3-1.3.5]
[5.5.3.1]
Table 5.7.3.2 Distribution Factor Summary
Force Component Width Type of Loading Span (ft)
Distribution Factor (lanes/ft)
Flexure Interior Strip
One Lane 55 0.056
70 0.054
Multiple Lanes 55 0.076
70 0.075
Exterior Strip One Lane 55 & 70 0.100
Shear Slab Width Multiple Lanes 55 & 70 0.054
Deflections Slab Width Multiple Lanes 55 & 70 0.054
The following load modifiers will be used for this example:
Strength Service Fatigue
Ductility D 1.0 1.0 1.0
Redundancy R 1.0 1.0 1.0
Importance I 1.0 n/a n/a
IRD 1.0 1.0 1.0
The load combinations considered for the design example are identified below: STRENGTH I – Used to ensure adequate strength under normal vehicular use.
IMLL75.1DW25.1DC25.10.1U
SERVICE I – Used for compression checks in prestressed concrete.
IMLL0.1DWDC0.1U
SERVICE III – Used for tension checks in prestressed concrete for crack control purposes.
IMLL8.0DWDC0.1U
FATIGUE – No fatigue check is necessary for fully prestressed sections.
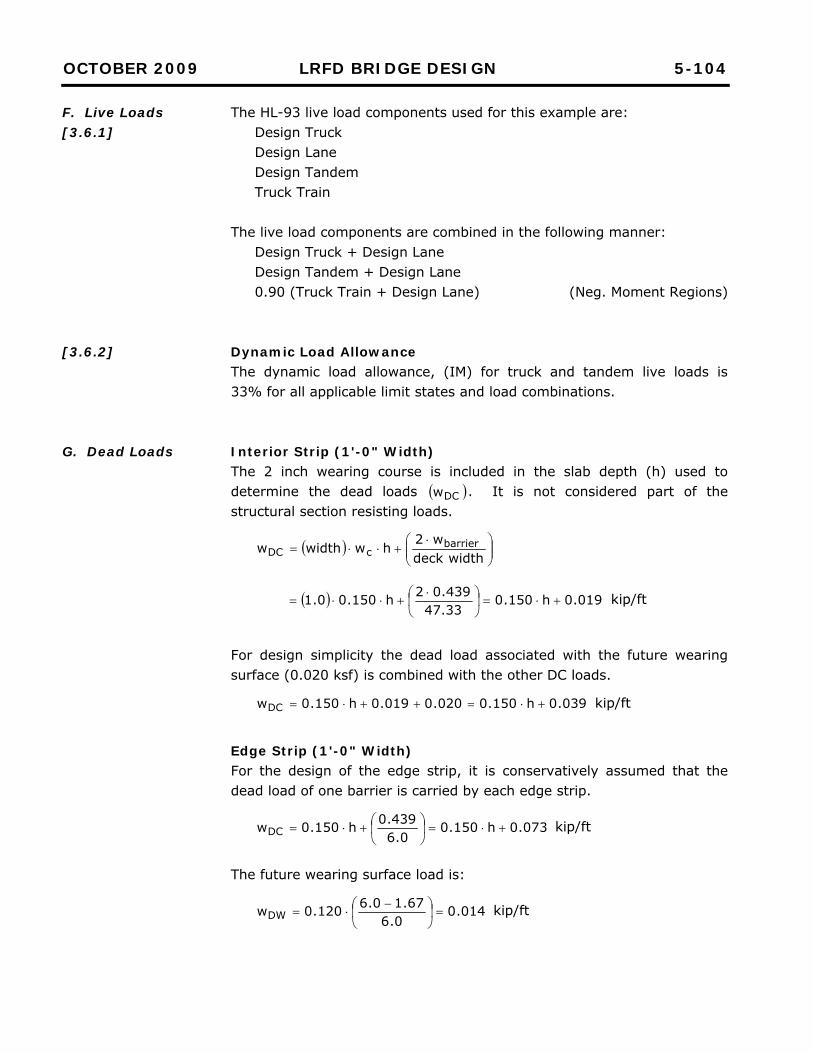
OCTOBER 2009 LRFD BRIDGE DESIGN 5-104
F. Live Loads [3.6.1]
[3.6.2]
G. Dead Loads
The HL-93 live load components used for this example are: Design Truck Design Lane Design Tandem Truck Train
The live load components are combined in the following manner:
Design Truck + Design Lane Design Tandem + Design Lane 0.90 (Truck Train + Design Lane) (Neg. Moment Regions)
Dynamic Load Allowance The dynamic load allowance, (IM) for truck and tandem live loads is 33% for all applicable limit states and load combinations. Interior Strip (1'-0" Width) The 2 inch wearing course is included in the slab depth (h) used to determine the dead loads DCw . It is not considered part of the structural section resisting loads.
widthdeck w2
hwwidthw barriercDC
019.0h150.047.33
439.02h150.00.1
kip/ft
For design simplicity the dead load associated with the future wearing surface (0.020 ksf) is combined with the other DC loads.
039.0h150.0020.0019.0h150.0wDC kip/ft
Edge Strip (1'-0" Width) For the design of the edge strip, it is conservatively assumed that the dead load of one barrier is carried by each edge strip.
073.0h150.00.6
439.0h150.0wDC
kip/ft
The future wearing surface load is:
014.00.6
67.10.6120.0wDW
kip/ft
OCTOBER 2009 LRFD BRIDGE DESIGN 5-105
H. Structural Analysis Model and Resultant Loads
The combined dead load is:
087.0h150.0w073.0h150.0w DWDC kip/ft
The dead and live loads were applied to a continuous beam model with gross section properties. Nonprismatic properties were used to account for the presence of the linear haunches near the piers. The results of the analysis are presented in Tables 5.7.3.3 and 5.7.3.4.
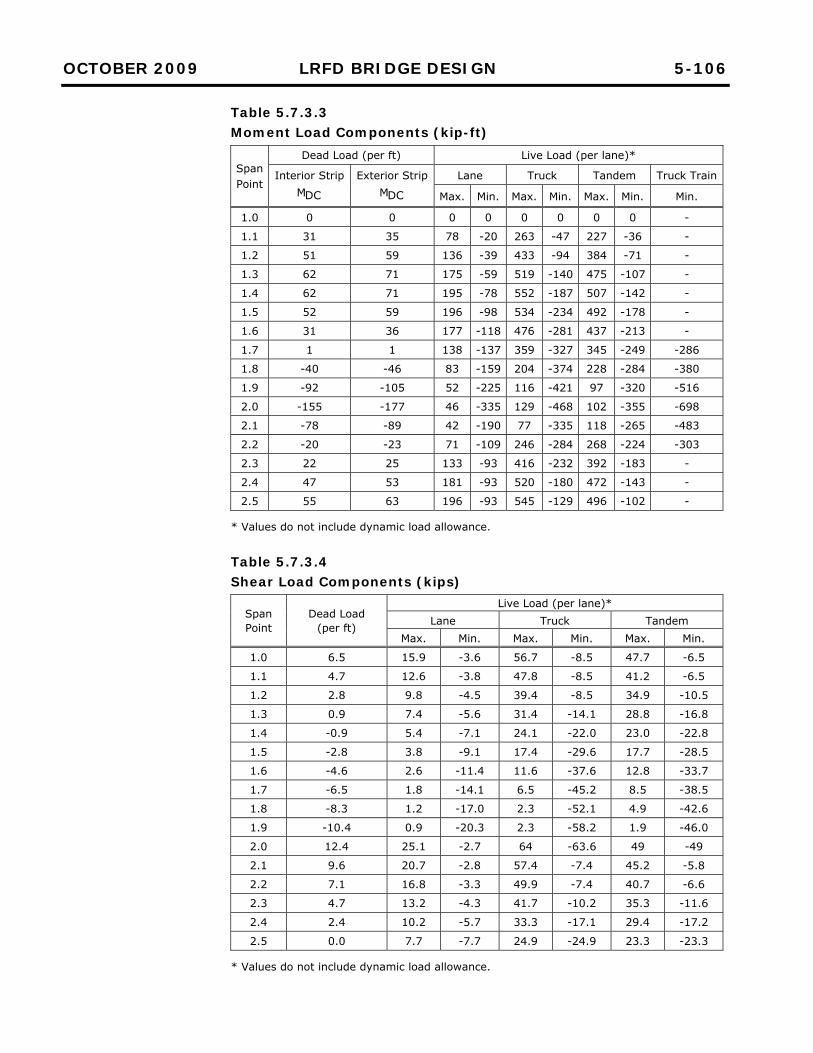
OCTOBER 2009 LRFD BRIDGE DESIGN 5-106
Table 5.7.3.3 Moment Load Components (kip-ft)
Span Point
Dead Load (per ft) Live Load (per lane)*
Interior Strip
DCM Exterior Strip
DCM Lane Truck Tandem Truck Train
Max. Min. Max. Min. Max. Min. Min.
1.0 0 0 0 0 0 0 0 0 -
1.1 31 35 78 -20 263 -47 227 -36 -
1.2 51 59 136 -39 433 -94 384 -71 -
1.3 62 71 175 -59 519 -140 475 -107 -
1.4 62 71 195 -78 552 -187 507 -142 -
1.5 52 59 196 -98 534 -234 492 -178 -
1.6 31 36 177 -118 476 -281 437 -213 -
1.7 1 1 138 -137 359 -327 345 -249 -286
1.8 -40 -46 83 -159 204 -374 228 -284 -380
1.9 -92 -105 52 -225 116 -421 97 -320 -516
2.0 -155 -177 46 -335 129 -468 102 -355 -698
2.1 -78 -89 42 -190 77 -335 118 -265 -483
2.2 -20 -23 71 -109 246 -284 268 -224 -303
2.3 22 25 133 -93 416 -232 392 -183 -
2.4 47 53 181 -93 520 -180 472 -143 -
2.5 55 63 196 -93 545 -129 496 -102 -
* Values do not include dynamic load allowance. Table 5.7.3.4 Shear Load Components (kips)
Span Point
Dead Load (per ft)
Live Load (per lane)* Lane Truck Tandem
Max. Min. Max. Min. Max. Min.
1.0 6.5 15.9 -3.6 56.7 -8.5 47.7 -6.5
1.1 4.7 12.6 -3.8 47.8 -8.5 41.2 -6.5
1.2 2.8 9.8 -4.5 39.4 -8.5 34.9 -10.5
1.3 0.9 7.4 -5.6 31.4 -14.1 28.8 -16.8
1.4 -0.9 5.4 -7.1 24.1 -22.0 23.0 -22.8
1.5 -2.8 3.8 -9.1 17.4 -29.6 17.7 -28.5
1.6 -4.6 2.6 -11.4 11.6 -37.6 12.8 -33.7
1.7 -6.5 1.8 -14.1 6.5 -45.2 8.5 -38.5
1.8 -8.3 1.2 -17.0 2.3 -52.1 4.9 -42.6
1.9 -10.4 0.9 -20.3 2.3 -58.2 1.9 -46.0
2.0 12.4 25.1 -2.7 64 -63.6 49 -49
2.1 9.6 20.7 -2.8 57.4 -7.4 45.2 -5.8
2.2 7.1 16.8 -3.3 49.9 -7.4 40.7 -6.6
2.3 4.7 13.2 -4.3 41.7 -10.2 35.3 -11.6
2.4 2.4 10.2 -5.7 33.3 -17.1 29.4 -17.2
2.5 0.0 7.7 -7.7 24.9 -24.9 23.3 -23.3
* Values do not include dynamic load allowance.
OCTOBER 2009 LRFD BRIDGE DESIGN 5-107
I. Develop Preliminary Tendon Profile
Begin by determining the eccentricity of the tendon at primary locations and calculating the dead load and live load moments. Preliminary runs with assumed prestress losses are used to determine an appropriate tendon area or tendon force per foot. The prestress needs to provide zero tension stress in the slab at the service limit state. For this example, a 12 strand (0.6 inch diameter) tendon is found to be appropriate when spaced at 2'-5". A handful of suppliers provide post-tensioning products in the U.S. Catalogs from the suppliers should be reviewed to ensure that standard tendons and ducts are used. LRFD Article 5.4.6.2 places maximum and minimum limits on the size of ducts based on the size of the tendon and the least concrete dimension of the member. The tendon low points for the side spans will be placed at Span Points 1.4 and 3.6 (22 ft away from the abutment end of the span). The tendon low point for the center span will be placed at midspan (Span Point 2.5). The tendon high points will be located over the piers at Span Points 2.0 and 3.0. The tendon will be at the centroid of the gross cross section at each end of the structure (Span Points 1.0 and 4.0). See Figure 5.7.3.3 for a sketch of the proposed tendon profile and tendon centroid locations at high and low points of the tendon profile. Critical points of the tendon geometry are calculated as:
topd at Span Point 1.0 = 11.00 in
topd at Span Points 1.4 and 2.5 = 22 - 1.5 - 0.625 - 2.25 = 17.63 in
topd at Span Points 2.0 = 3 + 0.625 + 2.25 = 5.88 in
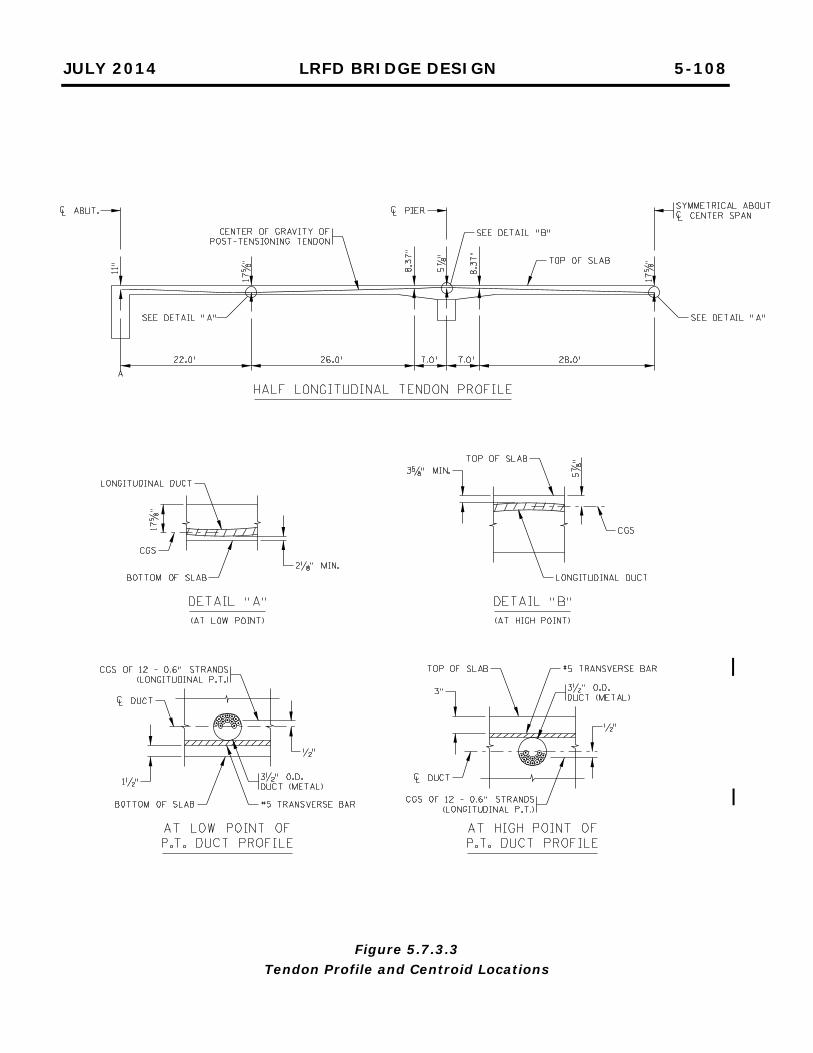
JULY 2014 LRFD BRIDGE DESIGN 5-108
Figure 5.7.3.3 Tendon Profile and Centroid Locations
OCTOBER 2009 LRFD BRIDGE DESIGN 5-109
Tendon Equations The tendon profile can be defined with a series of parabolas where for each parabola:
cxbxay 2
With the section depth varying along the slab, use the top of the slab as the datum for defining the parabolic curves. The tendon profile is described with three parabolas; one describing the positive moment region of the side spans, a second describing the negative moment regions over the piers, and lastly a third parabola describing the positive moment region of the center span. Using the constraints:
y= 11.00 inches at x = 0 feet y = 17.63 inches at x = 22 feet Slope = 0 at x = 22 feet
The equation for the parabola for the positive moment regions of the side spans is found to be:
00.11x6023.0x01369.0y 2 (x in feet, y in inches)
Knowing that the y-coordinate and the slope for the tendon profile needs to be consistent at the location where parabolas meet, the second and third parabolas can be found. Set the origin for the second parabola to be at Span Point 2.0. The following constraints can be used to determine the constants for the parabola:
y = 5.875 inches at x = 0 feet Slope = 0 at x = 0 feet y at the end of the curve matches that of the 1st parabola Slope at the end of the curve matches that of the 1st parabola
The location where the 1st and 2nd parabolas meet was found by changing the length of the 2nd parabola until the y value and slope matched that of the 1st parabola. The parabolas satisfy the criteria if they meet at a point 7.00 feet away from the pier (Span Point 1.873). The equation for the 2nd parabola is:
875.5x0x05092.0y 2 (x in feet, y in inches)
OCTOBER 2009 LRFD BRIDGE DESIGN 5-110
With the 2nd parabola defined, the same procedure can be used to determine the constants for the 3rd parabola. With x = 0 at Span Point 2.5, the constants are:
y = 17.625 inches at x = 0 feet Slope = 0 at x = 0 feet y at the end of the curve matches that of the 2nd parabola Slope at the end of the curve matches that of the 2nd parabola
After iterating the length of the 3rd parabola, the location where the y values and slopes match for the 2nd and 3rd parabolas is at a location 7.00 feet away from the pier (Span Point 2.1). The equation for the 2nd parabola is:
625.17x0x0118.0y 2 (x in feet, y in inches)
Tendon Geometry The tendon profile information for different points along the bridge are presented in Table 5.7.3.5. The equations presented above are in mixed units with the y values in inches and the x values in feet. To arrive at the tendon slopes in radians, the equation constants were divided by 12.
OCTOBER 2009 LRFD BRIDGE DESIGN 5-111
Table 5.7.3.5 Tendon Geometry
Spa
n Po
int
Dep
th o
f Sec
tion
(in
)
Sec
tion
Cen
troi
d (i
n)
* Te
ndon
Cen
troi
d (i
n)
Tend
on E
ccen
tric
ity (
in)
Tend
on S
lope
(ra
dian
s)
Cum
ulat
ive
Leng
th o
f Te
ndon
(ft
)
Cum
ulat
ive
Ang
le
Cha
nge
(rad
ians
)
1.0/4.0 22.00 11.00 11.00 0.00 +/- 0.050 0.000/180.094 0.000/0.559
1.1/3.9 22.00 11.00 13.90 -2.90 +/- 0.038 5.505/174.588 0.013/0.546
1.2/3.8 22.00 11.00 15.97 -4.97 +/- 0.025 11.008/169.086 0.025/0.534
1.3/3.7 22.00 11.00 17.21 -6.21 +/- 0.013 16.509/163.585 0.038/0.521
1.4/3.6 22.00 11.00 17.63 -6.63 0.000 22.009/158.084 0.050/0.508
1.5/3.5 22.00 11.00 17.21 -6.21 -/+ 0.013 27.509/152.584 0.063/0.496
1.6/3.4 22.00 11.00 15.97 -4.97 -/+ 0.025 33.010/147.083 0.075/0.483
1.7/3.3 22.00 11.00 13.90 -2.90 -/+ 0.038 38.513/141.581 0.088/0.471
1.8/3.2 22.96 11.48 11.00 0.48 -/+ 0.050 44.018/136.075 0.100/0.458
1.873/3.127 25.52 12.76 8.37 4.39 -/+ 0.059 48.024/132.069 0.110/0.449
1.9/3.1 26.48 13.24 7.42 5.82 -/+ 0.047 49.527/130.567 0.122/0.436
2.0/3.0 30.00 15.00 5.88 9.13 0.000 55.029/125.065 0.169/0.390
2.1/2.9 25.52 12.76 8.37 4.39 +/- 0.059 62.033/118.061 0.224/0.334
2.2/2.8 22.00 11.00 12.42 -1.42 +/- 0.041 69.041/111.053 0.238/0.321
2.3/2.7 22.00 11.00 15.31 -4.31 +/- 0.028 76.045/104.049 0.252/0.307
2.4/2.6 22.00 11.00 17.05 -6.05 +/- 0.014 83.047/97.047 0.266/0.293
2.5 22.00 11.00 17.63 -6.63 0.000 90.047 0.279
* Measured from top of structural slab.
OCTOBER 2009 LRFD BRIDGE DESIGN 5-112
J. Initial Prestress Losses
[5.9.5.2.2]
[5.9.5.2.1]
Calculate the prestress losses due to friction, anchor set, and elastic shortening. Friction Losses An exponential equation is used to determine the friction losses at different tendon locations.
xKpjpF e1ff
where:
pjf = stress in prestressing steel at jacking (ksi)
x = length of prestressing tendon between any two points (ft)
K = wobble coefficient from LRFD Table 5.9.5.2.2b-1 Use 0.0002
= coefficient of friction from LRFD Table 5.9.5.2.2b-1 Use 0.25
= absolute value of angular change of prestressing path between two points (radians)
The friction coefficients assume that the strands are installed in rigid galvanized ducts. The ratio of the force in the tendon to the force at any location after friction losses (Friction Factor) is summarized in Table 5.7.3.6. Anchor Set Losses The release of the tensioning jack from the PT tendon is accomplished by engaging strand wedges in the permanent anchor plate. A small shortening displacement in the tendon is necessary to seat the wedges. During construction, the tendon displacement is dependent on the jacking equipment used (some jacks can power seat wedges, others cannot). For design, a typical seating displacement is assumed (a standard value is 0.375 inches). The effective tension in the post-tensioning tendons at the jacking end is reduced due to the shortening of the tendon. This localized loss in tendon stress is called anchor set. The effect of anchor set is represented in Figure 5.7.3.4.
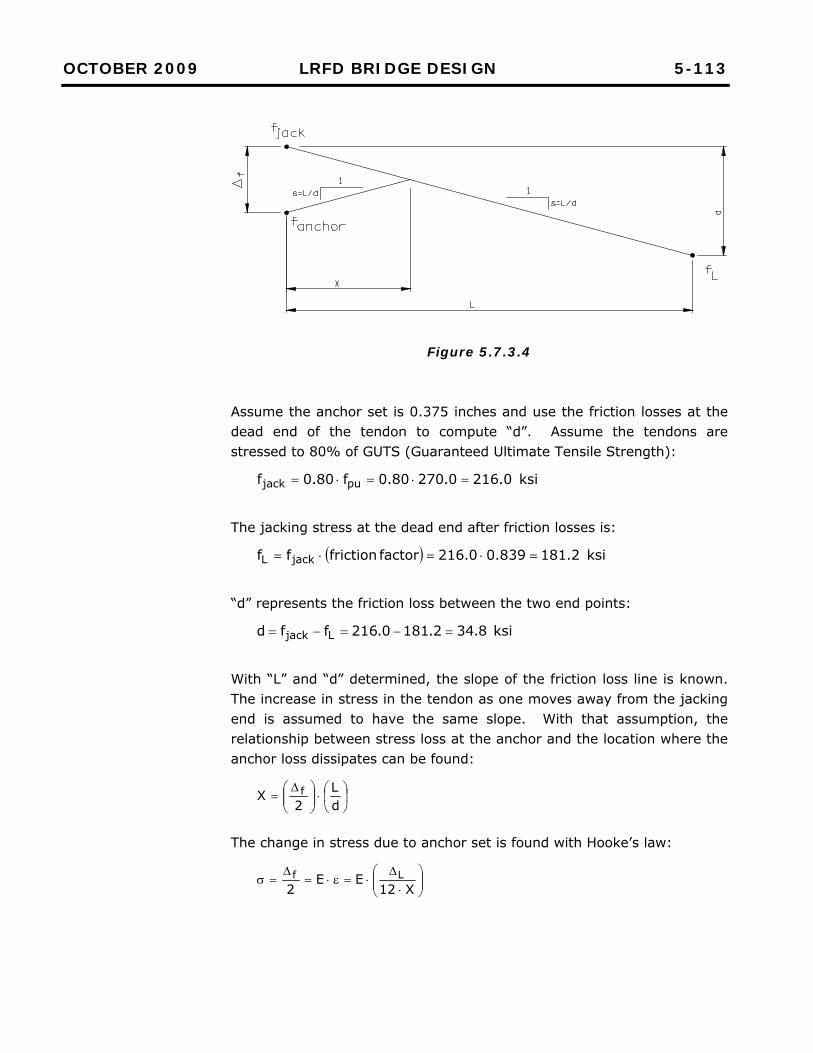
OCTOBER 2009 LRFD BRIDGE DESIGN 5-113
Figure 5.7.3.4 Assume the anchor set is 0.375 inches and use the friction losses at the dead end of the tendon to compute “d”. Assume the tendons are stressed to 80% of GUTS (Guaranteed Ultimate Tensile Strength):
ksi0.2160.27080.0f80.0f pujack
The jacking stress at the dead end after friction losses is:
ksi2.181839.00.216factor frictionff jackL
“d” represents the friction loss between the two end points:
ksi8.342.1810.216ffd Ljack
With “L” and “d” determined, the slope of the friction loss line is known. The increase in stress in the tendon as one moves away from the jacking end is assumed to have the same slope. With that assumption, the relationship between stress loss at the anchor and the location where the anchor loss dissipates can be found:
dL
2X f
The change in stress due to anchor set is found with Hooke’s law:
X12EE
2Lf
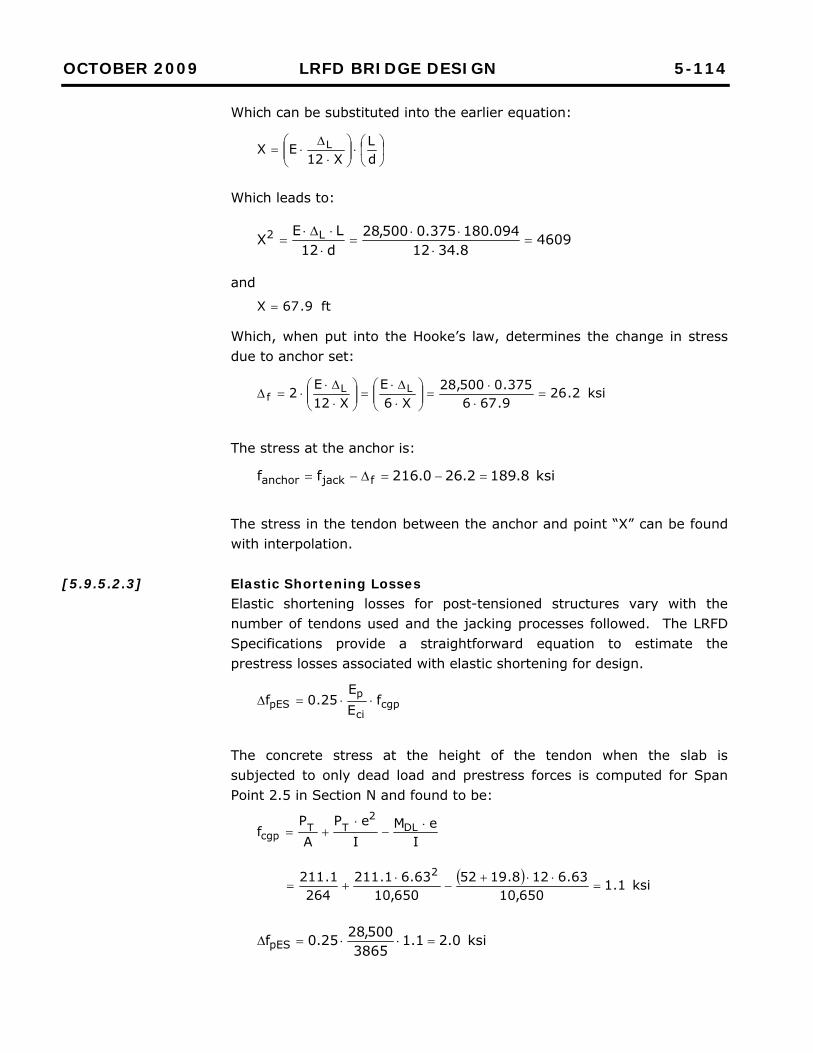
OCTOBER 2009 LRFD BRIDGE DESIGN 5-114
[5.9.5.2.3]
Which can be substituted into the earlier equation:
dL
X12EX L
Which leads to:
46098.3412
094.180375.0500,28d12LEX L2
and
ft9.67X
Which, when put into the Hooke’s law, determines the change in stress due to anchor set:
ksi2.269.676375.0500,28
X6E
X12E2 LL
f
The stress at the anchor is:
ksi8.1892.260.216ff fjackanchor
The stress in the tendon between the anchor and point “X” can be found with interpolation. Elastic Shortening Losses Elastic shortening losses for post-tensioned structures vary with the number of tendons used and the jacking processes followed. The LRFD Specifications provide a straightforward equation to estimate the prestress losses associated with elastic shortening for design.
cgpci
ppES f
EE
25.0f
The concrete stress at the height of the tendon when the slab is subjected to only dead load and prestress forces is computed for Span Point 2.5 in Section N and found to be:
IeM
IeP
AP
f DL2
TTcgp
ksi1.1650,10
63.6128.1952650,10
63.61.211264
1.211 2
ksi0.21.13865
500,2825.0fpES
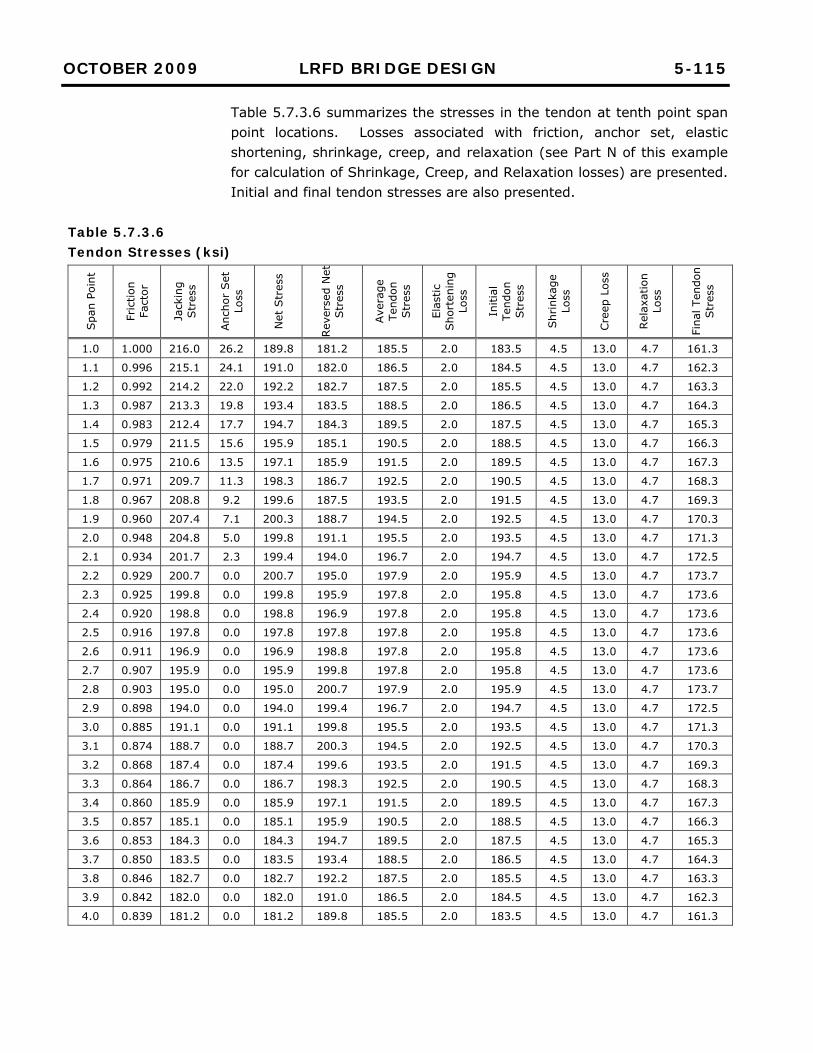
OCTOBER 2009 LRFD BRIDGE DESIGN 5-115
Table 5.7.3.6 summarizes the stresses in the tendon at tenth point span point locations. Losses associated with friction, anchor set, elastic shortening, shrinkage, creep, and relaxation (see Part N of this example for calculation of Shrinkage, Creep, and Relaxation losses) are presented. Initial and final tendon stresses are also presented.
Table 5.7.3.6 Tendon Stresses (ksi)
Spa
n Po
int
Fric
tion
Fact
or
Jack
ing
Str
ess
Anc
hor
Set
Lo
ss
Net
Str
ess
Rev
erse
d N
et
Str
ess
Ave
rage
Te
ndon
Str
ess
Elas
tic
Sho
rten
ing
Loss
Initi
al
Tend
on
Str
ess
Shr
inka
ge
Loss
Cre
ep L
oss
Rel
axat
ion
Loss
Fina
l Ten
don
Str
ess
1.0 1.000 216.0 26.2 189.8 181.2 185.5 2.0 183.5 4.5 13.0 4.7 161.3
1.1 0.996 215.1 24.1 191.0 182.0 186.5 2.0 184.5 4.5 13.0 4.7 162.3
1.2 0.992 214.2 22.0 192.2 182.7 187.5 2.0 185.5 4.5 13.0 4.7 163.3
1.3 0.987 213.3 19.8 193.4 183.5 188.5 2.0 186.5 4.5 13.0 4.7 164.3
1.4 0.983 212.4 17.7 194.7 184.3 189.5 2.0 187.5 4.5 13.0 4.7 165.3
1.5 0.979 211.5 15.6 195.9 185.1 190.5 2.0 188.5 4.5 13.0 4.7 166.3
1.6 0.975 210.6 13.5 197.1 185.9 191.5 2.0 189.5 4.5 13.0 4.7 167.3
1.7 0.971 209.7 11.3 198.3 186.7 192.5 2.0 190.5 4.5 13.0 4.7 168.3
1.8 0.967 208.8 9.2 199.6 187.5 193.5 2.0 191.5 4.5 13.0 4.7 169.3
1.9 0.960 207.4 7.1 200.3 188.7 194.5 2.0 192.5 4.5 13.0 4.7 170.3
2.0 0.948 204.8 5.0 199.8 191.1 195.5 2.0 193.5 4.5 13.0 4.7 171.3
2.1 0.934 201.7 2.3 199.4 194.0 196.7 2.0 194.7 4.5 13.0 4.7 172.5
2.2 0.929 200.7 0.0 200.7 195.0 197.9 2.0 195.9 4.5 13.0 4.7 173.7
2.3 0.925 199.8 0.0 199.8 195.9 197.8 2.0 195.8 4.5 13.0 4.7 173.6
2.4 0.920 198.8 0.0 198.8 196.9 197.8 2.0 195.8 4.5 13.0 4.7 173.6
2.5 0.916 197.8 0.0 197.8 197.8 197.8 2.0 195.8 4.5 13.0 4.7 173.6
2.6 0.911 196.9 0.0 196.9 198.8 197.8 2.0 195.8 4.5 13.0 4.7 173.6
2.7 0.907 195.9 0.0 195.9 199.8 197.8 2.0 195.8 4.5 13.0 4.7 173.6
2.8 0.903 195.0 0.0 195.0 200.7 197.9 2.0 195.9 4.5 13.0 4.7 173.7
2.9 0.898 194.0 0.0 194.0 199.4 196.7 2.0 194.7 4.5 13.0 4.7 172.5
3.0 0.885 191.1 0.0 191.1 199.8 195.5 2.0 193.5 4.5 13.0 4.7 171.3
3.1 0.874 188.7 0.0 188.7 200.3 194.5 2.0 192.5 4.5 13.0 4.7 170.3
3.2 0.868 187.4 0.0 187.4 199.6 193.5 2.0 191.5 4.5 13.0 4.7 169.3
3.3 0.864 186.7 0.0 186.7 198.3 192.5 2.0 190.5 4.5 13.0 4.7 168.3
3.4 0.860 185.9 0.0 185.9 197.1 191.5 2.0 189.5 4.5 13.0 4.7 167.3
3.5 0.857 185.1 0.0 185.1 195.9 190.5 2.0 188.5 4.5 13.0 4.7 166.3
3.6 0.853 184.3 0.0 184.3 194.7 189.5 2.0 187.5 4.5 13.0 4.7 165.3
3.7 0.850 183.5 0.0 183.5 193.4 188.5 2.0 186.5 4.5 13.0 4.7 164.3
3.8 0.846 182.7 0.0 182.7 192.2 187.5 2.0 185.5 4.5 13.0 4.7 163.3
3.9 0.842 182.0 0.0 182.0 191.0 186.5 2.0 184.5 4.5 13.0 4.7 162.3
4.0 0.839 181.2 0.0 181.2 189.8 185.5 2.0 183.5 4.5 13.0 4.7 161.3
OCTOBER 2009 LRFD BRIDGE DESIGN 5-116
K. Check Stress Limits on Prestressing Strands [Table 5.9.3-1]
L. Summary of Analysis Results
Stress Limits for Prestressing Strands: Prior to seating ksi7.218f90.0f pys At anchorages after anchor set ksi0.189f70.0f pus End of seating zone after anchor set ksi8.199f74.0f pus At service limit after losses ksi4.194f80.0f pys
A review of the values in Table 5.7.3.6 indicates that none of the stress limits are exceeded. From this point forward, the design of an interior strip at points of maximum positive and negative moment subject to dead and live loads will be presented. The design procedure for the edge strip is similar. A summary of bending moments obtained at different locations along the superstructure for a 1 foot wide design strip is presented in Table 5.7.3.7. The analysis results are symmetric about midspan of the center span. Secondary Post-Tensioning Forces The linear haunches complicate the analysis of the slab superstructure. The nonprismatic section, combined with the parabolic tendon profiles prevent an easy hand method from being used to determine the secondary moments associated with post-tensioning a continuous superstructure. Therefore, a beam analysis program was used to determine secondary post-tensioning forces. The tensioning of the tendon redistributes the dead load reactions of the superstructure. For the design example the redistribution was an increase in the abutment reaction of 0.87 kips and a corresponding reduction in the pier reactions of 0.87 kips. This implies that the positive moment regions of the tendon profile introduced slightly more curvature into the superstructure than the negative moment regions. The secondary moments associated with the redistribution amount to a linearly increasing positive moment in the side spans (0.0 kip-ft at the abutments and 47.9 kip-ft at the piers). The secondary moment in the center span is a constant positive value of 47.9 kip-ft.
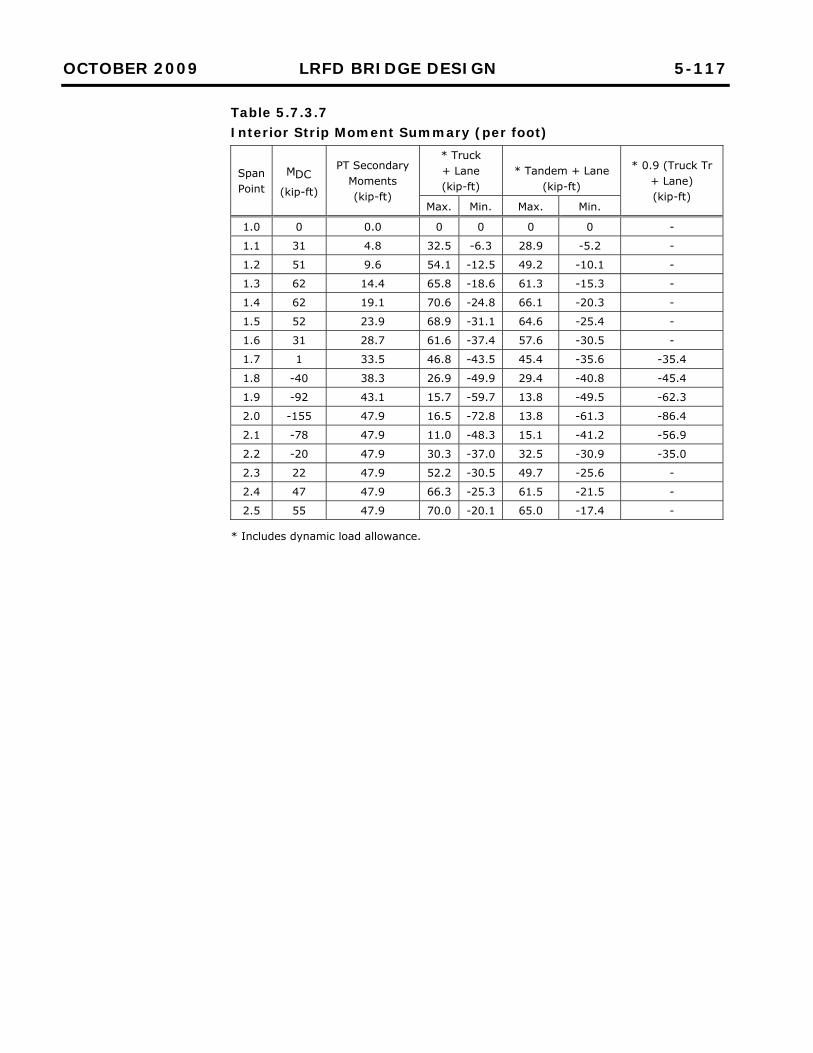
OCTOBER 2009 LRFD BRIDGE DESIGN 5-117
Table 5.7.3.7 Interior Strip Moment Summary (per foot)
Span Point
DCM
(kip-ft)
PT Secondary Moments (kip-ft)
* Truck + Lane (kip-ft)
* Tandem + Lane (kip-ft)
* 0.9 (Truck Tr + Lane) (kip-ft)
Max. Min. Max. Min.
1.0 0 0.0 0 0 0 0 -
1.1 31 4.8 32.5 -6.3 28.9 -5.2 -
1.2 51 9.6 54.1 -12.5 49.2 -10.1 -
1.3 62 14.4 65.8 -18.6 61.3 -15.3 -
1.4 62 19.1 70.6 -24.8 66.1 -20.3 -
1.5 52 23.9 68.9 -31.1 64.6 -25.4 -
1.6 31 28.7 61.6 -37.4 57.6 -30.5 -
1.7 1 33.5 46.8 -43.5 45.4 -35.6 -35.4
1.8 -40 38.3 26.9 -49.9 29.4 -40.8 -45.4
1.9 -92 43.1 15.7 -59.7 13.8 -49.5 -62.3
2.0 -155 47.9 16.5 -72.8 13.8 -61.3 -86.4
2.1 -78 47.9 11.0 -48.3 15.1 -41.2 -56.9
2.2 -20 47.9 30.3 -37.0 32.5 -30.9 -35.0
2.3 22 47.9 52.2 -30.5 49.7 -25.6 -
2.4 47 47.9 66.3 -25.3 61.5 -21.5 -
2.5 55 47.9 70.0 -20.1 65.0 -17.4 -
* Includes dynamic load allowance.
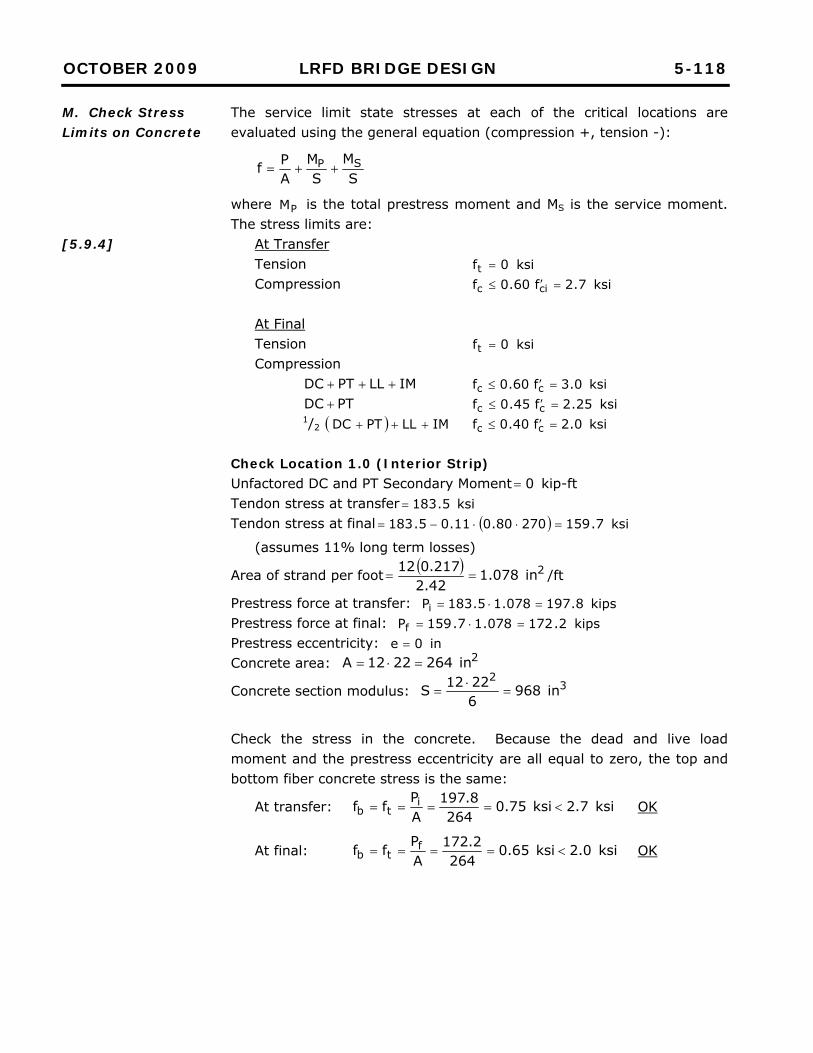
OCTOBER 2009 LRFD BRIDGE DESIGN 5-118
M. Check Stress Limits on Concrete
[5.9.4]
The service limit state stresses at each of the critical locations are evaluated using the general equation (compression +, tension -):
SM
SM
APf SP
where PM is the total prestress moment and MS is the service moment. The stress limits are:
At Transfer Tension ksi0ft Compression ksi7.2f60.0f cic At Final Tension ksi0ft Compression
IMLLPTDC ksi0.3f60.0f cc PTDC ksi25.2f45.0f cc
1/2 IMLLPTDC ksi0.2f40.0f cc Check Location 1.0 (Interior Strip) Unfactored DC and PT Secondary Moment 0 kip-ft Tendon stress at transfer ksi5.183 Tendon stress at final ksi7.15927080.011.05.183
(assumes 11% long term losses)
Area of strand per foot 2in078.142.2217.012
/ft
Prestress force at transfer: kips8.197078.15.183Pi Prestress force at final: kips2.172078.17.159Pf Prestress eccentricity: in0e Concrete area: 2in2642212A
Concrete section modulus: 32
in96862212S
Check the stress in the concrete. Because the dead and live load moment and the prestress eccentricity are all equal to zero, the top and bottom fiber concrete stress is the same:
At transfer: ksi7.2ksi75.0264
8.197APff i
tb OK
At final: ksi0.2ksi65.0264
2.172APff f
tb OK
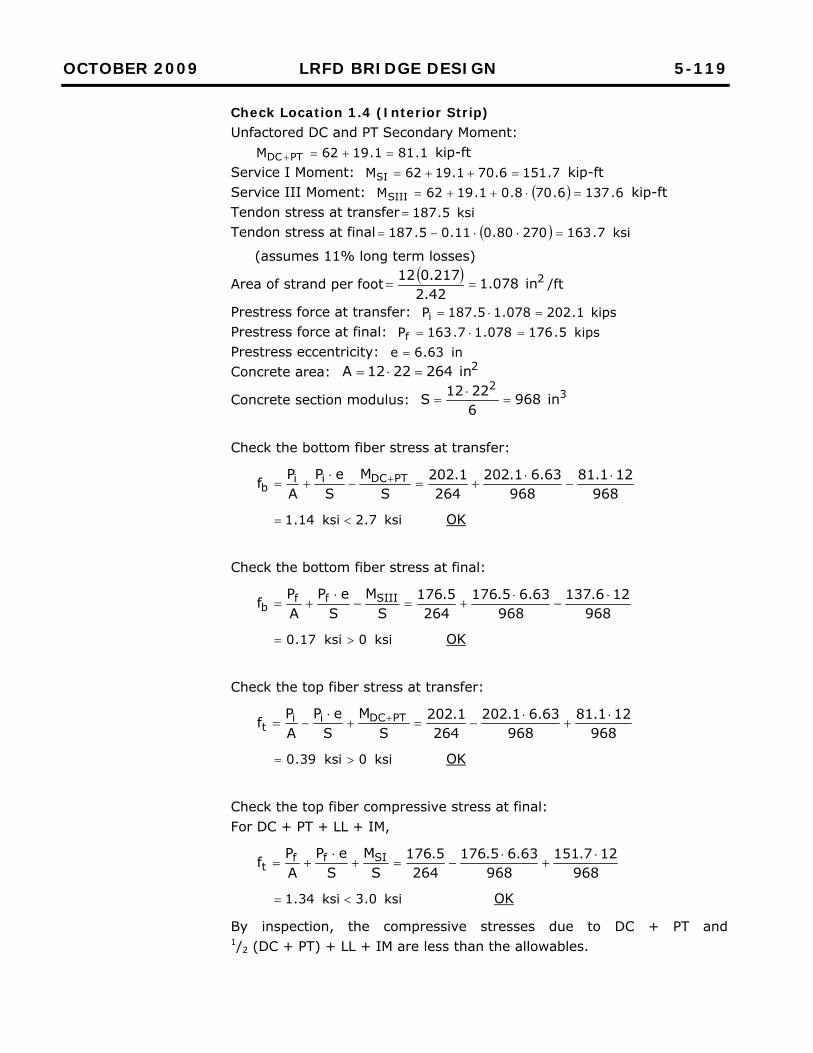
OCTOBER 2009 LRFD BRIDGE DESIGN 5-119
Check Location 1.4 (Interior Strip) Unfactored DC and PT Secondary Moment:
1.811.1962M PTDC kip-ft Service I Moment: 7.1516.701.1962MSI kip-ft Service III Moment: 6.1376.708.01.1962MSIII kip-ft Tendon stress at transfer ksi5.187 Tendon stress at final ksi7.16327080.011.05.187
(assumes 11% long term losses)
Area of strand per foot 2in078.142.2217.012
/ft
Prestress force at transfer: kips1.202078.15.187Pi Prestress force at final: kips5.176078.17.163Pf Prestress eccentricity: in63.6e Concrete area: 2in2642212A
Concrete section modulus: 32
in96862212S
Check the bottom fiber stress at transfer:
968121.81
96863.61.202
2641.202
SM
SeP
APf PTDCii
b
ksi7.2ksi14.1 OK
Check the bottom fiber stress at final:
968126.137
96863.65.176
2645.176
SM
SeP
APf SIIIff
b
ksi0ksi17.0 OK
Check the top fiber stress at transfer:
968121.81
96863.61.202
2641.202
SM
SeP
APf PTDCii
t
ksi0ksi39.0 OK
Check the top fiber compressive stress at final: For DC + PT + LL + IM,
968127.151
96863.65.176
2645.176
SM
SeP
APf SIff
t
ksi0.3ksi34.1 OK
By inspection, the compressive stresses due to DC + PT and 1/2 (DC + PT) + LL + IM are less than the allowables.
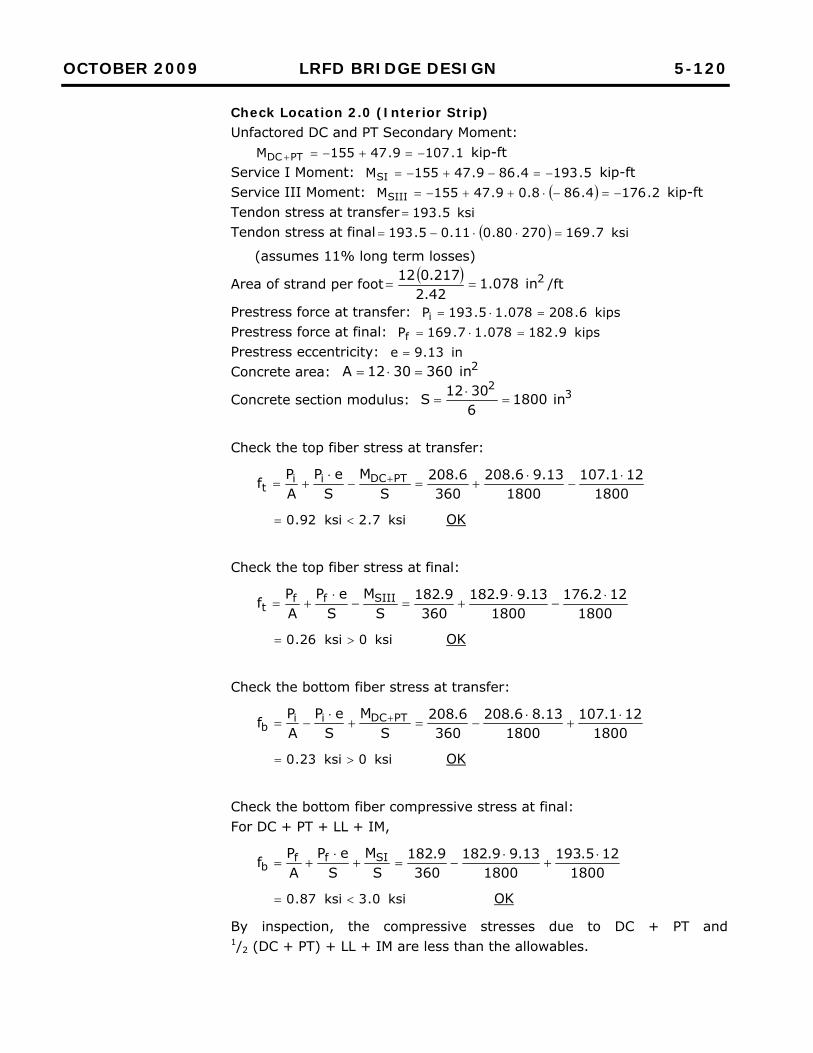
OCTOBER 2009 LRFD BRIDGE DESIGN 5-120
Check Location 2.0 (Interior Strip) Unfactored DC and PT Secondary Moment:
1.1079.47155M PTDC kip-ft Service I Moment: 5.1934.869.47155MSI kip-ft Service III Moment: 2.1764.868.09.47155MSIII kip-ft Tendon stress at transfer ksi5.193 Tendon stress at final ksi7.16927080.011.05.193
(assumes 11% long term losses)
Area of strand per foot 2in078.142.2217.012
/ft
Prestress force at transfer: kips6.208078.15.193Pi Prestress force at final: kips9.182078.17.169Pf Prestress eccentricity: in13.9e Concrete area: 2in3603012A
Concrete section modulus: 32
in180063012S
Check the top fiber stress at transfer:
1800121.107
180013.96.208
3606.208
SM
SeP
APf PTDCii
t
ksi7.2ksi92.0 OK
Check the top fiber stress at final:
1800122.176
180013.99.182
3609.182
SM
SeP
APf SIIIff
t
ksi0ksi26.0 OK
Check the bottom fiber stress at transfer:
1800121.107
180013.86.208
3606.208
SM
SeP
APf PTDCii
b
ksi0ksi23.0 OK
Check the bottom fiber compressive stress at final: For DC + PT + LL + IM,
1800125.193
180013.99.182
3609.182
SM
SeP
APf SIff
b
ksi0.3ksi87.0 OK
By inspection, the compressive stresses due to DC + PT and 1/2 (DC + PT) + LL + IM are less than the allowables.
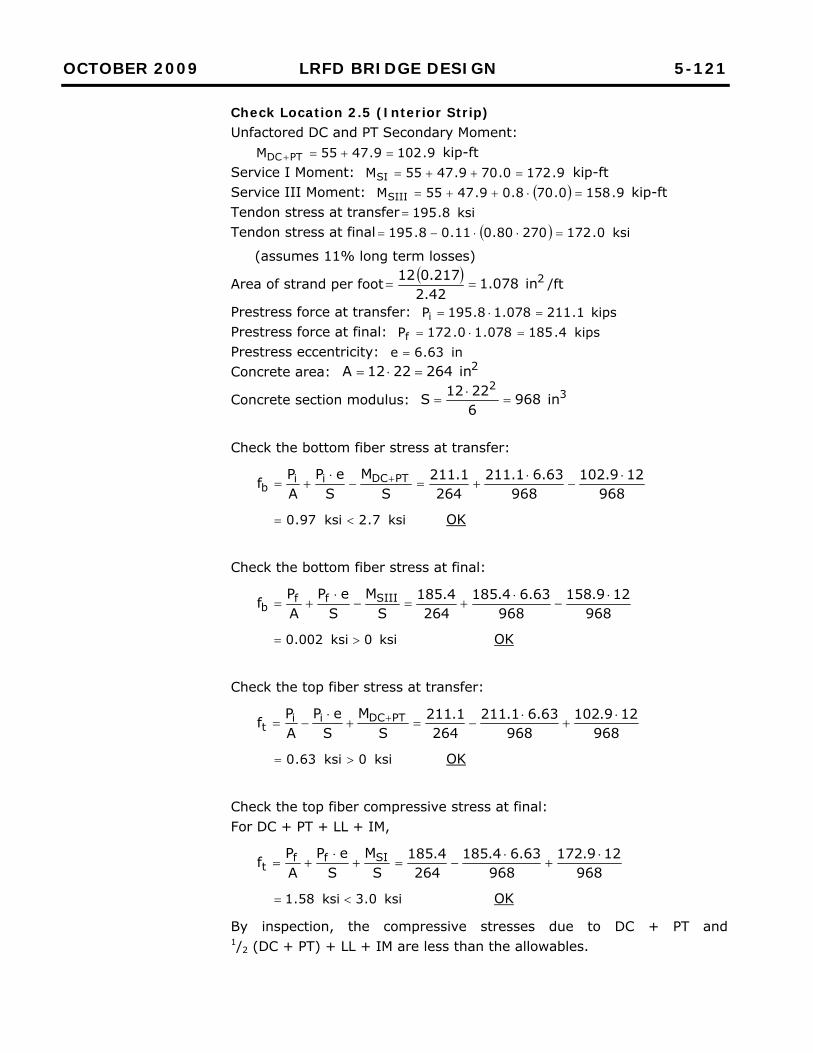
OCTOBER 2009 LRFD BRIDGE DESIGN 5-121
Check Location 2.5 (Interior Strip) Unfactored DC and PT Secondary Moment:
9.1029.4755M PTDC kip-ft Service I Moment: 9.1720.709.4755MSI kip-ft Service III Moment: 9.1580.708.09.4755MSIII kip-ft Tendon stress at transfer ksi8.195 Tendon stress at final ksi0.17227080.011.08.195
(assumes 11% long term losses)
Area of strand per foot 2in078.142.2217.012
/ft
Prestress force at transfer: kips1.211078.18.195Pi Prestress force at final: kips4.185078.10.172Pf Prestress eccentricity: in63.6e Concrete area: 2in2642212A
Concrete section modulus: 32
in96862212S
Check the bottom fiber stress at transfer:
968129.102
96863.61.211
2641.211
SM
SeP
APf PTDCii
b
ksi7.2ksi97.0 OK
Check the bottom fiber stress at final:
968129.158
96863.64.185
2644.185
SM
SeP
APf SIIIff
b
ksi0ksi002.0 OK
Check the top fiber stress at transfer:
968129.102
96863.61.211
2641.211
SM
SeP
APf PTDCii
t
ksi0ksi63.0 OK
Check the top fiber compressive stress at final: For DC + PT + LL + IM,
968129.172
96863.64.185
2644.185
SM
SeP
APf SIff
t
ksi0.3ksi58.1 OK
By inspection, the compressive stresses due to DC + PT and 1/2 (DC + PT) + LL + IM are less than the allowables.
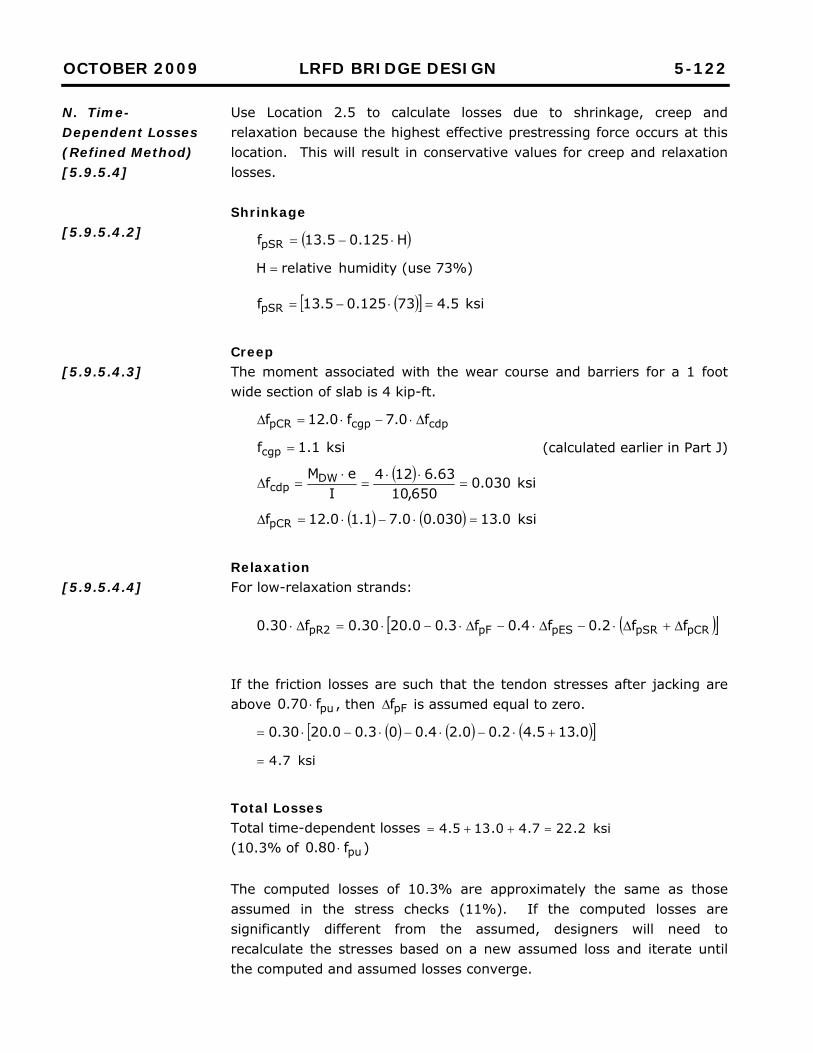
OCTOBER 2009 LRFD BRIDGE DESIGN 5-122
N. Time-Dependent Losses (Refined Method) [5.9.5.4]
[5.9.5.4.2]
[5.9.5.4.3]
[5.9.5.4.4]
Use Location 2.5 to calculate losses due to shrinkage, creep and relaxation because the highest effective prestressing force occurs at this location. This will result in conservative values for creep and relaxation losses. Shrinkage
H125.05.13fpSR
relativeH humidity (use 73%)
ksi5.473125.05.13fpSR
Creep The moment associated with the wear course and barriers for a 1 foot wide section of slab is 4 kip-ft.
cdpcgppCR f0.7f0.12f
ksi1.1fcgp (calculated earlier in Part J)
ksi030.0650,10
63.6124I
eMf DWcdp
ksi0.13030.00.71.10.12fpCR
Relaxation For low-relaxation strands:
pCRpSRpESpF2pR ff2.0f4.0f3.00.2030.0f30.0
If the friction losses are such that the tendon stresses after jacking are above puf70.0 , then pFf is assumed equal to zero.
0.135.42.00.24.003.00.2030.0
ksi7.4
Total Losses Total time-dependent losses ksi2.227.40.135.4 (10.3% of puf80.0 ) The computed losses of 10.3% are approximately the same as those assumed in the stress checks (11%). If the computed losses are significantly different from the assumed, designers will need to recalculate the stresses based on a new assumed loss and iterate until the computed and assumed losses converge.
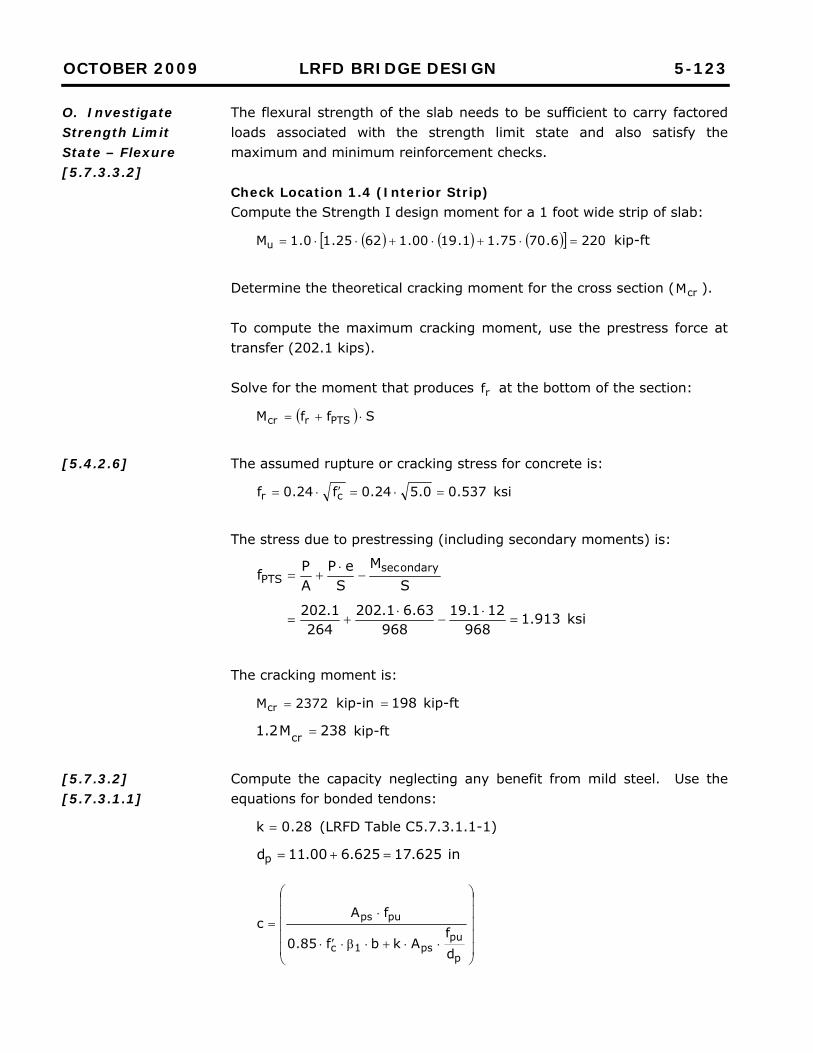
OCTOBER 2009 LRFD BRIDGE DESIGN 5-123
O. Investigate Strength Limit State – Flexure [5.7.3.3.2]
[5.4.2.6]
[5.7.3.2] [5.7.3.1.1]
The flexural strength of the slab needs to be sufficient to carry factored loads associated with the strength limit state and also satisfy the maximum and minimum reinforcement checks. Check Location 1.4 (Interior Strip) Compute the Strength I design moment for a 1 foot wide strip of slab:
2206.7075.11.1900.16225.10.1Mu kip-ft
Determine the theoretical cracking moment for the cross section ( crM ). To compute the maximum cracking moment, use the prestress force at transfer (202.1 kips). Solve for the moment that produces rf at the bottom of the section:
SffM PTSrcr
The assumed rupture or cracking stress for concrete is:
ksi537.00.524.0f24.0f cr
The stress due to prestressing (including secondary moments) is:
SM
SeP
APf ondarysec
PTS
ksi913.1968
121.19968
63.61.202264
1.202
The cracking moment is:
2372Mcr kip-in 198 kip-ft
238M2.1 cr kip-ft
Compute the capacity neglecting any benefit from mild steel. Use the equations for bonded tendons:
28.0k (LRFD Table C5.7.3.1.1-1)
in625.17625.600.11dp
p
pups1c
pups
df
Akbf85.0
fAc
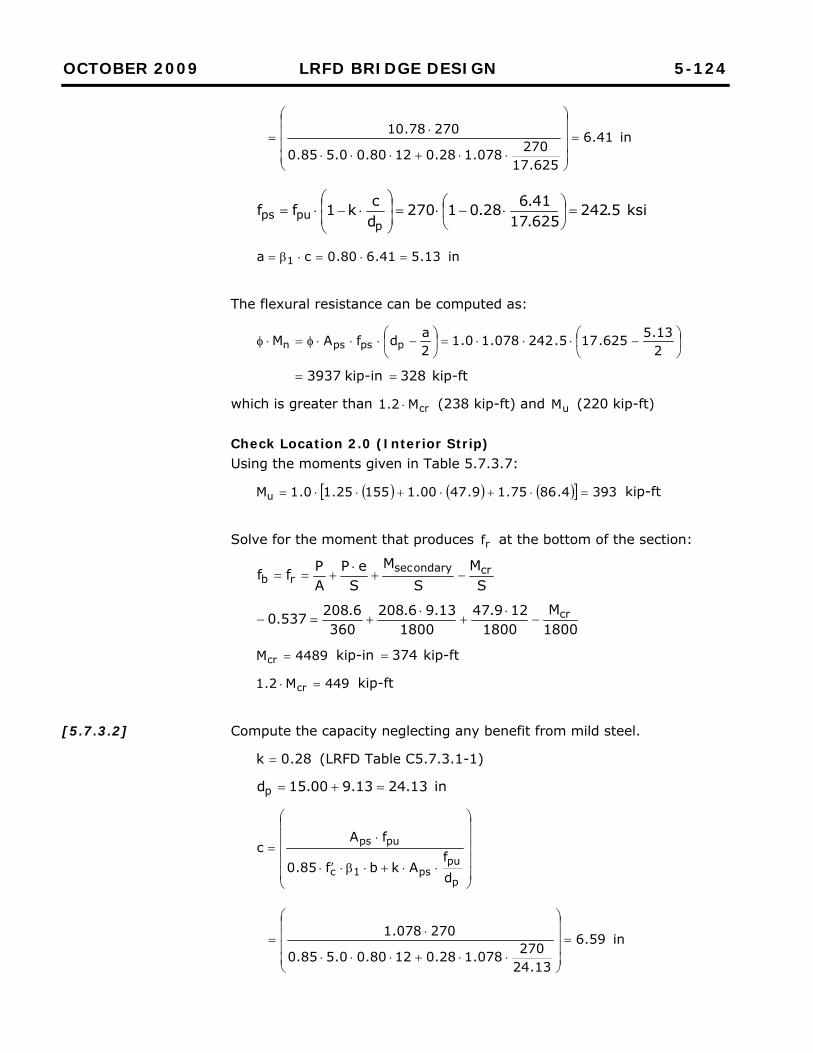
OCTOBER 2009 LRFD BRIDGE DESIGN 5-124
[5.7.3.2]
in41.6
625.17270078.128.01280.00.585.0
27078.10
ksi5.242625.1741.628.01270
dck1ffp
pups
in13.541.680.0ca 1
The flexural resistance can be computed as:
213.5625.175.242078.10.1
2adfAM ppspsn
3937 kip-in 328 kip-ft
which is greater than crM2.1 (238 kip-ft) and uM (220 kip-ft) Check Location 2.0 (Interior Strip) Using the moments given in Table 5.7.3.7:
3934.8675.19.4700.115525.10.1Mu kip-ft
Solve for the moment that produces rf at the bottom of the section:
SM
SM
SeP
APff crondarysec
rb
1800M
1800129.47
180013.96.208
3606.208537.0 cr
4489Mcr kip-in 374 kip-ft
449M2.1 cr kip-ft
Compute the capacity neglecting any benefit from mild steel.
28.0k (LRFD Table C5.7.3.1-1)
in13.2413.900.15dp
p
pups1c
pups
df
Akbf85.0
fAc
in59.6
13.24270078.128.01280.00.585.0
270078.1
OCTOBER 2009 LRFD BRIDGE DESIGN 5-125
[5.7.3.2]
ksi4.24913.2459.628.01270
dck1ffp
pups
in27.559.680.0ca 1
The flexural resistance can be computed as:
227.513.244.249078.10.1
2adfAM ppspsn
5779 kip-in 482 kip-ft
which is greater than crM2.1 (449 kip-ft) and uM (393 kip-ft). Check Location 2.5 (Interior Strip) Using the moments given in Table 5.7.3.7:
2397075.19.4700.15525.10.1Mu kip-ft
Solve for the moment that produces rf at the bottom of the section:
SM
SM
SeP
APff crondarysec
rb
968M
968129.47
96863.61.211
2641.211537.0 cr
2119Mcr kip-in 177 kip-ft
212M2.1 cr kip-ft
Compute the capacity neglecting any benefit from mild steel.
28.0k (LRFD Table C5.7.3.1-1)
in625.17625.600.11dp
p
pups1c
pups
df
Akbf85.0
fAc
in41.6
625.17270078.128.01280.00.585.0
270078.1
ksi5.242625.1741.628.01270
dck1ffp
pups
in13.541.680.0ca 1
OCTOBER 2009 LRFD BRIDGE DESIGN 5-126
[5.7.3.3.1]
The flexural resistance can be computed as:
213.5625.175.242078.10.1
2adfAM ppspsn
3937 kip-in 328 kip-ft
which is greater than uM (239 kip-ft) and crM2.1 (212 kip-ft). Check Principal Stresses [Future manual content] Check Maximum Reinforcement The maximum amount of reinforcement permitted in a section is based on the ratio of the depth of the section in compression compared to the depth of the distance to the tension reinforcement from the compression side of the section. The ratio can be no more than 0.42. When calculating “d”, do not include the wearing course. For Span Point 1.4:
36.0625.1741.6
dc
OK
For Span Point 2.0:
27.013.2459.6
dc
OK
For Span Point 2.5:
36.0625.1741.6
dc
OK
OCTOBER 2009 LRFD BRIDGE DESIGN 5-127
P. Shear [5.13.3.6]
The shear force components for a typical 1 foot wide strip of slab are summarized in Table 5.7.3.8. Table 5.7.3.8 Shear Summary (per foot)
Span Point
DCV
(kips)
PT Secondary Shear (kips)
* Truck + Lane (kips)
* Tandem + Lane (kips)
Max Min Max Min
1.0 6.5 0.87 4.9 -0.8 4.3 -0.7
1.1 4.7 0.87 4.1 -0.8 3.6 -0.7
1.2 2.8 0.87 3.4 -0.8 3.0 -1.0
1.3 0.9 0.87 2.7 -1.3 2.5 -1.5
1.4 -0.9 0.87 2.0 -2.0 1.9 -2.0
1.5 -2.8 0.87 1.5 -2.6 1.5 -2.5
1.6 -4.6 0.87 1.0 -3.3 1.1 -3.0
1.7 -6.5 0.87 0.6 -4.0 0.7 -3.5
1.8 -8.3 0.87 0.2 -4.7 0.4 -4.0
1.9 -10.4 0.87 0.2 -5.3 0.2 -4.4
2.0 12.4 0.0 6.0 -4.7 4.9 -3.7
2.1 9.6 0.0 5.2 -0.7 4.4 -0.6
2.2 7.1 0.0 4.5 -0.7 3.8 -0.7
2.3 4.7 0.0 3.7 -1.0 3.3 -1.1
2.4 2.4 0.0 2.9 -1.5 2.7 -1.5
2.5 0.0 0.0 2.2 -2.2 2.1 -2.1
* Includes dynamic load allowance.
The LRFD Specifications do not require that a shear check be performed, however MnDOT design practice is to do so. To minimize the effort associated with the shear check, conservatively check the largest design shear force on a non-haunch portion of the slab. If the check is satisfied, all sections of the slab can be considered adequate. If the check is not satisfied additional investigation is necessary. The Strength I design shear at Span Point 2.0 is:
kips0.260.675.10.000.14.1225.1Vu
Investigate LRFD Equation 5.8.3.4.2-2. No axial load is applied. Neglect any mild flexural reinforcement and any beneficial vertical prestressing effect. As a starting point, assume is equal to 30 degrees.
OCTOBER 2009 LRFD BRIDGE DESIGN 5-128
[Eqn. 5.8.3.4.2-4]
Q. Minimum Longitudinal Reinforcement [5.8.3.5]
pspss
popspuuv
u
x AEAE
fAcotVV5.0N5.0dM
Use the uM and vd from Span Point 1.4
078.1500,280000,29
2707.0078.130cot265.005.084.1512220
x
000244.0 Determine the crack spacing parameter next. Use vd for xs
3.1063.05.1
38.184.1563.0a
38.1ssg
xxe
With the strain and crack parameters determined, refer to Table 5.8.3.4.2-2 to determine the appropriate and values for use in computing the shear capacity of the concrete. Use the values in the cell for 15sxe and 20.0x ( 34.5 and 5.29 ). The required nominal shear capacity is:
kips9.289.00.26VV
v
un
The shear capacity of the concrete is:
84.15120.534.50316.0dbf0316.0V vvcc
kips9.287.7184.15120.534.50316.0
[Future manual content]
JULY 2014 LRFD BRIDGE DESIGN 5-129
R. Distribution Reinforcement [5.14.4.1]
S. Shrinkage and Temperature Reinforcement [5.10.8.2]
T. Deformations [2.5.2.6]
The minimum amount of transverse reinforcement in a horizontal plane shall be taken as a percentage of the main reinforcement:
%5060f
L100 pe
For Spans 1 and 3
%3860
3.17055
100
Interior Strip: Maximum positive moment
Positive moment prestressing 2in078.1 /ft Transverse reinforcement 2in41.0078.138.0 /ft
Use #6 @ 12", 2s in44.0A /ft
Using an average thickness of 26 inches, the required temperature steel is:
2
y
gs in57.0
60261211.0
fA
11.0A
/ft each direction, both faces
Half should be placed in each face:
2s in29.057.0
21A /ft each direction
Use #5 @ 12", 2
s in31.0A /ft
Dead Load Deflection Plus Prestress Camber The total weight of the superstructure is used for dead load deflections. The gross moment of inertias are used and a computer analysis is run to obtain instantaneous deflections. The results of the computer analysis, (dead load deflections and camber due to prestress) are presented below. Using the long-term multipliers (from Section 4.6 of the PCI Handbook with composite topping), the long-term deflections are calculated as:
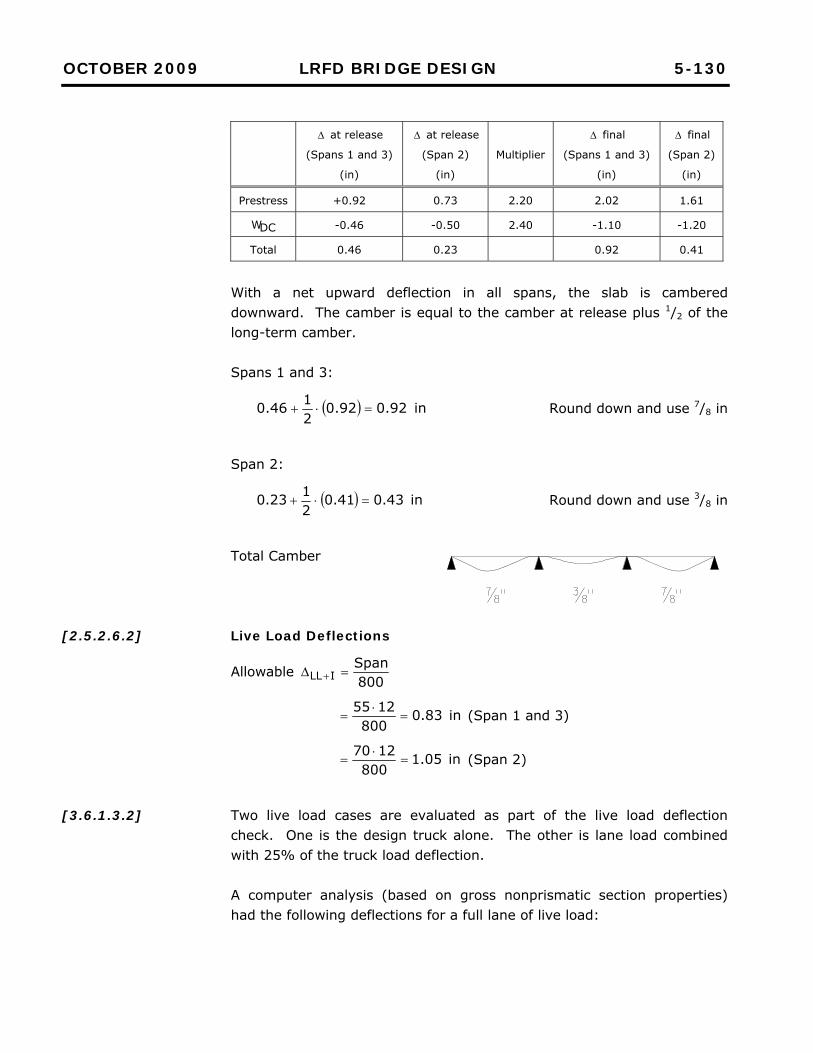
OCTOBER 2009 LRFD BRIDGE DESIGN 5-130
[2.5.2.6.2]
[3.6.1.3.2]
at release
(Spans 1 and 3)
(in)
at release
(Span 2)
(in)
Multiplier
final
(Spans 1 and 3)
(in)
final
(Span 2)
(in)
Prestress +0.92 0.73 2.20 2.02 1.61
DCW -0.46 -0.50 2.40 -1.10 -1.20
Total 0.46 0.23 0.92 0.41
With a net upward deflection in all spans, the slab is cambered downward. The camber is equal to the camber at release plus 1/2 of the long-term camber. Spans 1 and 3:
in92.092.02146.0 Round down and use 7/8 in
Span 2:
in43.041.02123.0 Round down and use 3/8 in
Total Camber Live Load Deflections
Allowable 800Span
ILL
in83.0800
1255
(Span 1 and 3)
in05.1800
1270
(Span 2)
Two live load cases are evaluated as part of the live load deflection check. One is the design truck alone. The other is lane load combined with 25% of the truck load deflection. A computer analysis (based on gross nonprismatic section properties) had the following deflections for a full lane of live load:
OCTOBER 2009 LRFD BRIDGE DESIGN 5-131
U. Anchorage Zone [5.10.9]
[5.10.9.6.2]
Spans 1 and 3: Truck deflection: 6.24 in/lane Lane deflection: 2.59 in/lane Truck check:
truckIM1 (distribution factor) in83.045.0054.024.633.1 OK
Lane/truck check:
lanetruckIM125.0 (distribution factor) in83.025.0054.059.224.633.125.0 OK
Span 2:
Truck deflection: 8.83 in/lane Lane deflection: 3.60 in/lane Truck check:
truckIM1 (distribution factor) in05.163.0054.083.833.1 OK
Lane/truck check:
lanetruckIM125.0 (distribution factor) in05.135.0054.060.383.833.125.0 OK
Anchorages are designed at the strength limit state for the factored jacking force. Due to the simplicity of the geometry of the anchorage and the lack of substantial deviation in the force flow path, the approximate procedure described in LRFD Article 5.10.9.6 is used. For a 12- 0.6" diameter strand tendon, use a square anchorage plate with a side dimension of 12.875 inches (a and b). Assume a duct outer diameter of 6.25 inches. General Zone Compressive Stresses Determine the allowable concrete compressive stress from:
t1
b11A
KP6.0f
effcb
uca
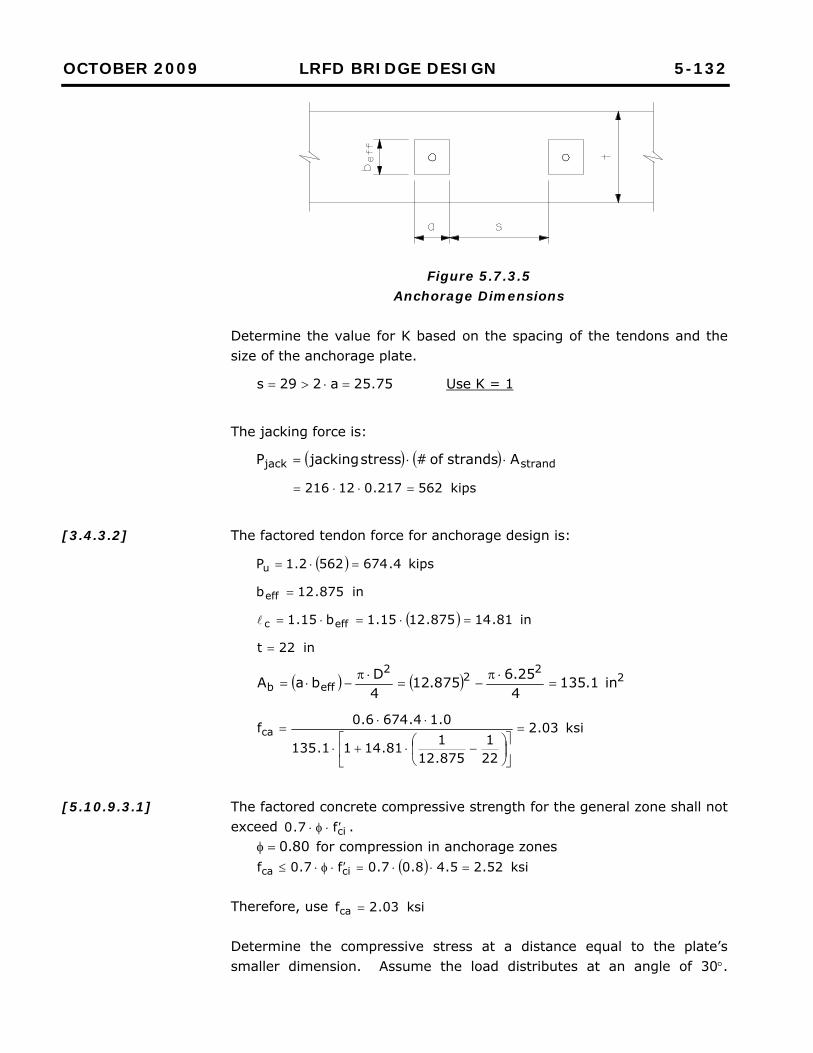
OCTOBER 2009 LRFD BRIDGE DESIGN 5-132
[3.4.3.2]
[5.10.9.3.1]
Figure 5.7.3.5
Anchorage Dimensions Determine the value for K based on the spacing of the tendons and the size of the anchorage plate.
75.25a229s Use K = 1
The jacking force is:
strandjack Astrands of #stress jackingP
kips562217.012216
The factored tendon force for anchorage design is:
kips4.6745622.1Pu
in875.12beff
in81.14875.1215.1b15.1 effc
in22t
22
22
effb in1.135425.6875.12
4DbaA
ksi03.2
221
875.12181.1411.135
0.14.6746.0fca
The factored concrete compressive strength for the general zone shall not exceed cif7.0 .
80.0 for compression in anchorage zones ksi52.25.48.07.0f7.0f cica
Therefore, use ksi03.2fca Determine the compressive stress at a distance equal to the plate’s smaller dimension. Assume the load distributes at an angle of 30.
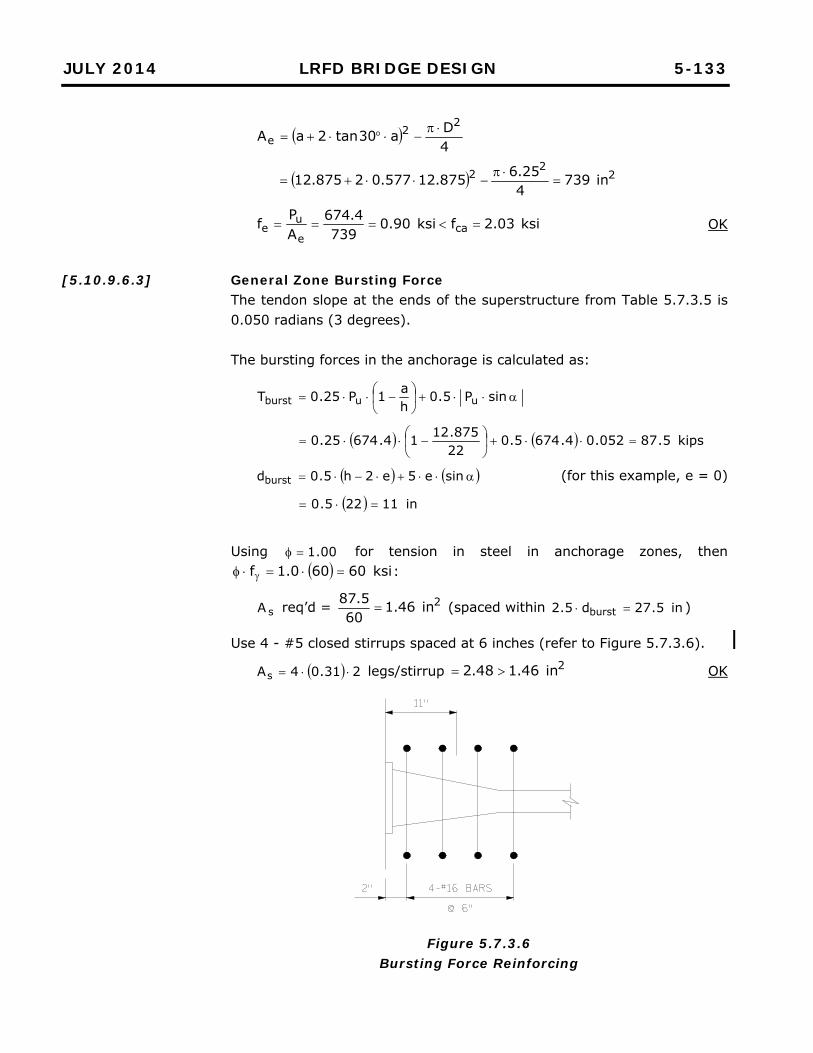
JULY 2014 LRFD BRIDGE DESIGN 5-133
[5.10.9.6.3]
4Da30tan2aA
22
e
22
2 in739425.6875.12577.02875.12
ksi03.2fksi90.0739
4.674APf ca
e
ue OK
General Zone Bursting Force The tendon slope at the ends of the superstructure from Table 5.7.3.5 is 0.050 radians (3 degrees). The bursting forces in the anchorage is calculated as:
sinP5.0ha1P25.0T uuburst
kips5.87052.04.6745.022875.1214.67425.0
sine5e2h5.0dburst (for this example, e = 0)
in11225.0
Using 00.1 for tension in steel in anchorage zones, then
ksi60600.1f :
sA req’d = 2in46.160
5.87 (spaced within in5.27d5.2 burst )
Use 4 - #5 closed stirrups spaced at 6 inches (refer to Figure 5.7.3.6).
231.04As legs/stirrup 2in46.148.2 OK
Figure 5.7.3.6
Bursting Force Reinforcing
JULY 2014 LRFD BRIDGE DESIGN 5-134
[5.10.9.3.2]
V. Summary of Final Design
General Zone Edge Tension Forces Edge tension forces are the tensile forces in the anchorage zone acting close to the transverse edge (spalling forces) and longitudinal edges (longitudinal edge tension forces). For the case of a concentrically loaded anchorage zone, the longitudinal edge tension forces are insignificant, and the magnitude of the design spalling force may be taken as 2% of the total post-tensioning force.
Spalling Force kips5.134.67402.0
Using ksi60600.1fy :
sA req’d 2in22.060
5.13
Use 2- #5 bars, 2
s in62.0A
A summary of the primary reinforcement for the slab is provided in Figure 5.7.3.7. A typical transverse half section is illustrated for the midspan section and for the section over the piers.
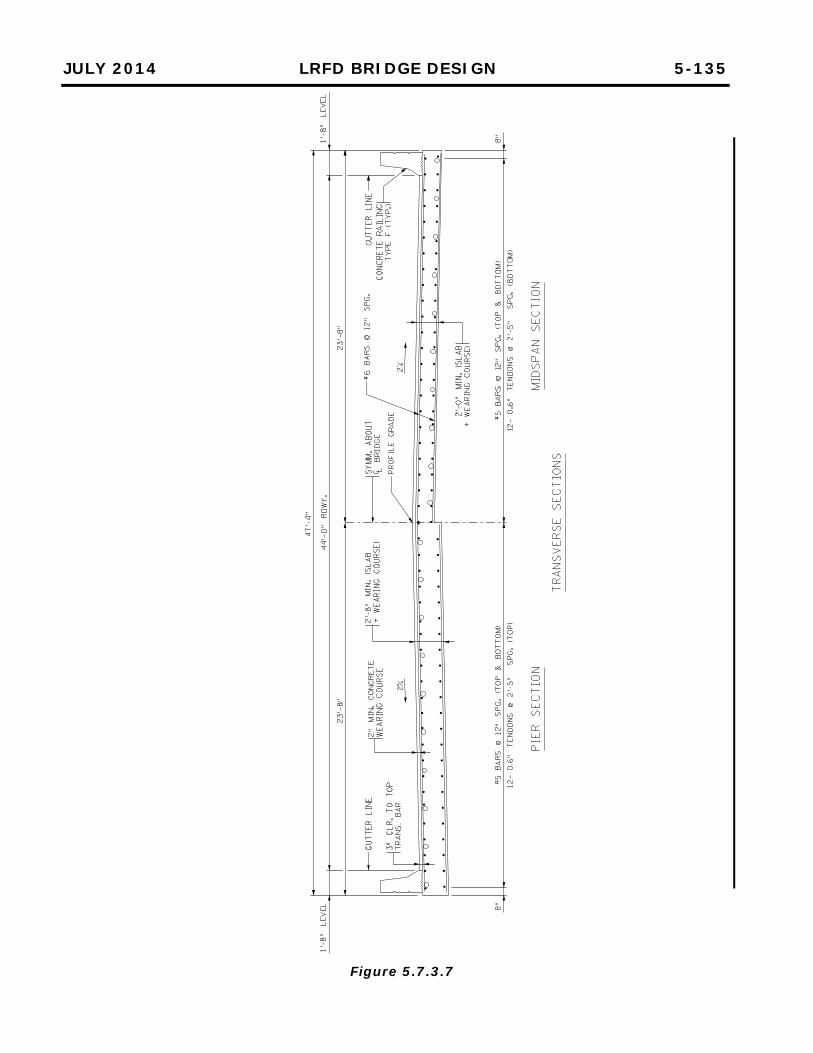
JULY 2014 LRFD BRIDGE DESIGN 5-135
Figure 5.7.3.7

OCTOBER 2009 LRFD BRIDGE DESIGN 5-136
[ This Page Intentionally Left Blank ]
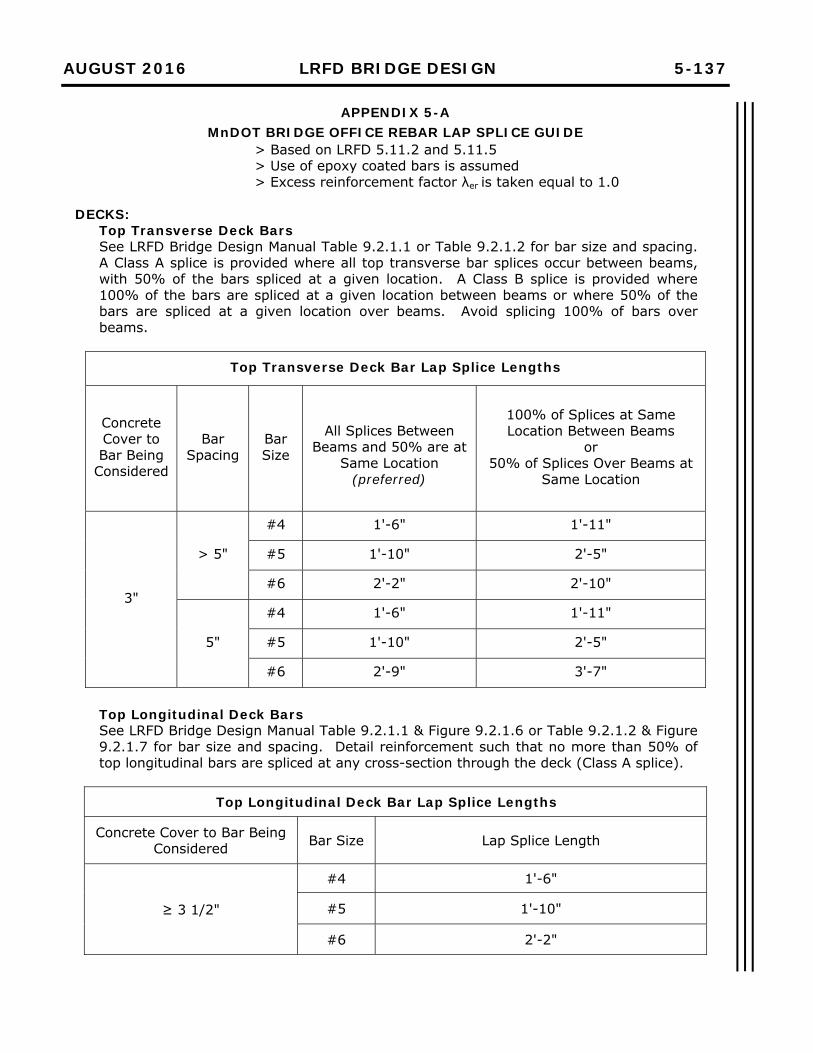
AUGUST 2016 LRFD BRIDGE DESIGN 5-137
APPENDIX 5-A MnDOT BRIDGE OFFICE REBAR LAP SPLICE GUIDE
> Based on LRFD 5.11.2 and 5.11.5 > Use of epoxy coated bars is assumed > Excess reinforcement factor λer is taken equal to 1.0
DECKS:
Top Transverse Deck Bars See LRFD Bridge Design Manual Table 9.2.1.1 or Table 9.2.1.2 for bar size and spacing. A Class A splice is provided where all top transverse bar splices occur between beams, with 50% of the bars spliced at a given location. A Class B splice is provided where 100% of the bars are spliced at a given location between beams or where 50% of the bars are spliced at a given location over beams. Avoid splicing 100% of bars over beams.
Top Transverse Deck Bar Lap Splice Lengths
Concrete Cover to Bar Being
Considered
Bar Spacing
Bar Size
All Splices Between
Beams and 50% are at Same Location
(preferred)
100% of Splices at Same Location Between Beams
or 50% of Splices Over Beams at
Same Location
3"
> 5"
#4 1'-6" 1'-11"
#5 1'-10" 2'-5"
#6 2'-2" 2'-10"
5"
#4 1'-6" 1'-11"
#5 1'-10" 2'-5"
#6 2'-9" 3'-7"
Top Longitudinal Deck Bars See LRFD Bridge Design Manual Table 9.2.1.1 & Figure 9.2.1.6 or Table 9.2.1.2 & Figure 9.2.1.7 for bar size and spacing. Detail reinforcement such that no more than 50% of top longitudinal bars are spliced at any cross-section through the deck (Class A splice).
Top Longitudinal Deck Bar Lap Splice Lengths
Concrete Cover to Bar Being Considered Bar Size Lap Splice Length
≥ 3 1/2"
#4 1'-6"
#5 1'-10"
#6 2'-2"
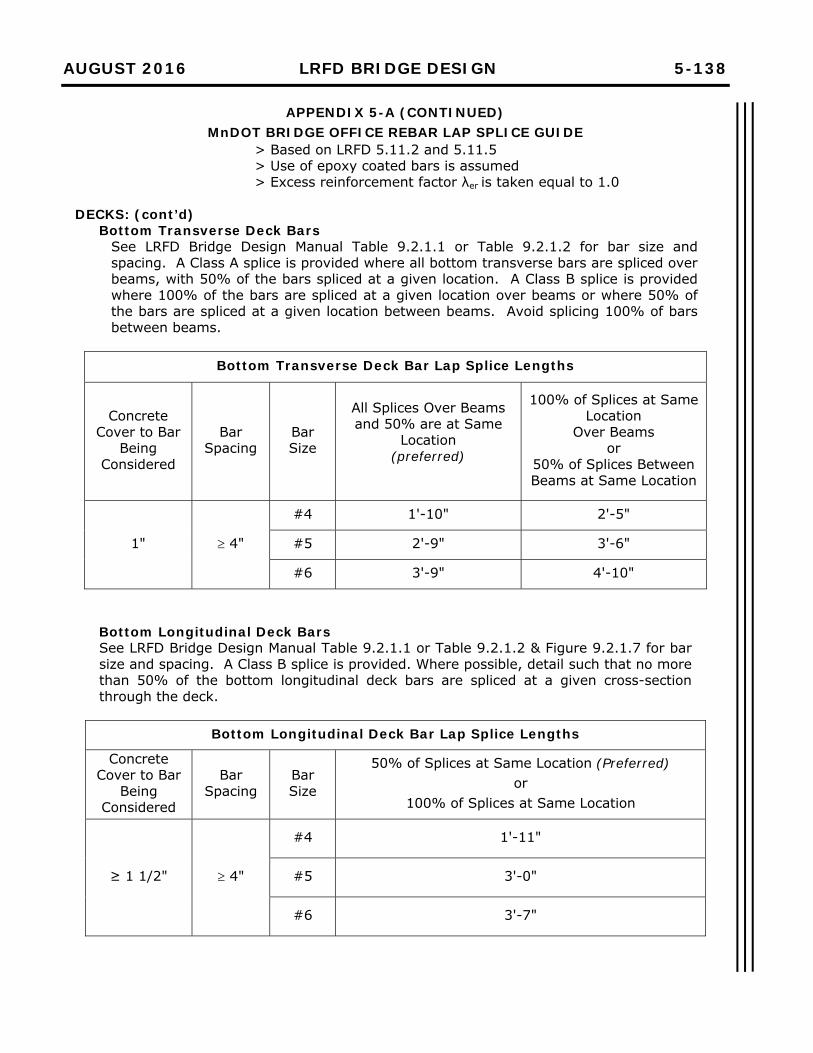
AUGUST 2016 LRFD BRIDGE DESIGN 5-138
APPENDIX 5-A (CONTINUED) MnDOT BRIDGE OFFICE REBAR LAP SPLICE GUIDE
> Based on LRFD 5.11.2 and 5.11.5 > Use of epoxy coated bars is assumed > Excess reinforcement factor λer is taken equal to 1.0
DECKS: (cont’d)
Bottom Transverse Deck Bars See LRFD Bridge Design Manual Table 9.2.1.1 or Table 9.2.1.2 for bar size and spacing. A Class A splice is provided where all bottom transverse bars are spliced over beams, with 50% of the bars spliced at a given location. A Class B splice is provided where 100% of the bars are spliced at a given location over beams or where 50% of the bars are spliced at a given location between beams. Avoid splicing 100% of bars between beams.
Bottom Transverse Deck Bar Lap Splice Lengths
Concrete Cover to Bar
Being Considered
Bar Spacing
Bar Size
All Splices Over Beams and 50% are at Same
Location (preferred)
100% of Splices at Same Location
Over Beams or
50% of Splices Between Beams at Same Location
1" 4"
#4 1'-10" 2'-5"
#5 2'-9" 3'-6"
#6 3'-9" 4'-10"
Bottom Longitudinal Deck Bars See LRFD Bridge Design Manual Table 9.2.1.1 or Table 9.2.1.2 & Figure 9.2.1.7 for bar size and spacing. A Class B splice is provided. Where possible, detail such that no more than 50% of the bottom longitudinal deck bars are spliced at a given cross-section through the deck.
Bottom Longitudinal Deck Bar Lap Splice Lengths
Concrete Cover to Bar
Being Considered
Bar Spacing
Bar Size
50% of Splices at Same Location (Preferred) or
100% of Splices at Same Location
≥ 1 1/2" 4"
#4 1'-11"
#5 3'-0"
#6 3'-7"
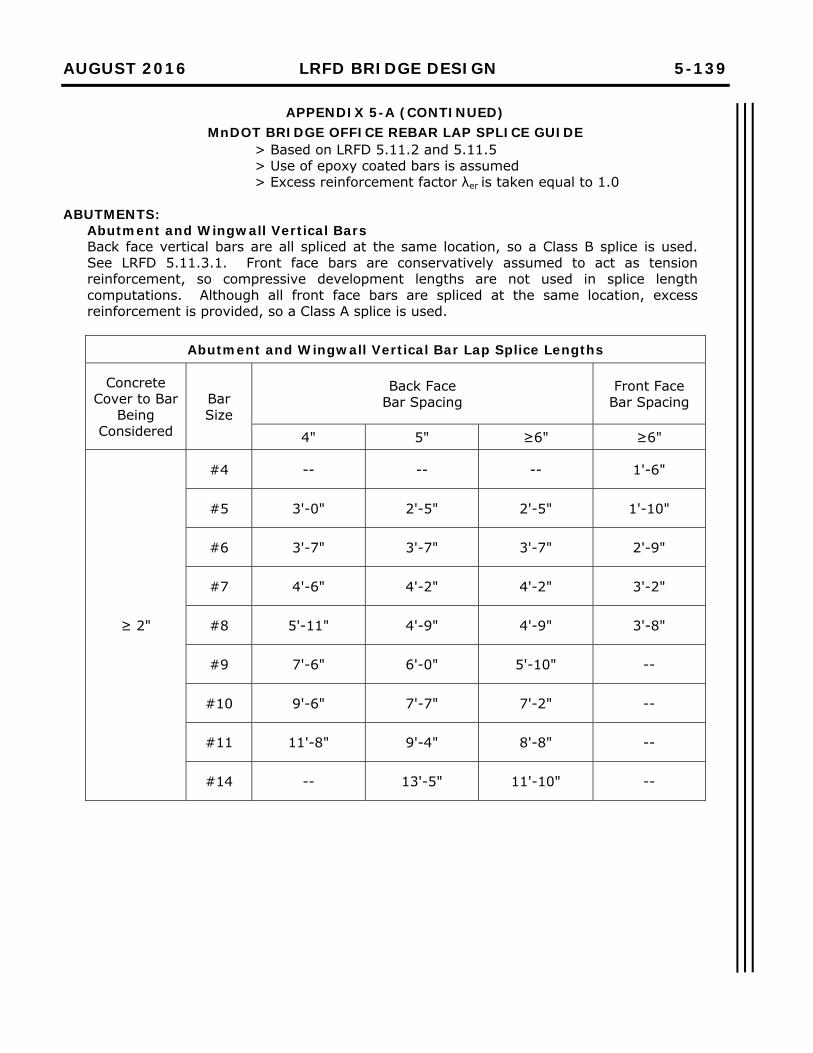
AUGUST 2016 LRFD BRIDGE DESIGN 5-139
APPENDIX 5-A (CONTINUED) MnDOT BRIDGE OFFICE REBAR LAP SPLICE GUIDE
> Based on LRFD 5.11.2 and 5.11.5 > Use of epoxy coated bars is assumed > Excess reinforcement factor λer is taken equal to 1.0
ABUTMENTS:
Abutment and Wingwall Vertical Bars Back face vertical bars are all spliced at the same location, so a Class B splice is used. See LRFD 5.11.3.1. Front face bars are conservatively assumed to act as tension reinforcement, so compressive development lengths are not used in splice length computations. Although all front face bars are spliced at the same location, excess reinforcement is provided, so a Class A splice is used.
Abutment and Wingwall Vertical Bar Lap Splice Lengths
Concrete Cover to Bar
Being Considered
Bar Size
Back Face Bar Spacing
Front Face Bar Spacing
4" 5" ≥6" ≥6"
≥ 2"
#4 -- -- -- 1'-6"
#5 3'-0" 2'-5" 2'-5" 1'-10"
#6 3'-7" 3'-7" 3'-7" 2'-9"
#7 4'-6" 4'-2" 4'-2" 3'-2"
#8 5'-11" 4'-9" 4'-9" 3'-8"
#9 7'-6" 6'-0" 5'-10" --
#10 9'-6" 7'-7" 7'-2" --
#11 11'-8" 9'-4" 8'-8" --
#14 -- 13'-5" 11'-10" --
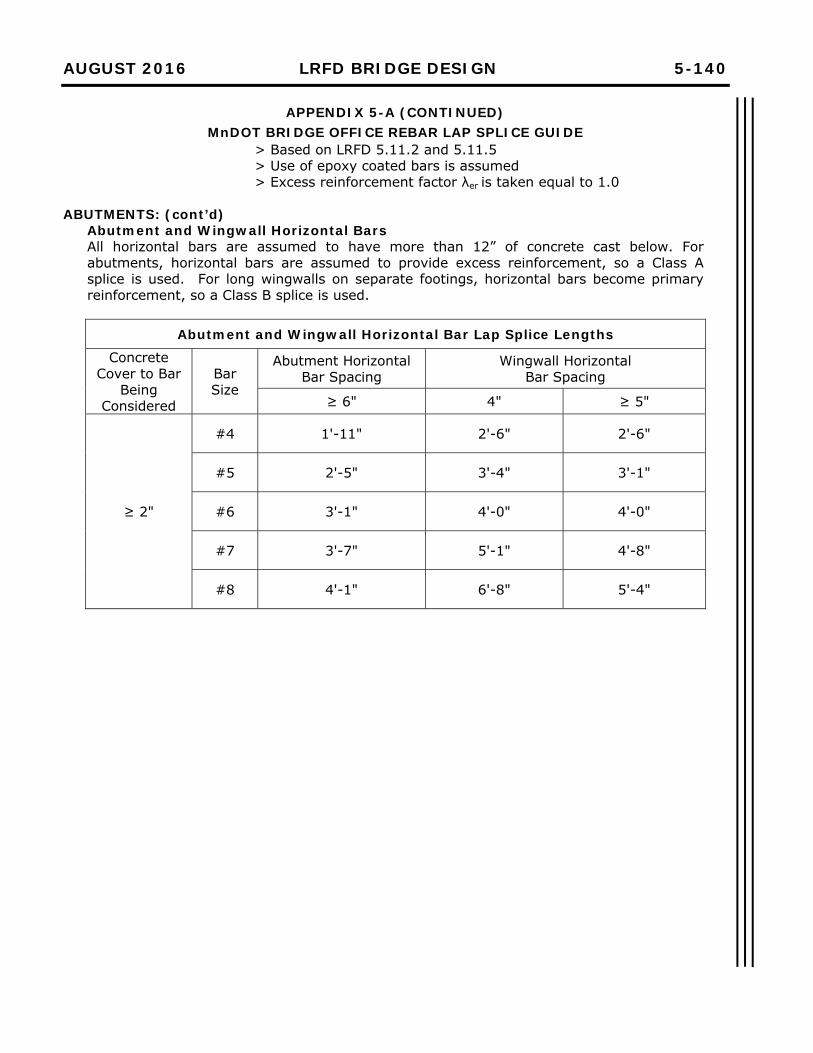
AUGUST 2016 LRFD BRIDGE DESIGN 5-140
APPENDIX 5-A (CONTINUED) MnDOT BRIDGE OFFICE REBAR LAP SPLICE GUIDE
> Based on LRFD 5.11.2 and 5.11.5 > Use of epoxy coated bars is assumed > Excess reinforcement factor λer is taken equal to 1.0
ABUTMENTS: (cont’d)
Abutment and Wingwall Horizontal Bars All horizontal bars are assumed to have more than 12” of concrete cast below. For abutments, horizontal bars are assumed to provide excess reinforcement, so a Class A splice is used. For long wingwalls on separate footings, horizontal bars become primary reinforcement, so a Class B splice is used.
Abutment and Wingwall Horizontal Bar Lap Splice Lengths
Concrete Cover to Bar
Being Considered
Bar Size
Abutment Horizontal Bar Spacing
Wingwall Horizontal Bar Spacing
≥ 6" 4" ≥ 5"
≥ 2"
#4 1'-11" 2'-6" 2'-6"
#5 2'-5" 3'-4" 3'-1"
#6 3'-1" 4'-0" 4'-0"
#7 3'-7" 5'-1" 4'-8"
#8 4'-1" 6'-8" 5'-4"
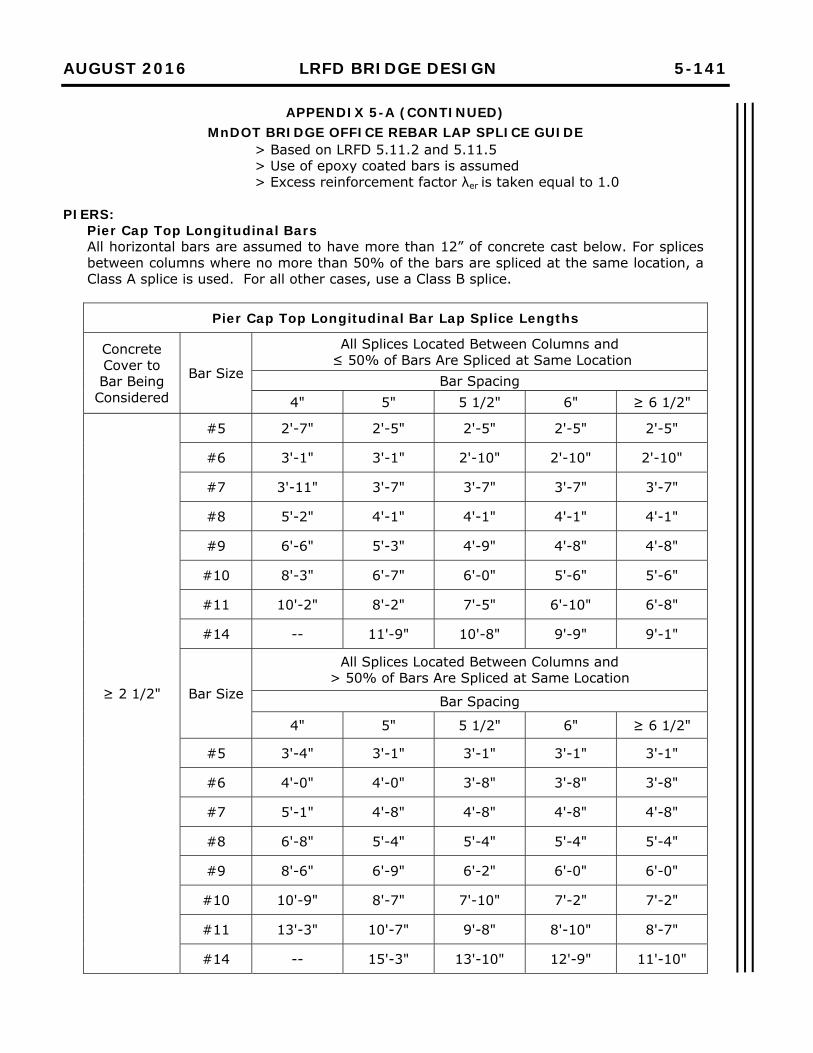
AUGUST 2016 LRFD BRIDGE DESIGN 5-141
APPENDIX 5-A (CONTINUED) MnDOT BRIDGE OFFICE REBAR LAP SPLICE GUIDE
> Based on LRFD 5.11.2 and 5.11.5 > Use of epoxy coated bars is assumed > Excess reinforcement factor λer is taken equal to 1.0
PIERS:
Pier Cap Top Longitudinal Bars All horizontal bars are assumed to have more than 12” of concrete cast below. For splices between columns where no more than 50% of the bars are spliced at the same location, a Class A splice is used. For all other cases, use a Class B splice.
Pier Cap Top Longitudinal Bar Lap Splice Lengths
Concrete Cover to Bar Being
Considered
Bar Size
All Splices Located Between Columns and ≤ 50% of Bars Are Spliced at Same Location
Bar Spacing 4" 5" 5 1/2" 6" ≥ 6 1/2"
≥ 2 1/2"
#5 2'-7" 2'-5" 2'-5" 2'-5" 2'-5"
#6 3'-1" 3'-1" 2'-10" 2'-10" 2'-10"
#7 3'-11" 3'-7" 3'-7" 3'-7" 3'-7"
#8 5'-2" 4'-1" 4'-1" 4'-1" 4'-1"
#9 6'-6" 5'-3" 4'-9" 4'-8" 4'-8"
#10 8'-3" 6'-7" 6'-0" 5'-6" 5'-6"
#11 10'-2" 8'-2" 7'-5" 6'-10" 6'-8"
#14 -- 11'-9" 10'-8" 9'-9" 9'-1"
Bar Size
All Splices Located Between Columns and > 50% of Bars Are Spliced at Same Location
Bar Spacing
4" 5" 5 1/2" 6" ≥ 6 1/2"
#5 3'-4" 3'-1" 3'-1" 3'-1" 3'-1"
#6 4'-0" 4'-0" 3'-8" 3'-8" 3'-8"
#7 5'-1" 4'-8" 4'-8" 4'-8" 4'-8"
#8 6'-8" 5'-4" 5'-4" 5'-4" 5'-4"
#9 8'-6" 6'-9" 6'-2" 6'-0" 6'-0"
#10 10'-9" 8'-7" 7'-10" 7'-2" 7'-2"
#11 13'-3" 10'-7" 9'-8" 8'-10" 8'-7"
#14 -- 15'-3" 13'-10" 12'-9" 11'-10"
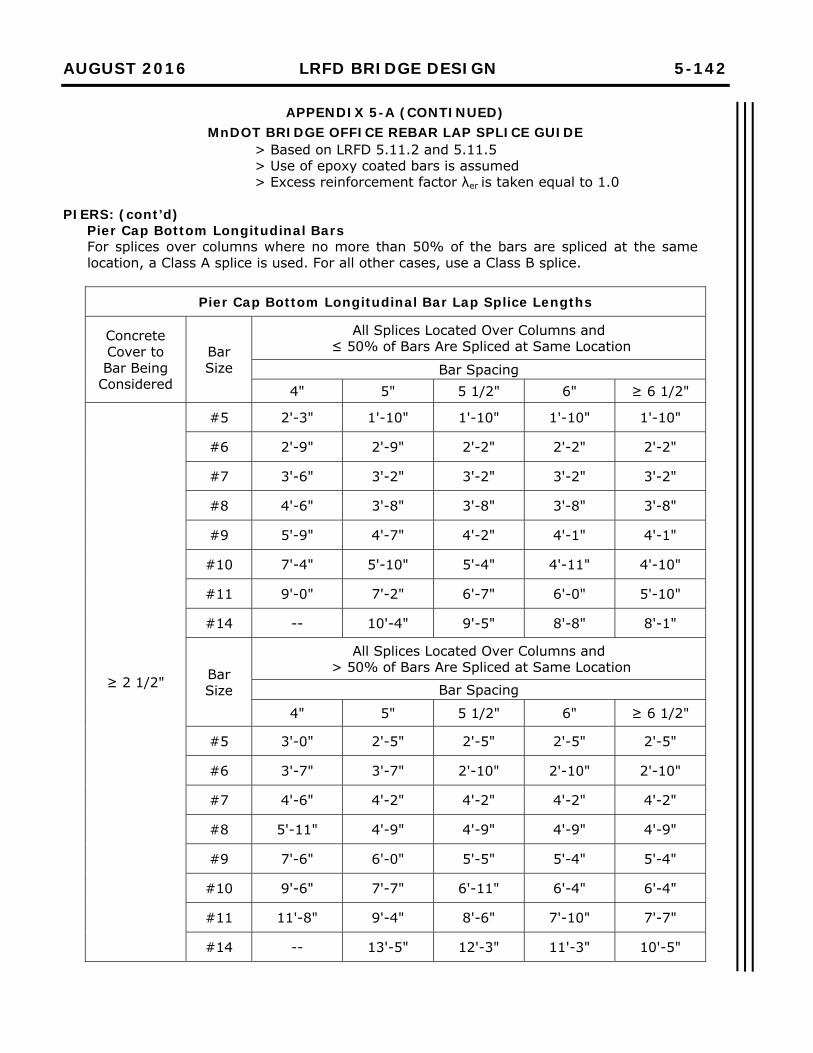
AUGUST 2016 LRFD BRIDGE DESIGN 5-142
APPENDIX 5-A (CONTINUED) MnDOT BRIDGE OFFICE REBAR LAP SPLICE GUIDE
> Based on LRFD 5.11.2 and 5.11.5 > Use of epoxy coated bars is assumed > Excess reinforcement factor λer is taken equal to 1.0
PIERS: (cont’d)
Pier Cap Bottom Longitudinal Bars For splices over columns where no more than 50% of the bars are spliced at the same location, a Class A splice is used. For all other cases, use a Class B splice.
Pier Cap Bottom Longitudinal Bar Lap Splice Lengths
Concrete Cover to Bar Being
Considered
Bar Size
All Splices Located Over Columns and ≤ 50% of Bars Are Spliced at Same Location
Bar Spacing 4" 5" 5 1/2" 6" ≥ 6 1/2"
≥ 2 1/2"
#5 2'-3" 1'-10" 1'-10" 1'-10" 1'-10"
#6 2'-9" 2'-9" 2'-2" 2'-2" 2'-2"
#7 3'-6" 3'-2" 3'-2" 3'-2" 3'-2"
#8 4'-6" 3'-8" 3'-8" 3'-8" 3'-8"
#9 5'-9" 4'-7" 4'-2" 4'-1" 4'-1"
#10 7'-4" 5'-10" 5'-4" 4'-11" 4'-10"
#11 9'-0" 7'-2" 6'-7" 6'-0" 5'-10"
#14 -- 10'-4" 9'-5" 8'-8" 8'-1"
Bar Size
All Splices Located Over Columns and > 50% of Bars Are Spliced at Same Location
Bar Spacing
4" 5" 5 1/2" 6" ≥ 6 1/2"
#5 3'-0" 2'-5" 2'-5" 2'-5" 2'-5"
#6 3'-7" 3'-7" 2'-10" 2'-10" 2'-10"
#7 4'-6" 4'-2" 4'-2" 4'-2" 4'-2"
#8 5'-11" 4'-9" 4'-9" 4'-9" 4'-9"
#9 7'-6" 6'-0" 5'-5" 5'-4" 5'-4"
#10 9'-6" 7'-7" 6'-11" 6'-4" 6'-4"
#11 11'-8" 9'-4" 8'-6" 7'-10" 7'-7"
#14 -- 13'-5" 12'-3" 11'-3" 10'-5"
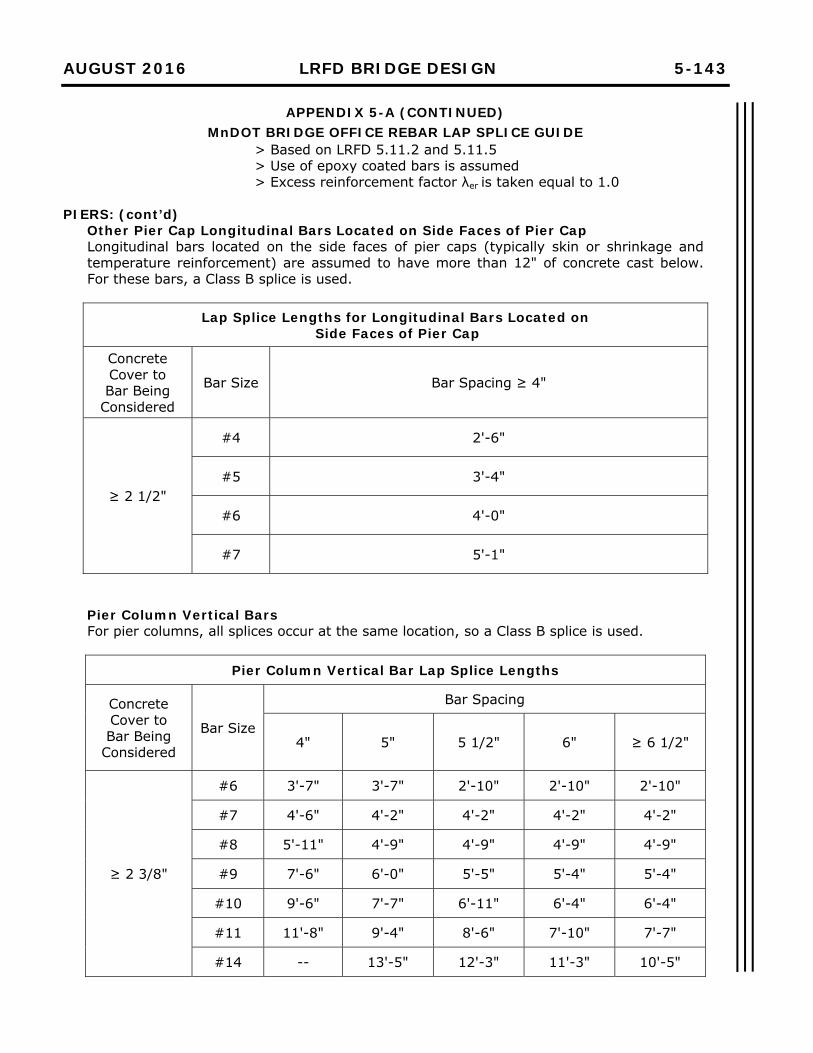
AUGUST 2016 LRFD BRIDGE DESIGN 5-143
APPENDIX 5-A (CONTINUED) MnDOT BRIDGE OFFICE REBAR LAP SPLICE GUIDE
> Based on LRFD 5.11.2 and 5.11.5 > Use of epoxy coated bars is assumed > Excess reinforcement factor λer is taken equal to 1.0
PIERS: (cont’d)
Other Pier Cap Longitudinal Bars Located on Side Faces of Pier Cap Longitudinal bars located on the side faces of pier caps (typically skin or shrinkage and temperature reinforcement) are assumed to have more than 12" of concrete cast below. For these bars, a Class B splice is used.
Lap Splice Lengths for Longitudinal Bars Located on
Side Faces of Pier Cap
Concrete Cover to Bar Being
Considered
Bar Size Bar Spacing ≥ 4"
≥ 2 1/2"
#4 2'-6"
#5 3'-4"
#6 4'-0"
#7 5'-1"
Pier Column Vertical Bars For pier columns, all splices occur at the same location, so a Class B splice is used.
Pier Column Vertical Bar Lap Splice Lengths
Concrete Cover to Bar Being
Considered
Bar Size
Bar Spacing
4" 5" 5 1/2" 6" ≥ 6 1/2"
≥ 2 3/8"
#6 3'-7" 3'-7" 2'-10" 2'-10" 2'-10"
#7 4'-6" 4'-2" 4'-2" 4'-2" 4'-2"
#8 5'-11" 4'-9" 4'-9" 4'-9" 4'-9"
#9 7'-6" 6'-0" 5'-5" 5'-4" 5'-4"
#10 9'-6" 7'-7" 6'-11" 6'-4" 6'-4"
#11 11'-8" 9'-4" 8'-6" 7'-10" 7'-7"
#14 -- 13'-5" 12'-3" 11'-3" 10'-5"
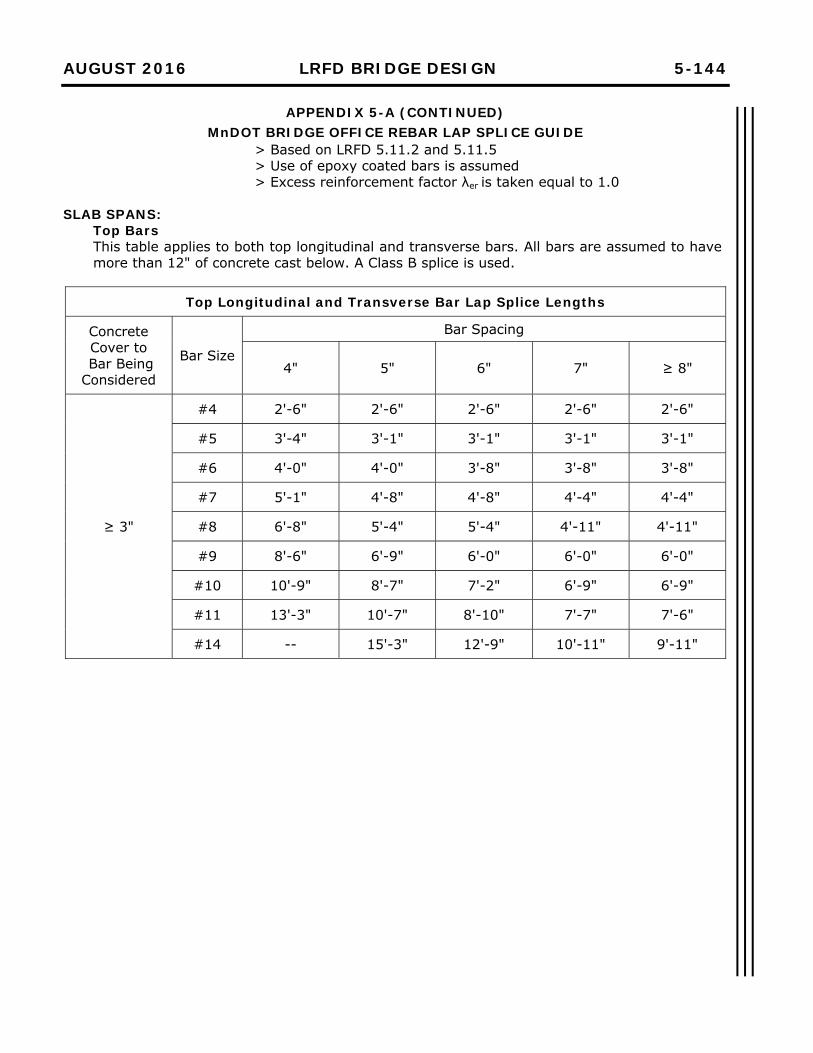
AUGUST 2016 LRFD BRIDGE DESIGN 5-144
APPENDIX 5-A (CONTINUED) MnDOT BRIDGE OFFICE REBAR LAP SPLICE GUIDE
> Based on LRFD 5.11.2 and 5.11.5 > Use of epoxy coated bars is assumed > Excess reinforcement factor λer is taken equal to 1.0
SLAB SPANS:
Top Bars This table applies to both top longitudinal and transverse bars. All bars are assumed to have more than 12" of concrete cast below. A Class B splice is used.
Top Longitudinal and Transverse Bar Lap Splice Lengths
Concrete Cover to
Bar Being Considered
Bar Size
Bar Spacing
4" 5" 6" 7" ≥ 8"
≥ 3"
#4 2'-6" 2'-6" 2'-6" 2'-6" 2'-6"
#5 3'-4" 3'-1" 3'-1" 3'-1" 3'-1"
#6 4'-0" 4'-0" 3'-8" 3'-8" 3'-8"
#7 5'-1" 4'-8" 4'-8" 4'-4" 4'-4"
#8 6'-8" 5'-4" 5'-4" 4'-11" 4'-11"
#9 8'-6" 6'-9" 6'-0" 6'-0" 6'-0"
#10 10'-9" 8'-7" 7'-2" 6'-9" 6'-9"
#11 13'-3" 10'-7" 8'-10" 7'-7" 7'-6"
#14 -- 15'-3" 12'-9" 10'-11" 9'-11"
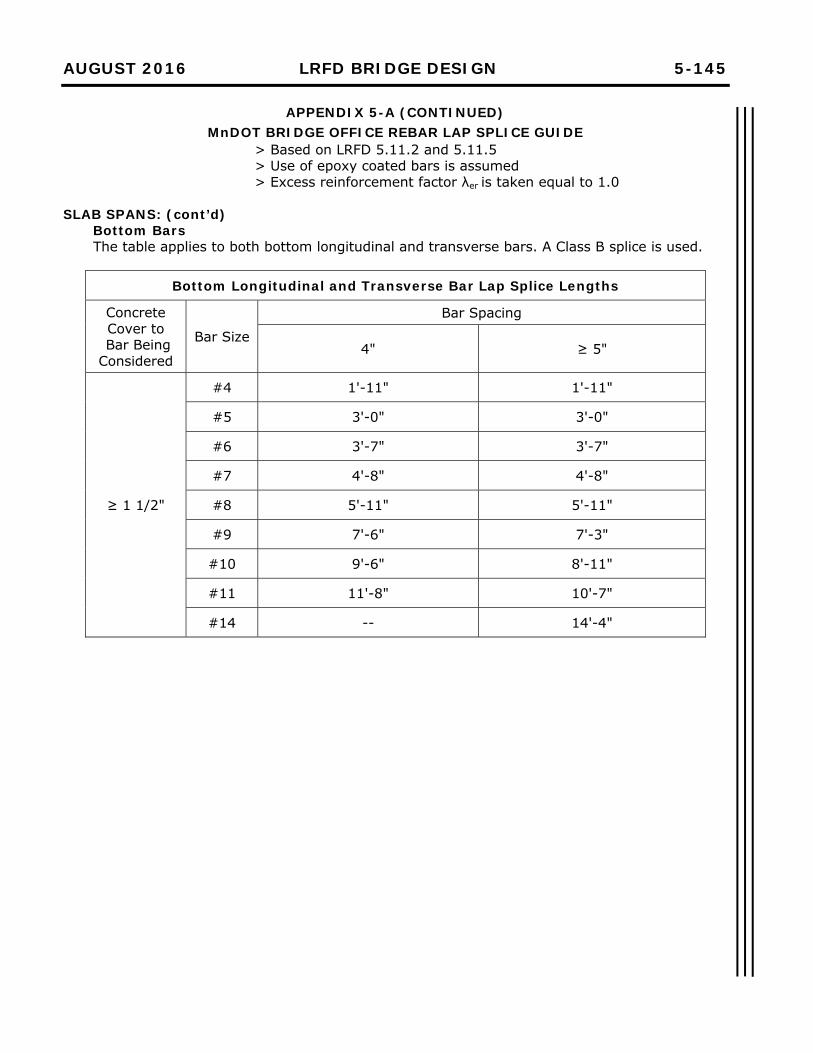
AUGUST 2016 LRFD BRIDGE DESIGN 5-145
APPENDIX 5-A (CONTINUED) MnDOT BRIDGE OFFICE REBAR LAP SPLICE GUIDE
> Based on LRFD 5.11.2 and 5.11.5 > Use of epoxy coated bars is assumed > Excess reinforcement factor λer is taken equal to 1.0
SLAB SPANS: (cont’d)
Bottom Bars The table applies to both bottom longitudinal and transverse bars. A Class B splice is used.
Bottom Longitudinal and Transverse Bar Lap Splice Lengths
Concrete Cover to
Bar Being Considered
Bar Size
Bar Spacing
4" ≥ 5"
≥ 1 1/2"
#4 1'-11" 1'-11"
#5 3'-0" 3'-0"
#6 3'-7" 3'-7"
#7 4'-8" 4'-8"
#8 5'-11" 5'-11"
#9 7'-6" 7'-3"
#10 9'-6" 8'-11"
#11 11'-8" 10'-7"
#14 -- 14'-4"

AUGUST 2016 LRFD BRIDGE DESIGN 5-146
[ This Page Intentionally Left Blank ]