Embed Size (px)
Citation preview
Investor Presentation
July 08,2011
2
Disclaimer
Certain statements in these slides are forward-looking statements. These
statements are based on management's current expectations and are subject
to uncertainty and changes in circumstances.
Please also refer to the statement of quarterly financial results required by
Indian regulations that has been filed with the stock exchanges in India where
IndusInd Bank’s equity shares are listed and is available on our website
www.indusind.com.
3
Theme for Planning Cycle II - 2011-14 – ‘Invest to grow’ phase
Scale with Profitability
4
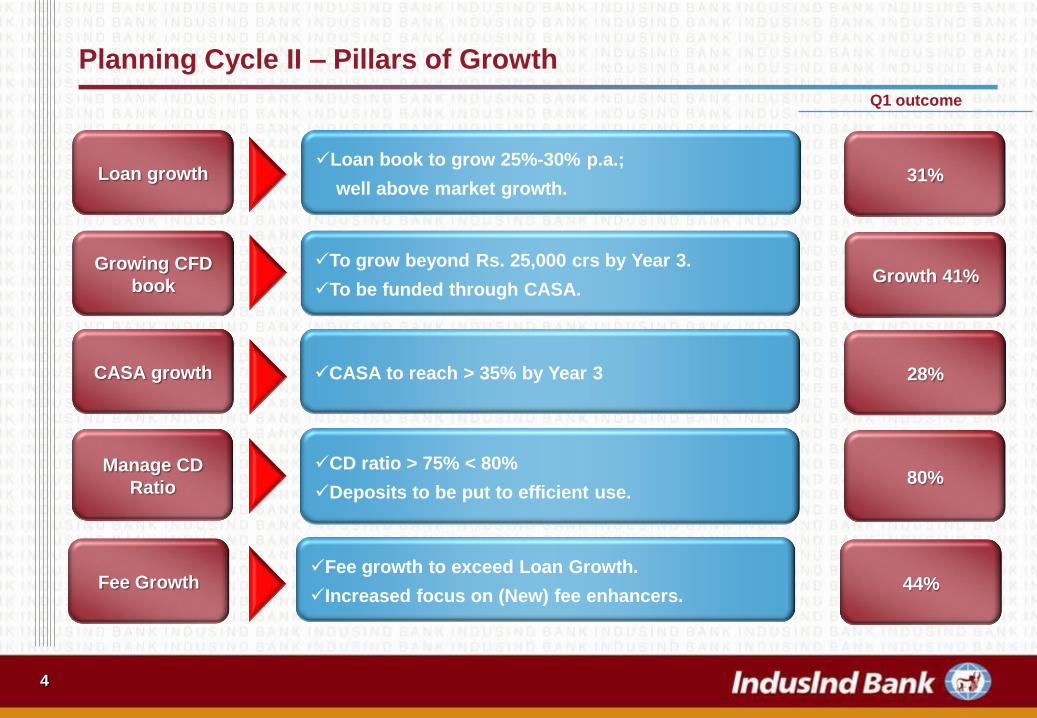
Planning Cycle II – Pillars of Growth
Growing CFD
book
To grow beyond Rs. 25,000 crs by Year 3.
To be funded through CASA.
CASA growth CASA to reach > 35% by Year 3
Manage CD
Ratio
CD ratio > 75% < 80%
Deposits to be put to efficient use.
Fee GrowthFee growth to exceed Loan Growth.
Increased focus on (New) fee enhancers.
Loan growthLoan book to grow 25%-30% p.a.;
well above market growth.
Growth 41%
28%
80%
44%
31%
Q1 outcome
5
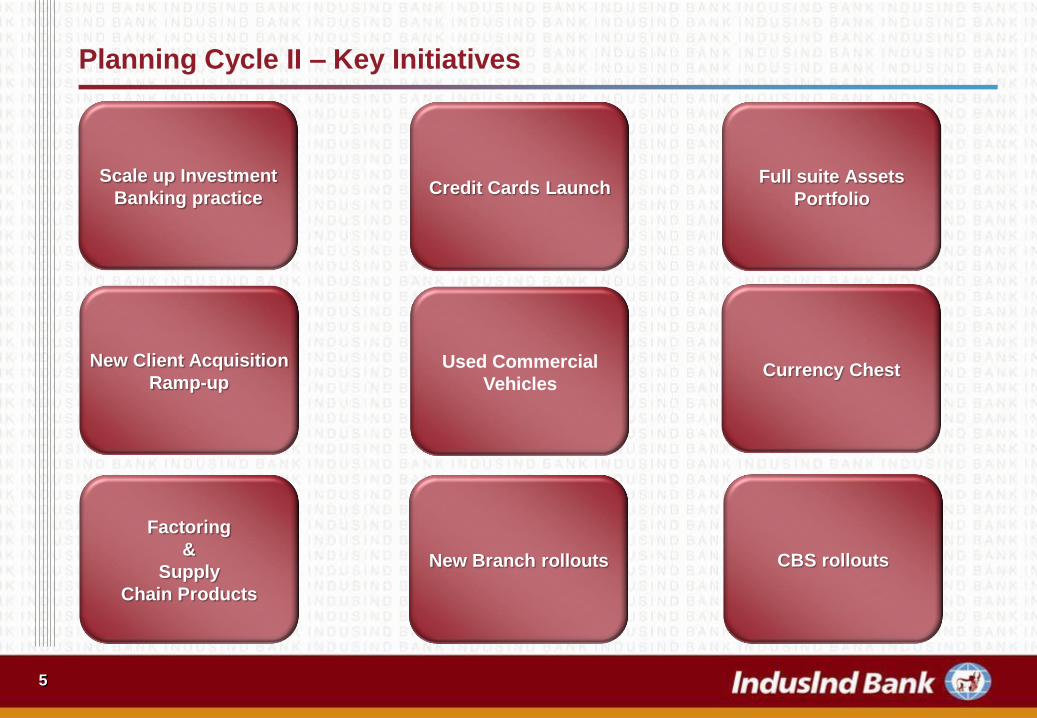
Planning Cycle II – Key Initiatives
Used Commercial
Vehicles
Scale up Investment
Banking practiceCredit Cards Launch
Full suite Assets
Portfolio
New Client Acquisition
Ramp-upCurrency Chest
Factoring
&
Supply
Chain Products
New Branch rollouts CBS rollouts
6
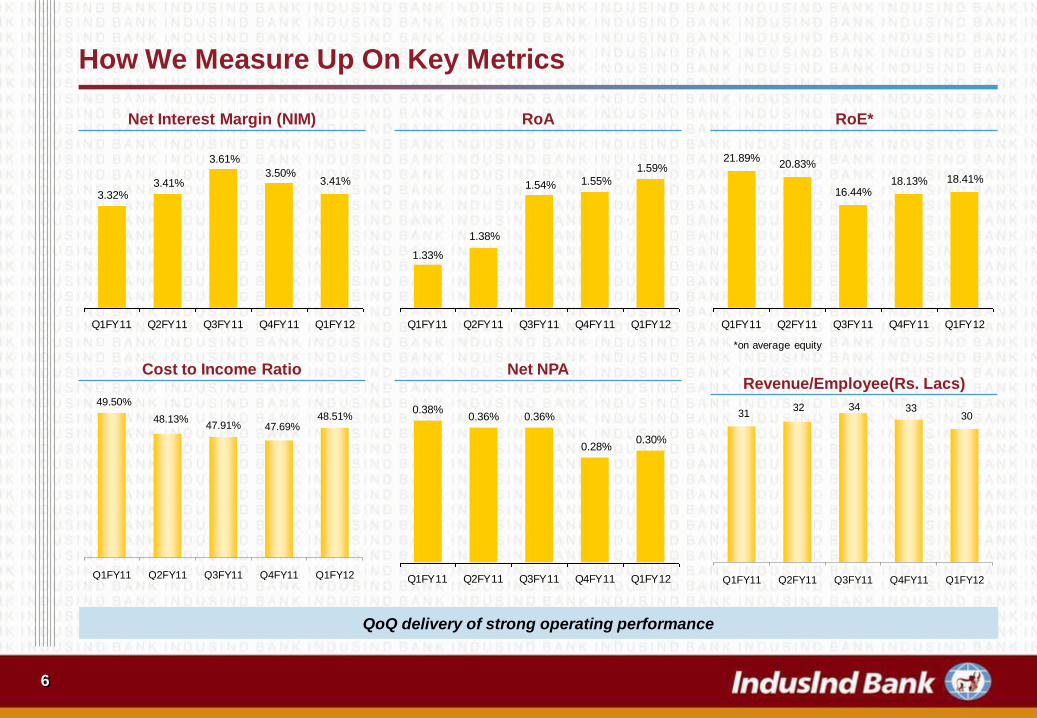
How We Measure Up On Key Metrics
Net Interest Margin (NIM) RoA RoE*
Cost to Income Ratio Net NPA
QoQ delivery of strong operating performance
3.41%3.50%
3.61%
3.41%3.32%
Q1FY11 Q2FY11 Q3FY11 Q4FY11 Q1FY12
1.33%
1.38%
1.54% 1.55%
1.59%
Q1FY11 Q2FY11 Q3FY11 Q4FY11 Q1FY12
21.89%20.83%
16.44%18.13% 18.41%
Q1FY11 Q2FY11 Q3FY11 Q4FY11 Q1FY12
49.50%
48.13%47.91% 47.69%
48.51%
Q1FY11 Q2FY11 Q3FY11 Q4FY11 Q1FY12
0.38%
0.30%0.28%
0.36% 0.36%
Q1FY11 Q2FY11 Q3FY11 Q4FY11 Q1FY12
*on average equity
Revenue/Employee(Rs. Lacs)
3132 34 33
30
Q1FY11 Q2FY11 Q3FY11 Q4FY11 Q1FY12
7
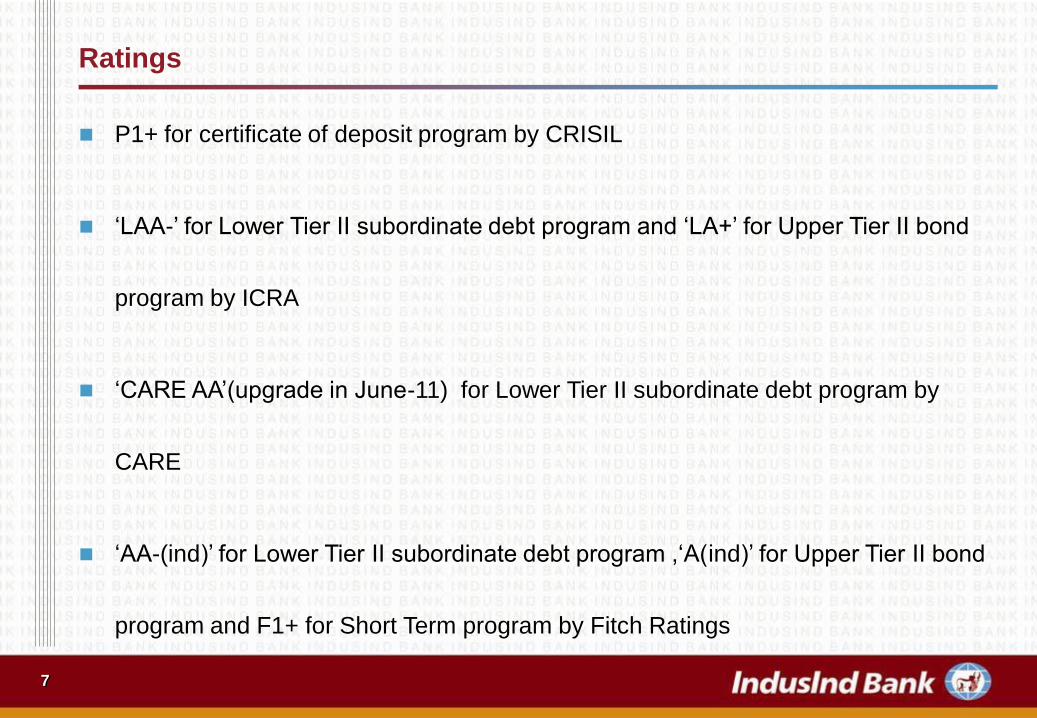
Ratings
P1+ for certificate of deposit program by CRISIL
‘LAA-’ for Lower Tier II subordinate debt program and ‘LA+’ for Upper Tier II bond
program by ICRA
‘CARE AA’(upgrade in June-11) for Lower Tier II subordinate debt program by
CARE
‘AA-(ind)’ for Lower Tier II subordinate debt program ,‘A(ind)’ for Upper Tier II bond
program and F1+ for Short Term program by Fitch Ratings
Financial Performance
9
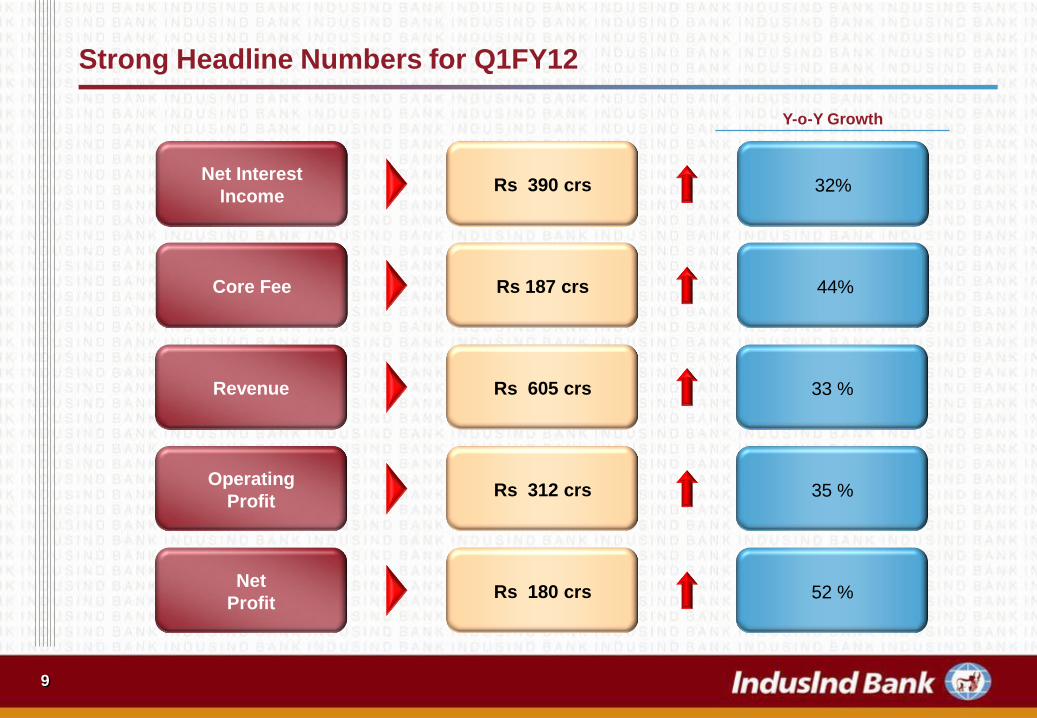
Strong Headline Numbers for Q1FY12
Net Interest
IncomeRs 390 crs 32%
Core Fee Rs 187 crs 44%
Revenue Rs 605 crs 33 %
Operating
ProfitRs 312 crs 35 %
Net
ProfitRs 180 crs 52 %
Y-o-Y Growth
10
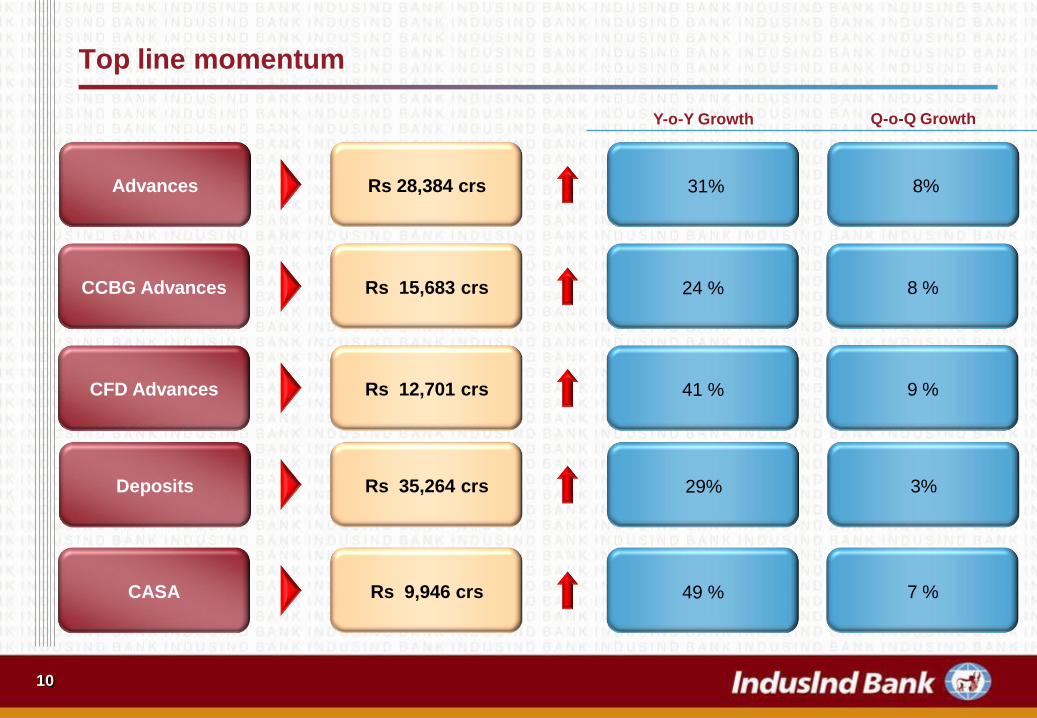
Top line momentum
Advances Rs 28,384 crs 31%
CCBG Advances Rs 15,683 crs 24 %
CFD Advances Rs 12,701 crs 41 %
CASA Rs 9,946 crs 49 %
Y-o-Y Growth
8%
8 %
9 %
7 %
Q-o-Q Growth
Deposits Rs 35,264 crs 29% 3%
11
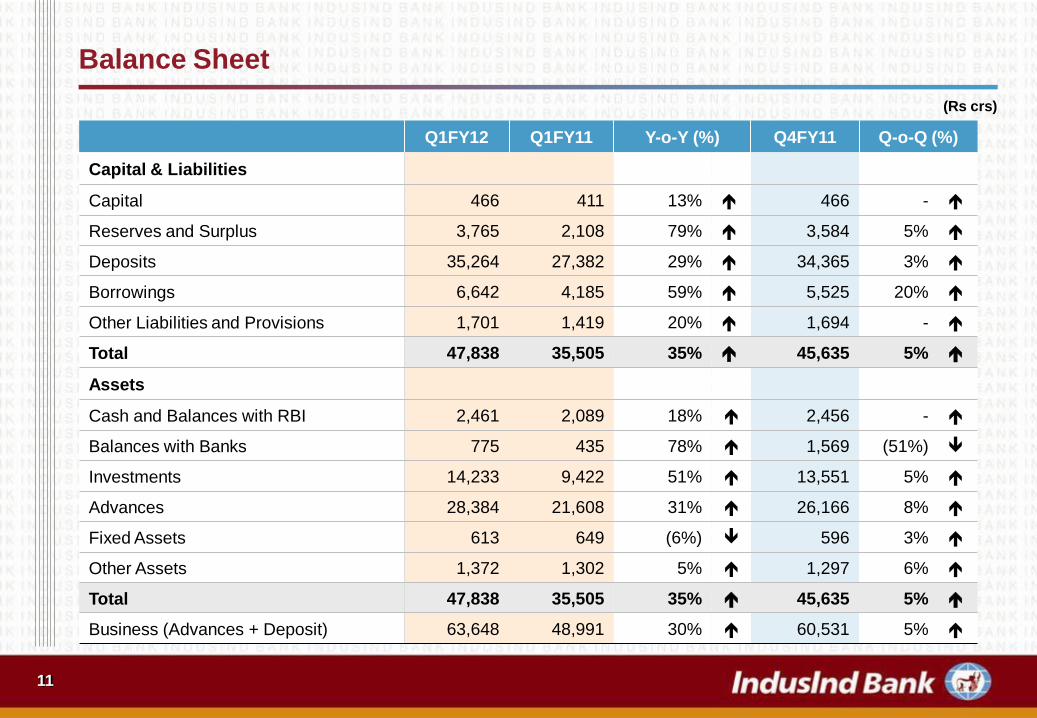
Balance Sheet
Q1FY12 Q1FY11 Y-o-Y (%) Q4FY11 Q-o-Q (%)
Capital & Liabilities
Capital 466 411 13% 466 -
Reserves and Surplus 3,765 2,108 79% 3,584 5%
Deposits 35,264 27,382 29% 34,365 3%
Borrowings 6,642 4,185 59% 5,525 20%
Other Liabilities and Provisions 1,701 1,419 20% 1,694 -
Total 47,838 35,505 35% 45,635 5%
Assets
Cash and Balances with RBI 2,461 2,089 18% 2,456 -
Balances with Banks 775 435 78% 1,569 (51%)
Investments 14,233 9,422 51% 13,551 5%
Advances 28,384 21,608 31% 26,166 8%
Fixed Assets 613 649 (6%) 596 3%
Other Assets 1,372 1,302 5% 1,297 6%
Total 47,838 35,505 35% 45,635 5%
Business (Advances + Deposit) 63,648 48,991 30% 60,531 5%
(Rs crs)
12
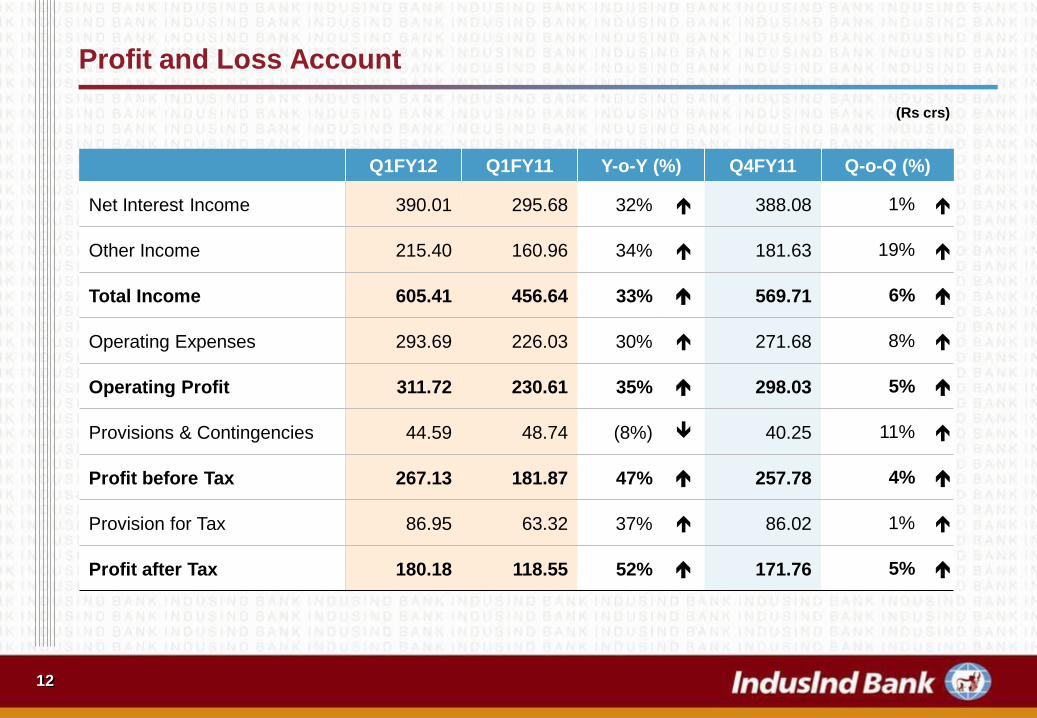
Profit and Loss Account
Q1FY12 Q1FY11 Y-o-Y (%) Q4FY11 Q-o-Q (%)
Net Interest Income 390.01 295.68 32% 388.08 1%
Other Income 215.40 160.96 34% 181.63 19%
Total Income 605.41 456.64 33% 569.71 6%
Operating Expenses 293.69 226.03 30% 271.68 8%
Operating Profit 311.72 230.61 35% 298.03 5%
Provisions & Contingencies 44.59 48.74 (8%) 40.25 11%
Profit before Tax 267.13 181.87 47% 257.78 4%
Provision for Tax 86.95 63.32 37% 86.02 1%
Profit after Tax 180.18 118.55 52% 171.76 5%
(Rs crs)
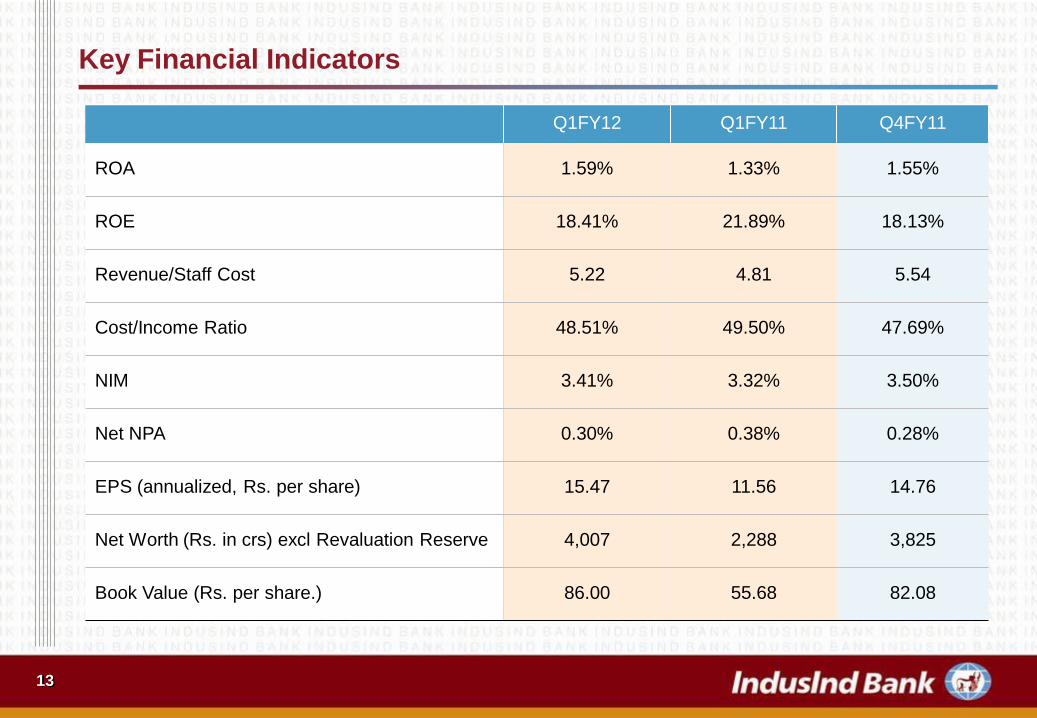
Key Financial Indicators
13
Q1FY12 Q1FY11 Q4FY11
ROA 1.59% 1.33% 1.55%
ROE 18.41% 21.89% 18.13%
Revenue/Staff Cost 5.22 4.81 5.54
Cost/Income Ratio 48.51% 49.50% 47.69%
NIM 3.41% 3.32% 3.50%
Net NPA 0.30% 0.38% 0.28%
EPS (annualized, Rs. per share) 15.47 11.56 14.76
Net Worth (Rs. in crs) excl Revaluation Reserve 4,007 2,288 3,825
Book Value (Rs. per share.) 86.00 55.68 82.08
14
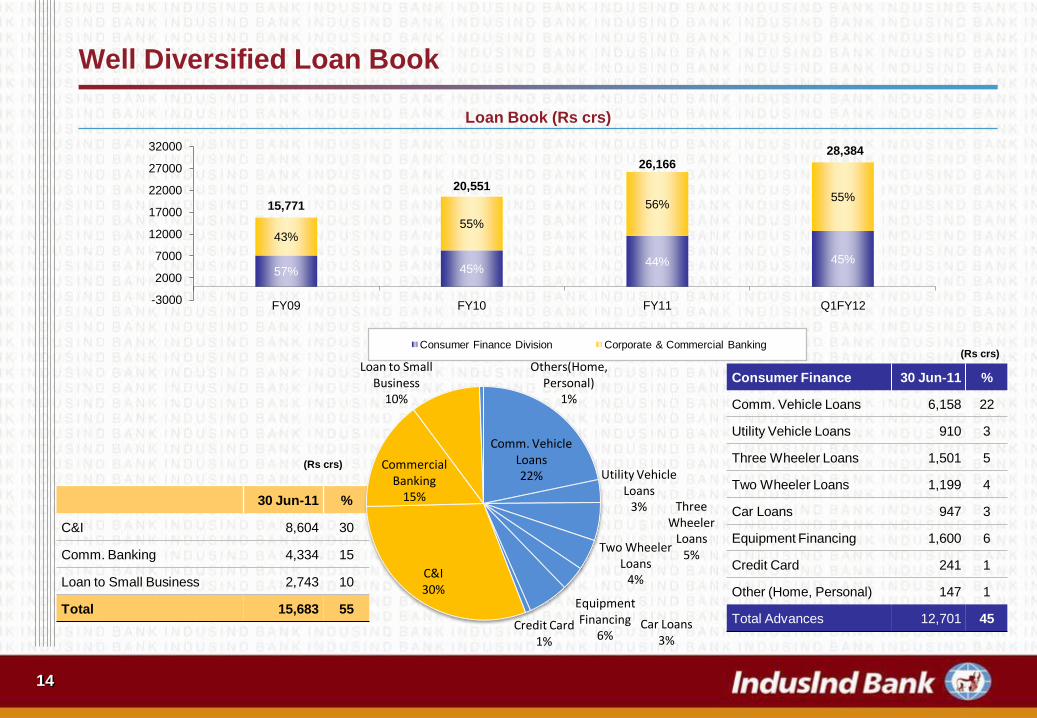
57% 45%44% 45%
43%55%
56%55%
15,771
20,551
26,16628,384
-3000
2000
7000
12000
17000
22000
27000
32000
FY09 FY10 FY11 Q1FY12
Consumer Finance Division Corporate & Commercial Banking
Well Diversified Loan Book
Loan Book (Rs crs)
30 Jun-11 %
C&I 8,604 30
Comm. Banking 4,334 15
Loan to Small Business 2,743 10
Total 15,683 55
Consumer Finance 30 Jun-11 %
Comm. Vehicle Loans 6,158 22
Utility Vehicle Loans 910 3
Three Wheeler Loans 1,501 5
Two Wheeler Loans 1,199 4
Car Loans 947 3
Equipment Financing 1,600 6
Credit Card 241 1
Other (Home, Personal) 147 1
Total Advances 12,701 45
(Rs crs)
(Rs crs)
Comm. Vehicle Loans 22% Utility Vehicle
Loans 3% Three
Wheeler Loans
5%Two Wheeler
Loans4%
Car Loans3%
Equipment Financing
6%Credit Card
1%
C&I 30%
Commercial Banking
15%
Loan to Small Business
10%
Others(Home, Personal)
1%
1515
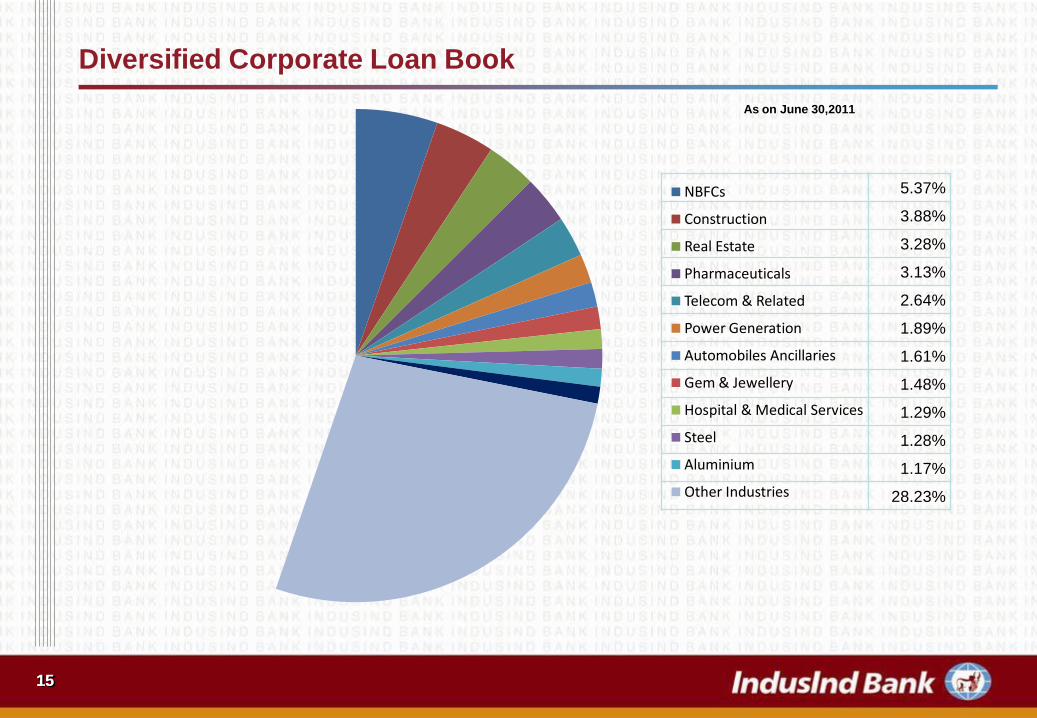
Diversified Corporate Loan Book
5.37%
3.88%
3.28%
3.13%
2.64%
1.89%
1.61%
1.48%
1.29%
1.28%
1.17%
28.23%
As on June 30,2011
NBFCs
Construction
Real Estate
Pharmaceuticals
Telecom & Related
Power Generation
Automobiles Ancillaries
Gem & Jewellery
Hospital & Medical Services
Steel
Aluminium
Other Industries
16
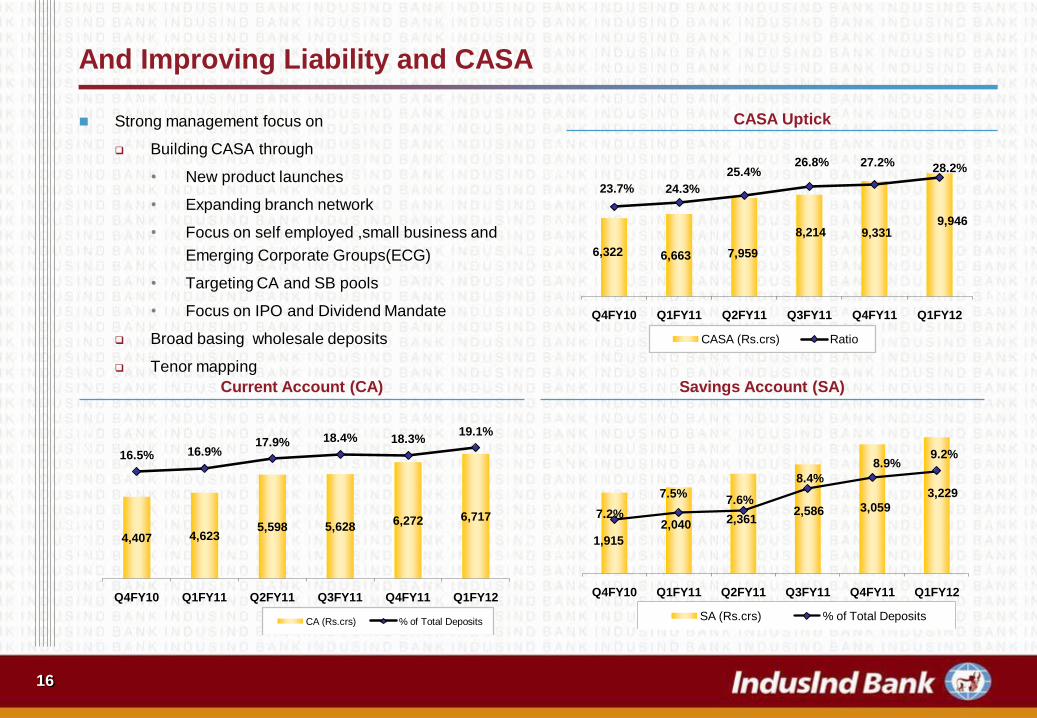
And Improving Liability and CASA
6,322 6,663 7,959
8,214 9,3319,946
23.7% 24.3%
25.4%26.8% 27.2% 28.2%
10%
16%
21%
27%
33%
0
2,000
4,000
6,000
8,000
10,000
12,000
Q4FY10 Q1FY11 Q2FY11 Q3FY11 Q4FY11 Q1FY12
CASA (Rs.crs) Ratio
CASA Uptick Strong management focus on
Building CASA through
• New product launches
• Expanding branch network
• Focus on self employed ,small business and
Emerging Corporate Groups(ECG)
• Targeting CA and SB pools
• Focus on IPO and Dividend Mandate
Broad basing wholesale deposits
Tenor mapping
Current Account (CA)
4,407 4,6235,598 5,628
6,272 6,717
16.5% 16.9%17.9% 18.4% 18.3%
19.1%
5%
9%
13%
17%
21%
0
1,000
2,000
3,000
4,000
5,000
6,000
7,000
8,000
Q4FY10 Q1FY11 Q2FY11 Q3FY11 Q4FY11 Q1FY12
CA (Rs.crs) % of Total Deposits
Savings Account (SA)
1,915
2,040 2,3612,586 3,059
3,229
7.2%
7.5%7.6%
8.4%
8.9%9.2%
5%
7%
9%
11%
0
500
1,000
1,500
2,000
2,500
3,000
3,500
Q4FY10 Q1FY11 Q2FY11 Q3FY11 Q4FY11 Q1FY12
SA (Rs.crs) % of Total Deposits
17
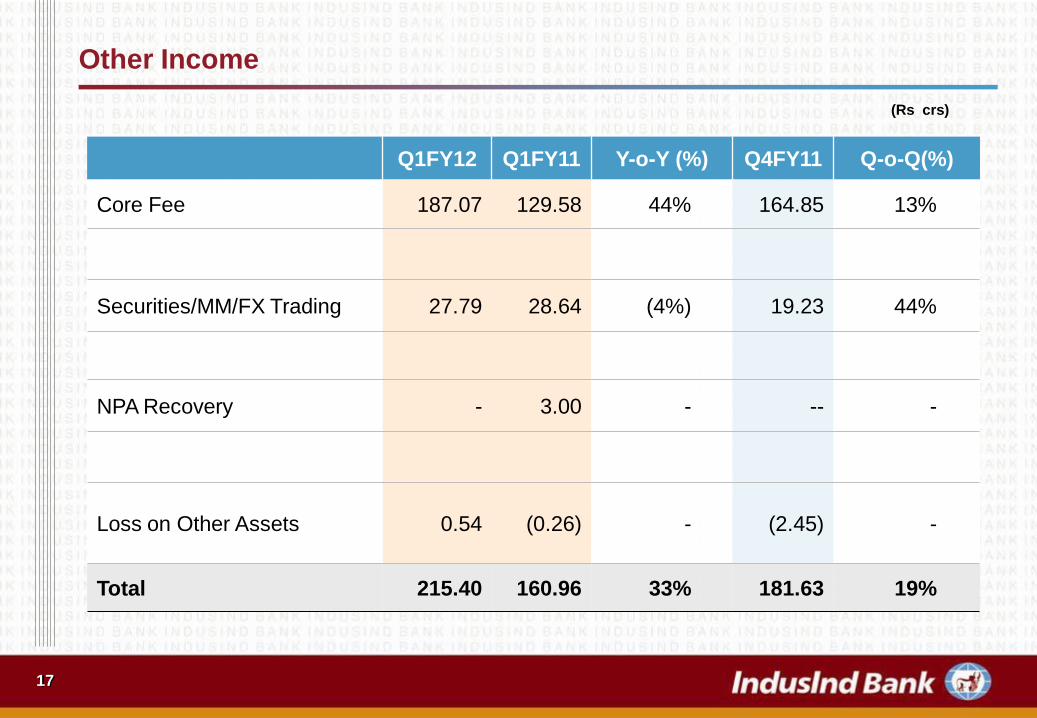
Other Income
Q1FY12 Q1FY11 Y-o-Y (%) Q4FY11 Q-o-Q(%)
Core Fee 187.07 129.58 44% 164.85 13%
Securities/MM/FX Trading 27.79 28.64 (4%) 19.23 44%
NPA Recovery - 3.00 - -- -
Loss on Other Assets 0.54 (0.26) - (2.45) -
Total 215.40 160.96 33% 181.63 19%
(Rs crs)
18
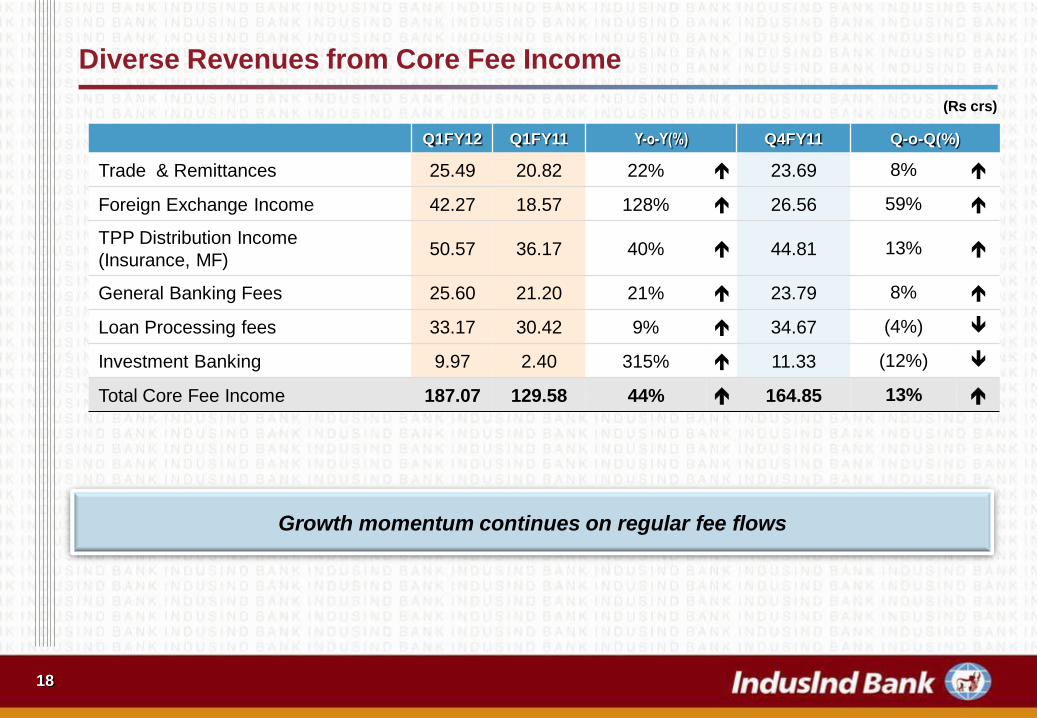
Diverse Revenues from Core Fee Income
Q1FY12 Q1FY11 Y-o-Y(%) Q4FY11 Q-o-Q(%)
Trade & Remittances 25.49 20.82 22% 23.69 8%
Foreign Exchange Income 42.27 18.57 128% 26.56 59%
TPP Distribution Income
(Insurance, MF)50.57 36.17 40% 44.81 13%
General Banking Fees 25.60 21.20 21% 23.79 8%
Loan Processing fees 33.17 30.42 9% 34.67 (4%)
Investment Banking 9.97 2.40 315% 11.33 (12%)
Total Core Fee Income 187.07 129.58 44% 164.85 13%
(Rs crs)
Growth momentum continues on regular fee flows
19
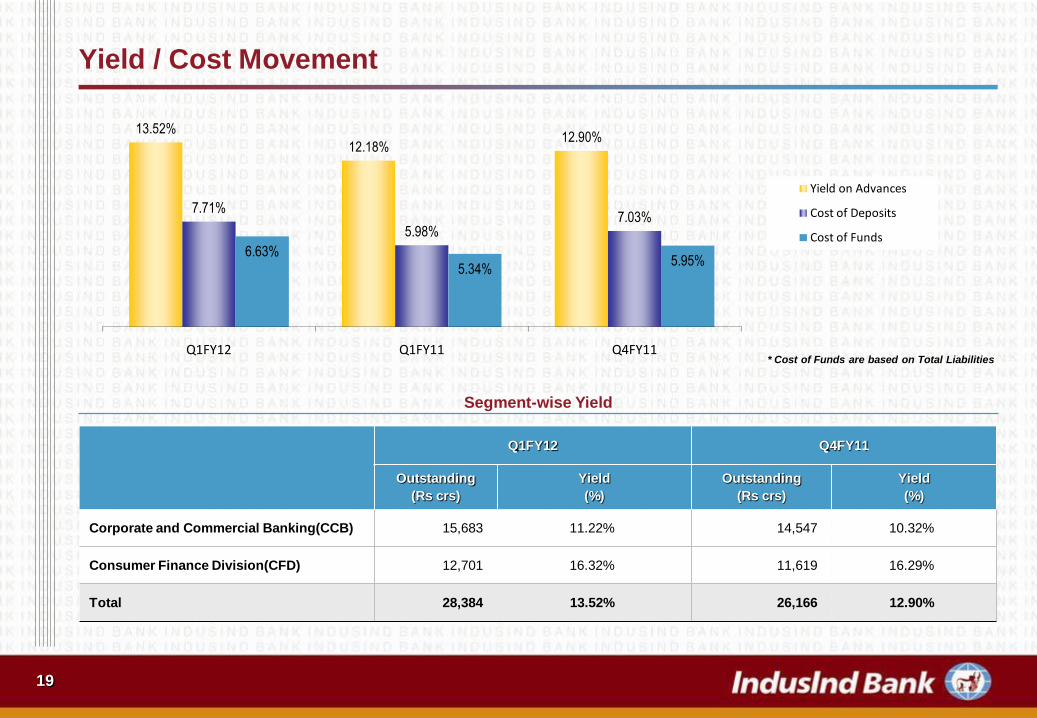
Yield / Cost Movement
13.52%
12.18%12.90%
7.71%
5.98%7.03%
6.63%
5.34%5.95%
Q1FY12 Q1FY11 Q4FY11
Yield on Advances
Cost of Deposits
Cost of Funds
Q1FY12 Q4FY11
Outstanding
(Rs crs)
Yield
(%)
Outstanding
(Rs crs)
Yield
(%)
Corporate and Commercial Banking(CCB) 15,683 11.22% 14,547 10.32%
Consumer Finance Division(CFD) 12,701 16.32% 11,619 16.29%
Total 28,384 13.52% 26,166 12.90%
Segment-wise Yield
* Cost of Funds are based on Total Liabilities
20
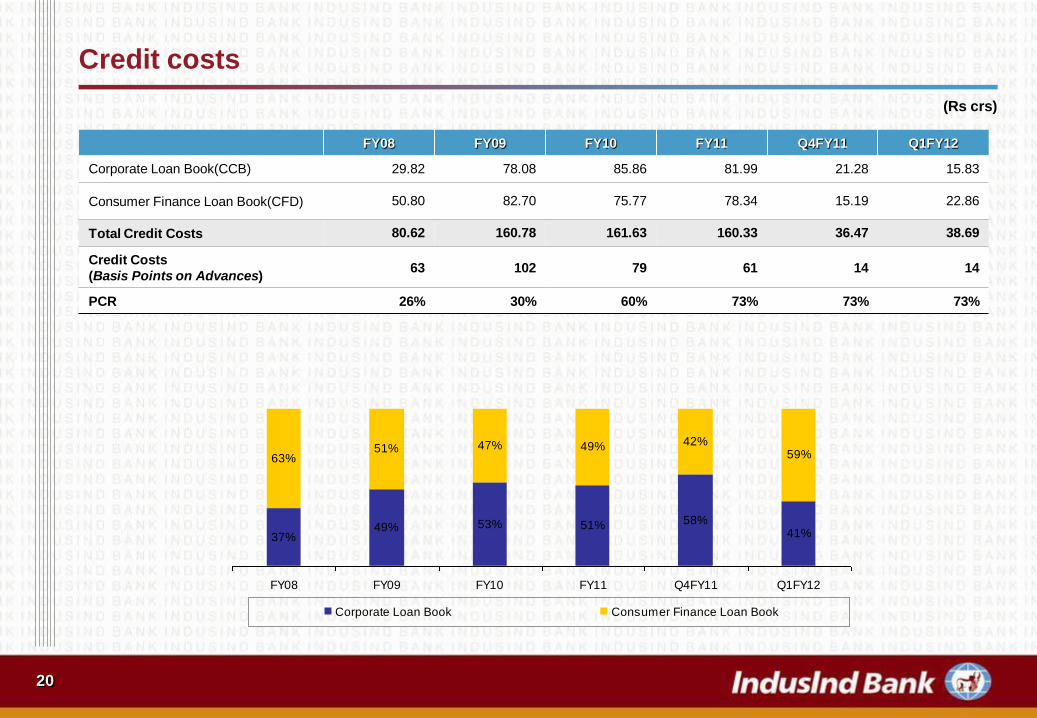
Credit costs
FY08 FY09 FY10 FY11 Q4FY11 Q1FY12
Corporate Loan Book(CCB) 29.82 78.08 85.86 81.99 21.28 15.83
Consumer Finance Loan Book(CFD) 50.80 82.70 75.77 78.34 15.19 22.86
Total Credit Costs 80.62 160.78 161.63 160.33 36.47 38.69
Credit Costs
(Basis Points on Advances)63 102 79 61 14 14
PCR 26% 30% 60% 73% 73% 73%
37%49% 53% 51% 58%
41%
42%59%
49%47%51%63%
FY08 FY09 FY10 FY11 Q4FY11 Q1FY12
Corporate Loan Book Consumer Finance Loan Book
(Rs crs)
21
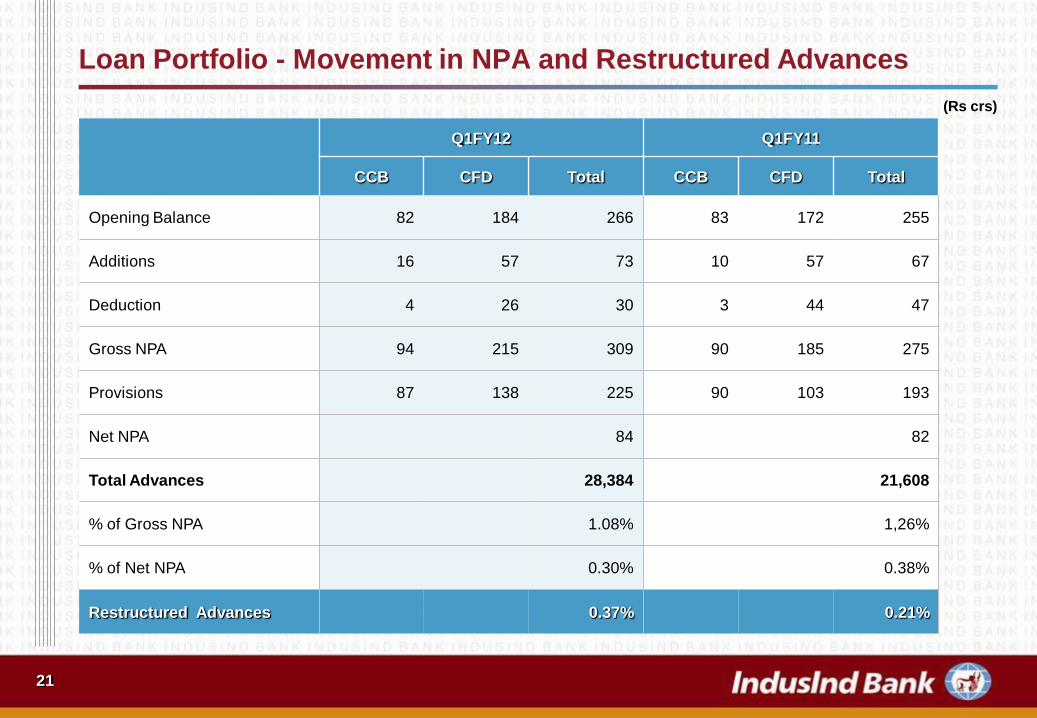
Loan Portfolio - Movement in NPA and Restructured Advances
Q1FY12 Q1FY11
CCB CFD Total CCB CFD Total
Opening Balance 82 184 266 83 172 255
Additions 16 57 73 10 57 67
Deduction 4 26 30 3 44 47
Gross NPA 94 215 309 90 185 275
Provisions 87 138 225 90 103 193
Net NPA 84 82
Total Advances 28,384 21,608
% of Gross NPA 1.08% 1,26%
% of Net NPA 0.30% 0.38%
Restructured Advances 0.37% 0.21%
(Rs crs)
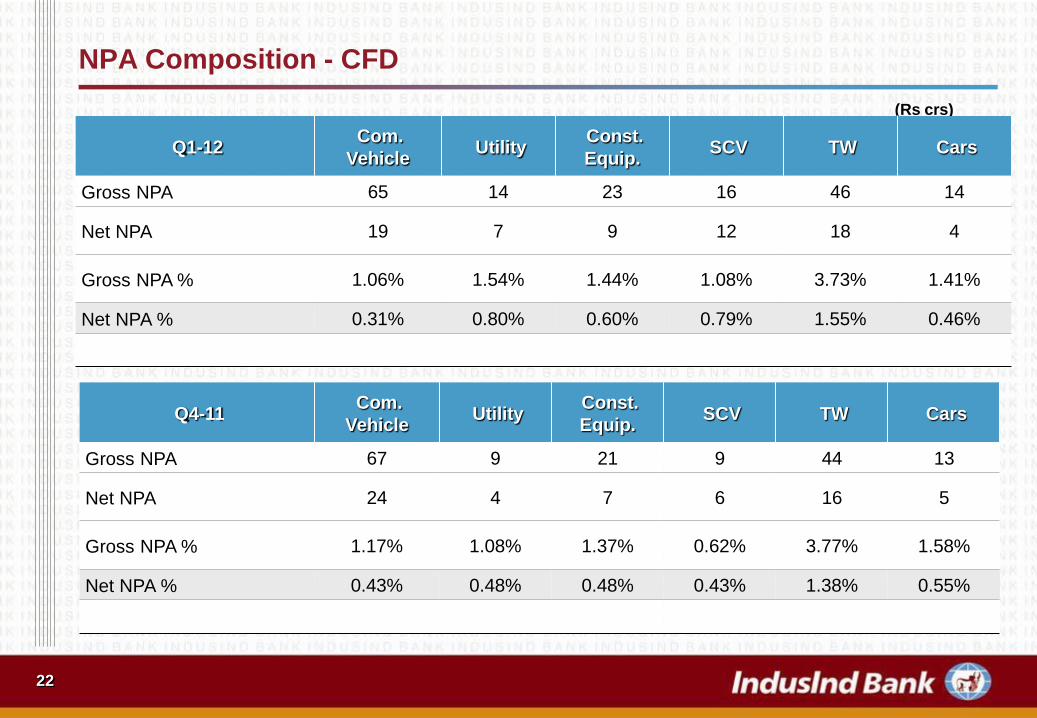
NPA Composition - CFD
22
(Rs crs)
Q4-11Com.
Vehicle Utility
Const.
Equip. SCV TW Cars
Gross NPA 67 9 21 9 44 13
Net NPA 24 4 7 6 16 5
Gross NPA % 1.17% 1.08% 1.37% 0.62% 3.77% 1.58%
Net NPA % 0.43% 0.48% 0.48% 0.43% 1.38% 0.55%
Q1-12Com.
Vehicle Utility
Const.
Equip. SCV TW Cars
Gross NPA 65 14 23 16 46 14
Net NPA 19 7 9 12 18 4
Gross NPA % 1.06% 1.54% 1.44% 1.08% 3.73% 1.41%
Net NPA % 0.31% 0.80% 0.60% 0.79% 1.55% 0.46%
23
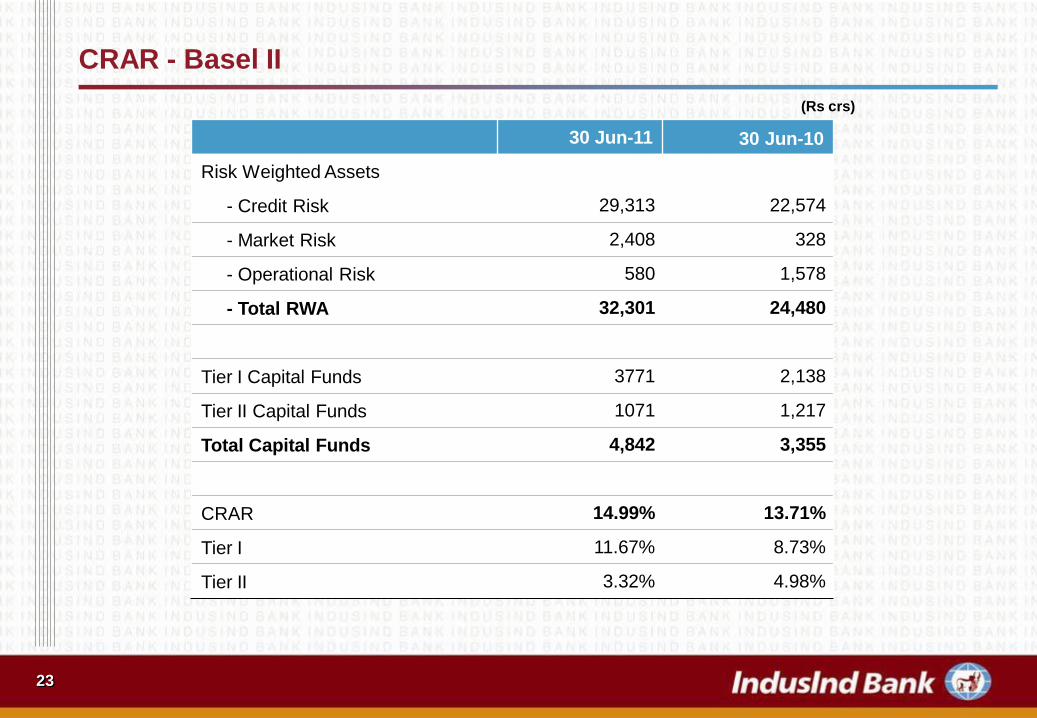
CRAR - Basel II
30 Jun-11 30 Jun-10
Risk Weighted Assets
- Credit Risk 29,313 22,574
- Market Risk 2,408 328
- Operational Risk 580 1,578
- Total RWA 32,301 24,480
Tier I Capital Funds 3771 2,138
Tier II Capital Funds 1071 1,217
Total Capital Funds 4,842 3,355
CRAR 14.99% 13.71%
Tier I 11.67% 8.73%
Tier II 3.32% 4.98%
(Rs crs)
24
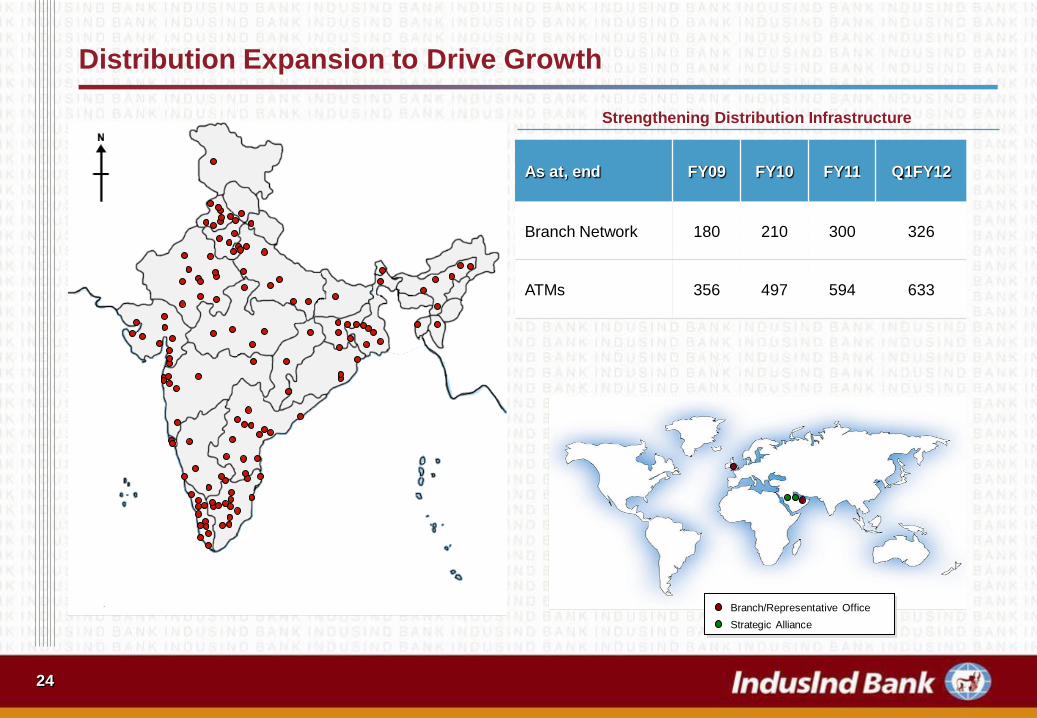
Distribution Expansion to Drive Growth
As at, end FY09 FY10 FY11 Q1FY12
Branch Network 180 210 300 326
ATMs 356 497 594 633
Strengthening Distribution Infrastructure
Branch/Representative Office
Strategic Alliance
25
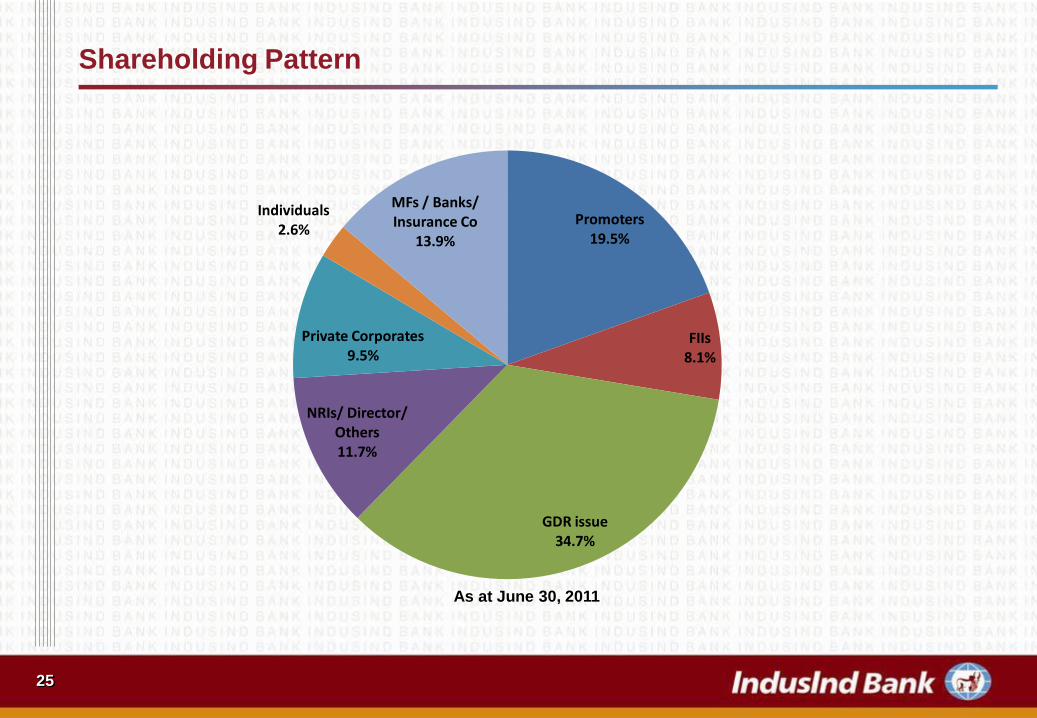
Shareholding Pattern
As at June 30, 2011
Promoters19.5%
FIIs8.1%
GDR issue34.7%
NRIs/ Director/ Others11.7%
Private Corporates9.5%
Individuals2.6%
MFs / Banks/ Insurance Co
13.9%

Thank you