Embed Size (px)
Citation preview
Bank of Baroda: A Journey of Sustained Soundness
Performance Analysis: Q1, 2012‐13 (FY13)
Dr Rupa Rege NitsureChief Economist
July 30, 2012
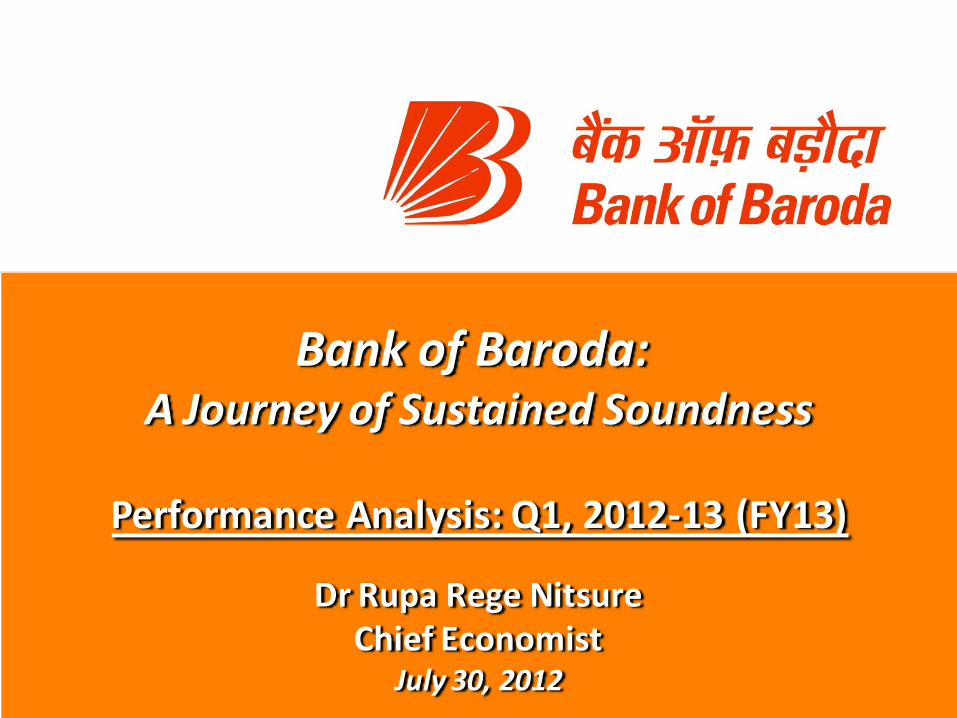
Bank of Baroda: Key Strengths
Bank of Baroda is a 104 years old State‐owned Bank with modern & contemporary personality,offering banking products and services to Large Industrial, SME, Retail & Agricultural customersacross India and 24 other countries.
Relatively Strong Presence in Progressive States like Gujarat & Maharashtra
Uninterrupted Recordin Profit‐making and Dividend Payment
Overseas Business Operations extend across
24 countries through 93 Offices
First PSB to receiveCorporate Governance
Rating (CGR‐2)
Robust Technology
Platform with 100%CBS in Indian Branches
Pioneer in many Customer‐Centric
Initiatives
Strong Domestic
Presence through 3, 913 Branches
Modern & Contemporary
Personality
Provides Financial Services to over
45.16 mln Customers Globally
A well‐accepted &recognised Brand in
Indian banking industry
Results at a Glance ..
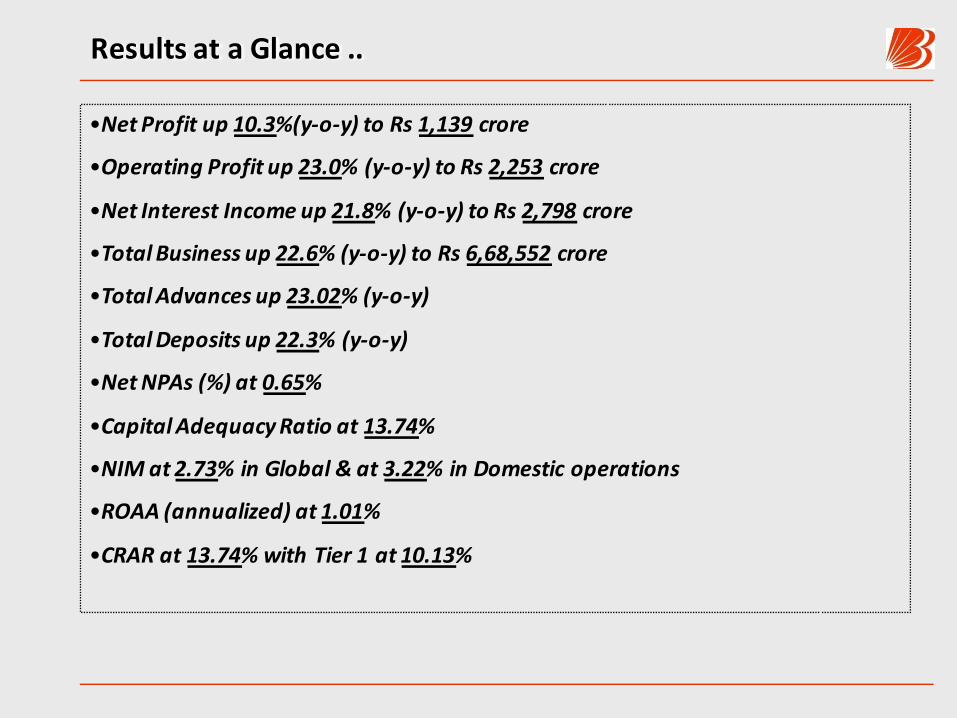
•Net Profit up 10.3%(y‐o‐y) to Rs 1,139 crore
•Operating Profit up 23.0% (y‐o‐y) to Rs 2,253 crore
•Net Interest Income up 21.8% (y‐o‐y) to Rs 2,798 crore
•Total Business up 22.6% (y‐o‐y) to Rs 6,68,552 crore
•Total Advances up 23.02% (y‐o‐y)
•Total Deposits up 22.3% (y‐o‐y)
•Net NPAs (%) at 0.65%
•Capital Adequacy Ratio at 13.74%
•NIM at 2.73% in Global & at 3.22% in Domestic operations
•ROAA (annualized) at 1.01%
•CRAR at 13.74% with Tier 1 at 10.13%

Domestic Branch Network
28512927 3106
3409
391 3
0
500
1000
1500
2000
2500
3000
3500
4000
Jun'08 Jun'09 Jun'10 Jun'11 Jun'12
No. of Domestic Branches
Regional Break-up of Domestic Branches as on 30th June, 2012
Metro Urban Semi-Urban
Rural
877 716 1,046 1,274
•In a year’s time, the Bank added 504 brs to its domestic network comprising 121 in metro; 77 in urban; 204 in semi‐urban & 102 in rural areas.
•During Q1, FY13, the Bank opened 10 new brs (3 in metro, 5 in rural & one each in urban & semi‐urban) and merged one of its rural branches.
•In the remaining part of FY13, the Bank plans to open 572 new brs including 160brs from its Branch Expansion Plan of FY12.
•Newly opened branches in Q1, FY13 are from Maharashtra & Goa; Rajasthan, U.P, Southern & Eastern states.
•Around 32.6% of the Bank’s network at the end‐June, FY13 was situated in rural areas.
•Moreover, the Bank’s ATM tally improved from 1,657 at end‐June, 2011 to 2,130 at end‐June, 2012.
Robust Technology Platform
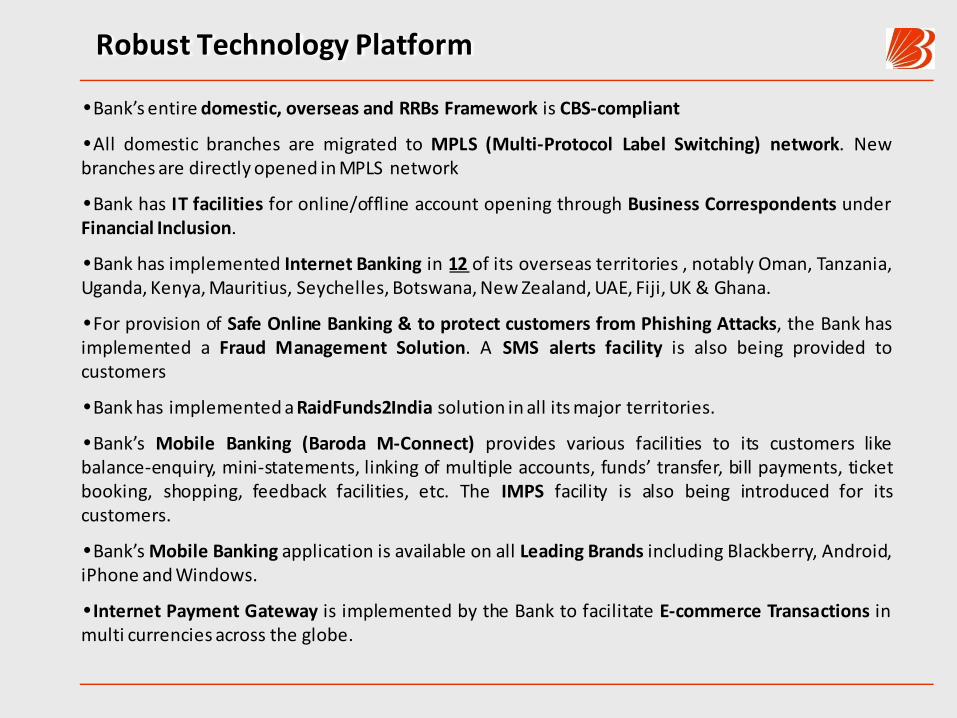
•Bank’s entire domestic, overseas and RRBs Framework is CBS‐compliant
•All domestic branches are migrated to MPLS (Multi‐Protocol Label Switching) network. Newbranches are directly opened inMPLS network
•Bank has IT facilities for online/offline account opening through Business Correspondents underFinancial Inclusion.
•Bank has implemented Internet Banking in 12 of its overseas territories , notably Oman, Tanzania,Uganda, Kenya,Mauritius, Seychelles, Botswana,NewZealand,UAE, Fiji, UK & Ghana.
•For provision of Safe Online Banking & to protect customers from Phishing Attacks, the Bank hasimplemented a Fraud Management Solution. A SMS alerts facility is also being provided tocustomers
•Bankhas implementedaRaidFunds2India solution in all itsmajor territories.
•Bank’s Mobile Banking (Baroda M‐Connect) provides various facilities to its customers likebalance‐enquiry, mini‐statements, linking of multiple accounts, funds’ transfer, bill payments, ticketbooking, shopping, feedback facilities, etc. The IMPS facility is also being introduced for itscustomers.
•Bank’sMobile Banking application is available on all Leading Brands including Blackberry, Android,iPhone andWindows.
•Internet Payment Gateway is implemented by the Bank to facilitate E‐commerce Transactions inmulti currencies across the globe.

Robust Technology Platform
•Bank’s ATM Switch is upgraded to handle increasing volume of ATMtransactions ; the Bank’s ATMcount has increased to 2,130 by 30th June, 2012; its ATM switch also supports eight internationalterritories.
•Bank has a Facility of Multiple Accounts being linked to a single Debit Card (verified byVisa, CVV2)andalso a Mobile Number registration thru’ ATMs in CBS for the SMS Alerts.
•E‐tax payments thru’ ATMs are also facilitated by the Bank and Mobile ATMs are introduced inseveral cities.
•Bank has set up two Contact Centres in Lucknow & Baroda to address customer queries andgrievanceswithoutmuch delay.
•Cash Management Solution is implemented to provide Operational Support to the Customers’ALM.
•AntiMoney Laundering (AML) is implemented in Indiaand 20 of the Bank’s overseas territories.
•Bank has developed an Integrated Global Treasury Solution in its major territories like U.K., UAE,Bahamas, Bahrain, Hong Kong, Singapore, Belgium, USA and India to reduce the cost of operationsand improve the funds’management.
•A Centralised SWIFT is being implementedwithin India&the Bank’s 22 overseas territories.
•The CTS ‐Cheque Truncation System is implemented in Delhi and a Grid based CTS System isimplemented inChennai, Coimbatore andBangalore.

Robust Technology Platform
•ACPC (Automated Cheque Processing Centre) for centralised Inward / Outward clearing has beenimplemented inMumbai, Surat and Ahmedabad regionsof the Bank.
•Back Office functions are centralised in the Bank at its City Back Offices & ten Regional BackOffices (at Baroda, Jaipur, Lucknow, Bhopal, Coimbtore, Kolkata, Mumbai, Jamshedpur, New Delhi,Pune) to improve the service delivery to customers.
•RTGS & NEFT straight through processing has been implemented for all sponsored RRBs of theBank.
•Ebiz Suit (EWGL, HRMS & CRM) is upgraded to R12 Platform for betterperformance.
•Bank has built a State‐of‐the‐Art Data Centre conforming to Uptime Institute Tier‐3 standard anda Disaster Recovery Site in different seismic zones to ensure uninterrupted banking services to itscustomers.
•Various Technology projects like Virtualisation, Back‐up Consolidation & RAC (Realtime ApplicationCluster) are beingundertaken to support increasingbusiness requirement.
•BoB IIT – an exclusive IT Training Centre has been set up in Ghandhinagar to educate the Bank’sStaff in all IT relatedproducts & services.

Concentration (%): Domestic Branch Network
Gujarat, 20.8
Maharashtra, 11.9
Rajasthan, 11.1South, 11.2
UP & Uttaranchal, 21.9
Rest of India, 23.1

Pattern of Shareholding: 30th June, 2012
FIIs14.34%
Corp. Bodies6.58%
Indian Public4.93%
Others0.38%
Mutual Funds6.60%
Insurance Cos
12.86%
Govt. of India
54.31%
• BOB is a Part of the following Indexes
BSE 100, BSE 200, BSE 500 & Bankex
Nifty, BankNifty, CNX 100, CNX 200, CNX 500
• BOB’s Share is also listed on BSE and NSE in the‘Future and Options’ segment.
As on 30th June, 2012
•Share Capital: Rs 412.38 crore
•No. of Shares: 411.12 million
•Net worth: Rs 27889.31 crore (up 34.2%, y‐o‐y)
•B. V. per share: Rs 678.37 (up 27.8%, y‐o‐y)
•Return on Equity: 16.33%
India’s Macro Health: Q1, FY12 to Q1, FY13
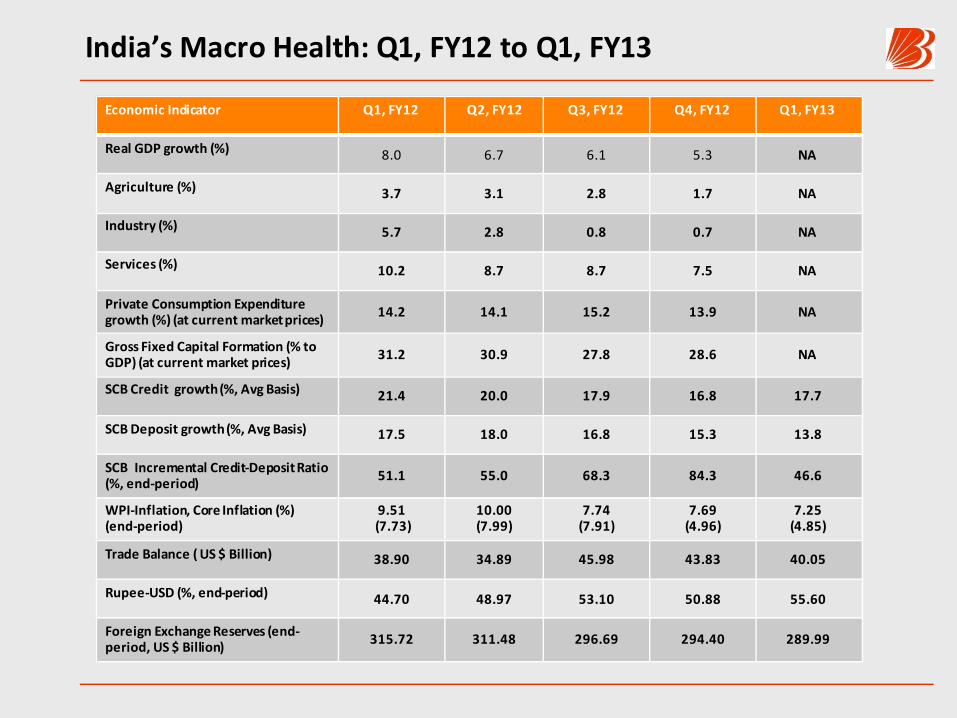
Economic Indicator Q1, FY12 Q2, FY12 Q3, FY12 Q4, FY12 Q1, FY13
Real GDP growth (%) 8.0 6.7 6.1 5.3 NA
Agriculture (%) 3.7 3.1 2.8 1.7 NA
Industry (%) 5.7 2.8 0.8 0.7 NA
Services (%) 10.2 8.7 8.7 7.5 NA
Private Consumption Expenditure growth (%) (at current marketprices) 14.2 14.1 15.2 13.9 NA
Gross Fixed Capital Formation (% to GDP) (at current market prices) 31.2 30.9 27.8 28.6 NA
SCB Credit growth (%, Avg Basis) 21.4 20.0 17.9 16.8 17.7
SCB Deposit growth (%, Avg Basis) 17.5 18.0 16.8 15.3 13.8
SCB Incremental Credit‐Deposit Ratio (%, end‐period) 51.1 55.0 68.3 84.3 46.6
WPI‐Inflation, Core Inflation (%)(end‐period)
9.51(7.73)
10.00(7.99)
7.74(7.91)
7.69(4.96)
7.25(4.85)
Trade Balance ( US $ Billion) 38.90 34.89 45.98 43.83 40.05
Rupee‐USD (%, end‐period) 44.70 48.97 53.10 50.88 55.60
Foreign Exchange Reserves (end‐period, US $ Billion) 315.72 311.48 296.69 294.40 289.99

Bank’s Business Growth (Y‐O‐Y): Jun’07 to Jun’12
22 .726.5 28.2 28.23
22.88 22.3
0.0
5.0
10.0
15.0
20.0
25.0
30.0
Jun'07
Jun'08
Jun'09
Jun'10
Jun'11
Jun'12
Growth: Total Deposits (%)
24.6
32.628.0 29.3
23.922.1
0.0
5.0
10.0
15.0
20.0
25.0
30.0
35.0
Jun '0
7Ju
n '08
Jun '0
9Ju
n '10
Jun '1
1Ju
n '12
Growth: Total Business (%)
11.1
20.318.8
27.5
16.1
11.6
0.0
5.0
10.0
15.0
20.0
25.0
30.0
Jun '0
7Ju
n '08
Jun '0
9Ju
n '10
Jun '1
1Ju
n '12
Domestic CASA Growth (%)
27.5
42.1
27.730.7
25.223.0
0.05.0
10.015.020.025.030.035.040.045.0
Jun '0
7Ju
n '08
Jun '0
9Ju
n '10
Jun '1
1Ju
n '12
Growth: Total Advances (%)

Bank’s Profitability: Jun’07 to Jun’12
1831.28
1527.87
100 9.94
800.19
644.45
2253.18
330.8 3 370.86
685.38
859.16
1032.851138.86
0.00
500.00
1000.00
1500.00
2000.00
2500.00
Jun'07 Jun'08 Jun'09 Jun'10 Jun'11 Jun'12
Rs crore
Gross Profit Net Profit
•During the last five years, the Bank’s First Quarter Net Profit hasgrown at the rich CAGR of 28.1% .

Bank’s Asset Quality: Jun’06 to Jun’12
1.84
1.461.411.44
1.86
2.78
0.65
0.44
0.390.27
0.52
0.67
0.92
0
0.5
1
1.5
2
2.5
3
3.5
4
Jun'06 Jun'07 Jun'08 Jun'09 Jun'10 Jun'11 Jun'12
%
0
0.2
0.4
0.6
0.8
1
1.2
1.4
1.6
1.8
2%
Gross NPA
Net NPA

Bank’s Business Performance: Jun’11 to Jun’12
Particular
(Rs crore)Jun’11 Mar’12 Jun’12
Y‐O‐Y
(%)
Change
OverMar’11 (%)
Global Business 5,45,283 6,72,248 6,68,552 22.6% ‐1.0%
Domestic Business 4,05,156 4,82,211 4,73,825 17.0% ‐1.7%
Overseas Business 1,40,127 1,90,038 1,94,726 39.0% 2.5%
Global Deposits 3,12,943 3,84,871 3,82,739 22.3% ‐0.6%
Domestic Deposits 2,36,536 2,80,135 2,77,839 17.4% ‐0.8%
Overseas Deposits 76,407 1,04,736 1,04,899 37.3% 0.2%
Global CASA Deposits 87,221 1,03,524 99,776 14.4% ‐3.6%
Domestic CASA 80,225 92,948 89,551 11.6% ‐3.7%
Overseas CASA 6,996 10,576 10,225 46.2% ‐3.3%
•Share of Domestic CASA was at 32.23% in terms of Aggregate Deposits and at 33.72% in terms of CoreDeposits as on 30th June, 2012.

Bank’s Business Performance: Jun’11 to Jun’12
Particular
(Rs crore)Jun’11 Mar’12 Jun’12
Y‐O‐Y
(%)
Change
OverMar’11 (%)
Global advances (Net) 2,32,340 2,87,377 2,85,813 23.0% ‐0.5%
Domestic Advances 1,68,621 2,02,075 1,95,986 16.2% ‐3.0%
Overseas Advances 63,719 85,302 89,827 41.0% 5.3%
Retail Credit
Of which:30,934 35,668 32,922 6.4% ‐7.7%
Home Loans 12,910 14,133 14,520 12.5% 2.7%
SME Credit 28,367 34,512 34,346 21.1% ‐0.5%
Farm Credit* 23,211 29,036 27,774 19.7% ‐4.3%
Credit to Weaker Sections* 13,248 15,863 15,627 18.0% ‐1.5%
* As of Last Reporting Friday

Bank’s Business Performance: Jun’11 to Jun’12
Particular(Rs crore) Jun’11 Mar’12 Jun’12
Y-O-Y(%)
ChangeOver
Dec’10 (%)
Global Saving Deposits 65,654 74,580 75,562 15.1% 1.3%
Domestic Savings Deposits 64,162 72,575 73,519 14.6% 1.3%
Overseas Savings Deposits 1,491 2,004 2,043 37.0% 1.9%
Global Current Deposits 21,567 28,944 24,214 12.3% -16.3%
Domestic Current Deposits 16,063 20,372 16,033 -0.2% -21.3%
Overseas Current Deposits5,505 8,572 8,181 48.6% -4.6%

Bank’s Profits & NII: Apr‐Jun, FY12 & FY13
Particular
(Rs crore)Apr‐Jun’11 Apr‐Jun’12
Y‐O‐Y
(%)
Gross Profit 1,831 2,253 23.0%
Net Profit 1,033 1,139 10.3%
Net Interest Income 2,297 2,798 21.8%

Other Highlights: Q1,FY12 versus Q1,FY13
Particular (in %) Q1, FY12
Q2, FY12
Q3, FY12
Q4, FY12
Q1, FY13
Global Cost of Deposits 5.36 5.61 5.65 5.81 5.89
Domestic Cost of Deposits 6.41 6.84 6.90 7.17 7.30
Overseas Cost of Deposits 1.80 1.82 1.96 1.74 1.86
Global Yield on Advances 9.11 9.64 9.45 9.33 9.08
Domestic Yield on Advances 11.23 12.14 12.01 11.71 11.65
Overseas Yield on Advances 3.38 3.37 3.60 3.75 3.52

Other Highlights: Q1, FY12 versus Q1,FY13
Particular (in %) Q1, FY12
Q2, FY12
Q3, FY12
Q4, FY12
Q1, FY13
Global Yield on Investment 7.47 7.58 7.67 7.53 7.71
Domestic Yield on Investment
7.59 7.72 7.79 7.69 7.83
Overseas Yield on Investment 4.86 4.24 4.90 3.84 4.91
Global NIM 2.87 3.07 2.99 2.96 2.73
Domestic NIM 3.39 3.67 3.51 3.44 3.22
Overseas NIM 1.37 1.42 1.64 1.68 1.55

Key Financial Ratios : Q1, FY13
Returnon Average Assets at1.01%
Earningper Share at Rs 110.80
BookValue per Share at Rs 678.37
Returnon Equity (ROE) at 16.33%
Capital AdequacyRatio at 13.74% withTier I Capital at 10.13%
• Cost‐Income Ratio at 37.21%
Gross NPA ratio at 1.84%
NetNPA ratio too low at 0.65%
NPACoverage at the healthy level of 79.02%
Incremental Delinquency Ratio at 0.43% for Q1, FY13 – consistent with a long lasting
slowdown in industry and weakmonsoon so far.

Key Productivity Indicators: Q1, FY12 versus Q1, FY13
Particulars Q1, FY12 Q1, FY13
Business per Employee (Rs crore) 12.65 14.79
Business per Branch (Rs crore) 157.45 169.49
Profit per Employee (Rs lakh) 10.26 10.81
Profit per Branch (Rs lakh) 119.30 114.80

Non‐Interest Income: Q1, FY12 and Q1, FY13
(Rs crore) Q1, FY12 Q1, FY13% Change
(Y‐O‐Y)
Commission, Exchange, Brokerage
274.77 275.93 0.4%
Incidental Charges 79.55 82.82 4.1%
Other Miscellaneous Income 43.76 55.45 55.5%
Total Fee‐Based Income 398.08 414.20 4.1%
Trading Gains 74.02 81.51 10.1%
Profit on Exchange Transactions 140.01 192.10 37.2%
Recovery from PWO 28.76 82.99 188.6%
Total Non‐Interest Income 640.87 770.80 20.3%
Provisions & Contingencies: Q1, FY12 and Q1, FY13
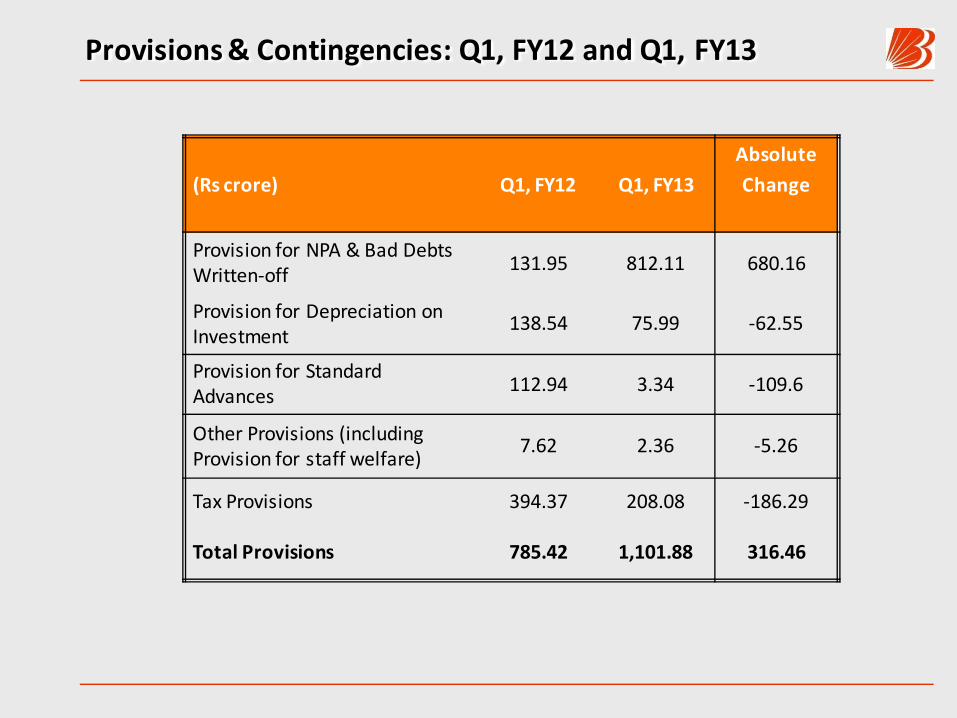
(Rs crore) Q1, FY12 Q1, FY13
Absolute
Change
Provision for NPA & Bad Debts Written‐off 131.95 812.11 680.16
Provision for Depreciation on Investment
138.54 75.99 ‐62.55
Provision for Standard Advances 112.94 3.34 ‐109.6
Other Provisions (including Provision for staff welfare)
7.62 2.36 ‐5.26
Tax Provisions 394.37 208.08 ‐186.29
Total Provisions 785.42 1,101.88 316.46

Bank’s Treasury Highlights: Q1, FY12
• Treasury Income stood at the level of Rs 273.61 crore (up 27.8%, y‐o‐y) in Q1,FY13.
• Out of this, Trading Gains Stood at Rs 81.51 crore in Q1, FY13 despite extremelyvolatile financial market conditions.
• As of June 30, 2012, the share of SLR Securities in Total Investment was 83.57%.
• The Bank had 85.37% of SLR Securities in HTM and 13.73% in AFS at end‐June2012.
• The per cent of SLR to NDTL as on 30th June, 2012 was 25.05%.
• While the modified duration of AFS investments is 2.57 years; that of HTMsecurities is 5.08 years.
• Total size of Bank’s Domestic Investment Book as on 30th June, 2012 stood at Rs94,504 crore.
• Total size of Bank’s Overseas Investment Book as on 30th June, 2012 stood at Rs3,943 crore.

Overseas Business: Q1, FY12
• As on 30th June, 2012, the “Overseas Business” contributed 29.1% to the Bank’sTotal Business, 23.7% to its Gross Profit and 36.2% to its Core Fee income.
• While the Cost‐Income Ratio for Domestic Operations stood at 41.51% in Q1, FY13,it was more favourable at 17.78% for the Bank’s Overseas Operations.
• While the Gross NPA (%) in Domestic Operations stood at 2.56% at end‐June, 2012,that for Overseas Operations was lower at 0.69%.
• The Gross Profit to Avg. Working Funds (%) for Overseas Operations stood at 1.49%inQ1, FY12 and at 1.62% in Q1, FY13.
• NIM as % of Interest Earnings Assets in Overseas Operations improved from 1.37%inQ1, FY12 to 1.55% in Q1, FY13.
• During Q1, FY13, the Bank opened two branches in New Zealand, notably atWellington and Manukau and two branches in Uganda, notably at Entebbe andKabale.
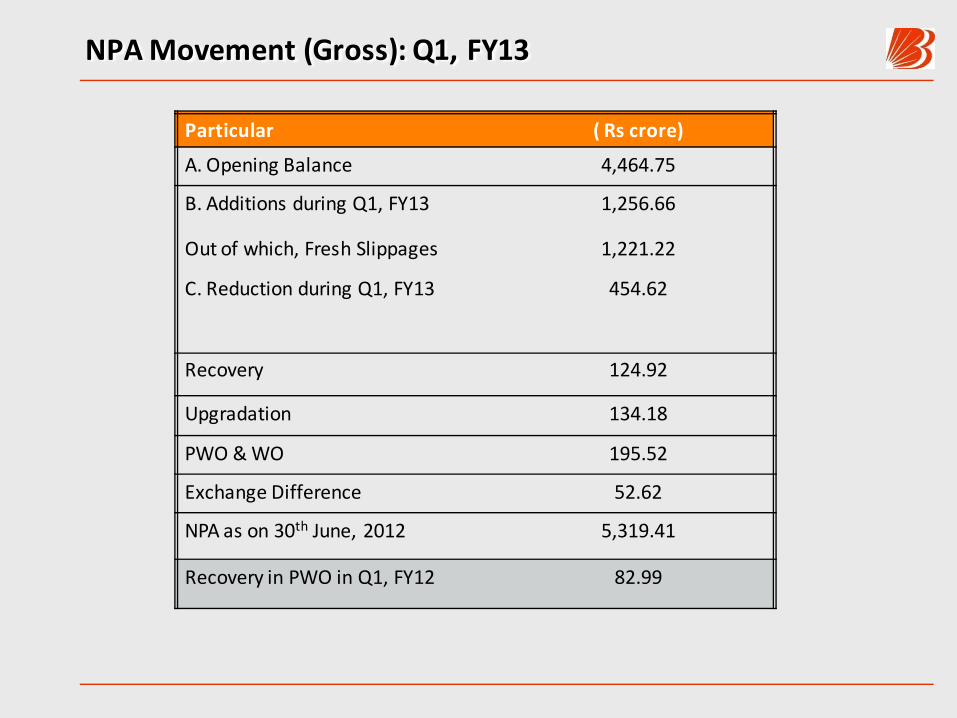
NPA Movement (Gross): Q1, FY13
Particular ( Rs crore)
A. Opening Balance 4,464.75
B. Additions during Q1, FY13 1,256.66
Out of which, Fresh Slippages 1,221.22
C. Reduction during Q1, FY13 454.62
Recovery 124.92
Upgradation 134.18
PWO & WO 195.52
Exchange Difference 52.62
NPA as on 30th June, 2012 5,319.41
Recovery in PWO in Q1, FY12 82.99

Sector‐wise Gross NPAs: Q1, FY12 versus Q1, FY13
Sector Gross NPA (%)Q1, FY12
Gross NPA (%)Q1, FY13
Agriculture 4.10 4.66
Large & Medium Industries 1.80 1.63
Retail 2.11 2.00
Housing 1.96 1.70
SSI (Mfg) 1.50 4.78
Total MSME 2.50 3.49
Overseas Operations 0.62 0.69

Cumulative Position of Restructured Assets
• During the past 51 months (1 Apr’08 to 30 June’12), the Bank has restructured86,596 accounts amounting Rs 15,747.41 crore in its Domestic operations.
• Within this, the loans worth Rs 770.57 crore were restructured in Q1, FY13; Rs8,265.41 crore were restructured in FY12, Rs 1,597.81 crore were restructured inFY11, Rs 2,455.05 crore in FY10 & Rs 2,658.57 crore in FY09.
• For the period of 51 months, out of the total amount restructured, Rs 11,918.84crore (75.7%) belonged to wholesale banking, Rs 2,195.61 crore (13.9%) toSMEs, Rs 614.03 crore (3.9%) to retail and Rs 1,018.93 crore (6.5%) toagriculture sector.
• About 100 accounts (of Rs 1 crore & above) restructured on/after 1st Apr, 2008with aggregate outstanding of Rs 1,511.20 crore slipped to NPA afterrestructuring and most of them belonged to the SME segment.
• In cumulative terms, the Bank has restructured 88 accounts in its Overseas operationsinvolving the amount of Rs 3,743.84 crore.• Out of these three accounts were restructured during Q1, FY13 involving the
amount Rs 32.74 crore.
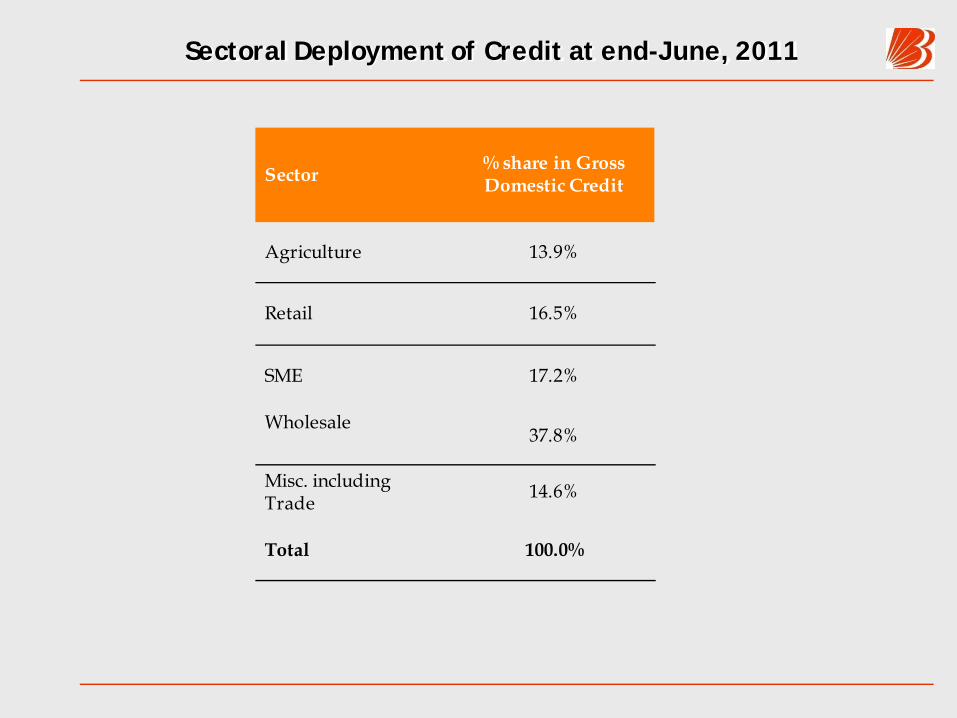
Sectoral Deployment of Credit at end-June, 2011
Sector % share in Gross Domestic Credit
Agriculture 13.9%
Retail 16.5%
SME 17.2%
Wholesale 37.8%
Misc. including Trade 14.6%
Total 100.0%

Bank’s BPR Project ‐ Navnirmaan
•Project Navnirmaan has altogether 18 activities covering both BPR & OrganisationalRestructuring, aimed at transforming the Bank’s branches into a sales & service centres tomake possible a sustained sales growth, superior customer experience and alternatechannel migration.
•Themost important initiatives are‐
•Conversion of all metro & urban branches into Baroda Next branches within atimeline [1134 branches rolled out so far across 13 zones & 56 regions]
•Creation of automated & lean Back Offices like:
•City Back Office (Automated cheque processing introduced at Mumbai, Surat &Ahmedabad)
•Regional Back Office [Ten RBOs functioning (one in each zone); five RBOs openedduring FY13]; for CASA opening [ No. of brs linked – 1,531 ]; for issuance ofpersonalised cheque books [ no. of brs linked – 2,590].
•Establishmentof two Contact (or Call) Centres
•Introduction of frontline automation [Queue Management System & ChequeDeposit Machines] at select branches for customer convenience
•Creation of an Academyof excellence [Thru’ Training & Boot Camps]
•OrganisationalRestructuring [ Creation of Selling roles at branch, R.O.& Z.O.]

Bank’s BPR Project ‐ Navnirmaan
•The initial impact of Baroda Next migration has been observed to be rewarding both interms of increased customer satisfaction& CASA growth.
•The said impact has been sustained at 110 Baroda Next brs evaluated on sales, customersatisfaction, etc., during the first stage of evaluation.
•Another evaluation carried out recently at Baroda Next brs on (a) customer satisfaction[at177 brs] and (b) employee satisfaction [at171 brs] showed significant improvement.
•Furtherevaluation initiatives are on.
•To sustain Sales growth, a new Sales Operating Model has been rolled out in 255 brs in Mumbai,Surat, Baroda, Ahmedabad, Delhi & Kanpur
•Out of 15 Mid Corporate Brs planned, 14 are already functional and one more is expected to beopened soon.
•Further centralisation initiatives are going to be piloted soon to enable the brs to become a“Sales‐cum‐Service”outlet.
•Bank’sHi‐Tech City Branch at Hyderabad has been transformed into an e‐branch.

Bank’s HR Initiatives
Recruitment –2012‐13
•Bank’s HR Function has focused on hiring efforts on a sustained basis to bridge the “gap” created bysuperannuation and to cater to the Bank’s consistent business growth and branch expansion
•Bank’s Proposed NewHiring in FY13: 3,400
•ProbationaryOfficers:600
•SpecialistOfficers:150
•Baroda Manipal Trainees:400
•Campus Recruitment:250
•Clerks:2,000
•Bank carried out a three‐month long residential programme involving massive skills’ upgradation for itsnew recruits during FY13 with a focus on development of key banking skills covering the major areas likecredit, forex operations, soft skills, etc.
•Other path‐breaking initiatives in Employee Development are –
•Baroda Next: A comprehensive leadership development training covering almost 1,500 leaders {all branchheads of urban/metro branches & AGMs/DGMs in theBank
•Project Sparsh: A transformational HR project focusing on talent management, succession planning,creation of a scientific staffingmodel &manpower planning, capability building& performancemanagement.
•Baroda‐Manipal School of Banking: An innovative & new channel of resourcing of trained manpower in theBank. Around 180 students are being inducted in this school every quarter for a focused grooming and a one‐year full‐timePG Course in Banking that is tailored to theBank’s specific requirements.
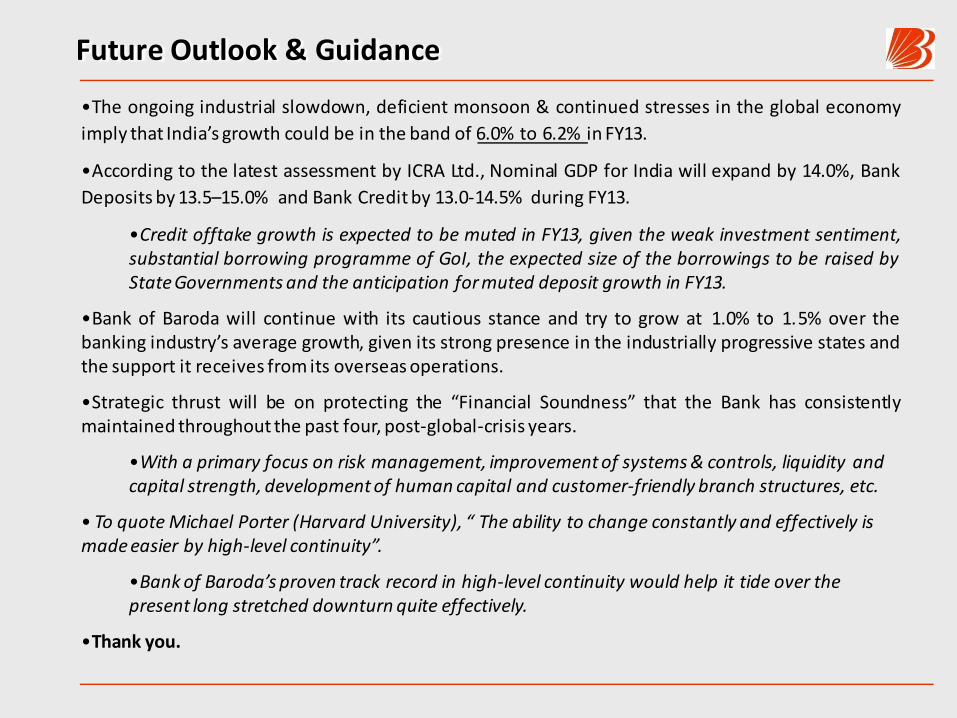
Future Outlook & Guidance
•The ongoing industrial slowdown, deficient monsoon & continued stresses in the global economyimply that India’s growth could be in the band of 6.0% to 6.2% in FY13.
•According to the latest assessment by ICRA Ltd., Nominal GDP for India will expand by 14.0%, BankDeposits by 13.5–15.0% and Bank Credit by 13.0‐14.5% during FY13.
•Credit offtake growth is expected to be muted in FY13, given the weak investment sentiment,substantial borrowing programme of GoI, the expected size of the borrowings to be raised byStateGovernments and the anticipation formuted deposit growth in FY13.
•Bank of Baroda will continue with its cautious stance and try to grow at 1.0% to 1.5% over thebanking industry’s average growth, given its strong presence in the industrially progressive states andthe support it receives from its overseasoperations.
•Strategic thrust will be on protecting the “Financial Soundness” that the Bank has consistentlymaintained throughout the past four, post‐global‐crisis years.
•With a primary focus on risk management, improvement of systems & controls, liquidity and capital strength, development of human capital and customer‐friendly branch structures, etc.
• To quote Michael Porter (Harvard University), “ The ability to change constantly and effectively is made easier by high‐level continuity”.
•Bank of Baroda’s proven track record in high‐level continuity would help it tide over the present long stretched downturn quite effectively.
•Thank you.


![The Bahamas Nationality Regulations - Bahamas Immigration€¦ · THE BAHAMAS NATIONALITY [CH.190 – 7[Original Service 2001] STATUTE LAW OF THE BAHAMAS 16. An application for a](https://img.pdfslide.us/doc/110x75/5ec52238bbef09285e547b38/the-bahamas-nationality-regulations-bahamas-immigration-the-bahamas-nationality.jpg)