Embed Size (px)
Citation preview
Judicial Diversity
Statistics 2016
Judicial Office Statistics Bulletin
Published 28 July 2016
Judicial Diversity Statistics 2016
2
Contents
Introduction 3
Key findings 4
Diversity in the Courts 5
Diversity in the Tribunals 11
Primary and secondary roles 14
Magistrates 15
Data quality 16
Contacts 17
Judicial Diversity Statistics 2016
3
This bulletin provides an overview of the diversity of appointed judges in the courts and tribunals on 1 April 2016. Where a judge holds more than one appointment the statistics are compiled for the appointment considered to be their primary appointment, i.e. the appointment they hold most of the time.
This bulletin gives a summary of the results and commentary on the following characteristics:
• Gender
• Ethnicity
• Professional background
• Salaried/fee paid judges
• Age (first published in 2015)
The accompanying tables give a more detailed breakdown of these characteristics.
Any feedback, questions or requests for further information about this statistical bulletin should be directed to the contacts given at the end of this report.
Diversity characteristics of groups may change year on year due to promotions, recruitment, retirements and resignations. The recruitment exercises run over the last year by the Judicial Appointments Commission will also impact on diversity.
The Judicial Career Progression Chart provides an overview of progression through the judiciary in England and Wales https://www.judiciary.gov.uk/about-the-judiciary/judges-career-paths/judicial-career-progression-chart/
For an explanation of judicial roles see: https://www.judiciary.gov.uk/about-the-judiciary/who-are-the-judiciary/judicial-roles/
Any feedback, questions or requests for further information about this statistical bulletin should be directed to the contacts given at the end of this report.
Users
The main users of these statistics are ministers and officials in central government, the Judicial Appointments Commission and Judicial Office responsible for developing policy with regards to judicial diversity. Other users include judges, lawyers and academics, and the professional bodies such as The Bar Council, The Law Society, and The Chartered Institute of Legal Executives.
Introduction
Judicial Diversity Statistics 2016
4
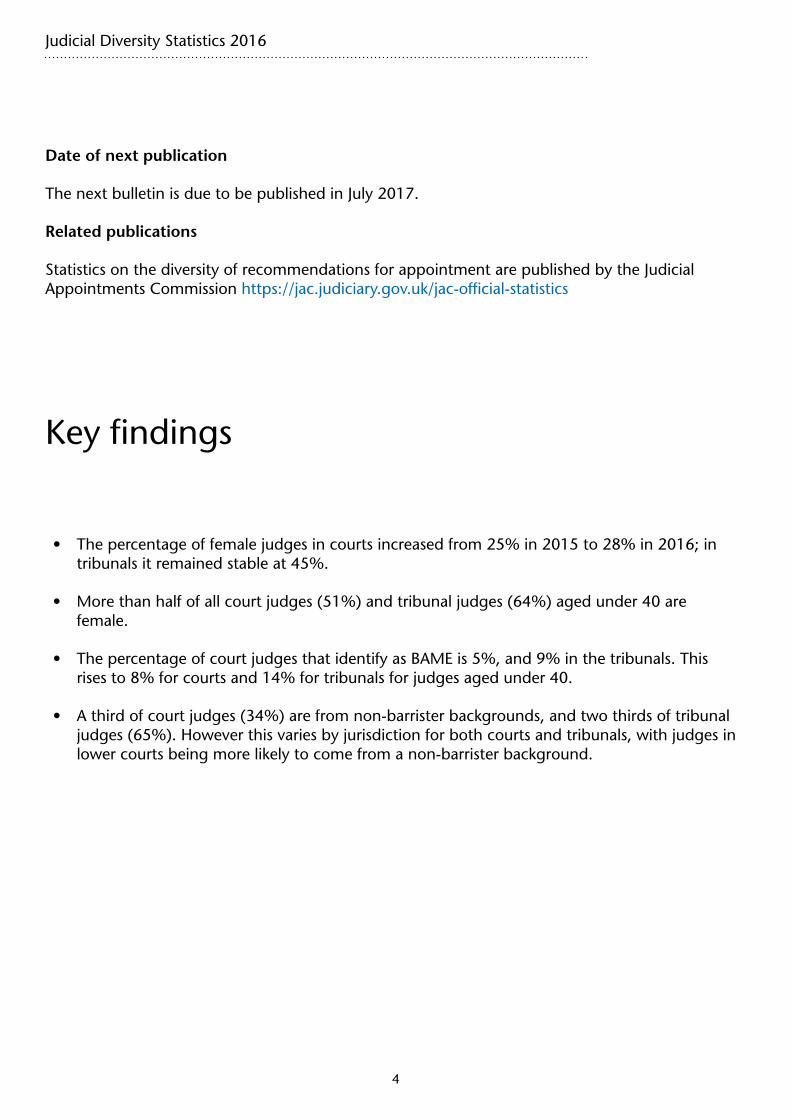
• The percentage of female judges in courts increased from 25% in 2015 to 28% in 2016; in tribunals it remained stable at 45%.
• More than half of all court judges (51%) and tribunal judges (64%) aged under 40 are female.
• The percentage of court judges that identify as BAME is 5%, and 9% in the tribunals. This rises to 8% for courts and 14% for tribunals for judges aged under 40.
• A third of court judges (34%) are from non-barrister backgrounds, and two thirds of tribunal judges (65%). However this varies by jurisdiction for both courts and tribunals, with judges in lower courts being more likely to come from a non-barrister background.
Key findings
Date of next publication
The next bulletin is due to be published in July 2017.
Related publications
Statistics on the diversity of recommendations for appointment are published by the Judicial Appointments Commission https://jac.judiciary.gov.uk/jac-official-statistics
Judicial Diversity Statistics 2016
5
Diversity in the CourtsJudges by gender (Table 1.1)
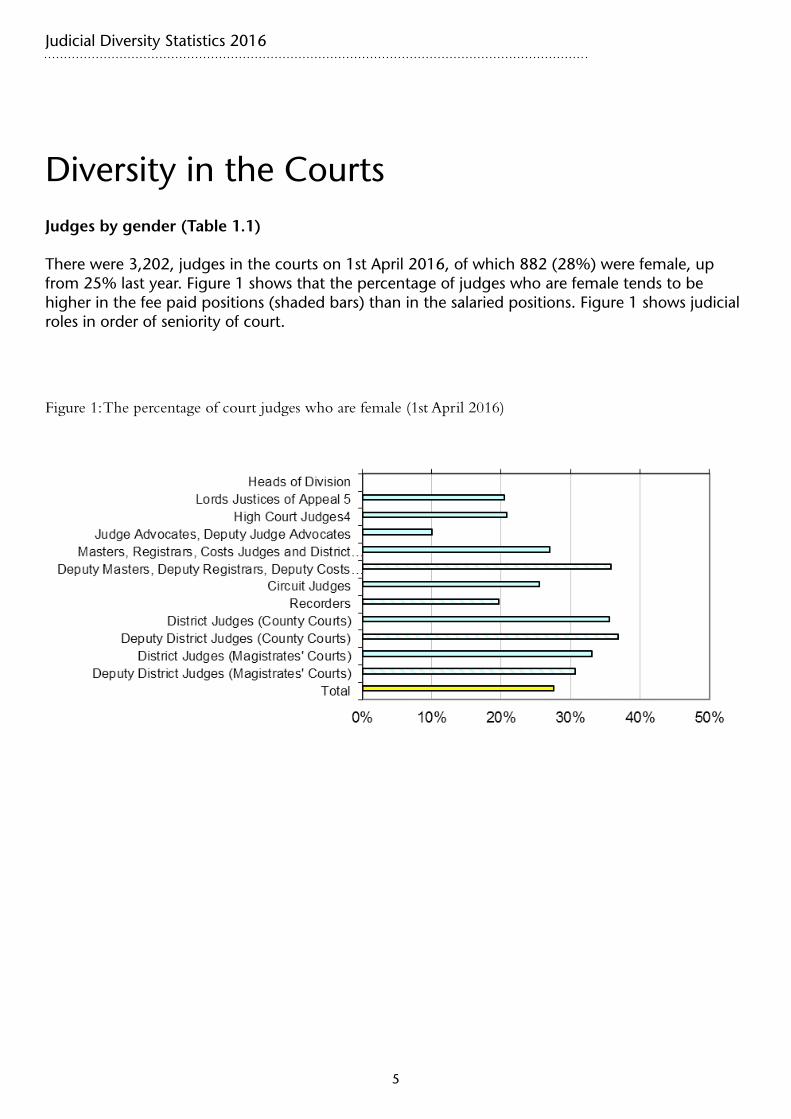
There were 3,202, judges in the courts on 1st April 2016, of which 882 (28%) were female, up from 25% last year. Figure 1 shows that the percentage of judges who are female tends to be higher in the fee paid positions (shaded bars) than in the salaried positions. Figure 1 shows judicial roles in order of seniority of court.
Figure 1: The percentage of court judges who are female (1st April 2016)
Judicial Diversity Statistics 2016
6
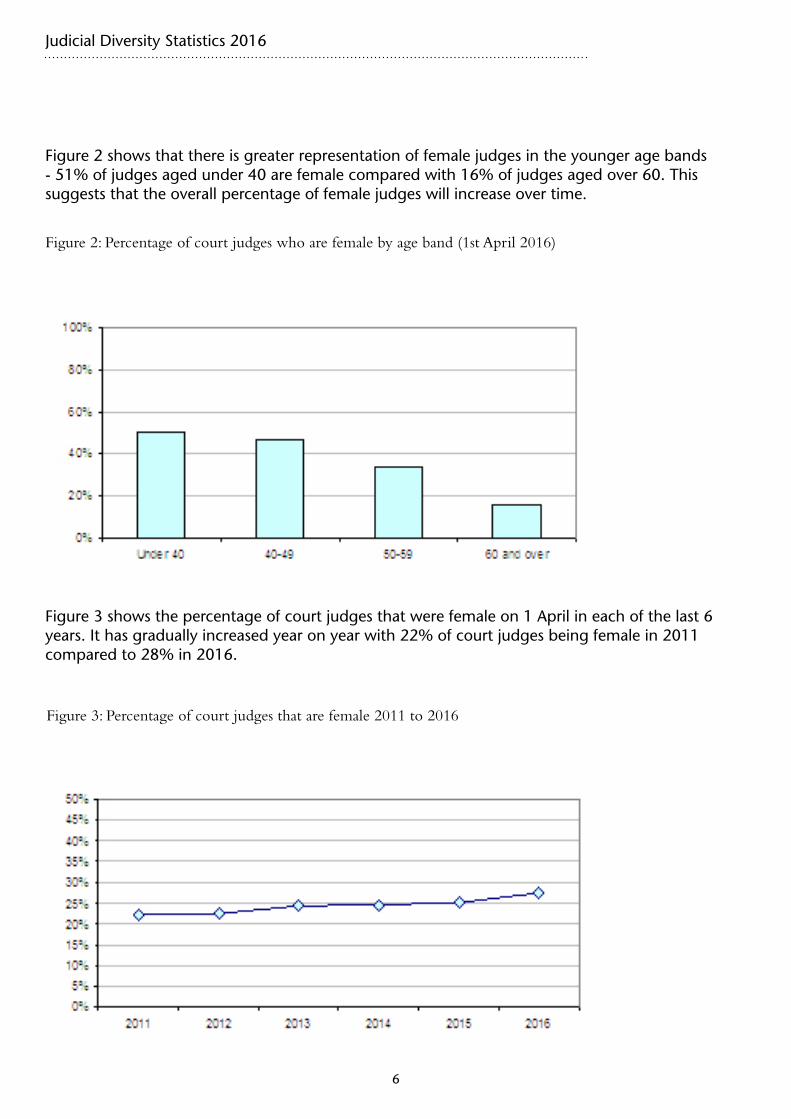
Figure 2 shows that there is greater representation of female judges in the younger age bands - 51% of judges aged under 40 are female compared with 16% of judges aged over 60. This suggests that the overall percentage of female judges will increase over time.
Figure 3 shows the percentage of court judges that were female on 1 April in each of the last 6 years. It has gradually increased year on year with 22% of court judges being female in 2011 compared to 28% in 2016.
Figure 2: Percentage of court judges who are female by age band (1st April 2016)
Figure 3: Percentage of court judges that are female 2011 to 2016
Judicial Diversity Statistics 2016
7
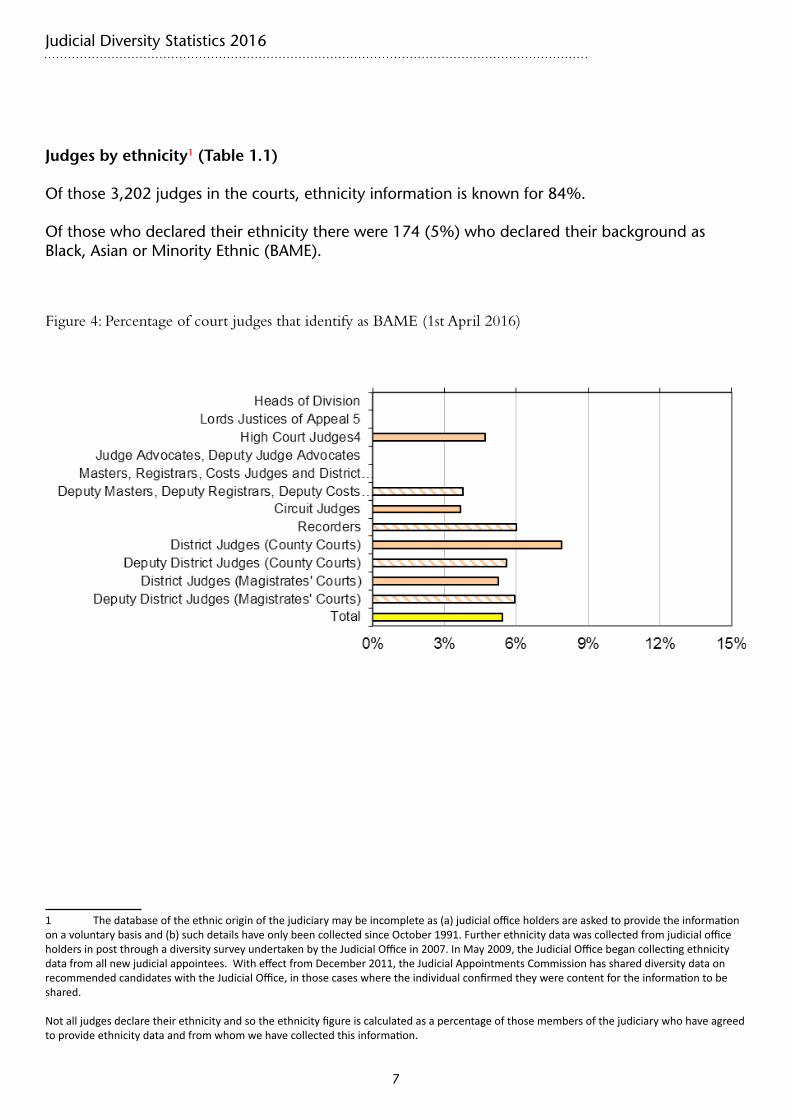
Judges by ethnicity1 (Table 1.1)
Of those 3,202 judges in the courts, ethnicity information is known for 84%.
Of those who declared their ethnicity there were 174 (5%) who declared their background as Black, Asian or Minority Ethnic (BAME).
1 Thedatabaseoftheethnicoriginofthejudiciarymaybeincompleteas(a)judicialofficeholdersareaskedtoprovidetheinformationonavoluntarybasisand(b)suchdetailshaveonlybeencollectedsinceOctober1991.FurtherethnicitydatawascollectedfromjudicialofficeholdersinpostthroughadiversitysurveyundertakenbytheJudicialOfficein2007.InMay2009,theJudicialOfficebegancollectingethnicitydatafromallnewjudicialappointees.WitheffectfromDecember2011,theJudicialAppointmentsCommissionhasshareddiversitydataonrecommendedcandidateswiththeJudicialOffice,inthosecaseswheretheindividualconfirmedtheywerecontentfortheinformationtobeshared.
Notalljudgesdeclaretheirethnicityandsotheethnicityfigureiscalculatedasapercentageofthosemembersofthejudiciarywhohaveagreedtoprovideethnicitydataandfromwhomwehavecollectedthisinformation.
Figure 4: Percentage of court judges that identify as BAME (1st April 2016)
Judicial Diversity Statistics 2016
8
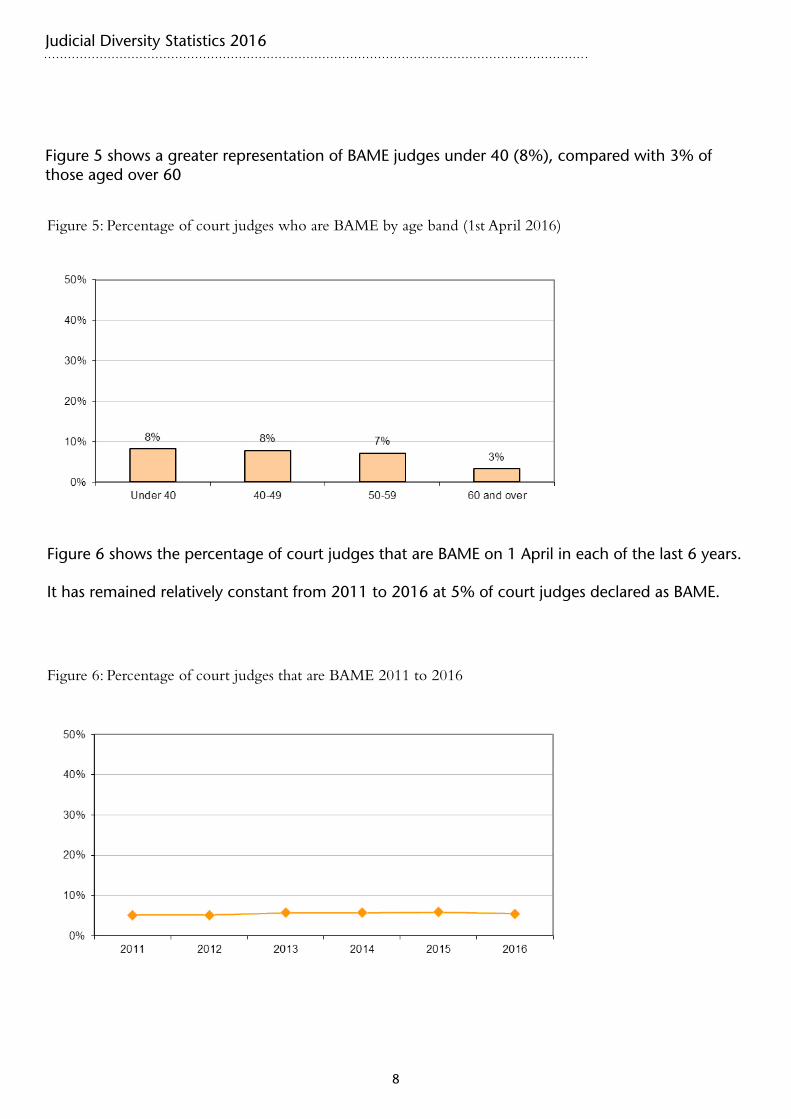
Figure 5 shows a greater representation of BAME judges under 40 (8%), compared with 3% of those aged over 60
Figure 6 shows the percentage of court judges that are BAME on 1 April in each of the last 6 years.
It has remained relatively constant from 2011 to 2016 at 5% of court judges declared as BAME.
Figure 5: Percentage of court judges who are BAME by age band (1st April 2016)
Figure 6: Percentage of court judges that are BAME 2011 to 2016
Judicial Diversity Statistics 2016
9
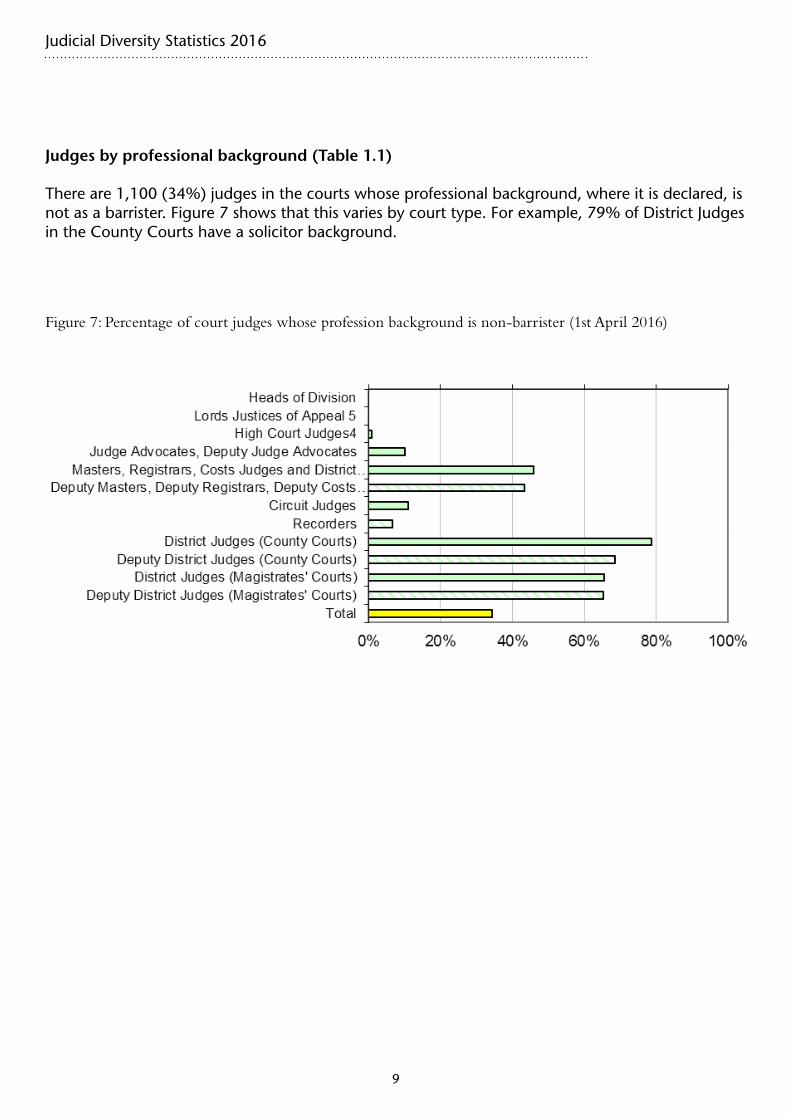
Judges by professional background (Table 1.1)
There are 1,100 (34%) judges in the courts whose professional background, where it is declared, is not as a barrister. Figure 7 shows that this varies by court type. For example, 79% of District Judges in the County Courts have a solicitor background.
Figure 7: Percentage of court judges whose profession background is non-barrister (1st April 2016)
Judicial Diversity Statistics 2016
10
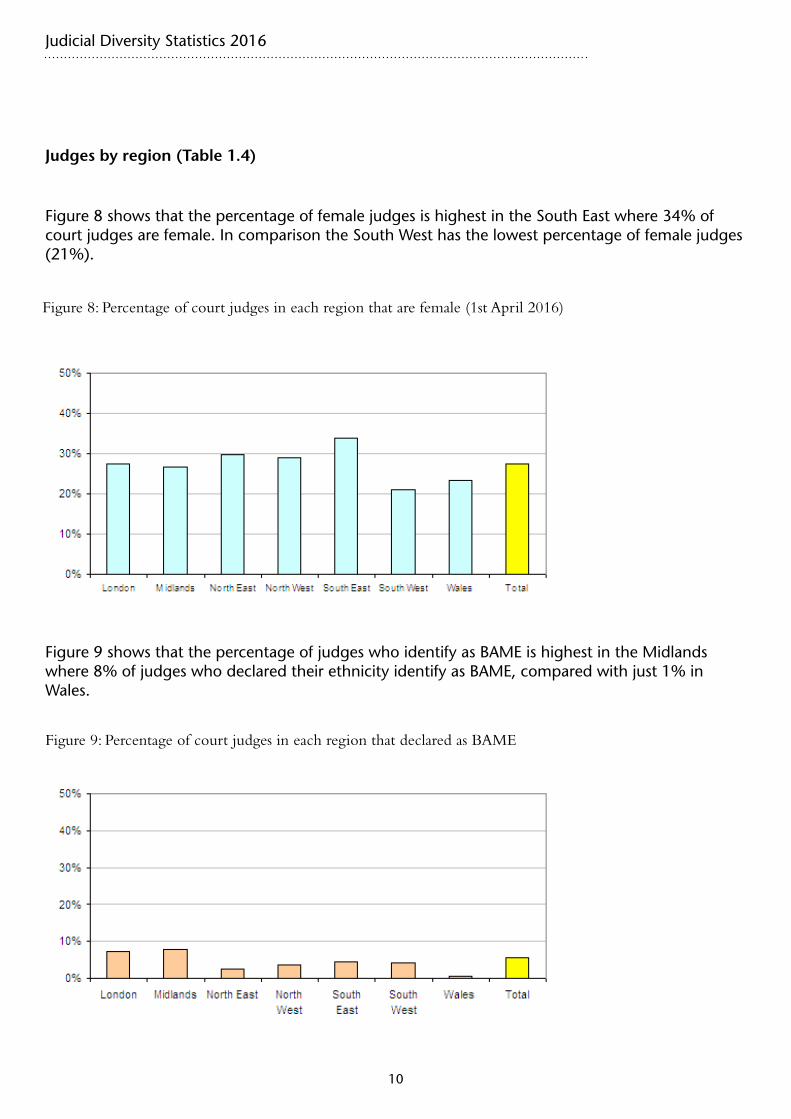
Figure 8 shows that the percentage of female judges is highest in the South East where 34% of court judges are female. In comparison the South West has the lowest percentage of female judges (21%).
Figure 9 shows that the percentage of judges who identify as BAME is highest in the Midlands where 8% of judges who declared their ethnicity identify as BAME, compared with just 1% in Wales.
Judges by region (Table 1.4)
Figure 8: Percentage of court judges in each region that are female (1st April 2016)
Figure 9: Percentage of court judges in each region that declared as BAME
Judicial Diversity Statistics 2016
11
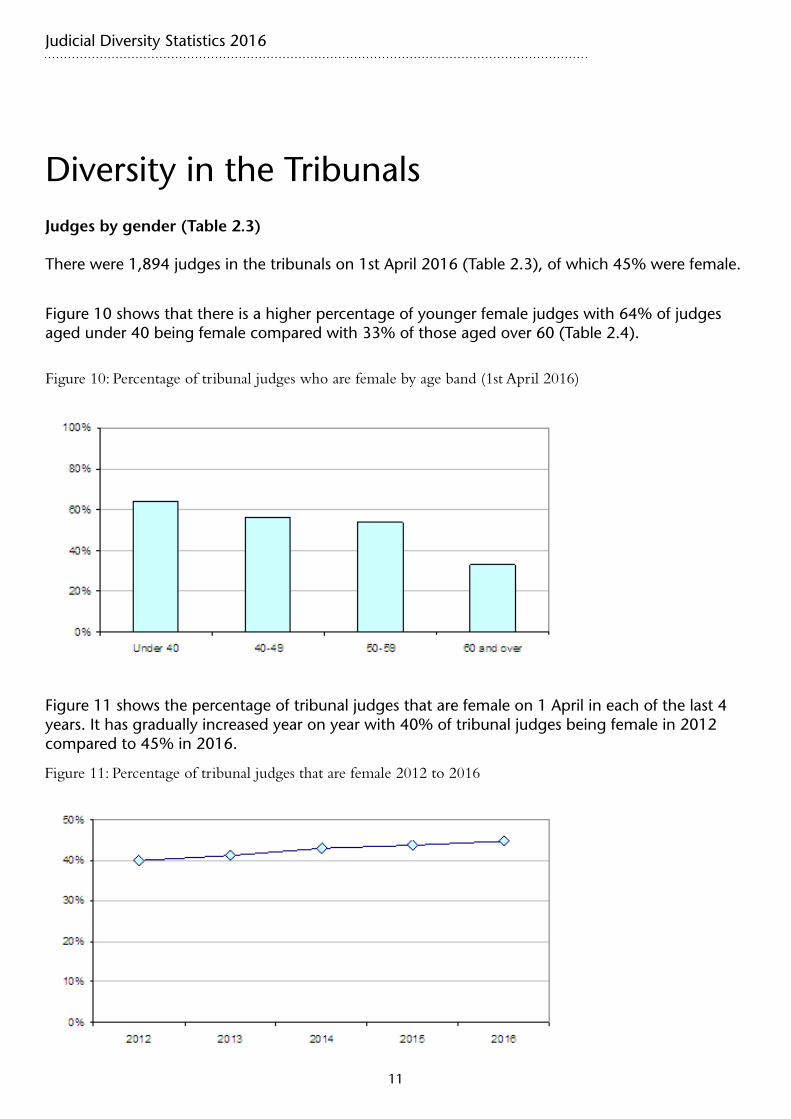
Diversity in the TribunalsJudges by gender (Table 2.3)
There were 1,894 judges in the tribunals on 1st April 2016 (Table 2.3), of which 45% were female.
Figure 10 shows that there is a higher percentage of younger female judges with 64% of judges aged under 40 being female compared with 33% of those aged over 60 (Table 2.4).
Figure 11 shows the percentage of tribunal judges that are female on 1 April in each of the last 4 years. It has gradually increased year on year with 40% of tribunal judges being female in 2012 compared to 45% in 2016.
Figure 10: Percentage of tribunal judges who are female by age band (1st April 2016)
Figure 11: Percentage of tribunal judges that are female 2012 to 2016
Judicial Diversity Statistics 2016
12
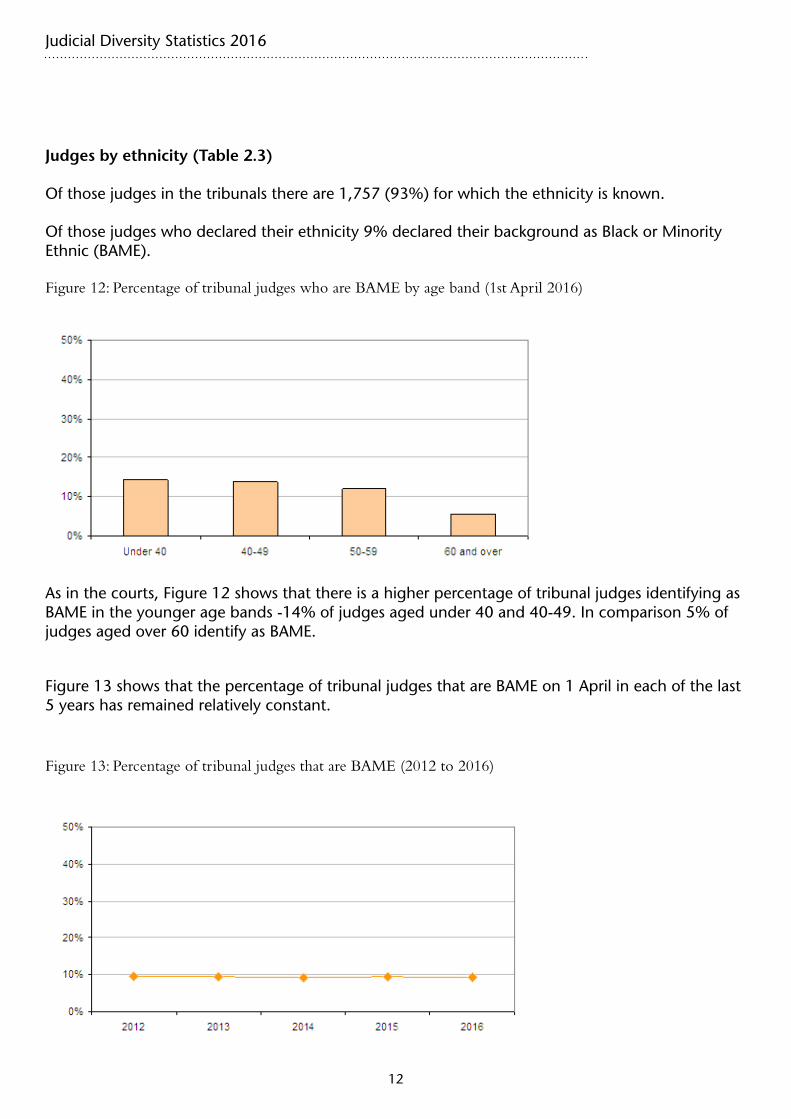
Judges by ethnicity (Table 2.3)
Of those judges in the tribunals there are 1,757 (93%) for which the ethnicity is known.
Of those judges who declared their ethnicity 9% declared their background as Black or Minority Ethnic (BAME).
As in the courts, Figure 12 shows that there is a higher percentage of tribunal judges identifying as BAME in the younger age bands -14% of judges aged under 40 and 40-49. In comparison 5% of judges aged over 60 identify as BAME.
Figure 13 shows that the percentage of tribunal judges that are BAME on 1 April in each of the last 5 years has remained relatively constant.
Figure 12: Percentage of tribunal judges who are BAME by age band (1st April 2016)
Figure 13: Percentage of tribunal judges that are BAME (2012 to 2016)
Judicial Diversity Statistics 2016
13
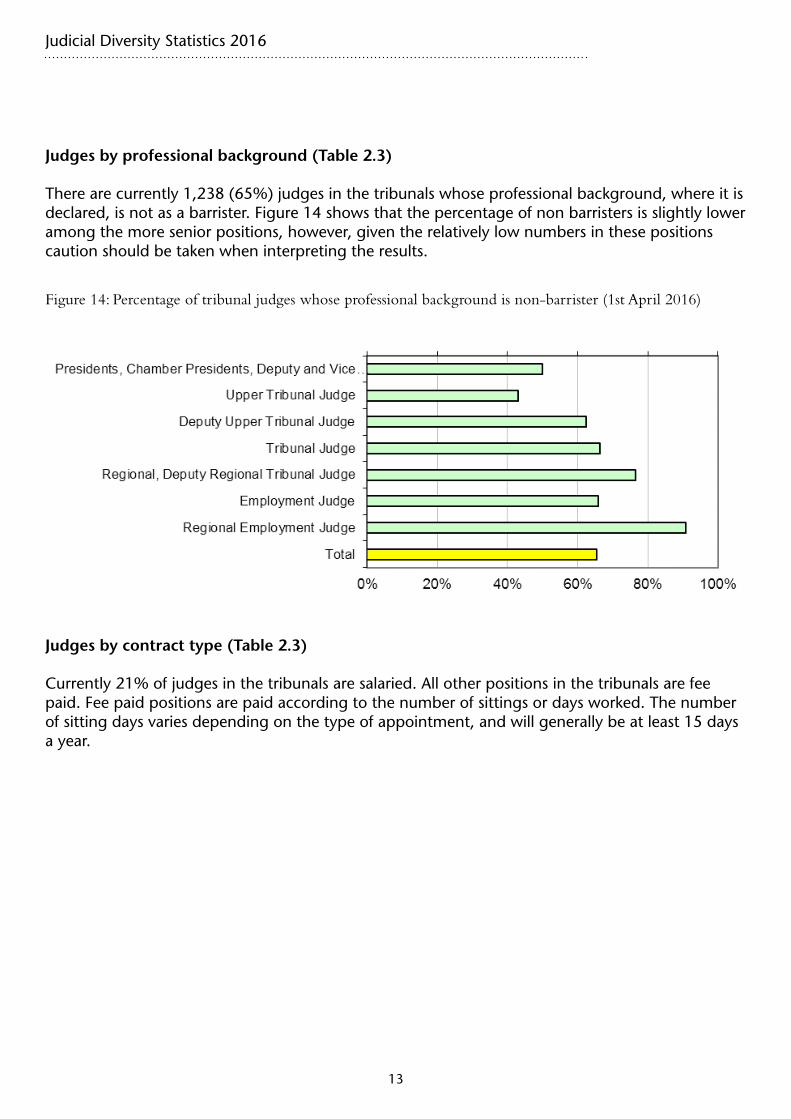
Judges by professional background (Table 2.3)
There are currently 1,238 (65%) judges in the tribunals whose professional background, where it is declared, is not as a barrister. Figure 14 shows that the percentage of non barristers is slightly lower among the more senior positions, however, given the relatively low numbers in these positions caution should be taken when interpreting the results.
Judges by contract type (Table 2.3)
Currently 21% of judges in the tribunals are salaried. All other positions in the tribunals are fee paid. Fee paid positions are paid according to the number of sittings or days worked. The number of sitting days varies depending on the type of appointment, and will generally be at least 15 days a year.
Figure 14: Percentage of tribunal judges whose professional background is non-barrister (1st April 2016)
Judicial Diversity Statistics 2016
14
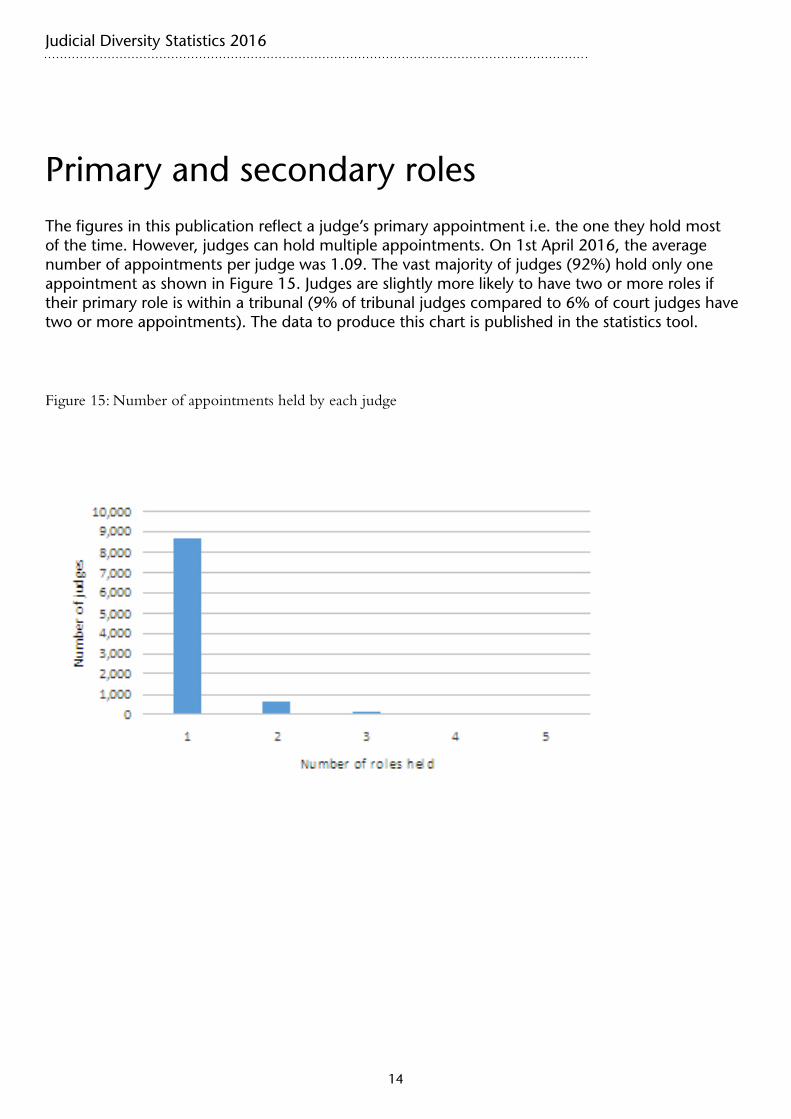
Primary and secondary rolesThe figures in this publication reflect a judge’s primary appointment i.e. the one they hold most of the time. However, judges can hold multiple appointments. On 1st April 2016, the average number of appointments per judge was 1.09. The vast majority of judges (92%) hold only one appointment as shown in Figure 15. Judges are slightly more likely to have two or more roles if their primary role is within a tribunal (9% of tribunal judges compared to 6% of court judges have two or more appointments). The data to produce this chart is published in the statistics tool.
Figure 15: Number of appointments held by each judge
Judicial Diversity Statistics 2016
15
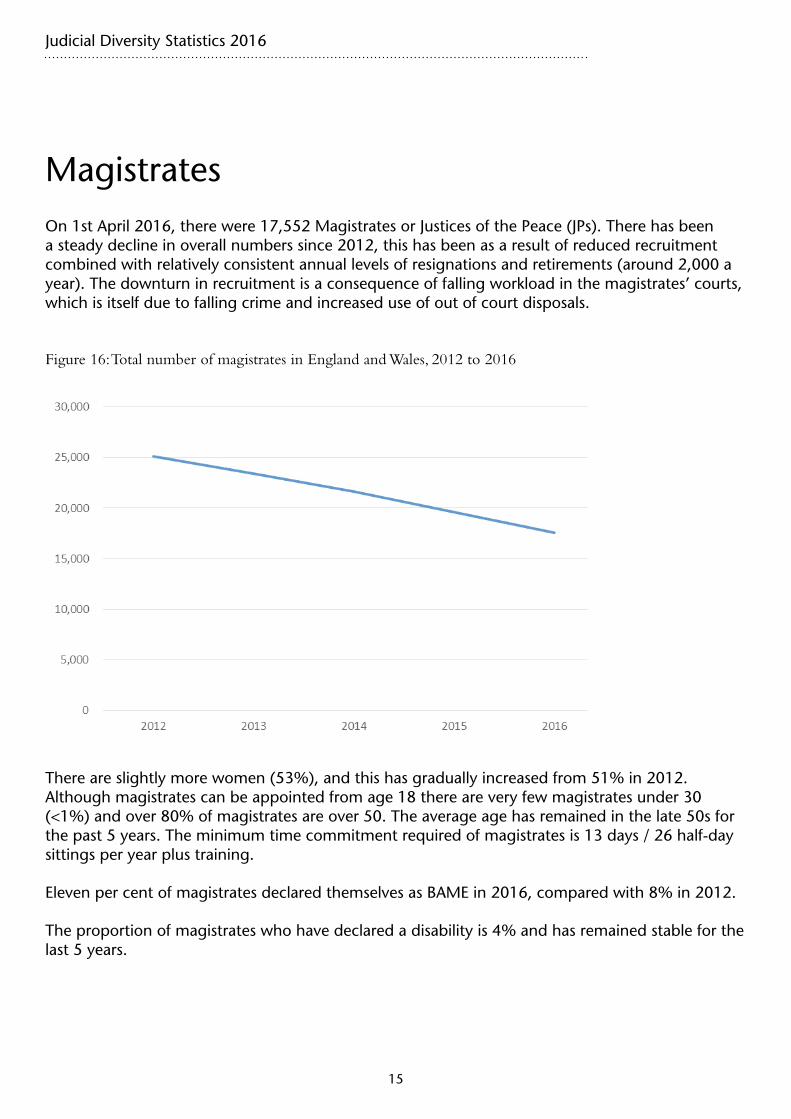
MagistratesOn 1st April 2016, there were 17,552 Magistrates or Justices of the Peace (JPs). There has been a steady decline in overall numbers since 2012, this has been as a result of reduced recruitment combined with relatively consistent annual levels of resignations and retirements (around 2,000 a year). The downturn in recruitment is a consequence of falling workload in the magistrates’ courts, which is itself due to falling crime and increased use of out of court disposals.
Figure 16: Total number of magistrates in England and Wales, 2012 to 2016
There are slightly more women (53%), and this has gradually increased from 51% in 2012. Although magistrates can be appointed from age 18 there are very few magistrates under 30 (<1%) and over 80% of magistrates are over 50. The average age has remained in the late 50s for the past 5 years. The minimum time commitment required of magistrates is 13 days / 26 half-day sittings per year plus training.
Eleven per cent of magistrates declared themselves as BAME in 2016, compared with 8% in 2012.
The proportion of magistrates who have declared a disability is 4% and has remained stable for the last 5 years.
Judicial Diversity Statistics 2016
16
Data qualityA new HR system (e-HR) has been introduced for the judiciary in 2016 and has rationalised a number of existing systems which contained HR and training data. Validation of the data since migration is ongoing
The database of the ethnic origin of the judiciary may be incomplete as (a) judicial office holders are asked to provide the information on a voluntary basis and (b) such details have only been collected since October 1991. Further ethnicity data was collected from judicial office holders in post through a diversity survey undertaken by the Judicial Office in 2007. In May 2009, the Judicial Office began collecting ethnicity data from all new judicial appointees. With effect from December 2011, the Judicial Appointments Commission has shared diversity data on selected candidates with the Judicial Office, in those cases where the individual confirmed they were content for the information to be shared.
Judicial Diversity Statistics 2016
17
Contacts Enquires or comments about the content and statistics in this bulletin should be directed to:
Alison Colquhoun
Statistician
Judicial Office
7.07, 102 Petty France, London SW1H 9AJ
Email: [email protected]
For media enquiries on the content of this bulletin, contact:
Stephen Ward
Judicial Office
Email: [email protected]
Tel: 0207 947 6438
General information about the official statistics system of the United Kingdom is available from:
http://statisticsauthority.gov.uk/about-the-authority/uk-statistical-system