Embed Size (px)
Citation preview

A guide to reading the Official Statistics on judicial review in
the Administrative Court
October 2020
Lewis Graham, Lee Marsons,
Professor Maurice Sunkin, and Dr Joe Tomlinson

2
1. This short guide aims to help people understand what the official statistics tell us (and do not tell us) about the use of judicial review in the Administrative Court. The note draws on the civil justice statistics published annually by the Ministry of Justice. This note explains the available statistics in an impartial way with a view to making them easier to read and understand, and therefore more widely accessible.
2. Judicial review (JR) is a process where the legality of a decision of a public authority is challenged. This can take place in different courts and tribunals. However, the Administrative Court is the main forum and the statistics discussed here concern JR in the Administrative Court.
3. The JR procedure has multiple stages. First, there is the pre-action stage. Here, a Pre-Action Protocol letter is sent, signalling the claimant’s intention to challenge a decision. Often, cases are settled before a formal application for JR is lodged. There is no data on pre-action settlement in the official statistics as those matters never formally enter the justice system.
4. Second, an application for JR is lodged with the Administrative Court. The statistics show how many applications for JR are lodged. They show that the number of JR applications lodged rose steadily from 2000 onwards but has been decreasing over the last few years. In fact, fewer JRs were lodged in 2019 compared to any year since 2000.
5. It is important to note that immigration cases have largely been transferred out of the Administrative Court in the last decade. On 17 October 2011, claims in the category of Human Rights and Asylum Fresh Claim applications were transferred to the Upper Tribunal. From November 2013, the Upper Tribunal of the Immigration and Asylum Chamber took over assessing applications for the vast majority of Immigration and Asylum JRs. For this reason, these cases are no longer included in the JR statistics: they were last included in the 2013 figures. That is why the number of claims lodged then fell sharply. The total numbers of JR cases lodged each year since 2000 are shown in the following graph and table.
4,2384,722
5,3725,938
4,2005,356
6,4216,6857,093
9,098
10,55111,360
12,429
15,592
4,0654,6814,3014,196
3,5953,384
0
2,000
4,000
6,000
8,000
10,000
12,000
14,000
16,000
18,000
Total cases lodged

3
Year Total cases lodged
2000 4,238
2001 4,722
2002 5,372
2003 5,938
2004 4,200
2005 5,356
2006 6,421
2007 6,685
2008 7,093
2009 9,098
2010 10,551
2011 11,360
2012 12,429
2013 15,592
2014 4,065
2015 4,681
2016 4,301
2017 4,196
2018 3,595
2019 3,384
6. Once an application is lodged, it will be considered for permission. This is where the Court
assesses if a case is arguable and should be considered at a full hearing. Permission may be
a two-stage process. Permission decisions are first made on the basis of written argument
alone (on the papers). If permission is granted on the papers the case can proceed to a final
hearing. If permission is refused on the papers then claimants can “renew” their argument at
an oral permission hearing. The statistics show how many cases reach both permission
stages and whether permission is granted or refused. The following charts show what
percentage of claims reaching each stage are granted permission to proceed by the court.
Oral renewal stage
permission granted permission refused
Written permission stage
permission granted permission refused

4
7. 2019 was a typical year in terms of success rates at the permission stage. The statistics show that over the last few years, around 20% of applications that reached the permission stage were granted permission to proceed to a full hearing. The following graph charts the overall number of cases that reached the permission stage and the overall number of cases granted permission, in each calendar year.
8. It is important to remember that many cases may drop out of the system before reaching
the permission stage. The details of these cases are not provided in these statistics, but their number can be worked out from the data provided. In 2019, for example, 3,384 applications were lodged, but only 2,487 cases reached the initial permission stage. This indicates that roughly 27% of cases were withdrawn, settled or otherwise removed from the JR system before permission was determined. This is a rough figure in part because the statistics show the number of cases by calendar year and some claims will be lodged in one year but will be withdrawn or considered at the permission or the final hearing stage in another year.
3,5904,077
4,4134,786
3,142
3,687
4,2074,422
4,624
5,318
6,6667,076
8,1458,492
3,200
3,7193,254 3,303
2,7032,487
1,381 1,3541,091
1,589
849 1,014 1,067 953 1,066 1,205 1,343 1,292 1,477 1,628
814 807 743 828 758 638
0
1,000
2,000
3,000
4,000
5,000
6,000
7,000
8,000
9,000
2000 2001 2002 2003 2004 2005 2006 2007 2008 2009 2010 2011 2012 2013 2014 2015 2016 2017 2018 2019
Permission grant rates
Reached permission Overall permission granted decisions
Cases lodged (2019)
Reached permission stage Did not reach permission stage
5
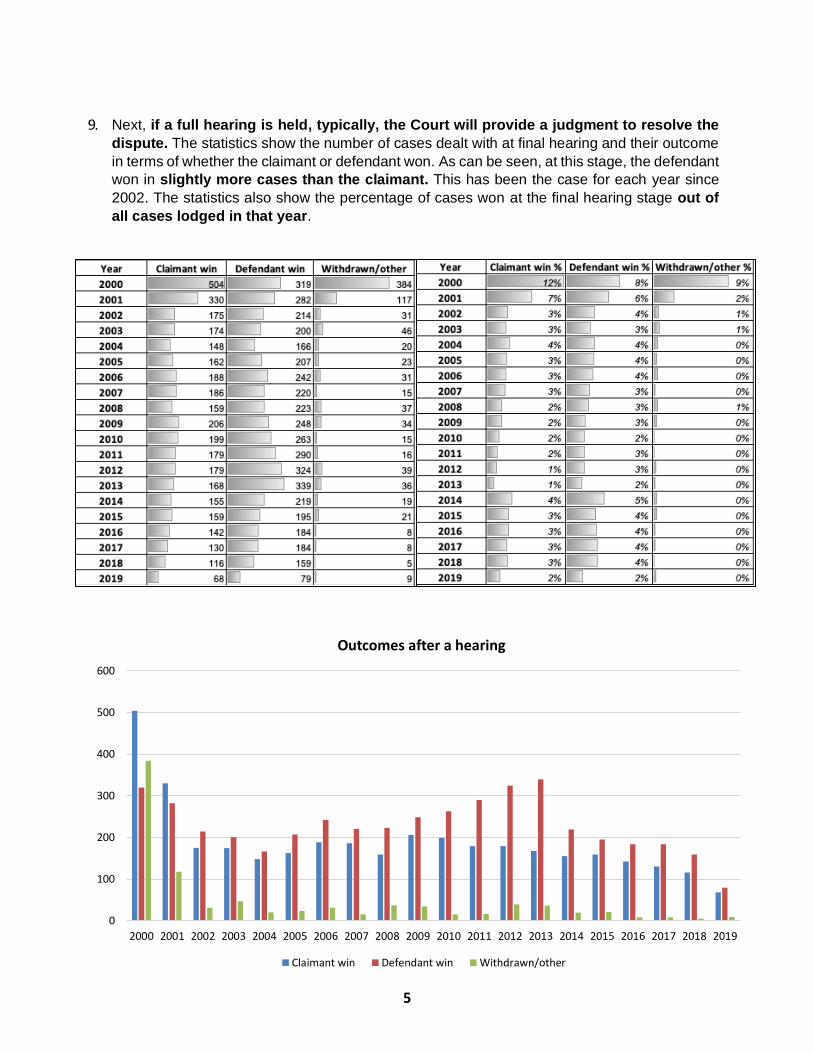
9. Next, if a full hearing is held, typically, the Court will provide a judgment to resolve the
dispute. The statistics show the number of cases dealt with at final hearing and their outcome
in terms of whether the claimant or defendant won. As can be seen, at this stage, the defendant
won in slightly more cases than the claimant. This has been the case for each year since
2002. The statistics also show the percentage of cases won at the final hearing stage out of
all cases lodged in that year.
0
100
200
300
400
500
600
2000 2001 2002 2003 2004 2005 2006 2007 2008 2009 2010 2011 2012 2013 2014 2015 2016 2017 2018 2019
Outcomes after a hearing
Claimant win Defendant win Withdrawn/other

6
10. The current statistics separate JRs into civil (Immigration and Asylum), other civil matters, and criminal cases (the total figures do not always match due to a small number of unknown cases).
11. As can be seen, the number of JRs lodged each year which concern civil matters always significantly outweighs the number of those concerning criminal matters.
Year Total cases Civil Criminal
2000 4,238 3,878 348
2001 4,722 4,370 344
2002 5,372 5,093 276
2003 5,938 5,655 282
2004 4,200 3,886 314
2005 5,356 5,065 291
2006 6,421 6,105 315
2007 6,685 6,374 311
2008 7,093 6,746 346
2009 9,098 8,749 345
2010 10,551 10,184 367
2011 11,360 10,995 363
2012 12,430 12,045 384
2013 15,592 15,319 273
2014 4,065 3,797 268
2015 4,681 4,418 262
2016 4,301 4,081 220
2017 4,196 3,977 219
0%
10%
20%
30%
40%
50%
60%
70%
80%
90%
100%
2000 2001 2002 2003 2004 2005 2006 2007 2008 2009 2010 2011 2012 2013 2014 2015 2016 2017 2018 2019
Subject matter of judicial review: civil and criminal (per year)
Civil % Criminal %
7
Year Total cases Civil Criminal
2018 3,595 3,386 209
2019 3,383 3,212 171
12. Fluctuations in the number of applications relating to civil matters is mainly due to changes in the field of immigration. The number of non-immigration civil cases has remained relatively constant over the last decade, at around 2,000 per year.
13. Judicial review can be used to challenge bodies performing public functions and these include central government, the police and (state) schools, and local and regional governments.
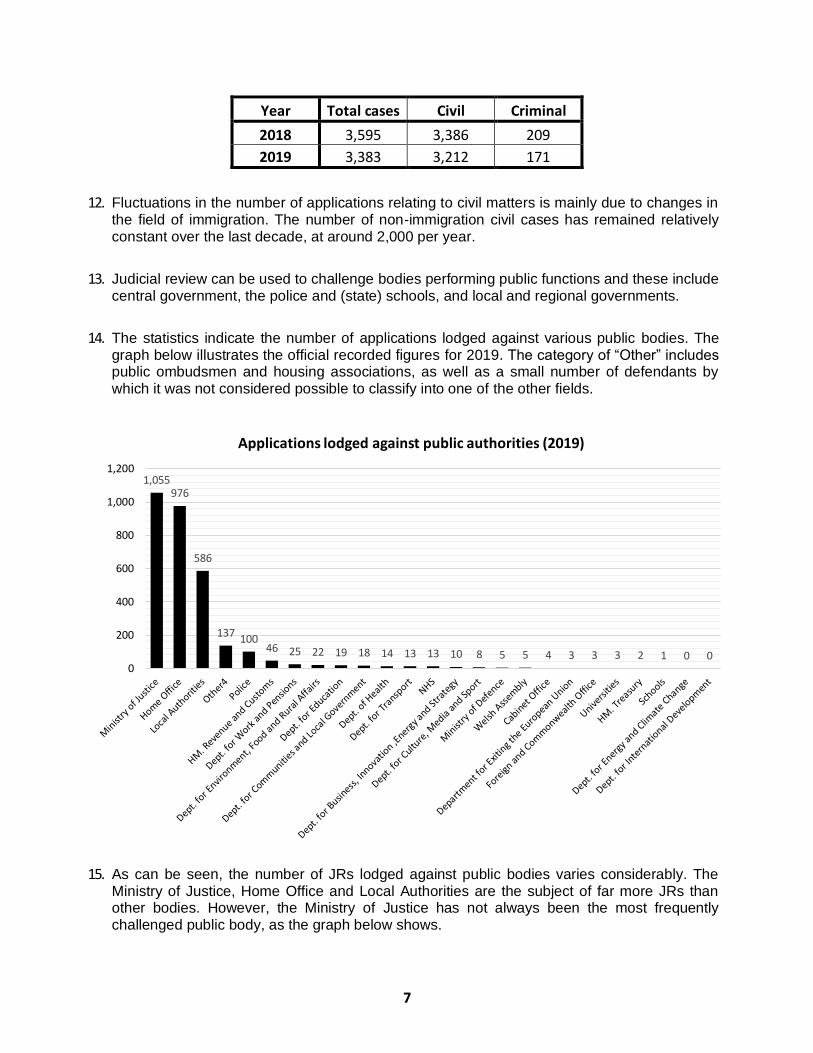
14. The statistics indicate the number of applications lodged against various public bodies. The graph below illustrates the official recorded figures for 2019. The category of “Other” includes public ombudsmen and housing associations, as well as a small number of defendants by which it was not considered possible to classify into one of the other fields.
15. As can be seen, the number of JRs lodged against public bodies varies considerably. The Ministry of Justice, Home Office and Local Authorities are the subject of far more JRs than other bodies. However, the Ministry of Justice has not always been the most frequently challenged public body, as the graph below shows.
1,055976
586
137100
46 25 22 19 18 14 13 13 10 8 5 5 4 3 3 3 2 1 0 00
200
400
600
800
1,000
1,200
Applications lodged against public authorities (2019)
8
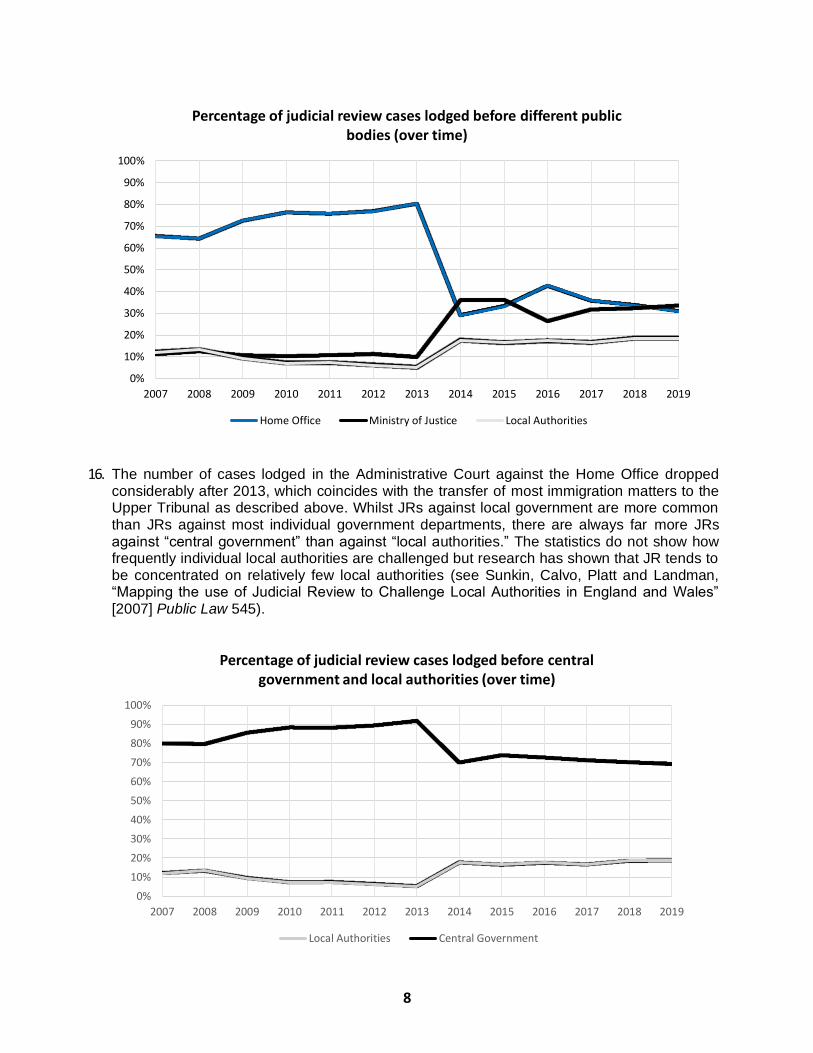
16. The number of cases lodged in the Administrative Court against the Home Office dropped considerably after 2013, which coincides with the transfer of most immigration matters to the Upper Tribunal as described above. Whilst JRs against local government are more common than JRs against most individual government departments, there are always far more JRs against “central government” than against “local authorities.” The statistics do not show how frequently individual local authorities are challenged but research has shown that JR tends to be concentrated on relatively few local authorities (see Sunkin, Calvo, Platt and Landman, “Mapping the use of Judicial Review to Challenge Local Authorities in England and Wales” [2007] Public Law 545).
0%
10%
20%
30%
40%
50%
60%
70%
80%
90%
100%
2007 2008 2009 2010 2011 2012 2013 2014 2015 2016 2017 2018 2019
Percentage of judicial review cases lodged before different public bodies (over time)
Home Office Ministry of Justice Local Authorities
0%
10%
20%
30%
40%
50%
60%
70%
80%
90%
100%
2007 2008 2009 2010 2011 2012 2013 2014 2015 2016 2017 2018 2019
Percentage of judicial review cases lodged before central government and local authorities (over time)
Local Authorities Central Government

9
17. The statistics show that the “success rate” of JRs varied according to the identity of the defendant. The graph below shows the average success rate of claims against the six public authorities with the most JRs lodged against them. Here, the average success rate is defined according to the total number of successful cases across the data available (rather than the mean annual success rate). It should also be borne in mind that the figures below compare the total number of cases succeeding with the number of cases granted permission to proceed to a full hearing. This means that these statistics do not tell us how many “unsuccessful” cases lost at a final hearing and how many were simply withdrawn.
18. The data suggests that JRs against the Ministry of Justice and police authorities were more likely to succeed compared to JRs against HMRC and the Home Office. However, these overall averages should not be considered in isolation. The “success rate” of JRs against different bodies varies, sometimes quite considerably, between years. Below are three sample graphs, illustrating the variation in success rates with respect to cases against HMRC, the NHS and police forces.
0%
5%
10%
15%
20%
25%
30%
35%
40%
45%
50%
Ministry of Justice Police Local Authorities NHS HM. Revenue andCustoms
Home Office
Percentage of permitted cases successful at final hearing (per public authority, total)

10
0%
10%
20%
30%
40%
50%
60%
2007 2008 2009 2010 2011 2012 2013 2014 2015 2016 2017 2018 2019
Percentage of permitted cases successful at final hearing against HMRC
0%
10%
20%
30%
40%
50%
60%
2007 2008 2009 2010 2011 2012 2013 2014 2015 2016 2017 2018 2019
Percentage of permitted cases successful at final hearing against the NHS
0%
10%
20%
30%
40%
50%
60%
2007 2008 2009 2010 2011 2012 2013 2014 2015 2016 2017 2018 2019
Percentage of permitted cases successful at final hearing against the police
11
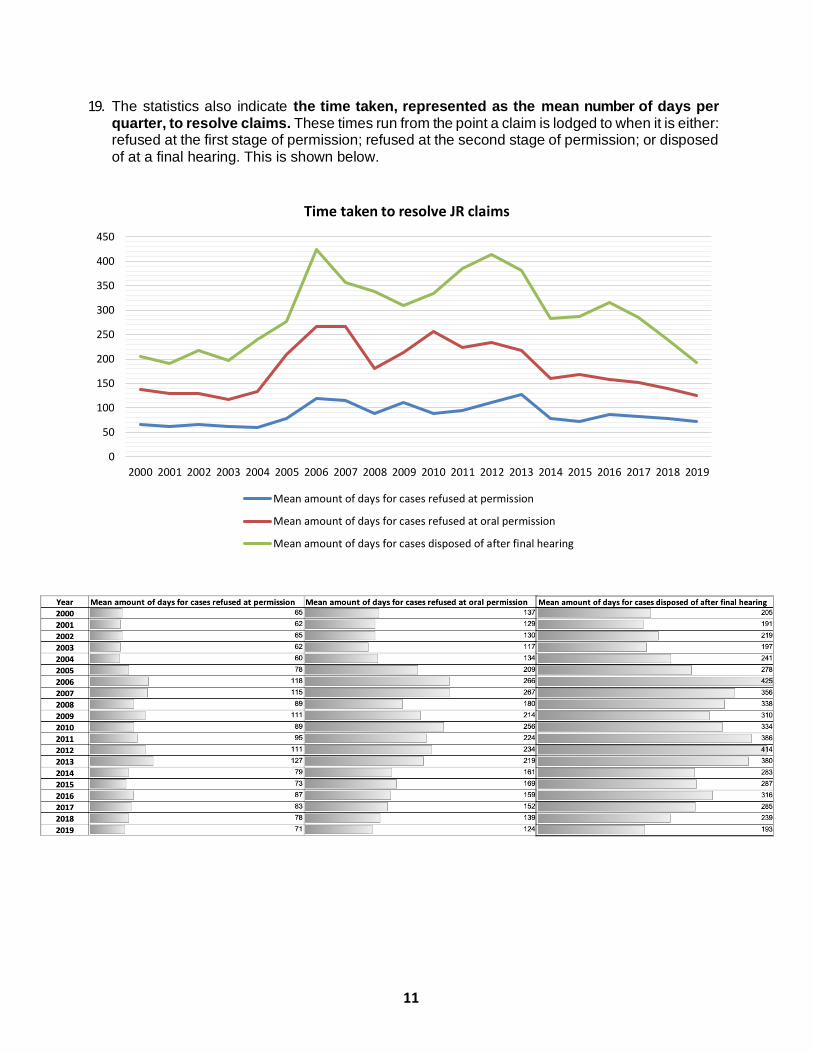
19. The statistics also indicate the time taken, represented as the mean number of days per quarter, to resolve claims. These times run from the point a claim is lodged to when it is either: refused at the first stage of permission; refused at the second stage of permission; or disposed of at a final hearing. This is shown below.
0
50
100
150
200
250
300
350
400
450
2000 2001 2002 2003 2004 2005 2006 2007 2008 2009 2010 2011 2012 2013 2014 2015 2016 2017 2018 2019
Time taken to resolve JR claims
Mean amount of days for cases refused at permission
Mean amount of days for cases refused at oral permission
Mean amount of days for cases disposed of after final hearing

12
20. It is important that these all stages of judicial review are not understood separately but as forming a part of a complete process. The Sankey diagram below shows how cases flow through the system. This diagram shows 2019 (the last complete calendar year on record). It does not show the pre-action process.

13
21. Finally, it is worth noting that these statistics do not show a number of important things about JR litigation. In particular, they do not show who the claimants are – whether for instance claimants are individuals, pressure or public interest groups, organisations, or public authorities; they do not tell us about the nature of the claims, whether for instance the claims focus on individual circumstances or raise public interest claims; they do not tell us how claims are funded or whether third parties intervened in claims; they do not tell us anything about the nature of settlements, for instance whether claims where settled in favour of claimants or defendants; they do not reveal the remedies granted by the court; and nor do the statistics tell us anything about what happened after the litigation.