Embed Size (px)
Citation preview
2017. 6. 15
Pharmaceuticals(OVERWEIGHT)
Earnings growth, R&D results in the spotlight in 2H
● Global, Korean pharma markets to grow 6.3% and 4.4% pa, respectively. Multiple
blockbusters to come off patent over 2016-2020, benefiting Korean biosimilar firms.
● Sea change from 2012 as Korean healthcare integrates with global ecosystem.
Next five years, virtuous circle: stronger brands/track records →→→→ financial gains. ● Eye government policy, regulatory direction; visibility to improve in 2H. Be
selective: buy firms with R&D successes, B2B track record, or improving earnings. ● Covered stocks: combined sales, operating profit to grow 14.1%, 47.9% y-y in 2017.
Medical aesthetics to stand out in 2Q; large pharmaceutical, biotech stocks in 2H. ● Top picks: Hanmi Pharm, Samsung Biologics, Hugel, Dentium, ST Pharm, Huons.
WHAT’S THE STORY?
Solid growth ahead for global, Korean pharmaceutical markets: The global pharmaceutical market is projected to grow at a 2016-2022 CAGR of 6.3% to reach USD1.12t, while its Korean counterpart should expand at 2017-2021 CAGR of 4.4% to KRW18.6t. Meanwhile, a second patent cliff is ahead: blockbuster drugs (including several biologics) worth USD249b will lose patent protection over 2016-2020. In short, things are looking good for the Korean companies that lead the global biosimilar market.
Sea change for Korean healthcare: Over 2012-2017, Korean healthcare firms made massive progress on R&D, B2B operations, and exports. Some signed large out-licensing deals with global pharmaceutical firms. Korea-made biosimilars dominate the global market, while Korea-made botulinum toxins and fillers are gaining global market share. We expect Korea to produce the world’s top biologics contract manufacturing organization and one of the world’s top-ten chemical-drug contract manufacturing services. Successes over the past five years owe much to the accumulation of technology, effective business strategies, investments by chaebol, and supportive government policies. Over the next five years, Korean healthcare firms should enter a virtuous cycle wherein stronger brand equities and track records lead to greater financial gains.
Monitor policy, regulatory direction: Korea’s healthcare industry should benefit if the government keeps election pledges to nurture the pharmaceutical, biotechnology, and medical device industries; halts the introduction of for-profit medical corporations; and raises subsidies for implants, hearing aids, and Alzheimer’s treatments. But prescription-drug makers will suffer if a total drug cost limit is enforced. Focus on firms specialized in OTC drugs, supplements, biotech, diagnostics, medical aesthetics, and medical devices.
To make visible progress on R&D, B2B fronts: In 2H, Hanmi Pharmaceutical should begin global Phase III clinical trials for Efpeglenatide and resume global Phase I trials for HM12525A/JNJ-64565111; Green Cross should win US approval for IVIG; Samsung Biologics should win US and European approval for three biosimilars; Medytox-Allegan should begin global Phase III trials for Innotox; Kolon Life Science should win domestic approval for Invossa; Genexine and Qurient should make progress on their B2B operations; and Seegene should begin supplying ODM products to Beckman Coulter.
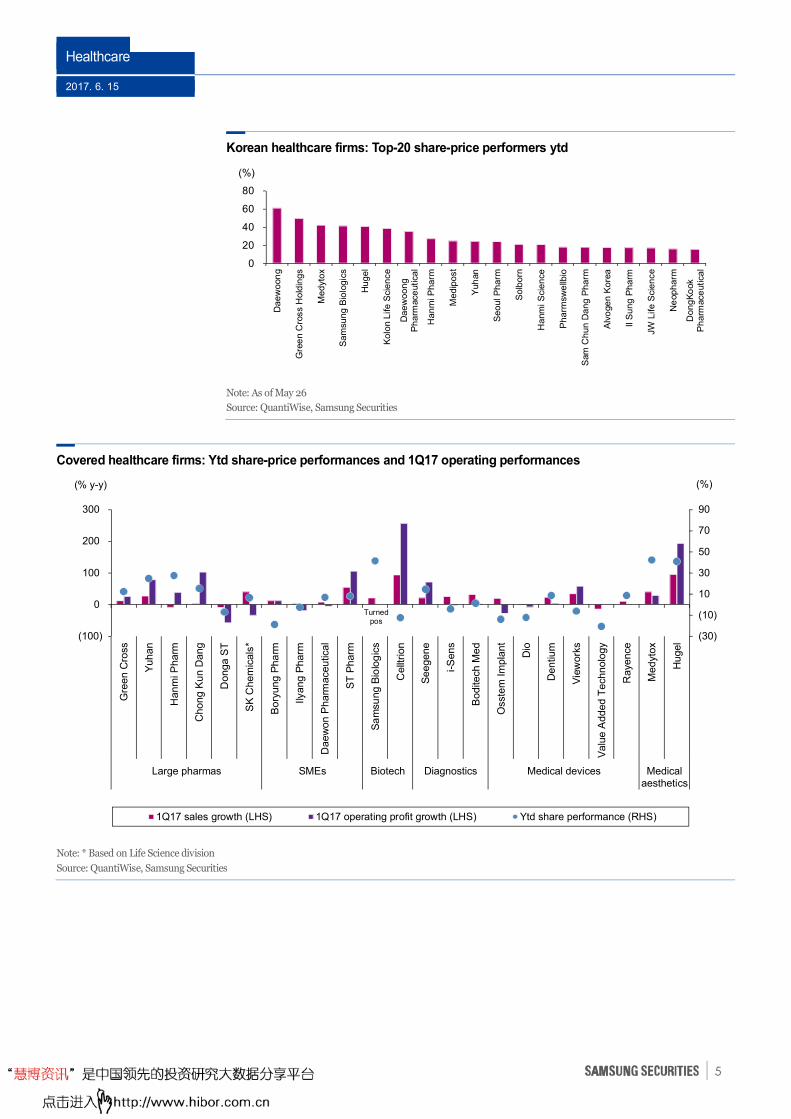
Operating profit growth: We have operating profits at our covered large pharmaceutical firms, medium-sized pharmaceutical firms, biotech, medical-diagnostics, medical-aesthetics, and medical-device firms growing 32.9%, 12.6%, 123.2%, 26.5%, 51.6%, and 15.6% y-y, respectively, in 2017. Medical aesthetics profits should stand out in 2Q on rising demand. In 2H, large pharmaceutical firms should shine on base effect and SG&A cost-cutting; biotech firms should shine on export growth. We foresee outstanding earnings growth over 2Q-4Q for Hanmi Pharm, Donga ST, Celltrion, Seegene, and Hugel.
Team Analysts
Brian Lee Team Head (Pharm/Biotech) [email protected] 822 2020 7177
SunYoung Yoon (Pharm/Biotech) [email protected] 822 2020 7840
Kevin Kim (Medical Devices/Medical Aesthetics) [email protected] 822 2020 7178
Research Associate
Wonyong Park [email protected] 822 2020 7847
Sector Update
AT A GLANCE
Hanmi Pharmaceutical (128940 KS, KRW364,000)
Target price: KRW450,000 (23.6%)
Samsung Biologics (207940 KS,
KRW213,500)
Target price: KRW260,000 (21.8%)
Hugel (145020 KS, KRW451,900)
Target price: KRW570,000 (26.1%)
Dentium (145720 KS, KRW37,450)
Target price: KRW50,000 (33.5%)
ST Pharm (237690 KS, KRW48,400)
Target price: KRW56,000 (15.7%)
Huons (243070 KS, KRW58,800)
Target price: n/a
* Share price and financials based on May 26
Healthcare
2017. 6. 15
2
1H review: Poverty in the midst of plenty
Healthcare indices largely in line with market in 1H; stock performances diverge
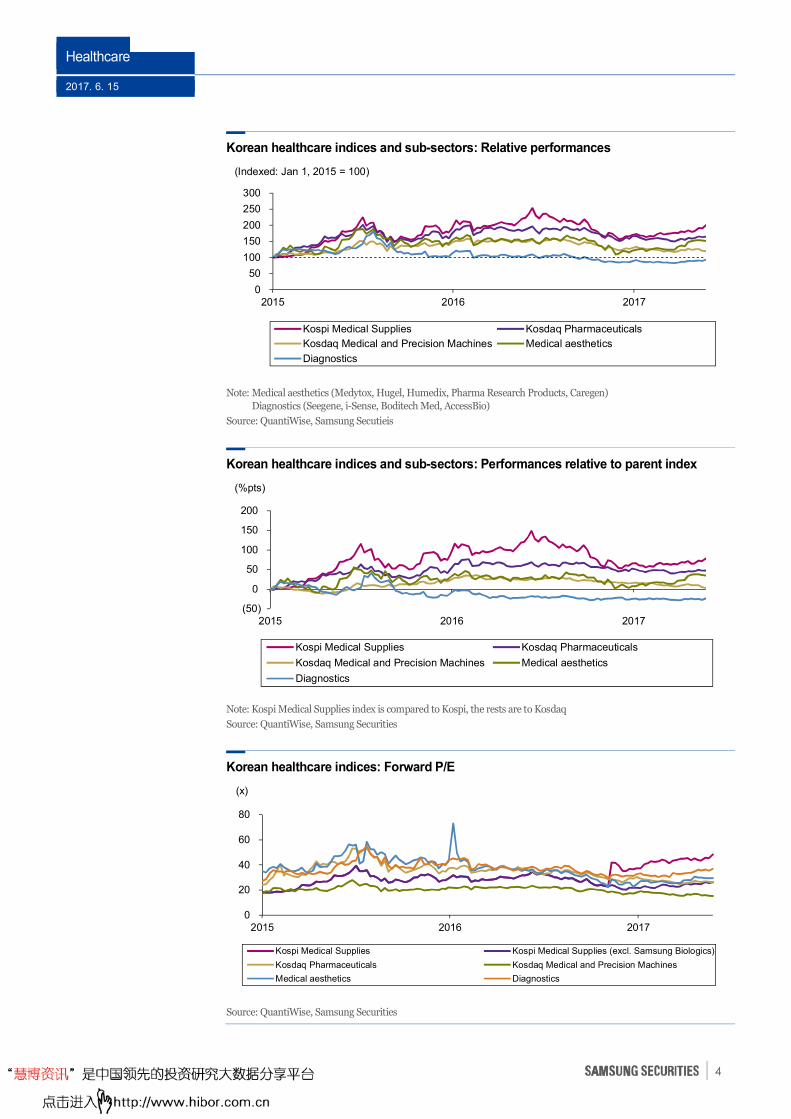
Kospi Medical Supplies Index performing in line in 1H: The Kospi Medical Supplies Index
peaked at 11,297 on Jun 10, 2016, bottomed at 6,988 on Dec 2, 2016, and bounced back to stand at
8,888 on May 26, 2017. The index is up 17.1% ytd, in line with the Kospi’s ytd gains of 16.2%. The
index excluding Samsung Biologics was valued as high as 40.1x P/E (Jul 22, 2016) and as low as
18.5x (Nov 18, 2016). It was valued at 26.2x on May 26, 2017.
Kosdaq Pharmaceutical Index underperforming in 1H: The Kosdaq Pharmaceutical Index
peaked at 7,552 on Feb 5, 2016, bottomed at 5,662 on Mar 24, 2017, and crept back up to stand at
6,209 on May 26, 2017. The index is down 1.3% ytd, underperforming the Kosdaq, which has gained
2.3%. The index’s P/E valuation peaked at 39.4x (Jan 29, 2015) and hit bottom at 24.6x (Mar 24,
2017). It was valued at 26.3x on May 26, 2017.
Sector sentiment weakening: Investors have been in thrall to the IT sector in 1H on prospects of
record earnings amid a semiconductor supply shortage and smartphone launches. Cyclical sectors
have also appealed to those who anticipate US infrastructure investments and inflation under
President Trump. In contrast, the belief that the US has begun a period of rate hikes has reduced the
investment appeal of high-multiple sectors. Sentiment towards the healthcare sector weakened after
Hanmi Pharmaceutical in 2016 announced that some out-licensing contracts it signed in 2015 have
been revised or canceled. The sector has remained lackluster in 1H due to a lack of standout R&D
successes and earnings momentum. Still, steep share-price corrections in late 2016 made valuations
less demanding, leading shares to bottom out in 1Q.
Oversold stocks and those with earnings momentum bounce back in 1H: The Kospi
Medical Supplies Index performed in line with the Kospi, but stocks with earnings momentum
posted the steepest share-price gains. Among our covered healthcare stocks, Samsung Biologics is up
41.4% ytd, Medytox 42.1%, Hugel 40.7%, Hanmi Pharmaceutical 27.4%, and Yuhan 24.6%. Also,
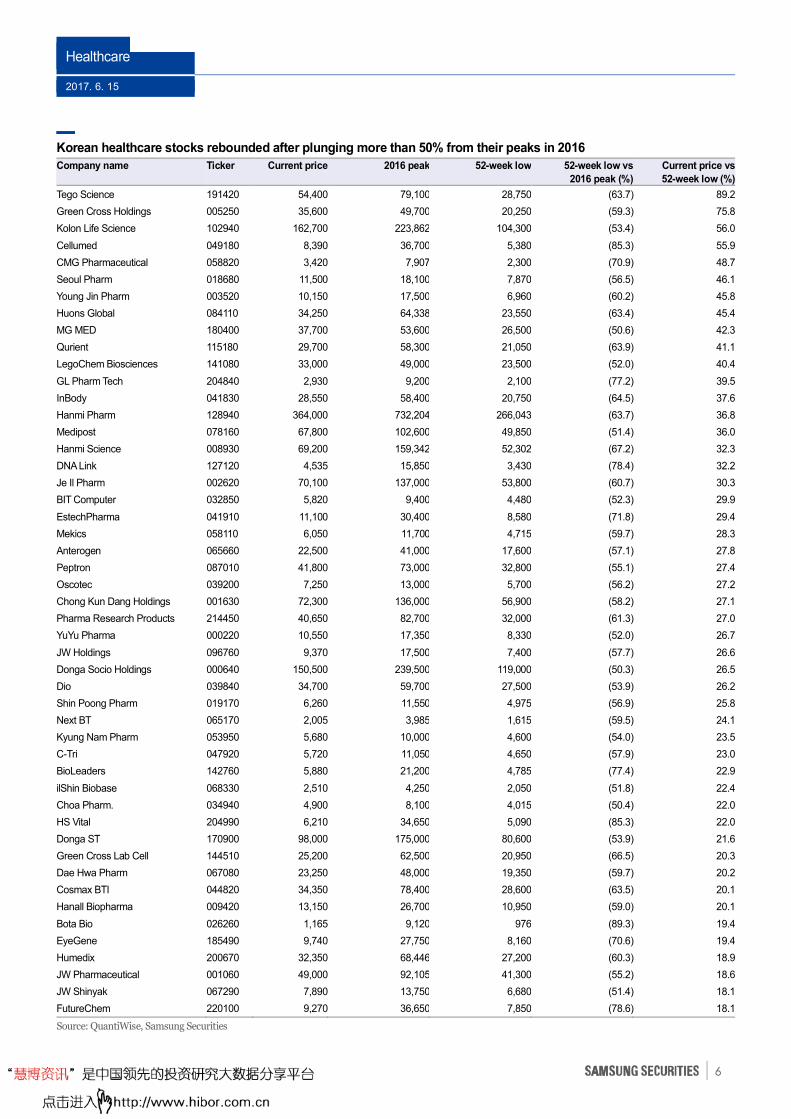
stocks that had plunged more than 50% from their previous peaks have rebounded almost 20% from
their lows as bargain hunters snapped them up. Healthcare stocks that have rebounded strongly
include Huons Global (45.4%), Hanmi Pharmaceutical (36.8%), Hanmi Science (32.3%), and Jeil
Pharmaceutical (30.3%).
Contents
1H review: Poverty in the midst of plenty
p2
Pharmaceutical market outlook
p7
Visible progress to be made on R&D and B2B fronts
p32
Government policy warrants attention
p52
Key issues in 2H p68
Solid earnings momentum in 2H
p87
Company p105
Healthcare
2017. 6. 15
3
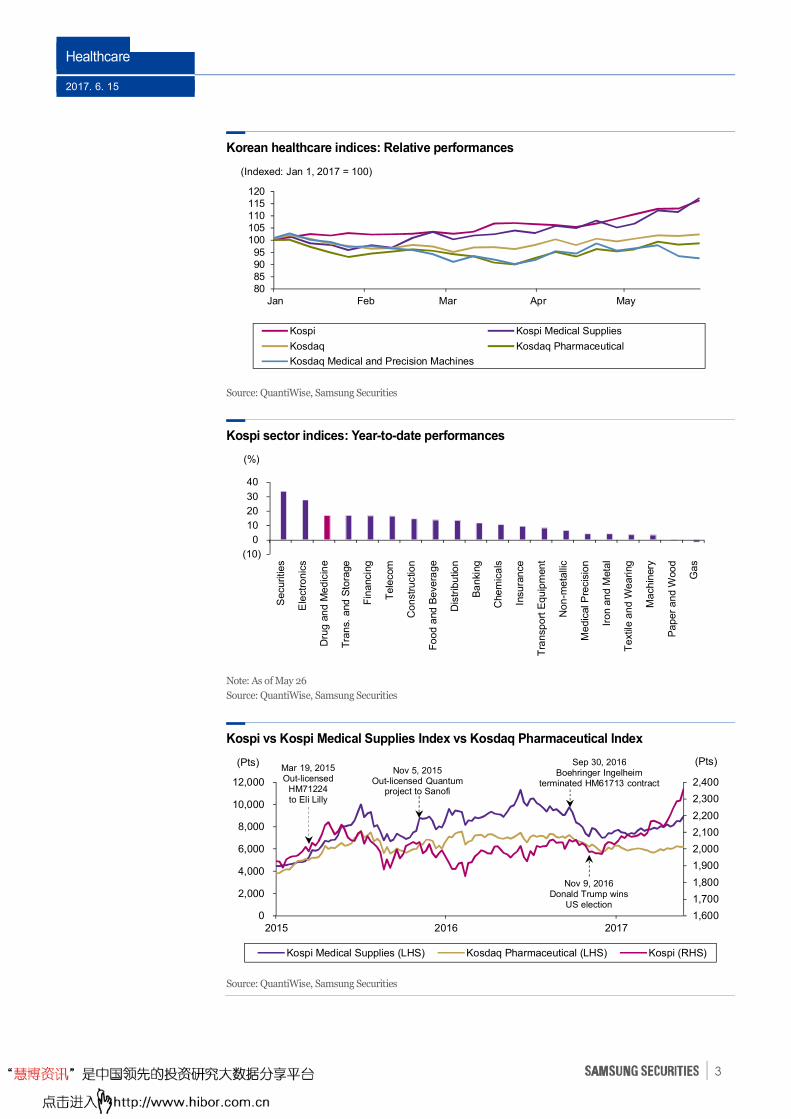
Korean healthcare indices: Relative performances
Source: QuantiWise, Samsung Securities
Kospi sector indices: Year-to-date performances
Note: As of May 26
Source: QuantiWise, Samsung Securities
Kospi vs Kospi Medical Supplies Index vs Kosdaq Pharmaceutical Index
Source: QuantiWise, Samsung Securities
1,600
1,700
1,800
1,900
2,000
2,100
2,200
2,300
2,400
0
2,000
4,000
6,000
8,000
10,000
12,000
2015 2016 2017
Kospi Medical Supplies (LHS) Kosdaq Pharmaceutical (LHS) Kospi (RHS)
(Pts) (Pts)Nov 5, 2015
Out-licensed Quantumproject to Sanofi
Sep 30, 2016Boehringer Ingelheim
terminated HM61713 contract
Nov 9, 2016Donald Trump wins
US election
Mar 19, 2015Out-licensed
HM71224to Eli Lilly
80859095
100105110115120
Jan Feb Mar Apr May
Kospi Kospi Medical Supplies
Kosdaq Kosdaq Pharmaceutical
Kosdaq Medical and Precision Machines
(Indexed: Jan 1, 2017 = 100)
(10)
0
10
20
30
40
Se
cu
ritie
s
Ele
ctr
on
ics
Dru
g a
nd
Me
dic
ine
Tra
ns.
and
Sto
rage
Fin
ancin
g
Te
lecom
Co
nstr
uctio
n
Fo
od
and
Be
ve
rag
e
Dis
trib
utio
n
Ba
nki
ng
Che
mic
als
Insu
ran
ce
Tra
nsp
ort
Eq
uip
men
t
No
n-m
eta
llic
Me
dic
al P
recis
ion
Iro
n a
nd
Meta
l
Te
xtil
e a
nd
We
ari
ng
Ma
ch
inery
Pa
pe
r a
nd
Woo
d
Ga
s
(%)
Healthcare
2017. 6. 15
4
Korean healthcare indices and sub-sectors: Relative performances
Note: Medical aesthetics (Medytox, Hugel, Humedix, Pharma Research Products, Caregen)
Diagnostics (Seegene, i-Sense, Boditech Med, AccessBio)
Source: QuantiWise, Samsung Secutieis
Korean healthcare indices and sub-sectors: Performances relative to parent index
Note: Kospi Medical Supplies index is compared to Kospi, the rests are to Kosdaq
Source: QuantiWise, Samsung Securities
Korean healthcare indices: Forward P/E
Source: QuantiWise, Samsung Securities
0
20
40
60
80
2015 2016 2017
Kospi Medical Supplies Kospi Medical Supplies (excl. Samsung Biologics)
Kosdaq Pharmaceuticals Kosdaq Medical and Precision Machines
Medical aesthetics Diagnostics
(x)
0
50
100
150
200
250
300
2015 2016 2017
Kospi Medical Supplies Kosdaq Pharmaceuticals
Kosdaq Medical and Precision Machines Medical aesthetics
Diagnostics
(Indexed: Jan 1, 2015 = 100)
(50)
0
50
100
150
200
2015 2016 2017
Kospi Medical Supplies Kosdaq Pharmaceuticals
Kosdaq Medical and Precision Machines Medical aesthetics
Diagnostics
(%pts)
Healthcare
2017. 6. 15
5
Korean healthcare firms: Top-20 share-price performers ytd
Note: As of May 26
Source: QuantiWise, Samsung Securities
Covered healthcare firms: Ytd share-price performances and 1Q17 operating performances
Note: * Based on Life Science division
Source: QuantiWise, Samsung Securities
0
20
40
60
80
Da
ew
oon
g
Gre
en C
ross
Ho
ldin
gs
Me
dyt
ox
Sa
msu
ng
Bio
log
ics
Hu
ge
l
Ko
lon L
ife
Sci
en
ce
Da
ew
oo
ng
Ph
arm
ace
utica
l
Ha
nm
i Ph
arm
Me
dip
ost
Yuh
an
Se
ou
l Ph
arm
So
lbo
rn
Ha
nm
i S
cie
nce
Ph
arm
swe
llbio
Sam
Ch
un
Da
ng
Ph
arm
Alv
oge
n K
ore
a
Il S
un
g P
ha
rm
JW L
ife
Sci
en
ce
Ne
op
ha
rm
Do
ng
Ko
ok
Ph
arm
ace
utica
l
(%)
(30)
(10)
10
30
50
70
90
(100)
0
100
200
300
Gre
en C
ross
Yuhan
Hanm
i Pharm
Chong K
un D
ang
Donga S
T
SK
Chem
icals
*
Bory
ung P
ha
rm
Ilyang P
harm
Daew
on P
harm
ace
utic
al
ST
Pharm
Sa
msu
ng B
iolo
gic
s
Cellt
rion
Seegene
i-S
ens
Bodite
ch M
ed
Oss
tem
Im
pla
nt
Dio
Dentiu
m
Vie
work
s
Valu
e A
dded T
ech
nolo
gy
Raye
nce
Medyt
ox
Hugel
Large pharmas SMEs Biotech Diagnostics Medical devices Medicalaesthetics
1Q17 sales growth (LHS) 1Q17 operating profit growth (LHS) Ytd share performance (RHS)
(% y-y) (%)
Turnedpos
Healthcare
2017. 6. 15
6
Korean healthcare stocks rebounded after plunging more than 50% from their peaks in 2016
Company name
Ticker
Current price 2016 peak 52-week low 52-week low vs
2016 peak (%)
Current price vs
52-week low (%)
Tego Science 191420 54,400 79,100 28,750 (63.7) 89.2
Green Cross Holdings 005250 35,600 49,700 20,250 (59.3) 75.8
Kolon Life Science 102940 162,700 223,862 104,300 (53.4) 56.0
Cellumed 049180 8,390 36,700 5,380 (85.3) 55.9
CMG Pharmaceutical 058820 3,420 7,907 2,300 (70.9) 48.7
Seoul Pharm 018680 11,500 18,100 7,870 (56.5) 46.1
Young Jin Pharm 003520 10,150 17,500 6,960 (60.2) 45.8
Huons Global 084110 34,250 64,338 23,550 (63.4) 45.4
MG MED 180400 37,700 53,600 26,500 (50.6) 42.3
Qurient 115180 29,700 58,300 21,050 (63.9) 41.1
LegoChem Biosciences 141080 33,000 49,000 23,500 (52.0) 40.4
GL Pharm Tech 204840 2,930 9,200 2,100 (77.2) 39.5
InBody 041830 28,550 58,400 20,750 (64.5) 37.6
Hanmi Pharm 128940 364,000 732,204 266,043 (63.7) 36.8
Medipost 078160 67,800 102,600 49,850 (51.4) 36.0
Hanmi Science 008930 69,200 159,342 52,302 (67.2) 32.3
DNA Link 127120 4,535 15,850 3,430 (78.4) 32.2
Je Il Pharm 002620 70,100 137,000 53,800 (60.7) 30.3
BIT Computer 032850 5,820 9,400 4,480 (52.3) 29.9
EstechPharma 041910 11,100 30,400 8,580 (71.8) 29.4
Mekics 058110 6,050 11,700 4,715 (59.7) 28.3
Anterogen 065660 22,500 41,000 17,600 (57.1) 27.8
Peptron 087010 41,800 73,000 32,800 (55.1) 27.4
Oscotec 039200 7,250 13,000 5,700 (56.2) 27.2
Chong Kun Dang Holdings 001630 72,300 136,000 56,900 (58.2) 27.1
Pharma Research Products 214450 40,650 82,700 32,000 (61.3) 27.0
YuYu Pharma 000220 10,550 17,350 8,330 (52.0) 26.7
JW Holdings 096760 9,370 17,500 7,400 (57.7) 26.6
Donga Socio Holdings 000640 150,500 239,500 119,000 (50.3) 26.5
Dio 039840 34,700 59,700 27,500 (53.9) 26.2
Shin Poong Pharm 019170 6,260 11,550 4,975 (56.9) 25.8
Next BT 065170 2,005 3,985 1,615 (59.5) 24.1
Kyung Nam Pharm 053950 5,680 10,000 4,600 (54.0) 23.5
C-Tri 047920 5,720 11,050 4,650 (57.9) 23.0
BioLeaders 142760 5,880 21,200 4,785 (77.4) 22.9
ilShin Biobase 068330 2,510 4,250 2,050 (51.8) 22.4
Choa Pharm. 034940 4,900 8,100 4,015 (50.4) 22.0
HS Vital 204990 6,210 34,650 5,090 (85.3) 22.0
Donga ST 170900 98,000 175,000 80,600 (53.9) 21.6
Green Cross Lab Cell 144510 25,200 62,500 20,950 (66.5) 20.3
Dae Hwa Pharm 067080 23,250 48,000 19,350 (59.7) 20.2
Cosmax BTI 044820 34,350 78,400 28,600 (63.5) 20.1
Hanall Biopharma 009420 13,150 26,700 10,950 (59.0) 20.1
Bota Bio 026260 1,165 9,120 976 (89.3) 19.4
EyeGene 185490 9,740 27,750 8,160 (70.6) 19.4
Humedix 200670 32,350 68,446 27,200 (60.3) 18.9
JW Pharmaceutical 001060 49,000 92,105 41,300 (55.2) 18.6
JW Shinyak 067290 7,890 13,750 6,680 (51.4) 18.1
FutureChem 220100 9,270 36,650 7,850 (78.6) 18.1
Source: QuantiWise, Samsung Securities
Healthcare
2017. 6. 15
7
Pharmaceutical market outlook
Breakthrough-therapy approvals brighten outlook for global market
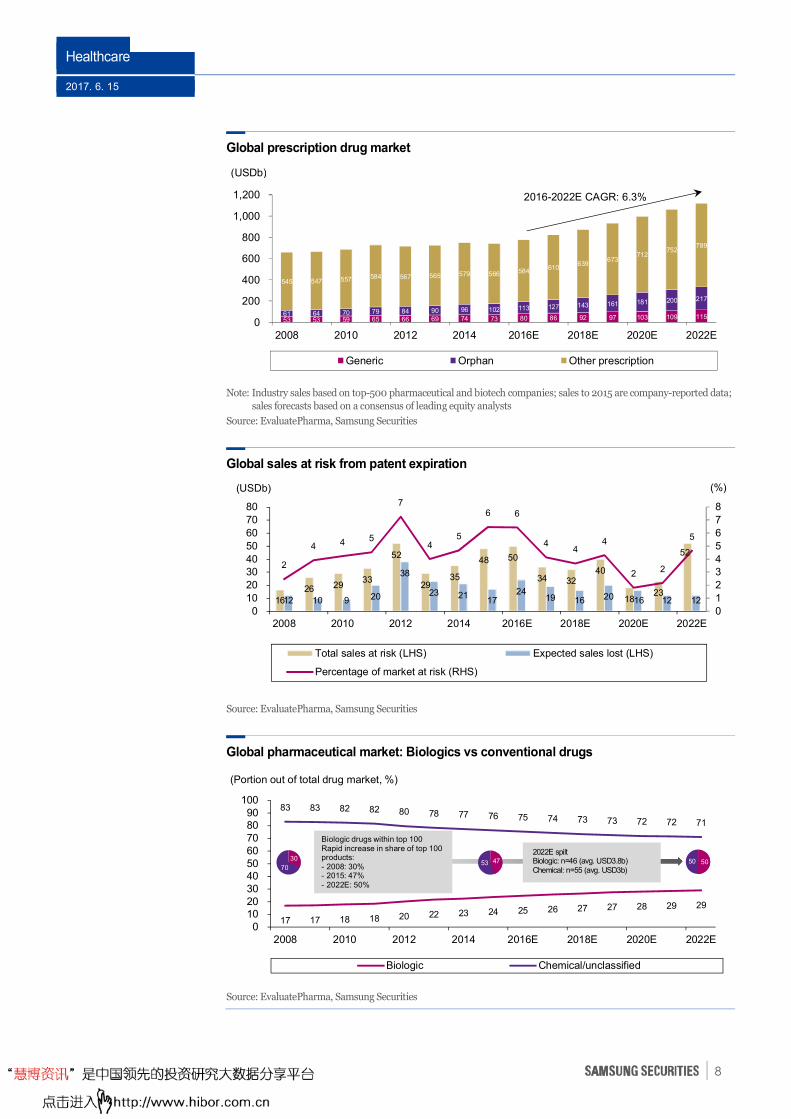
Worldwide pharmaceutical sales outlook: EvaluatePharma has the global pharmaceutical
industry growing at a 2016-2022 CAGR of 6.3% to reach USD1.12t, with a new wave of innovative
therapies approved by regulators over the last three years serving as the core engine. The market
research firm expects the orphan drug market to almost double over the same period, expanding at
an 11.5% CAGR to peak at USD217b in 2022, while generic sales should grow at a 6.2% CAGR to
USD115b. R&D programs should increasingly be oriented towards narrower patient populations
characterized by larger unmet need, limited market competition, and favorable environment to gain
approvals. Yet, tightening of insurance-benefit rules and drug-pricing policies by the US
administration and large pharmacy benefit managers (PBMs) warrant attention.
Worldwide biologics sales outlook: The world’s chemical and biologic drug markets should
continue to grow at CAGRs of 5.1% and 9.1%, respectively, through 2022 to reach USD827b and
KRW337b. Biotech product penetration increased from 16.9% in 2008 to 24.6% in 2016, and it
should hit 29% in 2022, when 50% of the value of the top-100 products comes from biologics (vs 30%
in 2008 and 47% in 2016).
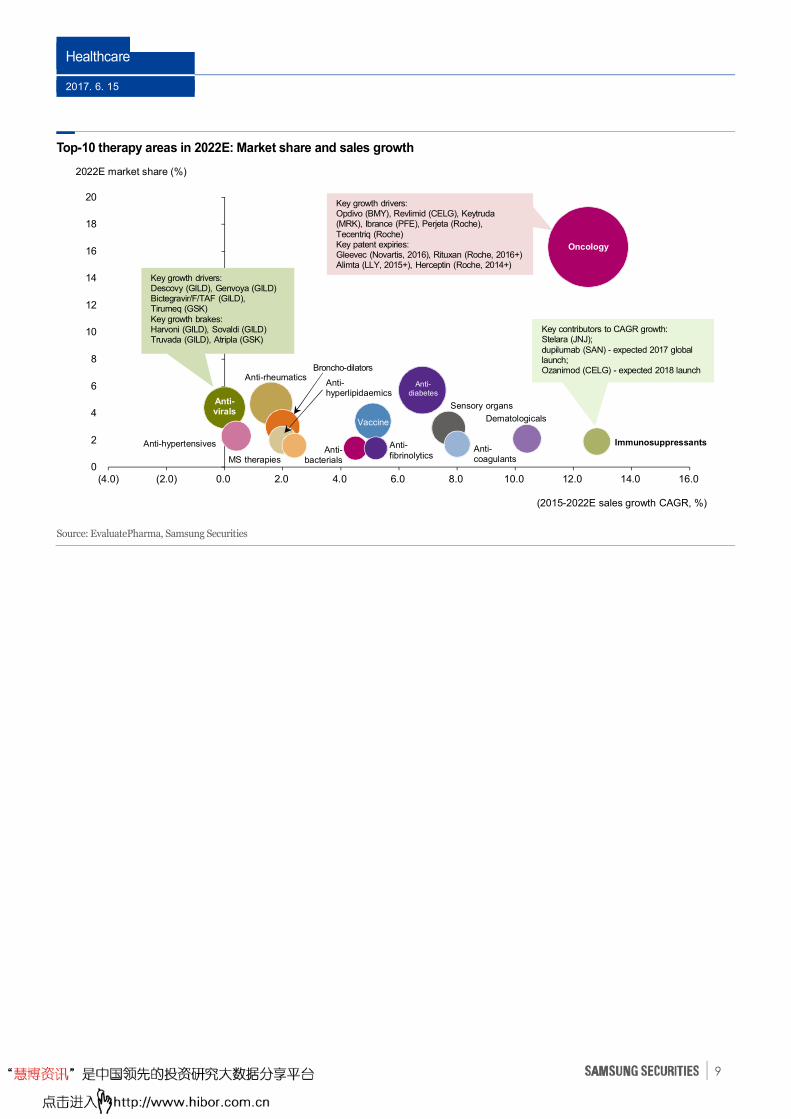
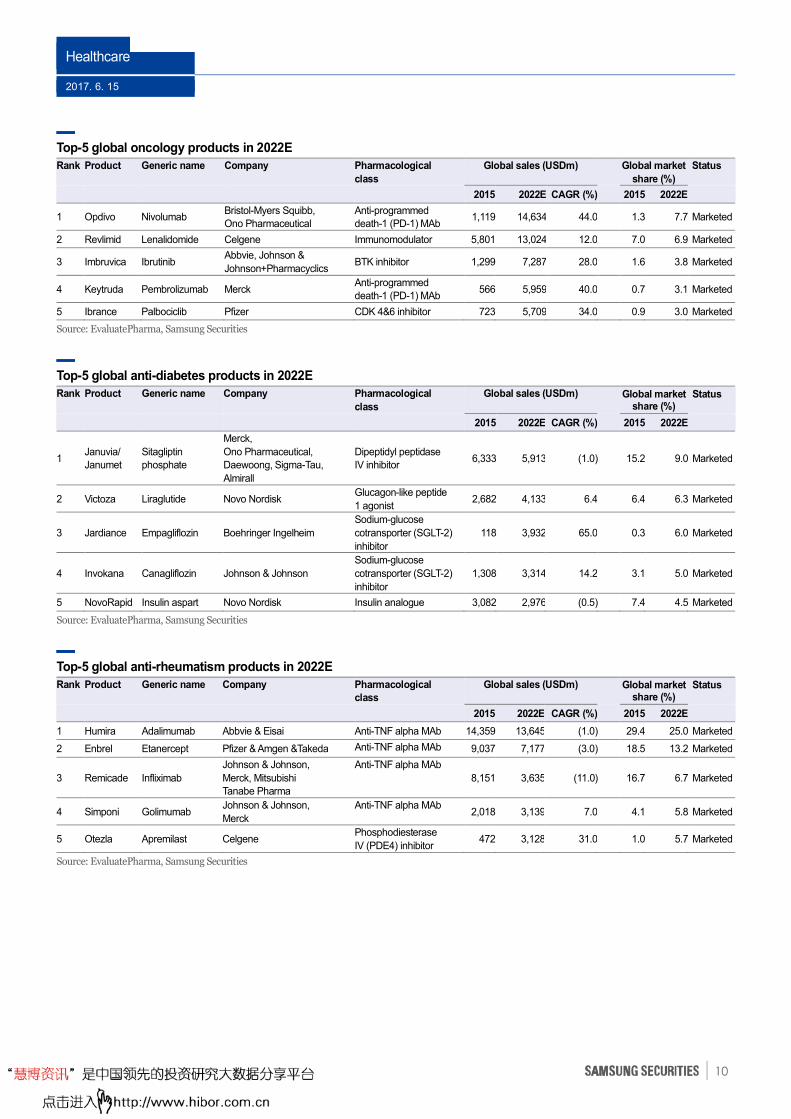
Oncology should remain the fastest-growing therapy area, expanding at a 2016-2022 CAGR of 12.5%
to reach USD190b in annual sales and represent 16.3% of the global pharmaceuticals market (vs 10.7%
in 2015). Top player Roche should see its oncology sales grow 3.3% pa to USD32.2b over the same
period, though its market share is likely to slide to 17% (vs 30.9% in 2015) due to the release of
biosimilars (of Avastin, Herceptin, and Rituxan) after key patents expire. Anti-diabetes is forecast to
be the second biggest therapy area, with sales of USD66.1b in 2022 (6.8% CAGR), accounting for 5.7%
of the pharmaceuticals market (vs 5.4% in 2015). Sales of number-one anti-diabetes drug Lantus
should shrink at a 2016-2022 CAGR of 11.8% to USD3b in 2022 on the advent of biosimilars after
patent expiration. Accordingly, Sanofi’s anti-diabetes sales should slide 1.1% pa to USD7.7b in 2022,
while its market share should tumble from 20% to 11.7%. Meanwhile, anti-rheumatics should remain
a low-growth market, expanding just 1.6% pa to USD54.5b in 2022 due to price erosion caused by
the entry of biosimilars. We expect sales of the blockbusters Humira, Enbrel, and Remicade to
decline 0.7%, 3.2%, and 10.9% pa, respectively, to USD13.6b, USD7.2b, and KRW3.6b in 2022.
Contents
1H review: Poverty in the midst of plenty
p2
Pharmaceutical market outlook
p7
Visible progress to be made on R&D and B2B fronts
p32
Government policy warrants attention
p52
Key issues in 2H p68
Solid earnings momentum in 2H
p87
Company p105
Healthcare
2017. 6. 15
8
Global prescription drug market
Note: Industry sales based on top-500 pharmaceutical and biotech companies; sales to 2015 are company-reported data;
sales forecasts based on a consensus of leading equity analysts
Source: EvaluatePharma, Samsung Securities
Global sales at risk from patent expiration
Source: EvaluatePharma, Samsung Securities
Global pharmaceutical market: Biologics vs conventional drugs
Source: EvaluatePharma, Samsung Securities
53 53 59 65 66 69 74 73 80 86 92 97 103 109 115 61 64 70 79 84 90 96 102 113 127 143 161 181 200 217
545 547 557 584 567 565 579 566 584 610
639 673
712 752
789
0
200
400
600
800
1,000
1,200
2008 2010 2012 2014 2016E 2018E 2020E 2022E
Generic Orphan Other prescription
(USDb)
2016-2022E CAGR: 6.3%
17 17 18 18 20 22 23 24 25 26 27 27 28 29 29
83 83 82 82 80 78 77 76 75 74 73 73 72 72 71
0102030405060708090
100
2008 2010 2012 2014 2016E 2018E 2020E 2022E
Biologic Chemical/unclassified
(Portion out of total drug market, %)
Biologic drugs within top 100Rapid increase in share of top 100 products:- 2008: 30%- 2015: 47%- 2022E: 50%
2022E spiltBiologic: n=46 (avg. USD3.8b)Chemical: n=55 (avg. USD3b)
30
7053 47 50 50
16
26 29 33
52
29 35
48 50
34 32 40
18 23
52
12 10 9 20
38
23 21 17
24 19 16 20 16 12 12
2
4 4 5
7
4 5
6 6
4 4
4
2 2
5
0
1
2
34
5
6
7
8
0
10
20
3040
50
60
70
80
2008 2010 2012 2014 2016E 2018E 2020E 2022E
Total sales at risk (LHS) Expected sales lost (LHS)
Percentage of market at risk (RHS)
(USDb) (%)
Healthcare
2017. 6. 15
9
Top-10 therapy areas in 2022E: Market share and sales growth
Source: EvaluatePharma, Samsung Securities
0
2
4
6
8
10
12
14
16
18
20
(4.0) (2.0) 0.0 2.0 4.0 6.0 8.0 10.0 12.0 14.0 16.0
2022E market share (%)
(2015-2022E sales growth CAGR, %)
Oncology
Anti-diabetes
Immunosuppressants
Dematologicals
Anti-virals
Anti-rheumatics
Anti-hypertensives
Vaccine
Sensory organs
MS therapiesAnti-coagulants
Broncho-dilators
Anti-fibrinolytics
Anti-bacterials
Key growth drivers:Descovy (GILD), Genvoya (GILD)Bictegravir/F/TAF (GILD), Tirumeq (GSK)Key growth brakes:Harvoni (GILD), Sovaldi (GILD)Truvada (GILD), Atripla (GSK)
Key growth drivers:Opdivo (BMY), Revlimid (CELG), Keytruda (MRK), Ibrance (PFE), Perjeta (Roche), Tecentriq (Roche)Key patent expiries:Gleevec (Novartis, 2016), Rituxan (Roche, 2016+)Alimta (LLY, 2015+), Herceptin (Roche, 2014+)
Key contributors to CAGR growth:Stelara (JNJ); dupilumab (SAN) - expected 2017 global launch; Ozanimod (CELG) - expected 2018 launch
Anti-hyperlipidaemics
Healthcare
2017. 6. 15
10
Top-5 global oncology products in 2022E
Rank
Product
Generic name
Company
Pharmacological
class
Global sales (USDm)
Global market
share (%)
Status
2015 2022E CAGR (%) 2015 2022E
1 Opdivo Nivolumab Bristol-Myers Squibb,
Ono Pharmaceutical
Anti-programmed
death-1 (PD-1) MAb 1,119 14,634 44.0 1.3 7.7 Marketed
2 Revlimid Lenalidomide Celgene Immunomodulator 5,801 13,024 12.0 7.0 6.9 Marketed
3 Imbruvica Ibrutinib Abbvie, Johnson &
Johnson+Pharmacyclics BTK inhibitor 1,299 7,287 28.0 1.6 3.8 Marketed
4 Keytruda Pembrolizumab Merck Anti-programmed
death-1 (PD-1) MAb 566 5,959 40.0 0.7 3.1 Marketed
5 Ibrance Palbociclib Pfizer CDK 4&6 inhibitor 723 5,709 34.0 0.9 3.0 Marketed
Source: EvaluatePharma, Samsung Securities
Top-5 global anti-diabetes products in 2022E
Rank
Product
Generic name
Company
Pharmacological
class
Global sales (USDm)
Global market share (%)
Status
2015 2022E CAGR (%) 2015 2022E
1 Januvia/
Janumet
Sitagliptin
phosphate
Merck,
Ono Pharmaceutical,
Daewoong, Sigma-Tau,
Almirall
Dipeptidyl peptidase
IV inhibitor 6,333 5,913 (1.0) 15.2 9.0 Marketed
2 Victoza Liraglutide Novo Nordisk Glucagon-like peptide
1 agonist 2,682 4,133 6.4 6.4 6.3 Marketed
3 Jardiance Empagliflozin Boehringer Ingelheim
Sodium-glucose
cotransporter (SGLT-2)
inhibitor
118 3,932 65.0 0.3 6.0 Marketed
4 Invokana Canagliflozin Johnson & Johnson
Sodium-glucose
cotransporter (SGLT-2)
inhibitor
1,308 3,314 14.2 3.1 5.0 Marketed
5 NovoRapid Insulin aspart Novo Nordisk Insulin analogue 3,082 2,976 (0.5) 7.4 4.5 Marketed
Source: EvaluatePharma, Samsung Securities
Top-5 global anti-rheumatism products in 2022E
Rank
Product
Generic name
Company
Pharmacological
class
Global sales (USDm)
Global market share (%)
Status
2015 2022E CAGR (%) 2015 2022E
1 Humira Adalimumab Abbvie & Eisai Anti-TNF alpha MAb 14,359 13,645 (1.0) 29.4 25.0 Marketed
2 Enbrel Etanercept Pfizer & Amgen &Takeda Anti-TNF alpha MAb 9,037 7,177 (3.0) 18.5 13.2 Marketed
3 Remicade Infliximab
Johnson & Johnson,
Merck, Mitsubishi
Tanabe Pharma
Anti-TNF alpha MAb
8,151 3,635 (11.0) 16.7 6.7 Marketed
4 Simponi Golimumab Johnson & Johnson,
Merck
Anti-TNF alpha MAb 2,018 3,139 7.0 4.1 5.8 Marketed
5 Otezla Apremilast Celgene Phosphodiesterase
IV (PDE4) inhibitor 472 3,128 31.0 1.0 5.7 Marketed
Source: EvaluatePharma, Samsung Securities
Healthcare
2017. 6. 15
11
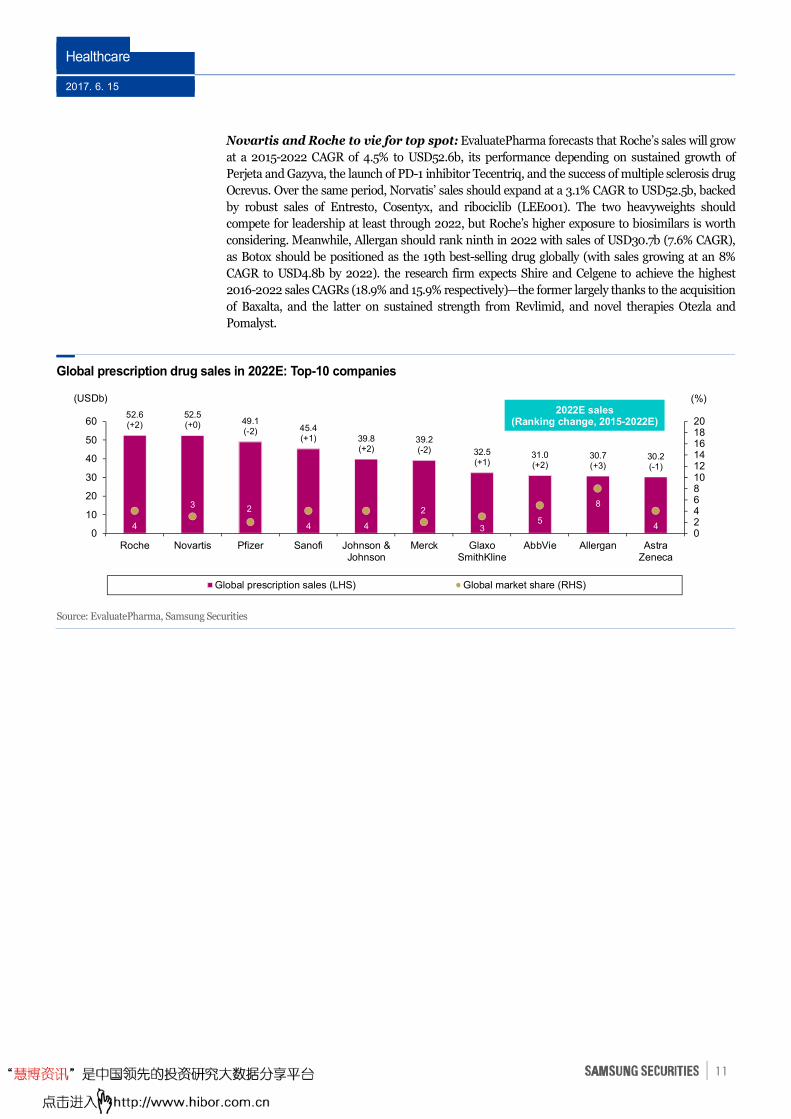
Novartis and Roche to vie for top spot: EvaluatePharma forecasts that Roche’s sales will grow
at a 2015-2022 CAGR of 4.5% to USD52.6b, its performance depending on sustained growth of
Perjeta and Gazyva, the launch of PD-1 inhibitor Tecentriq, and the success of multiple sclerosis drug
Ocrevus. Over the same period, Norvatis’ sales should expand at a 3.1% CAGR to USD52.5b, backed
by robust sales of Entresto, Cosentyx, and ribociclib (LEE001). The two heavyweights should
compete for leadership at least through 2022, but Roche’s higher exposure to biosimilars is worth
considering. Meanwhile, Allergan should rank ninth in 2022 with sales of USD30.7b (7.6% CAGR),
as Botox should be positioned as the 19th best-selling drug globally (with sales growing at an 8%
CAGR to USD4.8b by 2022). the research firm expects Shire and Celgene to achieve the highest
2016-2022 sales CAGRs (18.9% and 15.9% respectively)—the former largely thanks to the acquisition
of Baxalta, and the latter on sustained strength from Revlimid, and novel therapies Otezla and
Pomalyst.
Global prescription drug sales in 2022E: Top-10 companies
Source: EvaluatePharma, Samsung Securities
52.6(+2)
52.5(+0) 49.1
(-2) 45.4(+1) 39.8
(+2)39.2(-2) 32.5
(+1)31.0(+2)
30.7(+3)
30.2(-1)
4
3 2
4 4
2
35
8
402468101214161820
0
10
20
30
40
50
60
Roche Novartis Pfizer Sanofi Johnson &Johnson
Merck GlaxoSmithKline
AbbVie Allergan AstraZeneca
Global prescription sales (LHS) Global market share (RHS)
(USDb) (%)2022E sales
(Ranking change, 2015-2022E)
Healthcare
2017. 6. 15
12
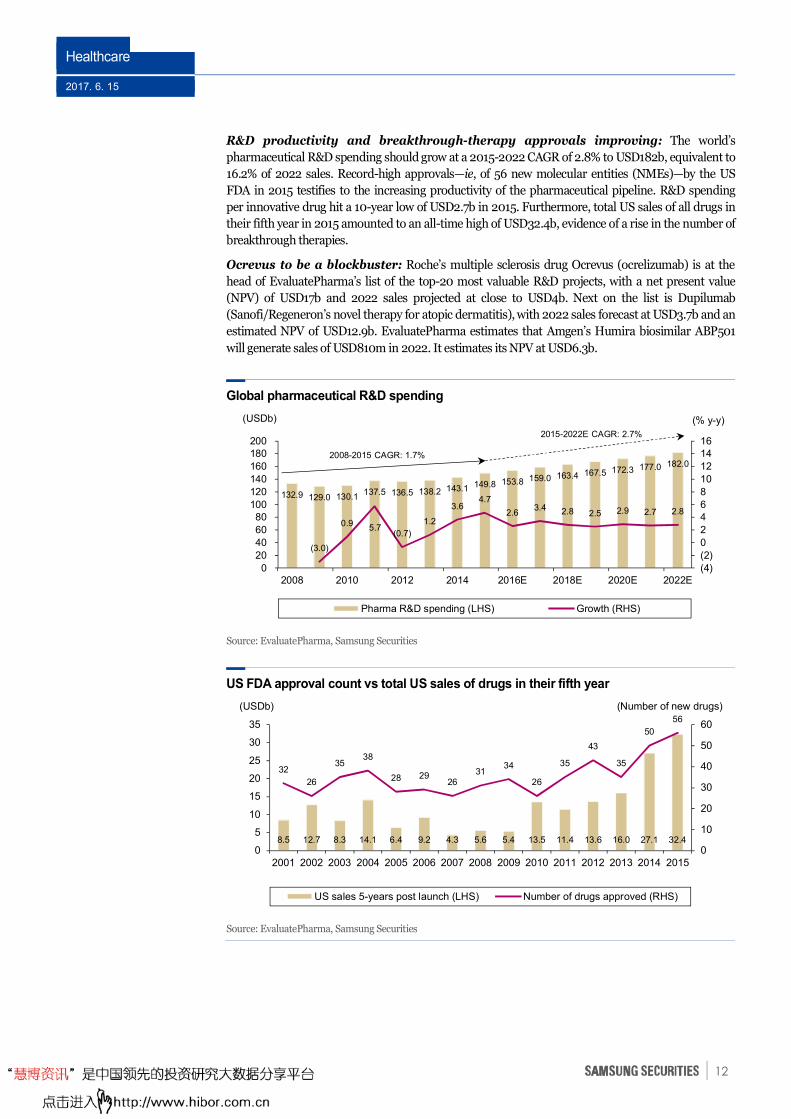
R&D productivity and breakthrough-therapy approvals improving: The world’s
pharmaceutical R&D spending should grow at a 2015-2022 CAGR of 2.8% to USD182b, equivalent to
16.2% of 2022 sales. Record-high approvals—ie, of 56 new molecular entities (NMEs)—by the US
FDA in 2015 testifies to the increasing productivity of the pharmaceutical pipeline. R&D spending
per innovative drug hit a 10-year low of USD2.7b in 2015. Furthermore, total US sales of all drugs in
their fifth year in 2015 amounted to an all-time high of USD32.4b, evidence of a rise in the number of
breakthrough therapies.
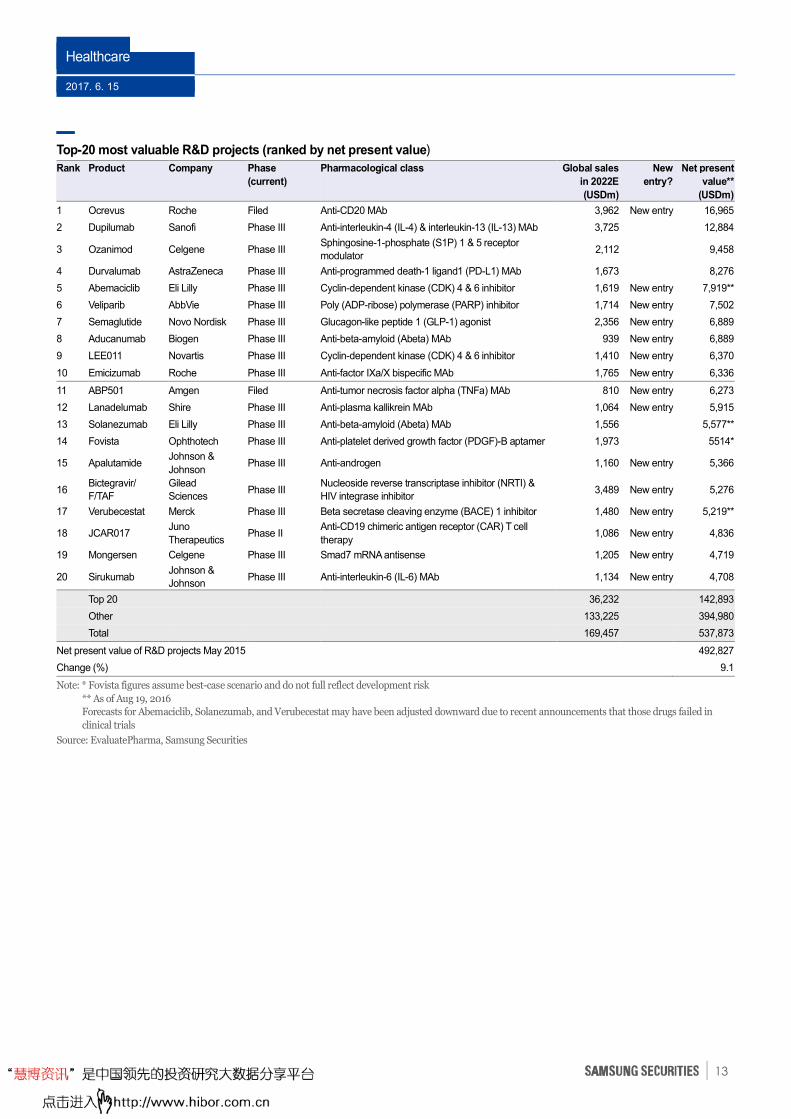
Ocrevus to be a blockbuster: Roche’s multiple sclerosis drug Ocrevus (ocrelizumab) is at the
head of EvaluatePharma’s list of the top-20 most valuable R&D projects, with a net present value
(NPV) of USD17b and 2022 sales projected at close to USD4b. Next on the list is Dupilumab
(Sanofi/Regeneron’s novel therapy for atopic dermatitis), with 2022 sales forecast at USD3.7b and an
estimated NPV of USD12.9b. EvaluatePharma estimates that Amgen’s Humira biosimilar ABP501
will generate sales of USD810m in 2022. It estimates its NPV at USD6.3b.
Global pharmaceutical R&D spending
Source: EvaluatePharma, Samsung Securities
US FDA approval count vs total US sales of drugs in their fifth year
Source: EvaluatePharma, Samsung Securities
8.5 12.7 8.3 14.1 6.4 9.2 4.3 5.6 5.4 13.5 11.4 13.6 16.0 27.1 32.4
32
26
3538
28 2926
3134
26
35
43
35
50
56
0
10
20
30
40
50
60
0
5
10
15
20
25
30
35
2001 2002 2003 2004 2005 2006 2007 2008 2009 2010 2011 2012 2013 2014 2015
US sales 5-years post launch (LHS) Number of drugs approved (RHS)
(USDb) (Number of new drugs)
132.9 129.0 130.1 137.5 136.5 138.2 143.1 149.8 153.8 159.0 163.4 167.5 172.3 177.0 182.0
(3.0)
0.9 5.7
(0.7)
1.2
3.6 4.7
2.6 3.4 2.8 2.5 2.9 2.7 2.8
(4)
(2)
0
2
46
8
10
12
1416
0
20
40
60
80100
120
140
160
180200
2008 2010 2012 2014 2016E 2018E 2020E 2022E
Pharma R&D spending (LHS) Growth (RHS)
(USDb) (% y-y)
2008-2015 CAGR: 1.7%
2015-2022E CAGR: 2.7%
Healthcare
2017. 6. 15
13
Top-20 most valuable R&D projects (ranked by net present value)
Rank
Product
Company
Phase
(current)
Pharmacological class
Global sales
in 2022E
(USDm)
New
entry?
Net present
value**
(USDm)
1 Ocrevus Roche Filed Anti-CD20 MAb 3,962 New entry 16,965
2 Dupilumab Sanofi Phase III Anti-interleukin-4 (IL-4) & interleukin-13 (IL-13) MAb 3,725 12,884
3 Ozanimod Celgene Phase III Sphingosine-1-phosphate (S1P) 1 & 5 receptor
modulator 2,112 9,458
4 Durvalumab AstraZeneca Phase III Anti-programmed death-1 ligand1 (PD-L1) MAb 1,673 8,276
5 Abemaciclib Eli Lilly Phase III Cyclin-dependent kinase (CDK) 4 & 6 inhibitor 1,619 New entry 7,919**
6 Veliparib AbbVie Phase III Poly (ADP-ribose) polymerase (PARP) inhibitor 1,714 New entry 7,502
7 Semaglutide Novo Nordisk Phase III Glucagon-like peptide 1 (GLP-1) agonist 2,356 New entry 6,889
8 Aducanumab Biogen Phase III Anti-beta-amyloid (Abeta) MAb 939 New entry 6,889
9 LEE011 Novartis Phase III Cyclin-dependent kinase (CDK) 4 & 6 inhibitor 1,410 New entry 6,370
10 Emicizumab Roche Phase III Anti-factor IXa/X bispecific MAb 1,765 New entry 6,336
11 ABP501 Amgen Filed Anti-tumor necrosis factor alpha (TNFa) MAb 810 New entry 6,273
12 Lanadelumab Shire Phase III Anti-plasma kallikrein MAb 1,064 New entry 5,915
13 Solanezumab Eli Lilly Phase III Anti-beta-amyloid (Abeta) MAb 1,556 5,577**
14 Fovista Ophthotech Phase III Anti-platelet derived growth factor (PDGF)-B aptamer 1,973 5514*
15 Apalutamide Johnson &
Johnson Phase III Anti-androgen 1,160 New entry 5,366
16 Bictegravir/
F/TAF
Gilead
Sciences Phase III
Nucleoside reverse transcriptase inhibitor (NRTI) &
HIV integrase inhibitor 3,489 New entry 5,276
17 Verubecestat Merck Phase III Beta secretase cleaving enzyme (BACE) 1 inhibitor 1,480 New entry 5,219**
18 JCAR017 Juno
Therapeutics Phase II
Anti-CD19 chimeric antigen receptor (CAR) T cell
therapy 1,086 New entry 4,836
19 Mongersen Celgene Phase III Smad7 mRNA antisense 1,205 New entry 4,719
20 Sirukumab Johnson &
Johnson Phase III Anti-interleukin-6 (IL-6) MAb 1,134 New entry 4,708
Top 20 36,232 142,893
Other 133,225 394,980
Total 169,457 537,873
Net present value of R&D projects May 2015 492,827
Change (%) 9.1
Note: * Fovista figures assume best-case scenario and do not full reflect development risk
** As of Aug 19, 2016
Forecasts for Abemaciclib, Solanezumab, and Verubecestat may have been adjusted downward due to recent announcements that those drugs failed in
clinical trials
Source: EvaluatePharma, Samsung Securities

Healthcare
2017. 6. 15
14
Biosimilar market outlook bright—Multiple biologics to go off patent over 2016-2022
USD249b of sales at risk over 2016-2022: With USD249b of sales at risk over 2016-2022,
EvaluatePharma says that the pharmaceutical industry is on the brink of a second patent cliff that
will usher in an era of biosimilars challenging top biologics. Sales of the most popular biologics (eg,
Humira, Enbrel, Remicade, Lantus, Rituxan, Avastin, and Herceptin) seem destined to slide. The
London-based consulting firm contends that some analysts are too conservative in their forecasts of
the impact that upcoming biosimilars will have.
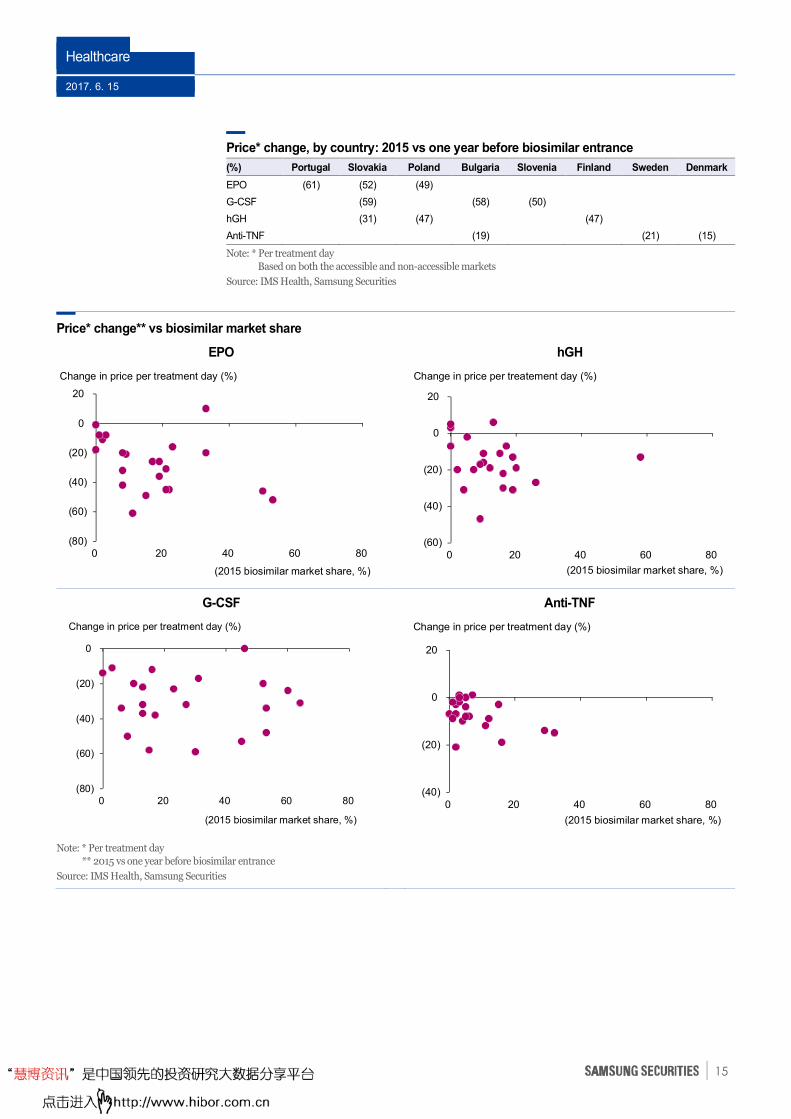
Implications of biosimilar competition: IMS Health has studied the effects of biosimilars—
specifically, epoetin (EPO), granulocyte colony-stimulating factor (G-CSF), human growth hormone
(hGH), and anti-tumor necrosis factor (anti-TNF)—on price, volume, and market share in Europe.
The data show that in some countries, prices of some original drugs fell by almost 70% after the
release of biosimilars. Even in cases where biosimilars were less competitive, their existence was an
essential step to generating a more competitive environment, which drove down prices of original
biologics. The correlation between a biosimilar’s market share and price was weak. Competition also
influenced the behavior of originators, encouraging them to: 1) reduce prices sufficiently to protect
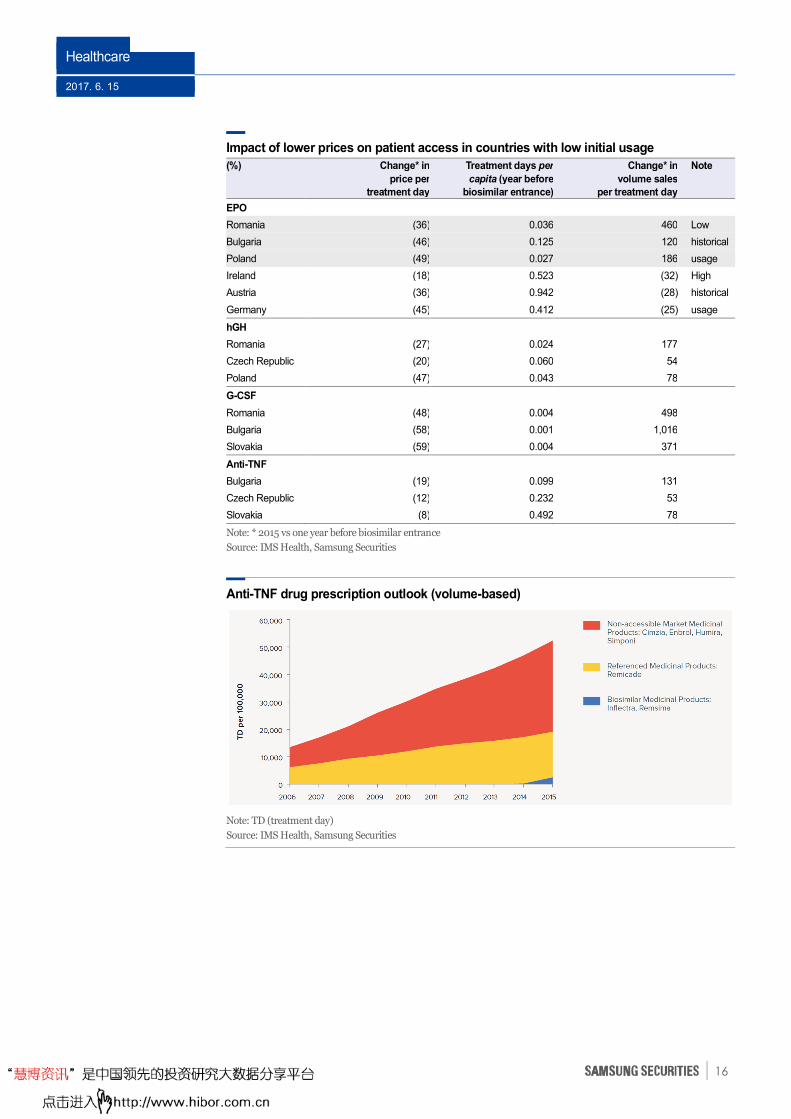
market share; 2) manufacture their own biosimilars; or 3) develop competitive bio-betters. In
countries where biologics usage/availability was once low, price cuts appear to have had a significant
impact on access.
Price* change: 2015 vs one year before biosimilar entrance
Note: * Per treatment day
Accessible market = products within the same ATC4 code
Total market = both the accessible and non-accessible markets
Source: IMS Health, Samsung Securities
(33) (32)
(19)
(8)
(34)(32)
(13)
(8)
(26)(23)
(13)
(4)
(40)
(35)
(30)
(25)
(20)
(15)
(10)
(5)
0
EPO G-CSF hGH Anti-TNF
Biosimilar and reference product Accessible market Total market
(%)
Healthcare
2017. 6. 15
15
Price* change, by country: 2015 vs one year before biosimilar entrance
(%) Portugal Slovakia Poland Bulgaria Slovenia Finland Sweden Denmark
EPO (61) (52) (49)
G-CSF (59) (58) (50)
hGH (31) (47) (47)
Anti-TNF (19) (21) (15)
Note: * Per treatment day
Based on both the accessible and non-accessible markets
Source: IMS Health, Samsung Securities
Price* change** vs biosimilar market share
EPO hGH
G-CSF Anti-TNF
Note: * Per treatment day
** 2015 vs one year before biosimilar entrance
Source: IMS Health, Samsung Securities
(80)
(60)
(40)
(20)
0
20
0 20 40 60 80
(2015 biosimilar market share, %)
Change in price per treatment day (%)
(60)
(40)
(20)
0
20
0 20 40 60 80
(2015 biosimilar market share, %)
Change in price per treatement day (%)
(40)
(20)
0
20
0 20 40 60 80
(2015 biosimilar market share, %)
Change in price per treatment day (%)
(80)
(60)
(40)
(20)
0
0 20 40 60 80
(2015 biosimilar market share, %)
Change in price per treatment day (%)
Healthcare
2017. 6. 15
16
Impact of lower prices on patient access in countries with low initial usage
(%)
Change* in
price per
treatment day
Treatment days per
capita (year before
biosimilar entrance)
Change* in
volume sales
per treatment day
Note
EPO
Romania (36) 0.036 460 Low
Bulgaria (46) 0.125 120 historical
Poland (49) 0.027 186 usage
Ireland (18) 0.523 (32) High
Austria (36) 0.942 (28) historical
Germany (45) 0.412 (25) usage
hGH
Romania (27) 0.024 177
Czech Republic (20) 0.060 54
Poland (47) 0.043 78
G-CSF
Romania (48) 0.004 498
Bulgaria (58) 0.001 1,016
Slovakia (59) 0.004 371
Anti-TNF
Bulgaria (19) 0.099 131
Czech Republic (12) 0.232 53
Slovakia (8) 0.492 78
Note: * 2015 vs one year before biosimilar entrance
Source: IMS Health, Samsung Securities
Anti-TNF drug prescription outlook (volume-based)
Note: TD (treatment day)
Source: IMS Health, Samsung Securities
Healthcare
2017. 6. 15
17
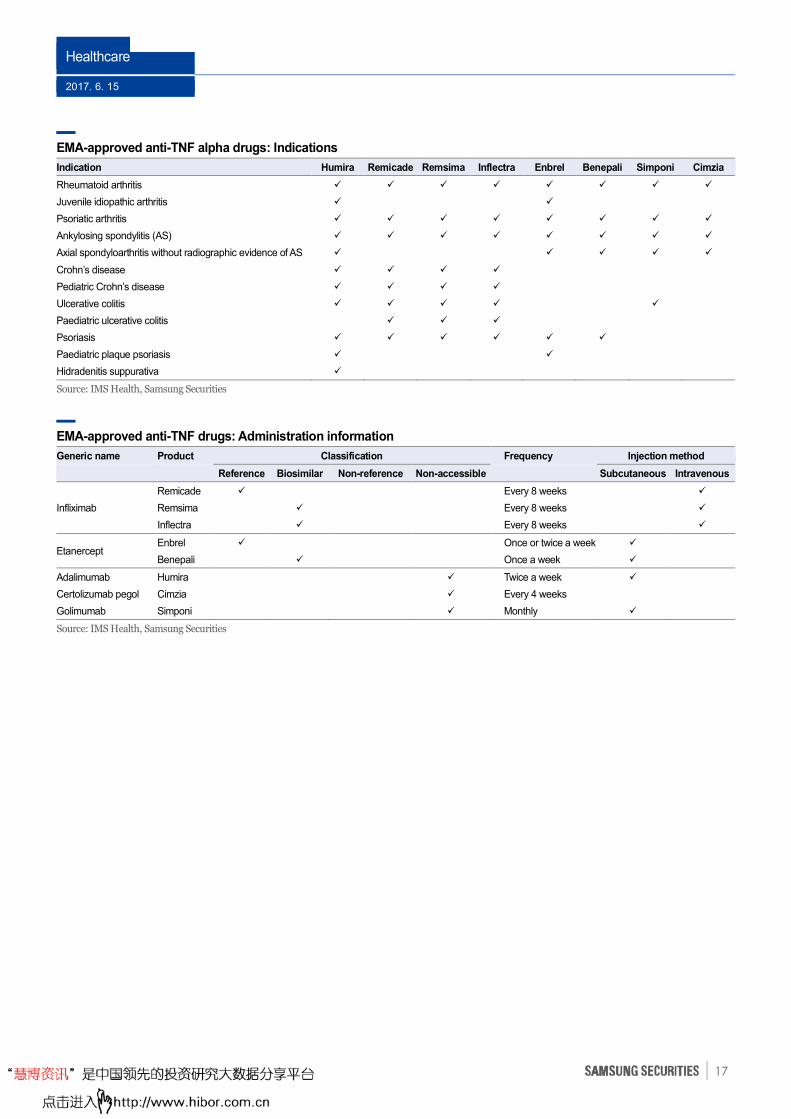
EMA-approved anti-TNF alpha drugs: Indications
Indication Humira Remicade Remsima Inflectra Enbrel Benepali Simponi Cimzia
Rheumatoid arthritis � � � � � � � �
Juvenile idiopathic arthritis � �
Psoriatic arthritis � � � � � � � �
Ankylosing spondylitis (AS) � � � � � � � �
Axial spondyloarthritis without radiographic evidence of AS � � � � �
Crohn’s disease � � � �
Pediatric Crohn’s disease � � � �
Ulcerative colitis � � � � �
Paediatric ulcerative colitis � � �
Psoriasis � � � � � �
Paediatric plaque psoriasis � �
Hidradenitis suppurativa �
Source: IMS Health, Samsung Securities
EMA-approved anti-TNF drugs: Administration information
Generic name Product Classification Frequency Injection method
Reference Biosimilar Non-reference Non-accessible Subcutaneous Intravenous
Remicade � Every 8 weeks �
Infliximab Remsima � Every 8 weeks �
Inflectra � Every 8 weeks �
Etanercept Enbrel � Once or twice a week �
Benepali � Once a week �
Adalimumab Humira � Twice a week �
Certolizumab pegol Cimzia � Every 4 weeks
Golimumab Simponi � Monthly �
Source: IMS Health, Samsung Securities
Healthcare
2017. 6. 15
18
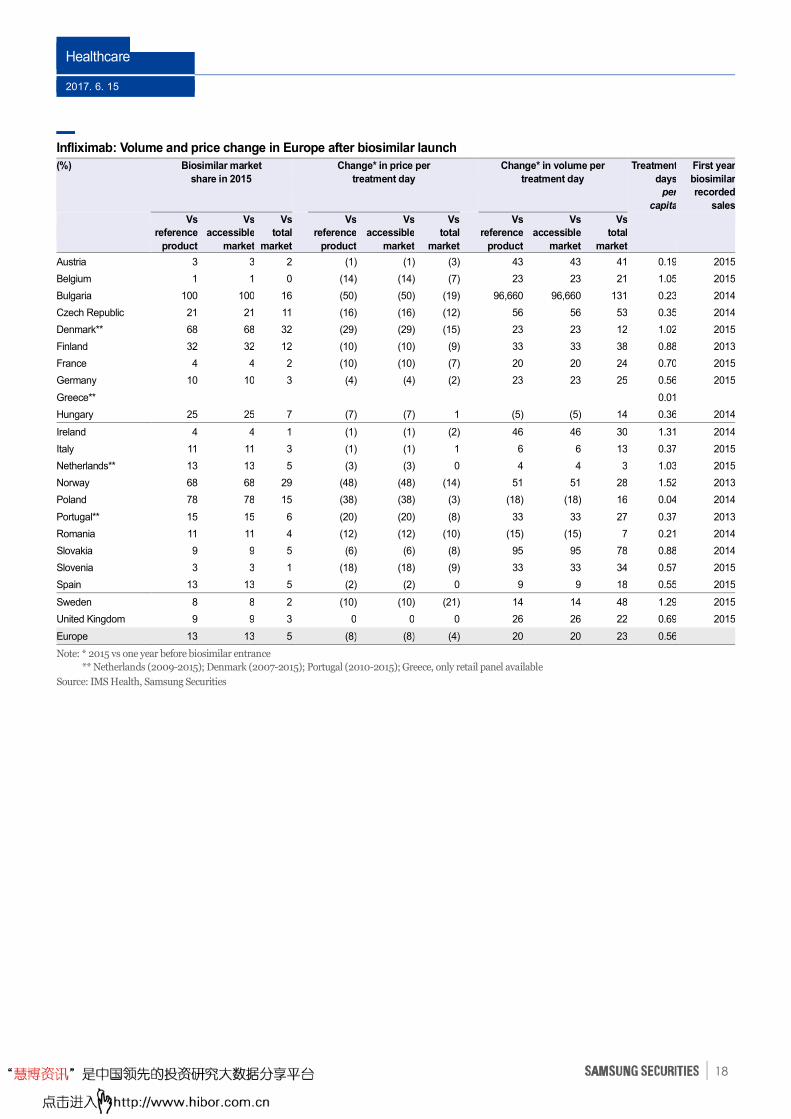
Infliximab: Volume and price change in Europe after biosimilar launch
(%)
Biosimilar market
share in 2015
Change* in price per
treatment day
Change* in volume per
treatment day
Treatment
days
per
capita
First year
biosimilar
recorded
sales
Vs
reference
product
Vs
accessible
market
Vs
total
market
Vs
reference
product
Vs
accessible
market
Vs
total
market
Vs
reference
product
Vs
accessible
market
Vs
total
market
Austria 3 3 2 (1) (1) (3) 43 43 41 0.19 2015
Belgium 1 1 0 (14) (14) (7) 23 23 21 1.05 2015
Bulgaria 100 100 16 (50) (50) (19) 96,660 96,660 131 0.23 2014
Czech Republic 21 21 11 (16) (16) (12) 56 56 53 0.35 2014
Denmark** 68 68 32 (29) (29) (15) 23 23 12 1.02 2015
Finland 32 32 12 (10) (10) (9) 33 33 38 0.88 2013
France 4 4 2 (10) (10) (7) 20 20 24 0.70 2015
Germany 10 10 3 (4) (4) (2) 23 23 25 0.56 2015
Greece** 0.01
Hungary 25 25 7 (7) (7) 1 (5) (5) 14 0.36 2014
Ireland 4 4 1 (1) (1) (2) 46 46 30 1.31 2014
Italy 11 11 3 (1) (1) 1 6 6 13 0.37 2015
Netherlands** 13 13 5 (3) (3) 0 4 4 3 1.03 2015
Norway 68 68 29 (48) (48) (14) 51 51 28 1.52 2013
Poland 78 78 15 (38) (38) (3) (18) (18) 16 0.04 2014
Portugal** 15 15 6 (20) (20) (8) 33 33 27 0.37 2013
Romania 11 11 4 (12) (12) (10) (15) (15) 7 0.21 2014
Slovakia 9 9 5 (6) (6) (8) 95 95 78 0.88 2014
Slovenia 3 3 1 (18) (18) (9) 33 33 34 0.57 2015
Spain 13 13 5 (2) (2) 0 9 9 18 0.55 2015
Sweden 8 8 2 (10) (10) (21) 14 14 48 1.29 2015
United Kingdom 9 9 3 0 0 0 26 26 22 0.69 2015
Europe 13 13 5 (8) (8) (4) 20 20 23 0.56
Note: * 2015 vs one year before biosimilar entrance
** Netherlands (2009-2015); Denmark (2007-2015); Portugal (2010-2015); Greece, only retail panel available
Source: IMS Health, Samsung Securities
Healthcare
2017. 6. 15
19
Korea’s pharmaceutical market outlook solid
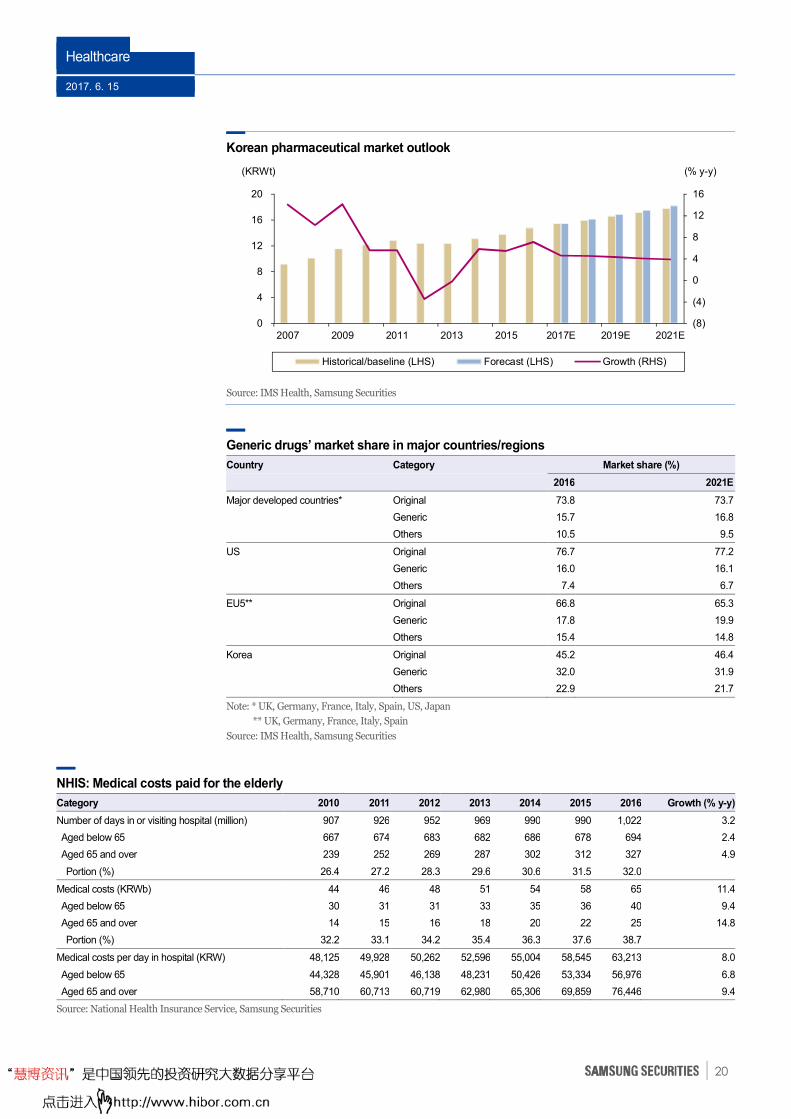
Korea’s pharmaceutical sales outlook: According to IMS Health, Korea’s pharmaceutical
market should grow at a 2017-2021 CAGR of 4.4% to KRW18.58t—around twice stronger the
country’s estimated annual GDP growth of 2.3% over the same period. Cancer therapy and
immunomodulators should achieve the highest growth, averaging 8.5% pa, while anti-diabetes and
digestive-system medicines should also outpace the market’s growth, averaging 5.2% pa. Meanwhile,
sales of systemic anti-infective materials are projected fall sharply as sales of hepatitis C treatments
weaken.
Growth via population aging, chronic disease, wider coverage for four big diseases:
The market expansion will be driven by population aging, according to IMS Health. In 2016, the
elderly—ie, those aged 65 and above—accounted for only 13% of people covered by the National
Health Insurance Service (NHIS), but their medical costs accounted for 39% (KRW25.2t) of the
NHIS total. The life expectancy of Korean females born in 2030 should be 90 years, up from 85.2
years in 2015, while males born in 2030 should have a life expectancy of 84.1 years (vs 79 years in
2015). The country’s medical costs should surge over 2017-2021 as: 1) more people are developing
chronic diseases due to societal aging; and 2) national health insurance coverage is expanding for
four major diseases—ie, cancers, rare diseases, cardiovascular diseases, and cerebrovascular diseases.
The government plans to improve the frameworks for drug prices and health insurance to support
the bio industry.
Generics to continue to lead market growth in Korea: IMS Health says that generics
represented 32% of Korea’s pharmaceutical market in 2016, and that figure should barely budge
through 2021, edging down just 0.1%pts. Meanwhile, the developed-market average should climb
1.1%pts to 16.8% over the same period. Why will market share stagnate in Korea? Because
penetration is already high, and prices are almost on par with those of off-patent drugs, which serves
to discourage substitution with generics. Meanwhile, original drugs accounted for 45.2% of 2016
sales in Korea, around half of which came from off-patent drugs; original drugs made up 73.8% of
sales in developed markets, while off-patent drugs accounted for around just 20%.
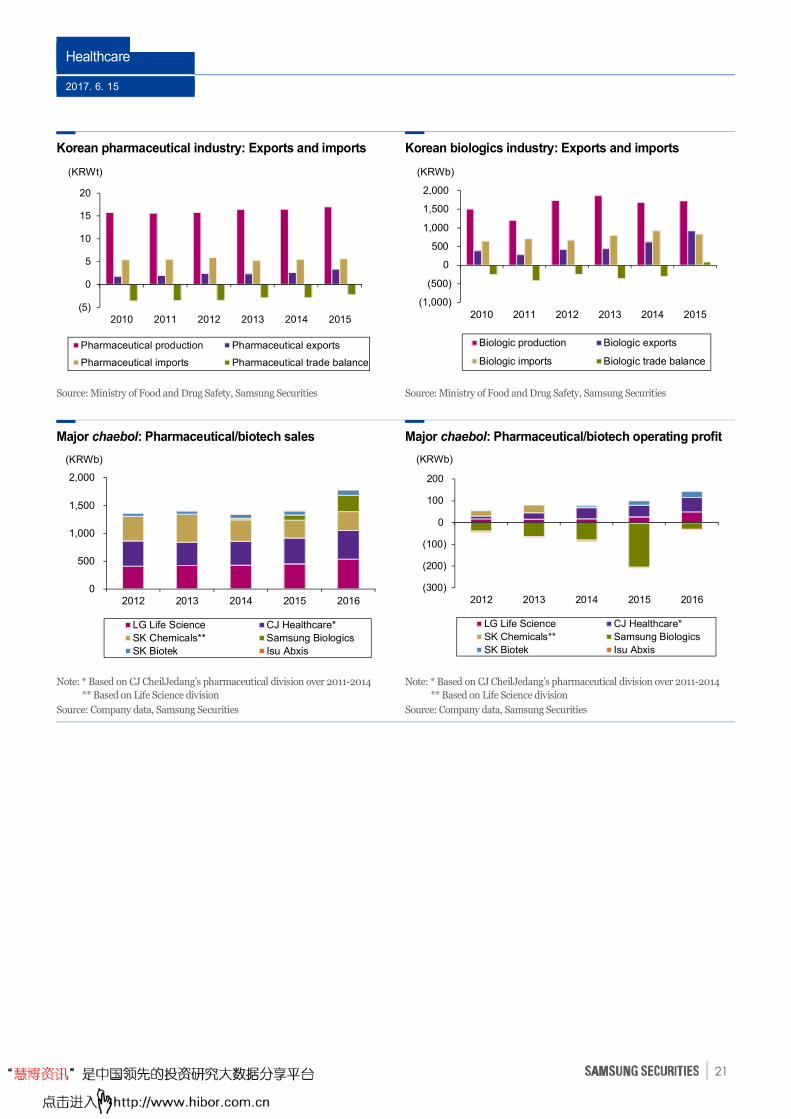
Biologics exports to keep growing strongly: According to Korea’s Ministry of Food and Drug
Safety, the pharmaceutical market grew 3.4% y-y to KRW17t in 2015, with exports leaping 31.1% y-y
to KRW3.3t and imports rising 1.9% y-y to KRW5.6t for a trade deficit of KRW2.3t. In the same year,
biologics production rose 2.3% y-y to KRW1.72t. Biologics exports leapt 47.7% y-y to KRW915.7b
while imports shrank 9.5% y-y to KRW835.3b, turning Korea to a trade surplus of KRW80.4b.
Biologics exports have accelerated, led by solid biosimilar exports, and this trend should continue as
multiple biosimilar are commercialized and exports by bio-CMO firms increase.
Chaebols’ pharmaceutical arms to thrive: Chaebols have also entered the pharmaceutical
market—eg, CJ Healthcare was established in 1984; SK Chemicals (formerly SK Pharma) in 1998;
Isu Abxis in 2001; LG Life Sciences in 2002; SK Biopharmaceuticals (spun off) and Samsung
Biologics in 2011; Samsung Bioepis in 2012; and SK Biotek (spun off) in 2015. These chaebol arms
are now emerging as growth drivers of Korea’s pharmaceutical market and, notably, enjoying rapid
earnings improvements. The combined sales of LG Life Sciences, CJ Healthcare, SK Chemicals,
Samsung Biologics, SK Biotek, and Isu Abxis leapt 27% y-y to KRW1.795t in 2016, and the group
turned y-y to a combined operating profit of KRW110.7b. We expect those companies to enjoy
sustained growth as their investments start to bear fruit.
Healthcare
2017. 6. 15
20
Korean pharmaceutical market outlook
Source: IMS Health, Samsung Securities
Generic drugs’ market share in major countries/regions
Country Category Market share (%)
2016 2021E
Major developed countries* Original 73.8 73.7
Generic 15.7 16.8
Others 10.5 9.5
US Original 76.7 77.2
Generic 16.0 16.1
Others 7.4 6.7
EU5** Original 66.8 65.3
Generic 17.8 19.9
Others 15.4 14.8
Korea Original 45.2 46.4
Generic 32.0 31.9
Others 22.9 21.7
Note: * UK, Germany, France, Italy, Spain, US, Japan
** UK, Germany, France, Italy, Spain
Source: IMS Health, Samsung Securities
NHIS: Medical costs paid for the elderly
Category 2010 2011 2012 2013 2014 2015 2016 Growth (% y-y)
Number of days in or visiting hospital (million) 907 926 952 969 990 990 1,022 3.2
Aged below 65 667 674 683 682 686 678 694 2.4
Aged 65 and over 239 252 269 287 302 312 327 4.9
Portion (%) 26.4 27.2 28.3 29.6 30.6 31.5 32.0
Medical costs (KRWb) 44 46 48 51 54 58 65 11.4
Aged below 65 30 31 31 33 35 36 40 9.4
Aged 65 and over 14 15 16 18 20 22 25 14.8
Portion (%) 32.2 33.1 34.2 35.4 36.3 37.6 38.7
Medical costs per day in hospital (KRW) 48,125 49,928 50,262 52,596 55,004 58,545 63,213 8.0
Aged below 65 44,328 45,901 46,138 48,231 50,426 53,334 56,976 6.8
Aged 65 and over 58,710 60,713 60,719 62,980 65,306 69,859 76,446 9.4
Source: National Health Insurance Service, Samsung Securities
(8)
(4)
0
4
8
12
16
0
4
8
12
16
20
2007 2009 2011 2013 2015 2017E 2019E 2021E
Historical/baseline (LHS) Forecast (LHS) Growth (RHS)
(KRWt) (% y-y)
Healthcare
2017. 6. 15
21
Korean pharmaceutical industry: Exports and imports Korean biologics industry: Exports and imports
Source: Ministry of Food and Drug Safety, Samsung Securities
Source: Ministry of Food and Drug Safety, Samsung Securities
Major chaebol: Pharmaceutical/biotech sales Major chaebol: Pharmaceutical/biotech operating profit
Note: * Based on CJ CheilJedang’s pharmaceutical division over 2011-2014
** Based on Life Science division
Source: Company data, Samsung Securities
Note: * Based on CJ CheilJedang’s pharmaceutical division over 2011-2014
** Based on Life Science division
Source: Company data, Samsung Securities
(5)
0
5
10
15
20
2010 2011 2012 2013 2014 2015
Pharmaceutical production Pharmaceutical exports
Pharmaceutical imports Pharmaceutical trade balance
(KRWt)
(1,000)
(500)
0
500
1,000
1,500
2,000
2010 2011 2012 2013 2014 2015
Biologic production Biologic exports
Biologic imports Biologic trade balance
(KRWb)
0
500
1,000
1,500
2,000
2012 2013 2014 2015 2016
LG Life Science CJ Healthcare*
SK Chemicals** Samsung Biologics
SK Biotek Isu Abxis
(KRWb)
(300)
(200)
(100)
0
100
200
2012 2013 2014 2015 2016
LG Life Science CJ Healthcare*
SK Chemicals** Samsung Biologics
SK Biotek Isu Abxis
(KRWb)
Healthcare
2017. 6. 15
22
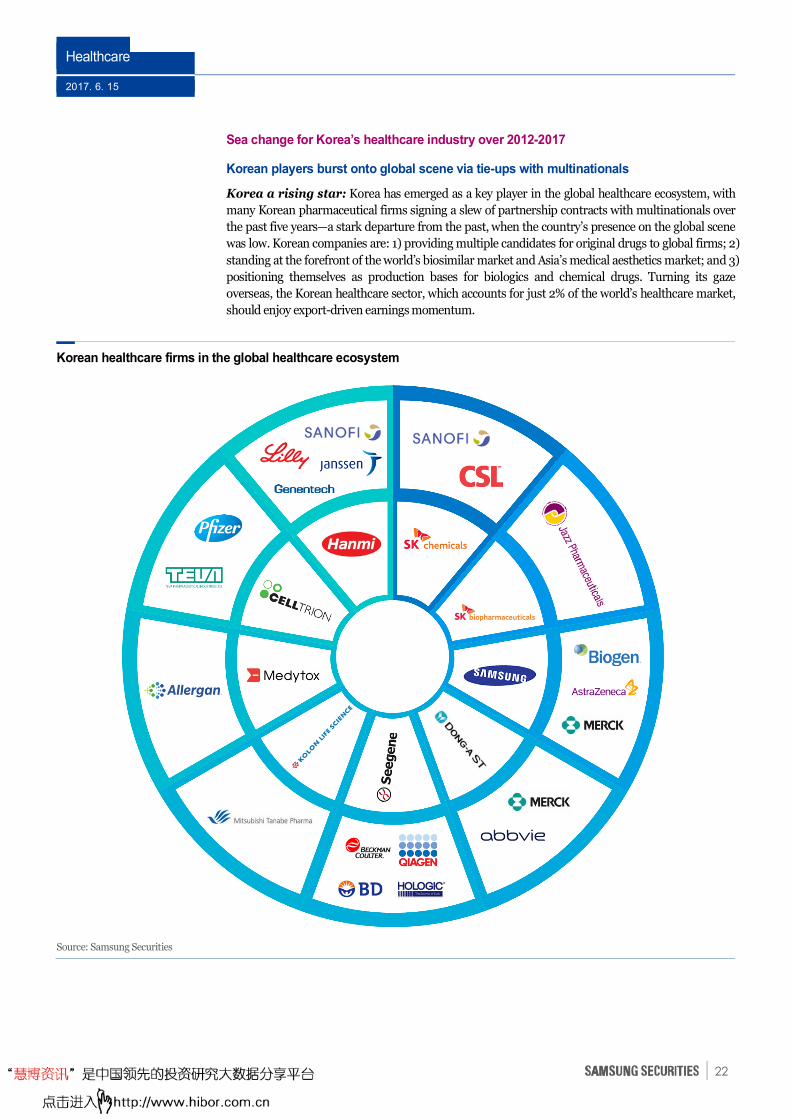
Sea change for Korea’s healthcare industry over 2012-2017
Korean players burst onto global scene via tie-ups with multinationals
Korea a rising star: Korea has emerged as a key player in the global healthcare ecosystem, with
many Korean pharmaceutical firms signing a slew of partnership contracts with multinationals over
the past five years—a stark departure from the past, when the country’s presence on the global scene
was low. Korean companies are: 1) providing multiple candidates for original drugs to global firms; 2)
standing at the forefront of the world’s biosimilar market and Asia’s medical aesthetics market; and 3)
positioning themselves as production bases for biologics and chemical drugs. Turning its gaze
overseas, the Korean healthcare sector, which accounts for just 2% of the world’s healthcare market,
should enjoy export-driven earnings momentum.
Korean healthcare firms in the global healthcare ecosystem
Source: Samsung Securities
Healthcare
2017. 6. 15
23
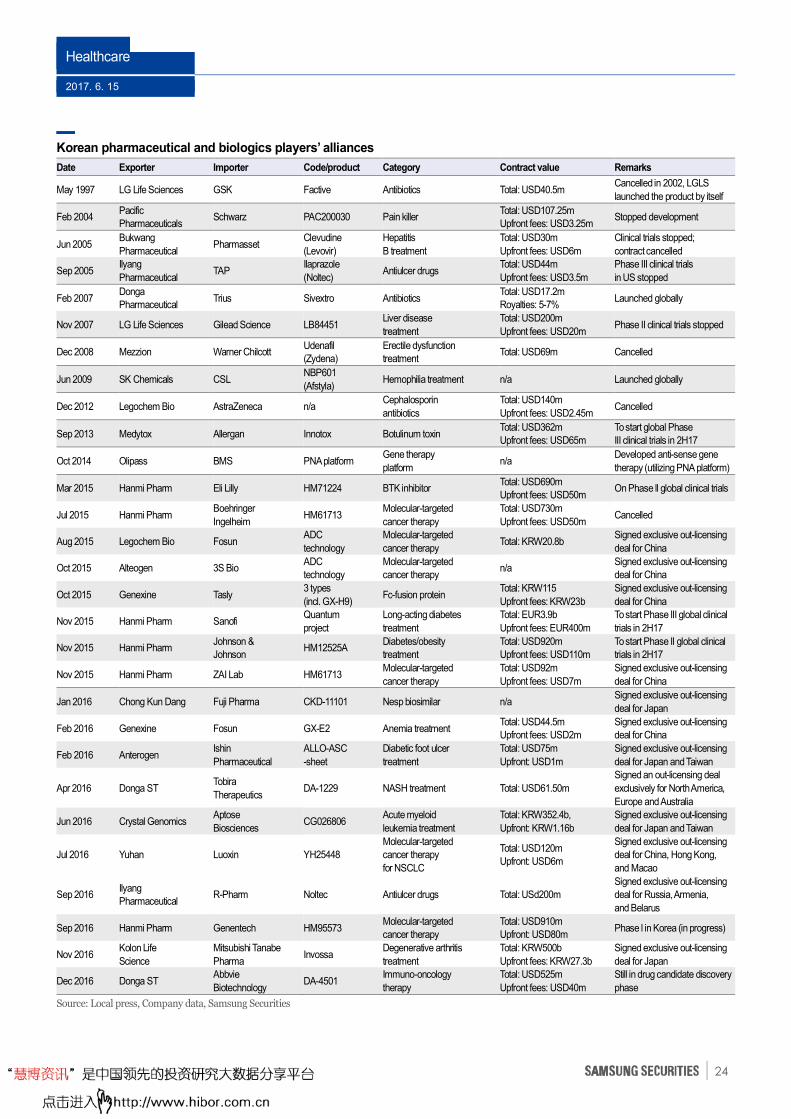
Korean players out-license new drug candidates: To date, the US FDA has approved the
following Korean-made pharmaceuticals: 1) original chemical drugs by LG Life Sciences (Factive,
2003) and Donga ST (Sivextro, 2014); and 2) Afstyla biologics by SK Chemicals (2016). Most Korean
players out-license new drug candidates they discover, because: 1) the have limited capital for R&D; 2)
they lack experience in carrying out global clinical development; 3) they are unsure of the process of
gaining approval and handling health insurance providers and related authorities in developed
countries; or 4) they are weak on the marketing front. Donga ST in 2007 out-licensed Sivextro to
Trius Therapeutics, which was later acquired by Merck, which went on to commercialize the drug. SK
Chemicals’ Afstyla also hit the shelves after an out-licensing contract with CSL (Australia) in 2010.
Out-licensing contracts signed over 2013-2016: Medytox in Sep 2013 out-licensed Innotox,
the world’s first liquid botulinum toxin (BTX; a bio-better) to Allergan for USD362m. It granted
Allergan exclusive development and sales rights worldwide (save Korea and Japan). Over 2015-2016,
Hanmi Pharmaceutical agreed to export its technology for autoimmune therapy HM71224 to Eli Lilly
(in a deal worth USD690m), the Quantum Project (diabetes drugs) to Sanofi, diabetes and obesity
treatments HM12525A and JNJ-64565111 to Johnson & Johnson (USD9150m), and anti-cancer RAF
kinase inhibitor HM95573 to Genentech (USD910m). Kolon Life Science out-licensed Invossa, the
world’s first allogeneic cell therapy for degenerative arthritis, to Mitsubishi Tanabe for JPY45.7b in
2016. Donga ST in Dec 2016 said it had out-licensed DA-4501, a cancer immunotherapy candidate
targeting Mer TK, to AbbVie Biotechnology in a deal worth up to USD525m.
Healthcare
2017. 6. 15
24
Korean pharmaceutical and biologics players’ alliances
Date Exporter Importer Code/product Category Contract value Remarks
May 1997 LG Life Sciences GSK Factive Antibiotics Total: USD40.5m Cancelled in 2002, LGLS
launched the product by itself
Feb 2004 Pacific
Pharmaceuticals Schwarz PAC200030 Pain killer
Total: USD107.25m
Upfront fees: USD3.25m Stopped development
Jun 2005 Bukwang
Pharmaceutical Pharmasset
Clevudine
(Levovir)
Hepatitis
B treatment
Total: USD30m
Upfront fees: USD6m
Clinical trials stopped;
contract cancelled
Sep 2005 Ilyang
Pharmaceutical TAP
Ilaprazole
(Noltec) Antiulcer drugs
Total: USD44m
Upfront fees: USD3.5m
Phase III clinical trials
in US stopped
Feb 2007 Donga
Pharmaceutical Trius Sivextro Antibiotics
Total: USD17.2m
Royalties: 5-7% Launched globally
Nov 2007 LG Life Sciences Gilead Science LB84451 Liver disease
treatment
Total: USD200m
Upfront fees: USD20m Phase II clinical trials stopped
Dec 2008 Mezzion Warner Chilcott Udenafil
(Zydena)
Erectile dysfunction
treatment Total: USD69m Cancelled
Jun 2009 SK Chemicals CSL NBP601
(Afstyla) Hemophilia treatment n/a Launched globally
Dec 2012 Legochem Bio AstraZeneca n/a Cephalosporin
antibiotics
Total: USD140m
Upfront fees: USD2.45m Cancelled
Sep 2013 Medytox Allergan Innotox Botulinum toxin Total: USD362m
Upfront fees: USD65m
To start global Phase
III clinical trials in 2H17
Oct 2014 Olipass BMS PNA platform Gene therapy
platform n/a
Developed anti-sense gene
therapy (utilizing PNA platform)
Mar 2015 Hanmi Pharm Eli Lilly HM71224 BTK inhibitor Total: USD690m
Upfront fees: USD50m On Phase ll global clinical trials
Jul 2015 Hanmi Pharm Boehringer
Ingelheim HM61713
Molecular-targeted
cancer therapy
Total: USD730m
Upfront fees: USD50m Cancelled
Aug 2015 Legochem Bio Fosun ADC
technology
Molecular-targeted
cancer therapy Total: KRW20.8b
Signed exclusive out-licensing
deal for China
Oct 2015 Alteogen 3S Bio ADC
technology
Molecular-targeted
cancer therapy n/a
Signed exclusive out-licensing
deal for China
Oct 2015 Genexine Tasly 3 types
(incl. GX-H9) Fc-fusion protein
Total: KRW115
Upfront fees: KRW23b
Signed exclusive out-licensing
deal for China
Nov 2015 Hanmi Pharm Sanofi Quantum
project
Long-acting diabetes
treatment
Total: EUR3.9b
Upfront fees: EUR400m
To start Phase III global clinical
trials in 2H17
Nov 2015 Hanmi Pharm Johnson &
Johnson HM12525A
Diabetes/obesity
treatment
Total: USD920m
Upfront fees: USD110m
To start Phase II global clinical
trials in 2H17
Nov 2015 Hanmi Pharm ZAI Lab HM61713 Molecular-targeted
cancer therapy
Total: USD92m
Upfront fees: USD7m
Signed exclusive out-licensing
deal for China
Jan 2016 Chong Kun Dang Fuji Pharma CKD-11101 Nesp biosimilar n/a Signed exclusive out-licensing
deal for Japan
Feb 2016 Genexine Fosun GX-E2 Anemia treatment Total: USD44.5m
Upfront fees: USD2m
Signed exclusive out-licensing
deal for China
Feb 2016 Anterogen Ishin
Pharmaceutical
ALLO-ASC
-sheet
Diabetic foot ulcer
treatment
Total: USD75m
Upfront: USD1m
Signed exclusive out-licensing
deal for Japan and Taiwan
Apr 2016 Donga ST Tobira
Therapeutics DA-1229 NASH treatment Total: USD61.50m
Signed an out-licensing deal
exclusively for North America,
Europe and Australia
Jun 2016 Crystal Genomics Aptose
Biosciences CG026806
Acute myeloid
leukemia treatment
Total: KRW352.4b,
Upfront: KRW1.16b
Signed exclusive out-licensing
deal for Japan and Taiwan
Jul 2016 Yuhan Luoxin YH25448
Molecular-targeted
cancer therapy
for NSCLC
Total: USD120m
Upfront: USD6m
Signed exclusive out-licensing
deal for China, Hong Kong,
and Macao
Sep 2016 Ilyang
Pharmaceutical R-Pharm Noltec Antiulcer drugs Total: USd200m
Signed exclusive out-licensing
deal for Russia, Armenia,
and Belarus
Sep 2016 Hanmi Pharm Genentech HM95573 Molecular-targeted
cancer therapy
Total: USD910m
Upfront: USD80m Phase l in Korea (in progress)
Nov 2016 Kolon Life
Science
Mitsubishi Tanabe
Pharma Invossa
Degenerative arthritis
treatment
Total: KRW500b
Upfront fees: KRW27.3b
Signed exclusive out-licensing
deal for Japan
Dec 2016 Donga ST Abbvie
Biotechnology DA-4501
Immuno-oncology
therapy
Total: USD525m
Upfront fees: USD40m
Still in drug candidate discovery
phase
Source: Local press, Company data, Samsung Securities
Healthcare
2017. 6. 15
25
Korean biosimilar developers leading the way
Biologics turn to trade surplus for first time in 2015: Korea’s pharmaceutical market
shrank a touch in 2015, creeping down 0.7% y-y to KRW19.1b, with production, exports, and imports
up 3.4%, 31.1%, and 1.9% y-y, respectively, to KRW17t, KRW3.3t, and KRW5.6t. Meanwhile, Korea’s
biologics market contracted a sharp 17.3% y-y to KRW1.64t, with production and exports rising 2.3%
and 47.7% y-y, respectively, to KRW1.72t and KRW815.7b, and imports falling 9.5% y-y to
KRW835.3b. The biologics market accounted for 8.5% of the nation’s pharmaceutical market
(down 1.7%pts y-y), while biologics production, exports, and imports represented a respective 10.1%,
27.5% and 14.9% (down 0.1%pts, up 3.1%pts, and down 1.9%pts y-y). The nation’s biologics industry
suffered a trade deficits before turning to its first-ever surplus in 2015. Backed by solid growth in
biologics exports, the pharmaceutical trade deficit also declined rapidly.
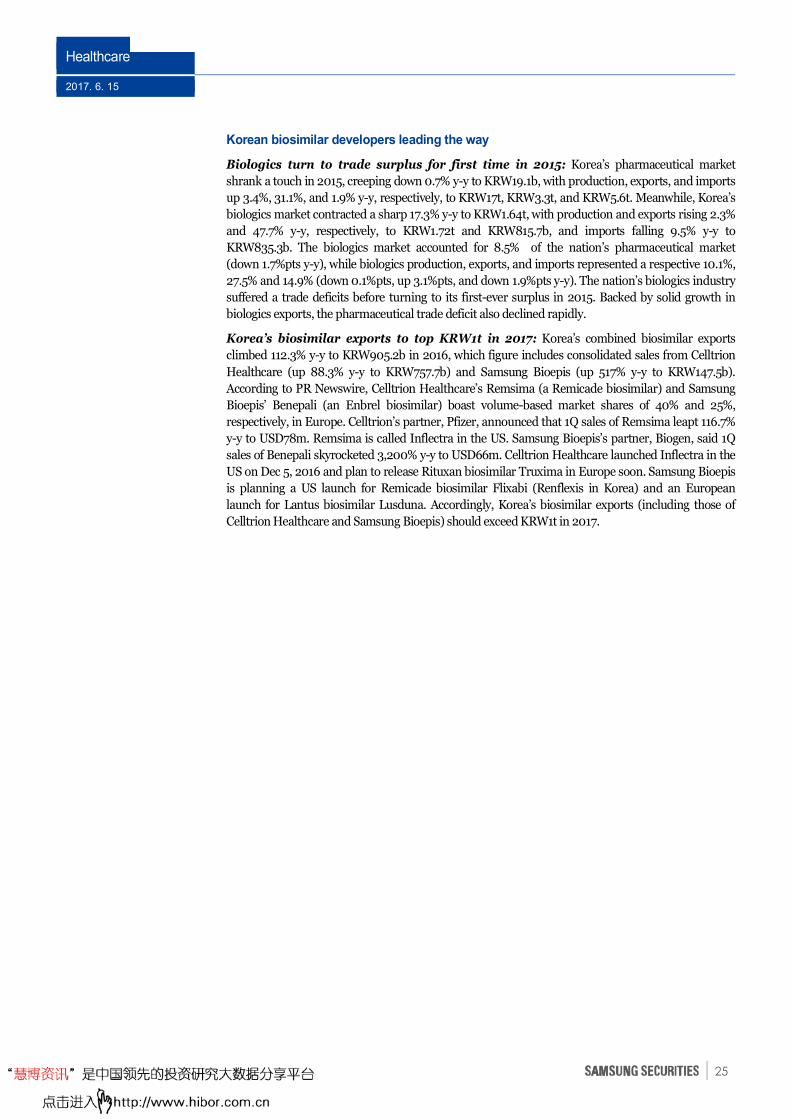
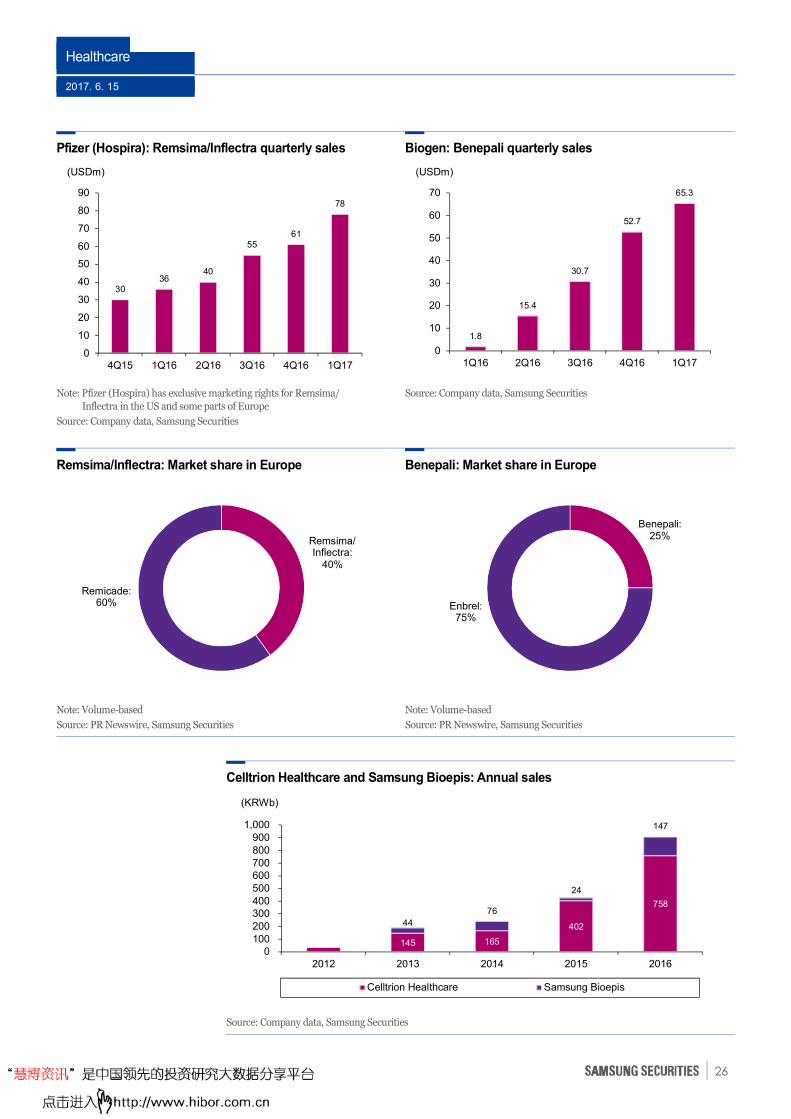
Korea’s biosimilar exports to top KRW1t in 2017: Korea’s combined biosimilar exports
climbed 112.3% y-y to KRW905.2b in 2016, which figure includes consolidated sales from Celltrion
Healthcare (up 88.3% y-y to KRW757.7b) and Samsung Bioepis (up 517% y-y to KRW147.5b).
According to PR Newswire, Celltrion Healthcare’s Remsima (a Remicade biosimilar) and Samsung
Bioepis’ Benepali (an Enbrel biosimilar) boast volume-based market shares of 40% and 25%,
respectively, in Europe. Celltrion’s partner, Pfizer, announced that 1Q sales of Remsima leapt 116.7%
y-y to USD78m. Remsima is called Inflectra in the US. Samsung Bioepis’s partner, Biogen, said 1Q
sales of Benepali skyrocketed 3,200% y-y to USD66m. Celltrion Healthcare launched Inflectra in the
US on Dec 5, 2016 and plan to release Rituxan biosimilar Truxima in Europe soon. Samsung Bioepis
is planning a US launch for Remicade biosimilar Flixabi (Renflexis in Korea) and an European
launch for Lantus biosimilar Lusduna. Accordingly, Korea’s biosimilar exports (including those of
Celltrion Healthcare and Samsung Bioepis) should exceed KRW1t in 2017.
Healthcare
2017. 6. 15
26
Pfizer (Hospira): Remsima/Inflectra quarterly sales Biogen: Benepali quarterly sales
Note: Pfizer (Hospira) has exclusive marketing rights for Remsima/
Inflectra in the US and some parts of Europe
Source: Company data, Samsung Securities
Source: Company data, Samsung Securities
Remsima/Inflectra: Market share in Europe Benepali: Market share in Europe
Note: Volume-based
Source: PR Newswire, Samsung Securities
Note: Volume-based
Source: PR Newswire, Samsung Securities
Celltrion Healthcare and Samsung Bioepis: Annual sales
Source: Company data, Samsung Securities
3036
40
5561
78
0
10
20
30
40
50
60
70
80
90
4Q15 1Q16 2Q16 3Q16 4Q16 1Q17
(USDm)
1.8
15.4
30.7
52.7
65.3
0
10
20
30
40
50
60
70
1Q16 2Q16 3Q16 4Q16 1Q17
(USDm)
Remsima/Inflectra:
40%
Remicade:60%
Benepali:25%
Enbrel:75%
34 145 165
402
758
44
76
24
147
0100200300400500600700800900
1,000
2012 2013 2014 2015 2016
Celltrion Healthcare Samsung Bioepis
(KRWb)
Healthcare
2017. 6. 15
27
Korean medical-aesthetic firms penetrate global BTX and filler markets
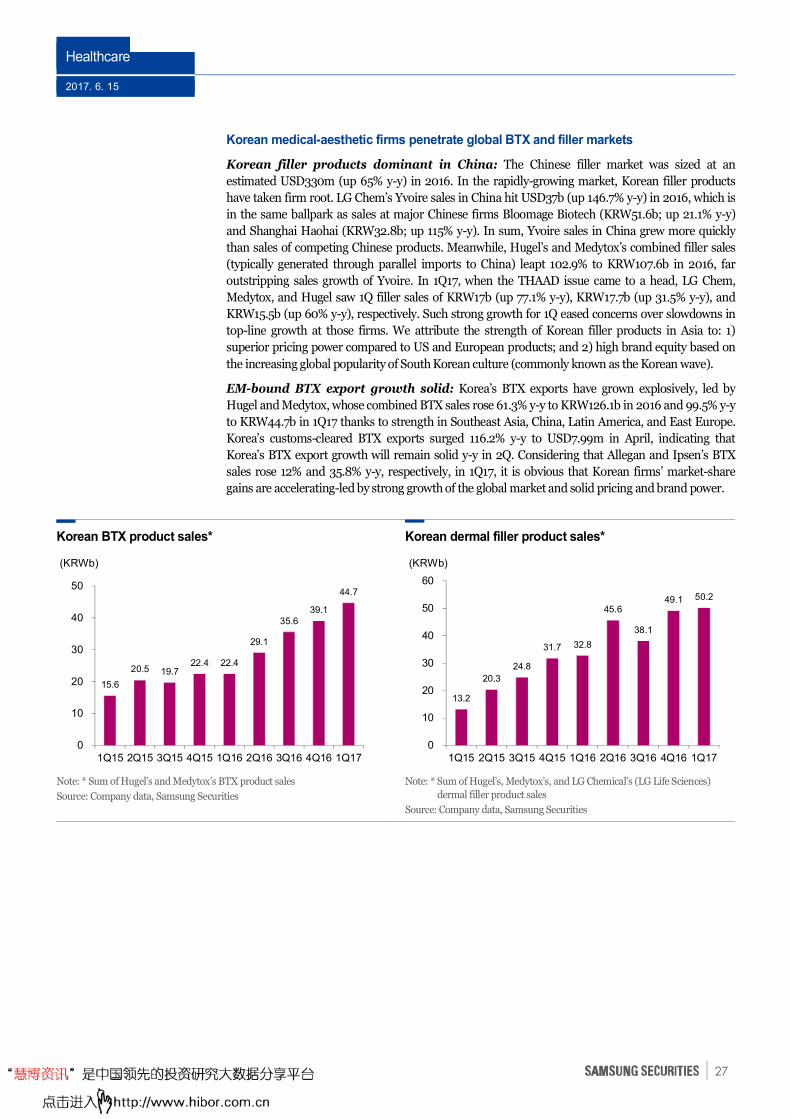
Korean filler products dominant in China: The Chinese filler market was sized at an
estimated USD330m (up 65% y-y) in 2016. In the rapidly-growing market, Korean filler products
have taken firm root. LG Chem’s Yvoire sales in China hit USD37b (up 146.7% y-y) in 2016, which is
in the same ballpark as sales at major Chinese firms Bloomage Biotech (KRW51.6b; up 21.1% y-y)
and Shanghai Haohai (KRW32.8b; up 115% y-y). In sum, Yvoire sales in China grew more quickly
than sales of competing Chinese products. Meanwhile, Hugel’s and Medytox’s combined filler sales
(typically generated through parallel imports to China) leapt 102.9% to KRW107.6b in 2016, far
outstripping sales growth of Yvoire. In 1Q17, when the THAAD issue came to a head, LG Chem,
Medytox, and Hugel saw 1Q filler sales of KRW17b (up 77.1% y-y), KRW17.7b (up 31.5% y-y), and
KRW15.5b (up 60% y-y), respectively. Such strong growth for 1Q eased concerns over slowdowns in
top-line growth at those firms. We attribute the strength of Korean filler products in Asia to: 1)
superior pricing power compared to US and European products; and 2) high brand equity based on
the increasing global popularity of South Korean culture (commonly known as the Korean wave).
EM-bound BTX export growth solid: Korea’s BTX exports have grown explosively, led by
Hugel and Medytox, whose combined BTX sales rose 61.3% y-y to KRW126.1b in 2016 and 99.5% y-y
to KRW44.7b in 1Q17 thanks to strength in Southeast Asia, China, Latin America, and East Europe.
Korea’s customs-cleared BTX exports surged 116.2% y-y to USD7.99m in April, indicating that
Korea’s BTX export growth will remain solid y-y in 2Q. Considering that Allegan and Ipsen’s BTX
sales rose 12% and 35.8% y-y, respectively, in 1Q17, it is obvious that Korean firms’ market-share
gains are accelerating-led by strong growth of the global market and solid pricing and brand power.
Korean BTX product sales* Korean dermal filler product sales*
Note: * Sum of Hugel’s and Medytox’s BTX product sales
Source: Company data, Samsung Securities
Note: * Sum of Hugel’s, Medytox’s, and LG Chemical’s (LG Life Sciences)
dermal filler product sales
Source: Company data, Samsung Securities
15.6
20.5 19.7 22.4 22.4
29.1
35.6 39.1
44.7
0
10
20
30
40
50
1Q15 2Q15 3Q15 4Q15 1Q16 2Q16 3Q16 4Q16 1Q17
(KRWb)
13.2
20.3
24.8
31.7 32.8
45.6
38.1
49.1 50.2
0
10
20
30
40
50
60
1Q15 2Q15 3Q15 4Q15 1Q16 2Q16 3Q16 4Q16 1Q17
(KRWb)
Healthcare
2017. 6. 15
28
Korean firms to lead global biologics CMO and chemical-drug CMS markets
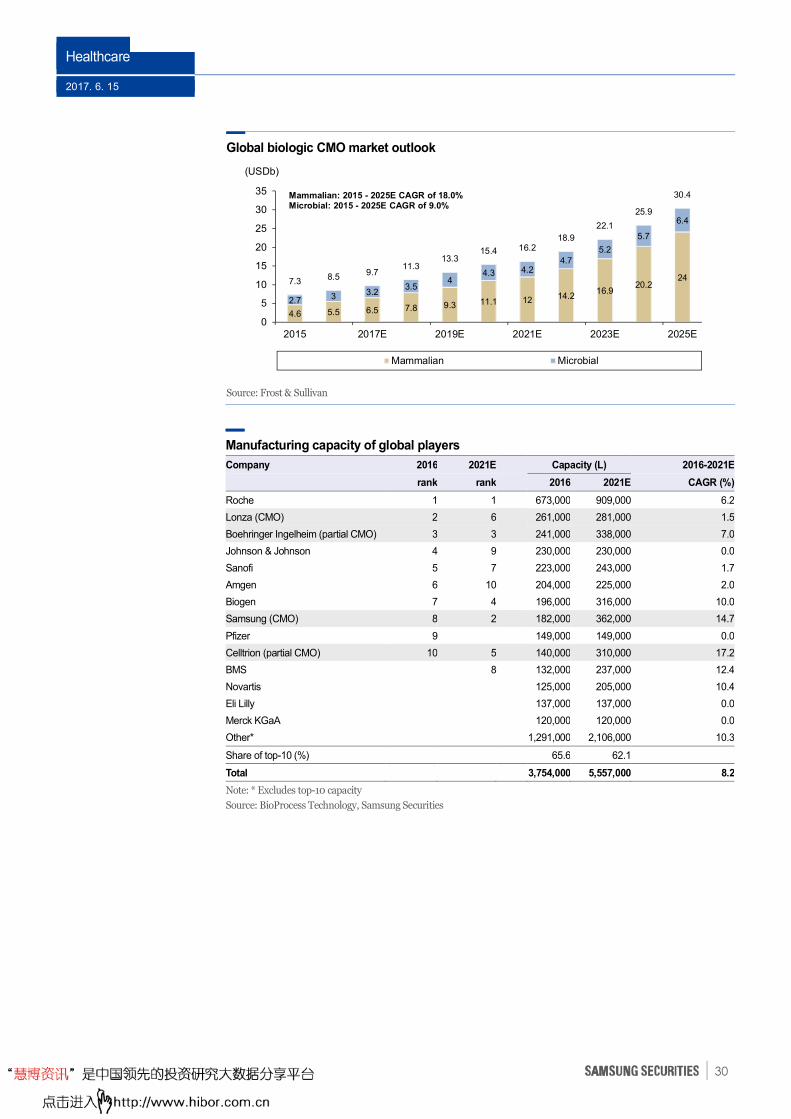
Global market for contracted manufacturing growing: The global market for chemical-
drug contract manufacturing services (CMS) is projected to grow at a 2015-2020 CAGR of 6.3% to
USD84b as pharmaceutical firms increasing outsource manufacturing as they strive to improve cost
competitiveness and amid rising demand for selective manufacturing technology. The global market
for biologics contract manufacturing organizations (CMOs) should grow at a 2015-2025 CAGR of 15.1%
to USD30.3b given the needs for capacity management, cost savings, risk control, rapid production,
and efficient use of resources.
Korea potentially home to a global top-ten CMS and the top CMO: SK Biotek entered the
CMS business in 1998 and was incorporated as an SK Group subsidiary in 2016 after being spun off
from SK Biopharmaceuticals in 2015. SK Biotek has accumulated a wide range of experience and
knowhow thanks to its group’s five decades of operating refineries and petrochemicals facilities. Of
note is the firm’s ability to meet customer demand for high-tech manufacturing, backed by its world-
class technology in continuous organic synthesis and systems that enable it to make over 50 types of
chemical synthesis technology. The firm’s factory in Daeduk has an annual production capacity of
158m cubic meters, while its factory in Sejong will open this year with a capacity of 318m cubic
meters, and this latter should rise to 798
m in 2020. Meanwhile, Samsung Biologics is Samsung Group’s biotech holding company established
in 2011 as a subsidiary of Samsung C&T and Samsung Electronics. Samsung Biologics is expanding
capacity efficiently by leveraging the group’s: 1) competitiveness in design, engineering, procurement,
construction, and validation (DEPC-V); and 2) ability to construct plant and install equipment
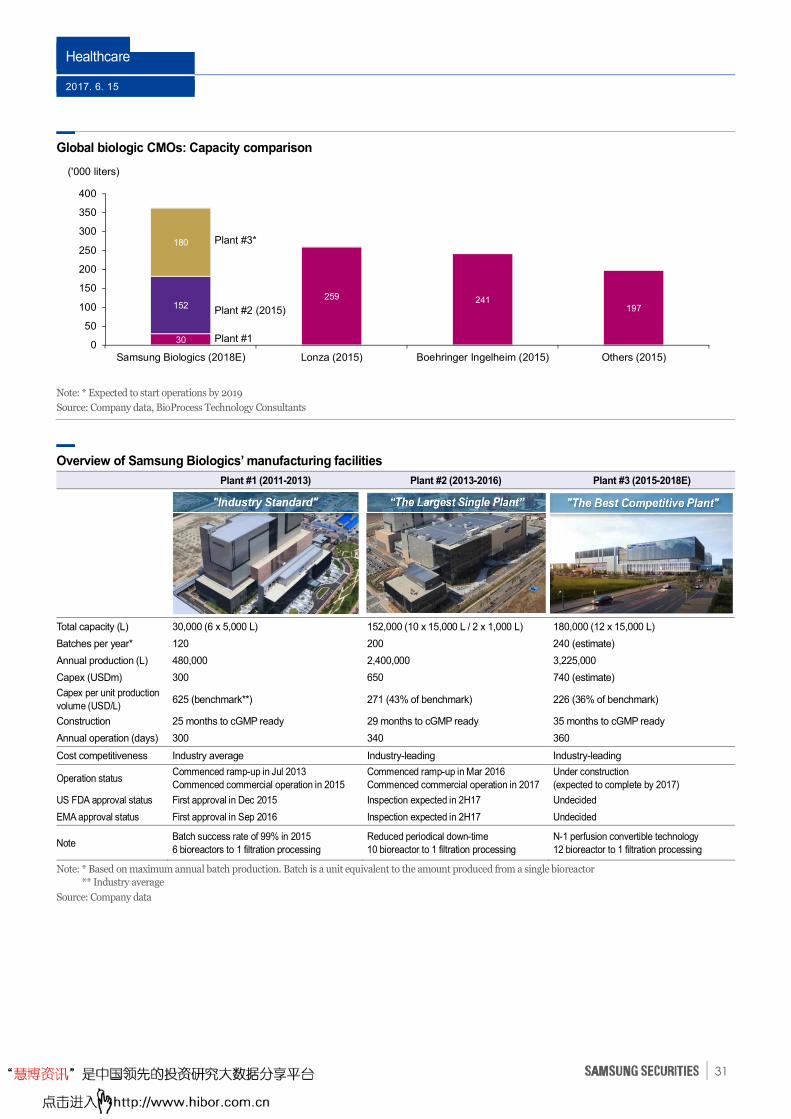
concurrently (based on its experience in the semiconductor industry). Swiss firm Lonza currently has
the world’s largest bio-CMO capacity at 259,000 liters, followed by Boehringer Ingelheim’s 241,000
liters and Samsung Biologics’ 182,000 liters. By 2018, however, Samsung Biologics should top the list
with 362,000 liters of capacity, followed by Boehringer Ingelheim’s 319,000 liters and Lonza’s
265,000 liters.
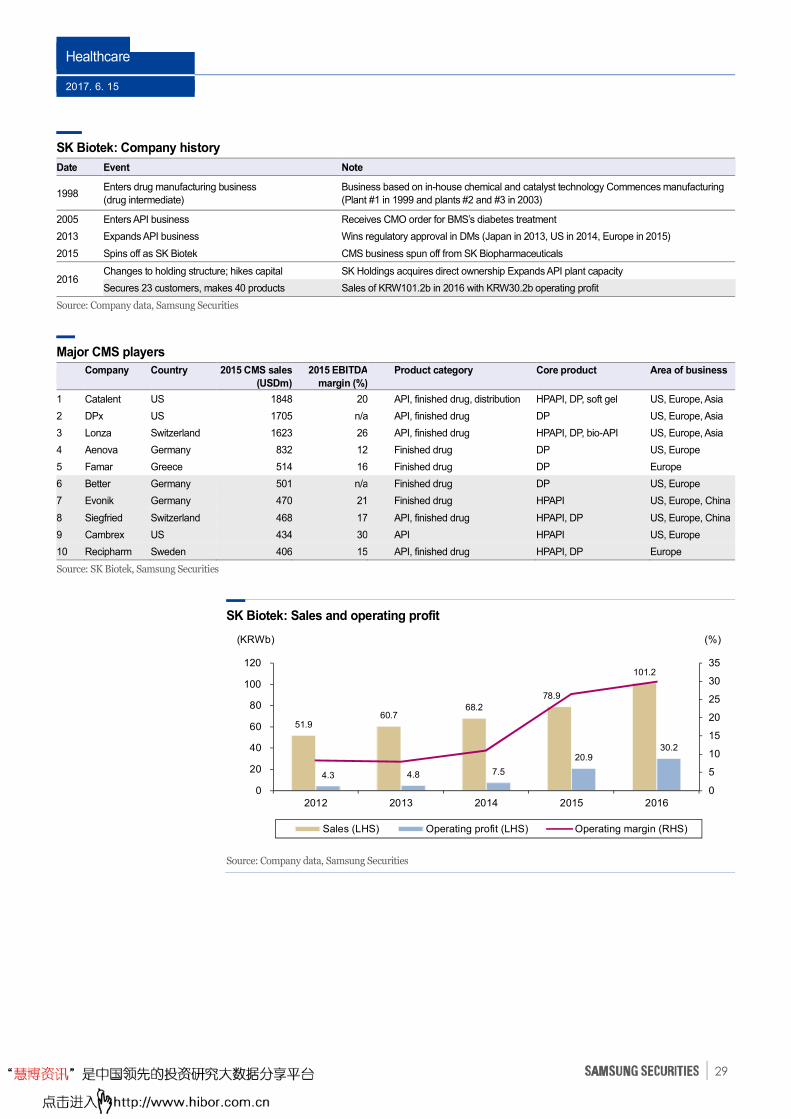
SK Biotek and Samsung Biologics pursuing ambitious 2020 targets: SK Biotek in 2016
posted sales of KRW97.1b (up 52.5% y-y) and an operating profit of KRW28.1b (up 80.1% y-y) for a
margin of 29% (up 4.4% pts y-y). The company’s 2020 vision is to become a global top-ten CMS
player with KRW1.5t in sales, KRW300b in operating profit, and an operating margin of 20%. IT will
pursue this by: 1) strengthening its competitiveness via domestic capacity expansions; and 2) seeking
M&A opportunities to rapidly secure capabilities. Samsung Biologics last year posted another
operating loss, this time to the tune of KRW30.4b on parent-based sales of KRW294.6b (up 337.3%
y-y). The company aims to be the world’s top bio-CMO player by 2020, with sales of KRW1t, an
operating profit of KRW400b, and an operating margin of 40%. The company currently has nine
CMO contracts totaling USD3.2b with six multinational pharmaceutical and biotechnology firms. It
is also negotiating with 15 such firms over around 30 biologics.
Healthcare
2017. 6. 15
29
SK Biotek: Company history
Date Event Note
1998 Enters drug manufacturing business
(drug intermediate)
Business based on in-house chemical and catalyst technology Commences manufacturing
(Plant #1 in 1999 and plants #2 and #3 in 2003)
2005 Enters API business Receives CMO order for BMS’s diabetes treatment
2013 Expands API business Wins regulatory approval in DMs (Japan in 2013, US in 2014, Europe in 2015)
2015 Spins off as SK Biotek CMS business spun off from SK Biopharmaceuticals
2016 Changes to holding structure; hikes capital SK Holdings acquires direct ownership Expands API plant capacity
Secures 23 customers, makes 40 products Sales of KRW101.2b in 2016 with KRW30.2b operating profit
Source: Company data, Samsung Securities
Major CMS players
Company
Country
2015 CMS sales
(USDm)
2015 EBITDA
margin (%)
Product category
Core product
Area of business
1 Catalent US 1848 20 API, finished drug, distribution HPAPI, DP, soft gel US, Europe, Asia
2 DPx US 1705 n/a API, finished drug DP US, Europe, Asia
3 Lonza Switzerland 1623 26 API, finished drug HPAPI, DP, bio-API US, Europe, Asia
4 Aenova Germany 832 12 Finished drug DP US, Europe
5 Famar Greece 514 16 Finished drug DP Europe
6 Better Germany 501 n/a Finished drug DP US, Europe
7 Evonik Germany 470 21 Finished drug HPAPI US, Europe, China
8 Siegfried Switzerland 468 17 API, finished drug HPAPI, DP US, Europe, China
9 Cambrex US 434 30 API HPAPI US, Europe
10 Recipharm Sweden 406 15 API, finished drug HPAPI, DP Europe
Source: SK Biotek, Samsung Securities
SK Biotek: Sales and operating profit
Source: Company data, Samsung Securities
51.9 60.7
68.2
78.9
101.2
4.3 4.8 7.5
20.9 30.2
0
5
10
15
20
25
30
35
0
20
40
60
80
100
120
2012 2013 2014 2015 2016
Sales (LHS) Operating profit (LHS) Operating margin (RHS)
(KRWb) (%)
Healthcare
2017. 6. 15
30
Global biologic CMO market outlook
Source: Frost & Sullivan
Manufacturing capacity of global players
Company 2016 2021E Capacity (L) 2016-2021E
rank rank 2016 2021E CAGR (%)
Roche 1 1 673,000 909,000 6.2
Lonza (CMO) 2 6 261,000 281,000 1.5
Boehringer Ingelheim (partial CMO) 3 3 241,000 338,000 7.0
Johnson & Johnson 4 9 230,000 230,000 0.0
Sanofi 5 7 223,000 243,000 1.7
Amgen 6 10 204,000 225,000 2.0
Biogen 7 4 196,000 316,000 10.0
Samsung (CMO) 8 2 182,000 362,000 14.7
Pfizer 9 149,000 149,000 0.0
Celltrion (partial CMO) 10 5 140,000 310,000 17.2
BMS 8 132,000 237,000 12.4
Novartis 125,000 205,000 10.4
Eli Lilly 137,000 137,000 0.0
Merck KGaA 120,000 120,000 0.0
Other* 1,291,000 2,106,000 10.3
Share of top-10 (%) 65.6 62.1
Total 3,754,000 5,557,000 8.2
Note: * Excludes top-10 capacity
Source: BioProcess Technology, Samsung Securities
4.6 5.5 6.5 7.8 9.3 11.1 12 14.216.9
20.224
2.7 3 3.23.5
44.3 4.2
4.75.2
5.7
6.4
7.38.5
9.711.3
13.315.4 16.2
18.9
22.1
25.9
30.4
0
5
10
15
20
25
30
35
2015 2017E 2019E 2021E 2023E 2025E
Mammalian Microbial
(USDb)
Mammalian: 2015 - 2025E CAGR of 18.0%Microbial: 2015 - 2025E CAGR of 9.0%
Healthcare
2017. 6. 15
31
Global biologic CMOs: Capacity comparison
Note: * Expected to start operations by 2019
Source: Company data, BioProcess Technology Consultants
Overview of Samsung Biologics’ manufacturing facilities
Plant #1 (2011-2013) Plant #2 (2013-2016) Plant #3 (2015-2018E)
Total capacity (L) 30,000 (6 x 5,000 L) 152,000 (10 x 15,000 L / 2 x 1,000 L) 180,000 (12 x 15,000 L)
Batches per year* 120 200 240 (estimate)
Annual production (L) 480,000 2,400,000 3,225,000
Capex (USDm) 300 650 740 (estimate)
Capex per unit production
volume (USD/L) 625 (benchmark**) 271 (43% of benchmark) 226 (36% of benchmark)
Construction 25 months to cGMP ready 29 months to cGMP ready 35 months to cGMP ready
Annual operation (days) 300 340 360
Cost competitiveness Industry average Industry-leading Industry-leading
Operation status Commenced ramp-up in Jul 2013
Commenced commercial operation in 2015
Commenced ramp-up in Mar 2016
Commenced commercial operation in 2017
Under construction
(expected to complete by 2017)
US FDA approval status First approval in Dec 2015 Inspection expected in 2H17 Undecided
EMA approval status First approval in Sep 2016 Inspection expected in 2H17 Undecided
Note Batch success rate of 99% in 2015
6 bioreactors to 1 filtration processing
Reduced periodical down-time
10 bioreactor to 1 filtration processing
N-1 perfusion convertible technology
12 bioreactor to 1 filtration processing
Note: * Based on maximum annual batch production. Batch is a unit equivalent to the amount produced from a single bioreactor
** Industry average
Source: Company data
30
259 241197152
180
0
50
100
150
200
250
300
350
400
Samsung Biologics (2018E) Lonza (2015) Boehringer Ingelheim (2015) Others (2015)
('000 liters)
Plant #3*
Plant #2 (2015)
Plant #1
Healthcare
2017. 6. 15
32
Visible progress to be made on R&D and B2B fronts
Firms with R&D or B2B deals with multinationals warrant attention
Uncertainties to ease in 2H: As stated, Hanmi Pharmaceutical, Medytox, and Seegene gained
global recognition over 2013-2016 for their out-licensing and ODM supply contracts with global
pharmaceutical companies. Yet, slow R&D progress by the global firms and delays in ODM
shipments have raised concerns over contract cancellations. In 2H, we expect Hanmi and Medytox to
move to the next phase of development and Seegene to start ODM shipments. Indeed, expectations
should supplant concerns and lead to the market to reevaluate Korean firms’ R&D capabilities.
Multiple drugs up for US, European approval: Samsung Bioepis and Celltrion filed for FDA
and EMA approval of multiple biosimilars in 2016 and expect to obtain them in 2H. Also in 2H: 1)
Green Cross should reapply for US approval of its immunodeficiency drug IVIG, which was shelved
in 2016 after an FDA review; and 2) SK Biopharmaceuticals plans to file for US approval of its
epilepsy drug Cenobamate and sleep disorder drug SKL-N05/JZP-110.
R&D to regain momentum, influence shares: Sentiment on the healthcare sector soured in
late 2016 on the cancellation or revision of some of Hanmi’s out-licensing contracts, and investors
lost interest in the sector in 1H17 for a lack of R&D momentum. In 2H17, however, the sector should
show visible R&D progress, resume ODM shipments, and receive US and European approvals for
multiple drugs, boosting sentiment and making R&D a key share-price determinant once again.
Contents
1H review: Poverty in the midst of plenty
p2
Pharmaceutical market outlook
p7
Visible progress to be made on R&D and B2B fronts
p32
Government policy warrants attention
p52
Key issues in 2H p68
Solid earnings momentum in 2H
p87
Company p105
Healthcare
2017. 6. 15
33
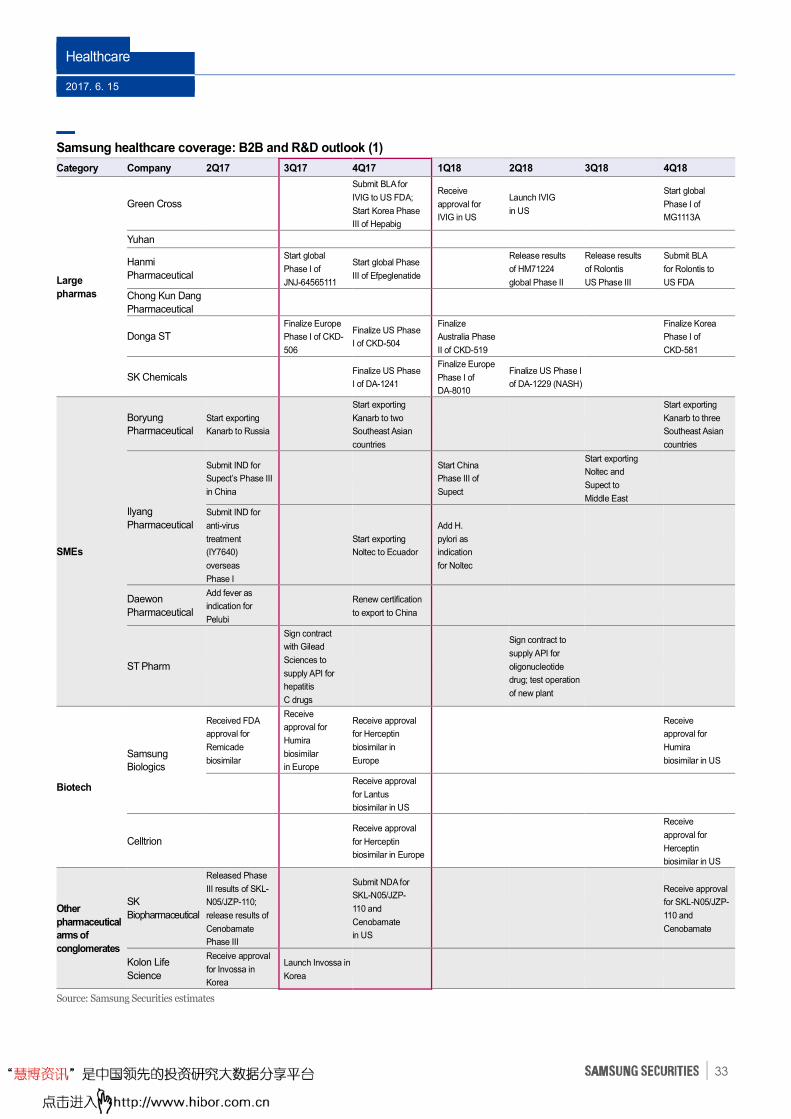
Samsung healthcare coverage: B2B and R&D outlook (1)
Category Company 2Q17 3Q17 4Q17 1Q18 2Q18 3Q18 4Q18
Large
pharmas
Green Cross
Submit BLA for
IVIG to US FDA;
Start Korea Phase
III of Hepabig
Receive
approval for
IVIG in US
Launch IVIG
in US
Start global
Phase I of
MG1113A
Yuhan
Hanmi
Pharmaceutical
Start global
Phase I of
JNJ-64565111
Start global Phase
III of Efpeglenatide
Release results
of HM71224
global Phase II
Release results
of Rolontis
US Phase III
Submit BLA
for Rolontis to
US FDA
Chong Kun Dang
Pharmaceutical
Donga ST
Finalize Europe
Phase I of CKD-
506
Finalize US Phase
I of CKD-504
Finalize
Australia Phase
II of CKD-519
Finalize Korea
Phase I of
CKD-581
SK Chemicals Finalize US Phase
I of DA-1241
Finalize Europe
Phase I of
DA-8010
Finalize US Phase I
of DA-1229 (NASH)
SMEs
Boryung
Pharmaceutical
Start exporting
Kanarb to Russia
Start exporting
Kanarb to two
Southeast Asian
countries
Start exporting
Kanarb to three
Southeast Asian
countries
Ilyang
Pharmaceutical
Submit IND for
Supect’s Phase III
in China
Start China
Phase III of
Supect
Start exporting
Noltec and
Supect to
Middle East
Submit IND for
anti-virus
treatment
(IY7640)
overseas
Phase I
Start exporting
Noltec to Ecuador
Add H.
pylori as
indication
for Noltec
Daewon
Pharmaceutical
Add fever as
indication for
Pelubi
Renew certification
to export to China
ST Pharm
Sign contract
with Gilead
Sciences to
supply API for
hepatitis
C drugs
Sign contract to
supply API for
oligonucleotide
drug; test operation
of new plant
Biotech
Samsung
Biologics
Received FDA
approval for
Remicade
biosimilar
Receive
approval for
Humira
biosimilar
in Europe
Receive approval
for Herceptin
biosimilar in
Europe
Receive
approval for
Humira
biosimilar in US
Receive approval
for Lantus
biosimilar in US
Celltrion
Receive approval
for Herceptin
biosimilar in Europe
Receive
approval for
Herceptin
biosimilar in US
Other
pharmaceutical
arms of
conglomerates
SK
Biopharmaceutical
Released Phase
III results of SKL-
N05/JZP-110;
release results of
Cenobamate
Phase III
Submit NDA for
SKL-N05/JZP-
110 and
Cenobamate
in US
Receive approval
for SKL-N05/JZP-
110 and
Cenobamate
Kolon Life
Science
Receive approval
for Invossa in
Korea
Launch Invossa in
Korea
Source: Samsung Securities estimates
Healthcare
2017. 6. 15
34
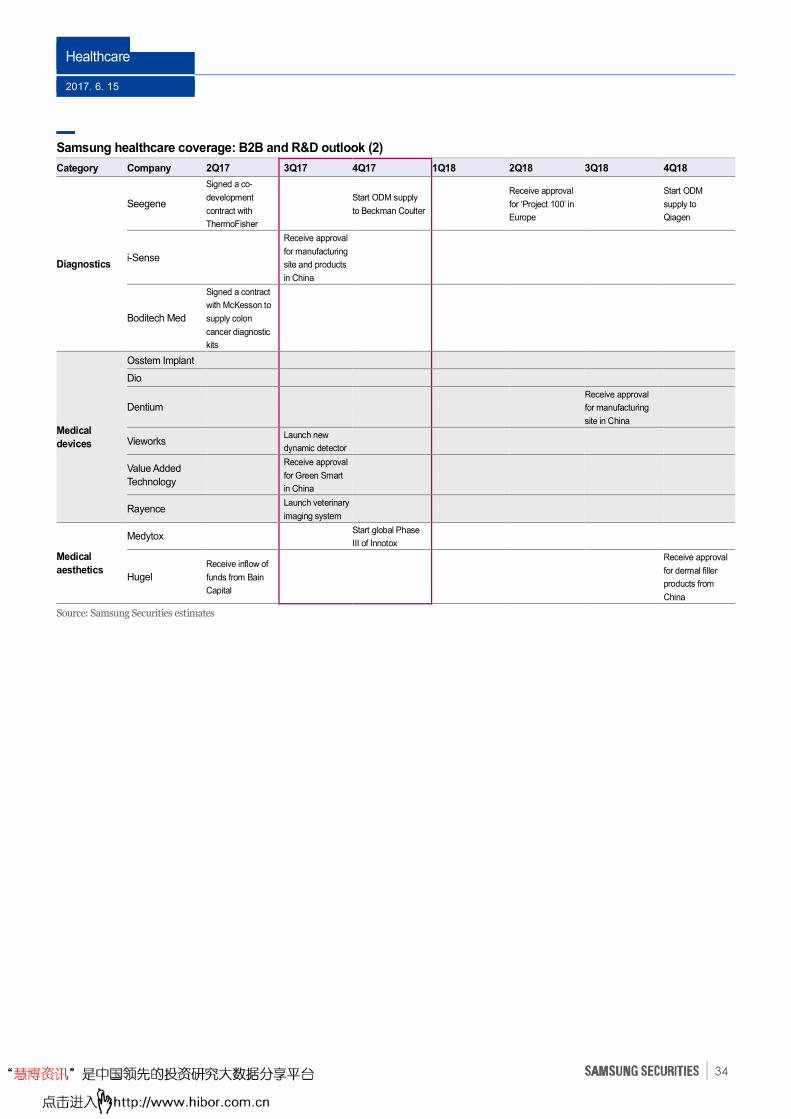
Samsung healthcare coverage: B2B and R&D outlook (2)
Category Company 2Q17 3Q17 4Q17 1Q18 2Q18 3Q18 4Q18
Diagnostics
Seegene
Signed a co-
development
contract with
ThermoFisher
Start ODM supply
to Beckman Coulter
Receive approval
for ‘Project 100’ in
Europe
Start ODM
supply to
Qiagen
i-Sense
Receive approval
for manufacturing
site and products
in China
Boditech Med
Signed a contract
with McKesson to
supply colon
cancer diagnostic
kits
Medical
devices
Osstem Implant
Dio
Dentium
Receive approval
for manufacturing
site in China
Vieworks Launch new
dynamic detector
Value Added
Technology
Receive approval
for Green Smart
in China
Rayence Launch veterinary
imaging system
Medical
aesthetics
Medytox Start global Phase
III of Innotox
Hugel
Receive inflow of
funds from Bain
Capital
Receive approval
for dermal filler
products from
China
Source: Samsung Securities estimates
Healthcare
2017. 6. 15
35
Hanmi Pharmaceutical: Sector leader to make R&D progress
Boasts out-licensing contracts worth KRW6.5t: Hanmi Pharmaceutical has a number of
exceptional out-licensing contracts, including ones worth: 1) USD690m (USD50m upfront;
USD640m in milestones) with Eli Lilly for BTK inhibitor-based autoimmune treatment HM71224; 2)
EUR2.92b (EUR0.2b; EUR2.72b) with Sanofi for long-acting GLP-1 diabetes treatment known as the
Quantum Project; 3) USD915m (USD105m; USD810m) with Johnson & Johnson for long-acting
GLP-1/Oxynotomduline diabetes/obesity treatment HM12525A/JNJ-64565111; 4) USD910m
(USD80m; USD830m) with Genentech for RAF inhibitor-based cancer treatment HM95573; 5)
undisclosed amounts with Spectrum (end-Jan 2012) for long-acting neutropenia treatment Rolonits
TM (LAPS-GCSF, eflapegrastim) and pan-HER cancer treatment poziotinib (Mar 2015); and 6) an
undisclosed amount with Zai Lab in for the marketing rights in China, Hong Kong, and Taiwan for
EGFR inhibitor-based lung cancer treatment HM61713/ZL-2303 (olmutinib; Nov 2015).
Five clinical trials underway
• Spectrum in Sep 2014 started US Phase III trials for Rolonits on 580 cancer patients that
developed neutropenia due to chemotherapy, with completion targeted for Oct 2018. If proven
effective, the once-every-three-week treatment has potential to take over the KRW6t global
neutropenia treatment market from Neulasta’s blockbuster PEG-GCSF, which requires once-a-
week dosing.
• Safety concerns over HM61713 (olmutinib) emerged after Boehringer Ingelheim on Sep 30, 2016
cancelled its out-licensing deal for the drug. That said, Hanmi on Apr 13 of this year obtained
investigational IND approval in Korea to conduct Phase III trials for the drug on EGFR-mutant
lung cancer patients. On Feb 2, 2017, Zai Lab filed for IND approval to perform Phase I trials in
China for ZL-2303 (olmutinib).
• Eli Lilly on Sep 10, 2016 initiated Phase II multinational trials for HM71224 on 182 rheumatoid
arthritis patients. The trials should complete in Jun 2018.
• Spectrum on Mar 8, 2016 began Phase II US trials for poziotinib on 70 breast cancer patients
showing resistance to existing therapies.
• Hanmi on Mar 20, 2017 entered Phase I domestic trials for HM95773 on 100 patients with solid
tumors harboring BRAF, KRAS, or NRAS mutations.
Global clinical trials to resume for LAPScovery biologics: Johnson & Johnson at end-Nov
2016 posted on the US NIH site clinicaltrials.gov that it suspended recruitment of patients for the
Phase I clinical trials for HM12525A/JNJ-64565111. Hanmi at end-Dec 2016 revealed revisions to its
out-licensing contract with Sanofi for three new diabetes treatments known as the Quantum Project.
Specifically, Sanofi will: 1) return the rights to LAPS-Insulin, a once-a-week insulin analog; 2) reduce
milestone payments for efpeglenatide (a once- or twice-monthly GLP-1 analog) and have Hanmi
share development costs (25% of Sanofi’s R&D costs with a cap of EUR150m); and 3) maintain its
contract for LAPS-Insulin Combo—a combination of LAPS-Insulin and efpeglenatide—and retain
rights to acquire the combination drug after development by Hanmi. Having taken back the rights to
LAPS-Insulin and accepting responsibility for delays in clinical sample production, Hanmi agreed to
return EUR196m of its upfront payment of EUR400m, while additional milestones will shrink from
EUR3.5b to EUR2.7b. HM12525A/JNJ-64565111 is a combination of LAPS-GLP-1 and LAPS-
Oxyntomodulin while efpeglenatide is LAPS-Exendin. Both are biologics based on LAPScovery long-
acting platform technology.
Healthcare
2017. 6. 15
36
The suspension of Phase I trials for HM12525A/JNJ-64565111 and revisions to the out-licensing
contract for the Quantum Project have raised doubts over the commercialization prospects of
LAPScovery drugs. Yet, Sanofi during an Apr 28 earnings call said it will begin Phase III clinical trials
for efpeglenatide in 4Q17, following through on remarks made during its 4Q16 earnings call that the
trials would start this year. The company also says efpeglenatide is a top-10 drug (slated for Phase III
trials) in its pipeline. RolontisTM, undergoing Phase III trials in the US, is also a LAPScovery-based
biologic.
Hanmi plans to invest KRW257.3b to complete a second bio plant in Pyeongtaek, with this one
dedicated to making LAPScovery-based biologics for clinical trials, regulatory approval, and
commercial production. Meanwhile, at the JP Morgan Healthcare Conference in January, the
company unveiled an enzyme replacement therapy for rare diseases that employs LAPScovery long-
action solution. The treatment is in preclinical phases, reconfirming LAPScovery’s commercial
potential and scalability. In interviews with local press on Feb 13 and May 10, Hanmi’s CEO said
sample shipments for efpeglenatide and HM12525A/JNJ-64565111 will begin soon, and added that
that Hanmi was working with Sanofi and Johnson & Johnson to test and fine-tune the facilities to
ensure they meet US FDA requirements, which was a reason behind sample production delays. We
believe it is time to focus on prospects of efpeglenatide and HM12525A/JNJ-64565111 resuming
global clinical trials and generating milestone income.
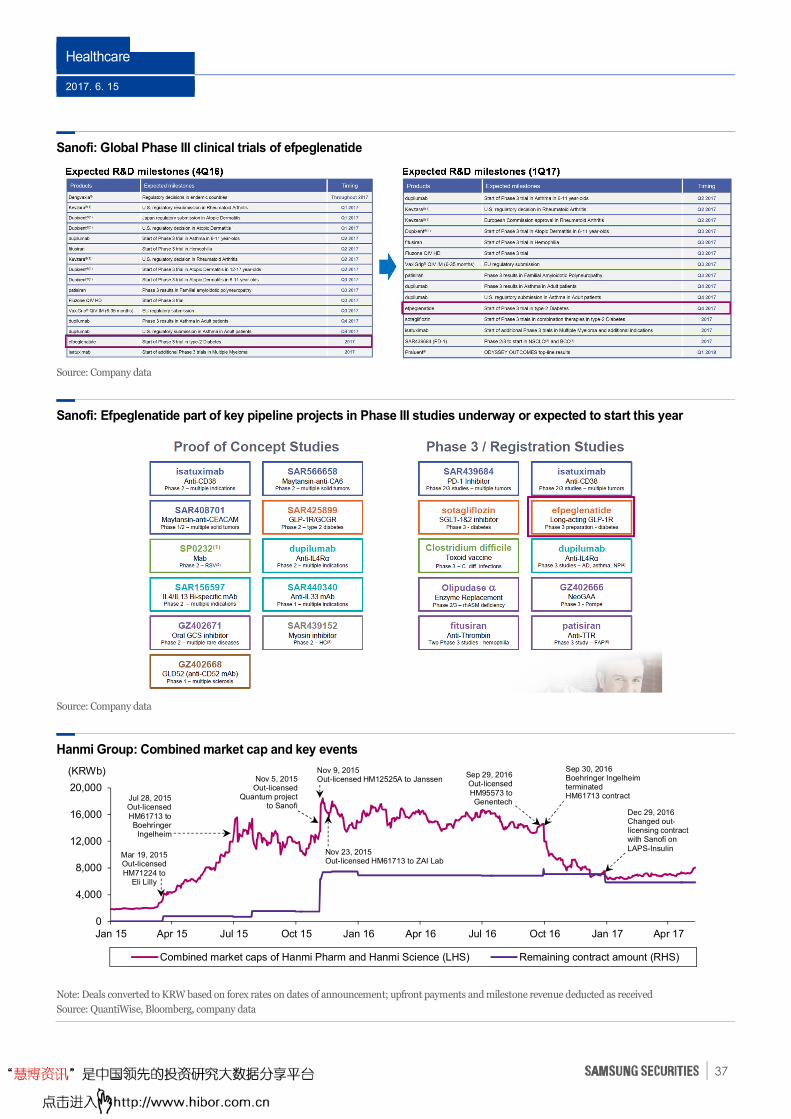
Healthcare
2017. 6. 15
37
Sanofi: Global Phase III clinical trials of efpeglenatide
Source: Company data
Sanofi: Efpeglenatide part of key pipeline projects in Phase III studies underway or expected to start this year
Source: Company data
Hanmi Group: Combined market cap and key events
Note: Deals converted to KRW based on forex rates on dates of announcement; upfront payments and milestone revenue deducted as received
Source: QuantiWise, Bloomberg, company data
0
4,000
8,000
12,000
16,000
20,000
Jan 15 Apr 15 Jul 15 Oct 15 Jan 16 Apr 16 Jul 16 Oct 16 Jan 17 Apr 17
Combined market caps of Hanmi Pharm and Hanmi Science (LHS) Remaining contract amount (RHS)
(KRWb)
Mar 19, 2015Out-licensed HM71224 to
Eli Lilly
Jul 28, 2015Out-licensed HM61713 to Boehringer
Ingelheim
Nov 5, 2015Out-licensed
Quantum project to Sanofi
Nov 9, 2015Out-licensed HM12525A to Janssen
Nov 23, 2015Out-licensed HM61713 to ZAI Lab
Sep 29, 2016Out-licensed HM95573 to Genentech
Sep 30, 2016Boehringer Ingelheim terminated HM61713 contract
Dec 29, 2016Changed out-licensing contract with Sanofi on LAPS-Insulin
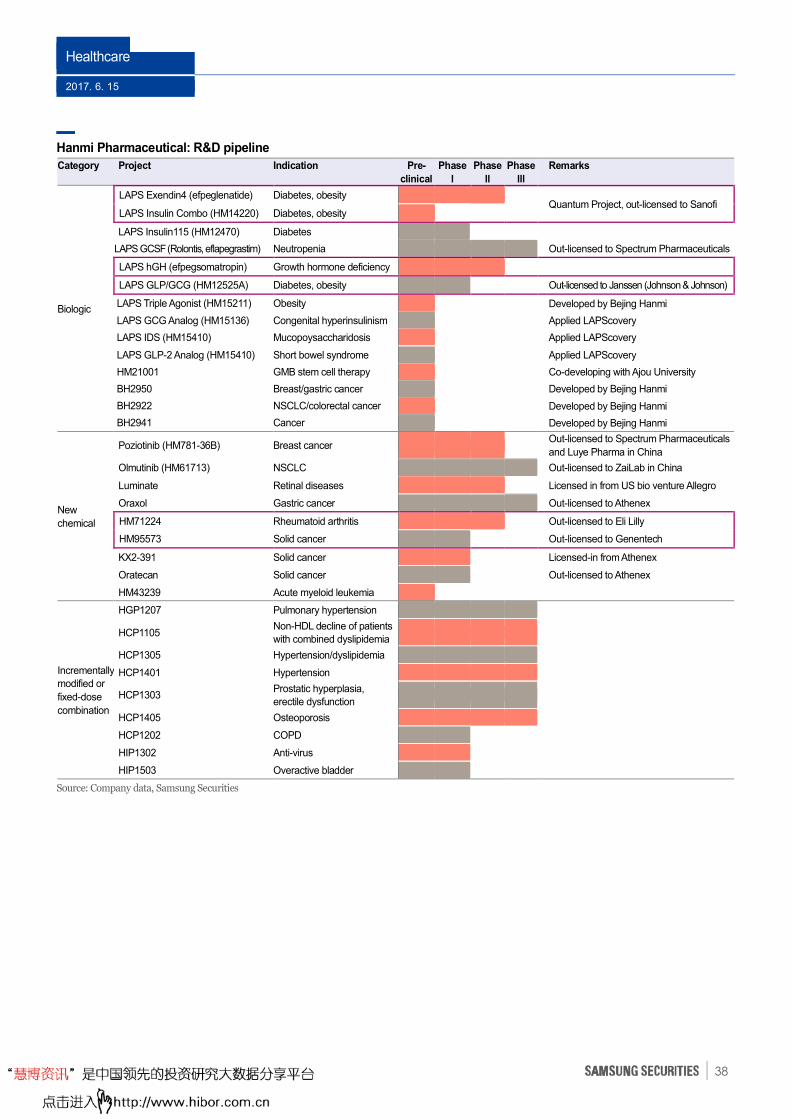
Healthcare
2017. 6. 15
38
Hanmi Pharmaceutical: R&D pipeline
Category
Project
Indication
Pre-
clinical
Phase
l
Phase
ll
Phase
lll
Remarks
Biologic
LAPS Exendin4 (efpeglenatide) Diabetes, obesity Quantum Project, out-licensed to Sanofi
LAPS Insulin Combo (HM14220) Diabetes, obesity
LAPS Insulin115 (HM12470) Diabetes
LAPS GCSF (Rolontis, eflapegrastim) Neutropenia Out-licensed to Spectrum Pharmaceuticals
LAPS hGH (efpegsomatropin) Growth hormone deficiency
LAPS GLP/GCG (HM12525A) Diabetes, obesity Out-licensed to Janssen (Johnson & Johnson)
LAPS Triple Agonist (HM15211) Obesity Developed by Bejing Hanmi
LAPS GCG Analog (HM15136) Congenital hyperinsulinism Applied LAPScovery
LAPS IDS (HM15410) Mucopoysaccharidosis Applied LAPScovery
LAPS GLP-2 Analog (HM15410) Short bowel syndrome Applied LAPScovery
HM21001 GMB stem cell therapy Co-developing with Ajou University
BH2950 Breast/gastric cancer Developed by Bejing Hanmi
BH2922 NSCLC/colorectal cancer Developed by Bejing Hanmi
BH2941 Cancer Developed by Bejing Hanmi
New
chemical
Poziotinib (HM781-36B) Breast cancer Out-licensed to Spectrum Pharmaceuticals
and Luye Pharma in China
Olmutinib (HM61713) NSCLC Out-licensed to ZaiLab in China
Luminate Retinal diseases Licensed in from US bio venture Allegro
Oraxol Gastric cancer Out-licensed to Athenex
HM71224 Rheumatoid arthritis Out-licensed to Eli Lilly
HM95573 Solid cancer Out-licensed to Genentech
KX2-391 Solid cancer Licensed-in from Athenex
Oratecan Solid cancer Out-licensed to Athenex
HM43239 Acute myeloid leukemia
Incrementally
modified or
fixed-dose
combination
HGP1207 Pulmonary hypertension
HCP1105 Non-HDL decline of patients
with combined dyslipidemia
HCP1305 Hypertension/dyslipidemia
HCP1401 Hypertension
HCP1303 Prostatic hyperplasia,
erectile dysfunction
HCP1405 Osteoporosis
HCP1202 COPD
HIP1302 Anti-virus
HIP1503 Overactive bladder
Source: Company data, Samsung Securities
Healthcare
2017. 6. 15
39
Samsung Biologics: Biotech leader to win more CMO contracts, biosimilar approvals
To become world’s largest bio CMO: Samsung Biologics currently operates two plants—with
capacities of 30,000 and 152,000 liters—and is building a third one with a capacity of 180,000 liters.
The #3 plant is 75% complete and should finish in 4Q17, with the validation process to wrap up v in
4Q18. On completion the company will be the world’s largest bio CMO in terms of capacity. The firm
expects to break even on an operating basis in 2017 on y-y sales growth of 50% to KRW441.9b
backed utilization rates of 100% and 40% at its #1 and #2 plants, respectively. In 2016 utilization
rates at those facilities were a respective 100% and 20%.
More CMO deals on the horizon: Samsung Biologics has a CMO order backlog of USD3.2b
(including a KRW47.1b deal signed with a European firm on May 4) and is in talks with more than 15
foreign pharmaceutical players for over 30 CMO contracts. Considering construction of the third
plant should complete this year, the firm is likely to pursue even more CMO contracts.
Boasts four approved biosimilars in developed markets: Subsidiary Samsung Bioepis
obtained approval from the EMA in: 1) Jan 2016 for Benepali, the world’s first Enbrel biosimilar; 2)
May 2016 for Flixabi, the second-ever Remicade biosimilar; and 3) January for Lusduna, the second-
ever Lantus biosimilar. After last week’s approval for Renflexis, the firm now boasts the largest
biosimilar lineup with US FDA and/or EMA approval.
The more biosimilars up for approval: Samsung Bioepis filed for US FDA approval of Lantus
biosimilar Lusduna in Aug 2016, and for EMA approval of a Humira biosimilar in Jul 2016 and a
Herceptin biosimilar in Oct 2016. The subsidiary should file for US approval of the latter two this
year. The company’s lineup of approved biosimilars by end-year should include Benepali, Flixabi,
Lusduna, Humira, and Herceptin in Europe and Renflexis and Lusduna in the US.
Biogen during its 1Q earnings call said that combined European sales of Benepali and Flixabi rose
3,527.8% y-y and 23.9% q-q to USD65.3m. Benepali, available in 16 countries, has been taken by
more than 40,000 patients while Flixabi is sold in seven countries. PR Newswire on May 4 reported
that Benepali captured a 25% market share in Europe.
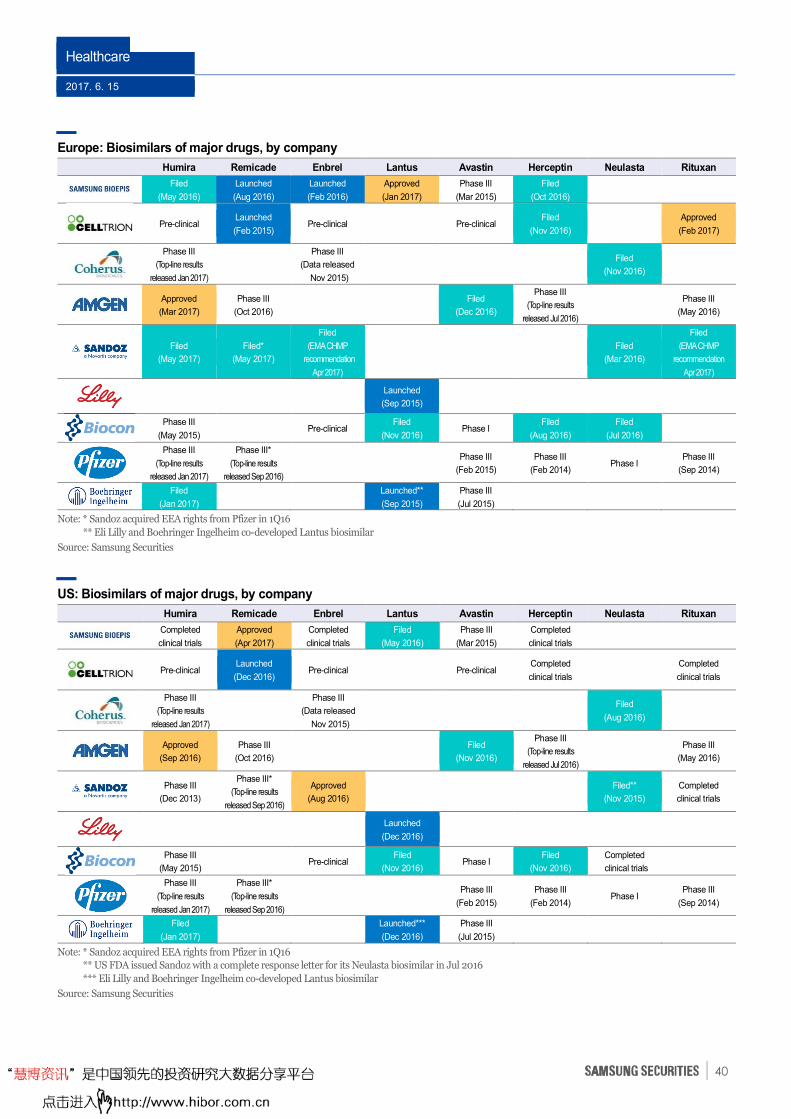
Healthcare
2017. 6. 15
40
Europe: Biosimilars of major drugs, by company
Humira Remicade Enbrel Lantus Avastin Herceptin Neulasta Rituxan
Filed
(May 2016)
Launched
(Aug 2016)
Launched
(Feb 2016)
Approved
(Jan 2017)
Phase III
(Mar 2015)
Filed
(Oct 2016)
Pre-clinical
Launched
(Feb 2015) Pre-clinical Pre-clinical
Filed
(Nov 2016)
Approved
(Feb 2017)
Phase III
(Top-line results
released Jan 2017)
Phase III
(Data released
Nov 2015)
Filed
(Nov 2016)
Approved
(Mar 2017)
Phase III
(Oct 2016)
Filed
(Dec 2016)
Phase III
(Top-line results
released Jul 2016)
Phase III
(May 2016)
Filed
(May 2017)
Filed*
(May 2017)
Filed
(EMA CHMP
recommendation
Apr 2017)
Filed
(Mar 2016)
Filed
(EMA CHMP
recommendation
Apr 2017)
Launched
(Sep 2015)
Phase III
(May 2015) Pre-clinical
Filed
(Nov 2016) Phase I
Filed
(Aug 2016)
Filed
(Jul 2016)
Phase III
(Top-line results
released Jan 2017)
Phase III*
(Top-line results
released Sep 2016)
Phase III
(Feb 2015)
Phase III
(Feb 2014) Phase I
Phase III
(Sep 2014)
Filed
(Jan 2017)
Launched**
(Sep 2015)
Phase III
(Jul 2015)
Note: * Sandoz acquired EEA rights from Pfizer in 1Q16
** Eli Lilly and Boehringer Ingelheim co-developed Lantus biosimilar
Source: Samsung Securities
US: Biosimilars of major drugs, by company
Humira Remicade Enbrel Lantus Avastin Herceptin Neulasta Rituxan
Completed
clinical trials
Approved
(Apr 2017)
Completed
clinical trials
Filed
(May 2016)
Phase III
(Mar 2015)
Completed
clinical trials
Pre-clinical
Launched
(Dec 2016) Pre-clinical Pre-clinical
Completed
clinical trials
Completed
clinical trials
Phase III
(Top-line results
released Jan 2017)
Phase III
(Data released
Nov 2015)
Filed
(Aug 2016)
Approved
(Sep 2016)
Phase III
(Oct 2016)
Filed
(Nov 2016)
Phase III
(Top-line results
released Jul 2016)
Phase III
(May 2016)
Phase III
(Dec 2013)
Phase III*
(Top-line results
released Sep 2016)
Approved
(Aug 2016)
Filed**
(Nov 2015)
Completed
clinical trials
Launched
(Dec 2016)
Phase III
(May 2015) Pre-clinical
Filed
(Nov 2016) Phase I
Filed
(Nov 2016)
Completed
clinical trials
Phase III
(Top-line results
released Jan 2017)
Phase III*
(Top-line results
released Sep 2016)
Phase III
(Feb 2015)
Phase III
(Feb 2014) Phase I
Phase III
(Sep 2014)
Filed
(Jan 2017)
Launched***
(Dec 2016)
Phase III
(Jul 2015)
Note: * Sandoz acquired EEA rights from Pfizer in 1Q16
** US FDA issued Sandoz with a complete response letter for its Neulasta biosimilar in Jul 2016
*** Eli Lilly and Boehringer Ingelheim co-developed Lantus biosimilar
Source: Samsung Securities
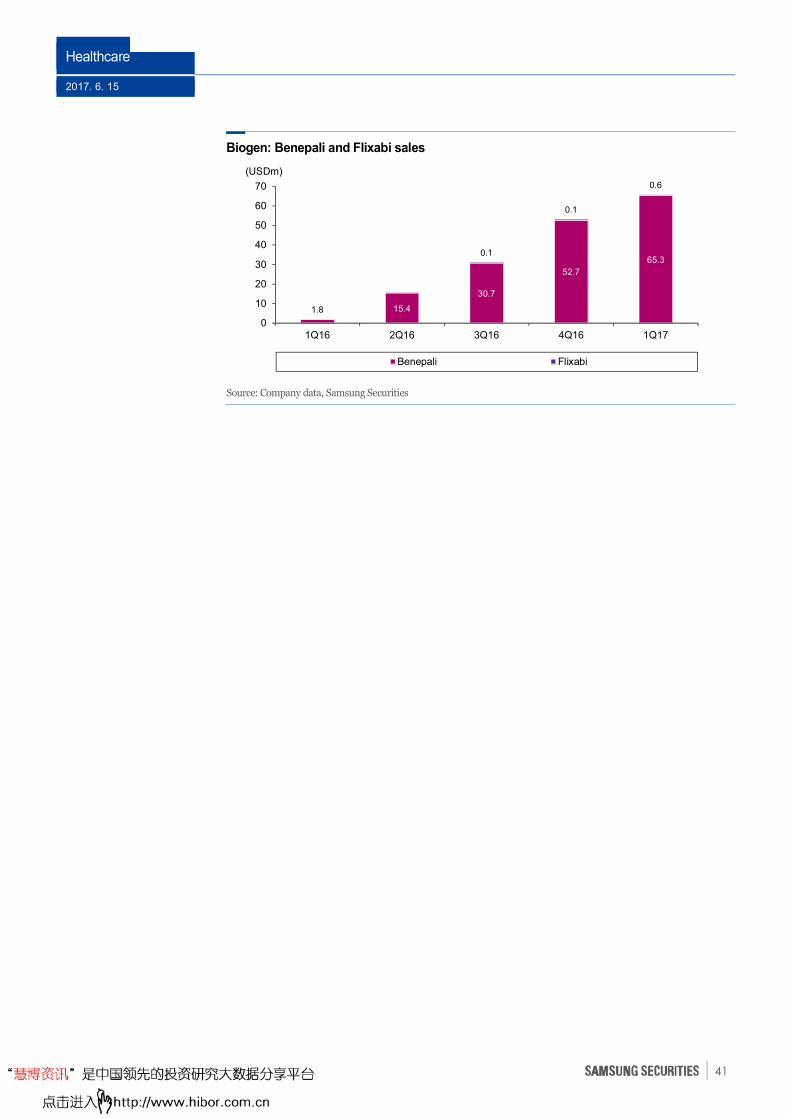
Healthcare
2017. 6. 15
41
Biogen: Benepali and Flixabi sales
Source: Company data, Samsung Securities
1.8 15.4
30.7
52.7
65.3 0.1
0.1
0.6
0
10
20
30
40
50
60
70
1Q16 2Q16 3Q16 4Q16 1Q17
Benepali Flixabi
(USDm)

Healthcare
2017. 6. 15
42
Medytox: Medical aesthetics leader to start Phase III trials for Innotox
Concerns have mounted over a lengthy delay to the start of Phase III trials for Medytox’s Innotox,
which were scheduled to commence in 4Q15. One reason behind the delay was Allergan’s Jan 2016
acquisition of next-generation BTX developer Anterios for an upfront payment of USD90m. Allergan,
during its 2Q16 earnings release, said it planned to submit an IND application to initiate Phase III
clinical trials for Innotox by end-2016, but has shown little progress thus far.
Medytox attributes the delay to an unexpectedly long validation process for its #2 plant in addition to
clinical material production issues. Many market watchers, however, believe Allergan is trying to
curb competition by acquiring and keeping next-generation BTX product candidates—such as
Innotox and Anterios’s topical BTX ANT-1207—in the development stage, noting the US firm’s Botox
controls 76% of the global BTX market. Recent developments at a rival, however, may force a change
in strategy.
Ipsen in 2013 conducted Phase II clinical trials for its liquid BTX—Dysport Next Generation (DNG)—
on 176 glabellar lines patients and Phase III clinical trials on 333 cervical dystonia patients, with both
trials producing positive results (released in Feb 2014) in terms of safety and efficacy. DNG was
superior to a placebo in both studies, comparable to Dysport in the first one, and regarded as a
success by the market in the latter. Yet, the firm delaying an application for DNG to treat cervical
dystonia has investors kept investors skeptical over the product’s commercial value.
Nonetheless, we believe Ipsen plans to commercialize DNG based on: 1) its purchase of Galderma’s
patent for liquid BTX, which began US Phase II clinical trials in 2014; and 2) the results of Phase III
trials for DNG in Europe where its efficacy and safety were respectively proven on trials on 184 and
600 patients that ended in Sep 2015 and Dec 2016. Ipsen on May 11 said it plans to apply for DNG’s
approval in Europe in 2H, implying that the product’s Phase III trials were successful. The firm
forecasts that DNG will be approved by the EMA as a treatment for glabellar lines in 2018 and
cervical dystonia in 2019.
All things considered, we expect Allergan to submit an IND application to initiate Phase III clinical
trials for Innotox in 3Q17. On submission, Medytox should receive related milestones of USD25m
and see its P/E fall from 36x to 27.9x. We estimate Innotox is worth KRW1.056t and will launch
commercially in 2020.
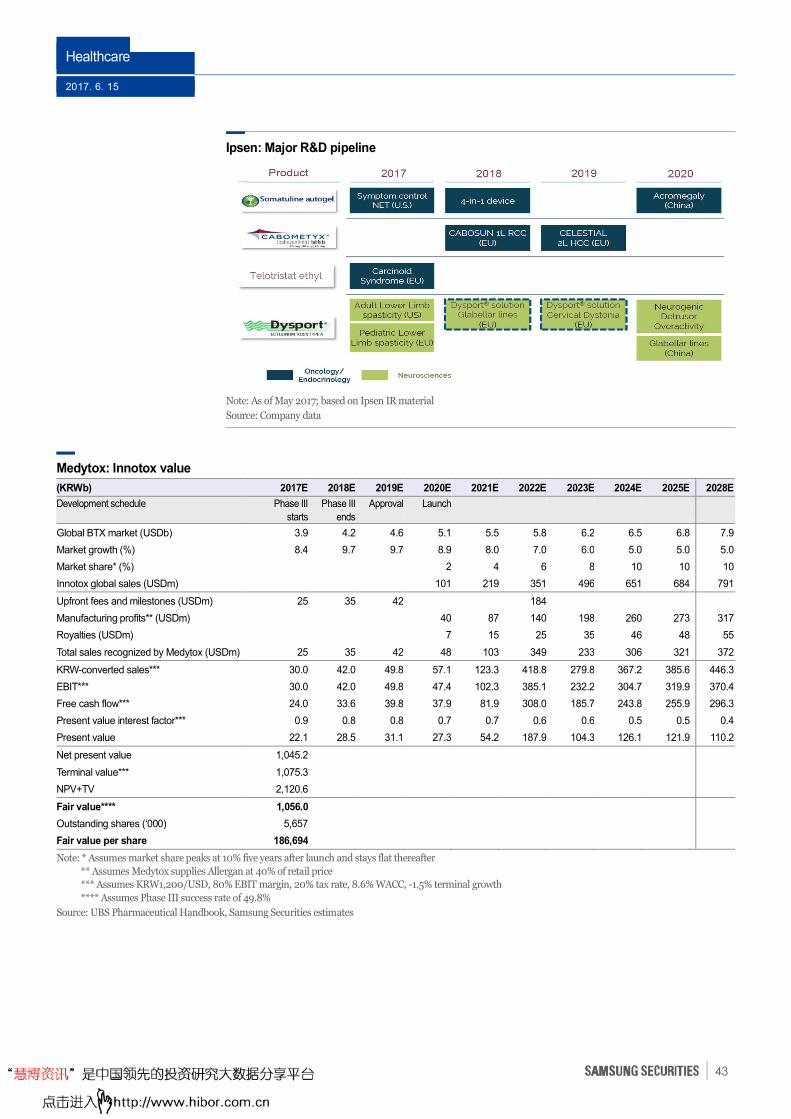
Healthcare
2017. 6. 15
43
Ipsen: Major R&D pipeline
Note: As of May 2017; based on Ipsen IR material
Source: Company data
Medytox: Innotox value
(KRWb) 2017E 2018E 2019E 2020E 2021E 2022E 2023E 2024E 2025E 2028E
Development schedule
Phase III
starts
Phase III
ends
Approval Launch
Global BTX market (USDb) 3.9 4.2 4.6 5.1 5.5 5.8 6.2 6.5 6.8 7.9
Market growth (%) 8.4 9.7 9.7 8.9 8.0 7.0 6.0 5.0 5.0 5.0
Market share* (%) 2 4 6 8 10 10 10
Innotox global sales (USDm) 101 219 351 496 651 684 791
Upfront fees and milestones (USDm) 25 35 42 184
Manufacturing profits** (USDm) 40 87 140 198 260 273 317
Royalties (USDm) 7 15 25 35 46 48 55
Total sales recognized by Medytox (USDm) 25 35 42 48 103 349 233 306 321 372
KRW-converted sales*** 30.0 42.0 49.8 57.1 123.3 418.8 279.8 367.2 385.6 446.3
EBIT*** 30.0 42.0 49.8 47.4 102.3 385.1 232.2 304.7 319.9 370.4
Free cash flow*** 24.0 33.6 39.8 37.9 81.9 308.0 185.7 243.8 255.9 296.3
Present value interest factor*** 0.9 0.8 0.8 0.7 0.7 0.6 0.6 0.5 0.5 0.4
Present value 22.1 28.5 31.1 27.3 54.2 187.9 104.3 126.1 121.9 110.2
Net present value 1,045.2 Terminal value*** 1,075.3 NPV+TV 2,120.6 Fair value**** 1,056.0 Outstanding shares (‘000) 5,657 Fair value per share 186,694 Note: * Assumes market share peaks at 10% five years after launch and stays flat thereafter
** Assumes Medytox supplies Allergan at 40% of retail price
*** Assumes KRW1,200/USD, 80% EBIT margin, 20% tax rate, 8.6% WACC, -1.5% terminal growth
**** Assumes Phase III success rate of 49.8%
Source: UBS Pharmaceutical Handbook, Samsung Securities estimates
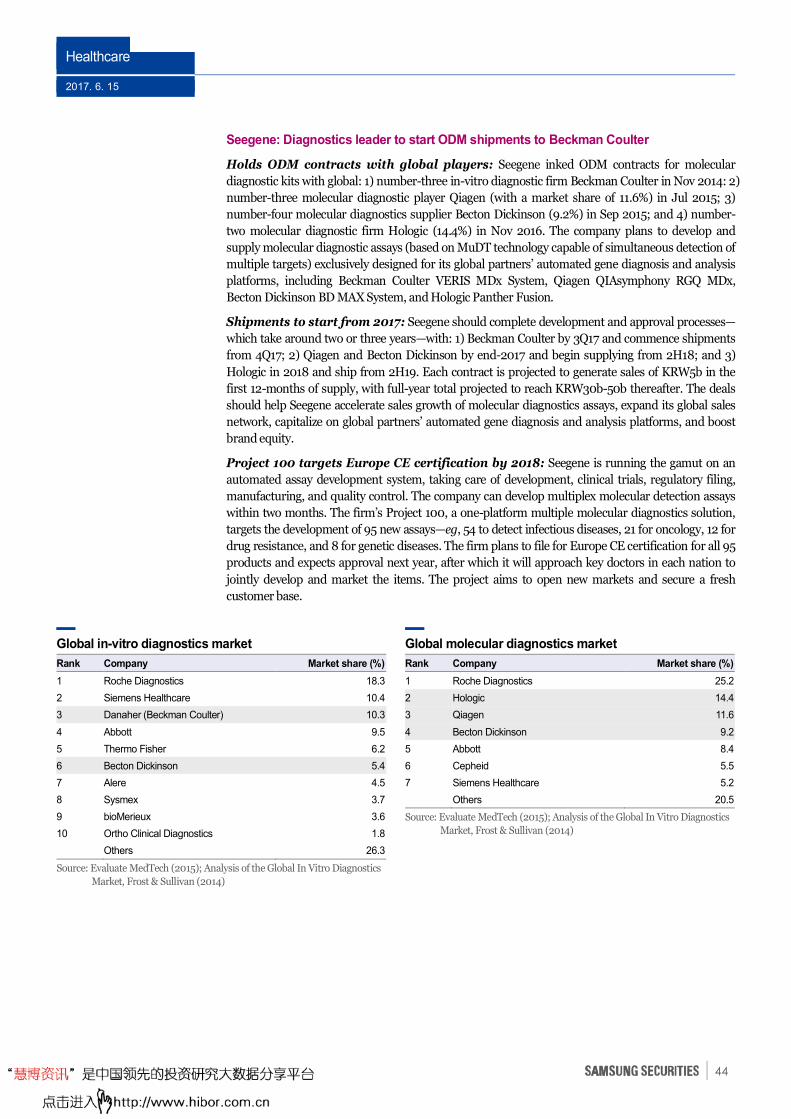
Healthcare
2017. 6. 15
44
Seegene: Diagnostics leader to start ODM shipments to Beckman Coulter
Holds ODM contracts with global players: Seegene inked ODM contracts for molecular
diagnostic kits with global: 1) number-three in-vitro diagnostic firm Beckman Coulter in Nov 2014: 2)
number-three molecular diagnostic player Qiagen (with a market share of 11.6%) in Jul 2015; 3)
number-four molecular diagnostics supplier Becton Dickinson (9.2%) in Sep 2015; and 4) number-
two molecular diagnostic firm Hologic (14.4%) in Nov 2016. The company plans to develop and
supply molecular diagnostic assays (based on MuDT technology capable of simultaneous detection of
multiple targets) exclusively designed for its global partners’ automated gene diagnosis and analysis
platforms, including Beckman Coulter VERIS MDx System, Qiagen QIAsymphony RGQ MDx,
Becton Dickinson BD MAX System, and Hologic Panther Fusion.
Shipments to start from 2017: Seegene should complete development and approval processes—
which take around two or three years—with: 1) Beckman Coulter by 3Q17 and commence shipments
from 4Q17; 2) Qiagen and Becton Dickinson by end-2017 and begin supplying from 2H18; and 3)
Hologic in 2018 and ship from 2H19. Each contract is projected to generate sales of KRW5b in the
first 12-months of supply, with full-year total projected to reach KRW30b-50b thereafter. The deals
should help Seegene accelerate sales growth of molecular diagnostics assays, expand its global sales
network, capitalize on global partners’ automated gene diagnosis and analysis platforms, and boost
brand equity.
Project 100 targets Europe CE certification by 2018: Seegene is running the gamut on an
automated assay development system, taking care of development, clinical trials, regulatory filing,
manufacturing, and quality control. The company can develop multiplex molecular detection assays
within two months. The firm’s Project 100, a one-platform multiple molecular diagnostics solution,
targets the development of 95 new assays—eg, 54 to detect infectious diseases, 21 for oncology, 12 for
drug resistance, and 8 for genetic diseases. The firm plans to file for Europe CE certification for all 95
products and expects approval next year, after which it will approach key doctors in each nation to
jointly develop and market the items. The project aims to open new markets and secure a fresh
customer base.
Global in-vitro diagnostics market
Rank Company Market share (%) 1 Roche Diagnostics 18.3
2 Siemens Healthcare 10.4
3 Danaher (Beckman Coulter) 10.3
4 Abbott 9.5
5 Thermo Fisher 6.2
6 Becton Dickinson 5.4
7 Alere 4.5
8 Sysmex 3.7
9 bioMerieux 3.6
10 Ortho Clinical Diagnostics 1.8
Others 26.3
Source: Evaluate MedTech (2015); Analysis of the Global In Vitro Diagnostics
Market, Frost & Sullivan (2014)
Global molecular diagnostics market
Rank Company Market share (%)
1 Roche Diagnostics 25.2
2 Hologic 14.4
3 Qiagen 11.6
4 Becton Dickinson 9.2
5 Abbott 8.4
6 Cepheid 5.5
7 Siemens Healthcare 5.2
Others 20.5
Source: Evaluate MedTech (2015); Analysis of the Global In Vitro Diagnostics
Market, Frost & Sullivan (2014)
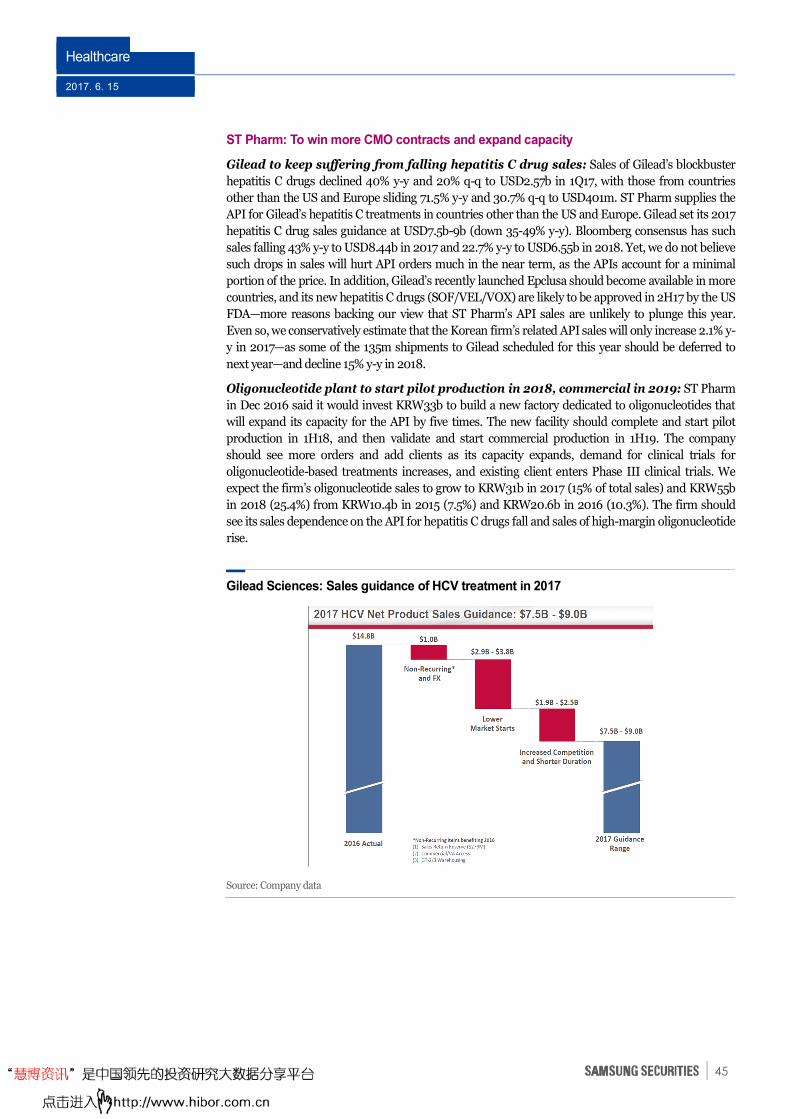
Healthcare
2017. 6. 15
45
ST Pharm: To win more CMO contracts and expand capacity
Gilead to keep suffering from falling hepatitis C drug sales: Sales of Gilead’s blockbuster
hepatitis C drugs declined 40% y-y and 20% q-q to USD2.57b in 1Q17, with those from countries
other than the US and Europe sliding 71.5% y-y and 30.7% q-q to USD401m. ST Pharm supplies the
API for Gilead’s hepatitis C treatments in countries other than the US and Europe. Gilead set its 2017
hepatitis C drug sales guidance at USD7.5b-9b (down 35-49% y-y). Bloomberg consensus has such
sales falling 43% y-y to USD8.44b in 2017 and 22.7% y-y to USD6.55b in 2018. Yet, we do not believe
such drops in sales will hurt API orders much in the near term, as the APIs account for a minimal
portion of the price. In addition, Gilead’s recently launched Epclusa should become available in more
countries, and its new hepatitis C drugs (SOF/VEL/VOX) are likely to be approved in 2H17 by the US
FDA—more reasons backing our view that ST Pharm’s API sales are unlikely to plunge this year.
Even so, we conservatively estimate that the Korean firm’s related API sales will only increase 2.1% y-
y in 2017—as some of the 135m shipments to Gilead scheduled for this year should be deferred to
next year—and decline 15% y-y in 2018.
Oligonucleotide plant to start pilot production in 2018, commercial in 2019: ST Pharm
in Dec 2016 said it would invest KRW33b to build a new factory dedicated to oligonucleotides that
will expand its capacity for the API by five times. The new facility should complete and start pilot
production in 1H18, and then validate and start commercial production in 1H19. The company
should see more orders and add clients as its capacity expands, demand for clinical trials for
oligonucleotide-based treatments increases, and existing client enters Phase III clinical trials. We
expect the firm’s oligonucleotide sales to grow to KRW31b in 2017 (15% of total sales) and KRW55b
in 2018 (25.4%) from KRW10.4b in 2015 (7.5%) and KRW20.6b in 2016 (10.3%). The firm should
see its sales dependence on the API for hepatitis C drugs fall and sales of high-margin oligonucleotide
rise.
Gilead Sciences: Sales guidance of HCV treatment in 2017
Source: Company data
Healthcare
2017. 6. 15
46
SK Biopharmaceuticals: Chaebol arm finding R&D success
Plans to build new drug candidate into a business: SK Biopharmaceuticals is dedicated to
developing drugs to treat central nervous system (CNS) disorders. The company envisions: 1)
discovering new drug candidates that address unmet medical needs; 2) carrying out global clinical
development through its organization in the US; and 3) selling its products directly, unlike most of its
domestic peers that opt for out-licensing contracts. The new drugs, if successful, should boost both
the firm’s top and bottom lines. SK Bio aims to become the world leader in epilepsy treatments by
2020 and a global top-50 pharmaceutical player by 2025.
To file for FDA approval of Cenobamate in 2017: Epilepsy is a result of excessive and
abnormal nerve cell activity in the brain cortex. Datamonitor predicts that the seven major epilepsy
treatment markets (US, France, Germany, Italy, Spain, UK, Japan) will see a 2.3% CAGR from
USD4.5b in 2013 to USD5.5b in 2022. Among epilepsy patients, approximately 59% experience
partial seizures, 27% generalized seizures, and 14% status epilepticus. Up to 30-40% of patients are
unresponsive to treatment consisting of a combination of two or three drugs—eg, it is an unmet
medical need. UCB/Daiichi Sankyo’s Vimpat (lacosamide) is currently leading the epilepsy treatment
market, and its sales in the seven major markets are projected to grow from USD829m in 2016 to
USD13.9m in 2021 before shrinking to USD493m in 2022 (on patent expiry in 2021). Clinical tests
over 2007-2010 demonstrated that Vimpat reduces seizure frequency by 19%pts and improves the
percentage of seizure-free patients by 2%pts, both figures vs those of a placebo. Cenobamate bettered
the performance of a placebo by a respective 34%pts and 19%pts in Phase IIa clinical trials (6-week
duration) and 31%pts and 10%pts in Phase IIb clinical trials (12-week duration). In other words,
Cenobamate has potential to be a best-in-class drug. The drug in 1Q16 started Phase III trials in 19
countries (including in the US) as an adjunctive therapy for 1,100 epilepsy patients with partial
seizures. The FDA only requires safety data from the Phase III study, saying Cenobamate proved its
effectiveness in the Phase II study. As an open-label study (in which participants know which
treatment is being administered) aimed at verifying the drug’s long-term safety, it has greater
probability of success than do regular Phase III studies. SK Bio plans to hold a pre-NDA meeting with
the FDA in 2Q and file for approval for use as an adjunctive therapy in 4Q. If commercialized,
Cenobamate would have a dosage of 200mg once a day. In the longer term, the company plans to
expand indications of the epilepsy drug to include sole therapy for partial seizures, generalized
seizures, and rare seizures. Given its clinical superiority, Cenobamate is likely to be priced higher
than Vimpat is. The firm intends to establish a dedicated marketing organization, recruit talent, and
decide whether to sell directly or through partners boasting established distribution networks.
Cenobamate worth an estimated KRW1.569t: Our estimate of Cenobamate’s value assumes
a won/dollar rate of KRW1,200, an EBIT margin of 50%, a tax rate of 22.5%, a WACC of 10%,
earnings persistence coefficient of 90%, probability of success of 87.9%, a 2018 approval, and 2019
launch. The company hopes the drug will generate annual sales of KRW1t and operating profit of
more than KRW500b. Considering Cenobamate outperformed leading epilepsy drug Vimpat in
clinical trials, we value the drug at KRW1.57t and expect its sales and operating profit to reach a
respective KRW1.08t and KRW540b in 2026.
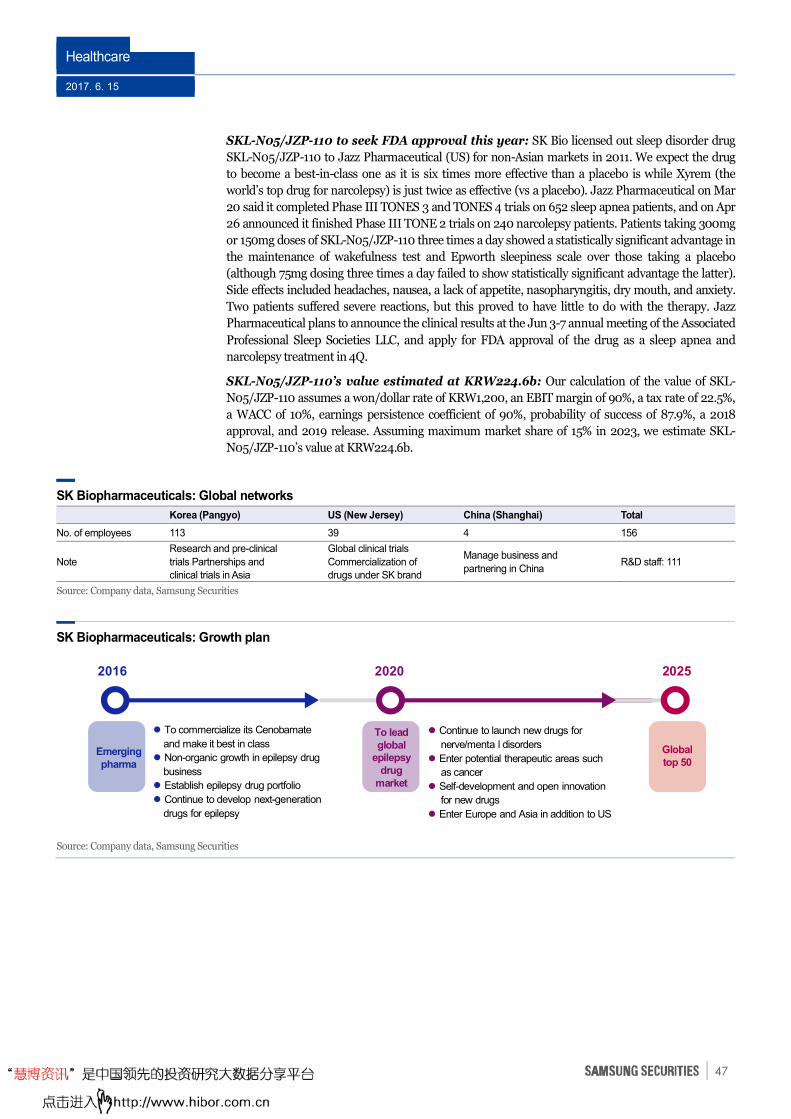
Healthcare
2017. 6. 15
47
SKL-N05/JZP-110 to seek FDA approval this year: SK Bio licensed out sleep disorder drug
SKL-N05/JZP-110 to Jazz Pharmaceutical (US) for non-Asian markets in 2011. We expect the drug
to become a best-in-class one as it is six times more effective than a placebo is while Xyrem (the
world’s top drug for narcolepsy) is just twice as effective (vs a placebo). Jazz Pharmaceutical on Mar
20 said it completed Phase III TONES 3 and TONES 4 trials on 652 sleep apnea patients, and on Apr
26 announced it finished Phase III TONE 2 trials on 240 narcolepsy patients. Patients taking 300mg
or 150mg doses of SKL-N05/JZP-110 three times a day showed a statistically significant advantage in
the maintenance of wakefulness test and Epworth sleepiness scale over those taking a placebo
(although 75mg dosing three times a day failed to show statistically significant advantage the latter).
Side effects included headaches, nausea, a lack of appetite, nasopharyngitis, dry mouth, and anxiety.
Two patients suffered severe reactions, but this proved to have little to do with the therapy. Jazz
Pharmaceutical plans to announce the clinical results at the Jun 3-7 annual meeting of the Associated
Professional Sleep Societies LLC, and apply for FDA approval of the drug as a sleep apnea and
narcolepsy treatment in 4Q.
SKL-N05/JZP-110’s value estimated at KRW224.6b: Our calculation of the value of SKL-
N05/JZP-110 assumes a won/dollar rate of KRW1,200, an EBIT margin of 90%, a tax rate of 22.5%,
a WACC of 10%, earnings persistence coefficient of 90%, probability of success of 87.9%, a 2018
approval, and 2019 release. Assuming maximum market share of 15% in 2023, we estimate SKL-
N05/JZP-110’s value at KRW224.6b.
SK Biopharmaceuticals: Global networks
Korea (Pangyo) US (New Jersey) China (Shanghai) Total
No. of employees 113 39 4 156
Note
Research and pre-clinical
trials Partnerships and
clinical trials in Asia
Global clinical trials
Commercialization of
drugs under SK brand
Manage business and
partnering in China R&D staff: 111
Source: Company data, Samsung Securities
SK Biopharmaceuticals: Growth plan
Source: Company data, Samsung Securities
202520202016
Emerging
pharma
� Continue to launch new drugs for
nerve/menta l disorders
� Enter potential therapeutic areas such
as cancer
� Self-development and open innovation
for new drugs
� Enter Europe and Asia in addition to US
Global
top 50
� To commercialize its Cenobamate
and make it best in class
� Non-organic growth in epilepsy drug
business
� Establish epilepsy drug portfolio
� Continue to develop next-generation
drugs for epilepsy
To lead
global
epilepsy
drug
market
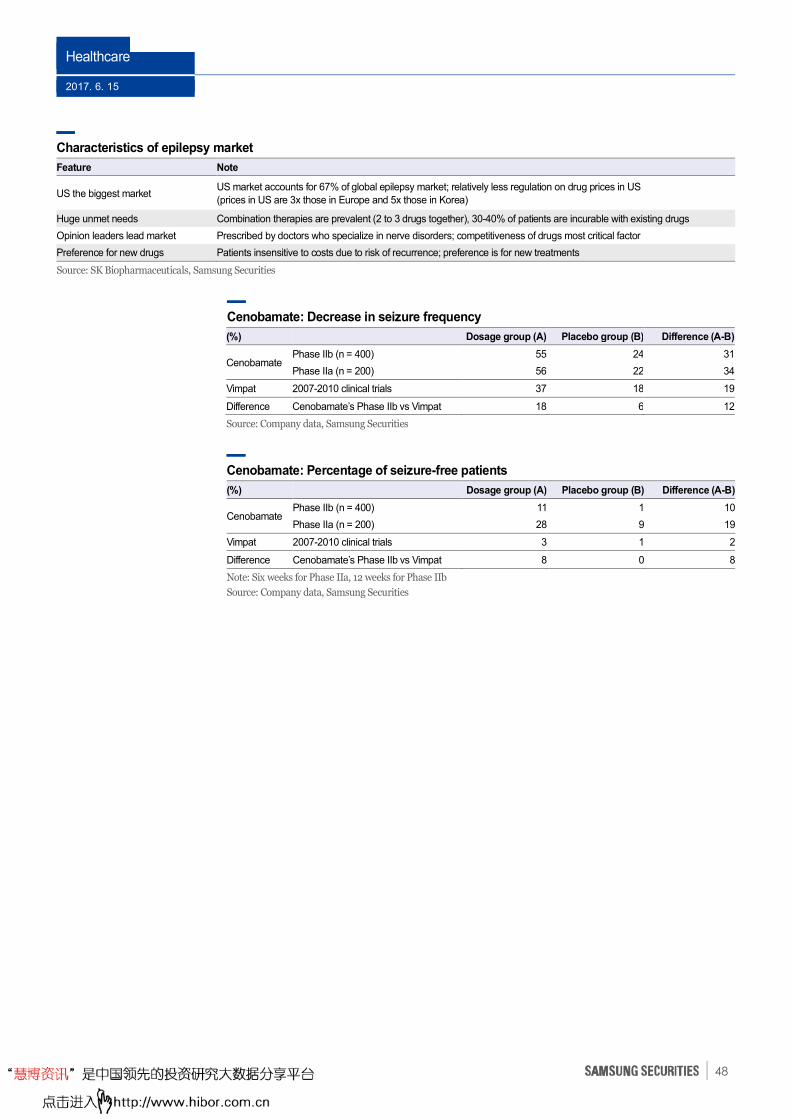
Healthcare
2017. 6. 15
48
Characteristics of epilepsy market
Feature Note
US the biggest market US market accounts for 67% of global epilepsy market; relatively less regulation on drug prices in US
(prices in US are 3x those in Europe and 5x those in Korea)
Huge unmet needs Combination therapies are prevalent (2 to 3 drugs together), 30-40% of patients are incurable with existing drugs
Opinion leaders lead market Prescribed by doctors who specialize in nerve disorders; competitiveness of drugs most critical factor
Preference for new drugs Patients insensitive to costs due to risk of recurrence; preference is for new treatments
Source: SK Biopharmaceuticals, Samsung Securities
Cenobamate: Decrease in seizure frequency
(%) Dosage group (A) Placebo group (B) Difference (A-B)
Cenobamate Phase IIb (n = 400) 55 24 31
Phase IIa (n = 200) 56 22 34
Vimpat 2007-2010 clinical trials 37 18 19
Difference Cenobamate’s Phase IIb vs Vimpat 18 6 12
Source: Company data, Samsung Securities
Cenobamate: Percentage of seizure-free patients
(%) Dosage group (A) Placebo group (B) Difference (A-B)
Cenobamate Phase IIb (n = 400) 11 1 10
Phase IIa (n = 200) 28 9 19
Vimpat 2007-2010 clinical trials 3 1 2
Difference Cenobamate’s Phase IIb vs Vimpat 8 0 8
Note: Six weeks for Phase IIa, 12 weeks for Phase IIb
Source: Company data, Samsung Securities
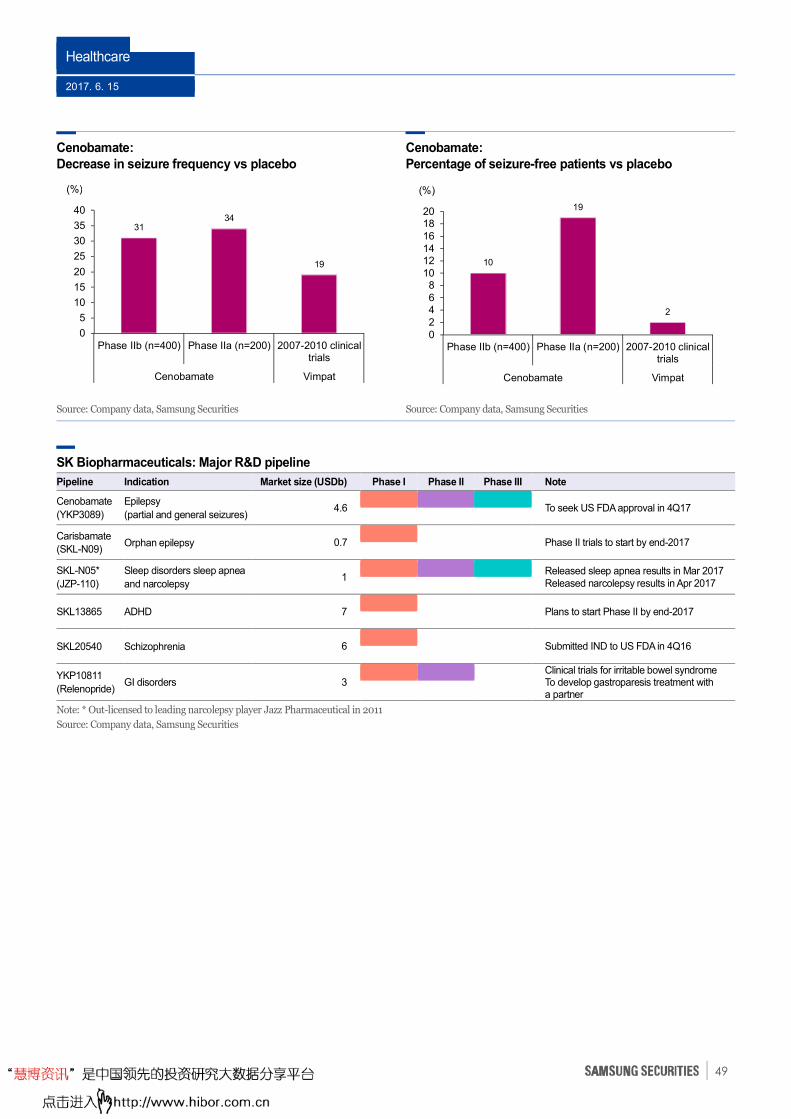
Healthcare
2017. 6. 15
49
Cenobamate:
Decrease in seizure frequency vs placebo
Cenobamate:
Percentage of seizure-free patients vs placebo
Source: Company data, Samsung Securities Source: Company data, Samsung Securities
SK Biopharmaceuticals: Major R&D pipeline
Pipeline Indication Market size (USDb) Phase I Phase II Phase III Note
Cenobamate
(YKP3089)
Epilepsy
(partial and general seizures) 4.6
To seek US FDA approval in 4Q17
Carisbamate
(SKL-N09) Orphan epilepsy 0.7
Phase II trials to start by end-2017
SKL-N05*
(JZP-110)
Sleep disorders sleep apnea
and narcolepsy 1
Released sleep apnea results in Mar 2017 Released narcolepsy results in Apr 2017
SKL13865 ADHD 7
Plans to start Phase II by end-2017
SKL20540 Schizophrenia 6
Submitted IND to US FDA in 4Q16 YKP10811
(Relenopride) GI disorders 3
Clinical trials for irritable bowel syndrome To develop gastroparesis treatment with a partner
Note: * Out-licensed to leading narcolepsy player Jazz Pharmaceutical in 2011
Source: Company data, Samsung Securities
10
19
2
02468
101214161820
Phase IIb (n=400) Phase IIa (n=200) 2007-2010 clinicaltrials
Cenobamate Vimpat
(%)
3134
19
0
5
10
15
20
25
30
35
40
Phase IIb (n=400) Phase IIa (n=200) 2007-2010 clinicaltrials
Cenobamate Vimpat
(%)
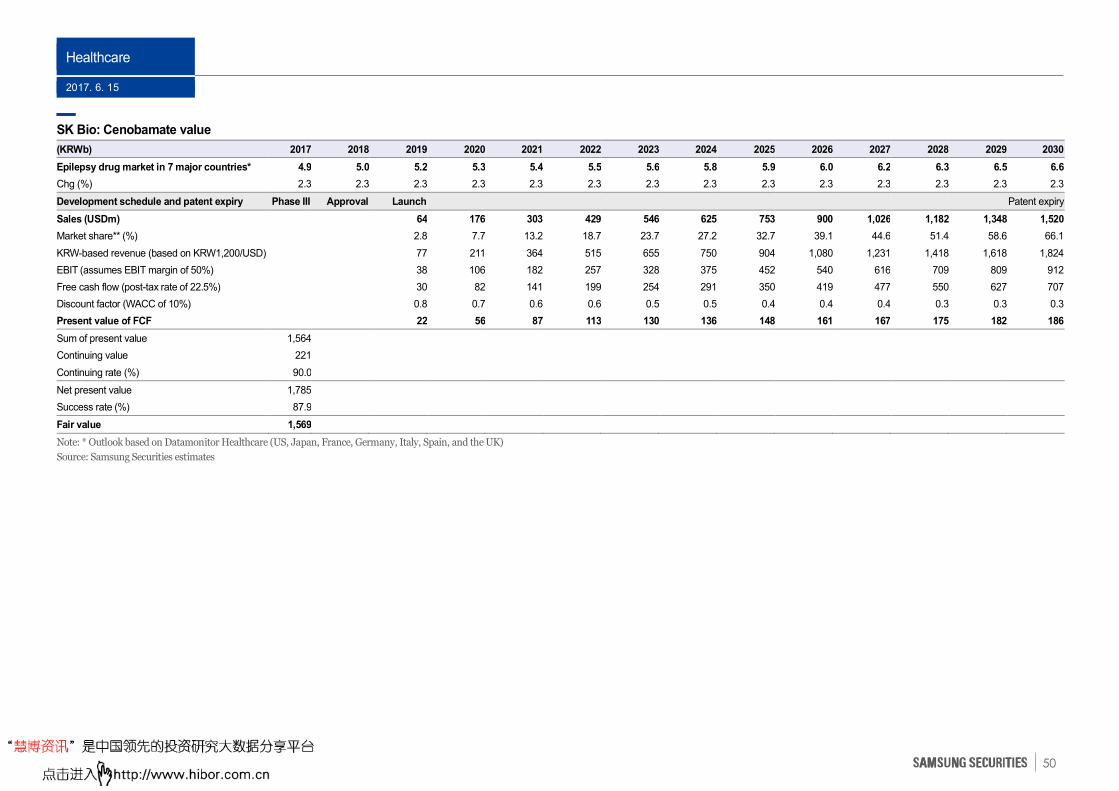
Healthcare
2017. 6. 15
50
SK Bio: Cenobamate value
(KRWb) 2017 2018 2019 2020 2021 2022 2023 2024 2025 2026 2027 2028 2029 2030
Epilepsy drug market in 7 major countries* 4.9 5.0 5.2 5.3 5.4 5.5 5.6 5.8 5.9 6.0 6.2 6.3 6.5 6.6
Chg (%) 2.3 2.3 2.3 2.3 2.3 2.3 2.3 2.3 2.3 2.3 2.3 2.3 2.3 2.3
Development schedule and patent expiry Phase III Approval Launch Patent expiry
Sales (USDm) 64 176 303 429 546 625 753 900 1,026 1,182 1,348 1,520
Market share** (%) 2.8 7.7 13.2 18.7 23.7 27.2 32.7 39.1 44.6 51.4 58.6 66.1
KRW-based revenue (based on KRW1,200/USD) 77 211 364 515 655 750 904 1,080 1,231 1,418 1,618 1,824
EBIT (assumes EBIT margin of 50%) 38 106 182 257 328 375 452 540 616 709 809 912
Free cash flow (post-tax rate of 22.5%) 30 82 141 199 254 291 350 419 477 550 627 707
Discount factor (WACC of 10%) 0.8 0.7 0.6 0.6 0.5 0.5 0.4 0.4 0.4 0.3 0.3 0.3
Present value of FCF 22 56 87 113 130 136 148 161 167 175 182 186
Sum of present value 1,564 Continuing value 221 Continuing rate (%) 90.0 Net present value 1,785 Success rate (%) 87.9 Fair value 1,569 Note: * Outlook based on Datamonitor Healthcare (US, Japan, France, Germany, Italy, Spain, and the UK)
Source: Samsung Securities estimates
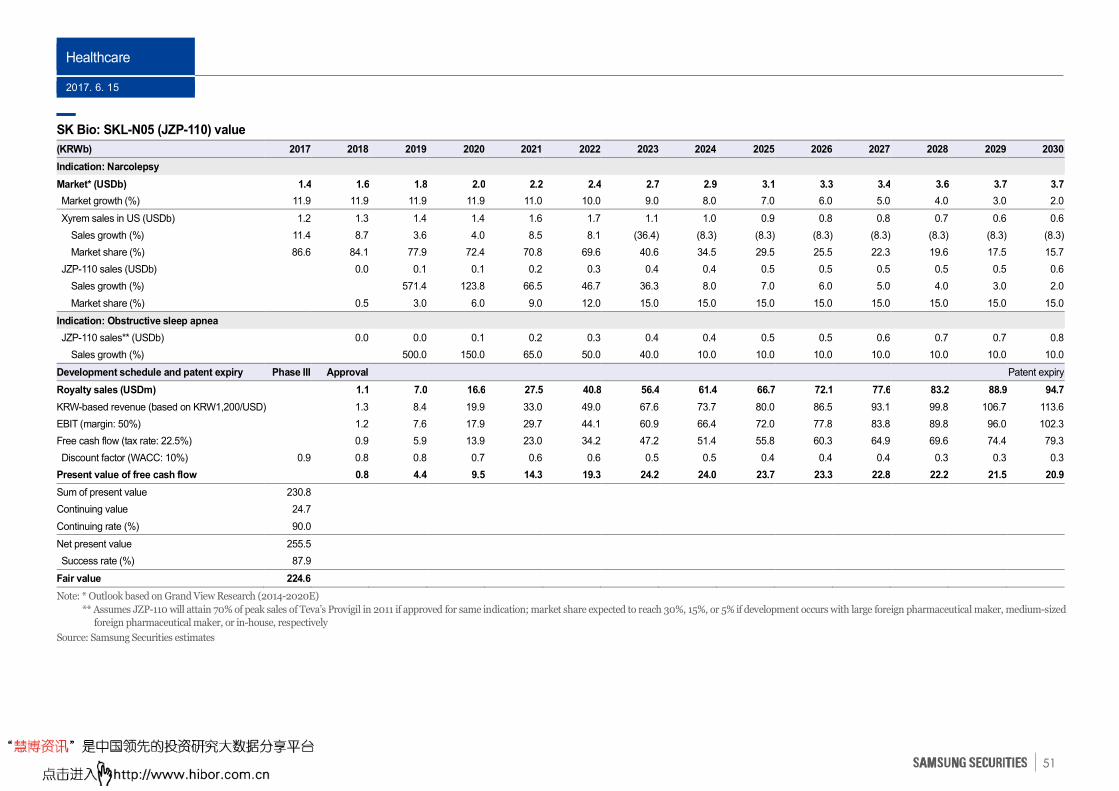
Healthcare
2017. 6. 15
51
SK Bio: SKL-N05 (JZP-110) value
(KRWb) 2017 2018 2019 2020 2021 2022 2023 2024 2025 2026 2027 2028 2029 2030
Indication: Narcolepsy
Market* (USDb) 1.4 1.6 1.8 2.0 2.2 2.4 2.7 2.9 3.1 3.3 3.4 3.6 3.7 3.7
Market growth (%) 11.9 11.9 11.9 11.9 11.0 10.0 9.0 8.0 7.0 6.0 5.0 4.0 3.0 2.0
Xyrem sales in US (USDb) 1.2 1.3 1.4 1.4 1.6 1.7 1.1 1.0 0.9 0.8 0.8 0.7 0.6 0.6
Sales growth (%) 11.4 8.7 3.6 4.0 8.5 8.1 (36.4) (8.3) (8.3) (8.3) (8.3) (8.3) (8.3) (8.3)
Market share (%) 86.6 84.1 77.9 72.4 70.8 69.6 40.6 34.5 29.5 25.5 22.3 19.6 17.5 15.7
JZP-110 sales (USDb) 0.0 0.1 0.1 0.2 0.3 0.4 0.4 0.5 0.5 0.5 0.5 0.5 0.6
Sales growth (%) 571.4 123.8 66.5 46.7 36.3 8.0 7.0 6.0 5.0 4.0 3.0 2.0
Market share (%) 0.5 3.0 6.0 9.0 12.0 15.0 15.0 15.0 15.0 15.0 15.0 15.0 15.0
Indication: Obstructive sleep apnea
JZP-110 sales** (USDb) 0.0 0.0 0.1 0.2 0.3 0.4 0.4 0.5 0.5 0.6 0.7 0.7 0.8
Sales growth (%) 500.0 150.0 65.0 50.0 40.0 10.0 10.0 10.0 10.0 10.0 10.0 10.0
Development schedule and patent expiry Phase III Approval Patent expiry
Royalty sales (USDm) 1.1 7.0 16.6 27.5 40.8 56.4 61.4 66.7 72.1 77.6 83.2 88.9 94.7
KRW-based revenue (based on KRW1,200/USD) 1.3 8.4 19.9 33.0 49.0 67.6 73.7 80.0 86.5 93.1 99.8 106.7 113.6
EBIT (margin: 50%) 1.2 7.6 17.9 29.7 44.1 60.9 66.4 72.0 77.8 83.8 89.8 96.0 102.3
Free cash flow (tax rate: 22.5%) 0.9 5.9 13.9 23.0 34.2 47.2 51.4 55.8 60.3 64.9 69.6 74.4 79.3
Discount factor (WACC: 10%) 0.9 0.8 0.8 0.7 0.6 0.6 0.5 0.5 0.4 0.4 0.4 0.3 0.3 0.3
Present value of free cash flow 0.8 4.4 9.5 14.3 19.3 24.2 24.0 23.7 23.3 22.8 22.2 21.5 20.9
Sum of present value 230.8
Continuing value 24.7
Continuing rate (%) 90.0
Net present value 255.5
Success rate (%) 87.9
Fair value 224.6
Note: * Outlook based on Grand View Research (2014-2020E)
** Assumes JZP-110 will attain 70% of peak sales of Teva’s Provigil in 2011 if approved for same indication; market share expected to reach 30%, 15%, or 5% if development occurs with large foreign pharmaceutical maker, medium-sized
foreign pharmaceutical maker, or in-house, respectively
Source: Samsung Securities estimates
Healthcare
2017. 6. 15
52
Government policy warrants attention
Recommend selective approach on those positioned well to benefit
Government to promote pharma/biotech/medical device industries: Korea’s new
government, striving to bring the nation out of low growth, presented a policy to nurture industries
that create high added value. The policy centers on supporting innovative technology-driven
industries such as ones in areas such as biotech nano and life sciences. The administration said it will:
1) set up a biotech control tower manned by industry specialists under the Ministry of Health &
Welfare; 2) produce reasonable guidelines (in line with international ones) to promote the
pharma/biotech/medical-device industries; and 3) increase policy predictability via presenting a
medium- to long-term plan. Moreover, the government also plans to: 1) improve the pricing system
for insured drugs to help boost global penetration of drugs developed by Korean firms; 2) create a
new drug development ecosystem by setting up a collaborative system among industry, academia,
and R&D centers; and 3) promote oriental medicine and dentistry as strategic national industries.
Government to end policy of allowing medical facilities to seek profits: The government
is likely to exclude the healthcare sector from the Basic Act on Service Industry. Specifically, it plans
to: 1) confine telemedicine to sharing information among practitioners; 2) ban hospitals from
establishing profit-seeking subsidiaries; 3) allow hospitals to seek efficiency only within areas allowed
under current laws; and 4) ban corporate pharmacies backed by large capital as they are highly likely
to turn into profit-seeking chains.
Implant, hearing aid, and dementia segments to benefit: On the campaign trail, the
president pledged to: 1) raise the basic monthly pension (paid to 70% of lower-income seniors aged
65 and older) from KRW200,000 to KRW300,000; 2) lower a patient’s implant cost from
KRW550,000-600,000/tooth to KRW300,000/tooth; and 3) make the government take full charge
of dementia patients and strengthen related benefits of the nation’s long-term care insurance. Based
on his pledges, it is likely insurance will increase the number of teeth that are covered for implants
(from two currently), and that financial burdens related to hearing-aid use will decline. The
government plans to set up a dementia support center, cap dementia patients’ medical cost burdens,
set up public hospitals dedicated to dementia, and establish more public, long-term care facilities.
Moreover, in taking full responsibility for dementia patients, it should make expand long-term care
insurance to include patients showing minor symptoms.
Contents
1H review: Poverty in the midst of plenty
p2
Pharmaceutical market outlook
p7
Visible progress to be made on R&D and B2B fronts
p32
Government policy warrants attention
p52
Key issues in 2H p68
Solid earnings momentum in 2H
p87
Company p105
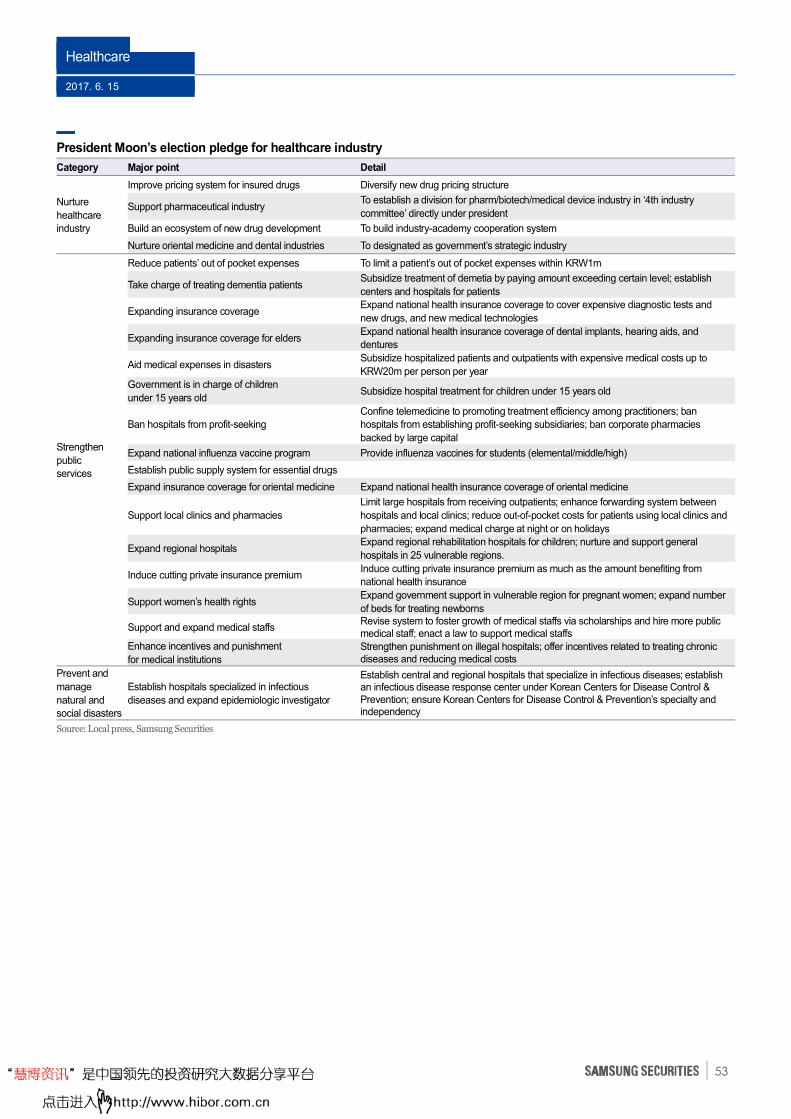
Healthcare
2017. 6. 15
53
President Moon’s election pledge for healthcare industry
Category Major point Detail
Nurture
healthcare
industry
Improve pricing system for insured drugs Diversify new drug pricing structure
Support pharmaceutical industry To establish a division for pharm/biotech/medical device industry in ‘4th industry
committee’ directly under president
Build an ecosystem of new drug development To build industry-academy cooperation system
Nurture oriental medicine and dental industries To designated as government’s strategic industry
Strengthen
public
services
Reduce patients’ out of pocket expenses To limit a patient’s out of pocket expenses within KRW1m
Take charge of treating dementia patients Subsidize treatment of demetia by paying amount exceeding certain level; establish
centers and hospitals for patients
Expanding insurance coverage Expand national health insurance coverage to cover expensive diagnostic tests and
new drugs, and new medical technologies
Expanding insurance coverage for elders Expand national health insurance coverage of dental implants, hearing aids, and
dentures
Aid medical expenses in disasters Subsidize hospitalized patients and outpatients with expensive medical costs up to
KRW20m per person per year
Government is in charge of children
under 15 years old Subsidize hospital treatment for children under 15 years old
Ban hospitals from profit-seeking
Confine telemedicine to promoting treatment efficiency among practitioners; ban
hospitals from establishing profit-seeking subsidiaries; ban corporate pharmacies
backed by large capital
Expand national influenza vaccine program Provide influenza vaccines for students (elemental/middle/high)
Establish public supply system for essential drugs
Expand insurance coverage for oriental medicine Expand national health insurance coverage of oriental medicine
Support local clinics and pharmacies
Limit large hospitals from receiving outpatients; enhance forwarding system between
hospitals and local clinics; reduce out-of-pocket costs for patients using local clinics and
pharmacies; expand medical charge at night or on holidays
Expand regional hospitals Expand regional rehabilitation hospitals for children; nurture and support general
hospitals in 25 vulnerable regions.
Induce cutting private insurance premium Induce cutting private insurance premium as much as the amount benefiting from
national health insurance
Support women’s health rights Expand government support in vulnerable region for pregnant women; expand number
of beds for treating newborns
Support and expand medical staffs Revise system to foster growth of medical staffs via scholarships and hire more public medical staff; enact a law to support medical staffs
Enhance incentives and punishment
for medical institutions
Strengthen punishment on illegal hospitals; offer incentives related to treating chronic diseases and reducing medical costs
Prevent and
manage
natural and
social disasters
Establish hospitals specialized in infectious
diseases and expand epidemiologic investigator
Establish central and regional hospitals that specialize in infectious diseases; establish an infectious disease response center under Korean Centers for Disease Control & Prevention; ensure Korean Centers for Disease Control & Prevention’s specialty and independency
Source: Local press, Samsung Securities
Healthcare
2017. 6. 15
54
Implant market to benefit from health insurance expansion
Korea’s Ministry of Health & Welfare on Jul 1 last year expanded health insurance coverage to
include dental implants for patients aged 65 or older. Previously, the age threshold was 75 from Jul
2014 and 70 from Jul 2015. Under the expanded coverage, an insured patient now pays just 50% of
the original cost for up to two implants (for any tooth) during their lifetime. Based on a government
survey, an implant typically costs an insured patient KRW1,165,720—ie, KRW1,055,720 procedure
and KRW110,000 material costs. Although the costs vary by clinic, some clinics charge an uninsured
implant patient as little as KRW1.2m per implant.
Korea’s implant market, backed by expanding coverage since 2014, has grown at a solid pace.
According to the National Health Insurance Corporation, its cost of implants saw a CAGR of 22.8%
from KRW1.7t in 2013 to KRW3.18t in 2016, with combined domestic sales of the nation’s top three
implant firms (ie, Osstem Implant, Dentium, and Dio) climbed 20.2% pa from KRW98.3b in 2013 to
KRW169.9b in 2016. According to the Health Insurance Review & Assessment Service, insured
implant sales volume saw at a CAGR of 142.9% y-y from 36,702 in 2014 to 491,083 in 2016, and the
number of implant patients jumped 147.8% y-y pa from 21,805 to 300,543 over the same period.
Market leader Osstem Implant’s earnings show that coverage expansion from 2014 has been the
main driver of growth. The company’s insured implant sales jumped 84.6% y-y from KRW6.5b in
2015 to KRW12b in 2016, with the insured portion accounting for 62.5% of the y-y domestic implant
sales gain of KRW19.2b. The nation’s top-five players—Osstem Implant, Dentium, Dio, Neo Biotech,
and Megagen Implant—benefitted most from the coverage expansion as: 1) foreign brands were
excluded; and 2) dentists likely prefer products with strong brand recognition, noting material costs
are relatively fixed.
Korea’s implant market is already saturated, with the nation boasting the world’s highest penetration
rate. Straumann reports that 412 implants were sold for every 10,000 Koreans in 2015, more than
twice the level of the next highest nation. This raised concerns that, absent further expansions in
insurance coverage, growth will slow in Korea’ implant market. The new president’s apparent
commitment to expand coverage for the elderly should ease such concerns. If the president follows
through on his campaign pledges, we estimate that the domestic implant market will grow 15-20% pa
over the next few years.
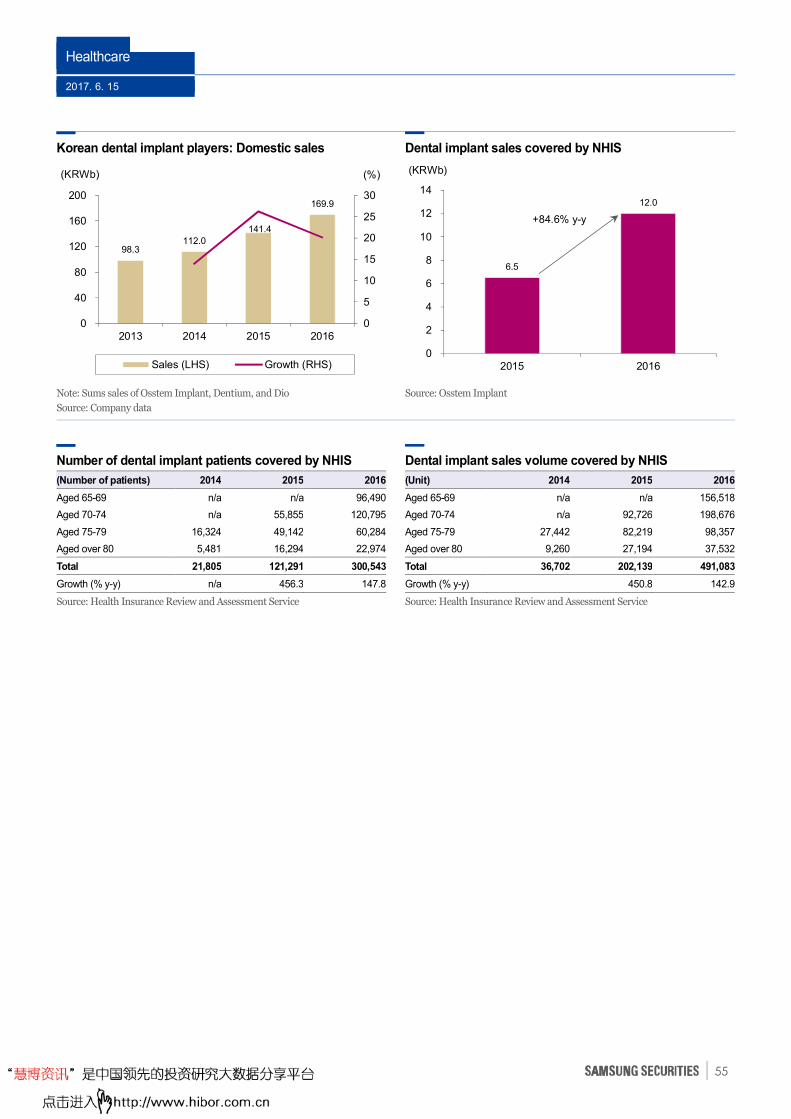
Healthcare
2017. 6. 15
55
Korean dental implant players: Domestic sales Dental implant sales covered by NHIS
Note: Sums sales of Osstem Implant, Dentium, and Dio
Source: Company data
Source: Osstem Implant
Number of dental implant patients covered by NHIS
(Number of patients) 2014 2015 2016
Aged 65-69 n/a n/a 96,490
Aged 70-74 n/a 55,855 120,795
Aged 75-79 16,324 49,142 60,284
Aged over 80 5,481 16,294 22,974
Total 21,805 121,291 300,543
Growth (% y-y) n/a 456.3 147.8
Source: Health Insurance Review and Assessment Service
Dental implant sales volume covered by NHIS
(Unit) 2014 2015 2016
Aged 65-69 n/a n/a 156,518
Aged 70-74 n/a 92,726 198,676
Aged 75-79 27,442 82,219 98,357
Aged over 80 9,260 27,194 37,532
Total 36,702 202,139 491,083
Growth (% y-y) 450.8 142.9
Source: Health Insurance Review and Assessment Service
98.3 112.0
141.4
169.9
0
5
10
15
20
25
30
0
40
80
120
160
200
2013 2014 2015 2016
(%)(KRWb)
Sales (LHS) Growth (RHS)
6.5
12.0
0
2
4
6
8
10
12
14
2015 2016
(KRWb)
+84.6% y-y

Healthcare
2017. 6. 15
56
Drug expenditure cap a possibility
NHIS cumulative surplus hits KRW20t in 2016… The NHIS posted an annual surplus of
KRW3.1t for 2016 (down 26.1% y-y) on revenue and expense growth of 6.3% and 9.1% y-y to
KRW55.7t and KRW52.6t, respectively. The revenue consists of insurance premiums (KRW47.3t; up
7.4% y-y) and government aid (KRW7.4t; down 0.4% y-y), with the latter coming from government
coffers (equivalent to 14% of expected insurance premium revenue in the year) and the National
Health Promotion Fund (6%). The agency’s cumulative surplus rose 18.3% y-y to KRW20t.
…but likely to fall to KRW17.2 t in 2020: Based on data submitted to the National Assembly,
the NHIS over 2017-2020 expects its: 1) revenue to grow 6.9% pa on premium hikes and increased
funding; and 2) expenses to expand 8.7% pa due to coverage expansions and greater use of medical
services. If correct, the program will suffer an annual deficit of KRW1.2t in 2019, with the cumulative
surplus peaking at KRW21.2t in 2018 and falling to KRW17.2t in 2020. With yields on managed
assets in 2016 a meager 1.7%, the NHIS intends to cut exposure to Korean bonds and diversify into
overseas stocks and alternative investments.
Aid normalization, premium hikes key: The National Health Insurance Act set government
aid at 20% of estimated annual insurance premium revenue. The government, however, has not
fulfilled its mandate, with unpaid government aid over 2007-2015 reaching KRW14.7t. Meanwhile,
after a 5.9% premium hike in 2011, growth in premiums collected has been slowing and should come
in flat y-y this year, totaling 6.12% of income. Even though expenditures by the NHIS have seen a
CAGR of 7.1% over 2011-2016, premium hikes have been moderate as pharmaceutical firms pared 14%
on average from drug prices in 2012. NHIS’s finances should improve if premiums rise and the
government makes good on its aid commitment. (Price cuts in 2012 reduced the drug portion of
medical costs from 29.1% in 2011 to a record low of 25.7% in 2016.)
Generous healthcare policy to burden finances: President Moon’s election pledges included
reducing the cap on out-of-pocket expenses for lower income people to KRW1m, increasing state
responsibility for hospitalized children under 15, and offering financial support for catastrophic
medical expenses. If implemented: 1) insurance expansion would cover more services, making the
out-of-pocket limit more meaningful; 2) out-of-pocket portion of costs would fall to 5% for those
under 15 years; and 3) patients facing expensive medical bills would receive government support of
up to KRW2m pa according to income levels. Also, national health insurance would expand to cover
expensive diagnostic exams, novel drugs, and new high-tech medical procedures, as well as costs
associated with employing care assistants, choosing more-experienced doctors, and staying in a
premium hospital room. Out-of-pocket ratios would vary by income level. The new regime’s
generous healthcare policy is likely to weigh on NHIS finances.
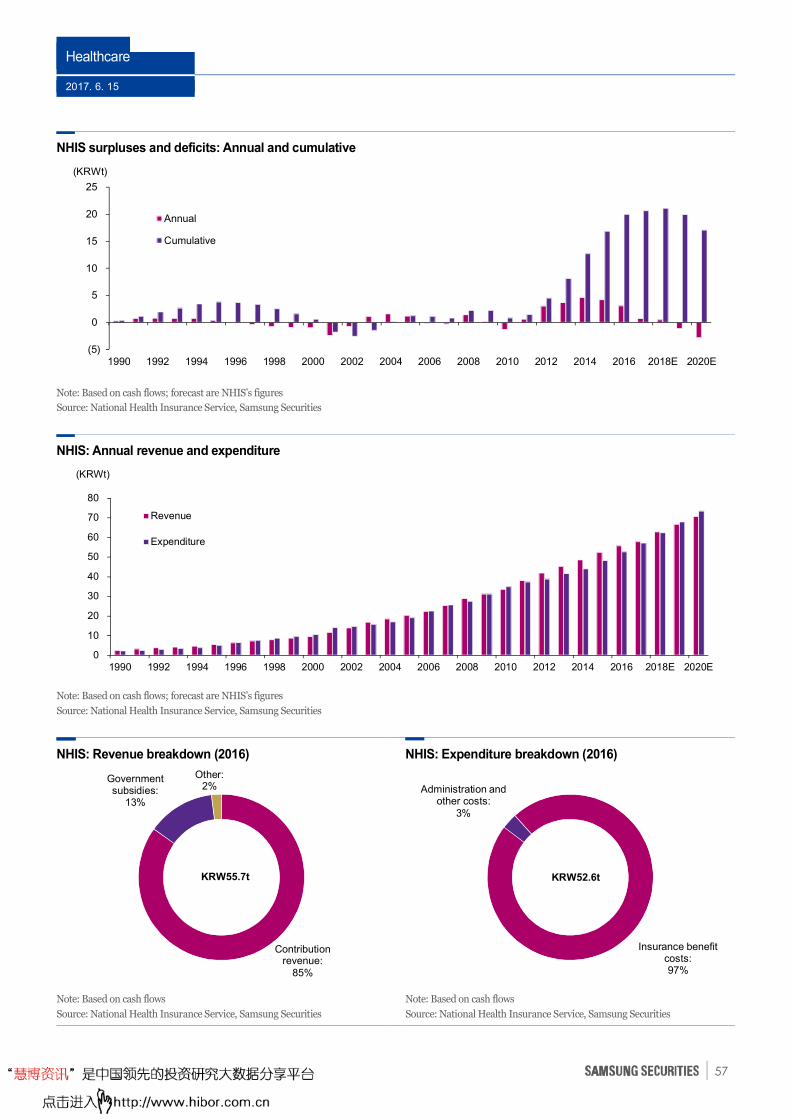
Healthcare
2017. 6. 15
57
NHIS surpluses and deficits: Annual and cumulative
Note: Based on cash flows; forecast are NHIS’s figures
Source: National Health Insurance Service, Samsung Securities
NHIS: Annual revenue and expenditure
Note: Based on cash flows; forecast are NHIS’s figures
Source: National Health Insurance Service, Samsung Securities
NHIS: Revenue breakdown (2016) NHIS: Expenditure breakdown (2016)
Note: Based on cash flows
Source: National Health Insurance Service, Samsung Securities
Note: Based on cash flows
Source: National Health Insurance Service, Samsung Securities
0
10
20
30
40
50
60
70
80
1990 1992 1994 1996 1998 2000 2002 2004 2006 2008 2010 2012 2014 2016 2018E 2020E
Revenue
Expenditure
(KRWt)
KRW52.6t
Administration and other costs:
3%
Insurance benefit costs:97%
Contribution revenue:
85%
Other:2%
KRW55.7t
Governmentsubsidies:
13%
(5)
0
5
10
15
20
25
1990 1992 1994 1996 1998 2000 2002 2004 2006 2008 2010 2012 2014 2016 2018E 2020E
Annual
Cumulative
(KRWt)
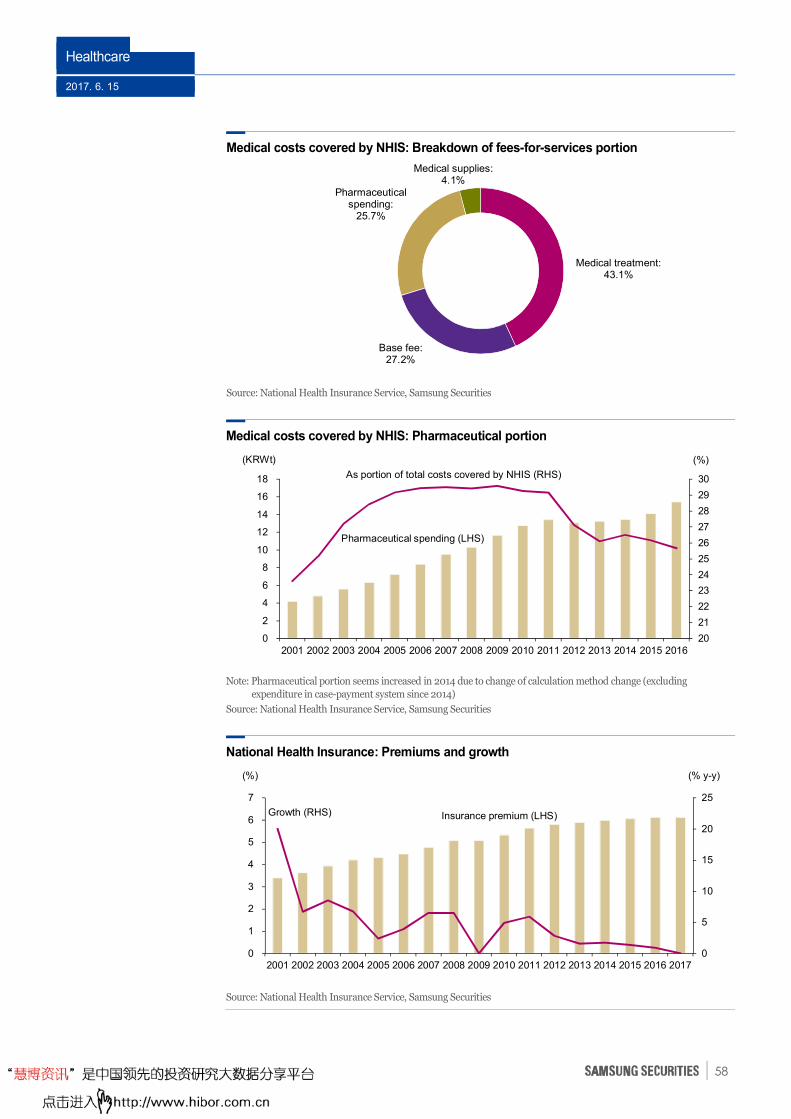
Healthcare
2017. 6. 15
58
Medical costs covered by NHIS: Breakdown of fees-for-services portion
Source: National Health Insurance Service, Samsung Securities
Medical costs covered by NHIS: Pharmaceutical portion
Note: Pharmaceutical portion seems increased in 2014 due to change of calculation method change (excluding
expenditure in case-payment system since 2014)
Source: National Health Insurance Service, Samsung Securities
National Health Insurance: Premiums and growth
Source: National Health Insurance Service, Samsung Securities
Medical treatment:43.1%
Base fee:27.2%
Pharmaceutical spending:
25.7%
Medical supplies:4.1%
20
21
22
23
24
25
26
27
28
29
30
0
2
4
6
8
10
12
14
16
18
2001 2002 2003 2004 2005 2006 2007 2008 2009 2010 2011 2012 2013 2014 2015 2016
(KRWt) (%)
Pharmaceutical spending (LHS)
As portion of total costs covered by NHIS (RHS)
0
5
10
15
20
25
0
1
2
3
4
5
6
7
2001 2002 2003 2004 2005 2006 2007 2008 2009 2010 2011 2012 2013 2014 2015 2016 2017
(%) (% y-y)
Insurance premium (LHS)Growth (RHS)
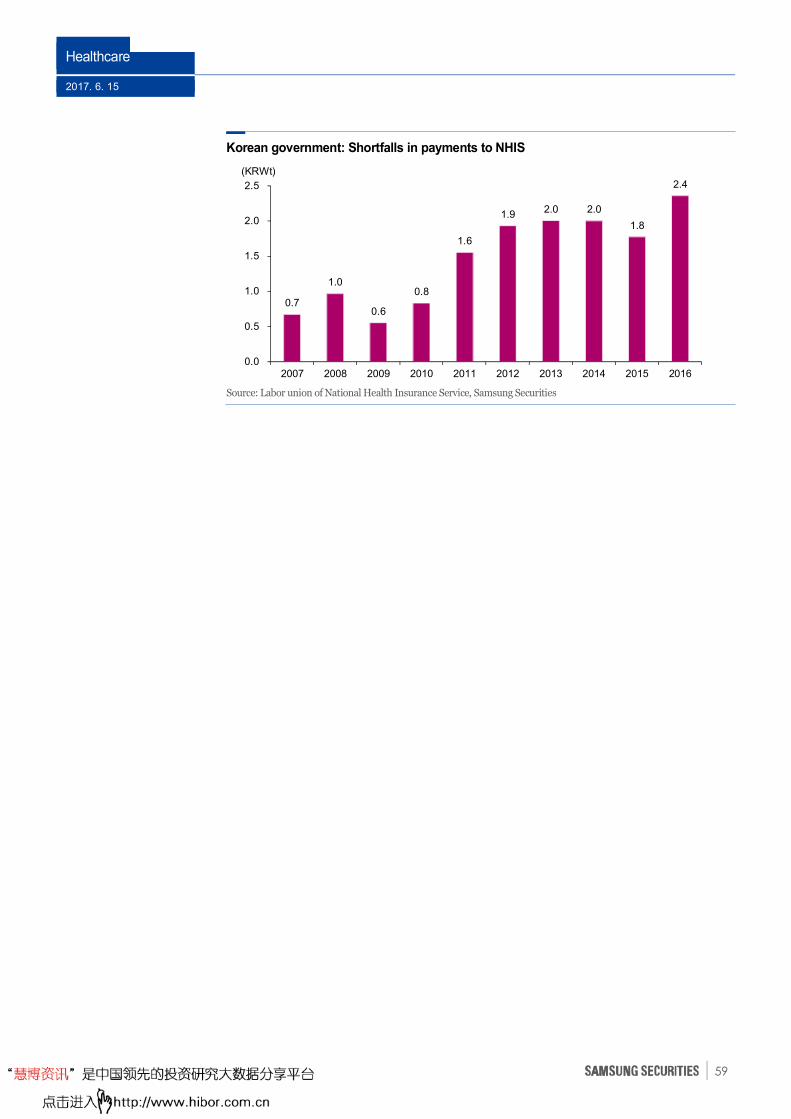
Healthcare
2017. 6. 15
59
Korean government: Shortfalls in payments to NHIS
Source: Labor union of National Health Insurance Service, Samsung Securities
0.7
1.0
0.6
0.8
1.6
1.9 2.0 2.0
1.8
2.4
0.0
0.5
1.0
1.5
2.0
2.5
2007 2008 2009 2010 2011 2012 2013 2014 2015 2016
(KRWt)
Healthcare
2017. 6. 15
60
Pharma to shoulder expenses exceeding NHIS budget? The NHIS, rather than controlling
the price of each drug (as it currently does), may assign an expenditure cap for each therapeutic class
(eg, hypertension, diabetes). Expenses exceeding the budget limit would be shouldered by
pharmaceutical firms. The move could thus have the biggest impact on the pharmaceutical industry
since 2012 when the government cut prices of 6,506 (out of 13,814) drugs on the formulary list,
causing a 14% drop on average. In 2011, an NHIS committee for advancing healthcare insurance
proposed: 1) capping growth in aggregate drug expenditures by therapeutic class; and 2) having
pharmaceutical firms reimburse drug costs that exceed the cap. In 2013, the Korea Institute for
Health and Social Affairs published A Study on Fixed Budget for Pharmaceutical Expenditures which,
after comparing drug budgets across countries, asserted that a fixed drug budget is necessary to
contain drug spending in the face of aging population and increasing number of people using medical
services.
Cap in Taiwan fails to address deficits: Taiwan introduced its National Health Insurance
(NHI) in 1995 on a fee-for-service basis, exempting out-of-pocket payments for certain medical
services such as child delivery. To contain rapidly rising costs, the nation implemented an
expenditure cap for dental care in 1998, outpatient care in 2001, and inpatient care in 2002. The
expenditure cap is adjusted every year as follows.
• Expenditure cap for new year = per-capita costs of covered medical services in 2016 x [1+ growth
in costs of covered medical services (non-negotiable factors + negotiable factors)] x number of
policyholders
The expenditure cap is based on both negotiable and non-negotiable factors. Negotiable factors refer
to changes in the scope of covered services, costs of enhancing medical service quality and promoting
health, magnitude of medical service usage; non-negotiable ones refer to natural growth in medical
service users (due to population growth and changing demographics by age and gender), and medical
service costs (eg, labor, drug, medical supplies).
Despite the expenditure caps, however, the NHI remained mired in deficits. In 2002 when it first
introduced the expenditure cap to all services, it posted a surplus of TWD8.7b (KRW326.9b) but
slipped back to a deficit of TWD12.6b (KRW473.5b) in 2007 which widened to TWD58.2b (KRW2.2t)
in 2009. Annual growth in medical expenditures typically outstripped that of premiums due to
population aging and heavy spending on major illnesses. To address the NHI’s financial woes, the
nation in 2011 undertook a major health care reform—the Second-Generation NHI—which it
implemented in 2013. The new plan levied: 1) additional premiums on employers and policyholders;
and 2) supplemental premiums in six additional areas (including rent, interest, and dividends),
establishing a new premium base.
Study results on drug expenditure cap due in July: The Ministry of Health and Welfare’s
Pharmaceutical Benefits Division in 2016 hinted at the need to introduce a drug expenditure cap. In
March 2017, the NHIS commissioned a study to explore ways to introduce a drug expenditure cap
(with the Seoul National University College of Nursing Professor Kim Jin-Hyun). The project, unlike
previous ones that simply looked into overseas cases and studied drug prices, focuses solely on
capping aggregate drug expenditures. The results should be announced by end-July.
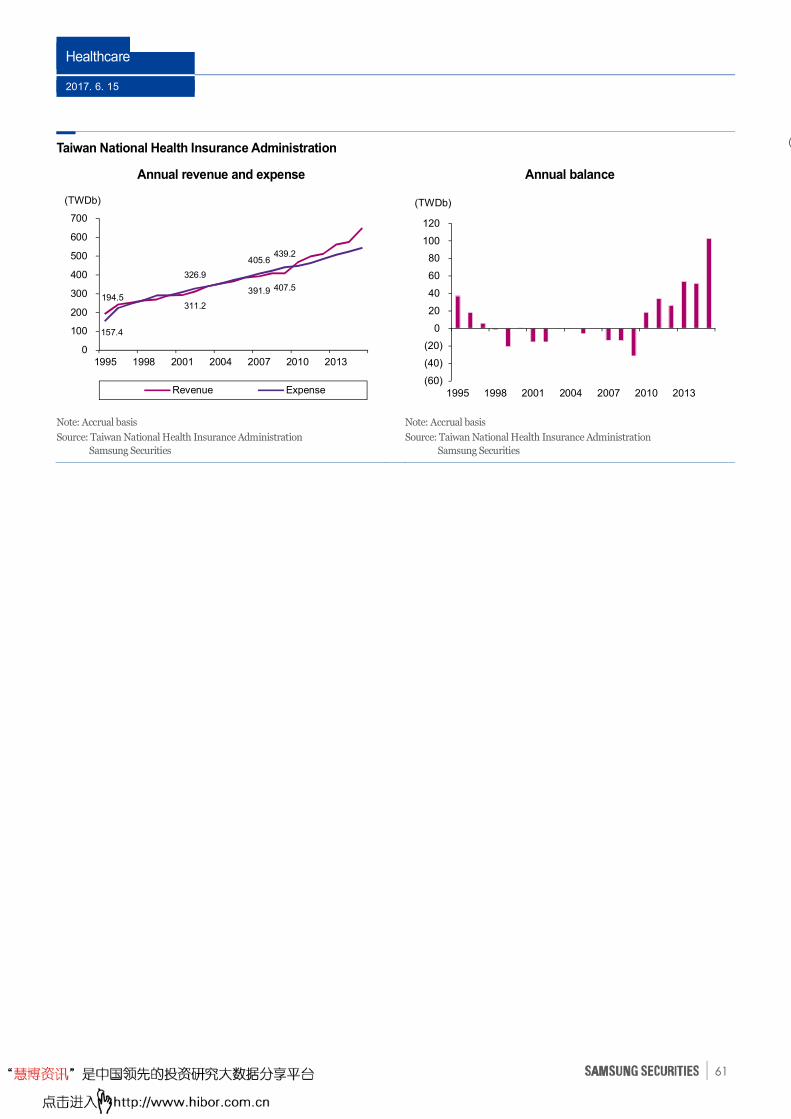
Healthcare
2017. 6. 15
61
Taiwan National Health Insurance Administration
Annual revenue and expense Annual balance
Note: Accrual basis
Source: Taiwan National Health Insurance Administration
Samsung Securities
Note: Accrual basis
Source: Taiwan National Health Insurance Administration
Samsung Securities
(
(60)
(40)
(20)
0
20
40
60
80
100
120
1995 1998 2001 2004 2007 2010 2013
(TWDb)
194.5 311.2
391.9 407.5
157.4
326.9
405.6 439.2
0
100
200
300
400
500
600
700
1995 1998 2001 2004 2007 2010 2013
Revenue Expense
(TWDb)
Healthcare
2017. 6. 15
62
Regulations over rebates may tighten again
Mandatory reporting to be implemented… The Ministry of Health and Welfare (MOHW) on
Mar 27 revealed a proposal that makes it mandatory for pharmaceutical firms to collect/track data
and submit reports regarding any financial incentives provided to pharmacists or physicians).
Reports should include offerings of sample products, support of clinical trials, post-launch surveys,
introductions of new drugs at big events (involving multiple institutions) or via a visit to a single
institution, assistance to academic events, and discounts on costs (ie, favorable payment terms). For
example, reports on academic events should include the event’s host, title, venue, and time, as well as
the total amount of financial support.
…with legally enforceable provisions: Pharmaceutical firms must submit the required
documents to the MOHW within three months of the end of a financial year and keep related data.
The MOHW reviews the reports and can ask law enforcement to become involved if required. Firms
that break rules are subject to corrective orders and fines (less than KRW1m), and failure to follow
corrective orders results in a fine of KRW2m. Furthermore, penalties for violating the prohibition of
providing financial incentives can reach up to three years in prison or KRW30m in fines.
Impacts to be limited: Major regulations related to rebates in Korea’s pharmaceutical industry
include: 1) dual punishment (Nov 28, 2010), where both the giver and receiver are punished; 2) a
two-strike rule (Jul 1, 2014) in which the offender can have its drug removed from NHIS list; and 3)
the anti-corruption law (Sep 28, 2016). Government investigations into pharmaceutical firms in 2011
led to the prosecution of three doctors that received rebates, and administrative sanctions for 212
doctors, marking the first case of dual-punishment. Meanwhile, the MOHW on Apr 27, 2017
announced the suspension of nine of Novartis Korea’s drugs from national insurance coverage for six
months and fined the company a combined KRW55.1b related to 33 other drugs, marking the first
case of the two-strike rule. We believe the mandatory reports on financial incentive offerings simply
complement existing anti-rebate regulations and will have limited impacts.
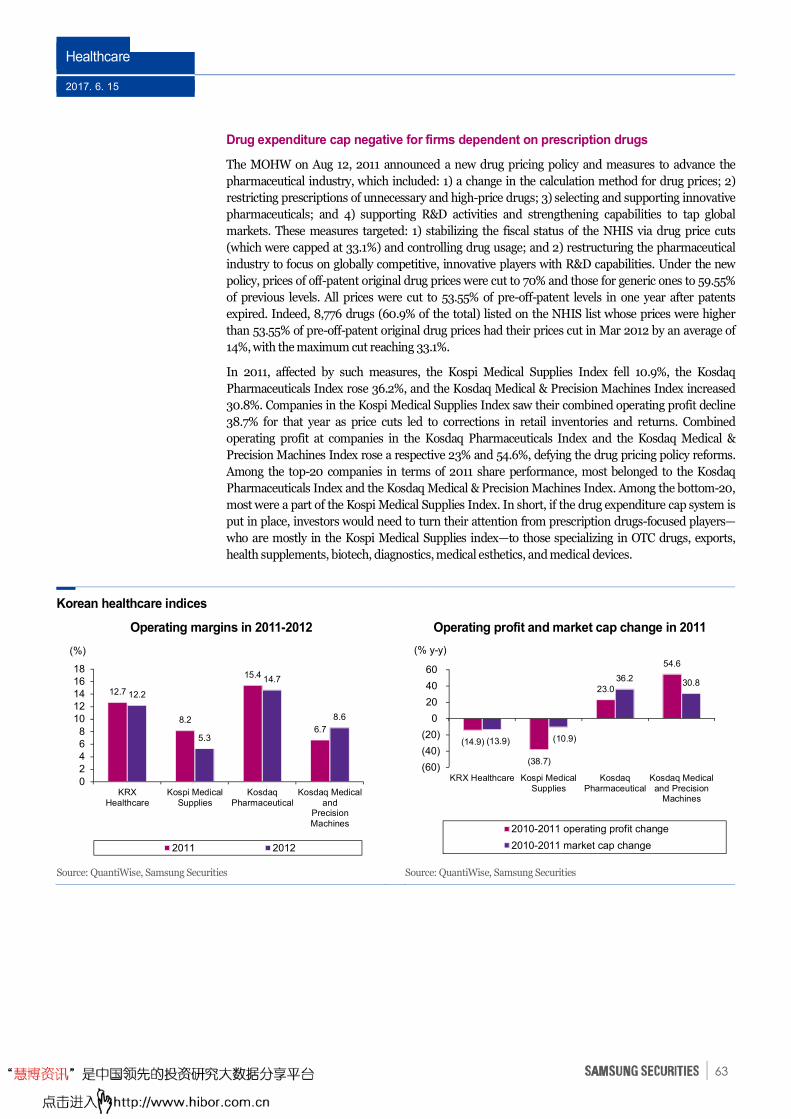
Healthcare
2017. 6. 15
63
Drug expenditure cap negative for firms dependent on prescription drugs
The MOHW on Aug 12, 2011 announced a new drug pricing policy and measures to advance the
pharmaceutical industry, which included: 1) a change in the calculation method for drug prices; 2)
restricting prescriptions of unnecessary and high-price drugs; 3) selecting and supporting innovative
pharmaceuticals; and 4) supporting R&D activities and strengthening capabilities to tap global
markets. These measures targeted: 1) stabilizing the fiscal status of the NHIS via drug price cuts
(which were capped at 33.1%) and controlling drug usage; and 2) restructuring the pharmaceutical
industry to focus on globally competitive, innovative players with R&D capabilities. Under the new
policy, prices of off-patent original drug prices were cut to 70% and those for generic ones to 59.55%
of previous levels. All prices were cut to 53.55% of pre-off-patent levels in one year after patents
expired. Indeed, 8,776 drugs (60.9% of the total) listed on the NHIS list whose prices were higher
than 53.55% of pre-off-patent original drug prices had their prices cut in Mar 2012 by an average of
14%, with the maximum cut reaching 33.1%.
In 2011, affected by such measures, the Kospi Medical Supplies Index fell 10.9%, the Kosdaq
Pharmaceuticals Index rose 36.2%, and the Kosdaq Medical & Precision Machines Index increased
30.8%. Companies in the Kospi Medical Supplies Index saw their combined operating profit decline
38.7% for that year as price cuts led to corrections in retail inventories and returns. Combined
operating profit at companies in the Kosdaq Pharmaceuticals Index and the Kosdaq Medical &
Precision Machines Index rose a respective 23% and 54.6%, defying the drug pricing policy reforms.
Among the top-20 companies in terms of 2011 share performance, most belonged to the Kosdaq
Pharmaceuticals Index and the Kosdaq Medical & Precision Machines Index. Among the bottom-20,
most were a part of the Kospi Medical Supplies Index. In short, if the drug expenditure cap system is
put in place, investors would need to turn their attention from prescription drugs-focused players—
who are mostly in the Kospi Medical Supplies index—to those specializing in OTC drugs, exports,
health supplements, biotech, diagnostics, medical esthetics, and medical devices.
Korean healthcare indices
Operating margins in 2011-2012 Operating profit and market cap change in 2011
Source: QuantiWise, Samsung Securities Source: QuantiWise, Samsung Securities
12.7
8.2
15.4
6.7
12.2
5.3
14.7
8.6
02468
1012141618
KRXHealthcare
Kospi MedicalSupplies
KosdaqPharmaceutical
Kosdaq Medicaland
PrecisionMachines
2011 2012
(%)
(14.9)
(38.7)
23.0
54.6
(13.9) (10.9)
36.230.8
(60)
(40)
(20)
0
20
40
60
KRX Healthcare Kospi MedicalSupplies
KosdaqPharmaceutical
Kosdaq Medicaland Precision
Machines
2010-2011 operating profit change
2010-2011 market cap change
(% y-y)
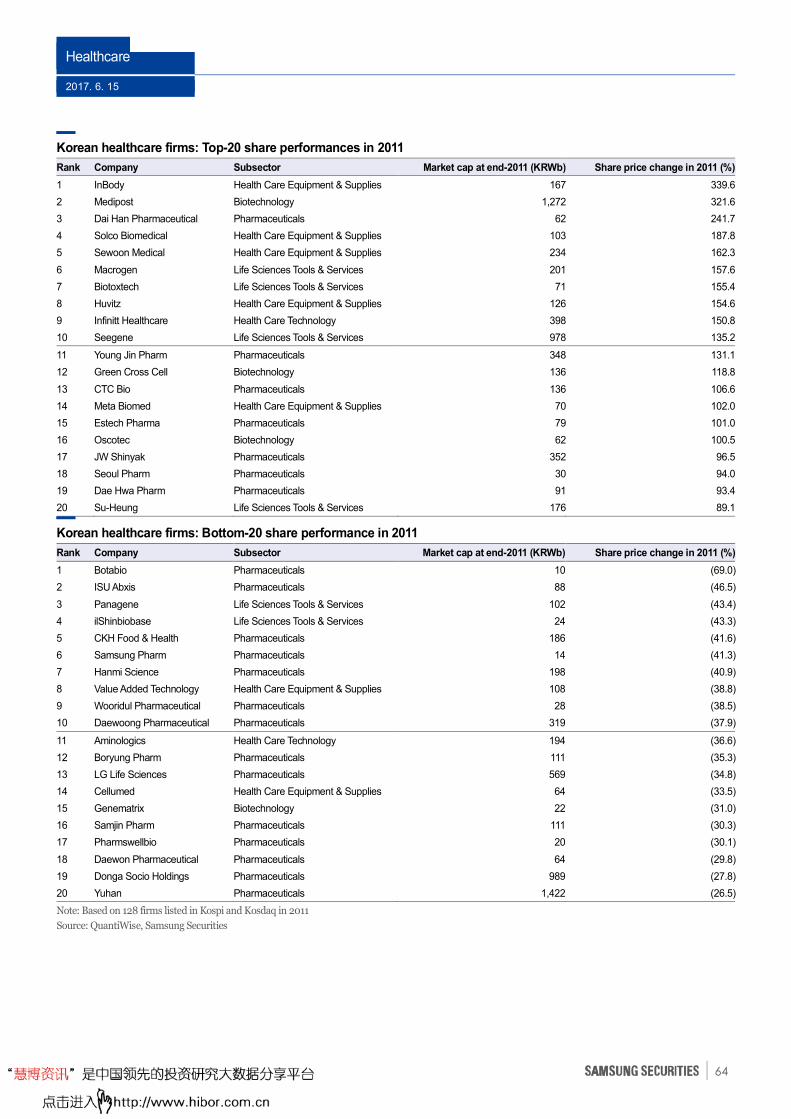
Healthcare
2017. 6. 15
64
Korean healthcare firms: Top-20 share performances in 2011
Rank Company Subsector Market cap at end-2011 (KRWb) Share price change in 2011 (%)
1 InBody Health Care Equipment & Supplies 167 339.6
2 Medipost Biotechnology 1,272 321.6
3 Dai Han Pharmaceutical Pharmaceuticals 62 241.7
4 Solco Biomedical Health Care Equipment & Supplies 103 187.8
5 Sewoon Medical Health Care Equipment & Supplies 234 162.3
6 Macrogen Life Sciences Tools & Services 201 157.6
7 Biotoxtech Life Sciences Tools & Services 71 155.4
8 Huvitz Health Care Equipment & Supplies 126 154.6
9 Infinitt Healthcare Health Care Technology 398 150.8
10 Seegene Life Sciences Tools & Services 978 135.2
11 Young Jin Pharm Pharmaceuticals 348 131.1
12 Green Cross Cell Biotechnology 136 118.8
13 CTC Bio Pharmaceuticals 136 106.6
14 Meta Biomed Health Care Equipment & Supplies 70 102.0
15 Estech Pharma Pharmaceuticals 79 101.0
16 Oscotec Biotechnology 62 100.5
17 JW Shinyak Pharmaceuticals 352 96.5
18 Seoul Pharm Pharmaceuticals 30 94.0
19 Dae Hwa Pharm Pharmaceuticals 91 93.4
20 Su-Heung Life Sciences Tools & Services 176 89.1
Korean healthcare firms: Bottom-20 share performance in 2011
Rank Company Subsector Market cap at end-2011 (KRWb) Share price change in 2011 (%)
1 Botabio Pharmaceuticals 10 (69.0)
2 ISU Abxis Pharmaceuticals 88 (46.5)
3 Panagene Life Sciences Tools & Services 102 (43.4)
4 ilShinbiobase Life Sciences Tools & Services 24 (43.3)
5 CKH Food & Health Pharmaceuticals 186 (41.6)
6 Samsung Pharm Pharmaceuticals 14 (41.3)
7 Hanmi Science Pharmaceuticals 198 (40.9)
8 Value Added Technology Health Care Equipment & Supplies 108 (38.8)
9 Wooridul Pharmaceutical Pharmaceuticals 28 (38.5)
10 Daewoong Pharmaceutical Pharmaceuticals 319 (37.9)
11 Aminologics Health Care Technology 194 (36.6)
12 Boryung Pharm Pharmaceuticals 111 (35.3)
13 LG Life Sciences Pharmaceuticals 569 (34.8)
14 Cellumed Health Care Equipment & Supplies 64 (33.5)
15 Genematrix Biotechnology 22 (31.0)
16 Samjin Pharm Pharmaceuticals 111 (30.3)
17 Pharmswellbio Pharmaceuticals 20 (30.1)
18 Daewon Pharmaceutical Pharmaceuticals 64 (29.8)
19 Donga Socio Holdings Pharmaceuticals 989 (27.8)
20 Yuhan Pharmaceuticals 1,422 (26.5)
Note: Based on 128 firms listed in Kospi and Kosdaq in 2011
Source: QuantiWise, Samsung Securities
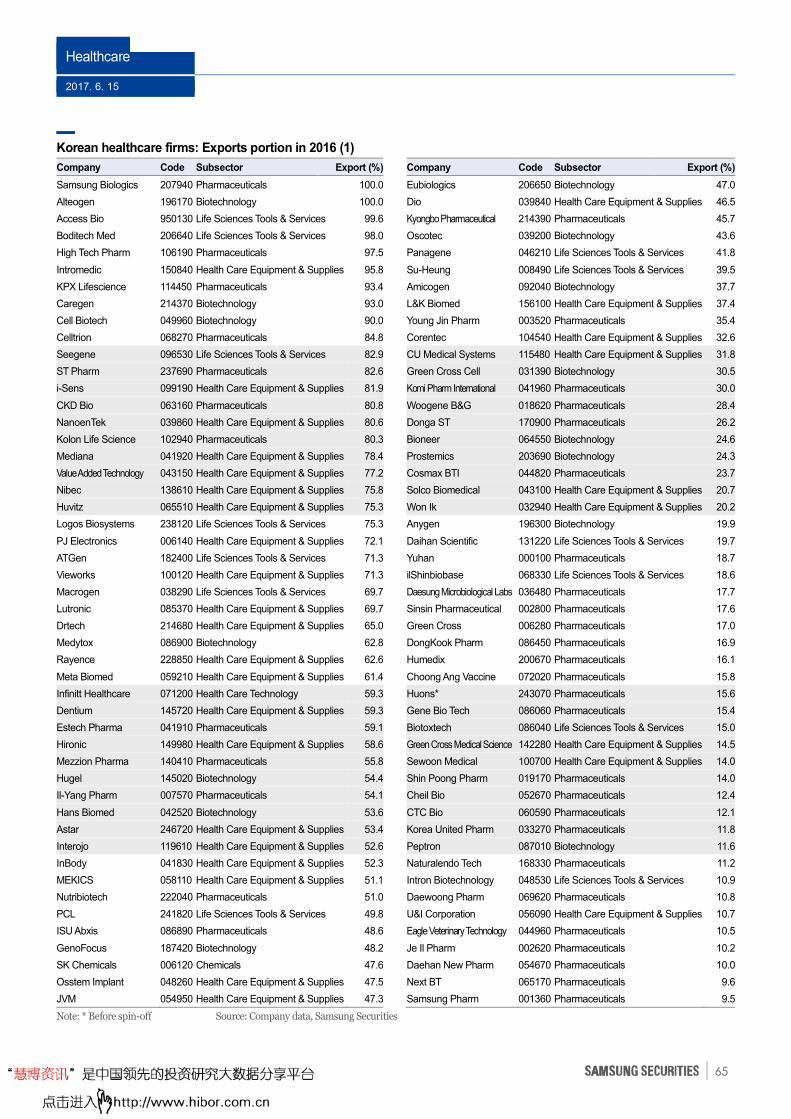
Healthcare
2017. 6. 15
65
Korean healthcare firms: Exports portion in 2016 (1)
Company Code Subsector Export (%) Company Code Subsector Export (%)
Samsung Biologics 207940 Pharmaceuticals 100.0 Eubiologics 206650 Biotechnology 47.0
Alteogen 196170 Biotechnology 100.0 Dio 039840 Health Care Equipment & Supplies 46.5
Access Bio 950130 Life Sciences Tools & Services 99.6 Kyongbo Pharmaceutical 214390 Pharmaceuticals 45.7
Boditech Med 206640 Life Sciences Tools & Services 98.0 Oscotec 039200 Biotechnology 43.6
High Tech Pharm 106190 Pharmaceuticals 97.5 Panagene 046210 Life Sciences Tools & Services 41.8
Intromedic 150840 Health Care Equipment & Supplies 95.8 Su-Heung 008490 Life Sciences Tools & Services 39.5
KPX Lifescience 114450 Pharmaceuticals 93.4 Amicogen 092040 Biotechnology 37.7
Caregen 214370 Biotechnology 93.0 L&K Biomed 156100 Health Care Equipment & Supplies 37.4
Cell Biotech 049960 Biotechnology 90.0 Young Jin Pharm 003520 Pharmaceuticals 35.4
Celltrion 068270 Pharmaceuticals 84.8 Corentec 104540 Health Care Equipment & Supplies 32.6
Seegene 096530 Life Sciences Tools & Services 82.9 CU Medical Systems 115480 Health Care Equipment & Supplies 31.8
ST Pharm 237690 Pharmaceuticals 82.6 Green Cross Cell 031390 Biotechnology 30.5
i-Sens 099190 Health Care Equipment & Supplies 81.9 Komi Pharm International 041960 Pharmaceuticals 30.0
CKD Bio 063160 Pharmaceuticals 80.8 Woogene B&G 018620 Pharmaceuticals 28.4
NanoenTek 039860 Health Care Equipment & Supplies 80.6 Donga ST 170900 Pharmaceuticals 26.2
Kolon Life Science 102940 Pharmaceuticals 80.3 Bioneer 064550 Biotechnology 24.6
Mediana 041920 Health Care Equipment & Supplies 78.4 Prostemics 203690 Biotechnology 24.3
Value Added Technology 043150 Health Care Equipment & Supplies 77.2 Cosmax BTI 044820 Pharmaceuticals 23.7
Nibec 138610 Health Care Equipment & Supplies 75.8 Solco Biomedical 043100 Health Care Equipment & Supplies 20.7
Huvitz 065510 Health Care Equipment & Supplies 75.3 Won Ik 032940 Health Care Equipment & Supplies 20.2
Logos Biosystems 238120 Life Sciences Tools & Services 75.3 Anygen 196300 Biotechnology 19.9
PJ Electronics 006140 Health Care Equipment & Supplies 72.1 Daihan Scientific 131220 Life Sciences Tools & Services 19.7
ATGen 182400 Life Sciences Tools & Services 71.3 Yuhan 000100 Pharmaceuticals 18.7
Vieworks 100120 Health Care Equipment & Supplies 71.3 ilShinbiobase 068330 Life Sciences Tools & Services 18.6
Macrogen 038290 Life Sciences Tools & Services 69.7 Daesung Microbiological Labs 036480 Pharmaceuticals 17.7
Lutronic 085370 Health Care Equipment & Supplies 69.7 Sinsin Pharmaceutical 002800 Pharmaceuticals 17.6
Drtech 214680 Health Care Equipment & Supplies 65.0 Green Cross 006280 Pharmaceuticals 17.0
Medytox 086900 Biotechnology 62.8 DongKook Pharm 086450 Pharmaceuticals 16.9
Rayence 228850 Health Care Equipment & Supplies 62.6 Humedix 200670 Pharmaceuticals 16.1
Meta Biomed 059210 Health Care Equipment & Supplies 61.4 Choong Ang Vaccine 072020 Pharmaceuticals 15.8
Infinitt Healthcare 071200 Health Care Technology 59.3 Huons* 243070 Pharmaceuticals 15.6
Dentium 145720 Health Care Equipment & Supplies 59.3 Gene Bio Tech 086060 Pharmaceuticals 15.4
Estech Pharma 041910 Pharmaceuticals 59.1 Biotoxtech 086040 Life Sciences Tools & Services 15.0
Hironic 149980 Health Care Equipment & Supplies 58.6 Green Cross Medical Science 142280 Health Care Equipment & Supplies 14.5
Mezzion Pharma 140410 Pharmaceuticals 55.8 Sewoon Medical 100700 Health Care Equipment & Supplies 14.0
Hugel 145020 Biotechnology 54.4 Shin Poong Pharm 019170 Pharmaceuticals 14.0
Il-Yang Pharm 007570 Pharmaceuticals 54.1 Cheil Bio 052670 Pharmaceuticals 12.4
Hans Biomed 042520 Biotechnology 53.6 CTC Bio 060590 Pharmaceuticals 12.1
Astar 246720 Health Care Equipment & Supplies 53.4 Korea United Pharm 033270 Pharmaceuticals 11.8
Interojo 119610 Health Care Equipment & Supplies 52.6 Peptron 087010 Biotechnology 11.6
InBody 041830 Health Care Equipment & Supplies 52.3 Naturalendo Tech 168330 Pharmaceuticals 11.2
MEKICS 058110 Health Care Equipment & Supplies 51.1 Intron Biotechnology 048530 Life Sciences Tools & Services 10.9
Nutribiotech 222040 Pharmaceuticals 51.0 Daewoong Pharm 069620 Pharmaceuticals 10.8
PCL 241820 Life Sciences Tools & Services 49.8 U&I Corporation 056090 Health Care Equipment & Supplies 10.7
ISU Abxis 086890 Pharmaceuticals 48.6 Eagle Veterinary Technology 044960 Pharmaceuticals 10.5
GenoFocus 187420 Biotechnology 48.2 Je Il Pharm 002620 Pharmaceuticals 10.2
SK Chemicals 006120 Chemicals 47.6 Daehan New Pharm 054670 Pharmaceuticals 10.0
Osstem Implant 048260 Health Care Equipment & Supplies 47.5 Next BT 065170 Pharmaceuticals 9.6
JVM 054950 Health Care Equipment & Supplies 47.3 Samsung Pharm 001360 Pharmaceuticals 9.5
Note: * Before spin-off Source: Company data, Samsung Securities
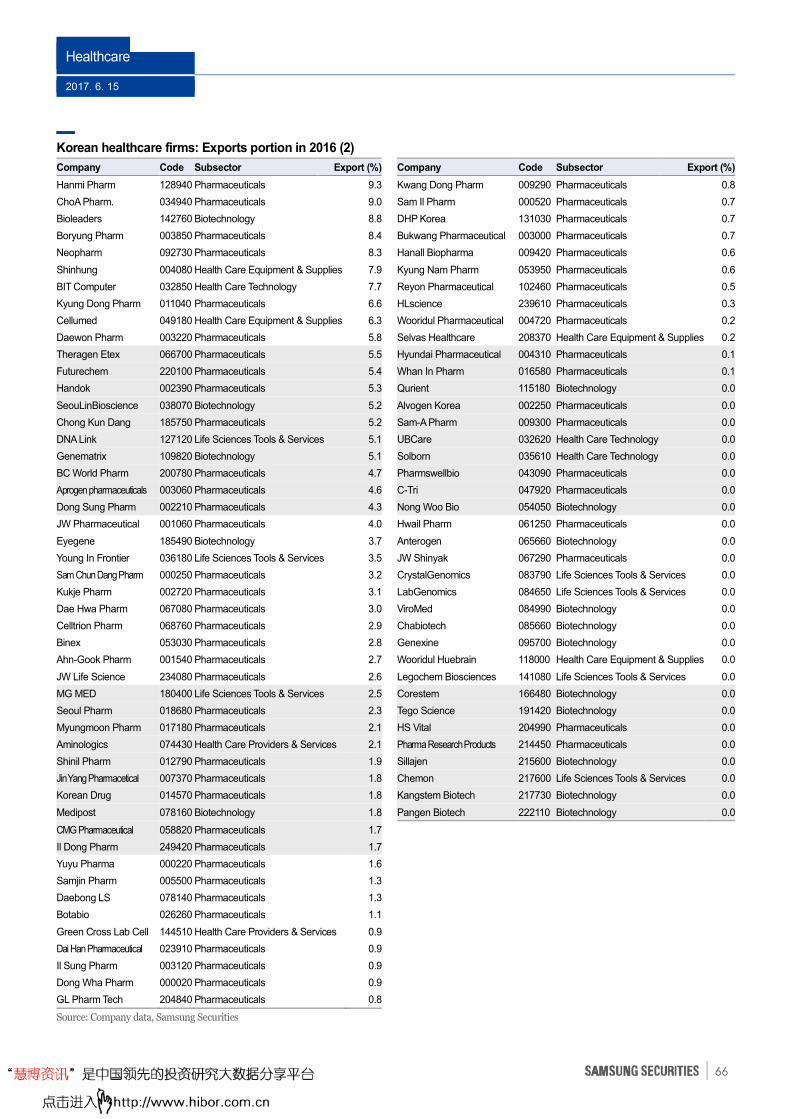
Healthcare
2017. 6. 15
66
Korean healthcare firms: Exports portion in 2016 (2)
Company Code Subsector Export (%) Company Code Subsector Export (%)
Hanmi Pharm 128940 Pharmaceuticals 9.3 Kwang Dong Pharm 009290 Pharmaceuticals 0.8
ChoA Pharm. 034940 Pharmaceuticals 9.0 Sam Il Pharm 000520 Pharmaceuticals 0.7
Bioleaders 142760 Biotechnology 8.8 DHP Korea 131030 Pharmaceuticals 0.7
Boryung Pharm 003850 Pharmaceuticals 8.4 Bukwang Pharmaceutical 003000 Pharmaceuticals 0.7
Neopharm 092730 Pharmaceuticals 8.3 Hanall Biopharma 009420 Pharmaceuticals 0.6
Shinhung 004080 Health Care Equipment & Supplies 7.9 Kyung Nam Pharm 053950 Pharmaceuticals 0.6
BIT Computer 032850 Health Care Technology 7.7 Reyon Pharmaceutical 102460 Pharmaceuticals 0.5
Kyung Dong Pharm 011040 Pharmaceuticals 6.6 HLscience 239610 Pharmaceuticals 0.3
Cellumed 049180 Health Care Equipment & Supplies 6.3 Wooridul Pharmaceutical 004720 Pharmaceuticals 0.2
Daewon Pharm 003220 Pharmaceuticals 5.8 Selvas Healthcare 208370 Health Care Equipment & Supplies 0.2
Theragen Etex 066700 Pharmaceuticals 5.5 Hyundai Pharmaceutical 004310 Pharmaceuticals 0.1
Futurechem 220100 Pharmaceuticals 5.4 Whan In Pharm 016580 Pharmaceuticals 0.1
Handok 002390 Pharmaceuticals 5.3 Qurient 115180 Biotechnology 0.0
SeouLinBioscience 038070 Biotechnology 5.2 Alvogen Korea 002250 Pharmaceuticals 0.0
Chong Kun Dang 185750 Pharmaceuticals 5.2 Sam-A Pharm 009300 Pharmaceuticals 0.0
DNA Link 127120 Life Sciences Tools & Services 5.1 UBCare 032620 Health Care Technology 0.0
Genematrix 109820 Biotechnology 5.1 Solborn 035610 Health Care Technology 0.0
BC World Pharm 200780 Pharmaceuticals 4.7 Pharmswellbio 043090 Pharmaceuticals 0.0
Aprogen pharmaceuticals 003060 Pharmaceuticals 4.6 C-Tri 047920 Pharmaceuticals 0.0
Dong Sung Pharm 002210 Pharmaceuticals 4.3 Nong Woo Bio 054050 Biotechnology 0.0
JW Pharmaceutical 001060 Pharmaceuticals 4.0 Hwail Pharm 061250 Pharmaceuticals 0.0
Eyegene 185490 Biotechnology 3.7 Anterogen 065660 Biotechnology 0.0
Young In Frontier 036180 Life Sciences Tools & Services 3.5 JW Shinyak 067290 Pharmaceuticals 0.0
Sam Chun Dang Pharm 000250 Pharmaceuticals 3.2 CrystalGenomics 083790 Life Sciences Tools & Services 0.0
Kukje Pharm 002720 Pharmaceuticals 3.1 LabGenomics 084650 Life Sciences Tools & Services 0.0
Dae Hwa Pharm 067080 Pharmaceuticals 3.0 ViroMed 084990 Biotechnology 0.0
Celltrion Pharm 068760 Pharmaceuticals 2.9 Chabiotech 085660 Biotechnology 0.0
Binex 053030 Pharmaceuticals 2.8 Genexine 095700 Biotechnology 0.0
Ahn-Gook Pharm 001540 Pharmaceuticals 2.7 Wooridul Huebrain 118000 Health Care Equipment & Supplies 0.0
JW Life Science 234080 Pharmaceuticals 2.6 Legochem Biosciences 141080 Life Sciences Tools & Services 0.0
MG MED 180400 Life Sciences Tools & Services 2.5 Corestem 166480 Biotechnology 0.0
Seoul Pharm 018680 Pharmaceuticals 2.3 Tego Science 191420 Biotechnology 0.0
Myungmoon Pharm 017180 Pharmaceuticals 2.1 HS Vital 204990 Pharmaceuticals 0.0
Aminologics 074430 Health Care Providers & Services 2.1 Pharma Research Products 214450 Pharmaceuticals 0.0
Shinil Pharm 012790 Pharmaceuticals 1.9 Sillajen 215600 Biotechnology 0.0
Jin Yang Pharmacetical 007370 Pharmaceuticals 1.8 Chemon 217600 Life Sciences Tools & Services 0.0
Korean Drug 014570 Pharmaceuticals 1.8 Kangstem Biotech 217730 Biotechnology 0.0
Medipost 078160 Biotechnology 1.8 Pangen Biotech 222110 Biotechnology 0.0
CMG Pharmaceutical 058820 Pharmaceuticals 1.7
Il Dong Pharm 249420 Pharmaceuticals 1.7
Yuyu Pharma 000220 Pharmaceuticals 1.6
Samjin Pharm 005500 Pharmaceuticals 1.3
Daebong LS 078140 Pharmaceuticals 1.3
Botabio 026260 Pharmaceuticals 1.1
Green Cross Lab Cell 144510 Health Care Providers & Services 0.9
Dai Han Pharmaceutical 023910 Pharmaceuticals 0.9
Il Sung Pharm 003120 Pharmaceuticals 0.9
Dong Wha Pharm 000020 Pharmaceuticals 0.9
GL Pharm Tech 204840 Pharmaceuticals 0.8
Source: Company data, Samsung Securities
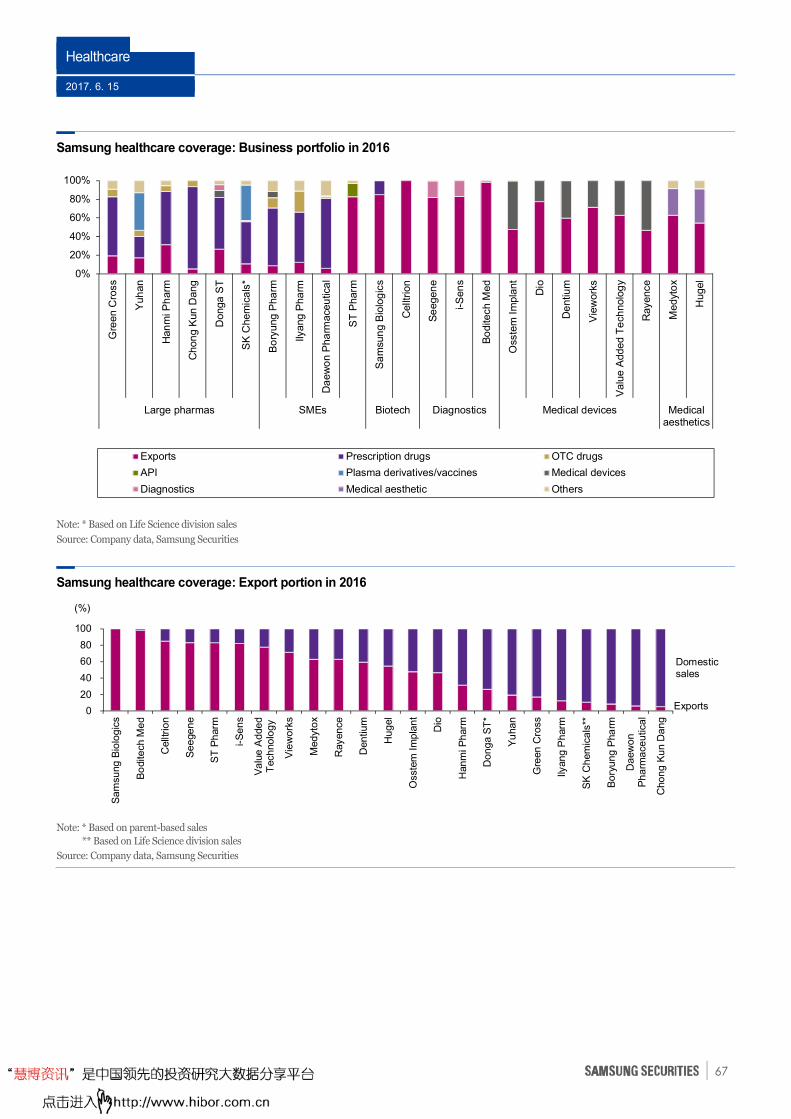
Healthcare
2017. 6. 15
67
Samsung healthcare coverage: Business portfolio in 2016
Note: * Based on Life Science division sales
Source: Company data, Samsung Securities
Samsung healthcare coverage: Export portion in 2016
Note: * Based on parent-based sales
** Based on Life Science division sales
Source: Company data, Samsung Securities
0
20
40
60
80
100
Sa
msu
ng
Bio
log
ics
Bo
dite
ch M
ed
Cellt
rio
n
Se
ege
ne
ST
Ph
arm
i-S
en
s
Va
lue
Ad
de
dT
ech
no
log
y
Vie
wo
rks
Med
yto
x
Rayen
ce
Den
tiu
m
Hu
gel
Osste
m I
mp
lan
t
Dio
Han
mi P
harm
Do
ng
a S
T*
Yu
ha
n
Gre
en
Cro
ss
Ilyan
g P
harm
SK
Ch
em
ica
ls**
Bo
ryu
ng
Pha
rm
Da
ew
on
Ph
arm
ace
utica
l
Cho
ng
Ku
n D
an
g
(%)
Exports
Domestic sales
0%
20%
40%
60%
80%
100%
Gre
en C
ross
Yuh
an
Han
mi P
harm
Chon
g K
un
Dang
Donga
ST
SK
Chem
ica
ls*
Bo
ryung P
ha
rm
Ilyang P
ha
rm
Da
ew
on P
ha
rmace
utic
al
ST
Pharm
Sa
msu
ng B
iolo
gic
s
Cellt
rion
Se
egen
e
i-S
en
s
Bo
dite
ch M
ed
Oss
tem
Im
pla
nt
Dio
De
ntiu
m
Vie
work
s
Valu
e A
dded
Te
chnolo
gy
Rayence
Medyt
ox
Hugel
Large pharmas SMEs Biotech Diagnostics Medical devices Medicalaesthetics
Exports Prescription drugs OTC drugs
API Plasma derivatives/vaccines Medical devices
Diagnostics Medical aesthetic Others
Healthcare
2017. 6. 15
68
Key issues in 2H
Pharmaceutical, biotech, and diagnostics segments
Green Cross’s IVIG-SN up for FDA approval in 2H
Green Cross on Nov 24, 2015 filed for US FDA approval for IVIG-SN. On Nov 22, 2016, the FDA
asked for more data on the manufacturing process for the immunodeficiency-disease treatment. The
company plans to prepare the requested data in 2Q and submit them in 3Q. We expect the product to
be approved in 4Q.
Establishing global value chain: Green Cross is building a global value chain that consists of
running blood collection centers (to secure plasma), operating plants to produce plasma derivatives,
obtaining approval to sell plasma derivatives, having plasma derivatives placed on the formulary lists,
and marketing and selling the products. The company has eight blood collection centers in the US
and seven in China, with plans to raise the respective numbers to 30 and 10 by 2020. The firm’s
Ochang plant #1 and facility in China produce plasma derivatives and have respective capacities of
0.7m and 0.3m liters pa. Its Ochang plant #2, completed in Aug 2016, has an annual capacity of
0.7m liters. Its plant in Canada with annual capacity of 1m liters is set to open in 2019. Green Cross’s
global blood derivatives business should take off once IVIG-SN obtains FDA approval. The company
aims to boost its exports of plasma derivatives and lift its export portion of sales from 10% in 2011
and 20% in 2016 to 30% in 2020.
Contents
1H review: Poverty in the midst of plenty
p2
Pharmaceutical market outlook
p7
Visible progress to be made on R&D and B2B fronts
p32
Government policy warrants attention
p52
Key issues in 2H p68
Solid earnings momentum in 2H
p87
Company p105
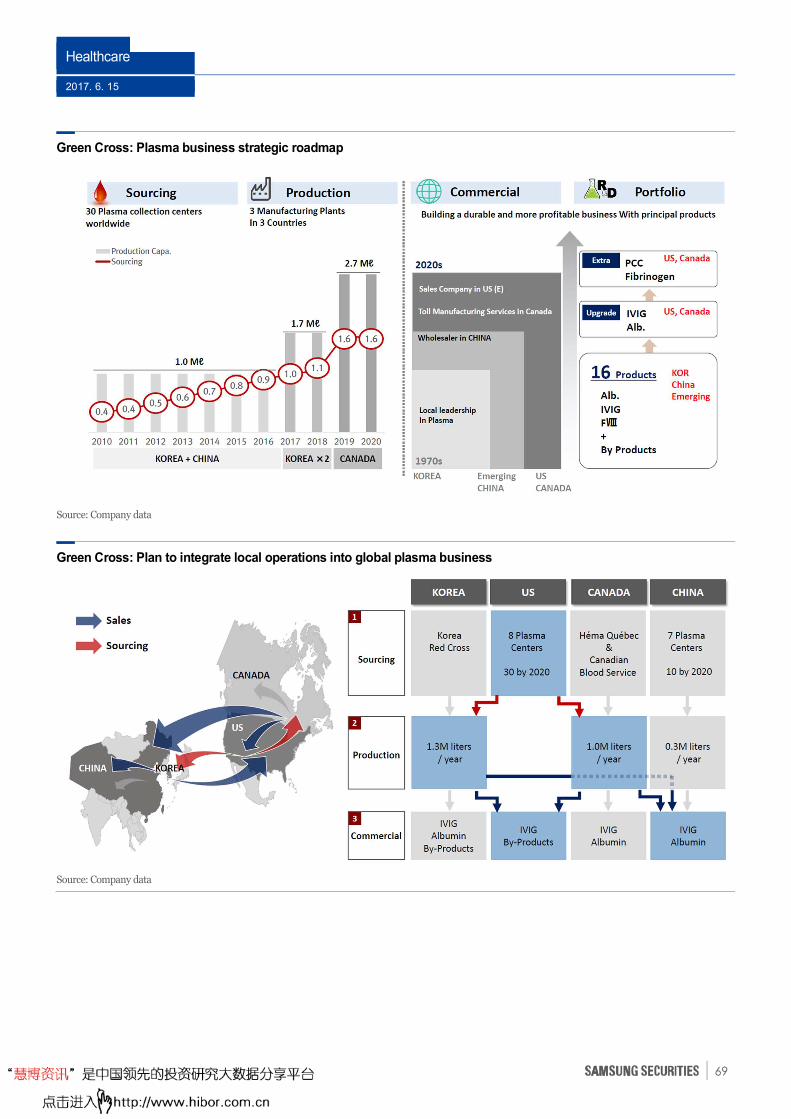
Healthcare
2017. 6. 15
69
Green Cross: Plasma business strategic roadmap
Source: Company data
Green Cross: Plan to integrate local operations into global plasma business
Source: Company data
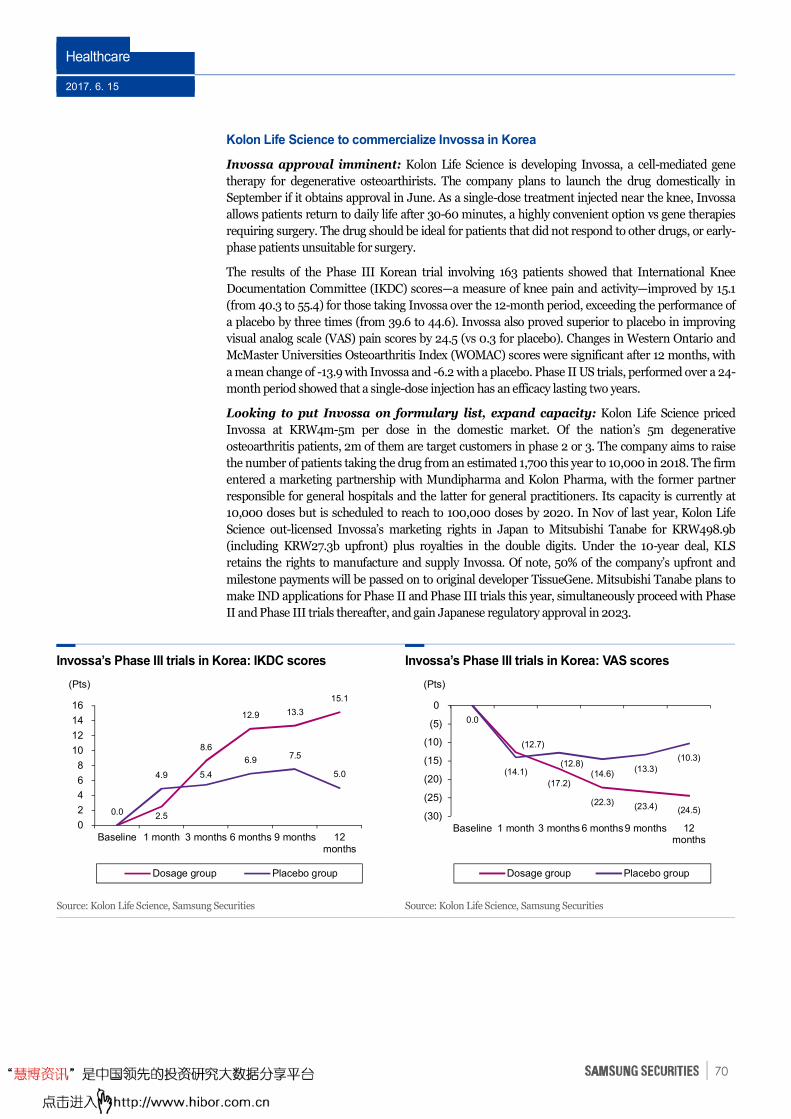
Healthcare
2017. 6. 15
70
Kolon Life Science to commercialize Invossa in Korea
Invossa approval imminent: Kolon Life Science is developing Invossa, a cell-mediated gene
therapy for degenerative osteoarthirists. The company plans to launch the drug domestically in
September if it obtains approval in June. As a single-dose treatment injected near the knee, Invossa
allows patients return to daily life after 30-60 minutes, a highly convenient option vs gene therapies
requiring surgery. The drug should be ideal for patients that did not respond to other drugs, or early-
phase patients unsuitable for surgery.
The results of the Phase III Korean trial involving 163 patients showed that International Knee
Documentation Committee (IKDC) scores—a measure of knee pain and activity—improved by 15.1
(from 40.3 to 55.4) for those taking Invossa over the 12-month period, exceeding the performance of
a placebo by three times (from 39.6 to 44.6). Invossa also proved superior to placebo in improving
visual analog scale (VAS) pain scores by 24.5 (vs 0.3 for placebo). Changes in Western Ontario and
McMaster Universities Osteoarthritis Index (WOMAC) scores were significant after 12 months, with
a mean change of -13.9 with Invossa and -6.2 with a placebo. Phase II US trials, performed over a 24-
month period showed that a single-dose injection has an efficacy lasting two years.
Looking to put Invossa on formulary list, expand capacity: Kolon Life Science priced
Invossa at KRW4m-5m per dose in the domestic market. Of the nation’s 5m degenerative
osteoarthritis patients, 2m of them are target customers in phase 2 or 3. The company aims to raise
the number of patients taking the drug from an estimated 1,700 this year to 10,000 in 2018. The firm
entered a marketing partnership with Mundipharma and Kolon Pharma, with the former partner
responsible for general hospitals and the latter for general practitioners. Its capacity is currently at
10,000 doses but is scheduled to reach to 100,000 doses by 2020. In Nov of last year, Kolon Life
Science out-licensed Invossa’s marketing rights in Japan to Mitsubishi Tanabe for KRW498.9b
(including KRW27.3b upfront) plus royalties in the double digits. Under the 10-year deal, KLS
retains the rights to manufacture and supply Invossa. Of note, 50% of the company’s upfront and
milestone payments will be passed on to original developer TissueGene. Mitsubishi Tanabe plans to
make IND applications for Phase II and Phase III trials this year, simultaneously proceed with Phase
II and Phase III trials thereafter, and gain Japanese regulatory approval in 2023.
Invossa’s Phase III trials in Korea: IKDC scores Invossa’s Phase III trials in Korea: VAS scores
Source: Kolon Life Science, Samsung Securities Source: Kolon Life Science, Samsung Securities
0.0 2.5
8.6
12.9 13.3
15.1
4.9 5.4
6.9 7.5
5.0
0
2
4
6
8
10
12
14
16
Baseline 1 month 3 months 6 months 9 months 12months
Dosage group Placebo group
(Pts)
0.0
(12.7)
(17.2)
(22.3) (23.4) (24.5)
(14.1)(12.8)
(14.6)(13.3)
(10.3)
(30)
(25)
(20)
(15)
(10)
(5)
0
Baseline 1 month 3 months 6 months9 months 12months
Dosage group Placebo group
(Pts)
Healthcare
2017. 6. 15
71
Genexine likely to release positive Phase II trial results
Genexine, a biotech firm specializing in immune and metabolic disease treatment drugs, owns hybrid
Fc fusion protein and DNA vaccine platform technology. The company has six candidates under
Phase II trials and two under Phase I trials. The firm has inked technology alliances with large, Asian
pharmaceutical firms such as Simcere, Tasly, Fosun, and Kalbe.
Likely to release positive phase II trial result for GX-H9: Genexine is developing GX-H9
(hGH-hyFc), an innovative, long-acting recombinant hGH utilizing novel hyFc (hybrid Fc)
technology and intended for once-weekly or twice-monthly administration. The global hGH market
is likely to expand from USD3.5b in 2013 to USD4.7b in 2018, consisting of the pediatric growth
hormone deficiency (86%) and adult growth hormone deficiency (14%) segments. Handok and
Genexine in Jun 2012 signed a technology transfer and joint development contract for GX-H9 and
agreed to split profits equally. The US FDA on Nov 16, 2016 granted GX-H9 an orphan drug
designation for the treatment of growth hormone deficiency, which qualifies the firm for a seven-year
monopoly in that nation. Genexine on Apr 1 at the annual Endocrine Society meeting 2017 released: 1)
positive interim Phase II results regarding impacts on pediatric height; and 2) final Phase II results
for adults. The former relates to data obtained from 24 patients, or 50% of total enrollment, for three
months of the total six months of treatment. Key conclusions from the interim analysis include mean
annualized height velocities of 12.7cm for the once-daily dose; 12.4cm for twice-monthly dose
(receiving 2.4mg/kg), and 10.7 cm and 15.3 cm for the two weekly doses of a respective 0.8 mg/kg
and 1.2mg/kg.
Final Phase II results for the trial on children should be available in Sep 2017, and are likely to
outperform results of rivals. The mean annualized height velocities at six months were 13.4cm for
Pfizer/Opko Health’s MOD-4023, 8.5cm for Versartis’s VRS-317, and 12.9cm for Ascendis’ ACP-001,
with all of those drugs currently under Phase III trials.
GH-H9 vs rival products: Pfizer and Opko Health in Dec 2014 entered into an USD570m
agreement to develop and commercialize the latter’s long-acting hGH MOD-4023 (hGH-CTP) based
on carboxy-terminal peptide. Opko Health received USD295m upfront and should bring in a
USD275m milestone when the drug is approved. The drug is now in Phase III trials. The drug’s low
viscosity makes it easy to develop, but developing a long-acting formulation—beyond its current
once-a-week product—has proven to be difficult. Versartis’s VRS-317 is a long-acting hGH based on
XTEN technology. It is a fusion protein found in E. coli and derived by combining XTEN1 and
XTEN2 with n- and c-terminals. That solubility rises in line with a hike in hydrophile is positive, but
it has limitations such as reduced efficacy, side effects related to the immune system, and difficulties
relating to developing treatments for children. Ascendis Pharma’s ACP-001 is a long-acting hormone
based on TransCon PEG hGH. Because of the use of a polyethylene glycol (PEG), the drug has
limitations related to formulation and toxicity. Novo Nordisk’s NNC-0195-0092 (Phase II) is a hGH
conjugated with an albumin binding moiety. Novo Nordisk dominates the world’s once-daily dose
hGH market, but limitations exist for the product due to the non-specific binding of albumin and
hGH.
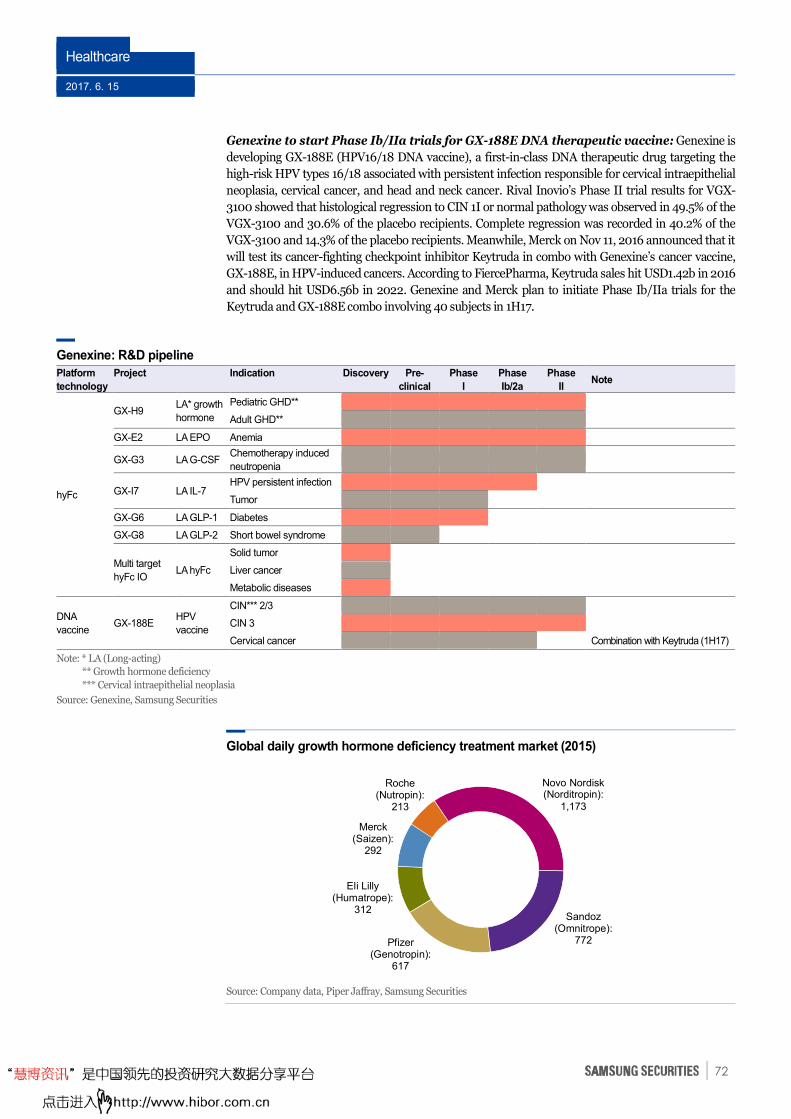
Healthcare
2017. 6. 15
72
Genexine to start Phase Ib/IIa trials for GX-188E DNA therapeutic vaccine: Genexine is
developing GX-188E (HPV16/18 DNA vaccine), a first-in-class DNA therapeutic drug targeting the
high-risk HPV types 16/18 associated with persistent infection responsible for cervical intraepithelial
neoplasia, cervical cancer, and head and neck cancer. Rival Inovio’s Phase II trial results for VGX-
3100 showed that histological regression to CIN 1I or normal pathology was observed in 49.5% of the
VGX-3100 and 30.6% of the placebo recipients. Complete regression was recorded in 40.2% of the
VGX-3100 and 14.3% of the placebo recipients. Meanwhile, Merck on Nov 11, 2016 announced that it
will test its cancer-fighting checkpoint inhibitor Keytruda in combo with Genexine’s cancer vaccine,
GX-188E, in HPV-induced cancers. According to FiercePharma, Keytruda sales hit USD1.42b in 2016
and should hit USD6.56b in 2022. Genexine and Merck plan to initiate Phase Ib/IIa trials for the
Keytruda and GX-188E combo involving 40 subjects in 1H17.
Genexine: R&D pipeline
Platform
technology
Project
Indication
Discovery
Pre-
clinical
Phase
I
Phase
Ib/2a
Phase
II Note
hyFc
GX-H9 LA* growth
hormone
Pediatric GHD** Adult GHD**
GX-E2 LA EPO Anemia GX-G3 LA G-CSF
Chemotherapy induced
neutropenia
GX-I7 LA IL-7 HPV persistent infection Tumor
GX-G6 LA GLP-1 Diabetes GX-G8 LA GLP-2 Short bowel syndrome
Multi target
hyFc IO LA hyFc
Solid tumor Liver cancer Metabolic diseases
DNA
vaccine GX-188E
HPV
vaccine
CIN*** 2/3 CIN 3 Cervical cancer Combination with Keytruda (1H17)
Note: * LA (Long-acting)
** Growth hormone deficiency
*** Cervical intraepithelial neoplasia
Source: Genexine, Samsung Securities
Global daily growth hormone deficiency treatment market (2015)
Source: Company data, Piper Jaffray, Samsung Securities
Novo Nordisk(Norditropin):
1,173
Sandoz(Omnitrope):
772 Pfizer(Genotropin):
617
Eli Lilly(Humatrope):
312
Merck(Saizen):
292
Roche(Nutropin):
213
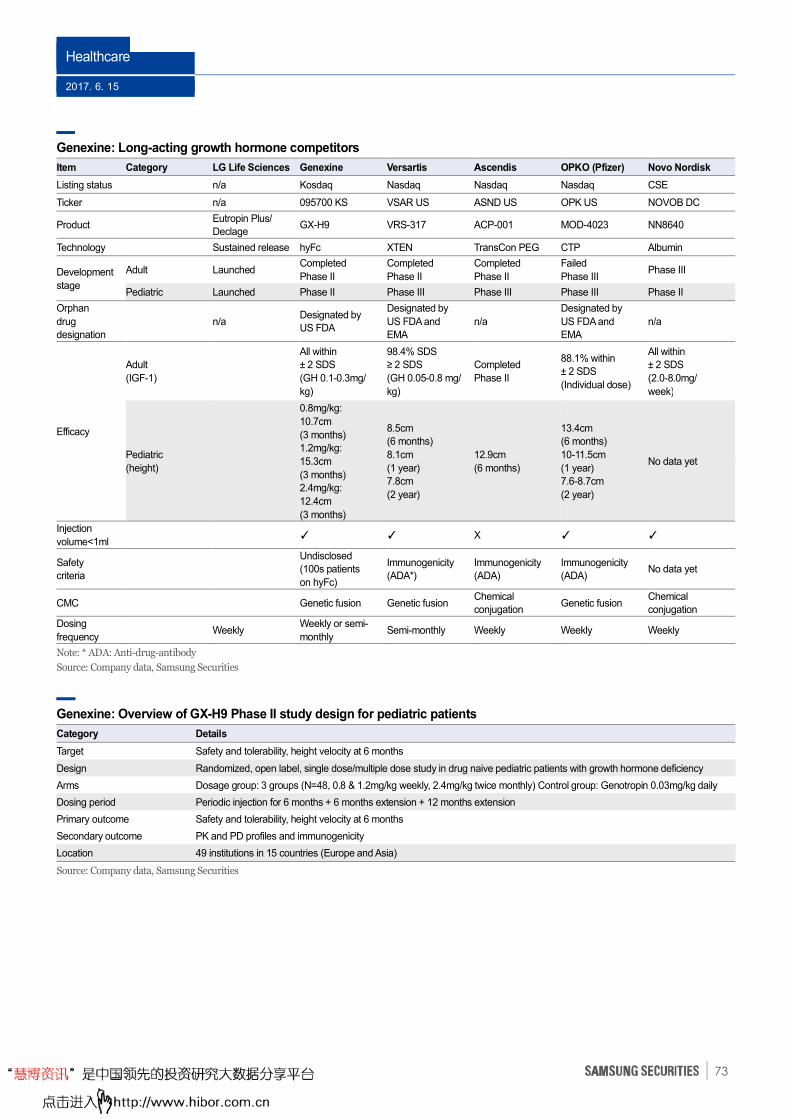
Healthcare
2017. 6. 15
73
Genexine: Long-acting growth hormone competitors
Item Category LG Life Sciences Genexine Versartis Ascendis OPKO (Pfizer) Novo Nordisk
Listing status n/a Kosdaq Nasdaq Nasdaq Nasdaq CSE
Ticker n/a 095700 KS VSAR US ASND US OPK US NOVOB DC
Product Eutropin Plus/
Declage GX-H9 VRS-317 ACP-001 MOD-4023 NN8640
Technology Sustained release hyFc XTEN TransCon PEG CTP Albumin
Development
stage
Adult Launched Completed
Phase II
Completed
Phase II
Completed
Phase II
Failed
Phase III Phase III
Pediatric Launched Phase II Phase III Phase III Phase III Phase II
Orphan
drug
designation
n/a Designated by
US FDA
Designated by
US FDA and
EMA
n/a
Designated by
US FDA and
EMA
n/a
Efficacy
Adult
(IGF-1)
All within
± 2 SDS
(GH 0.1-0.3mg/
kg)
98.4% SDS
≥ 2 SDS
(GH 0.05-0.8 mg/
kg)
Completed
Phase II
88.1% within
± 2 SDS
(Individual dose)
All within
± 2 SDS
(2.0-8.0mg/
week)
Pediatric
(height)
0.8mg/kg:
10.7cm
(3 months)
1.2mg/kg:
15.3cm
(3 months)
2.4mg/kg:
12.4cm
(3 months)
8.5cm
(6 months)
8.1cm
(1 year)
7.8cm
(2 year)
12.9cm
(6 months)
13.4cm
(6 months)
10-11.5cm
(1 year)
7.6-8.7cm
(2 year)
No data yet
Injection
volume<1ml ✓ ✓ X ✓ ✓
Safety
criteria
Undisclosed
(100s patients
on hyFc)
Immunogenicity
(ADA*)
Immunogenicity
(ADA)
Immunogenicity
(ADA) No data yet
CMC Genetic fusion Genetic fusion Chemical
conjugation Genetic fusion
Chemical
conjugation
Dosing
frequency Weekly
Weekly or semi-
monthly Semi-monthly Weekly Weekly Weekly
Note: * ADA: Anti-drug-antibody
Source: Company data, Samsung Securities
Genexine: Overview of GX-H9 Phase II study design for pediatric patients
Category Details
Target Safety and tolerability, height velocity at 6 months
Design Randomized, open label, single dose/multiple dose study in drug naive pediatric patients with growth hormone deficiency
Arms Dosage group: 3 groups (N=48, 0.8 & 1.2mg/kg weekly, 2.4mg/kg twice monthly) Control group: Genotropin 0.03mg/kg daily
Dosing period Periodic injection for 6 months + 6 months extension + 12 months extension
Primary outcome Safety and tolerability, height velocity at 6 months
Secondary outcome PK and PD profiles and immunogenicity
Location 49 institutions in 15 countries (Europe and Asia)
Source: Company data, Samsung Securities
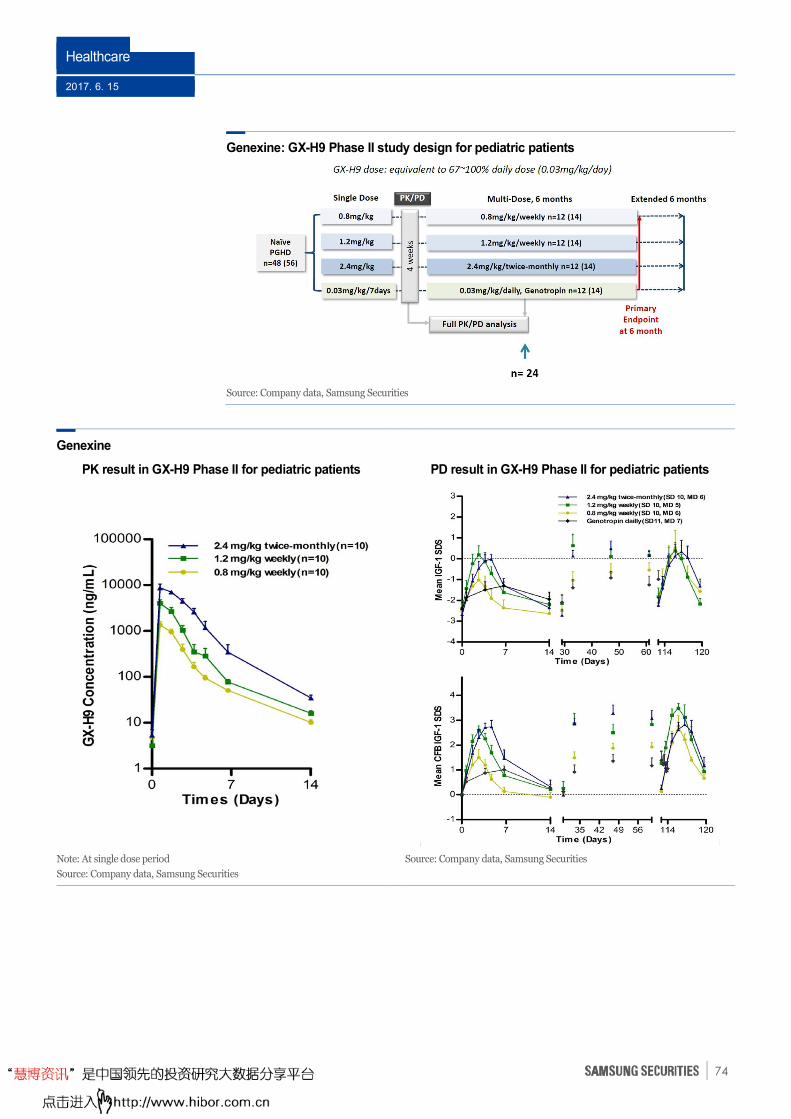
Healthcare
2017. 6. 15
74
Genexine: GX-H9 Phase II study design for pediatric patients
Source: Company data, Samsung Securities
Genexine
PK result in GX-H9 Phase II for pediatric patients PD result in GX-H9 Phase II for pediatric patients
Note: At single dose period
Source: Company data, Samsung Securities
Source: Company data, Samsung Securities
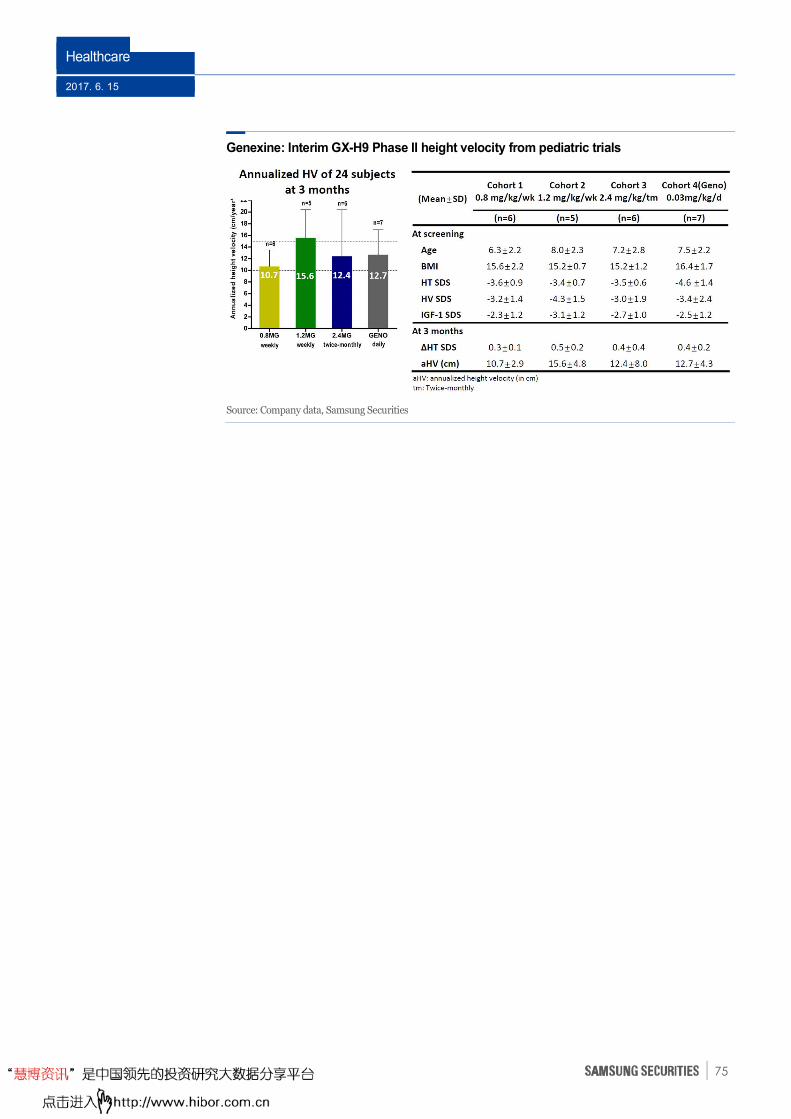
Healthcare
2017. 6. 15
75
Genexine: Interim GX-H9 Phase II height velocity from pediatric trials
Source: Company data, Samsung Securities
Healthcare
2017. 6. 15
76
Qurient to out-license eczema cure Q301 in 2H17
Qurient specializes in allergy and infection treatments, and anti-cancer drugs. The company entered
alliances with Institut Pasteur Korea and Max Planck Institute/Lead Discovery Center to create a
global innovative new drug development network. Qurient develops candidates for innovative drugs
to satisfy unmet medical needs, engages in R&D activities, and out-licenses new drugs. Its R&D
pipeline includes a one candidate in Phase II clinical trials, one in Phase I trials, and three in pre-
clinical development.
Eczema cure Q301 to be out-licensed in 2H17: Qurient is developing Q301, a cure for eczema
(atopic dermatitis), the market for which should grow from USD4.57b in 2016 to USD5.63b in 2022.
Side effects of existing steroid- and calcineurin inhibitor-based treatments include toxic ones, making
long-term administration difficult—ie, there is an unmet medical need. The company’s Q301 is based
on Zyflo (zileuton, 5-lipoxygenase inhibitor), Abbvie’s asthma treatment. The firm has completed
Phase IIa clinical trials for patients with stage 3 or 4 eczema in Feb 2016. Pfizer acquired Anacor in a
May 2016 deal worth USD5.2b to secure Eucrisa (crisaborole), a phosphodiesterase 4 (PDE-4)
inhibitor. The company in Dec 2016 received FDA approval for the drug to treat mild to moderate
eczema in patients aged 2 to 79 years old. Eucrisa is the first eczema treatment released in 15 years
and is priced at USD580/60g (which translates to over USD2b in annual sales). Meanwhile, Sanofi
and Regeneron at end-Mar 2017 acquired FDA approval for Dupixent (dupilumab), an interleukin-4
(IL-4) and IL-13 inhibitor. Dupixent, priced at USD37,000 per year, should generate more than
USD4b in annual sales. Following a series of innovative eczema treatment releases by Pfizer and
Sanofi, Qurient should be able to out-licensee Q301 to the US and Europe in 2H17.
Q203 up for PRV from US FDA: Qurient is also developing Q203 (imidazopyridine amide), a
treatment for drug-resistant tuberculosis. We estimate the market for such a treatment in Russia,
China, and India at a combined USD780m. The drug (now in Phase Ib) at end-Dec 2015 received US
FDA designation as a cure for rare diseases, granting it seven years of exclusivity in the US market.
On completion of Phase II trials, the drug should obtain a greenlight for Phase III clinical trials and is
eligible for a priority review voucher (PRV). The FDA introduced the PRV program to encourage
development of cures for rare and/or neglected diseases. A PRV—which can be sold—allows firms to
have any one of their drugs reviewed under FDA’s priority review system, which offers a reviewing
period of six months. Over 2009-2017, 13 PRVs changed hands for a combined total of
overUSD200m. The firm has one out-licensing deal for Q203 (Russia) and expects to ink more deals
in Korea and Southeast Asia.
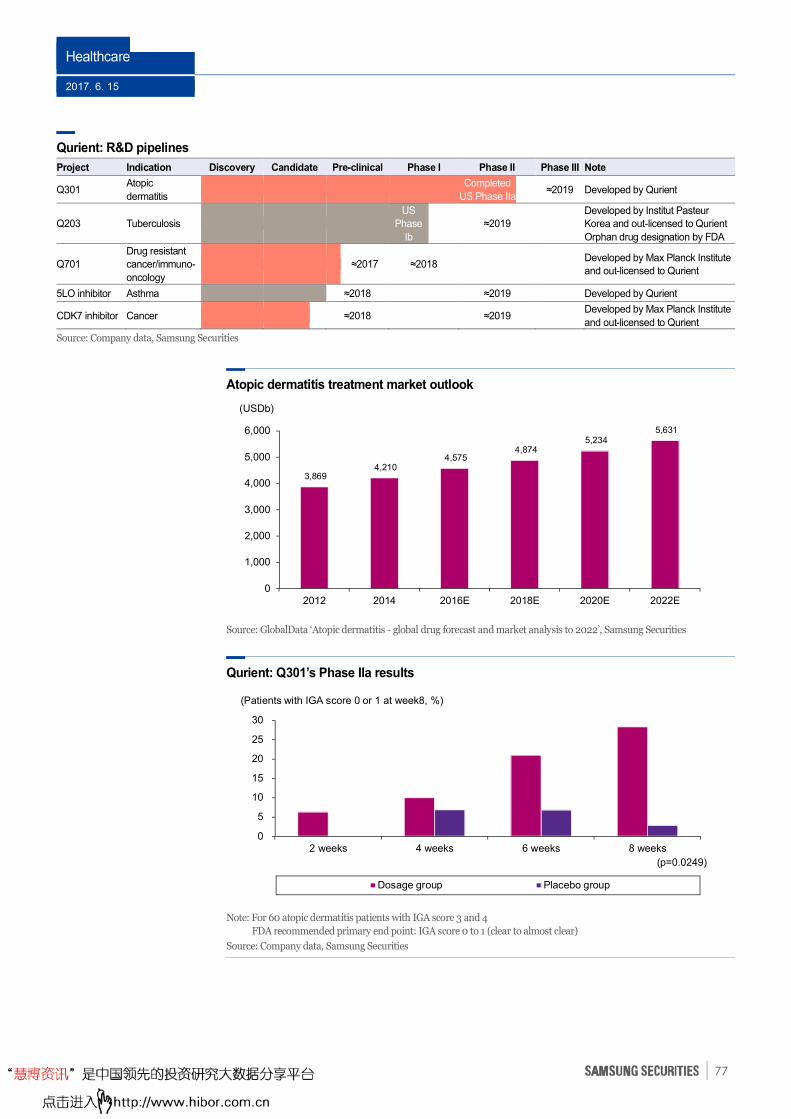
Healthcare
2017. 6. 15
77
Qurient: R&D pipelines
Project Indication Discovery Candidate Pre-clinical Phase I Phase II Phase III Note
Q301 Atopic
dermatitis
Completed
US Phase IIa ≈2019 Developed by Qurient
Q203 Tuberculosis
US
Phase
Ib
≈2019
Developed by Institut Pasteur
Korea and out-licensed to Qurient
Orphan drug designation by FDA
Q701
Drug resistant
cancer/immuno-
oncology
≈2017 ≈2018 Developed by Max Planck Institute
and out-licensed to Qurient
5LO inhibitor Asthma ≈2018 ≈2019 Developed by Qurient
CDK7 inhibitor Cancer ≈2018 ≈2019 Developed by Max Planck Institute
and out-licensed to Qurient
Source: Company data, Samsung Securities
Atopic dermatitis treatment market outlook
Source: GlobalData ‘Atopic dermatitis - global drug forecast and market analysis to 2022’, Samsung Securities
Qurient: Q301’s Phase IIa results
Note: For 60 atopic dermatitis patients with IGA score 3 and 4
FDA recommended primary end point: IGA score 0 to 1 (clear to almost clear)
Source: Company data, Samsung Securities
3,869 4,210
4,575 4,874
5,234 5,631
0
1,000
2,000
3,000
4,000
5,000
6,000
2012 2014 2016E 2018E 2020E 2022E
(USDb)
0
5
10
15
20
25
30
2 weeks 4 weeks 6 weeks 8 weeks
Dosage group Placebo group
(Patients with IGA score 0 or 1 at week8, %)
(p=0.0249)
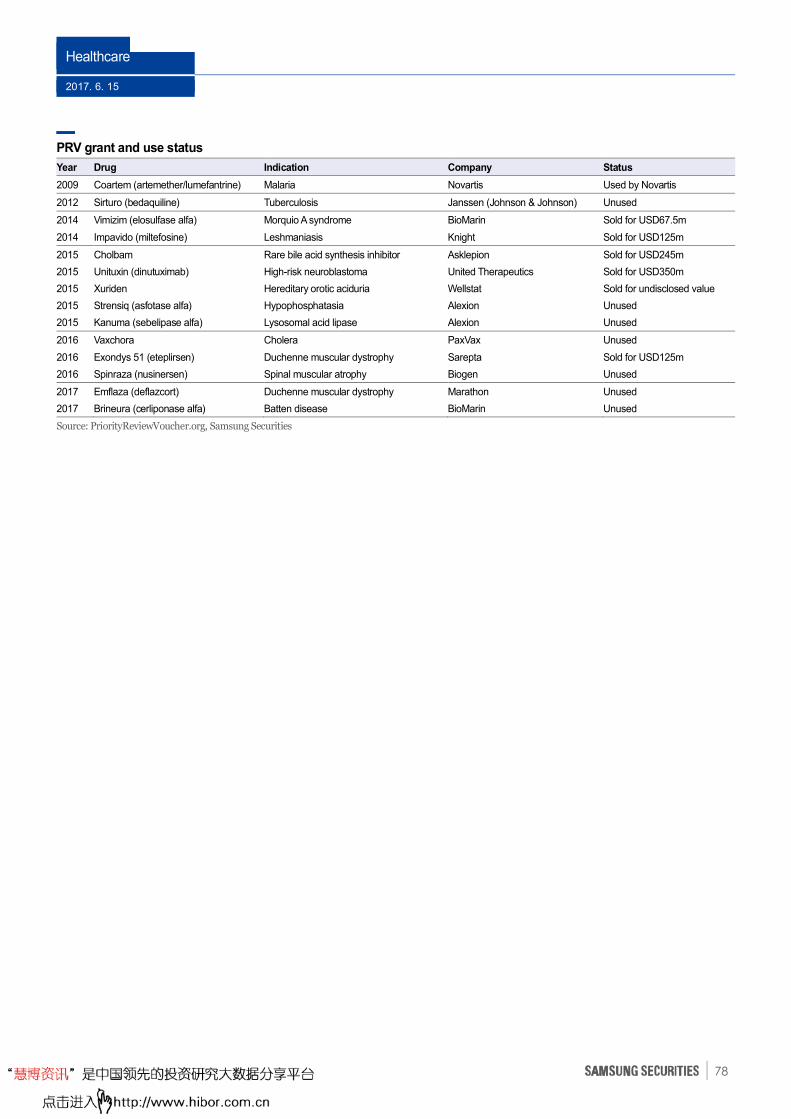
Healthcare
2017. 6. 15
78
PRV grant and use status
Year Drug Indication Company Status
2009 Coartem (artemether/lumefantrine) Malaria Novartis Used by Novartis
2012 Sirturo (bedaquiline) Tuberculosis Janssen (Johnson & Johnson) Unused
2014 Vimizim (elosulfase alfa) Morquio A syndrome BioMarin Sold for USD67.5m
2014 Impavido (miltefosine) Leshmaniasis Knight Sold for USD125m
2015 Cholbam Rare bile acid synthesis inhibitor Asklepion Sold for USD245m
2015 Unituxin (dinutuximab) High-risk neuroblastoma United Therapeutics Sold for USD350m
2015 Xuriden Hereditary orotic aciduria Wellstat Sold for undisclosed value
2015 Strensiq (asfotase alfa) Hypophosphatasia Alexion Unused
2015 Kanuma (sebelipase alfa) Lysosomal acid lipase Alexion Unused
2016 Vaxchora Cholera PaxVax Unused
2016 Exondys 51 (eteplirsen) Duchenne muscular dystrophy Sarepta Sold for USD125m
2016 Spinraza (nusinersen) Spinal muscular atrophy Biogen Unused
2017 Emflaza (deflazcort) Duchenne muscular dystrophy Marathon Unused
2017 Brineura (cerliponase alfa) Batten disease BioMarin Unused
Source: PriorityReviewVoucher.org, Samsung Securities
Healthcare
2017. 6. 15
79
Celltrion Healthcare, Tissuegene set for IPOs in 2H
Celltrion Healthcare on Mar 14, 2017 received an approval of a preliminary screening for its IPO on
the Kosdaq. According to press reports, the IPO price should be KRW33,300-41,000 per share (for a
market cap of KRW3.73t-4.6t), with the issuance of new shares to raise KRW819.3b-1.01t. The
projected price translates to 30.4x-37.4x 2016 P/E, and shares in the OTC market are currently at
KRW43,700 (for a market cap of KRW4.898t). The Korean Institute of Certified Public Accountants
(KICPA) on Mar 13, 2017 decided to conduct an in-depth audit of Celltrion Healthcare’s accounting
practices, pushing back the IPO schedule. KICPA raised questions over the timing of recognition of
interest income (of around KRW10.6b) related to the company’s contracts with overseas distribution
partners. Celltrion Healthcare submitted adjusted financial reports for 2015 on Mar 20. The audit
committee on Jun 1 released its findings which resulted in a light punishment.
Celltrion Healthcare submitted its IPO prospectus and plans to complete the listing by end-July.
Sales trends at the company’s global partners following its IPO in 2H17 should determine the
earnings and share prices at Celltrion.
Tissuegene is planning to apply a preliminary review for its IPO on the Kosdaq. The company is an
overseas entity and thus not subject to special treatments of the Kosdaq—eg, it does not have to
undergo a technology review. Still, the firm is known to have received an AA rating from Technology
Credit Bureau (TCB) for its biologics development capabilities. It plans to commence Phase III trials
of Invossa in the US after completing its IPO in 2H. The 24-month-long, double-blinded randomized
and controlled trial will enroll approximately 1,020 patients with osteoarthritis of the knee. It will
cost around KRW100b, with KRW30b funded by a loan and investment by the Korea Export-Import
Bank and KRW70b in proceeds from the IPO. The company expects to receive FDA approval for the
drug in 2023 as the first disease-modifying osteoarthritis drug marketed for treating osteoarthritis of
the knee.
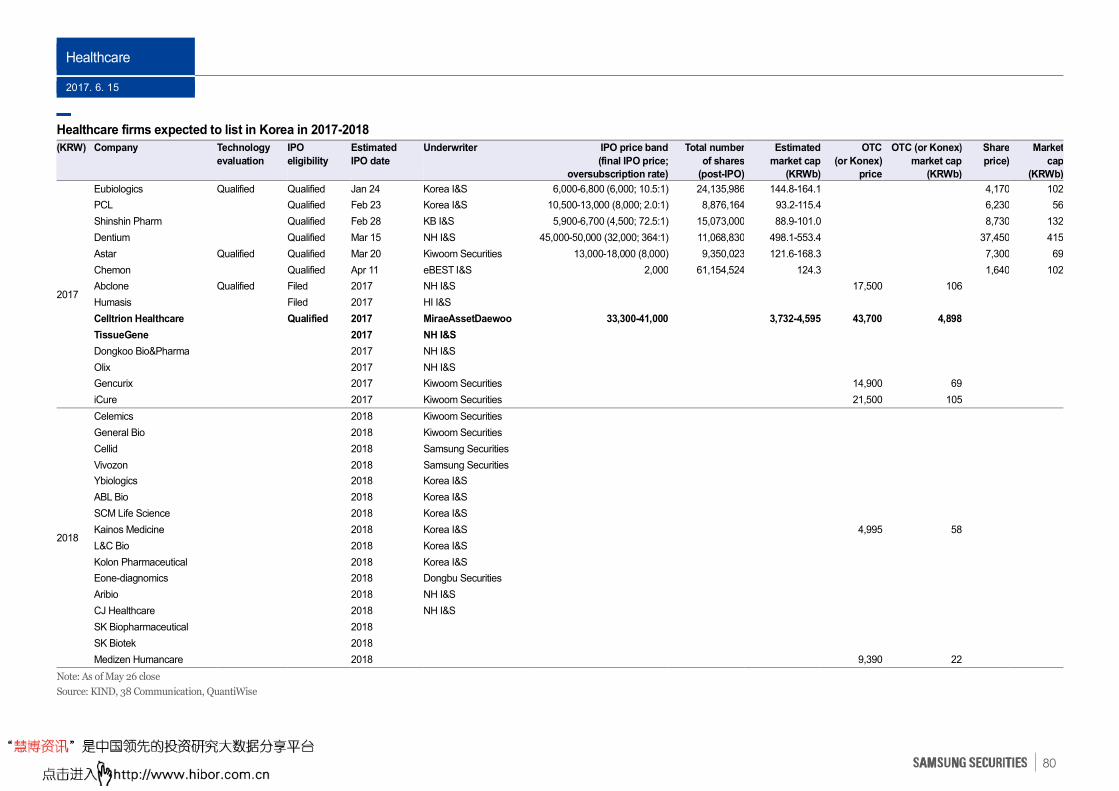
Healthcare
2017. 6. 15
80
Healthcare firms expected to list in Korea in 2017-2018
(KRW)
Company
Technology
evaluation
IPO
eligibility
Estimated
IPO date
Underwriter IPO price band
(final IPO price;
oversubscription rate)
Total number
of shares
(post-IPO)
Estimated
market cap
(KRWb)
OTC
(or Konex)
price
OTC (or Konex)
market cap
(KRWb)
Share
price)
Market
cap
(KRWb)
2017
Eubiologics Qualified Qualified Jan 24 Korea I&S 6,000-6,800 (6,000; 10.5:1) 24,135,986 144.8-164.1 4,170 102
PCL Qualified Feb 23 Korea I&S 10,500-13,000 (8,000; 2.0:1) 8,876,164 93.2-115.4 6,230 56
Shinshin Pharm Qualified Feb 28 KB I&S 5,900-6,700 (4,500; 72.5:1) 15,073,000 88.9-101.0 8,730 132
Dentium Qualified Mar 15 NH I&S 45,000-50,000 (32,000; 364:1) 11,068,830 498.1-553.4 37,450 415
Astar Qualified Qualified Mar 20 Kiwoom Securities 13,000-18,000 (8,000) 9,350,023 121.6-168.3 7,300 69
Chemon Qualified Apr 11 eBEST I&S 2,000 61,154,524 124.3 1,640 102
Abclone Qualified Filed 2017 NH I&S 17,500 106
Humasis Filed 2017 HI I&S
Celltrion Healthcare Qualified 2017 MiraeAssetDaewoo 33,300-41,000 3,732-4,595 43,700 4,898
TissueGene 2017 NH I&S
Dongkoo Bio&Pharma 2017 NH I&S
Olix 2017 NH I&S
Gencurix 2017 Kiwoom Securities 14,900 69
iCure 2017 Kiwoom Securities 21,500 105
2018
Celemics 2018 Kiwoom Securities
General Bio 2018 Kiwoom Securities
Cellid 2018 Samsung Securities
Vivozon 2018 Samsung Securities
Ybiologics 2018 Korea I&S
ABL Bio 2018 Korea I&S
SCM Life Science 2018 Korea I&S
Kainos Medicine 2018 Korea I&S 4,995 58
L&C Bio 2018 Korea I&S
Kolon Pharmaceutical 2018 Korea I&S
Eone-diagnomics 2018 Dongbu Securities
Aribio 2018 NH I&S
CJ Healthcare 2018 NH I&S
SK Biopharmaceutical 2018
SK Biotek 2018
Medizen Humancare 2018 9,390 22
Note: As of May 26 close
Source: KIND, 38 Communication, QuantiWise
Healthcare
2017. 6. 15
81
Major issues involving pharmaceutical SMEs and API makers
Viread and Tamiflu generics to launch in 2H after related patents expire
Viread to go off patent in Nov 2017: Outpatient prescription sales of Gilead’s hepatitis B
treatment Viread (tenofovir) grew 23% y-y to KRW154.1b in 2016, becoming the second biggest item
in the domestic prescription drug market. Sales hit KRW39.9b in 1H17, taking top spot from Pfizer’s
hyperlipidemia treatment Lipitor (atorvastatin). With Viread to go off patent on Nov 9, 2017 (in
terms of drug substance) and in Nov 2018 (in composition), around 20 pharmaceutical companies
plan to launch generics in Nov 2017 (provided they overcome the composition patent by winning
related lawsuits). Of note, outpatient prescription sales of BMS’s hepatitis B treatment Baraclude
(entecavir), which went off patent in 2015, plunged by around 50% from KRW193.1b in 2014 to
KRW97.4b in 2016. We thus expect top-tier pharmaceutical SMEs, which are set to launch Viread
generics, to see sales grow.
Tamiflu to lose patent protection in Aug 2017: Sales of Roche’s Tamiflu (oseltamivir) hit
KRW59.1b in 2016 (up 95% y-y), their highest figure since the drug launched in 2001. Tamiflu is an
anti-viral used to treat and prevent influenza A and B. Hanmi Pharm’s Hanmiflu is a supergeneric,
which launched in Korea on Feb 27, 2016 after having avoid the salt patent on original Tamiflu.
Hanmiflu sales reached KRW14.8b in 2016, and the drug’s share of the prescription market hit 54.9%
in the first week of Dec 2016 (topping Tamiflu’s shares) after Korea’s health authorities issued a flu
warning early in the month. When the Tamiflu salt loses patent protection on Aug 23, 2017, some 30
pharmaceutical companies are expected to launch generic versions. The flu treatment market grew to
KRW74b in 2016 thanks to the influenza pandemic last year. Influenza antiviral drug shortages
during the pandemic has led to an increase in demand for steady inventories, which bodes well for
further growth.
Export markets to expand; global clinical trials to start; to add overseas customers in 2H
Boryung, Ilyang to export in-house-developed new drugs to more countries in 2H:
Boryung Pharmaceutical should begin exporting its in-house-developed hypertension drug Kanarb
(fimasartan) to Russia and Southeast Asia in 2017. Although such exports should have little impact
on the firm’s overall sales, we are encouraged that the firm is adding exports destination markets
(having only exported to Mexico last year). The company should land more export contracts for
Kanarb-based combination drugs Dukarb (fimasartan + amlodipine) and Tuvero (fimasartan +
rosuvastatin), both of which launched in 2016. Meanwhile, Ilyang Pharmaceutical should begin
initial shipments of its in-house-developed gastroesophageal reflux disease treatment Noltec and
leukemia treatment Supect to Latin America and the Middle East. Noltec is increasing its share of the
domestic proton pump inhibitor (PPI) market, and its Supect sales have been increasing gradually
since the drug was approved as a first-line chronic myeloid leukemia treatment at end-2015. Rising
sales of high-margin, in-house-developed new drugs should contribute to longer-term profitability
improvement.
Huons to start global trials for BTX and new eye drop for dry-eye syndrome in 2H:
Huons should begin Phase 3 clinical trials for its BTX Hutox in Korea and the US in 2H17. It plans to
launch the product in Korea in early 2019 and the US possibly as soon as 2020. Having obtained an
export license in Aug 2016 from Korea’s Ministry of Food and Drug Safety, Huons commenced
exports of Hutox to Southeast Asia, the Middle East, and Latin America in Oct 2016. Hutox exports
hit KRW2.3b in 4Q16 and should grow to KRW12b in 2017. Meanwhile, Huons plans to begin Phase
2 clinical trials for its in-house-developed eye drop for dry-eye syndrome in 2H17. Rising costs
associated with trials should drive operating profit down this year, but shares should enjoy significant
momentum from the firm’s entry into the fast-growing BTX market and late-phase clinical trials
overseas.
Healthcare
2017. 6. 15
82
Key issues for medical aesthetics sector
Hugel to beef up global operation in 2H with newly raised capital
Tapping into global network: Hugel on Apr 17 signed a term sheet with Bain Capital outlining a
deal that would grant control to the global top-ten private equity fund. Considering Bain Capital’s
extensive global network and management capability, Hugel’s overseas strategy stands to benefit.
Hugel earned KRW454.7b in proceeds from the deal, which it should use to: 1) strengthen its
distribution network in the US by securing a global pharma as a partner; 2) establish local
subsidiaries and acquire local distributors in key markets, thus helping boost its ASP; and 3) increase
its stake in filler-making subsidiary Across, thus boosting its net margin (attributable to controlling
shareholders).
Expected to sign BTX supply deal with US multinational pharma: Hugel plans to take
back US sales rights for its Botulax (a glabellar line treatment) from Croma Pharmaceuticals, its
business partner in North America, Europe, and Australia, and sign a new contract with a new
multinational. The firm needs KRW100b to terminate the deal with Croma, which is currently
conducting Phase III trials for Botulax in the US and Europe (involving 90 subjects). Considering
Bain Capital’s global network and the BTX market’s solid growth, we expect many multinationals to
show interest in acquiring the rights. We expect Hugel to sign a Botulax supply contract with a US
pharmaceutical company in 2H. In Europe, considering the capability of Stada, Germany’s third
largest generic firm (which Bain Capital took over in April), Hugel has likely already secured an
extensive distribution network there.
To make acquisitions to establish direct overseas network: Hugel distributes products via
partners in each country—at a price that is just half what physicians pay to distribution firms. Thus, if
the firm can secure a direct distribution network with physicians, its ASP could double. Hugel plans
to acquire overseas distribution firms that have strong relationships with plastic surgery clinics or
pharmaceutical companies—a move that should boost its profitability over the longer term.
To increase stake in subsidiary Across: Across is Hugel’s filler-maker subsidiary (52.2%
stake). In 2016, Across saw sales, operating profit, net profit, operating margin and net margin rise
34.7%, 36.9%, 40.8%, 1%pt, and 2.3%pts y-y, respectively, to KRW30.9b, KRW18.4b, KRW16.4b,
59.4%, and 53.2%. Hugel announced that it will use some of the proceeds from its deal with Bain
Capital to increase its stake in Across. This should dissipate concerns that the stake in the subsidiary
will be diluted if Across goes public in 2018. The stake expansion should also boost Hugel’s net
margin attributable to controlling interests. Considering the potential synergies between BTX and
filler products, Bain Capital is unlikely to take Across public. Hugel’s financial statement has the
following footnote, ‘Hugel must collaborate with Across’ second-largest shareholder STIC Investment
(19.3%) and take all reasonable measures to take Across public by Sep 2019. If Hugel violates this,
STIC Investment has the right to request Hugel buy all or some of its stake in Across’. This indicates
that Hugel may have to acquire some or all of STIC Investment’s stake in Across.
Medytox’s capacity shortage to be resolved in 2H
Earnings momentum strong; plant #3 wins domestic approval: Medytox partially
resolved its capacity shortage issue, as its #3 plant on Dec 19, 2016 won KGMP and export approval.
Currently, the firm ships output from its #3 plant to nations that do not require separate approval,
such as Japan and some countries in Southeast Asia and Latin America. As the plant’s output
recently won domestic approval, the firm’s BTX capacity shortage should be fully resolved in 3Q.
Healthcare
2017. 6. 15
83
Major issues in medical-device industry
Measures to expand dental implant insurance coverage to become visible in 2H
Concerns over slowing growth in domestic implant market to ease: On the campaign
trail, Moon Jae-in—now president—pledged to: 1) lower per-tooth implant costs for patients from
KRW600,000 to KRW300,000; and 2) gradually increase the number of teeth subject to implant
coverage (from two currently). We expect follow-ups to these pledges to become visible in 2H. With
implant coverage having expanded steadily (from those aged 75 and over in Jul 2014 to those aged 70
and over in Jul 2015 to those aged 65 and over in Jul 2016), the combined domestic implant sales of
Osstem Implant, Dentium, and Dio hit KRW112b in 2014 (up 14% y-y), KRW141.4b in 2015 (up 26.2%
y-y), and KRW169.9b in 2016 (up 20.2% y-y). We expect this figure to hit KRW191.6b in 2017 (up
12.8% y-y) and KRW211.6b in 2018 (up 10.4% y-y), which figures are subject to upwards revisions if
the president follows through on his campaign pledges. We estimate that the domestic implant
market will grow 15-20% pa over the next two to three years if insurance coverage expands.
Vieworks to land dynamic detector supply contracts in 2H
Vieworks to be world’s third firm to commercialize TFT-based dynamic detectors:
Dynamic detectors are indispensable for radiography fluoroscopy (used in gastrointestinalgraphy,
angiography, and C-arm for noninvasive anesthesia or orthopedic surgeries) and computed
tomography (CT). Like detectors that generate still images (eg, flat panel-digital radiography
detectors: FP-DRs), those that generate moving images (RF) can also be classified into CMOS and
TFT. In the past, when TFT detectors could not produce high-resolution images with small doses of
radiation, CMOS detectors were widely used for their fast retakes. However, recent advances in TFT
detector technology have minimized image noise, allowing high-resolution images at low radiation
doses. Also, TFT’s lower cost per area (vs CMOS) makes them more suitable for large-area imaging.
We expect TFT-based dynamic detectors to become the gold standard in fluoroscopy and the CT
market. Currently, Varex Imaging and Trixell are the only companies that have commercialized TFT-
based dynamic detectors. We find the dynamic detector market more attractive than the FP-DR
market given less downward pressure on ASPs. Vieworks in 2H should become the third company in
the world to commercialize TFT-based dynamic detectors. The global dynamic detector market is
estimated to be sized at KRW300b-KRW400b and should grow approximately 5% pa through 2020.
Dynamic detectors to serve as another cash cow within three years: Vieworks
completed development of dynamic detectors early this year and is known to be in talks to supply
products to a number of radiography fluoroscopy (RF) system companies. The global RF system
market is controlled by General Electronics, Siemens, and Philips. Admittedly, it is difficult for a
detector manufacturer (other than Varex Imaging, Trixell, and Canon) to win supply contracts with
major system firms. However, we believe Vieworks has a strong chance of landing B2B supply
contracts in 2H given that: 1) it has a track record of more than five years in the FP-DR market; and 2)
only two companies have so far managed to commercialize TFT-based dynamic detectors. Our
earnings model currently has Vieworks’ dynamic detector sales (including CCD-RF) hitting
KRW9.9b in 2017 (up 106.4% y-y) and KRW21.8b in 2018 (up 120% y-y)—figure we believe to be
conservative given that the firm’s FP-DR sales hit KRW14.9b in their first year rose 97.1% to
KRW29.5b the following year. Dynamic detectors should bolster profitability, as they have ASPs 1.5x
those of still-image detectors but similar COGS. If the firm signs a large supply contract for dynamic
detectors, it will dissipate concerns over slower growth in still-image detector sales.
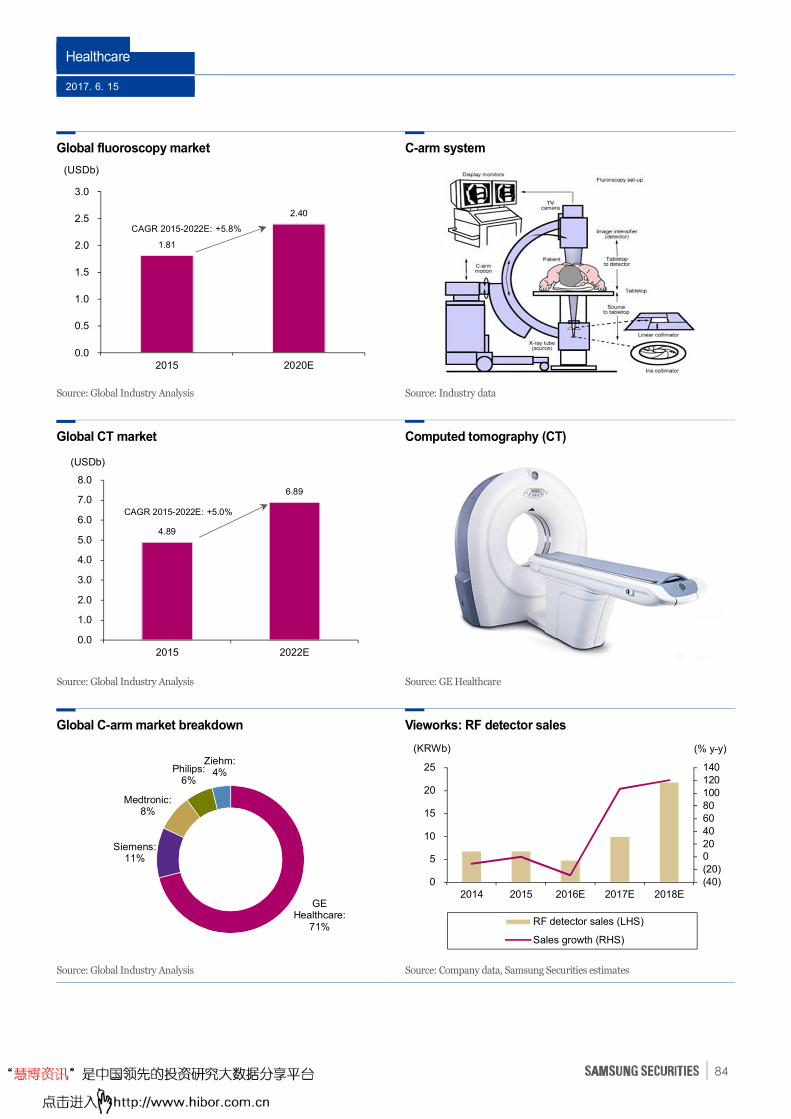
Healthcare
2017. 6. 15
84
Global fluoroscopy market C-arm system
Source: Global Industry Analysis
Source: Industry data
Global CT market Computed tomography (CT)
Source: Global Industry Analysis
Source: GE Healthcare
Global C-arm market breakdown Vieworks: RF detector sales
Source: Global Industry Analysis Source: Company data, Samsung Securities estimates
GE Healthcare:
71%
Siemens:11%
Medtronic:8%
Philips:6%
Ziehm:4%
(40)(20)020406080100120140
0
5
10
15
20
25
2014 2015 2016E 2017E 2018E
(% y-y)(KRWb)
RF detector sales (LHS)
Sales growth (RHS)
1.81
2.40
0.0
0.5
1.0
1.5
2.0
2.5
3.0
2015 2020E
(USDb)
CAGR 2015-2022E: +5.8%
4.89
6.89
0.0
1.0
2.0
3.0
4.0
5.0
6.0
7.0
8.0
2015 2022E
(USDb)
CAGR 2015-2022E: +5.0%
Healthcare
2017. 6. 15
85
Vatech to obtain China approval for Green Smart in 3Q
China’s dental x-ray imaging systems market growing quickly: China’s dental x-ray
imaging systems market—worth USD220m in 2015—is set to grow at a 2015-2020 CAGR of 15.6%.
Leading global players have an oligopoly in China: Dentsply Sirona, Vatech, and Hefei Meiya
Optoelectronic Technology each have 20% of the market (in terms of volume), while Planmeca,
Carestream, and Danaher have 10-15% apiece.
Sales contribution from China subsidiary surge in 2016: Vatech’s sales in China reached
KRW15.4b in 2015 but rose only 16.8% y-y to KRW18b in 2016. Sales at its Chinese subsidiary surged
119.3% y-y to KRW16.4b in 2016, partly because the parent handed over its sales business to the
subsidiary, but mainly thanks to surging sales of Green 3D, which received local sales approval in
2Q16. If Green Smart receives approval in 3Q17, Vatech’s China sales should further accelerate. The
China subsidiary is eligible to manufacture Green 2D (approved in 2H14) but should soon win
approval to manufacture Green 3D as well.
Green Smart makes a splash: In Sep 2014, Vatech launched its Green Smart imaging system
(formerly PaX-i3D Smart) domestically, and despite using just two x-ray detectors—for panoramic,
CT, and cephalometric imaging—the device can produce 2D and 3D images on par with those
generated by CBCT systems that require three detectors. This means the system’s detectors cost just
two-thirds those of CBCT systems, so the system’s ASP is also lower. While Vatech’s regular 3D
imaging systems is priced at USD50,000-60,000/unit (10-20% lower than rivals’ offerings), the
Green Smart system sells for USD40,000/unit. In addition to price competitiveness, Green Smart
requires only one round of filming to capture 2D and 3D images—whereas CBCT systems require two
rounds of filming to accomplish this—which increases convenience for users and patients. Green
Smart was central to Vatech’s domestic market share, which jumped from 50-60% in 1H14 to 78% by
end-2015.
Export growth for Green Smart strong: Green Smart made a significant contribution to
Vatech’s domestic top-line growth. In 2H15, the firm began to export it to Europe (after having
obtained CE approval in 3Q15), where it made KRW8.4b in sales in that half. Exports shot up 263.6%
y-y to KRW30.6b in 2016, backed by US-bound shipments from 2Q16. The Green Smart portion of
Vatech’s 3D imaging device exports leapt from 26% in 2H15 to 40% in 2016.
Green Smart approval to take China sales to new heights: Competitively priced, Green
Smart mainly targets buyers in China and other EMs who have relatively low purchasing power.
Green Smart is dominant in Korea—which has the world’s highest CBCT system penetration—and
the system should be a hit in China once its sale is approved in 3Q. We expect Vatech’s 3D imaging
device exports to jump 26% this year to KRW96.4b.
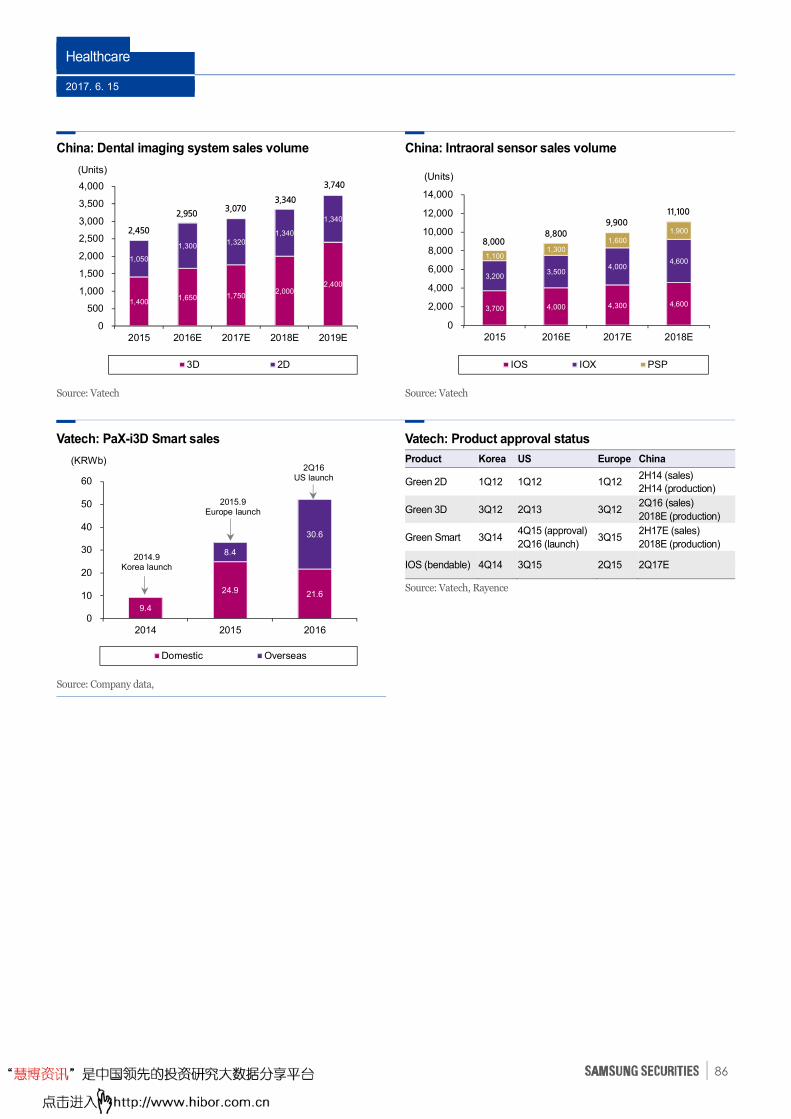
Healthcare
2017. 6. 15
86
China: Dental imaging system sales volume China: Intraoral sensor sales volume
Source: Vatech
Source: Vatech
Vatech: PaX-i3D Smart sales Vatech: Product approval status
Product Korea US Europe China
Green 2D 1Q12 1Q12 1Q12 2H14 (sales)
2H14 (production)
Green 3D 3Q12 2Q13 3Q12 2Q16 (sales)
2018E (production)
Green Smart 3Q14 4Q15 (approval)
2Q16 (launch) 3Q15
2H17E (sales)
2018E (production)
IOS (bendable) 4Q14 3Q15 2Q15 2Q17E
Source: Vatech, Rayence
Source: Company data,
1,400 1,650 1,750
2,000 2,400
1,050
1,300 1,320
1,340
1,340
0
500
1,000
1,500
2,000
2,500
3,000
3,500
4,000
2015 2016E 2017E 2018E 2019E
(Units)
3D 2D
2,450
2,9503,070
3,340
3,740
3,700 4,000 4,300 4,600
3,200 3,500
4,000 4,600
1,100 1,300
1,600
1,900
0
2,000
4,000
6,000
8,000
10,000
12,000
14,000
2015 2016E 2017E 2018E
(Units)
IOS IOX PSP
8,0008,800
9,90011,100
9.4
24.9 21.6
8.4
30.6
0
10
20
30
40
50
60
2014 2015 2016
(KRWb)
Domestic Overseas
2014.9 Korea launch
2015.9 Europe launch
2Q16 US launch
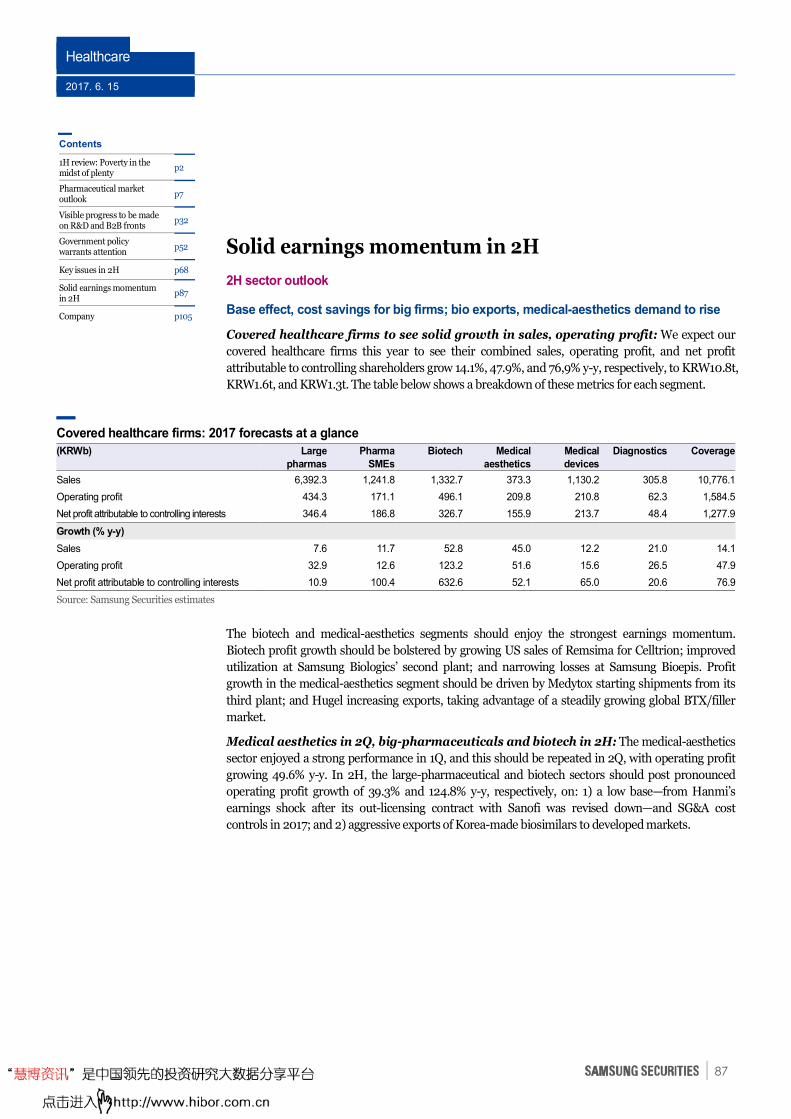
Healthcare
2017. 6. 15
87
Solid earnings momentum in 2H
2H sector outlook
Base effect, cost savings for big firms; bio exports, medical-aesthetics demand to rise
Covered healthcare firms to see solid growth in sales, operating profit: We expect our
covered healthcare firms this year to see their combined sales, operating profit, and net profit
attributable to controlling shareholders grow 14.1%, 47.9%, and 76,9% y-y, respectively, to KRW10.8t,
KRW1.6t, and KRW1.3t. The table below shows a breakdown of these metrics for each segment.
Covered healthcare firms: 2017 forecasts at a glance
(KRWb)
Large
pharmas
Pharma
SMEs
Biotech Medical
aesthetics
Medical
devices
Diagnostics Coverage
Sales 6,392.3 1,241.8 1,332.7 373.3 1,130.2 305.8 10,776.1
Operating profit 434.3 171.1 496.1 209.8 210.8 62.3 1,584.5
Net profit attributable to controlling interests 346.4 186.8 326.7 155.9 213.7 48.4 1,277.9
Growth (% y-y)
Sales 7.6 11.7 52.8 45.0 12.2 21.0 14.1
Operating profit 32.9 12.6 123.2 51.6 15.6 26.5 47.9
Net profit attributable to controlling interests 10.9 100.4 632.6 52.1 65.0 20.6 76.9
Source: Samsung Securities estimates
The biotech and medical-aesthetics segments should enjoy the strongest earnings momentum.
Biotech profit growth should be bolstered by growing US sales of Remsima for Celltrion; improved
utilization at Samsung Biologics’ second plant; and narrowing losses at Samsung Bioepis. Profit
growth in the medical-aesthetics segment should be driven by Medytox starting shipments from its
third plant; and Hugel increasing exports, taking advantage of a steadily growing global BTX/filler
market.
Medical aesthetics in 2Q, big-pharmaceuticals and biotech in 2H: The medical-aesthetics
sector enjoyed a strong performance in 1Q, and this should be repeated in 2Q, with operating profit
growing 49.6% y-y. In 2H, the large-pharmaceutical and biotech sectors should post pronounced
operating profit growth of 39.3% and 124.8% y-y, respectively, on: 1) a low base—from Hanmi’s
earnings shock after its out-licensing contract with Sanofi was revised down—and SG&A cost
controls in 2017; and 2) aggressive exports of Korea-made biosimilars to developed markets.
Contents
1H review: Poverty in the midst of plenty
p2
Pharmaceutical market outlook
p7
Visible progress to be made on R&D and B2B fronts
p32
Government policy warrants attention
p52
Key issues in 2H p68
Solid earnings momentum in 2H
p87
Company p105
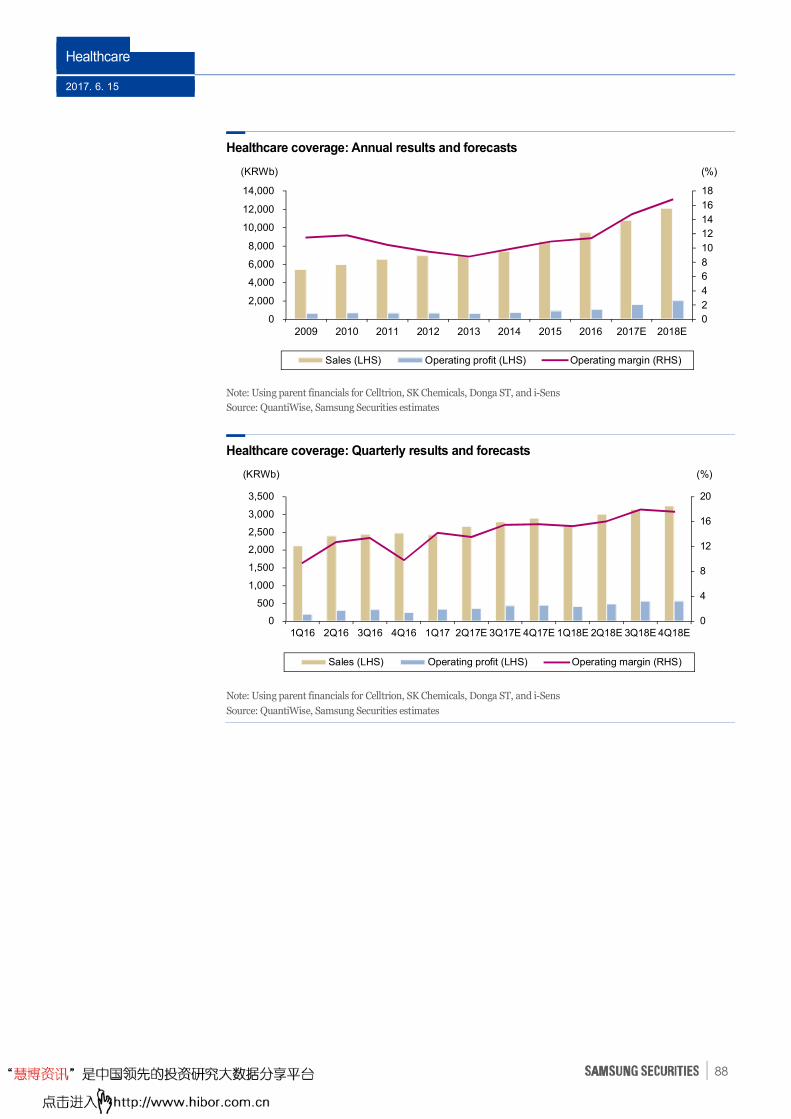
Healthcare
2017. 6. 15
88
Healthcare coverage: Annual results and forecasts
Note: Using parent financials for Celltrion, SK Chemicals, Donga ST, and i-Sens
Source: QuantiWise, Samsung Securities estimates
Healthcare coverage: Quarterly results and forecasts
Note: Using parent financials for Celltrion, SK Chemicals, Donga ST, and i-Sens
Source: QuantiWise, Samsung Securities estimates
0
2
4
6
8
10
12
14
16
18
0
2,000
4,000
6,000
8,000
10,000
12,000
14,000
2009 2010 2011 2012 2013 2014 2015 2016 2017E 2018E
Sales (LHS) Operating profit (LHS) Operating margin (RHS)
(KRWb) (%)
0
4
8
12
16
20
0
500
1,000
1,500
2,000
2,500
3,000
3,500
1Q16 2Q16 3Q16 4Q16 1Q17 2Q17E 3Q17E 4Q17E 1Q18E 2Q18E 3Q18E 4Q18E
Sales (LHS) Operating profit (LHS) Operating margin (RHS)
(KRWb) (%)
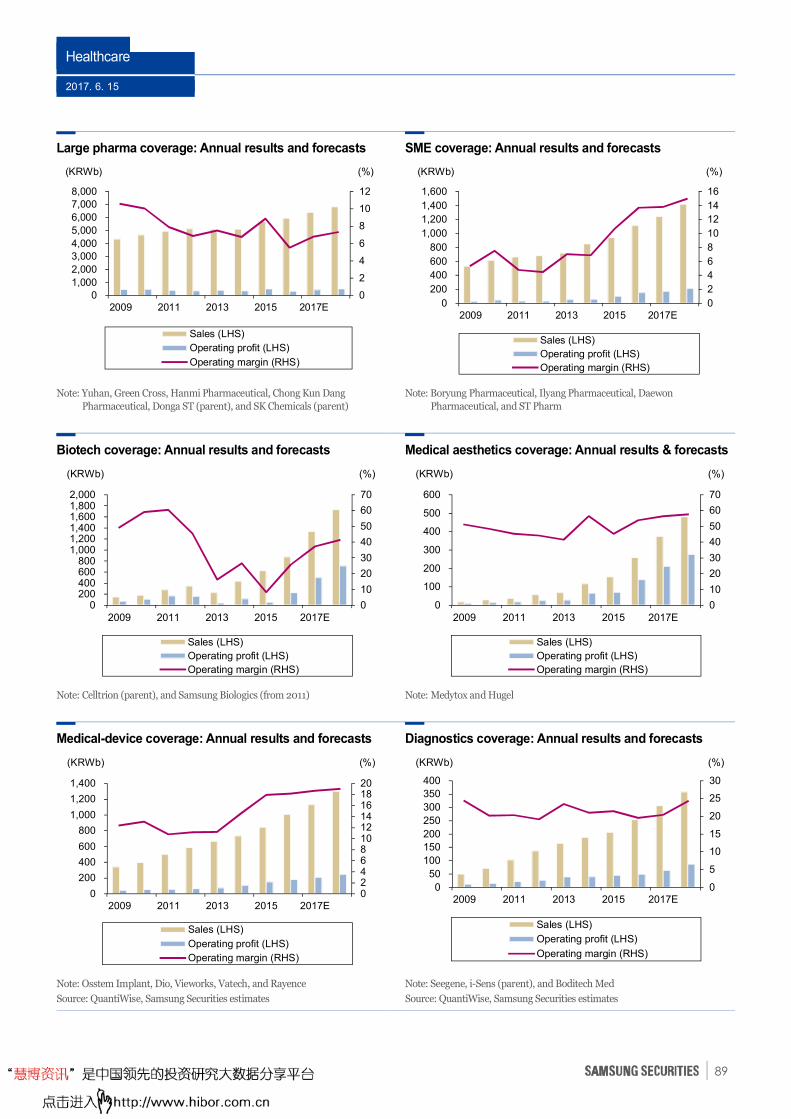
Healthcare
2017. 6. 15
89
Large pharma coverage: Annual results and forecasts SME coverage: Annual results and forecasts
Note: Yuhan, Green Cross, Hanmi Pharmaceutical, Chong Kun Dang
Pharmaceutical, Donga ST (parent), and SK Chemicals (parent)
Note: Boryung Pharmaceutical, Ilyang Pharmaceutical, Daewon
Pharmaceutical, and ST Pharm
Biotech coverage: Annual results and forecasts Medical aesthetics coverage: Annual results & forecasts
Note: Celltrion (parent), and Samsung Biologics (from 2011)
Note: Medytox and Hugel
Medical-device coverage: Annual results and forecasts Diagnostics coverage: Annual results and forecasts
Note: Osstem Implant, Dio, Vieworks, Vatech, and Rayence
Source: QuantiWise, Samsung Securities estimates
Note: Seegene, i-Sens (parent), and Boditech Med
Source: QuantiWise, Samsung Securities estimates
0
10
20
30
40
50
60
70
0200400600800
1,0001,2001,4001,6001,8002,000
2009 2011 2013 2015 2017E
Sales (LHS)
Operating profit (LHS)
Operating margin (RHS)
(KRWb) (%)
0
10
20
30
40
50
60
70
0
100
200
300
400
500
600
2009 2011 2013 2015 2017E
Sales (LHS)
Operating profit (LHS)
Operating margin (RHS)
(KRWb) (%)
02468101214161820
0
200
400
600
800
1,000
1,200
1,400
2009 2011 2013 2015 2017E
Sales (LHS)
Operating profit (LHS)
Operating margin (RHS)
(KRWb) (%)
0
5
10
15
20
25
30
0
50
100
150
200
250
300
350
400
2009 2011 2013 2015 2017E
Sales (LHS)
Operating profit (LHS)
Operating margin (RHS)
(KRWb) (%)
0
2
4
6
8
10
12
0
1,000
2,000
3,000
4,000
5,000
6,000
7,000
8,000
2009 2011 2013 2015 2017E
Sales (LHS)
Operating profit (LHS)
Operating margin (RHS)
(KRWb) (%)
0
2
4
6
8
10
12
14
16
0
200
400
600
800
1,000
1,200
1,400
1,600
2009 2011 2013 2015 2017E
Sales (LHS)
Operating profit (LHS)
Operating margin (RHS)
(KRWb) (%)
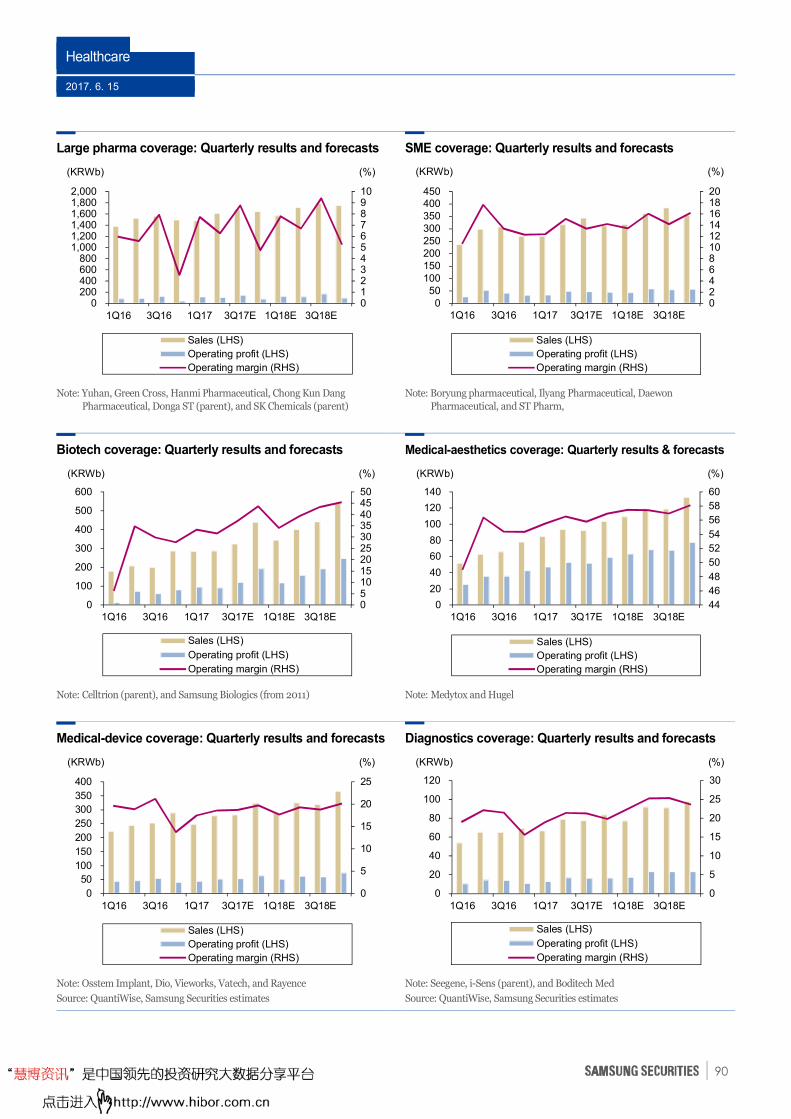
Healthcare
2017. 6. 15
90
Large pharma coverage: Quarterly results and forecasts SME coverage: Quarterly results and forecasts
Note: Yuhan, Green Cross, Hanmi Pharmaceutical, Chong Kun Dang
Pharmaceutical, Donga ST (parent), and SK Chemicals (parent)
Note: Boryung pharmaceutical, Ilyang Pharmaceutical, Daewon
Pharmaceutical, and ST Pharm,
Biotech coverage: Quarterly results and forecasts Medical-aesthetics coverage: Quarterly results & forecasts
Note: Celltrion (parent), and Samsung Biologics (from 2011)
Note: Medytox and Hugel
Medical-device coverage: Quarterly results and forecasts Diagnostics coverage: Quarterly results and forecasts
Note: Osstem Implant, Dio, Vieworks, Vatech, and Rayence
Source: QuantiWise, Samsung Securities estimates
Note: Seegene, i-Sens (parent), and Boditech Med
Source: QuantiWise, Samsung Securities estimates
012345678910
0200400600800
1,0001,2001,4001,6001,8002,000
1Q16 3Q16 1Q17 3Q17E 1Q18E 3Q18E
Sales (LHS)
Operating profit (LHS)
Operating margin (RHS)
(KRWb) (%)
02468101214161820
050
100150200250300350400450
1Q16 3Q16 1Q17 3Q17E 1Q18E 3Q18E
Sales (LHS)
Operating profit (LHS)
Operating margin (RHS)
(KRWb) (%)
05101520253035404550
0
100
200
300
400
500
600
1Q16 3Q16 1Q17 3Q17E 1Q18E 3Q18E
Sales (LHS)
Operating profit (LHS)
Operating margin (RHS)
(KRWb) (%)
44
46
48
50
52
54
56
58
60
0
20
40
60
80
100
120
140
1Q16 3Q16 1Q17 3Q17E 1Q18E 3Q18E
Sales (LHS)
Operating profit (LHS)
Operating margin (RHS)
(KRWb) (%)
0
5
10
15
20
25
0
50
100
150
200
250
300
350
400
1Q16 3Q16 1Q17 3Q17E 1Q18E 3Q18E
Sales (LHS)
Operating profit (LHS)
Operating margin (RHS)
(KRWb) (%)
0
5
10
15
20
25
30
0
20
40
60
80
100
120
1Q16 3Q16 1Q17 3Q17E 1Q18E 3Q18E
Sales (LHS)
Operating profit (LHS)
Operating margin (RHS)
(KRWb) (%)
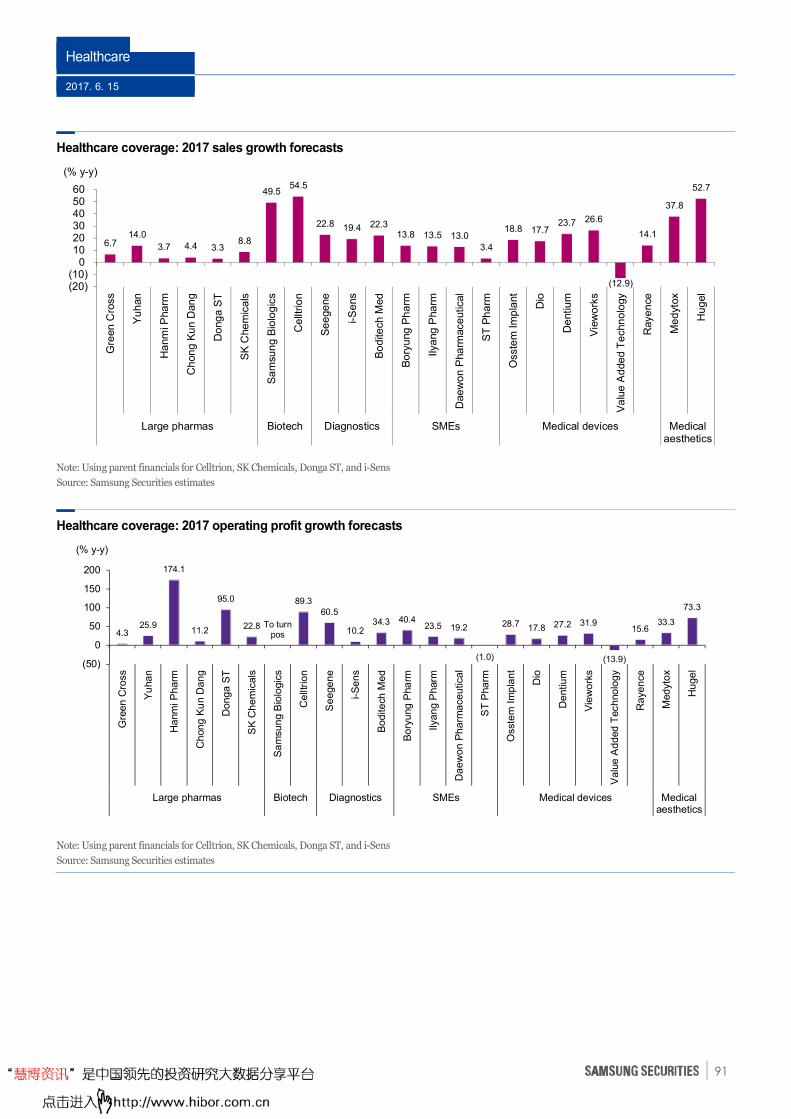
Healthcare
2017. 6. 15
91
Healthcare coverage: 2017 sales growth forecasts
Note: Using parent financials for Celltrion, SK Chemicals, Donga ST, and i-Sens
Source: Samsung Securities estimates
Healthcare coverage: 2017 operating profit growth forecasts
Note: Using parent financials for Celltrion, SK Chemicals, Donga ST, and i-Sens
Source: Samsung Securities estimates
6.7 14.0
3.7 4.4 3.3 8.8
49.5 54.5
22.8 19.4 22.3 13.8 13.5 13.0
3.4
18.8 17.7 23.7 26.6
(12.9)
14.1
37.8
52.7
(20)(10)
0102030405060
Gre
en
Cro
ss
Yu
han
Ha
nm
i Pha
rm
Ch
on
g K
un
Dan
g
Do
ng
a S
T
SK
Che
mic
als
Sa
msu
ng
Bio
log
ics
Ce
lltrio
n
Se
ege
ne
i-S
ens
Bo
dite
ch M
ed
Bo
ryu
ng
Ph
arm
Ilya
ng
Pha
rm
Dae
wo
n P
ha
rmace
utical
ST
Ph
arm
Osste
m Im
pla
nt
Dio
De
ntiu
m
Vie
wo
rks
Va
lue
Ad
de
d T
echn
olo
gy
Raye
nce
Me
dyt
ox
Hu
gel
Large pharmas Biotech Diagnostics SMEs Medical devices Medicalaesthetics
(% y-y)
4.3 25.9
174.1
11.2
95.0
22.8 To turn pos
89.3 60.5
10.2 34.3 40.4
23.5 19.2
(1.0)
28.7 17.8 27.2 31.9
(13.9)
15.6 33.3
73.3
(50)
0
50
100
150
200
Gre
en
Cro
ss
Yu
ha
n
Ha
nm
i P
ha
rm
Ch
on
g K
un D
an
g
Do
ng
a S
T
SK
Ch
em
ica
ls
Sa
msu
ng
Bio
log
ics
Ce
lltri
on
Se
ege
ne
i-S
en
s
Bo
dite
ch M
ed
Bo
ryu
ng
Pha
rm
Ilya
ng P
harm
Da
ew
on
Ph
arm
ace
utica
l
ST
Pha
rm
Osste
m I
mp
lan
t
Dio
De
ntiu
m
Vie
wo
rks
Va
lue
Ad
ded
Tech
no
log
y
Ra
ye
nce
Med
yto
x
Hu
ge
l
Large pharmas Biotech Diagnostics SMEs Medical devices Medicalaesthetics
(% y-y)
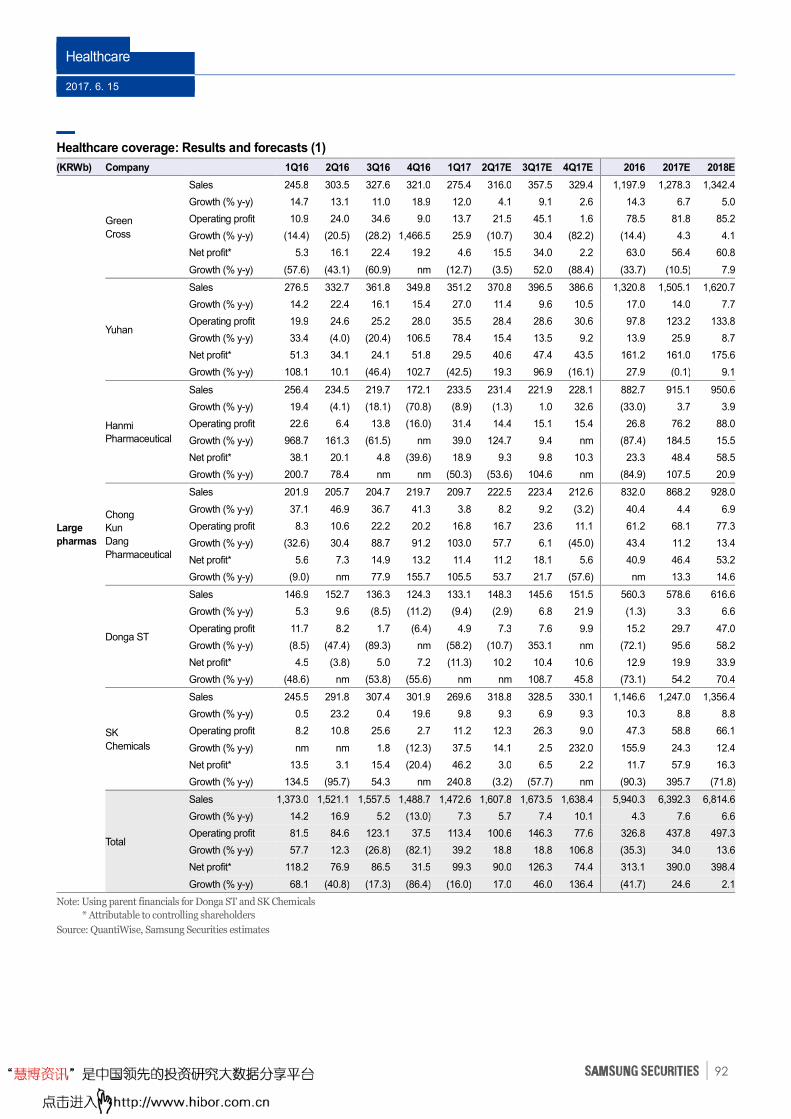
Healthcare
2017. 6. 15
92
Healthcare coverage: Results and forecasts (1)
(KRWb) Company 1Q16 2Q16 3Q16 4Q16 1Q17 2Q17E 3Q17E 4Q17E 2016 2017E 2018E
Large
pharmas
Green
Cross
Sales 245.8 303.5 327.6 321.0 275.4 316.0 357.5 329.4 1,197.9 1,278.3 1,342.4
Growth (% y-y) 14.7 13.1 11.0 18.9 12.0 4.1 9.1 2.6 14.3 6.7 5.0
Operating profit 10.9 24.0 34.6 9.0 13.7 21.5 45.1 1.6 78.5 81.8 85.2
Growth (% y-y) (14.4) (20.5) (28.2) 1,466.5 25.9 (10.7) 30.4 (82.2) (14.4) 4.3 4.1
Net profit* 5.3 16.1 22.4 19.2 4.6 15.5 34.0 2.2 63.0 56.4 60.8
Growth (% y-y) (57.6) (43.1) (60.9) nm (12.7) (3.5) 52.0 (88.4) (33.7) (10.5) 7.9
Yuhan
Sales 276.5 332.7 361.8 349.8 351.2 370.8 396.5 386.6 1,320.8 1,505.1 1,620.7
Growth (% y-y) 14.2 22.4 16.1 15.4 27.0 11.4 9.6 10.5 17.0 14.0 7.7
Operating profit 19.9 24.6 25.2 28.0 35.5 28.4 28.6 30.6 97.8 123.2 133.8
Growth (% y-y) 33.4 (4.0) (20.4) 106.5 78.4 15.4 13.5 9.2 13.9 25.9 8.7
Net profit* 51.3 34.1 24.1 51.8 29.5 40.6 47.4 43.5 161.2 161.0 175.6
Growth (% y-y) 108.1 10.1 (46.4) 102.7 (42.5) 19.3 96.9 (16.1) 27.9 (0.1) 9.1
Hanmi
Pharmaceutical
Sales 256.4 234.5 219.7 172.1 233.5 231.4 221.9 228.1 882.7 915.1 950.6
Growth (% y-y) 19.4 (4.1) (18.1) (70.8) (8.9) (1.3) 1.0 32.6 (33.0) 3.7 3.9
Operating profit 22.6 6.4 13.8 (16.0) 31.4 14.4 15.1 15.4 26.8 76.2 88.0
Growth (% y-y) 968.7 161.3 (61.5) nm 39.0 124.7 9.4 nm (87.4) 184.5 15.5
Net profit* 38.1 20.1 4.8 (39.6) 18.9 9.3 9.8 10.3 23.3 48.4 58.5
Growth (% y-y) 200.7 78.4 nm nm (50.3) (53.6) 104.6 nm (84.9) 107.5 20.9
Chong
Kun
Dang
Pharmaceutical
Sales 201.9 205.7 204.7 219.7 209.7 222.5 223.4 212.6 832.0 868.2 928.0
Growth (% y-y) 37.1 46.9 36.7 41.3 3.8 8.2 9.2 (3.2) 40.4 4.4 6.9
Operating profit 8.3 10.6 22.2 20.2 16.8 16.7 23.6 11.1 61.2 68.1 77.3
Growth (% y-y) (32.6) 30.4 88.7 91.2 103.0 57.7 6.1 (45.0) 43.4 11.2 13.4
Net profit* 5.6 7.3 14.9 13.2 11.4 11.2 18.1 5.6 40.9 46.4 53.2
Growth (% y-y) (9.0) nm 77.9 155.7 105.5 53.7 21.7 (57.6) nm 13.3 14.6
Donga ST
Sales 146.9 152.7 136.3 124.3 133.1 148.3 145.6 151.5 560.3 578.6 616.6
Growth (% y-y) 5.3 9.6 (8.5) (11.2) (9.4) (2.9) 6.8 21.9 (1.3) 3.3 6.6
Operating profit 11.7 8.2 1.7 (6.4) 4.9 7.3 7.6 9.9 15.2 29.7 47.0
Growth (% y-y) (8.5) (47.4) (89.3) nm (58.2) (10.7) 353.1 nm (72.1) 95.6 58.2
Net profit* 4.5 (3.8) 5.0 7.2 (11.3) 10.2 10.4 10.6 12.9 19.9 33.9
Growth (% y-y) (48.6) nm (53.8) (55.6) nm nm 108.7 45.8 (73.1) 54.2 70.4
SK
Chemicals
Sales 245.5 291.8 307.4 301.9 269.6 318.8 328.5 330.1 1,146.6 1,247.0 1,356.4
Growth (% y-y) 0.5 23.2 0.4 19.6 9.8 9.3 6.9 9.3 10.3 8.8 8.8
Operating profit 8.2 10.8 25.6 2.7 11.2 12.3 26.3 9.0 47.3 58.8 66.1
Growth (% y-y) nm nm 1.8 (12.3) 37.5 14.1 2.5 232.0 155.9 24.3 12.4
Net profit* 13.5 3.1 15.4 (20.4) 46.2 3.0 6.5 2.2 11.7 57.9 16.3
Growth (% y-y) 134.5 (95.7) 54.3 nm 240.8 (3.2) (57.7) nm (90.3) 395.7 (71.8)
Total
Sales 1,373.0 1,521.1 1,557.5 1,488.7 1,472.6 1,607.8 1,673.5 1,638.4 5,940.3 6,392.3 6,814.6
Growth (% y-y) 14.2 16.9 5.2 (13.0) 7.3 5.7 7.4 10.1 4.3 7.6 6.6
Operating profit 81.5 84.6 123.1 37.5 113.4 100.6 146.3 77.6 326.8 437.8 497.3
Growth (% y-y) 57.7 12.3 (26.8) (82.1) 39.2 18.8 18.8 106.8 (35.3) 34.0 13.6
Net profit* 118.2 76.9 86.5 31.5 99.3 90.0 126.3 74.4 313.1 390.0 398.4
Growth (% y-y) 68.1 (40.8) (17.3) (86.4) (16.0) 17.0 46.0 136.4 (41.7) 24.6 2.1
Note: Using parent financials for Donga ST and SK Chemicals
* Attributable to controlling shareholders
Source: QuantiWise, Samsung Securities estimates
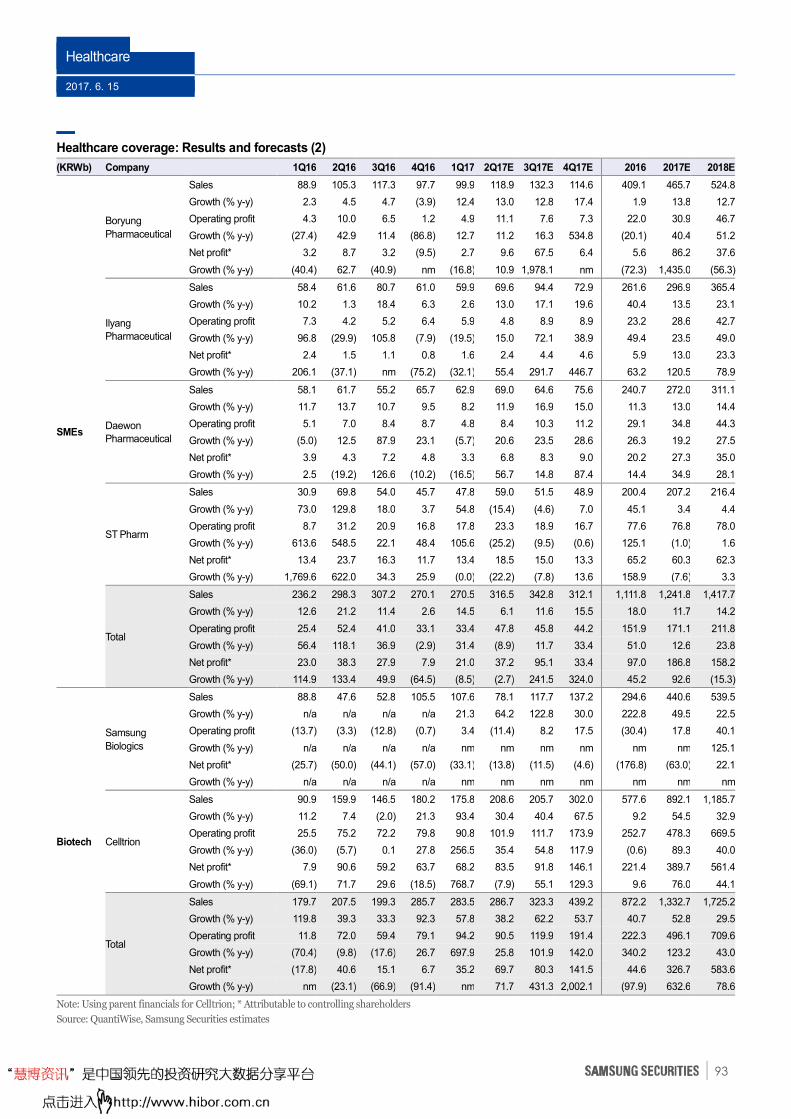
Healthcare
2017. 6. 15
93
Healthcare coverage: Results and forecasts (2)
(KRWb) Company 1Q16 2Q16 3Q16 4Q16 1Q17 2Q17E 3Q17E 4Q17E 2016 2017E 2018E
SMEs
Boryung
Pharmaceutical
Sales 88.9 105.3 117.3 97.7 99.9 118.9 132.3 114.6 409.1 465.7 524.8
Growth (% y-y) 2.3 4.5 4.7 (3.9) 12.4 13.0 12.8 17.4 1.9 13.8 12.7
Operating profit 4.3 10.0 6.5 1.2 4.9 11.1 7.6 7.3 22.0 30.9 46.7
Growth (% y-y) (27.4) 42.9 11.4 (86.8) 12.7 11.2 16.3 534.8 (20.1) 40.4 51.2
Net profit* 3.2 8.7 3.2 (9.5) 2.7 9.6 67.5 6.4 5.6 86.2 37.6
Growth (% y-y) (40.4) 62.7 (40.9) nm (16.8) 10.9 1,978.1 nm (72.3) 1,435.0 (56.3)
Ilyang
Pharmaceutical
Sales 58.4 61.6 80.7 61.0 59.9 69.6 94.4 72.9 261.6 296.9 365.4
Growth (% y-y) 10.2 1.3 18.4 6.3 2.6 13.0 17.1 19.6 40.4 13.5 23.1
Operating profit 7.3 4.2 5.2 6.4 5.9 4.8 8.9 8.9 23.2 28.6 42.7
Growth (% y-y) 96.8 (29.9) 105.8 (7.9) (19.5) 15.0 72.1 38.9 49.4 23.5 49.0
Net profit* 2.4 1.5 1.1 0.8 1.6 2.4 4.4 4.6 5.9 13.0 23.3
Growth (% y-y) 206.1 (37.1) nm (75.2) (32.1) 55.4 291.7 446.7 63.2 120.5 78.9
Daewon
Pharmaceutical
Sales 58.1 61.7 55.2 65.7 62.9 69.0 64.6 75.6 240.7 272.0 311.1
Growth (% y-y) 11.7 13.7 10.7 9.5 8.2 11.9 16.9 15.0 11.3 13.0 14.4
Operating profit 5.1 7.0 8.4 8.7 4.8 8.4 10.3 11.2 29.1 34.8 44.3
Growth (% y-y) (5.0) 12.5 87.9 23.1 (5.7) 20.6 23.5 28.6 26.3 19.2 27.5
Net profit* 3.9 4.3 7.2 4.8 3.3 6.8 8.3 9.0 20.2 27.3 35.0
Growth (% y-y) 2.5 (19.2) 126.6 (10.2) (16.5) 56.7 14.8 87.4 14.4 34.9 28.1
ST Pharm
Sales 30.9 69.8 54.0 45.7 47.8 59.0 51.5 48.9 200.4 207.2 216.4
Growth (% y-y) 73.0 129.8 18.0 3.7 54.8 (15.4) (4.6) 7.0 45.1 3.4 4.4
Operating profit 8.7 31.2 20.9 16.8 17.8 23.3 18.9 16.7 77.6 76.8 78.0
Growth (% y-y) 613.6 548.5 22.1 48.4 105.6 (25.2) (9.5) (0.6) 125.1 (1.0) 1.6
Net profit* 13.4 23.7 16.3 11.7 13.4 18.5 15.0 13.3 65.2 60.3 62.3
Growth (% y-y) 1,769.6 622.0 34.3 25.9 (0.0) (22.2) (7.8) 13.6 158.9 (7.6) 3.3
Total
Sales 236.2 298.3 307.2 270.1 270.5 316.5 342.8 312.1 1,111.8 1,241.8 1,417.7
Growth (% y-y) 12.6 21.2 11.4 2.6 14.5 6.1 11.6 15.5 18.0 11.7 14.2
Operating profit 25.4 52.4 41.0 33.1 33.4 47.8 45.8 44.2 151.9 171.1 211.8
Growth (% y-y) 56.4 118.1 36.9 (2.9) 31.4 (8.9) 11.7 33.4 51.0 12.6 23.8
Net profit* 23.0 38.3 27.9 7.9 21.0 37.2 95.1 33.4 97.0 186.8 158.2
Growth (% y-y) 114.9 133.4 49.9 (64.5) (8.5) (2.7) 241.5 324.0 45.2 92.6 (15.3)
Biotech
Samsung
Biologics
Sales 88.8 47.6 52.8 105.5 107.6 78.1 117.7 137.2 294.6 440.6 539.5
Growth (% y-y) n/a n/a n/a n/a 21.3 64.2 122.8 30.0 222.8 49.5 22.5
Operating profit (13.7) (3.3) (12.8) (0.7) 3.4 (11.4) 8.2 17.5 (30.4) 17.8 40.1
Growth (% y-y) n/a n/a n/a n/a nm nm nm nm nm nm 125.1
Net profit* (25.7) (50.0) (44.1) (57.0) (33.1) (13.8) (11.5) (4.6) (176.8) (63.0) 22.1
Growth (% y-y) n/a n/a n/a n/a nm nm nm nm nm nm nm
Celltrion
Sales 90.9 159.9 146.5 180.2 175.8 208.6 205.7 302.0 577.6 892.1 1,185.7
Growth (% y-y) 11.2 7.4 (2.0) 21.3 93.4 30.4 40.4 67.5 9.2 54.5 32.9
Operating profit 25.5 75.2 72.2 79.8 90.8 101.9 111.7 173.9 252.7 478.3 669.5
Growth (% y-y) (36.0) (5.7) 0.1 27.8 256.5 35.4 54.8 117.9 (0.6) 89.3 40.0
Net profit* 7.9 90.6 59.2 63.7 68.2 83.5 91.8 146.1 221.4 389.7 561.4
Growth (% y-y) (69.1) 71.7 29.6 (18.5) 768.7 (7.9) 55.1 129.3 9.6 76.0 44.1
Total
Sales 179.7 207.5 199.3 285.7 283.5 286.7 323.3 439.2 872.2 1,332.7 1,725.2
Growth (% y-y) 119.8 39.3 33.3 92.3 57.8 38.2 62.2 53.7 40.7 52.8 29.5
Operating profit 11.8 72.0 59.4 79.1 94.2 90.5 119.9 191.4 222.3 496.1 709.6
Growth (% y-y) (70.4) (9.8) (17.6) 26.7 697.9 25.8 101.9 142.0 340.2 123.2 43.0
Net profit* (17.8) 40.6 15.1 6.7 35.2 69.7 80.3 141.5 44.6 326.7 583.6
Growth (% y-y) nm (23.1) (66.9) (91.4) nm 71.7 431.3 2,002.1 (97.9) 632.6 78.6
Note: Using parent financials for Celltrion; * Attributable to controlling shareholders
Source: QuantiWise, Samsung Securities estimates
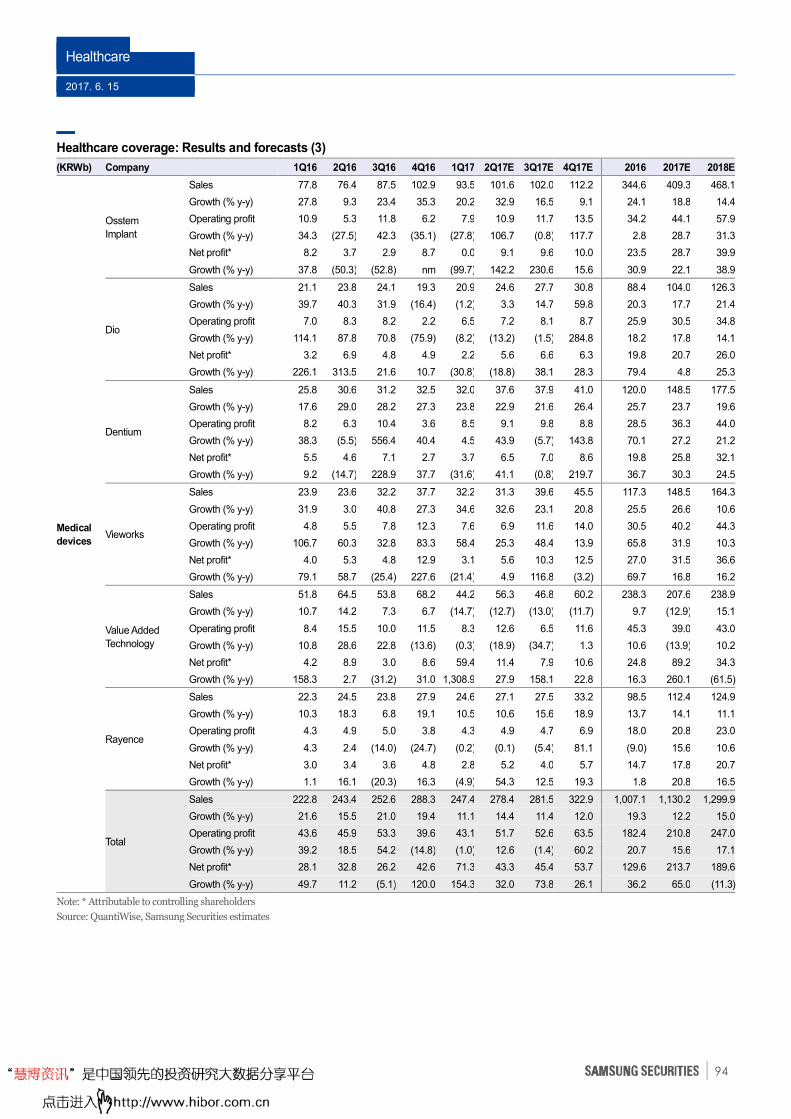
Healthcare
2017. 6. 15
94
Healthcare coverage: Results and forecasts (3)
(KRWb) Company 1Q16 2Q16 3Q16 4Q16 1Q17 2Q17E 3Q17E 4Q17E 2016 2017E 2018E
Medical
devices
Osstem
Implant
Sales 77.8 76.4 87.5 102.9 93.5 101.6 102.0 112.2 344.6 409.3 468.1
Growth (% y-y) 27.8 9.3 23.4 35.3 20.2 32.9 16.5 9.1 24.1 18.8 14.4
Operating profit 10.9 5.3 11.8 6.2 7.9 10.9 11.7 13.5 34.2 44.1 57.9
Growth (% y-y) 34.3 (27.5) 42.3 (35.1) (27.8) 106.7 (0.8) 117.7 2.8 28.7 31.3
Net profit* 8.2 3.7 2.9 8.7 0.0 9.1 9.6 10.0 23.5 28.7 39.9
Growth (% y-y) 37.8 (50.3) (52.8) nm (99.7) 142.2 230.6 15.6 30.9 22.1 38.9
Dio
Sales 21.1 23.8 24.1 19.3 20.9 24.6 27.7 30.8 88.4 104.0 126.3
Growth (% y-y) 39.7 40.3 31.9 (16.4) (1.2) 3.3 14.7 59.8 20.3 17.7 21.4
Operating profit 7.0 8.3 8.2 2.2 6.5 7.2 8.1 8.7 25.9 30.5 34.8
Growth (% y-y) 114.1 87.8 70.8 (75.9) (8.2) (13.2) (1.5) 284.8 18.2 17.8 14.1
Net profit* 3.2 6.9 4.8 4.9 2.2 5.6 6.6 6.3 19.8 20.7 26.0
Growth (% y-y) 226.1 313.5 21.6 10.7 (30.8) (18.8) 38.1 28.3 79.4 4.8 25.3
Dentium
Sales 25.8 30.6 31.2 32.5 32.0 37.6 37.9 41.0 120.0 148.5 177.5
Growth (% y-y) 17.6 29.0 28.2 27.3 23.8 22.9 21.6 26.4 25.7 23.7 19.6
Operating profit 8.2 6.3 10.4 3.6 8.5 9.1 9.8 8.8 28.5 36.3 44.0
Growth (% y-y) 38.3 (5.5) 556.4 40.4 4.5 43.9 (5.7) 143.8 70.1 27.2 21.2
Net profit* 5.5 4.6 7.1 2.7 3.7 6.5 7.0 8.6 19.8 25.8 32.1
Growth (% y-y) 9.2 (14.7) 228.9 37.7 (31.6) 41.1 (0.8) 219.7 36.7 30.3 24.5
Vieworks
Sales 23.9 23.6 32.2 37.7 32.2 31.3 39.6 45.5 117.3 148.5 164.3
Growth (% y-y) 31.9 3.0 40.8 27.3 34.6 32.6 23.1 20.8 25.5 26.6 10.6
Operating profit 4.8 5.5 7.8 12.3 7.6 6.9 11.6 14.0 30.5 40.2 44.3
Growth (% y-y) 106.7 60.3 32.8 83.3 58.4 25.3 48.4 13.9 65.8 31.9 10.3
Net profit* 4.0 5.3 4.8 12.9 3.1 5.6 10.3 12.5 27.0 31.5 36.6
Growth (% y-y) 79.1 58.7 (25.4) 227.6 (21.4) 4.9 116.8 (3.2) 69.7 16.8 16.2
Value Added
Technology
Sales 51.8 64.5 53.8 68.2 44.2 56.3 46.8 60.2 238.3 207.6 238.9
Growth (% y-y) 10.7 14.2 7.3 6.7 (14.7) (12.7) (13.0) (11.7) 9.7 (12.9) 15.1
Operating profit 8.4 15.5 10.0 11.5 8.3 12.6 6.5 11.6 45.3 39.0 43.0
Growth (% y-y) 10.8 28.6 22.8 (13.6) (0.3) (18.9) (34.7) 1.3 10.6 (13.9) 10.2
Net profit* 4.2 8.9 3.0 8.6 59.4 11.4 7.9 10.6 24.8 89.2 34.3
Growth (% y-y) 158.3 2.7 (31.2) 31.0 1,308.9 27.9 158.1 22.8 16.3 260.1 (61.5)
Rayence
Sales 22.3 24.5 23.8 27.9 24.6 27.1 27.5 33.2 98.5 112.4 124.9
Growth (% y-y) 10.3 18.3 6.8 19.1 10.5 10.6 15.6 18.9 13.7 14.1 11.1
Operating profit 4.3 4.9 5.0 3.8 4.3 4.9 4.7 6.9 18.0 20.8 23.0
Growth (% y-y) 4.3 2.4 (14.0) (24.7) (0.2) (0.1) (5.4) 81.1 (9.0) 15.6 10.6
Net profit* 3.0 3.4 3.6 4.8 2.8 5.2 4.0 5.7 14.7 17.8 20.7
Growth (% y-y) 1.1 16.1 (20.3) 16.3 (4.9) 54.3 12.5 19.3 1.8 20.8 16.5
Total
Sales 222.8 243.4 252.6 288.3 247.4 278.4 281.5 322.9 1,007.1 1,130.2 1,299.9
Growth (% y-y) 21.6 15.5 21.0 19.4 11.1 14.4 11.4 12.0 19.3 12.2 15.0
Operating profit 43.6 45.9 53.3 39.6 43.1 51.7 52.6 63.5 182.4 210.8 247.0
Growth (% y-y) 39.2 18.5 54.2 (14.8) (1.0) 12.6 (1.4) 60.2 20.7 15.6 17.1
Net profit* 28.1 32.8 26.2 42.6 71.3 43.3 45.4 53.7 129.6 213.7 189.6
Growth (% y-y) 49.7 11.2 (5.1) 120.0 154.3 32.0 73.8 26.1 36.2 65.0 (11.3)
Note: * Attributable to controlling shareholders
Source: QuantiWise, Samsung Securities estimates
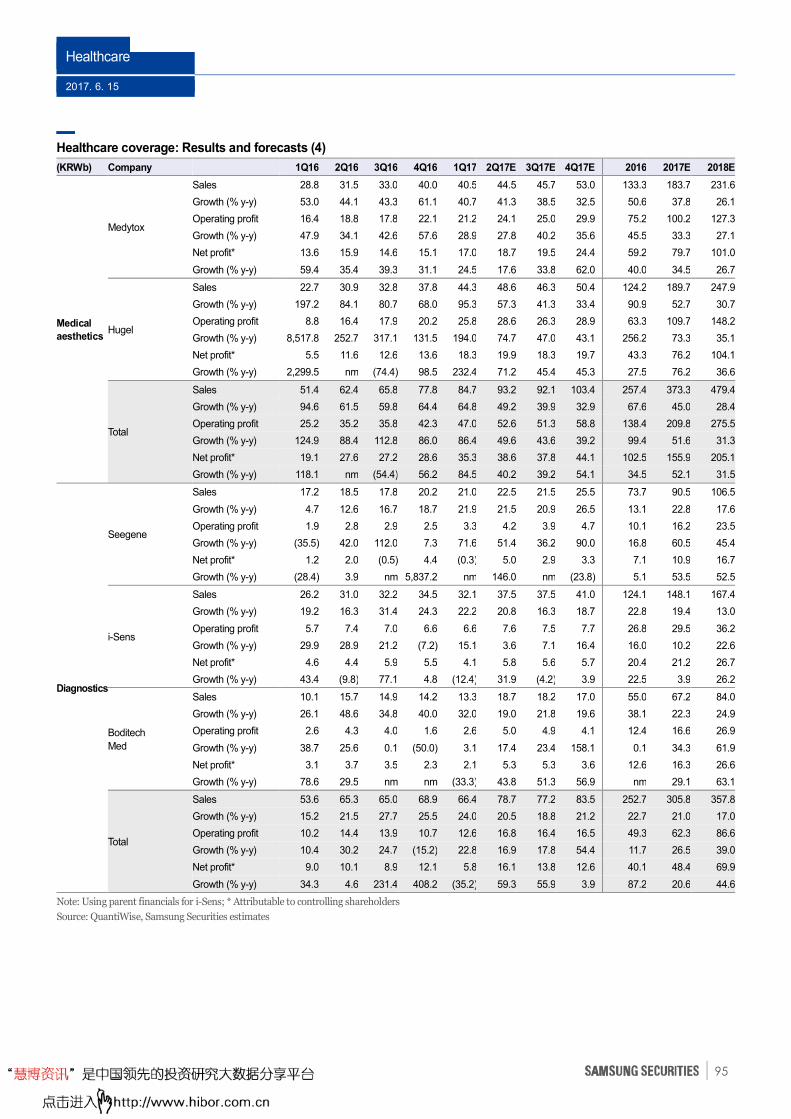
Healthcare
2017. 6. 15
95
Healthcare coverage: Results and forecasts (4)
(KRWb) Company 1Q16 2Q16 3Q16 4Q16 1Q17 2Q17E 3Q17E 4Q17E 2016 2017E 2018E
Medical
aesthetics
Medytox
Sales 28.8 31.5 33.0 40.0 40.5 44.5 45.7 53.0 133.3 183.7 231.6
Growth (% y-y) 53.0 44.1 43.3 61.1 40.7 41.3 38.5 32.5 50.6 37.8 26.1
Operating profit 16.4 18.8 17.8 22.1 21.2 24.1 25.0 29.9 75.2 100.2 127.3
Growth (% y-y) 47.9 34.1 42.6 57.6 28.9 27.8 40.2 35.6 45.5 33.3 27.1
Net profit* 13.6 15.9 14.6 15.1 17.0 18.7 19.5 24.4 59.2 79.7 101.0
Growth (% y-y) 59.4 35.4 39.3 31.1 24.5 17.6 33.8 62.0 40.0 34.5 26.7
Hugel
Sales 22.7 30.9 32.8 37.8 44.3 48.6 46.3 50.4 124.2 189.7 247.9
Growth (% y-y) 197.2 84.1 80.7 68.0 95.3 57.3 41.3 33.4 90.9 52.7 30.7
Operating profit 8.8 16.4 17.9 20.2 25.8 28.6 26.3 28.9 63.3 109.7 148.2
Growth (% y-y) 8,517.8 252.7 317.1 131.5 194.0 74.7 47.0 43.1 256.2 73.3 35.1
Net profit* 5.5 11.6 12.6 13.6 18.3 19.9 18.3 19.7 43.3 76.2 104.1
Growth (% y-y) 2,299.5 nm (74.4) 98.5 232.4 71.2 45.4 45.3 27.5 76.2 36.6
Total
Sales 51.4 62.4 65.8 77.8 84.7 93.2 92.1 103.4 257.4 373.3 479.4
Growth (% y-y) 94.6 61.5 59.8 64.4 64.8 49.2 39.9 32.9 67.6 45.0 28.4
Operating profit 25.2 35.2 35.8 42.3 47.0 52.6 51.3 58.8 138.4 209.8 275.5
Growth (% y-y) 124.9 88.4 112.8 86.0 86.4 49.6 43.6 39.2 99.4 51.6 31.3
Net profit* 19.1 27.6 27.2 28.6 35.3 38.6 37.8 44.1 102.5 155.9 205.1
Growth (% y-y) 118.1 nm (54.4) 56.2 84.5 40.2 39.2 54.1 34.5 52.1 31.5
Diagnostics
Seegene
Sales 17.2 18.5 17.8 20.2 21.0 22.5 21.5 25.5 73.7 90.5 106.5
Growth (% y-y) 4.7 12.6 16.7 18.7 21.9 21.5 20.9 26.5 13.1 22.8 17.6
Operating profit 1.9 2.8 2.9 2.5 3.3 4.2 3.9 4.7 10.1 16.2 23.5
Growth (% y-y) (35.5) 42.0 112.0 7.3 71.6 51.4 36.2 90.0 16.8 60.5 45.4
Net profit* 1.2 2.0 (0.5) 4.4 (0.3) 5.0 2.9 3.3 7.1 10.9 16.7
Growth (% y-y) (28.4) 3.9 nm 5,837.2 nm 146.0 nm (23.8) 5.1 53.5 52.5
i-Sens
Sales 26.2 31.0 32.2 34.5 32.1 37.5 37.5 41.0 124.1 148.1 167.4
Growth (% y-y) 19.2 16.3 31.4 24.3 22.2 20.8 16.3 18.7 22.8 19.4 13.0
Operating profit 5.7 7.4 7.0 6.6 6.6 7.6 7.5 7.7 26.8 29.5 36.2
Growth (% y-y) 29.9 28.9 21.2 (7.2) 15.1 3.6 7.1 16.4 16.0 10.2 22.6
Net profit* 4.6 4.4 5.9 5.5 4.1 5.8 5.6 5.7 20.4 21.2 26.7
Growth (% y-y) 43.4 (9.8) 77.1 4.8 (12.4) 31.9 (4.2) 3.9 22.5 3.9 26.2
Boditech
Med
Sales 10.1 15.7 14.9 14.2 13.3 18.7 18.2 17.0 55.0 67.2 84.0
Growth (% y-y) 26.1 48.6 34.8 40.0 32.0 19.0 21.8 19.6 38.1 22.3 24.9
Operating profit 2.6 4.3 4.0 1.6 2.6 5.0 4.9 4.1 12.4 16.6 26.9
Growth (% y-y) 38.7 25.6 0.1 (50.0) 3.1 17.4 23.4 158.1 0.1 34.3 61.9
Net profit* 3.1 3.7 3.5 2.3 2.1 5.3 5.3 3.6 12.6 16.3 26.6
Growth (% y-y) 78.6 29.5 nm nm (33.3) 43.8 51.3 56.9 nm 29.1 63.1
Total
Sales 53.6 65.3 65.0 68.9 66.4 78.7 77.2 83.5 252.7 305.8 357.8
Growth (% y-y) 15.2 21.5 27.7 25.5 24.0 20.5 18.8 21.2 22.7 21.0 17.0
Operating profit 10.2 14.4 13.9 10.7 12.6 16.8 16.4 16.5 49.3 62.3 86.6
Growth (% y-y) 10.4 30.2 24.7 (15.2) 22.8 16.9 17.8 54.4 11.7 26.5 39.0
Net profit* 9.0 10.1 8.9 12.1 5.8 16.1 13.8 12.6 40.1 48.4 69.9
Growth (% y-y) 34.3 4.6 231.4 408.2 (35.2) 59.3 55.9 3.9 87.2 20.6 44.6
Note: Using parent financials for i-Sens; * Attributable to controlling shareholders
Source: QuantiWise, Samsung Securities estimates
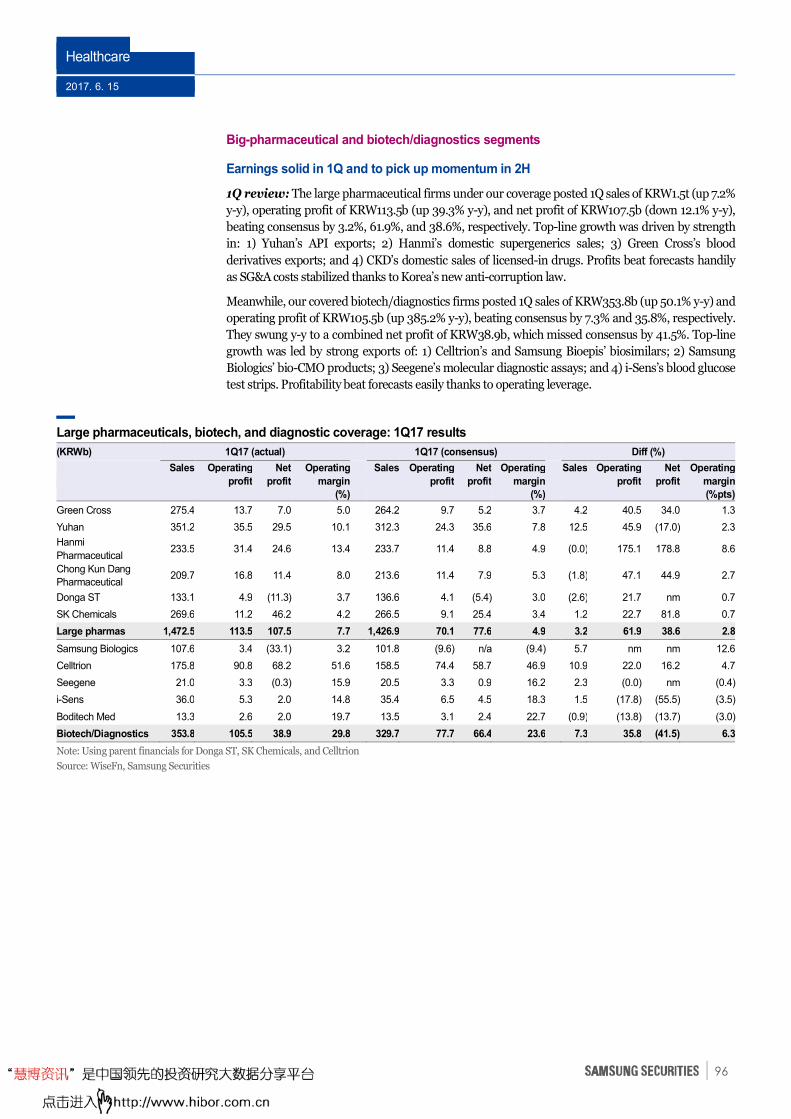
Healthcare
2017. 6. 15
96
Big-pharmaceutical and biotech/diagnostics segments
Earnings solid in 1Q and to pick up momentum in 2H
1Q review: The large pharmaceutical firms under our coverage posted 1Q sales of KRW1.5t (up 7.2%
y-y), operating profit of KRW113.5b (up 39.3% y-y), and net profit of KRW107.5b (down 12.1% y-y),
beating consensus by 3.2%, 61.9%, and 38.6%, respectively. Top-line growth was driven by strength
in: 1) Yuhan’s API exports; 2) Hanmi’s domestic supergenerics sales; 3) Green Cross’s blood
derivatives exports; and 4) CKD’s domestic sales of licensed-in drugs. Profits beat forecasts handily
as SG&A costs stabilized thanks to Korea’s new anti-corruption law.
Meanwhile, our covered biotech/diagnostics firms posted 1Q sales of KRW353.8b (up 50.1% y-y) and
operating profit of KRW105.5b (up 385.2% y-y), beating consensus by 7.3% and 35.8%, respectively.
They swung y-y to a combined net profit of KRW38.9b, which missed consensus by 41.5%. Top-line
growth was led by strong exports of: 1) Celltrion’s and Samsung Bioepis’ biosimilars; 2) Samsung
Biologics’ bio-CMO products; 3) Seegene’s molecular diagnostic assays; and 4) i-Sens’s blood glucose
test strips. Profitability beat forecasts easily thanks to operating leverage.
Large pharmaceuticals, biotech, and diagnostic coverage: 1Q17 results
(KRWb) 1Q17 (actual) 1Q17 (consensus) Diff (%)
Sales Operating
profit
Net
profit
Operating
margin
(%)
Sales Operating
profit
Net
profit
Operating
margin
(%)
Sales Operating
profit
Net
profit
Operating
margin
(%pts)
Green Cross 275.4 13.7 7.0 5.0 264.2 9.7 5.2 3.7 4.2 40.5 34.0 1.3
Yuhan 351.2 35.5 29.5 10.1 312.3 24.3 35.6 7.8 12.5 45.9 (17.0) 2.3
Hanmi
Pharmaceutical 233.5 31.4 24.6 13.4 233.7 11.4 8.8 4.9 (0.0) 175.1 178.8 8.6
Chong Kun Dang
Pharmaceutical 209.7 16.8 11.4 8.0 213.6 11.4 7.9 5.3 (1.8) 47.1 44.9 2.7
Donga ST 133.1 4.9 (11.3) 3.7 136.6 4.1 (5.4) 3.0 (2.6) 21.7 nm 0.7
SK Chemicals 269.6 11.2 46.2 4.2 266.5 9.1 25.4 3.4 1.2 22.7 81.8 0.7
Large pharmas 1,472.5 113.5 107.5 7.7 1,426.9 70.1 77.6 4.9 3.2 61.9 38.6 2.8
Samsung Biologics 107.6 3.4 (33.1) 3.2 101.8 (9.6) n/a (9.4) 5.7 nm nm 12.6
Celltrion 175.8 90.8 68.2 51.6 158.5 74.4 58.7 46.9 10.9 22.0 16.2 4.7
Seegene 21.0 3.3 (0.3) 15.9 20.5 3.3 0.9 16.2 2.3 (0.0) nm (0.4)
i-Sens 36.0 5.3 2.0 14.8 35.4 6.5 4.5 18.3 1.5 (17.8) (55.5) (3.5)
Boditech Med 13.3 2.6 2.0 19.7 13.5 3.1 2.4 22.7 (0.9) (13.8) (13.7) (3.0)
Biotech/Diagnostics 353.8 105.5 38.9 29.8 329.7 77.7 66.4 23.6 7.3 35.8 (41.5) 6.3
Note: Using parent financials for Donga ST, SK Chemicals, and Celltrion
Source: WiseFn, Samsung Securities
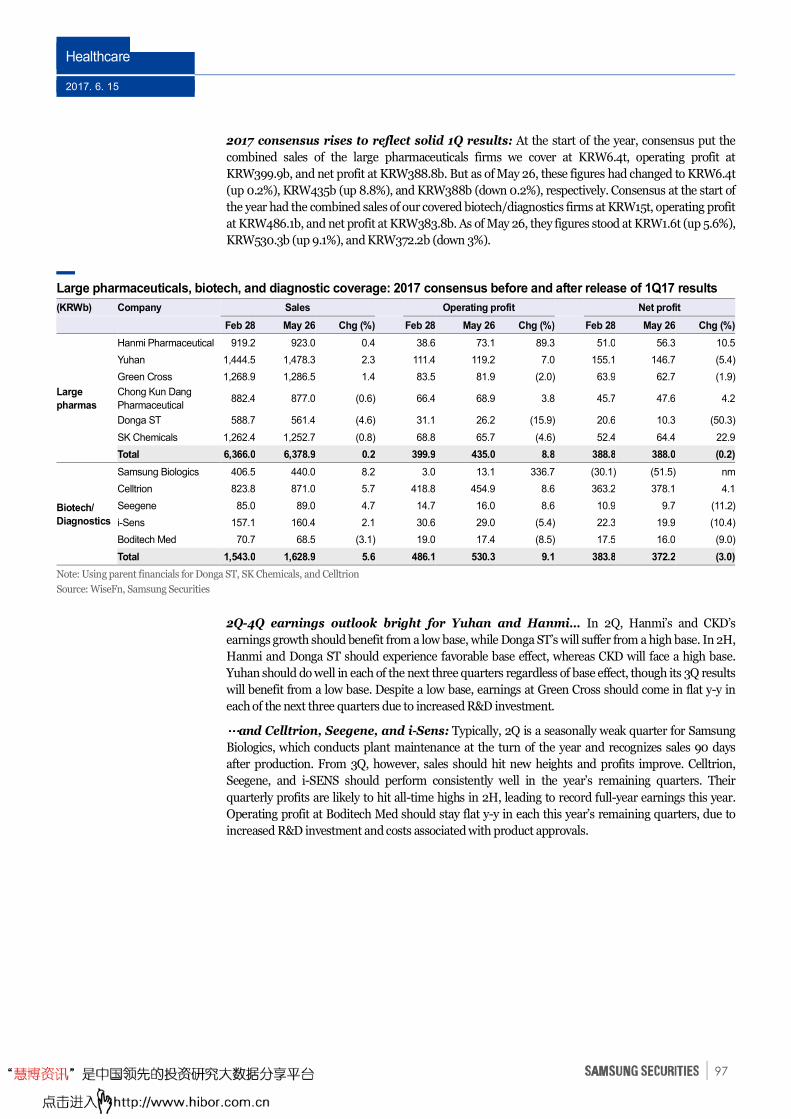
Healthcare
2017. 6. 15
97
2017 consensus rises to reflect solid 1Q results: At the start of the year, consensus put the
combined sales of the large pharmaceuticals firms we cover at KRW6.4t, operating profit at
KRW399.9b, and net profit at KRW388.8b. But as of May 26, these figures had changed to KRW6.4t
(up 0.2%), KRW435b (up 8.8%), and KRW388b (down 0.2%), respectively. Consensus at the start of
the year had the combined sales of our covered biotech/diagnostics firms at KRW15t, operating profit
at KRW486.1b, and net profit at KRW383.8b. As of May 26, they figures stood at KRW1.6t (up 5.6%),
KRW530.3b (up 9.1%), and KRW372.2b (down 3%).
Large pharmaceuticals, biotech, and diagnostic coverage: 2017 consensus before and after release of 1Q17 results
(KRWb) Company Sales Operating profit Net profit
Feb 28 May 26 Chg (%) Feb 28 May 26 Chg (%) Feb 28 May 26 Chg (%)
Large
pharmas
Hanmi Pharmaceutical 919.2 923.0 0.4 38.6 73.1 89.3 51.0 56.3 10.5
Yuhan 1,444.5 1,478.3 2.3 111.4 119.2 7.0 155.1 146.7 (5.4)
Green Cross 1,268.9 1,286.5 1.4 83.5 81.9 (2.0) 63.9 62.7 (1.9)
Chong Kun Dang
Pharmaceutical 882.4 877.0 (0.6) 66.4 68.9 3.8 45.7 47.6 4.2
Donga ST 588.7 561.4 (4.6) 31.1 26.2 (15.9) 20.6 10.3 (50.3)
SK Chemicals 1,262.4 1,252.7 (0.8) 68.8 65.7 (4.6) 52.4 64.4 22.9
Total 6,366.0 6,378.9 0.2 399.9 435.0 8.8 388.8 388.0 (0.2)
Biotech/
Diagnostics
Samsung Biologics 406.5 440.0 8.2 3.0 13.1 336.7 (30.1) (51.5) nm
Celltrion 823.8 871.0 5.7 418.8 454.9 8.6 363.2 378.1 4.1
Seegene 85.0 89.0 4.7 14.7 16.0 8.6 10.9 9.7 (11.2)
i-Sens 157.1 160.4 2.1 30.6 29.0 (5.4) 22.3 19.9 (10.4)
Boditech Med 70.7 68.5 (3.1) 19.0 17.4 (8.5) 17.5 16.0 (9.0)
Total 1,543.0 1,628.9 5.6 486.1 530.3 9.1 383.8 372.2 (3.0)
Note: Using parent financials for Donga ST, SK Chemicals, and Celltrion
Source: WiseFn, Samsung Securities
2Q-4Q earnings outlook bright for Yuhan and Hanmi… In 2Q, Hanmi’s and CKD’s
earnings growth should benefit from a low base, while Donga ST’s will suffer from a high base. In 2H,
Hanmi and Donga ST should experience favorable base effect, whereas CKD will face a high base.
Yuhan should do well in each of the next three quarters regardless of base effect, though its 3Q results
will benefit from a low base. Despite a low base, earnings at Green Cross should come in flat y-y in
each of the next three quarters due to increased R&D investment.
…………and Celltrion, Seegene, and i-Sens: Typically, 2Q is a seasonally weak quarter for Samsung
Biologics, which conducts plant maintenance at the turn of the year and recognizes sales 90 days
after production. From 3Q, however, sales should hit new heights and profits improve. Celltrion,
Seegene, and i-SENS should perform consistently well in the year’s remaining quarters. Their
quarterly profits are likely to hit all-time highs in 2H, leading to record full-year earnings this year.
Operating profit at Boditech Med should stay flat y-y in each this year’s remaining quarters, due to
increased R&D investment and costs associated with product approvals.

Healthcare
2017. 6. 15
98
Hanmi our top pick among large pharmas, Samsung Biologics among biotech firms
Hanmi top pick among large pharmas; Yuhan second pick: Hanmi is our top pick among
large pharmaceutical firms, and Yuhan is our next favorite. Hanmi will soon start producing samples
of its Lapscovery-based biologics for clinical trials. We believe it is time to focus on the possibilities of
Efpeglenatide and HM12525A/JNJ-64565111 resuming global clinical trials and generating
milestone income. Also, we foresee strong quarterly results over 2Q-4Q on a low base. Yuhan should
also post decent results over 2Q-4Q, backed by strong domestic sales of licensed-in prescription
drugs and robust API exports. In particular, 3Q results should benefit from a low base due to a 3Q16
earnings shock. Subsidiary Yuhan Kimberly has struggled because: 1) its China-bound exports have
been hit by fallout from the THAAD conflict; and 2) domestic sales of wipes contracted after
authorities told it to stop selling wet types. But the firm should bounce back over 2Q-4Q.
Samsung Biologics top biotech pick; Seegene second pick: Samsung Biologics is our top
biotech pick and Seegene our next favorite. With construction of a Samsung Biologics’ third plant due
to conclude in 2H, the firm is likely to pursue even more CMO contracts with multinationals.
Subsidiary Samsung Bioepis expects to receive US FDA approval for its Lantus biosimilar Lusduna,
and EMA approvals of its Humira and Herceptin biosimilars in 2H. As 2Q is a seasonally weak
quarter for the firm due to plant maintenance at the turn of the year, Samsung Biologics should post
record sales and growing profits from 3Q. Seegene’s quarterly growth has accelerated since it
launched new Allplex products in 2016. Quarterly results are set to hit all-time highs in 2H, lifting
annual earnings to record levels, too. In addition, the firm should commence ODM shipments to
Beckman Coulter in 4Q, after completing related development and the approval process in 3Q. The
contract will generate estimated sales of KRW5b during the first year of supply, and annual sales are
projected to reach KRW30b-50b thereafter.
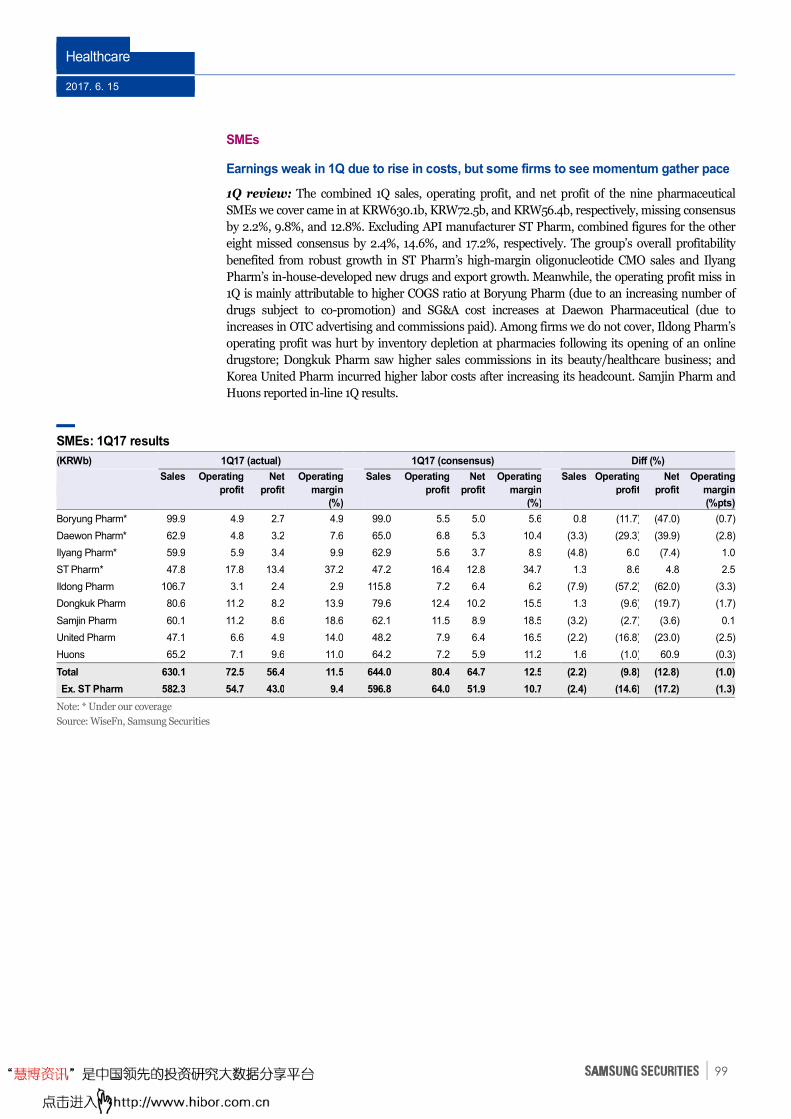
Healthcare
2017. 6. 15
99
SMEs
Earnings weak in 1Q due to rise in costs, but some firms to see momentum gather pace
1Q review: The combined 1Q sales, operating profit, and net profit of the nine pharmaceutical
SMEs we cover came in at KRW630.1b, KRW72.5b, and KRW56.4b, respectively, missing consensus
by 2.2%, 9.8%, and 12.8%. Excluding API manufacturer ST Pharm, combined figures for the other
eight missed consensus by 2.4%, 14.6%, and 17.2%, respectively. The group’s overall profitability
benefited from robust growth in ST Pharm’s high-margin oligonucleotide CMO sales and Ilyang
Pharm’s in-house-developed new drugs and export growth. Meanwhile, the operating profit miss in
1Q is mainly attributable to higher COGS ratio at Boryung Pharm (due to an increasing number of
drugs subject to co-promotion) and SG&A cost increases at Daewon Pharmaceutical (due to
increases in OTC advertising and commissions paid). Among firms we do not cover, Ildong Pharm’s
operating profit was hurt by inventory depletion at pharmacies following its opening of an online
drugstore; Dongkuk Pharm saw higher sales commissions in its beauty/healthcare business; and
Korea United Pharm incurred higher labor costs after increasing its headcount. Samjin Pharm and
Huons reported in-line 1Q results.
SMEs: 1Q17 results
(KRWb) 1Q17 (actual) 1Q17 (consensus) Diff (%)
Sales Operating
profit
Net
profit
Operating
margin
(%)
Sales Operating
profit
Net
profit
Operating
margin
(%)
Sales Operating
profit
Net
profit
Operating
margin
(%pts)
Boryung Pharm* 99.9 4.9 2.7 4.9 99.0 5.5 5.0 5.6 0.8 (11.7) (47.0) (0.7)
Daewon Pharm* 62.9 4.8 3.2 7.6 65.0 6.8 5.3 10.4 (3.3) (29.3) (39.9) (2.8)
Ilyang Pharm* 59.9 5.9 3.4 9.9 62.9 5.6 3.7 8.9 (4.8) 6.0 (7.4) 1.0
ST Pharm* 47.8 17.8 13.4 37.2 47.2 16.4 12.8 34.7 1.3 8.6 4.8 2.5
Ildong Pharm 106.7 3.1 2.4 2.9 115.8 7.2 6.4 6.2 (7.9) (57.2) (62.0) (3.3)
Dongkuk Pharm 80.6 11.2 8.2 13.9 79.6 12.4 10.2 15.5 1.3 (9.6) (19.7) (1.7)
Samjin Pharm 60.1 11.2 8.6 18.6 62.1 11.5 8.9 18.5 (3.2) (2.7) (3.6) 0.1
United Pharm 47.1 6.6 4.9 14.0 48.2 7.9 6.4 16.5 (2.2) (16.8) (23.0) (2.5)
Huons 65.2 7.1 9.6 11.0 64.2 7.2 5.9 11.2 1.6 (1.0) 60.9 (0.3)
Total 630.1 72.5 56.4 11.5 644.0 80.4 64.7 12.5 (2.2) (9.8) (12.8) (1.0)
Ex. ST Pharm 582.3 54.7 43.0 9.4 596.8 64.0 51.9 10.7 (2.4) (14.6) (17.2) (1.3)
Note: * Under our coverage
Source: WiseFn, Samsung Securities
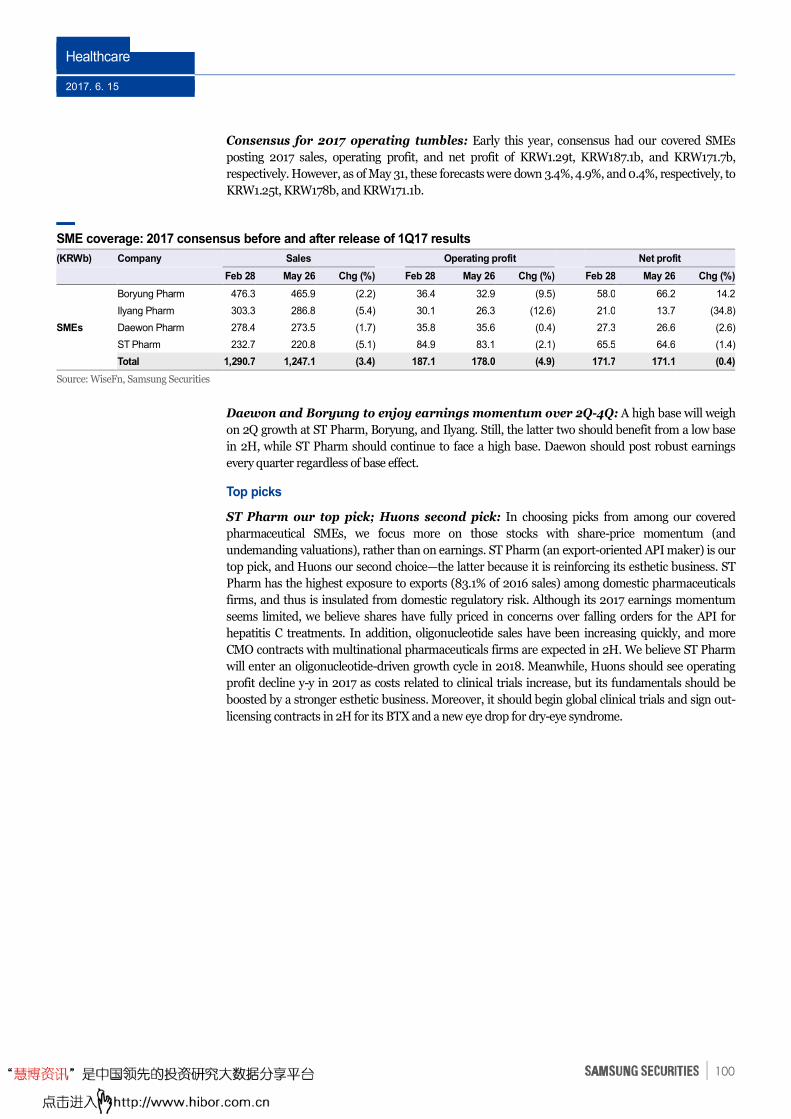
Healthcare
2017. 6. 15
100
Consensus for 2017 operating tumbles: Early this year, consensus had our covered SMEs
posting 2017 sales, operating profit, and net profit of KRW1.29t, KRW187.1b, and KRW171.7b,
respectively. However, as of May 31, these forecasts were down 3.4%, 4.9%, and 0.4%, respectively, to
KRW1.25t, KRW178b, and KRW171.1b.
SME coverage: 2017 consensus before and after release of 1Q17 results
(KRWb) Company Sales Operating profit Net profit
Feb 28 May 26 Chg (%) Feb 28 May 26 Chg (%) Feb 28 May 26 Chg (%)
SMEs
Boryung Pharm 476.3 465.9 (2.2) 36.4 32.9 (9.5) 58.0 66.2 14.2
Ilyang Pharm 303.3 286.8 (5.4) 30.1 26.3 (12.6) 21.0 13.7 (34.8)
Daewon Pharm 278.4 273.5 (1.7) 35.8 35.6 (0.4) 27.3 26.6 (2.6)
ST Pharm 232.7 220.8 (5.1) 84.9 83.1 (2.1) 65.5 64.6 (1.4)
Total 1,290.7 1,247.1 (3.4) 187.1 178.0 (4.9) 171.7 171.1 (0.4)
Source: WiseFn, Samsung Securities
Daewon and Boryung to enjoy earnings momentum over 2Q-4Q: A high base will weigh
on 2Q growth at ST Pharm, Boryung, and Ilyang. Still, the latter two should benefit from a low base
in 2H, while ST Pharm should continue to face a high base. Daewon should post robust earnings
every quarter regardless of base effect.
Top picks
ST Pharm our top pick; Huons second pick: In choosing picks from among our covered
pharmaceutical SMEs, we focus more on those stocks with share-price momentum (and
undemanding valuations), rather than on earnings. ST Pharm (an export-oriented API maker) is our
top pick, and Huons our second choice—the latter because it is reinforcing its esthetic business. ST
Pharm has the highest exposure to exports (83.1% of 2016 sales) among domestic pharmaceuticals
firms, and thus is insulated from domestic regulatory risk. Although its 2017 earnings momentum
seems limited, we believe shares have fully priced in concerns over falling orders for the API for
hepatitis C treatments. In addition, oligonucleotide sales have been increasing quickly, and more
CMO contracts with multinational pharmaceuticals firms are expected in 2H. We believe ST Pharm
will enter an oligonucleotide-driven growth cycle in 2018. Meanwhile, Huons should see operating
profit decline y-y in 2017 as costs related to clinical trials increase, but its fundamentals should be
boosted by a stronger esthetic business. Moreover, it should begin global clinical trials and sign out-
licensing contracts in 2H for its BTX and a new eye drop for dry-eye syndrome.
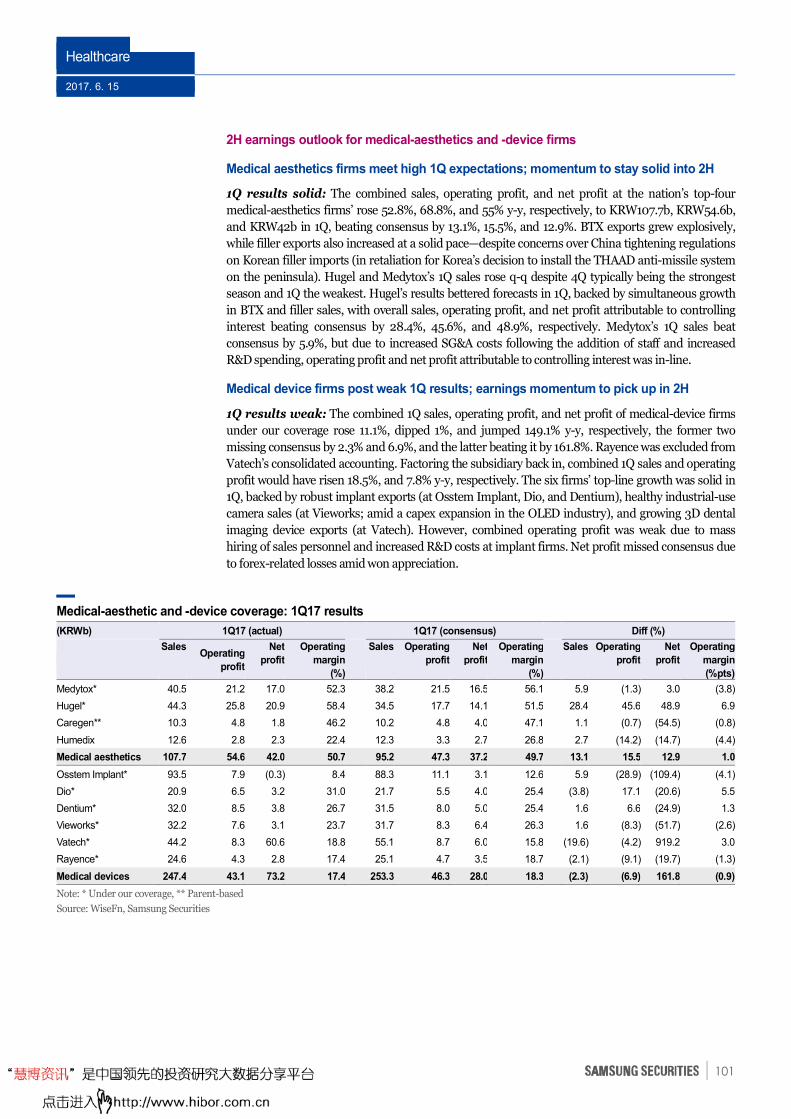
Healthcare
2017. 6. 15
101
2H earnings outlook for medical-aesthetics and -device firms
Medical aesthetics firms meet high 1Q expectations; momentum to stay solid into 2H
1Q results solid: The combined sales, operating profit, and net profit at the nation’s top-four
medical-aesthetics firms’ rose 52.8%, 68.8%, and 55% y-y, respectively, to KRW107.7b, KRW54.6b,
and KRW42b in 1Q, beating consensus by 13.1%, 15.5%, and 12.9%. BTX exports grew explosively,
while filler exports also increased at a solid pace—despite concerns over China tightening regulations
on Korean filler imports (in retaliation for Korea’s decision to install the THAAD anti-missile system
on the peninsula). Hugel and Medytox’s 1Q sales rose q-q despite 4Q typically being the strongest
season and 1Q the weakest. Hugel’s results bettered forecasts in 1Q, backed by simultaneous growth
in BTX and filler sales, with overall sales, operating profit, and net profit attributable to controlling
interest beating consensus by 28.4%, 45.6%, and 48.9%, respectively. Medytox’s 1Q sales beat
consensus by 5.9%, but due to increased SG&A costs following the addition of staff and increased
R&D spending, operating profit and net profit attributable to controlling interest was in-line.
Medical device firms post weak 1Q results; earnings momentum to pick up in 2H
1Q results weak: The combined 1Q sales, operating profit, and net profit of medical-device firms
under our coverage rose 11.1%, dipped 1%, and jumped 149.1% y-y, respectively, the former two
missing consensus by 2.3% and 6.9%, and the latter beating it by 161.8%. Rayence was excluded from
Vatech’s consolidated accounting. Factoring the subsidiary back in, combined 1Q sales and operating
profit would have risen 18.5%, and 7.8% y-y, respectively. The six firms’ top-line growth was solid in
1Q, backed by robust implant exports (at Osstem Implant, Dio, and Dentium), healthy industrial-use
camera sales (at Vieworks; amid a capex expansion in the OLED industry), and growing 3D dental
imaging device exports (at Vatech). However, combined operating profit was weak due to mass
hiring of sales personnel and increased R&D costs at implant firms. Net profit missed consensus due
to forex-related losses amid won appreciation.
Medical-aesthetic and -device coverage: 1Q17 results
(KRWb) 1Q17 (actual) 1Q17 (consensus) Diff (%)
SalesOperating
profit
Net
profit
Operating
margin
(%)
Sales Operating
profit
Net
profit
Operating
margin
(%)
Sales Operating
profit
Net
profit
Operating
margin
(%pts)
Medytox* 40.5 21.2 17.0 52.3 38.2 21.5 16.5 56.1 5.9 (1.3) 3.0 (3.8)
Hugel* 44.3 25.8 20.9 58.4 34.5 17.7 14.1 51.5 28.4 45.6 48.9 6.9
Caregen** 10.3 4.8 1.8 46.2 10.2 4.8 4.0 47.1 1.1 (0.7) (54.5) (0.8)
Humedix 12.6 2.8 2.3 22.4 12.3 3.3 2.7 26.8 2.7 (14.2) (14.7) (4.4)
Medical aesthetics 107.7 54.6 42.0 50.7 95.2 47.3 37.2 49.7 13.1 15.5 12.9 1.0
Osstem Implant* 93.5 7.9 (0.3) 8.4 88.3 11.1 3.1 12.6 5.9 (28.9) (109.4) (4.1)
Dio* 20.9 6.5 3.2 31.0 21.7 5.5 4.0 25.4 (3.8) 17.1 (20.6) 5.5
Dentium* 32.0 8.5 3.8 26.7 31.5 8.0 5.0 25.4 1.6 6.6 (24.9) 1.3
Vieworks* 32.2 7.6 3.1 23.7 31.7 8.3 6.4 26.3 1.6 (8.3) (51.7) (2.6)
Vatech* 44.2 8.3 60.6 18.8 55.1 8.7 6.0 15.8 (19.6) (4.2) 919.2 3.0
Rayence* 24.6 4.3 2.8 17.4 25.1 4.7 3.5 18.7 (2.1) (9.1) (19.7) (1.3)
Medical devices 247.4 43.1 73.2 17.4 253.3 46.3 28.0 18.3 (2.3) (6.9) 161.8 (0.9)
Note: * Under our coverage, ** Parent-based
Source: WiseFn, Samsung Securities
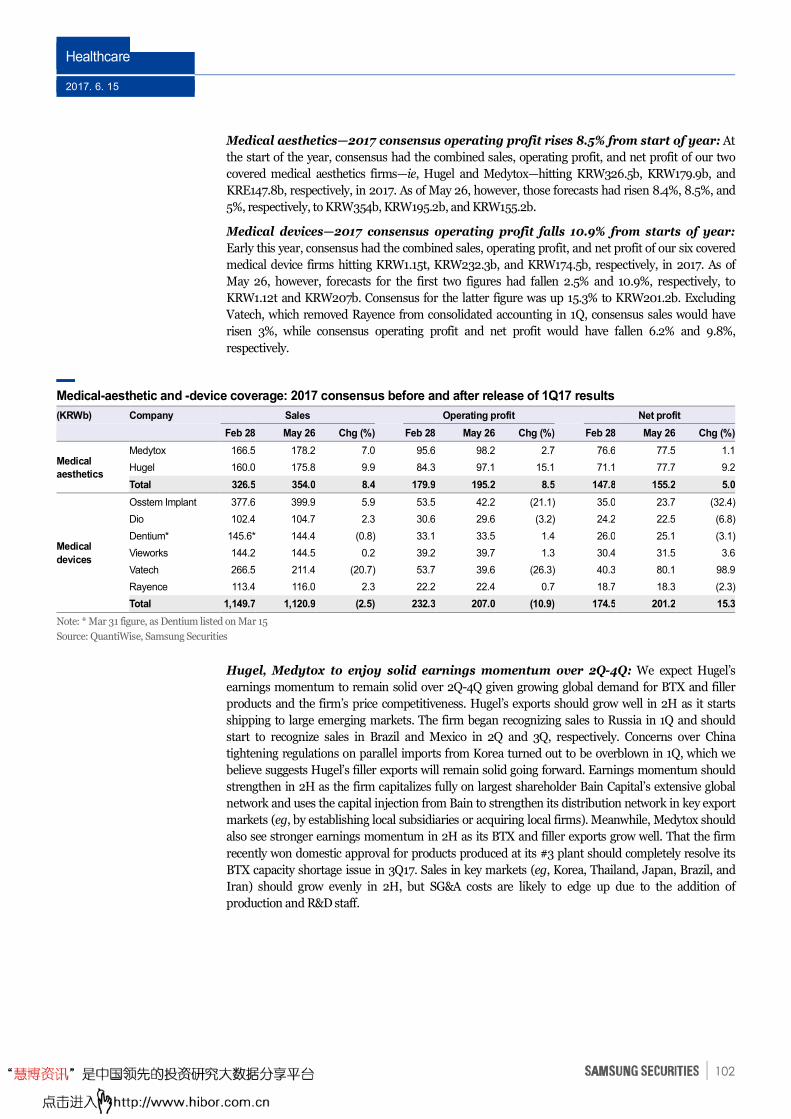
Healthcare
2017. 6. 15
102
Medical aesthetics—2017 consensus operating profit rises 8.5% from start of year: At
the start of the year, consensus had the combined sales, operating profit, and net profit of our two
covered medical aesthetics firms—ie, Hugel and Medytox—hitting KRW326.5b, KRW179.9b, and
KRE147.8b, respectively, in 2017. As of May 26, however, those forecasts had risen 8.4%, 8.5%, and
5%, respectively, to KRW354b, KRW195.2b, and KRW155.2b.
Medical devices—2017 consensus operating profit falls 10.9% from starts of year:
Early this year, consensus had the combined sales, operating profit, and net profit of our six covered
medical device firms hitting KRW1.15t, KRW232.3b, and KRW174.5b, respectively, in 2017. As of
May 26, however, forecasts for the first two figures had fallen 2.5% and 10.9%, respectively, to
KRW1.12t and KRW207b. Consensus for the latter figure was up 15.3% to KRW201.2b. Excluding
Vatech, which removed Rayence from consolidated accounting in 1Q, consensus sales would have
risen 3%, while consensus operating profit and net profit would have fallen 6.2% and 9.8%,
respectively.
Medical-aesthetic and -device coverage: 2017 consensus before and after release of 1Q17 results
(KRWb) Company Sales Operating profit Net profit
Feb 28 May 26 Chg (%) Feb 28 May 26 Chg (%) Feb 28 May 26 Chg (%)
Medical
aesthetics
Medytox 166.5 178.2 7.0 95.6 98.2 2.7 76.6 77.5 1.1
Hugel 160.0 175.8 9.9 84.3 97.1 15.1 71.1 77.7 9.2
Total 326.5 354.0 8.4 179.9 195.2 8.5 147.8 155.2 5.0
Medical
devices
Osstem Implant 377.6 399.9 5.9 53.5 42.2 (21.1) 35.0 23.7 (32.4)
Dio 102.4 104.7 2.3 30.6 29.6 (3.2) 24.2 22.5 (6.8)
Dentium* 145.6* 144.4 (0.8) 33.1 33.5 1.4 26.0 25.1 (3.1)
Vieworks 144.2 144.5 0.2 39.2 39.7 1.3 30.4 31.5 3.6
Vatech 266.5 211.4 (20.7) 53.7 39.6 (26.3) 40.3 80.1 98.9
Rayence 113.4 116.0 2.3 22.2 22.4 0.7 18.7 18.3 (2.3)
Total 1,149.7 1,120.9 (2.5) 232.3 207.0 (10.9) 174.5 201.2 15.3
Note: * Mar 31 figure, as Dentium listed on Mar 15
Source: QuantiWise, Samsung Securities
Hugel, Medytox to enjoy solid earnings momentum over 2Q-4Q: We expect Hugel’s
earnings momentum to remain solid over 2Q-4Q given growing global demand for BTX and filler
products and the firm’s price competitiveness. Hugel’s exports should grow well in 2H as it starts
shipping to large emerging markets. The firm began recognizing sales to Russia in 1Q and should
start to recognize sales in Brazil and Mexico in 2Q and 3Q, respectively. Concerns over China
tightening regulations on parallel imports from Korea turned out to be overblown in 1Q, which we
believe suggests Hugel’s filler exports will remain solid going forward. Earnings momentum should
strengthen in 2H as the firm capitalizes fully on largest shareholder Bain Capital’s extensive global
network and uses the capital injection from Bain to strengthen its distribution network in key export
markets (eg, by establishing local subsidiaries or acquiring local firms). Meanwhile, Medytox should
also see stronger earnings momentum in 2H as its BTX and filler exports grow well. That the firm
recently won domestic approval for products produced at its #3 plant should completely resolve its
BTX capacity shortage issue in 3Q17. Sales in key markets (eg, Korea, Thailand, Japan, Brazil, and
Iran) should grow evenly in 2H, but SG&A costs are likely to edge up due to the addition of
production and R&D staff.
Healthcare
2017. 6. 15
103
Dentium to enjoy earnings momentum over 2Q-4Q… Despite solid top-line growth,
operating margin at Dentium, Osstem Implant, and Dio is unlikely to improve visibly in 2H, as the
increases in sales personnel and R&D investments will bump up SG&A costs. While Dentium and
Osstem are likely to benefit from a low base in 2Q, Dio will face a high base in 2Q. All three firms will
face a high base in 3Q, but a low base in 4Q. Dentium’s earnings momentum should stand out most,
as its SG&A cost increases are likely to be the smallest.
…Vieworks and Vatech, too: Exports at medical-imaging firms Vieworks, Vatech, and Rayence
should remain solid in 2H. Though Vieworks’ is likely to report weak 2Q exports, it should beat
market estimates in 2H—despite a high base. Vatech will face a high base y-y over 2Q-4Q as it no
longer treats Rayence as a consolidated subsidiary, but its dental operation should keep posting solid
results, base effect notwithstanding. Rayence should benefit from a low base in 4Q, which is also
when its new operations should take off in earnest.
Hugel our preferred medical-aesthetics firm; Dentium our top medical-device firm
Hugel our top pick among medical-aesthetics firms: Hugel is our top pick among medical-
aesthetics firms. Backed by growth in sales of both BTX and fillers, operating profit should rise 73.4%
to KRW109.7b in 2017. The firm should use a capital injection of KRW454.7b from Bain Capital to: 1)
strengthen its distribution network in the US by securing a global pharma as a partner; 2) establish
local subsidiaries and acquire local distributors in key markets, which should help boost ASPs; and 3)
increase its stake in filler-making subsidiary Across, which should lead net margin (attributable to
controlling shareholders) to rise. Moreover, the firm has a solid longer-term growth story, as it plans
to enter the US, Europe, and China in 2019. Shares, trading at KRW451,000 (on May 26) were nearly
on par with the per-share acquisition price that Bain Capital paid to purchase a 45.3% stake in the
firm. Considering Bain’s expected return, we believe Hugel has a lot of upside.
Dentium our top pick among medical-device firms: Dentium was trading at 16.1x 2017 P/E
on May 26, discounted 37.4% to the 25.7x average of Korean rivals Osstem Implant (26x) and Dio
(25.4x). Excluding treasury shares (22.1% of shares outstanding), Dentium would have been trading
at just 12.5x P/E. We believe the steep discount is unwarranted considering its solid earnings growth
momentum. We forecast that Dentium’s full-year sales will rise 23.7% this year, backed by implant
market growth in Asia. As for the domestic implant market, contrary to concerns, it should keep
growing, backed by a likely expansion of insurance coverage, thus sustaining Dentium’s top-line
growth over the longer term. Unlike domestic rivals, the firm plans to keep tight control of SG&A
costs, suggesting earnings will remain solid in the near term.
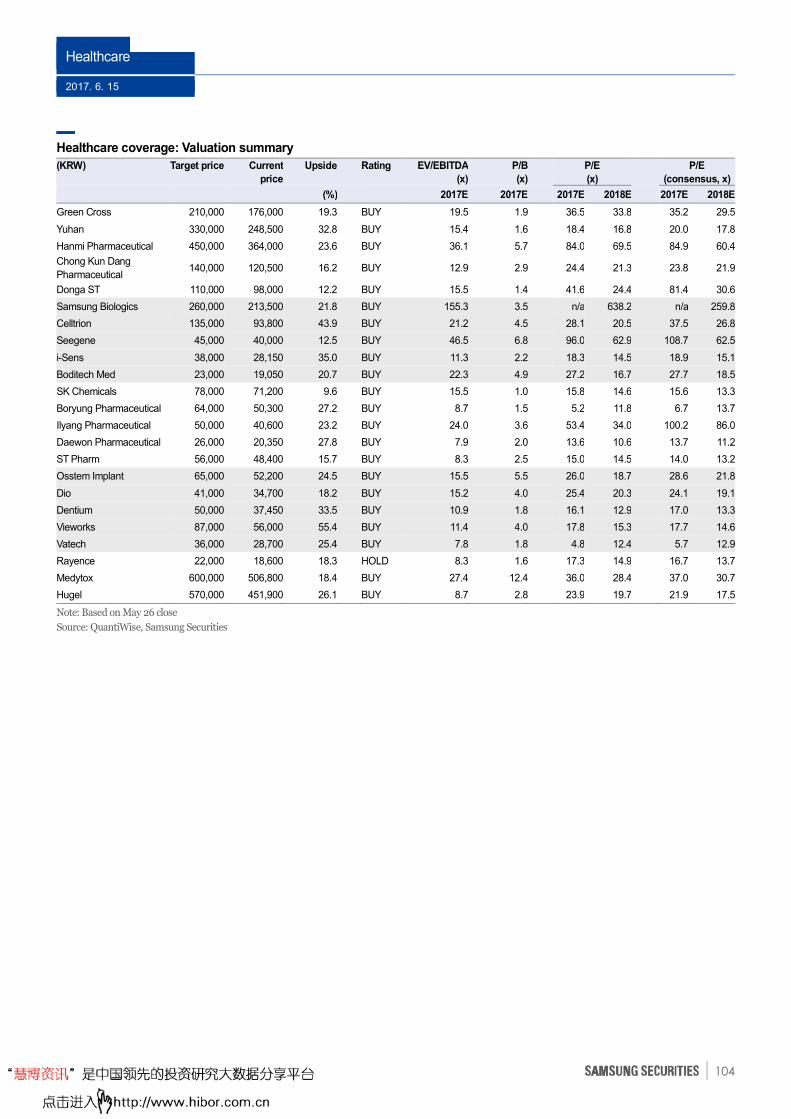
Healthcare
2017. 6. 15
104
Healthcare coverage: Valuation summary
(KRW)
Target price
Current
price
Upside
Rating
EV/EBITDA
(x)
P/B
(x)
P/E
(x)
P/E
(consensus, x)
(%) 2017E 2017E 2017E 2018E 2017E 2018E
Green Cross 210,000 176,000 19.3 BUY 19.5 1.9 36.5 33.8 35.2 29.5
Yuhan 330,000 248,500 32.8 BUY 15.4 1.6 18.4 16.8 20.0 17.8
Hanmi Pharmaceutical 450,000 364,000 23.6 BUY 36.1 5.7 84.0 69.5 84.9 60.4
Chong Kun Dang
Pharmaceutical 140,000 120,500 16.2 BUY 12.9 2.9 24.4 21.3 23.8 21.9
Donga ST 110,000 98,000 12.2 BUY 15.5 1.4 41.6 24.4 81.4 30.6
Samsung Biologics 260,000 213,500 21.8 BUY 155.3 3.5 n/a 638.2 n/a 259.8
Celltrion 135,000 93,800 43.9 BUY 21.2 4.5 28.1 20.5 37.5 26.8
Seegene 45,000 40,000 12.5 BUY 46.5 6.8 96.0 62.9 108.7 62.5
i-Sens 38,000 28,150 35.0 BUY 11.3 2.2 18.3 14.5 18.9 15.1
Boditech Med 23,000 19,050 20.7 BUY 22.3 4.9 27.2 16.7 27.7 18.5
SK Chemicals 78,000 71,200 9.6 BUY 15.5 1.0 15.8 14.6 15.6 13.3
Boryung Pharmaceutical 64,000 50,300 27.2 BUY 8.7 1.5 5.2 11.8 6.7 13.7
Ilyang Pharmaceutical 50,000 40,600 23.2 BUY 24.0 3.6 53.4 34.0 100.2 86.0
Daewon Pharmaceutical 26,000 20,350 27.8 BUY 7.9 2.0 13.6 10.6 13.7 11.2
ST Pharm 56,000 48,400 15.7 BUY 8.3 2.5 15.0 14.5 14.0 13.2
Osstem Implant 65,000 52,200 24.5 BUY 15.5 5.5 26.0 18.7 28.6 21.8
Dio 41,000 34,700 18.2 BUY 15.2 4.0 25.4 20.3 24.1 19.1
Dentium 50,000 37,450 33.5 BUY 10.9 1.8 16.1 12.9 17.0 13.3
Vieworks 87,000 56,000 55.4 BUY 11.4 4.0 17.8 15.3 17.7 14.6
Vatech 36,000 28,700 25.4 BUY 7.8 1.8 4.8 12.4 5.7 12.9
Rayence 22,000 18,600 18.3 HOLD 8.3 1.6 17.3 14.9 16.7 13.7
Medytox 600,000 506,800 18.4 BUY 27.4 12.4 36.0 28.4 37.0 30.7
Hugel 570,000 451,900 26.1 BUY 8.7 2.8 23.9 19.7 21.9 17.5
Note: Based on May 26 close
Source: QuantiWise, Samsung Securities
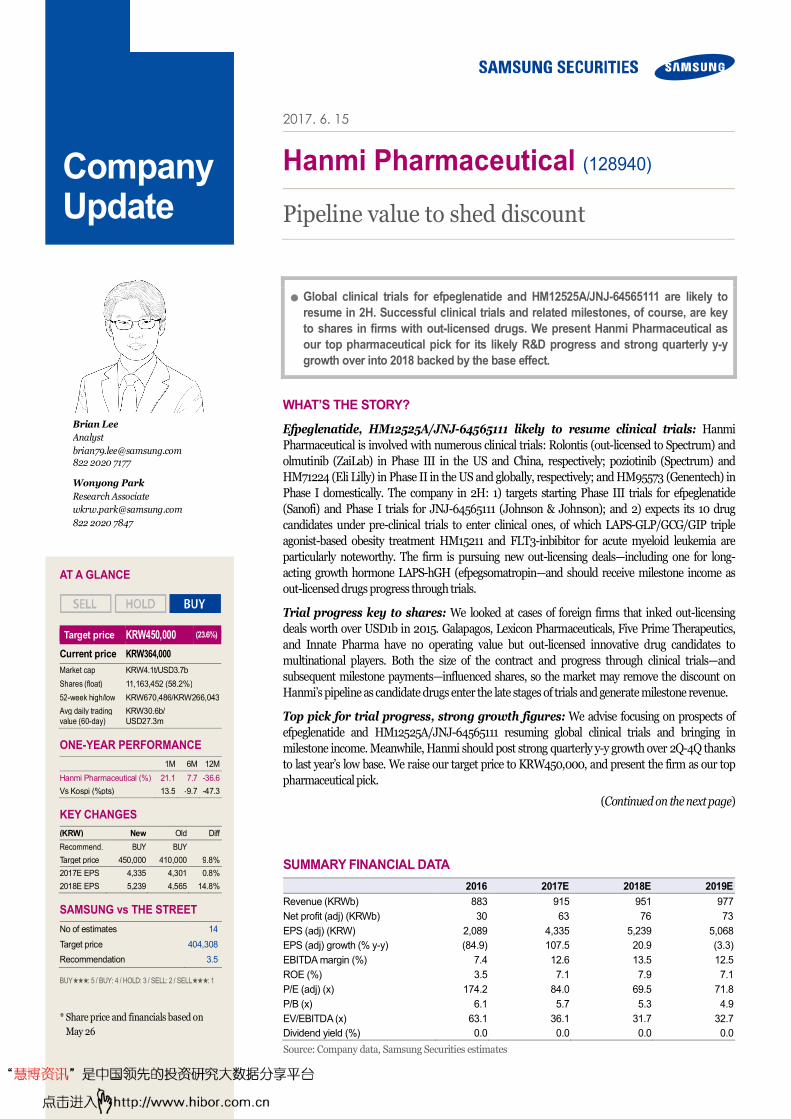
2017. 6. 15
Hanmi Pharmaceutical (128940)
Pipeline value to shed discount
● Global clinical trials for efpeglenatide and HM12525A/JNJ-64565111 are likely to
resume in 2H. Successful clinical trials and related milestones, of course, are key
to shares in firms with out-licensed drugs. We present Hanmi Pharmaceutical as
our top pharmaceutical pick for its likely R&D progress and strong quarterly y-y
growth over into 2018 backed by the base effect.
WHAT’S THE STORY?
Efpeglenatide, HM12525A/JNJ-64565111 likely to resume clinical trials: Hanmi
Pharmaceutical is involved with numerous clinical trials: Rolontis (out-licensed to Spectrum) and
olmutinib (ZaiLab) in Phase III in the US and China, respectively; poziotinib (Spectrum) and
HM71224 (Eli Lilly) in Phase II in the US and globally, respectively; and HM95573 (Genentech) in
Phase I domestically. The company in 2H: 1) targets starting Phase III trials for efpeglenatide
(Sanofi) and Phase I trials for JNJ-64565111 (Johnson & Johnson); and 2) expects its 10 drug
candidates under pre-clinical trials to enter clinical ones, of which LAPS-GLP/GCG/GIP triple
agonist-based obesity treatment HM15211 and FLT3-inbibitor for acute myeloid leukemia are
particularly noteworthy. The firm is pursuing new out-licensing deals—including one for long-
acting growth hormone LAPS-hGH (efpegsomatropin—and should receive milestone income as
out-licensed drugs progress through trials.
Trial progress key to shares: We looked at cases of foreign firms that inked out-licensing
deals worth over USD1b in 2015. Galapagos, Lexicon Pharmaceuticals, Five Prime Therapeutics,
and Innate Pharma have no operating value but out-licensed innovative drug candidates to
multinational players. Both the size of the contract and progress through clinical trials—and
subsequent milestone payments—influenced shares, so the market may remove the discount on
Hanmi’s pipeline as candidate drugs enter the late stages of trials and generate milestone revenue.
Top pick for trial progress, strong growth figures: We advise focusing on prospects of
efpeglenatide and HM12525A/JNJ-64565111 resuming global clinical trials and bringing in
milestone income. Meanwhile, Hanmi should post strong quarterly y-y growth over 2Q-4Q thanks
to last year’s low base. We raise our target price to KRW450,000, and present the firm as our top
pharmaceutical pick.
(Continued on the next page)
Company Update
SUMMARY FINANCIAL DATA
2016 2017E 2018E 2019E
Revenue (KRWb) 883 915 951 977
Net profit (adj) (KRWb) 30 63 76 73
EPS (adj) (KRW) 2,089 4,335 5,239 5,068
EPS (adj) growth (% y-y) (84.9) 107.5 20.9 (3.3)
EBITDA margin (%) 7.4 12.6 13.5 12.5
ROE (%) 3.5 7.1 7.9 7.1
P/E (adj) (x) 174.2 84.0 69.5 71.8
P/B (x) 6.1 5.7 5.3 4.9
EV/EBITDA (x) 63.1 36.1 31.7 32.7
Dividend yield (%) 0.0 0.0 0.0 0.0
Source: Company data, Samsung Securities estimates
Brian Lee
Analyst
[email protected] 822 2020 7177
Wonyong Park
Research Associate
822 2020 7847
AT A GLANCE
Target price KRW450,000 (23.6%)
Current price KRW364,000
Market cap KRW4.1t/USD3.7b
Shares (float) 11,163,452 (58.2%)
52-week high/low KRW670,486/KRW266,043
Avg daily trading value (60-day)
KRW30.6b/ USD27.3m
ONE-YEAR PERFORMANCE
1M 6M 12M
Hanmi Pharmaceutical (%) 21.1 7.7 -36.6
Vs Kospi (%pts) 13.5 -9.7 -47.3
KEY CHANGES
(KRW) New Old Diff
Recommend. BUY BUY
Target price 450,000 410,000 9.8%
2017E EPS 4,335 4,301 0.8%
2018E EPS 5,239 4,565 14.8%
SAMSUNG vs THE STREET
No of estimates 14
Target price 404,308
Recommendation 3.5
BUY★★★: 5 / BUY: 4 / HOLD: 3 / SELL: 2 / SELL★★★: 1
* Share price and financials based on
May 26
Hanmi
Pharmaceutical
2017. 6. 15
106
Foreign firms with big out-licensing deals in 2015: Galapagos (Belgium) and Gilead
Sciences in Dec 2015 inked a deal to develop and commercialize JAK 1-selective inhibitor filgotinib
for arthritis (under Phase II trials), with the latter paying the former USD2.075b (USD725m upfront,
USD1.35b in milestones, royalties of at least 20%). Lexicon Pharmaceuticals (US) in Nov 2015 out-
licensed diabetes candidate sotagliflozin (Phase III) to Sanofi for USD1.7b (USD300m upfront,
USD1.4b in milestones, royalties of at least 10%). The drug works as a dual inhibitor of SGLT-1 and
SGLT-2. In Oct 2015, Five Prime Therapeutics (US) out-licensed CSF1R inhibitor cabiralizumab
(Phase I) to BMS for USD1.75b (USD350m upfront, USD1.4b in milestones, royalties of 15-25%). In
Apr 2015, Innate Pharma (France) out-licensed NKG2A inhibitor monalizumab (Phase II) to
AstraZeneca for USD1.275b (USD250m upfront, USD1.025b in milestones, royalties of 10%).
Trial progress key to shares: Based on 30-day average share prices before and after the out-
licensing deals, the combined market cap of the four firms leapt USD314m, equal to 77.3% of their
USD460m in upfront payments. Performances have since diverged. For recent 30-day average share
prices (relative to 30-day averages right after the deals), Galapagos is up 91.5%, Lexicon 16.7%, Five
Prime 4.2%, while Innate has shed 25.2%. Progress through clinical trials was the difference maker.
Galapagos in May 2016 said it would start global Phase III trials by end-year for indications of
Crohn’s disease and ulcerative colitis. It dosed the first patient for Crohn’s disease in Nov 2016 and
for ulcerative colitis in Dec 2016, triggering respective milestone payments of USD50m and USD10m.
Lexicon in Mar 2016 announced plans to start global Phase III trials for type-2 diabetes within the
year, and in Sep 2016 reported successful results for global Phase III trials for type-1 diabetes. In
contrast, Five Prime in Oct 2016 initiated the Phase Ib portion of a clinical trial evaluating its drug
candidate in combination with BMS’s Opdivo. Innate entered Phase I/II trials of its drug candidate in
combination with Imbruvica (ibrutinib) in Oct 2015, Phase Ib/II trials in combination with Erbitux
(cetuximab) in Dec 2015, and Phase I trials in combination with Imfinzi (durvalumab) in Feb 2016.
Share price performances, of course, are impacted by both the size of out-licensing contracts and also
the ability of out-licensed drug candidates to progress through trials and trigger milestone payments.
Hanmi’s pipeline value to rise as drugs make progress, trigger milestones: Galapagos,
Lexicon, Five Prime, and Innate have no operating value but successfully out-licensed innovative
drug candidates to multinational players. Lacking operating value, their market caps can be seen as
the equivalent of the value of their drug pipeline. Based on recent 30-day market caps, we estimate
market caps of the four firms at USD4b, USD1.62b, USD897m, and USD615m, respectively. Hanmi
Pharmaceutical has more pipeline drugs in late-stage trials than any of the four firms do, with several
of them already under out-licensing deals. The value of the company’s pipeline, however, has been
discounted following a series of negative news flows in 2016—eg, a September cancellation of an out-
licensing deal with Boehringer Ingelheim for HM61713 (olmutinib), a November suspension of
patient recruitment for Phase I trials of HM12525A/JNJ-64565111, and December revisions to an
out-licensing contract with Sanofi for the Quantum Project. This year, Hanmi’s new CEO in
interviews on Feb 13 and May 10 said sample production for efpeglenatide and HM12525A/JNJ-
64565111 will commence soon, allowing global clinical trials to resume. The company’s pipeline may
be reevaluated as drug candidates progress to latter stages of trials and bring in milestone revenue.
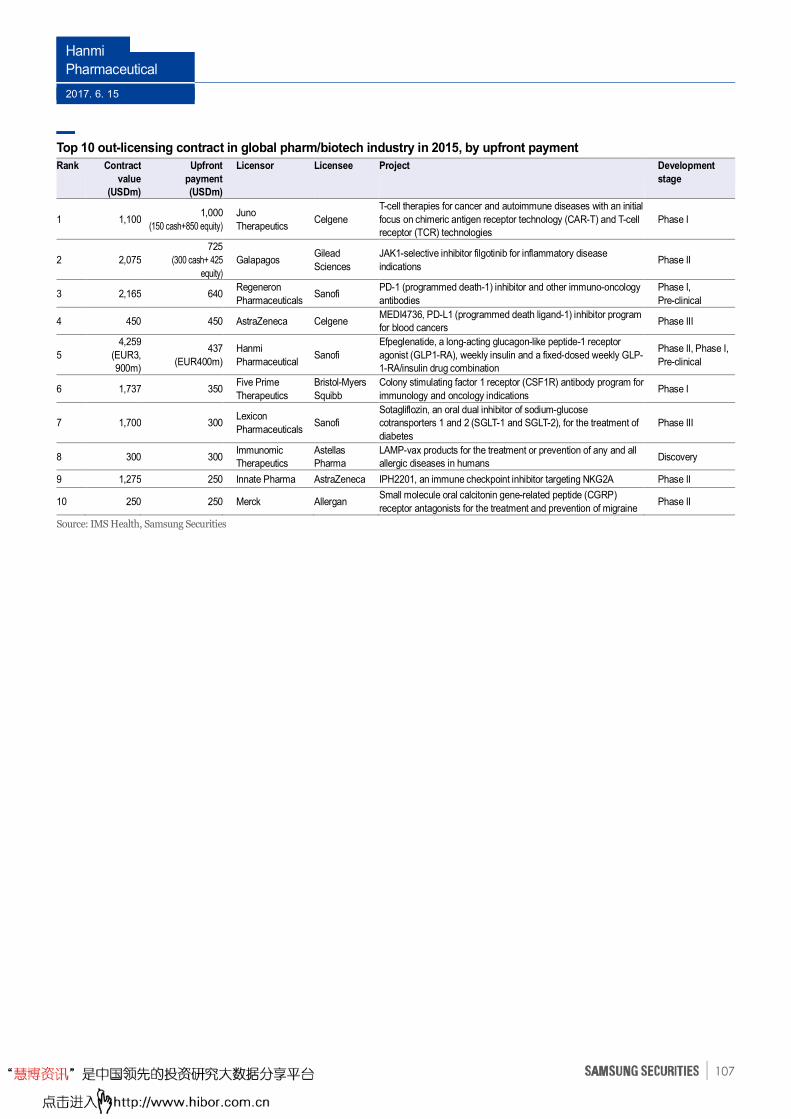
Hanmi
Pharmaceutical
2017. 6. 15
107
Top 10 out-licensing contract in global pharm/biotech industry in 2015, by upfront payment
Rank Contract
value
(USDm)
Upfront
payment
(USDm)
Licensor Licensee Project Development
stage
1 1,100 1,000
(150 cash+850 equity)
Juno
Therapeutics Celgene
T-cell therapies for cancer and autoimmune diseases with an initial
focus on chimeric antigen receptor technology (CAR-T) and T-cell
receptor (TCR) technologies
Phase I
2 2,075
725
(300 cash+ 425
equity)
Galapagos Gilead
Sciences
JAK1-selective inhibitor filgotinib for inflammatory disease
indications Phase II
3 2,165 640 Regeneron
Pharmaceuticals Sanofi
PD-1 (programmed death-1) inhibitor and other immuno-oncology
antibodies
Phase I,
Pre-clinical
4 450 450 AstraZeneca Celgene MEDI4736, PD-L1 (programmed death ligand-1) inhibitor program
for blood cancers Phase III
5
4,259
(EUR3,
900m)
437
(EUR400m)
Hanmi
Pharmaceutical Sanofi
Efpeglenatide, a long-acting glucagon-like peptide-1 receptor
agonist (GLP1-RA), weekly insulin and a fixed-dosed weekly GLP-
1-RA/insulin drug combination
Phase II, Phase I,
Pre-clinical
6 1,737 350 Five Prime
Therapeutics
Bristol-Myers
Squibb
Colony stimulating factor 1 receptor (CSF1R) antibody program for
immunology and oncology indications Phase I
7 1,700 300 Lexicon
Pharmaceuticals Sanofi
Sotagliflozin, an oral dual inhibitor of sodium-glucose
cotransporters 1 and 2 (SGLT-1 and SGLT-2), for the treatment of
diabetes
Phase III
8 300 300 Immunomic
Therapeutics
Astellas
Pharma
LAMP-vax products for the treatment or prevention of any and all
allergic diseases in humans Discovery
9 1,275 250 Innate Pharma AstraZeneca IPH2201, an immune checkpoint inhibitor targeting NKG2A Phase II
10 250 250 Merck Allergan Small molecule oral calcitonin gene-related peptide (CGRP)
receptor antagonists for the treatment and prevention of migraine Phase II
Source: IMS Health, Samsung Securities
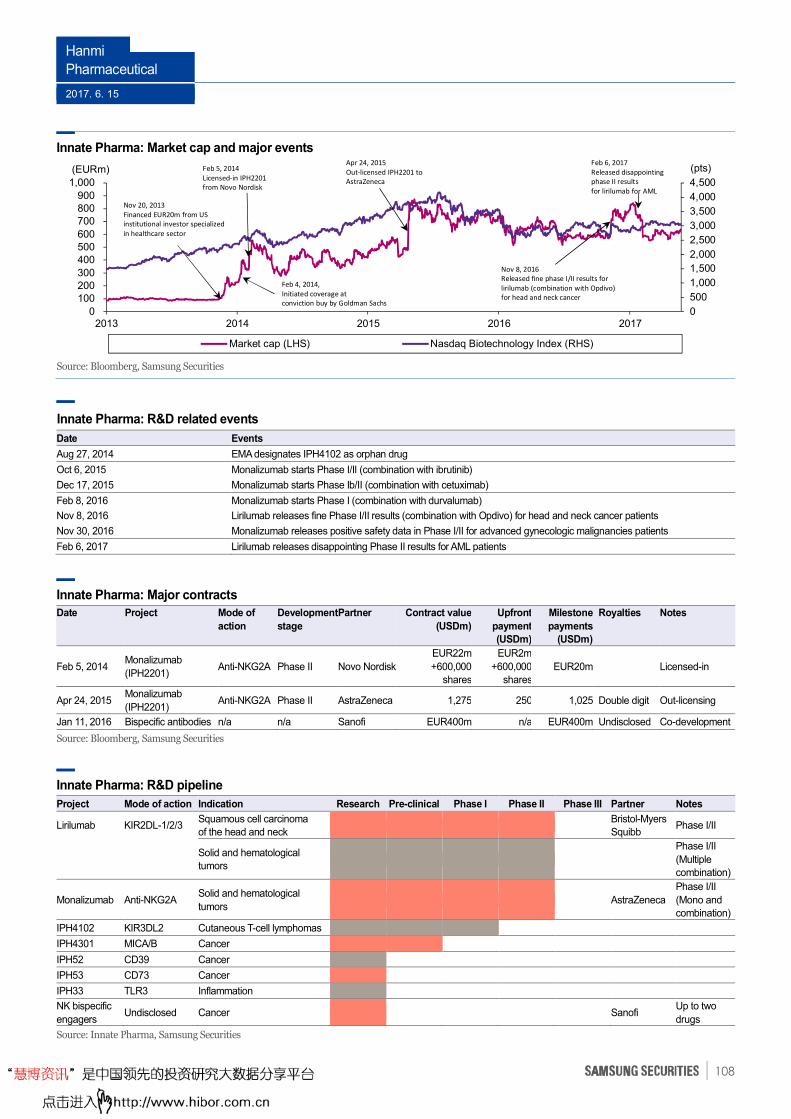
Hanmi
Pharmaceutical
2017. 6. 15
108
Innate Pharma: Market cap and major events
Source: Bloomberg, Samsung Securities
Innate Pharma: R&D related events
Date Events
Aug 27, 2014 EMA designates IPH4102 as orphan drug
Oct 6, 2015 Monalizumab starts Phase I/II (combination with ibrutinib)
Dec 17, 2015 Monalizumab starts Phase Ib/II (combination with cetuximab)
Feb 8, 2016 Monalizumab starts Phase I (combination with durvalumab)
Nov 8, 2016 Lirilumab releases fine Phase I/II results (combination with Opdivo) for head and neck cancer patients
Nov 30, 2016 Monalizumab releases positive safety data in Phase I/II for advanced gynecologic malignancies patients
Feb 6, 2017 Lirilumab releases disappointing Phase II results for AML patients
Innate Pharma: Major contracts
Date
Project
Mode of
action
Development
stage
Partner
Contract value
(USDm)
Upfront
payment
(USDm)
Milestone
payments
(USDm)
Royalties
Notes
Feb 5, 2014 Monalizumab
(IPH2201) Anti-NKG2A Phase II Novo Nordisk
EUR22m
+600,000
shares
EUR2m
+600,000
shares
EUR20m Licensed-in
Apr 24, 2015 Monalizumab
(IPH2201) Anti-NKG2A Phase II AstraZeneca 1,275 250 1,025 Double digit Out-licensing
Jan 11, 2016 Bispecific antibodies n/a n/a Sanofi EUR400m n/a EUR400m Undisclosed Co-development
Source: Bloomberg, Samsung Securities
Innate Pharma: R&D pipeline
Project Mode of action Indication Research Pre-clinical Phase I Phase II Phase III Partner Notes
Lirilumab KIR2DL-1/2/3 Squamous cell carcinoma
of the head and neck Bristol-Myers
Squibb Phase I/II
Solid and hematological
tumors
Phase I/II
(Multiple
combination)
Monalizumab Anti-NKG2A Solid and hematological
tumors AstraZeneca
Phase I/II
(Mono and
combination)
IPH4102 KIR3DL2 Cutaneous T-cell lymphomas
IPH4301 MICA/B Cancer
IPH52 CD39 Cancer
IPH53 CD73 Cancer
IPH33 TLR3 Inflammation
NK bispecific
engagers Undisclosed Cancer Sanofi
Up to two
drugs
Source: Innate Pharma, Samsung Securities
0
500
1,000
1,500
2,000
2,500
3,000
3,500
4,000
4,500
0
100200300
400500600
700800900
1,000
2013 2014 2015 2016 2017
Market cap (LHS) Nasdaq Biotechnology Index (RHS)
(EURm)Apr 24, 2015
Out-licensed IPH2201 to
AstraZeneca
Feb 5, 2014
Licensed-in IPH2201
from Novo Nordisk
Feb 6, 2017
Released disappointing
phase II results
for lirilumab for AML
Nov 8, 2016
Released fine phase I/II results for
lirilumab (combination with Opdivo)
for head and neck cancer
Nov 20, 2013
Financed EUR20m from US
institutional investor specialized
in healthcare sector
Feb 4, 2014,
Initiated coverage at
conviction buy by Goldman Sachs
(pts)
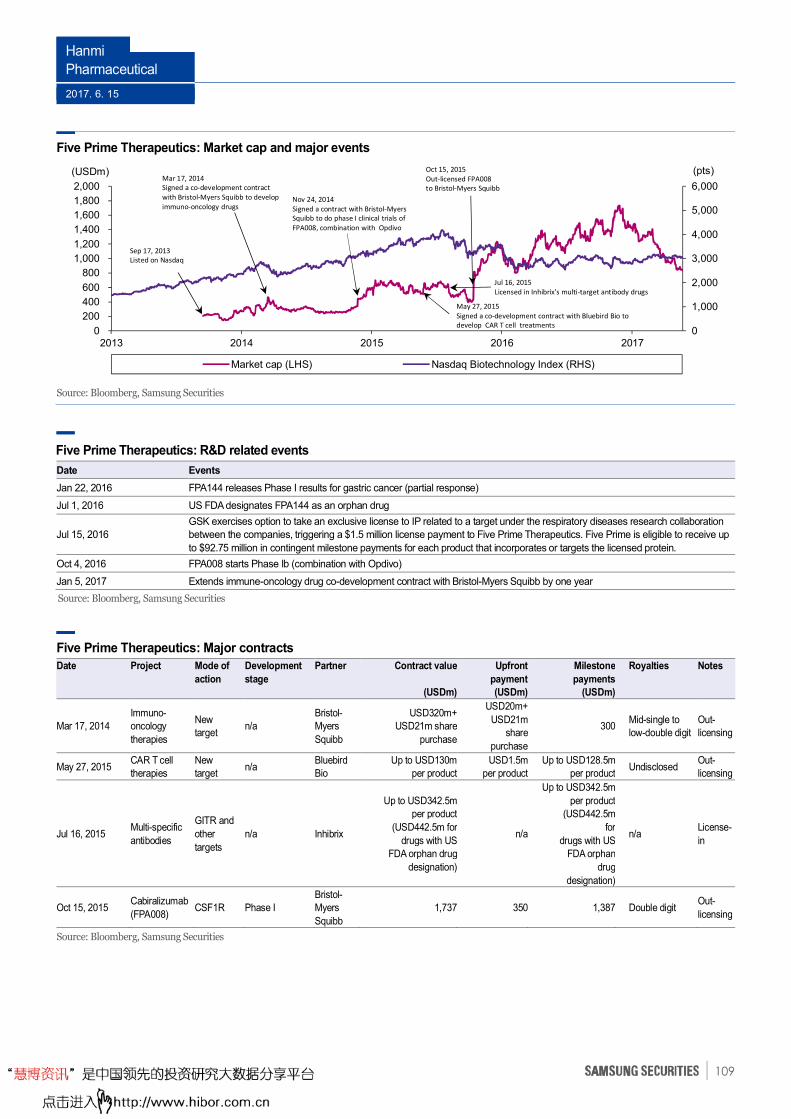
Hanmi
Pharmaceutical
2017. 6. 15
109
Five Prime Therapeutics: Market cap and major events
Source: Bloomberg, Samsung Securities
Five Prime Therapeutics: R&D related events
Date Events
Jan 22, 2016 FPA144 releases Phase I results for gastric cancer (partial response)
Jul 1, 2016 US FDA designates FPA144 as an orphan drug
Jul 15, 2016
GSK exercises option to take an exclusive license to IP related to a target under the respiratory diseases research collaboration
between the companies, triggering a $1.5 million license payment to Five Prime Therapeutics. Five Prime is eligible to receive up
to $92.75 million in contingent milestone payments for each product that incorporates or targets the licensed protein.
Oct 4, 2016 FPA008 starts Phase Ib (combination with Opdivo)
Jan 5, 2017 Extends immune-oncology drug co-development contract with Bristol-Myers Squibb by one year
Source: Bloomberg, Samsung Securities
Five Prime Therapeutics: Major contracts
Date
Project
Mode of
action
Development
stage
Partner
Contract value
(USDm)
Upfront
payment
(USDm)
Milestone
payments
(USDm)
Royalties
Notes
Mar 17, 2014
Immuno-
oncology
therapies
New
target n/a
Bristol-
Myers
Squibb
USD320m+
USD21m share
purchase
USD20m+
USD21m
share
purchase
300Mid-single to
low-double digit
Out-
licensing
May 27, 2015 CAR T cell
therapies
New
target n/a
Bluebird
Bio
Up to USD130m
per product
USD1.5m
per product
Up to USD128.5m
per product Undisclosed
Out-
licensing
Jul 16, 2015 Multi-specific
antibodies
GITR and
other
targets
n/a Inhibrix
Up to USD342.5m
per product
(USD442.5m for
drugs with US
FDA orphan drug
designation)
n/a
Up to USD342.5m
per product
(USD442.5m
for
drugs with US
FDA orphan
drug
designation)
n/a License-
in
Oct 15, 2015 Cabiralizumab
(FPA008) CSF1R Phase I
Bristol-
Myers
Squibb
1,737 350 1,387 Double digit Out-
licensing
Source: Bloomberg, Samsung Securities
0
1,000
2,000
3,000
4,000
5,000
6,000
0
200
400
600
800
1,000
1,200
1,400
1,600
1,800
2,000
2013 2014 2015 2016 2017
Market cap (LHS) Nasdaq Biotechnology Index (RHS)
(USDm) Oct 15, 2015
Out-licensed FPA008
to Bristol-Myers Squibb
Nov 24, 2014
Signed a contract with Bristol-Myers
Squibb to do phase I clinical trials of
FPA008, combination with Opdivo
Sep 17, 2013
Listed on Nasdaq
(pts)Mar 17, 2014
Signed a co-development contract
with Bristol-Myers Squibb to develop
immuno-oncology drugs
May 27, 2015
Signed a co-development contract with Bluebird Bio to
develop CAR T cell treatments
Jul 16, 2015
Licensed in Inhibrix's multi-target antibody drugs
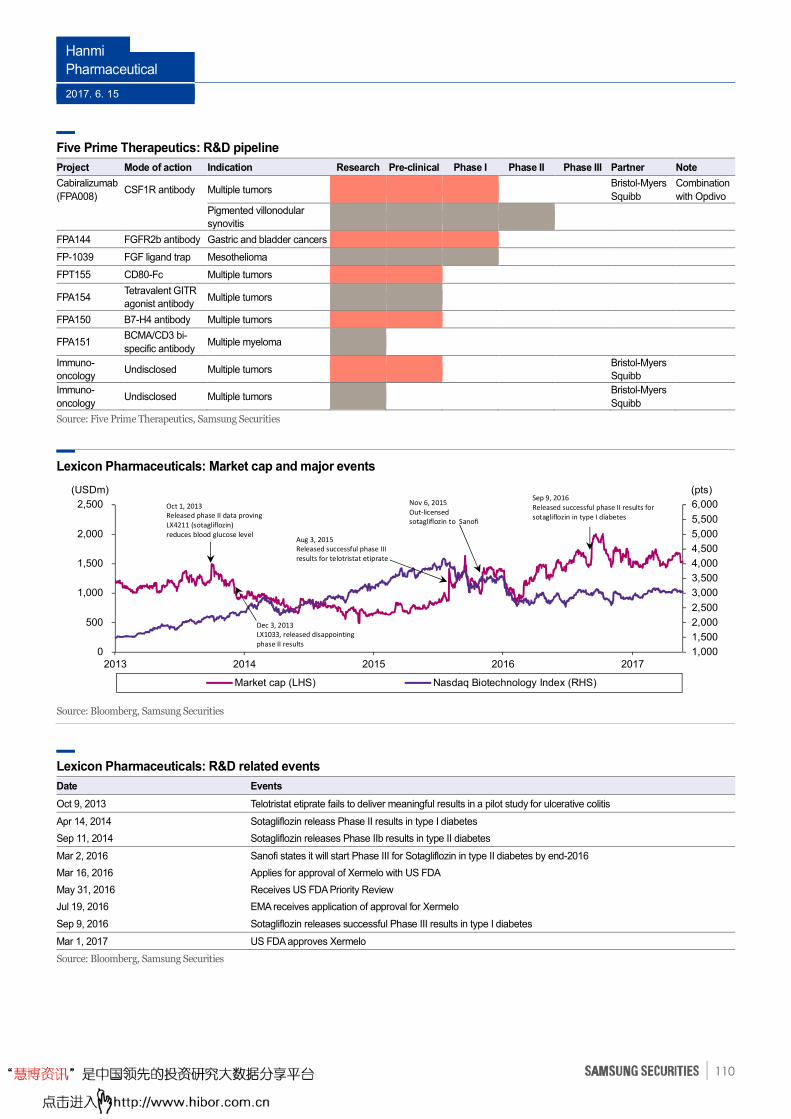
Hanmi
Pharmaceutical
2017. 6. 15
110
Five Prime Therapeutics: R&D pipeline
Project Mode of action Indication Research Pre-clinical Phase I Phase II Phase III Partner Note
Cabiralizumab
(FPA008) CSF1R antibody Multiple tumors
Bristol-Myers
Squibb
Combination
with Opdivo
Pigmented villonodular
synovitis
FPA144 FGFR2b antibody Gastric and bladder cancers
FP-1039 FGF ligand trap Mesothelioma
FPT155 CD80-Fc Multiple tumors
FPA154 Tetravalent GITR
agonist antibody Multiple tumors
FPA150 B7-H4 antibody Multiple tumors
FPA151 BCMA/CD3 bi-
specific antibody Multiple myeloma
Immuno-
oncology Undisclosed Multiple tumors
Bristol-Myers
Squibb
Immuno-
oncology Undisclosed Multiple tumors
Bristol-Myers
Squibb
Source: Five Prime Therapeutics, Samsung Securities
Lexicon Pharmaceuticals: Market cap and major events
Source: Bloomberg, Samsung Securities
Lexicon Pharmaceuticals: R&D related events
Date Events
Oct 9, 2013 Telotristat etiprate fails to deliver meaningful results in a pilot study for ulcerative colitis
Apr 14, 2014 Sotagliflozin releass Phase II results in type I diabetes
Sep 11, 2014 Sotagliflozin releases Phase IIb results in type II diabetes
Mar 2, 2016 Sanofi states it will start Phase III for Sotagliflozin in type II diabetes by end-2016
Mar 16, 2016 Applies for approval of Xermelo with US FDA
May 31, 2016 Receives US FDA Priority Review
Jul 19, 2016 EMA receives application of approval for Xermelo
Sep 9, 2016 Sotagliflozin releases successful Phase III results in type I diabetes
Mar 1, 2017 US FDA approves Xermelo
Source: Bloomberg, Samsung Securities
1,000
1,500
2,000
2,500
3,000
3,500
4,000
4,500
5,000
5,500
6,000
0
500
1,000
1,500
2,000
2,500
2013 2014 2015 2016 2017
Market cap (LHS) Nasdaq Biotechnology Index (RHS)
(USDm)Nov 6, 2015
Out-licensed
sotagliflozin to Sanofi
Aug 3, 2015
Released successful phase III
results for telotristat etiprate
Sep 9, 2016
Released successful phase II results for
sotagliflozin in type I diabetes
Oct 1, 2013
Released phase II data proving
LX4211 (sotagliflozin)
reduces blood glucose level
Dec 3, 2013
LX1033, released disappointing
phase II results
(pts)
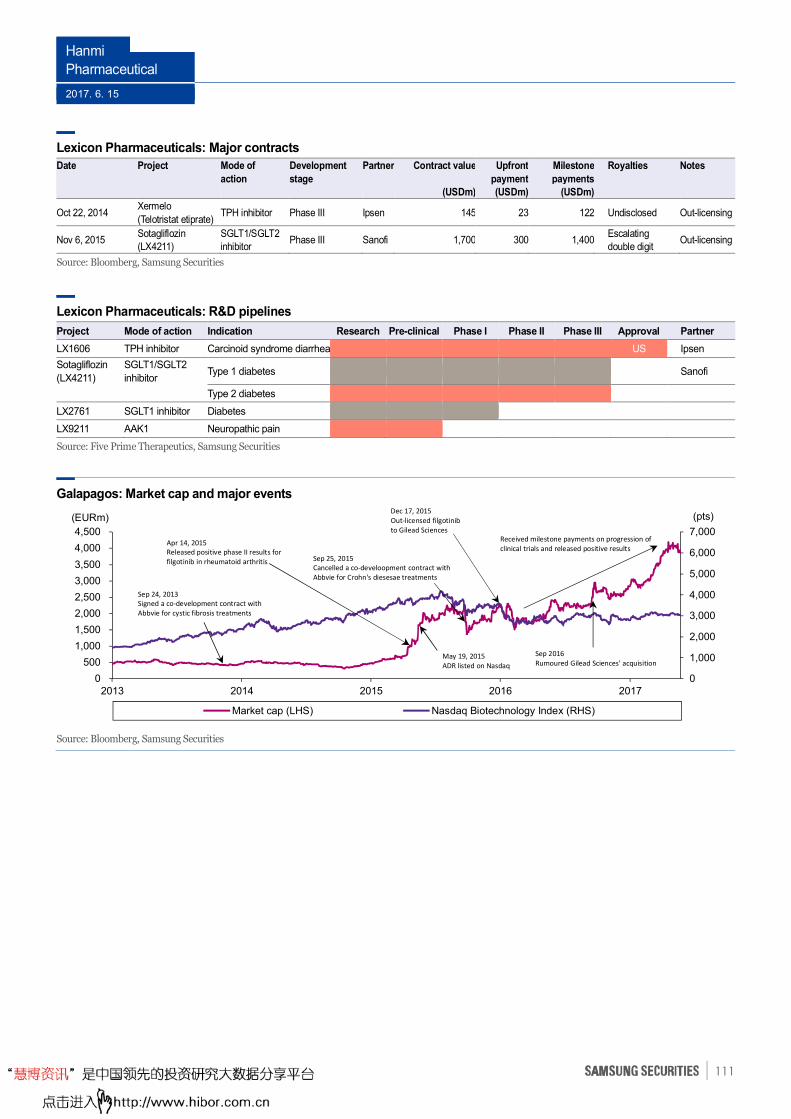
Hanmi
Pharmaceutical
2017. 6. 15
111
Lexicon Pharmaceuticals: Major contracts
Date
Project
Mode of
action
Development
stage
Partner
Contract value
(USDm)
Upfront
payment
(USDm)
Milestone
payments
(USDm)
Royalties
Notes
Oct 22, 2014 Xermelo
(Telotristat etiprate) TPH inhibitor Phase III Ipsen 145 23 122 Undisclosed Out-licensing
Nov 6, 2015 Sotagliflozin
(LX4211)
SGLT1/SGLT2
inhibitor Phase III Sanofi 1,700 300 1,400
Escalating
double digit Out-licensing
Source: Bloomberg, Samsung Securities
Lexicon Pharmaceuticals: R&D pipelines
Project Mode of action Indication Research Pre-clinical Phase I Phase II Phase III Approval Partner
LX1606 TPH inhibitor Carcinoid syndrome diarrhea US Ipsen
Sotagliflozin
(LX4211)
SGLT1/SGLT2
inhibitor Type 1 diabetes Sanofi
Type 2 diabetes
LX2761 SGLT1 inhibitor Diabetes
LX9211 AAK1 Neuropathic pain
Source: Five Prime Therapeutics, Samsung Securities
Galapagos: Market cap and major events
Source: Bloomberg, Samsung Securities
0
1,000
2,000
3,000
4,000
5,000
6,000
7,000
0
500
1,000
1,500
2,000
2,500
3,000
3,500
4,000
4,500
2013 2014 2015 2016 2017
Market cap (LHS) Nasdaq Biotechnology Index (RHS)
(EURm)Dec 17, 2015
Out-licensed filgotinib
to Gilead Sciences
May 19, 2015
ADR listed on Nasdaq
Received milestone payments on progression of
clinical trials and released positive results
Sep 24, 2013
Signed a co-development contract with
Abbvie for cystic fibrosis treatments
Apr 14, 2015
Released positive phase II results for
filgotinib in rheumatoid arthritis
(pts)
Sep 25, 2015
Cancelled a co-develoopment contract with
Abbvie for Crohn's diesesae treatments
Sep 2016
Rumoured Gilead Sciences' acquisition
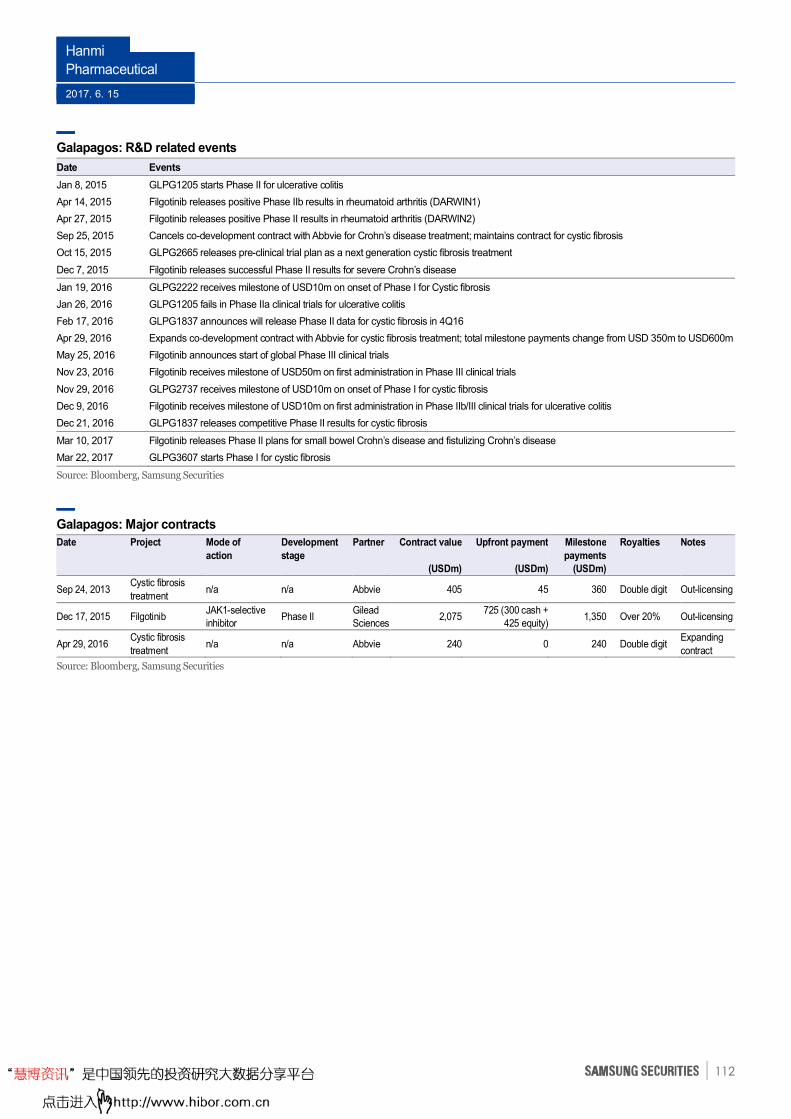
Hanmi
Pharmaceutical
2017. 6. 15
112
Galapagos: R&D related events
Date Events
Jan 8, 2015 GLPG1205 starts Phase II for ulcerative colitis
Apr 14, 2015 Filgotinib releases positive Phase IIb results in rheumatoid arthritis (DARWIN1)
Apr 27, 2015 Filgotinib releases positive Phase II results in rheumatoid arthritis (DARWIN2)
Sep 25, 2015 Cancels co-development contract with Abbvie for Crohn’s disease treatment; maintains contract for cystic fibrosis
Oct 15, 2015 GLPG2665 releases pre-clinical trial plan as a next generation cystic fibrosis treatment
Dec 7, 2015 Filgotinib releases successful Phase II results for severe Crohn’s disease
Jan 19, 2016 GLPG2222 receives milestone of USD10m on onset of Phase I for Cystic fibrosis
Jan 26, 2016 GLPG1205 fails in Phase IIa clinical trials for ulcerative colitis
Feb 17, 2016 GLPG1837 announces will release Phase II data for cystic fibrosis in 4Q16
Apr 29, 2016 Expands co-development contract with Abbvie for cystic fibrosis treatment; total milestone payments change from USD 350m to USD600m
May 25, 2016 Filgotinib announces start of global Phase III clinical trials
Nov 23, 2016 Filgotinib receives milestone of USD50m on first administration in Phase III clinical trials
Nov 29, 2016 GLPG2737 receives milestone of USD10m on onset of Phase I for cystic fibrosis
Dec 9, 2016 Filgotinib receives milestone of USD10m on first administration in Phase IIb/III clinical trials for ulcerative colitis
Dec 21, 2016 GLPG1837 releases competitive Phase II results for cystic fibrosis
Mar 10, 2017 Filgotinib releases Phase II plans for small bowel Crohn’s disease and fistulizing Crohn’s disease
Mar 22, 2017 GLPG3607 starts Phase I for cystic fibrosis
Source: Bloomberg, Samsung Securities
Galapagos: Major contracts
Date
Project
Mode of
action
Development
stage
Partner
Contract value
(USDm)
Upfront payment
(USDm)
Milestone
payments
(USDm)
Royalties
Notes
Sep 24, 2013 Cystic fibrosis
treatment n/a n/a Abbvie 405 45 360 Double digit Out-licensing
Dec 17, 2015 Filgotinib JAK1-selective
inhibitor Phase II
Gilead
Sciences 2,075
725 (300 cash +
425 equity)1,350 Over 20% Out-licensing
Apr 29, 2016 Cystic fibrosis
treatment n/a n/a Abbvie 240 0 240 Double digit
Expanding
contract
Source: Bloomberg, Samsung Securities
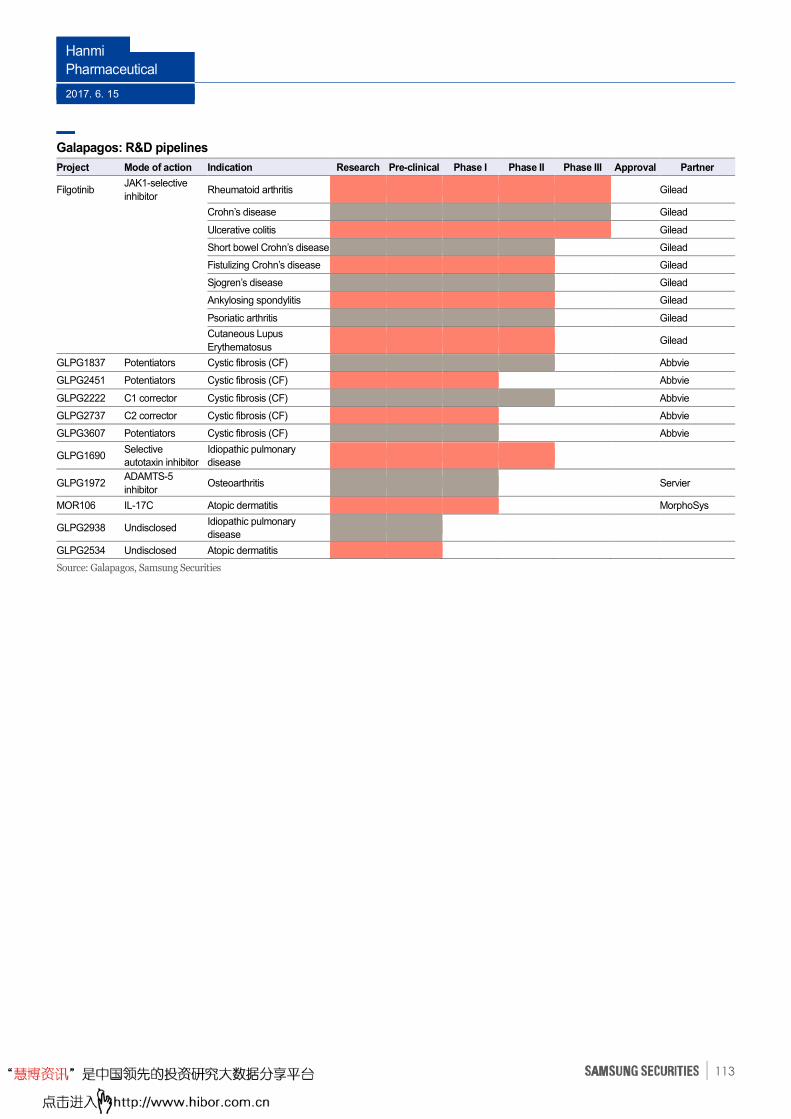
Hanmi
Pharmaceutical
2017. 6. 15
113
Galapagos: R&D pipelines
Project Mode of action Indication Research Pre-clinical Phase I Phase II Phase III Approval Partner
Filgotinib JAK1-selective
inhibitor Rheumatoid arthritis Gilead
Crohn’s disease Gilead
Ulcerative colitis Gilead
Short bowel Crohn’s disease Gilead
Fistulizing Crohn’s disease Gilead
Sjogren’s disease Gilead
Ankylosing spondylitis Gilead
Psoriatic arthritis Gilead
Cutaneous Lupus
Erythematosus Gilead
GLPG1837 Potentiators Cystic fibrosis (CF) Abbvie
GLPG2451 Potentiators Cystic fibrosis (CF) Abbvie
GLPG2222 C1 corrector Cystic fibrosis (CF) Abbvie
GLPG2737 C2 corrector Cystic fibrosis (CF) Abbvie
GLPG3607 Potentiators Cystic fibrosis (CF) Abbvie
GLPG1690 Selective
autotaxin inhibitor
Idiopathic pulmonary
disease
GLPG1972 ADAMTS-5
inhibitor Osteoarthritis Servier
MOR106 IL-17C Atopic dermatitis MorphoSys
GLPG2938 Undisclosed Idiopathic pulmonary
disease
GLPG2534 Undisclosed Atopic dermatitis
Source: Galapagos, Samsung Securities
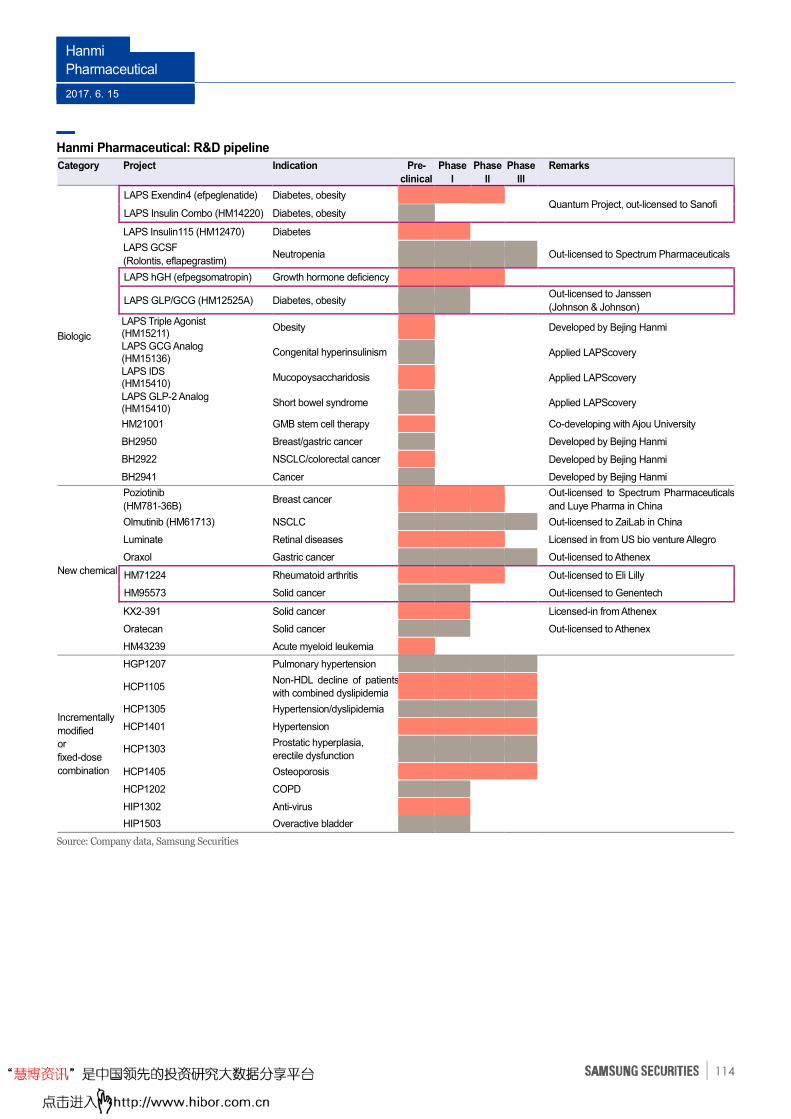
Hanmi
Pharmaceutical
2017. 6. 15
114
Hanmi Pharmaceutical: R&D pipeline
Category
Project
Indication
Pre-
clinical
Phase
l
Phase
ll
Phase
lll
Remarks
Biologic
LAPS Exendin4 (efpeglenatide) Diabetes, obesity Quantum Project, out-licensed to Sanofi
LAPS Insulin Combo (HM14220) Diabetes, obesity
LAPS Insulin115 (HM12470) Diabetes
LAPS GCSF
(Rolontis, eflapegrastim) Neutropenia Out-licensed to Spectrum Pharmaceuticals
LAPS hGH (efpegsomatropin) Growth hormone deficiency
LAPS GLP/GCG (HM12525A) Diabetes, obesity Out-licensed to Janssen
(Johnson & Johnson)
LAPS Triple Agonist (HM15211)
Obesity Developed by Bejing Hanmi
LAPS GCG Analog (HM15136)
Congenital hyperinsulinism Applied LAPScovery
LAPS IDS (HM15410)
Mucopoysaccharidosis Applied LAPScovery
LAPS GLP-2 Analog (HM15410)
Short bowel syndrome Applied LAPScovery
HM21001 GMB stem cell therapy Co-developing with Ajou University
BH2950 Breast/gastric cancer Developed by Bejing Hanmi
BH2922 NSCLC/colorectal cancer Developed by Bejing Hanmi
BH2941 Cancer Developed by Bejing Hanmi
New chemical
Poziotinib
(HM781-36B) Breast cancer
Out-licensed to Spectrum Pharmaceuticals
and Luye Pharma in China
Olmutinib (HM61713) NSCLC Out-licensed to ZaiLab in China
Luminate Retinal diseases Licensed in from US bio venture Allegro
Oraxol Gastric cancer Out-licensed to Athenex
HM71224 Rheumatoid arthritis Out-licensed to Eli Lilly
HM95573 Solid cancer Out-licensed to Genentech
KX2-391 Solid cancer Licensed-in from Athenex
Oratecan Solid cancer Out-licensed to Athenex
HM43239 Acute myeloid leukemia
Incrementally
modified
or
fixed-dose
combination
HGP1207 Pulmonary hypertension
HCP1105 Non-HDL decline of patients
with combined dyslipidemia
HCP1305 Hypertension/dyslipidemia
HCP1401 Hypertension
HCP1303 Prostatic hyperplasia,
erectile dysfunction
HCP1405 Osteoporosis
HCP1202 COPD
HIP1302 Anti-virus
HIP1503 Overactive bladder
Source: Company data, Samsung Securities
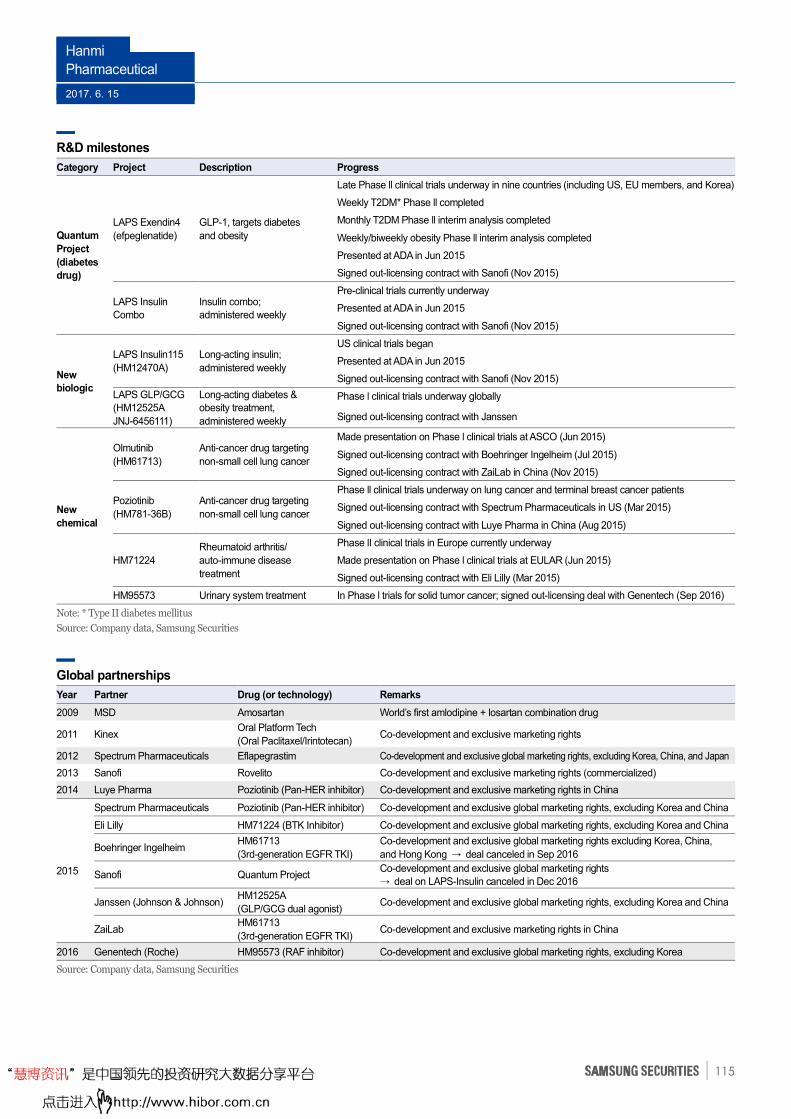
Hanmi
Pharmaceutical
2017. 6. 15
115
R&D milestones
Category Project Description Progress
Quantum
Project
(diabetes
drug)
LAPS Exendin4
(efpeglenatide)
GLP-1, targets diabetes
and obesity
Late Phase ll clinical trials underway in nine countries (including US, EU members, and Korea)
Weekly T2DM* Phase ll completed
Monthly T2DM Phase ll interim analysis completed
Weekly/biweekly obesity Phase ll interim analysis completed
Presented at ADA in Jun 2015
Signed out-licensing contract with Sanofi (Nov 2015)
LAPS Insulin
Combo
Insulin combo;
administered weekly
Pre-clinical trials currently underway
Presented at ADA in Jun 2015
Signed out-licensing contract with Sanofi (Nov 2015)
New
biologic
LAPS Insulin115
(HM12470A)
Long-acting insulin;
administered weekly
US clinical trials began
Presented at ADA in Jun 2015
Signed out-licensing contract with Sanofi (Nov 2015)
LAPS GLP/GCG
(HM12525A
JNJ-6456111)
Long-acting diabetes &
obesity treatment,
administered weekly
Phase l clinical trials underway globally
Signed out-licensing contract with Janssen
New
chemical
Olmutinib
(HM61713)
Anti-cancer drug targeting
non-small cell lung cancer
Made presentation on Phase l clinical trials at ASCO (Jun 2015)
Signed out-licensing contract with Boehringer Ingelheim (Jul 2015)
Signed out-licensing contract with ZaiLab in China (Nov 2015)
Poziotinib
(HM781-36B)
Anti-cancer drug targeting
non-small cell lung cancer
Phase ll clinical trials underway on lung cancer and terminal breast cancer patients
Signed out-licensing contract with Spectrum Pharmaceuticals in US (Mar 2015)
Signed out-licensing contract with Luye Pharma in China (Aug 2015)
HM71224
Rheumatoid arthritis/
auto-immune disease
treatment
Phase lI clinical trials in Europe currently underway
Made presentation on Phase l clinical trials at EULAR (Jun 2015)
Signed out-licensing contract with Eli Lilly (Mar 2015)
HM95573 Urinary system treatment In Phase l trials for solid tumor cancer; signed out-licensing deal with Genentech (Sep 2016)
Note: * Type II diabetes mellitus
Source: Company data, Samsung Securities
Global partnerships
Year Partner Drug (or technology) Remarks
2009 MSD Amosartan World’s first amlodipine + losartan combination drug
2011 Kinex Oral Platform Tech
(Oral Paclitaxel/Irintotecan) Co-development and exclusive marketing rights
2012 Spectrum Pharmaceuticals Eflapegrastim Co-development and exclusive global marketing rights, excluding Korea, China, and Japan
2013 Sanofi Rovelito Co-development and exclusive marketing rights (commercialized)
2014 Luye Pharma Poziotinib (Pan-HER inhibitor) Co-development and exclusive marketing rights in China
2015
Spectrum Pharmaceuticals Poziotinib (Pan-HER inhibitor) Co-development and exclusive global marketing rights, excluding Korea and China
Eli Lilly HM71224 (BTK Inhibitor) Co-development and exclusive global marketing rights, excluding Korea and China
Boehringer Ingelheim HM61713
(3rd-generation EGFR TKI)
Co-development and exclusive global marketing rights excluding Korea, China,
and Hong Kong → deal canceled in Sep 2016
Sanofi Quantum Project Co-development and exclusive global marketing rights
→ deal on LAPS-Insulin canceled in Dec 2016
Janssen (Johnson & Johnson) HM12525A
(GLP/GCG dual agonist) Co-development and exclusive global marketing rights, excluding Korea and China
ZaiLab HM61713
(3rd-generation EGFR TKI) Co-development and exclusive marketing rights in China
2016 Genentech (Roche) HM95573 (RAF inhibitor) Co-development and exclusive global marketing rights, excluding Korea
Source: Company data, Samsung Securities
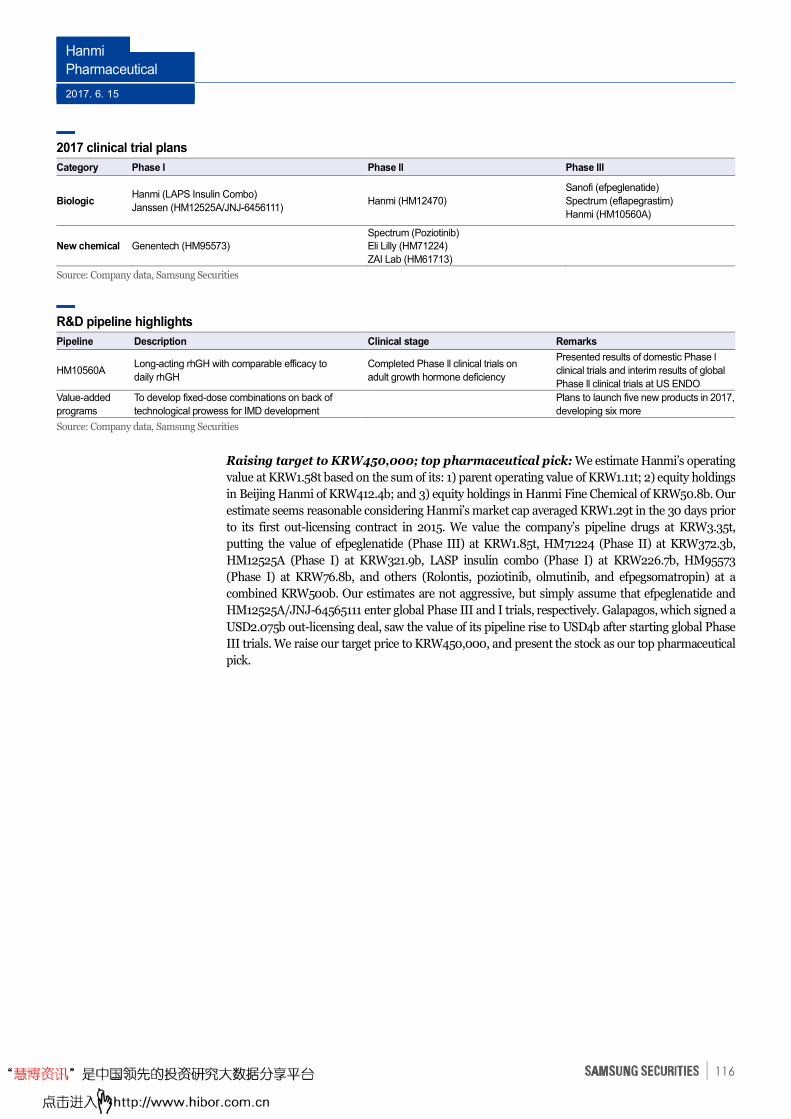
Hanmi
Pharmaceutical
2017. 6. 15
116
2017 clinical trial plans
Category Phase l Phase ll Phase lll
Biologic Hanmi (LAPS Insulin Combo)
Janssen (HM12525A/JNJ-6456111) Hanmi (HM12470)
Sanofi (efpeglenatide)
Spectrum (eflapegrastim)
Hanmi (HM10560A)
New chemical Genentech (HM95573)
Spectrum (Poziotinib)
Eli Lilly (HM71224)
ZAI Lab (HM61713)
Source: Company data, Samsung Securities
R&D pipeline highlights
Pipeline Description Clinical stage Remarks
HM10560A Long-acting rhGH with comparable efficacy to
daily rhGH
Completed Phase ll clinical trials on
adult growth hormone deficiency
Presented results of domestic Phase l
clinical trials and interim results of global
Phase ll clinical trials at US ENDO
Value-added
programs
To develop fixed-dose combinations on back of
technological prowess for IMD development
Plans to launch five new products in 2017,
developing six more
Source: Company data, Samsung Securities
Raising target to KRW450,000; top pharmaceutical pick: We estimate Hanmi’s operating
value at KRW1.58t based on the sum of its: 1) parent operating value of KRW1.11t; 2) equity holdings
in Beijing Hanmi of KRW412.4b; and 3) equity holdings in Hanmi Fine Chemical of KRW50.8b. Our
estimate seems reasonable considering Hanmi’s market cap averaged KRW1.29t in the 30 days prior
to its first out-licensing contract in 2015. We value the company’s pipeline drugs at KRW3.35t,
putting the value of efpeglenatide (Phase III) at KRW1.85t, HM71224 (Phase II) at KRW372.3b,
HM12525A (Phase I) at KRW321.9b, LASP insulin combo (Phase I) at KRW226.7b, HM95573
(Phase I) at KRW76.8b, and others (Rolontis, poziotinib, olmutinib, and efpegsomatropin) at a
combined KRW500b. Our estimates are not aggressive, but simply assume that efpeglenatide and
HM12525A/JNJ-64565111 enter global Phase III and I trials, respectively. Galapagos, which signed a
USD2.075b out-licensing deal, saw the value of its pipeline rise to USD4b after starting global Phase
III trials. We raise our target price to KRW450,000, and present the stock as our top pharmaceutical
pick.
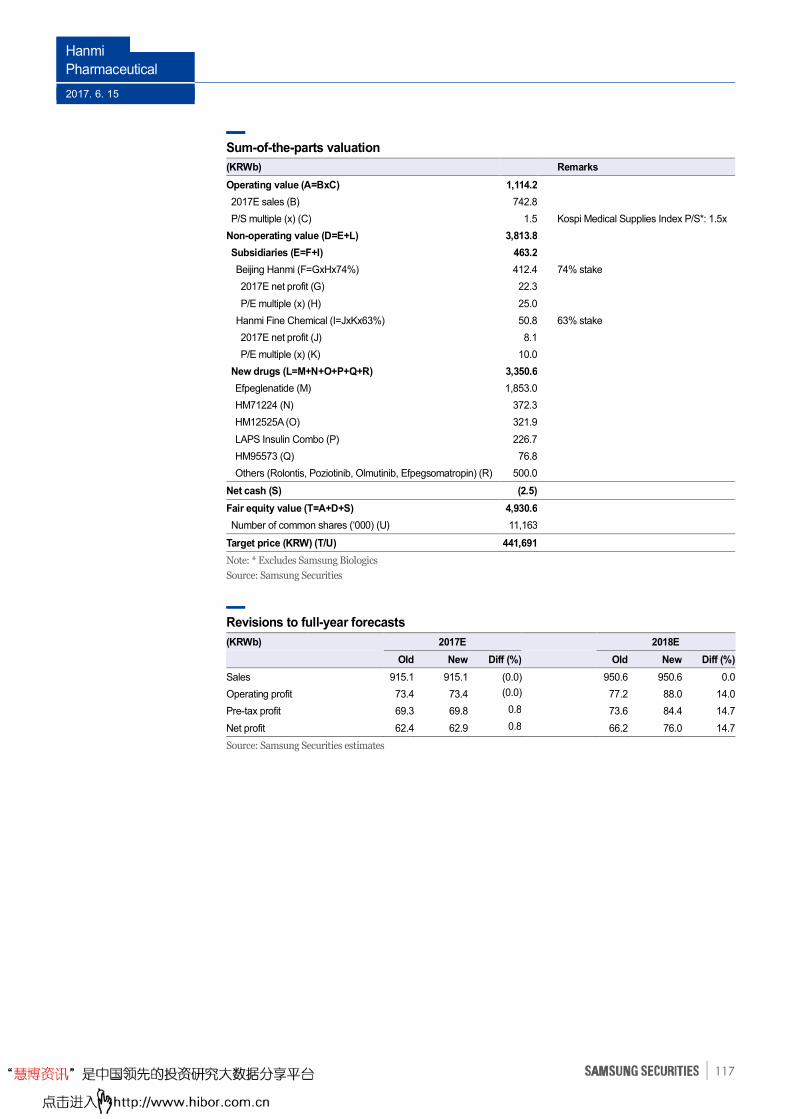
Hanmi
Pharmaceutical
2017. 6. 15
117
Sum-of-the-parts valuation
(KRWb) Remarks
Operating value (A=BxC) 1,114.2
2017E sales (B) 742.8
P/S multiple (x) (C) 1.5 Kospi Medical Supplies Index P/S*: 1.5x
Non-operating value (D=E+L) 3,813.8
Subsidiaries (E=F+I) 463.2
Beijing Hanmi (F=GxHx74%) 412.4 74% stake
2017E net profit (G) 22.3
P/E multiple (x) (H) 25.0
Hanmi Fine Chemical (I=JxKx63%) 50.8 63% stake
2017E net profit (J) 8.1
P/E multiple (x) (K) 10.0
New drugs (L=M+N+O+P+Q+R) 3,350.6
Efpeglenatide (M) 1,853.0
HM71224 (N) 372.3
HM12525A (O) 321.9
LAPS Insulin Combo (P) 226.7
HM95573 (Q) 76.8
Others (Rolontis, Poziotinib, Olmutinib, Efpegsomatropin) (R) 500.0
Net cash (S) (2.5)
Fair equity value (T=A+D+S) 4,930.6
Number of common shares (‘000) (U) 11,163
Target price (KRW) (T/U) 441,691
Note: * Excludes Samsung Biologics
Source: Samsung Securities
Revisions to full-year forecasts
(KRWb) 2017E 2018E
Old New Diff (%) Old New Diff (%)
Sales 915.1 915.1 (0.0) 950.6 950.6 0.0
Operating profit 73.4 73.4 (0.0) 77.2 88.0 14.0
Pre-tax profit 69.3 69.8 0.8 73.6 84.4 14.7
Net profit 62.4 62.9 0.8 66.2 76.0 14.7
Source: Samsung Securities estimates
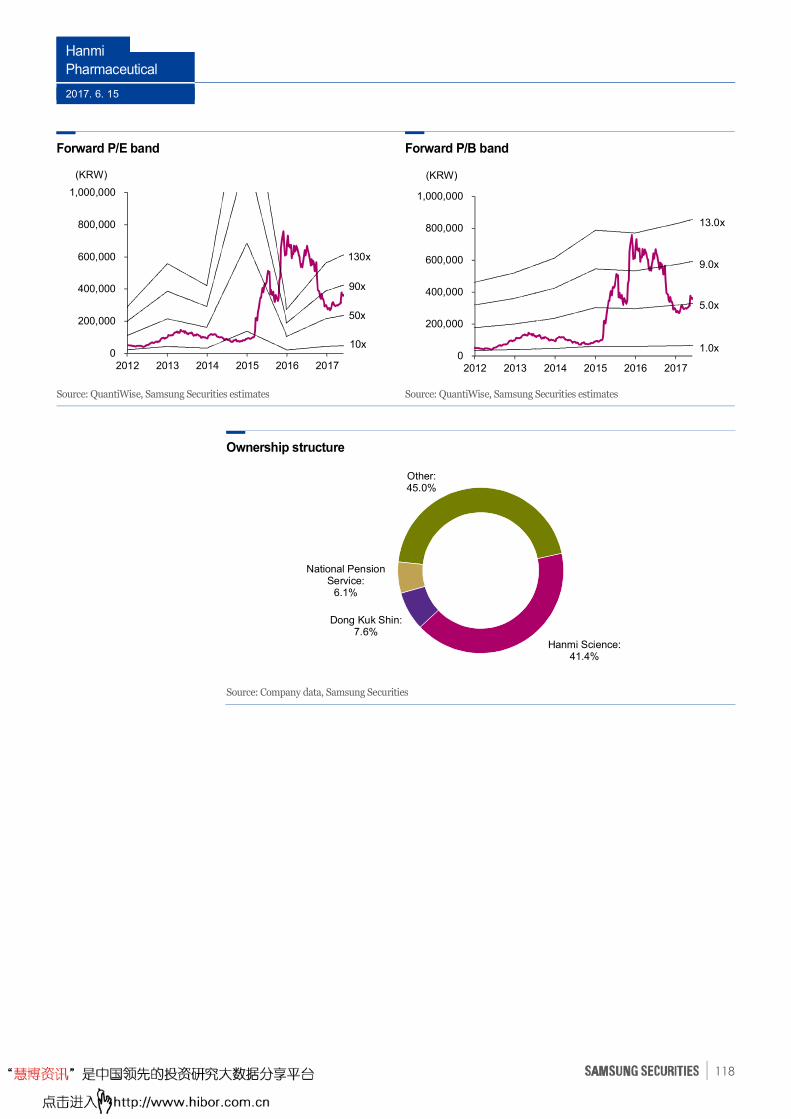
Hanmi
Pharmaceutical
2017. 6. 15
118
Forward P/E band Forward P/B band
Source: QuantiWise, Samsung Securities estimates Source: QuantiWise, Samsung Securities estimates
Ownership structure
Source: Company data, Samsung Securities
Hanmi Science:41.4%
Dong Kuk Shin:7.6%
National Pension Service:
6.1%
Other:45.0%
0
200,000
400,000
600,000
800,000
1,000,000
2012 2013 2014 2015 2016 2017
(KRW)
10x
50x
90x
130x
0
200,000
400,000
600,000
800,000
1,000,000
2012 2013 2014 2015 2016 2017
(KRW)
1.0x
5.0x
9.0x
13.0x
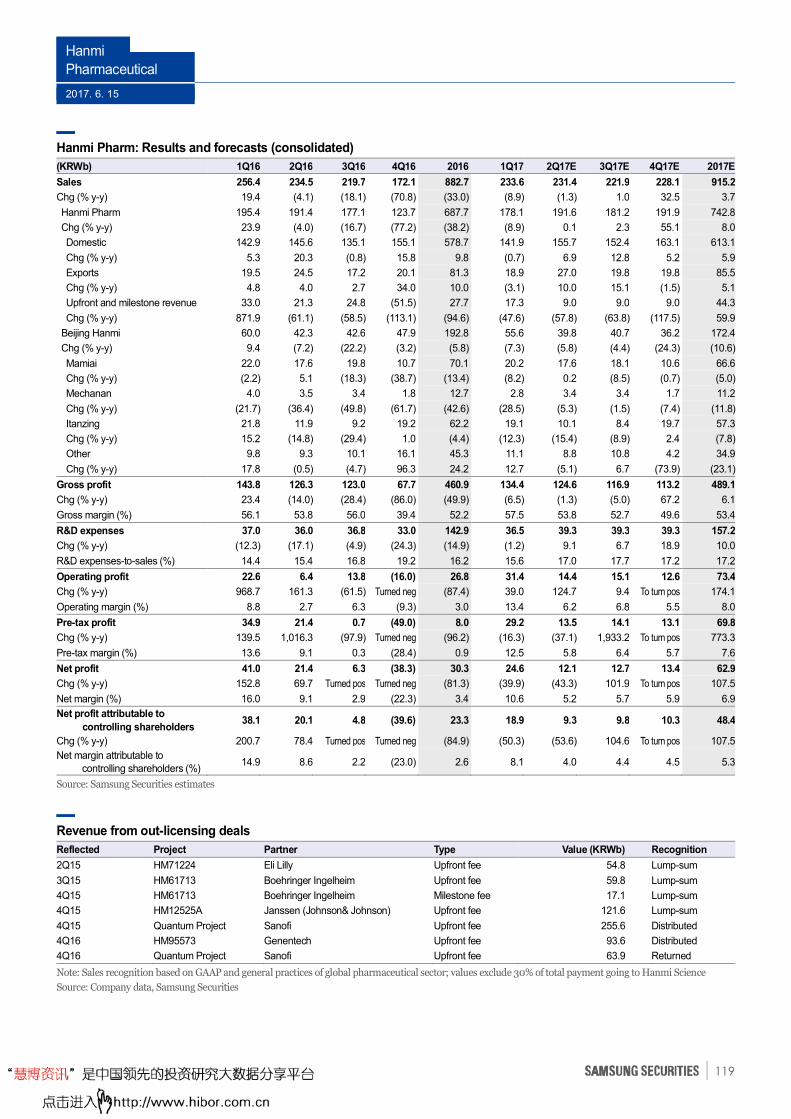
Hanmi
Pharmaceutical
2017. 6. 15
119
Hanmi Pharm: Results and forecasts (consolidated)
(KRWb) 1Q16 2Q16 3Q16 4Q16 2016 1Q17 2Q17E 3Q17E 4Q17E 2017E
Sales 256.4 234.5 219.7 172.1 882.7 233.6 231.4 221.9 228.1 915.2
Chg (% y-y) 19.4 (4.1) (18.1) (70.8) (33.0) (8.9) (1.3) 1.0 32.5 3.7
Hanmi Pharm 195.4 191.4 177.1 123.7 687.7 178.1 191.6 181.2 191.9 742.8
Chg (% y-y) 23.9 (4.0) (16.7) (77.2) (38.2) (8.9) 0.1 2.3 55.1 8.0
Domestic 142.9 145.6 135.1 155.1 578.7 141.9 155.7 152.4 163.1 613.1
Chg (% y-y) 5.3 20.3 (0.8) 15.8 9.8 (0.7) 6.9 12.8 5.2 5.9
Exports 19.5 24.5 17.2 20.1 81.3 18.9 27.0 19.8 19.8 85.5
Chg (% y-y) 4.8 4.0 2.7 34.0 10.0 (3.1) 10.0 15.1 (1.5) 5.1
Upfront and milestone revenue 33.0 21.3 24.8 (51.5) 27.7 17.3 9.0 9.0 9.0 44.3
Chg (% y-y) 871.9 (61.1) (58.5) (113.1) (94.6) (47.6) (57.8) (63.8) (117.5) 59.9
Beijing Hanmi 60.0 42.3 42.6 47.9 192.8 55.6 39.8 40.7 36.2 172.4
Chg (% y-y) 9.4 (7.2) (22.2) (3.2) (5.8) (7.3) (5.8) (4.4) (24.3) (10.6)
Mamiai 22.0 17.6 19.8 10.7 70.1 20.2 17.6 18.1 10.6 66.6
Chg (% y-y) (2.2) 5.1 (18.3) (38.7) (13.4) (8.2) 0.2 (8.5) (0.7) (5.0)
Mechanan 4.0 3.5 3.4 1.8 12.7 2.8 3.4 3.4 1.7 11.2
Chg (% y-y) (21.7) (36.4) (49.8) (61.7) (42.6) (28.5) (5.3) (1.5) (7.4) (11.8)
Itanzing 21.8 11.9 9.2 19.2 62.2 19.1 10.1 8.4 19.7 57.3
Chg (% y-y) 15.2 (14.8) (29.4) 1.0 (4.4) (12.3) (15.4) (8.9) 2.4 (7.8)
Other 9.8 9.3 10.1 16.1 45.3 11.1 8.8 10.8 4.2 34.9
Chg (% y-y) 17.8 (0.5) (4.7) 96.3 24.2 12.7 (5.1) 6.7 (73.9) (23.1)
Gross profit 143.8 126.3 123.0 67.7 460.9 134.4 124.6 116.9 113.2 489.1
Chg (% y-y) 23.4 (14.0) (28.4) (86.0) (49.9) (6.5) (1.3) (5.0) 67.2 6.1
Gross margin (%) 56.1 53.8 56.0 39.4 52.2 57.5 53.8 52.7 49.6 53.4
R&D expenses 37.0 36.0 36.8 33.0 142.9 36.5 39.3 39.3 39.3 157.2
Chg (% y-y) (12.3) (17.1) (4.9) (24.3) (14.9) (1.2) 9.1 6.7 18.9 10.0
R&D expenses-to-sales (%) 14.4 15.4 16.8 19.2 16.2 15.6 17.0 17.7 17.2 17.2
Operating profit 22.6 6.4 13.8 (16.0) 26.8 31.4 14.4 15.1 12.6 73.4
Chg (% y-y) 968.7 161.3 (61.5) Turned neg (87.4) 39.0 124.7 9.4 To turn pos 174.1
Operating margin (%) 8.8 2.7 6.3 (9.3) 3.0 13.4 6.2 6.8 5.5 8.0
Pre-tax profit 34.9 21.4 0.7 (49.0) 8.0 29.2 13.5 14.1 13.1 69.8
Chg (% y-y) 139.5 1,016.3 (97.9) Turned neg (96.2) (16.3) (37.1) 1,933.2 To turn pos 773.3
Pre-tax margin (%) 13.6 9.1 0.3 (28.4) 0.9 12.5 5.8 6.4 5.7 7.6
Net profit 41.0 21.4 6.3 (38.3) 30.3 24.6 12.1 12.7 13.4 62.9
Chg (% y-y) 152.8 69.7 Turned pos Turned neg (81.3) (39.9) (43.3) 101.9 To turn pos 107.5
Net margin (%) 16.0 9.1 2.9 (22.3) 3.4 10.6 5.2 5.7 5.9 6.9
Net profit attributable to
controlling shareholders 38.1 20.1 4.8 (39.6) 23.3 18.9 9.3 9.8 10.3 48.4
Chg (% y-y) 200.7 78.4 Turned pos Turned neg (84.9) (50.3) (53.6) 104.6 To turn pos 107.5
Net margin attributable to
controlling shareholders (%) 14.9 8.6 2.2 (23.0) 2.6 8.1 4.0 4.4 4.5 5.3
Source: Samsung Securities estimates
Revenue from out-licensing deals
Reflected Project Partner Type Value (KRWb) Recognition
2Q15 HM71224 Eli Lilly Upfront fee 54.8 Lump-sum
3Q15 HM61713 Boehringer Ingelheim Upfront fee 59.8 Lump-sum
4Q15 HM61713 Boehringer Ingelheim Milestone fee 17.1 Lump-sum
4Q15 HM12525A Janssen (Johnson& Johnson) Upfront fee 121.6 Lump-sum
4Q15 Quantum Project Sanofi Upfront fee 255.6 Distributed
4Q16 HM95573 Genentech Upfront fee 93.6 Distributed
4Q16 Quantum Project Sanofi Upfront fee 63.9 Returned
Note: Sales recognition based on GAAP and general practices of global pharmaceutical sector; values exclude 30% of total payment going to Hanmi Science
Source: Company data, Samsung Securities
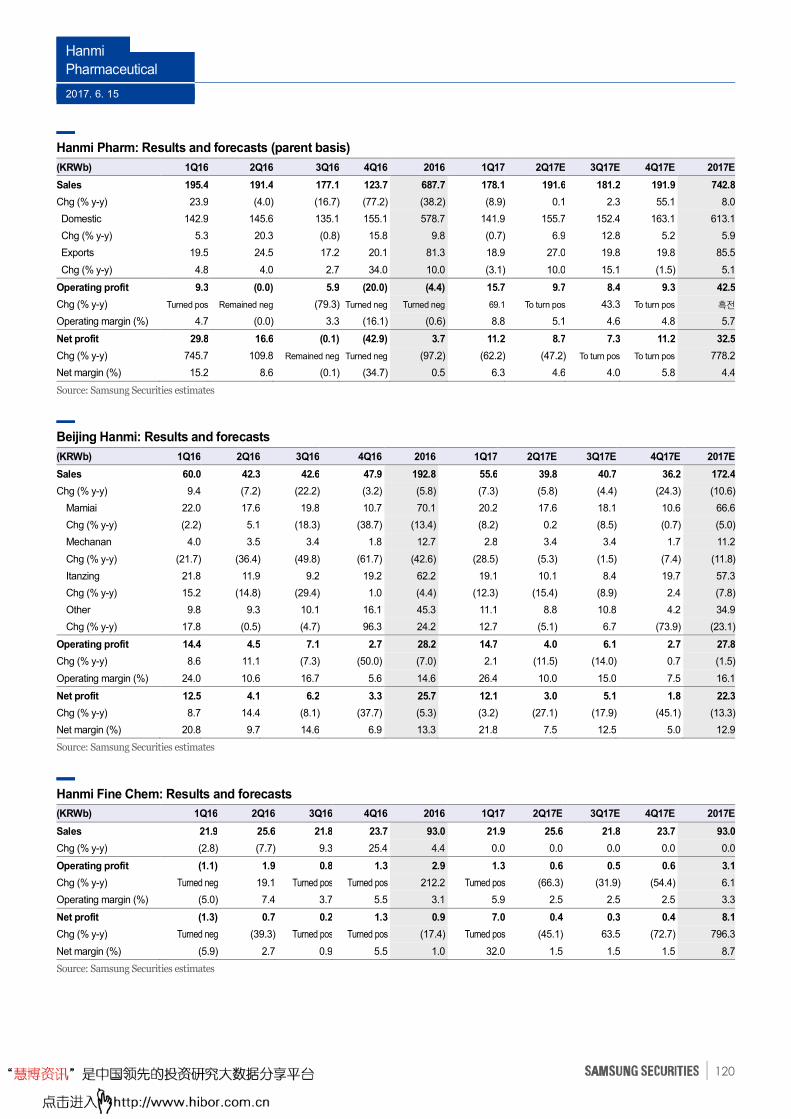
Hanmi
Pharmaceutical
2017. 6. 15
120
Hanmi Pharm: Results and forecasts (parent basis)
(KRWb) 1Q16 2Q16 3Q16 4Q16 2016 1Q17 2Q17E 3Q17E 4Q17E 2017E
Sales 195.4 191.4 177.1 123.7 687.7 178.1 191.6 181.2 191.9 742.8
Chg (% y-y) 23.9 (4.0) (16.7) (77.2) (38.2) (8.9) 0.1 2.3 55.1 8.0
Domestic 142.9 145.6 135.1 155.1 578.7 141.9 155.7 152.4 163.1 613.1
Chg (% y-y) 5.3 20.3 (0.8) 15.8 9.8 (0.7) 6.9 12.8 5.2 5.9
Exports 19.5 24.5 17.2 20.1 81.3 18.9 27.0 19.8 19.8 85.5
Chg (% y-y) 4.8 4.0 2.7 34.0 10.0 (3.1) 10.0 15.1 (1.5) 5.1
Operating profit 9.3 (0.0) 5.9 (20.0) (4.4) 15.7 9.7 8.4 9.3 42.5
Chg (% y-y) Turned pos Remained neg (79.3) Turned neg Turned neg 69.1 To turn pos 43.3 To turn pos 흑전Operating margin (%) 4.7 (0.0) 3.3 (16.1) (0.6) 8.8 5.1 4.6 4.8 5.7
Net profit 29.8 16.6 (0.1) (42.9) 3.7 11.2 8.7 7.3 11.2 32.5
Chg (% y-y) 745.7 109.8 Remained neg Turned neg (97.2) (62.2) (47.2) To turn pos To turn pos 778.2
Net margin (%) 15.2 8.6 (0.1) (34.7) 0.5 6.3 4.6 4.0 5.8 4.4
Source: Samsung Securities estimates
Beijing Hanmi: Results and forecasts
(KRWb) 1Q16 2Q16 3Q16 4Q16 2016 1Q17 2Q17E 3Q17E 4Q17E 2017E
Sales 60.0 42.3 42.6 47.9 192.8 55.6 39.8 40.7 36.2 172.4
Chg (% y-y) 9.4 (7.2) (22.2) (3.2) (5.8) (7.3) (5.8) (4.4) (24.3) (10.6)
Mamiai 22.0 17.6 19.8 10.7 70.1 20.2 17.6 18.1 10.6 66.6
Chg (% y-y) (2.2) 5.1 (18.3) (38.7) (13.4) (8.2) 0.2 (8.5) (0.7) (5.0)
Mechanan 4.0 3.5 3.4 1.8 12.7 2.8 3.4 3.4 1.7 11.2
Chg (% y-y) (21.7) (36.4) (49.8) (61.7) (42.6) (28.5) (5.3) (1.5) (7.4) (11.8)
Itanzing 21.8 11.9 9.2 19.2 62.2 19.1 10.1 8.4 19.7 57.3
Chg (% y-y) 15.2 (14.8) (29.4) 1.0 (4.4) (12.3) (15.4) (8.9) 2.4 (7.8)
Other 9.8 9.3 10.1 16.1 45.3 11.1 8.8 10.8 4.2 34.9
Chg (% y-y) 17.8 (0.5) (4.7) 96.3 24.2 12.7 (5.1) 6.7 (73.9) (23.1)
Operating profit 14.4 4.5 7.1 2.7 28.2 14.7 4.0 6.1 2.7 27.8
Chg (% y-y) 8.6 11.1 (7.3) (50.0) (7.0) 2.1 (11.5) (14.0) 0.7 (1.5)
Operating margin (%) 24.0 10.6 16.7 5.6 14.6 26.4 10.0 15.0 7.5 16.1
Net profit 12.5 4.1 6.2 3.3 25.7 12.1 3.0 5.1 1.8 22.3
Chg (% y-y) 8.7 14.4 (8.1) (37.7) (5.3) (3.2) (27.1) (17.9) (45.1) (13.3)
Net margin (%) 20.8 9.7 14.6 6.9 13.3 21.8 7.5 12.5 5.0 12.9
Source: Samsung Securities estimates
Hanmi Fine Chem: Results and forecasts
(KRWb) 1Q16 2Q16 3Q16 4Q16 2016 1Q17 2Q17E 3Q17E 4Q17E 2017E
Sales 21.9 25.6 21.8 23.7 93.0 21.9 25.6 21.8 23.7 93.0
Chg (% y-y) (2.8) (7.7) 9.3 25.4 4.4 0.0 0.0 0.0 0.0 0.0
Operating profit (1.1) 1.9 0.8 1.3 2.9 1.3 0.6 0.5 0.6 3.1
Chg (% y-y) Turned neg 19.1 Turned pos Turned pos 212.2 Turned pos (66.3) (31.9) (54.4) 6.1
Operating margin (%) (5.0) 7.4 3.7 5.5 3.1 5.9 2.5 2.5 2.5 3.3
Net profit (1.3) 0.7 0.2 1.3 0.9 7.0 0.4 0.3 0.4 8.1
Chg (% y-y) Turned neg (39.3) Turned pos Turned pos (17.4) Turned pos (45.1) 63.5 (72.7) 796.3
Net margin (%) (5.9) 2.7 0.9 5.5 1.0 32.0 1.5 1.5 1.5 8.7
Source: Samsung Securities estimates
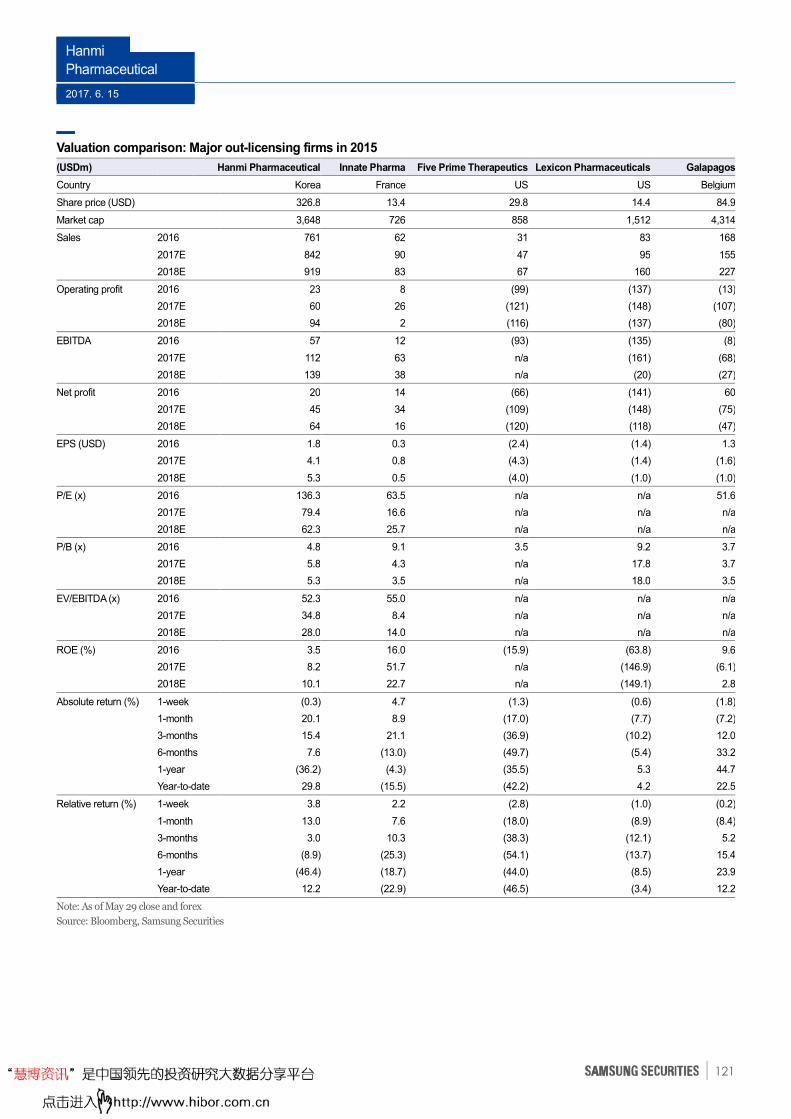
Hanmi
Pharmaceutical
2017. 6. 15
121
Valuation comparison: Major out-licensing firms in 2015
(USDm) Hanmi Pharmaceutical Innate Pharma Five Prime Therapeutics Lexicon Pharmaceuticals Galapagos
Country Korea France US US Belgium
Share price (USD) 326.8 13.4 29.8 14.4 84.9
Market cap 3,648 726 858 1,512 4,314
Sales 2016 761 62 31 83 168
2017E 842 90 47 95 155
2018E 919 83 67 160 227
Operating profit 2016 23 8 (99) (137) (13)
2017E 60 26 (121) (148) (107)
2018E 94 2 (116) (137) (80)
EBITDA 2016 57 12 (93) (135) (8)
2017E 112 63 n/a (161) (68)
2018E 139 38 n/a (20) (27)
Net profit 2016 20 14 (66) (141) 60
2017E 45 34 (109) (148) (75)
2018E 64 16 (120) (118) (47)
EPS (USD) 2016 1.8 0.3 (2.4) (1.4) 1.3
2017E 4.1 0.8 (4.3) (1.4) (1.6)
2018E 5.3 0.5 (4.0) (1.0) (1.0)
P/E (x) 2016 136.3 63.5 n/a n/a 51.6
2017E 79.4 16.6 n/a n/a n/a
2018E 62.3 25.7 n/a n/a n/a
P/B (x) 2016 4.8 9.1 3.5 9.2 3.7
2017E 5.8 4.3 n/a 17.8 3.7
2018E 5.3 3.5 n/a 18.0 3.5
EV/EBITDA (x) 2016 52.3 55.0 n/a n/a n/a
2017E 34.8 8.4 n/a n/a n/a
2018E 28.0 14.0 n/a n/a n/a
ROE (%) 2016 3.5 16.0 (15.9) (63.8) 9.6
2017E 8.2 51.7 n/a (146.9) (6.1)
2018E 10.1 22.7 n/a (149.1) 2.8
Absolute return (%) 1-week (0.3) 4.7 (1.3) (0.6) (1.8)
1-month 20.1 8.9 (17.0) (7.7) (7.2)
3-months 15.4 21.1 (36.9) (10.2) 12.0
6-months 7.6 (13.0) (49.7) (5.4) 33.2
1-year (36.2) (4.3) (35.5) 5.3 44.7
Year-to-date 29.8 (15.5) (42.2) 4.2 22.5
Relative return (%) 1-week 3.8 2.2 (2.8) (1.0) (0.2)
1-month 13.0 7.6 (18.0) (8.9) (8.4)
3-months 3.0 10.3 (38.3) (12.1) 5.2
6-months (8.9) (25.3) (54.1) (13.7) 15.4
1-year (46.4) (18.7) (44.0) (8.5) 23.9
Year-to-date 12.2 (22.9) (46.5) (3.4) 12.2
Note: As of May 29 close and forex
Source: Bloomberg, Samsung Securities
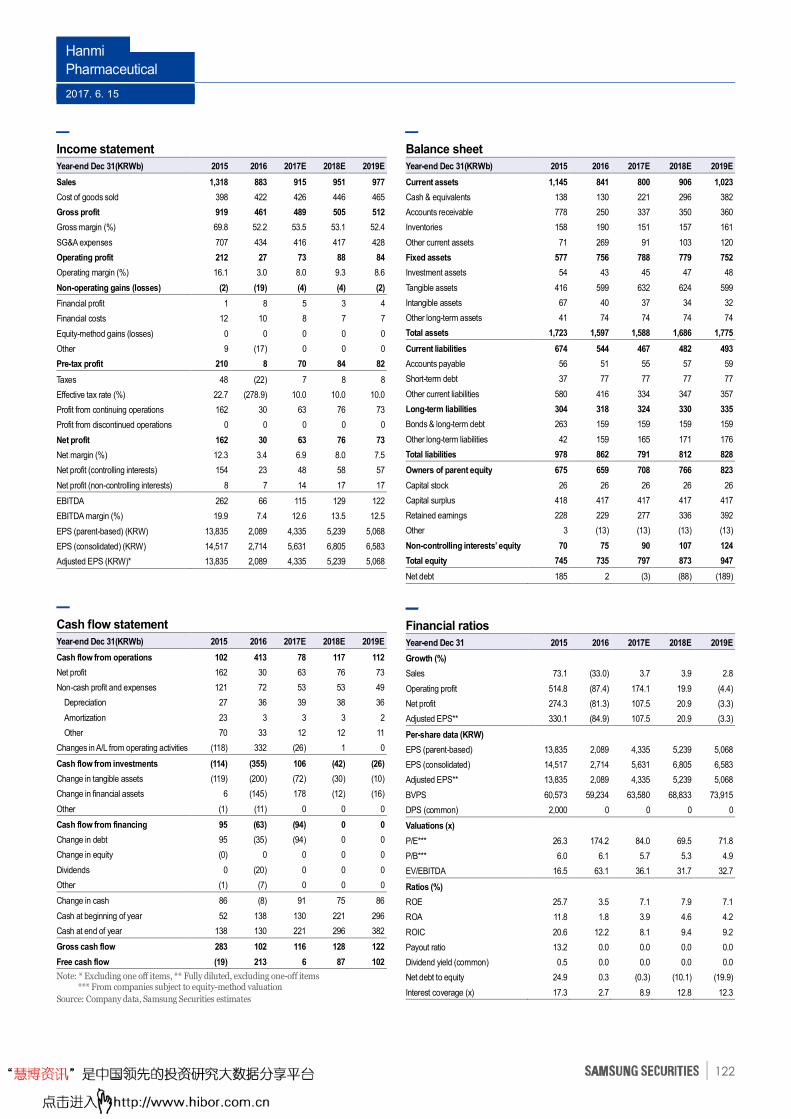
Hanmi
Pharmaceutical
2017. 6. 15
122
Income statement
Year-end Dec 31(KRWb) 2015 2016 2017E 2018E 2019E
Sales 1,318 883 915 951 977
Cost of goods sold 398 422 426 446 465
Gross profit 919 461 489 505 512
Gross margin (%) 69.8 52.2 53.5 53.1 52.4
SG&A expenses 707 434 416 417 428
Operating profit 212 27 73 88 84
Operating margin (%) 16.1 3.0 8.0 9.3 8.6
Non-operating gains (losses) (2) (19) (4) (4) (2)
Financial profit 1 8 5 3 4
Financial costs 12 10 8 7 7
Equity-method gains (losses) 0 0 0 0 0
Other 9 (17) 0 0 0
Pre-tax profit 210 8 70 84 82
Taxes 48 (22) 7 8 8
Effective tax rate (%) 22.7 (278.9) 10.0 10.0 10.0
Profit from continuing operations 162 30 63 76 73
Profit from discontinued operations 0 0 0 0 0
Net profit 162 30 63 76 73
Net margin (%) 12.3 3.4 6.9 8.0 7.5
Net profit (controlling interests) 154 23 48 58 57
Net profit (non-controlling interests) 8 7 14 17 17
EBITDA 262 66 115 129 122
EBITDA margin (%) 19.9 7.4 12.6 13.5 12.5
EPS (parent-based) (KRW) 13,835 2,089 4,335 5,239 5,068
EPS (consolidated) (KRW) 14,517 2,714 5,631 6,805 6,583
Adjusted EPS (KRW)* 13,835 2,089 4,335 5,239 5,068
Cash flow statement
Year-end Dec 31(KRWb) 2015 2016 2017E 2018E 2019E
Cash flow from operations 102 413 78 117 112
Net profit 162 30 63 76 73
Non-cash profit and expenses 121 72 53 53 49
Depreciation 27 36 39 38 36
Amortization 23 3 3 3 2
Other 70 33 12 12 11
Changes in A/L from operating activities (118) 332 (26) 1 0
Cash flow from investments (114) (355) 106 (42) (26)
Change in tangible assets (119) (200) (72) (30) (10)
Change in financial assets 6 (145) 178 (12) (16)
Other (1) (11) 0 0 0
Cash flow from financing 95 (63) (94) 0 0
Change in debt 95 (35) (94) 0 0
Change in equity (0) 0 0 0 0
Dividends 0 (20) 0 0 0
Other (1) (7) 0 0 0
Change in cash 86 (8) 91 75 86
Cash at beginning of year 52 138 130 221 296
Cash at end of year 138 130 221 296 382
Gross cash flow 283 102 116 128 122
Free cash flow (19) 213 6 87 102
Note: * Excluding one off items, ** Fully diluted, excluding one-off items *** From companies subject to equity-method valuation
Source: Company data, Samsung Securities estimates
Balance sheet
Year-end Dec 31(KRWb) 2015 2016 2017E 2018E 2019E
Current assets 1,145 841 800 906 1,023
Cash & equivalents 138 130 221 296 382
Accounts receivable 778 250 337 350 360
Inventories 158 190 151 157 161
Other current assets 71 269 91 103 120
Fixed assets 577 756 788 779 752
Investment assets 54 43 45 47 48
Tangible assets 416 599 632 624 599
Intangible assets 67 40 37 34 32
Other long-term assets 41 74 74 74 74
Total assets 1,723 1,597 1,588 1,686 1,775
Current liabilities 674 544 467 482 493
Accounts payable 56 51 55 57 59
Short-term debt 37 77 77 77 77
Other current liabilities 580 416 334 347 357
Long-term liabilities 304 318 324 330 335
Bonds & long-term debt 263 159 159 159 159
Other long-term liabilities 42 159 165 171 176
Total liabilities 978 862 791 812 828
Owners of parent equity 675 659 708 766 823
Capital stock 26 26 26 26 26
Capital surplus 418 417 417 417 417
Retained earnings 228 229 277 336 392
Other 3 (13) (13) (13) (13)
Non-controlling interests’ equity 70 75 90 107 124
Total equity 745 735 797 873 947
Net debt 185 2 (3) (88) (189)
Financial ratios
Year-end Dec 31 2015 2016 2017E 2018E 2019E
Growth (%)
Sales 73.1 (33.0) 3.7 3.9 2.8
Operating profit 514.8 (87.4) 174.1 19.9 (4.4)
Net profit 274.3 (81.3) 107.5 20.9 (3.3)
Adjusted EPS** 330.1 (84.9) 107.5 20.9 (3.3)
Per-share data (KRW)
EPS (parent-based) 13,835 2,089 4,335 5,239 5,068
EPS (consolidated) 14,517 2,714 5,631 6,805 6,583
Adjusted EPS** 13,835 2,089 4,335 5,239 5,068
BVPS 60,573 59,234 63,580 68,833 73,915
DPS (common) 2,000 0 0 0 0
Valuations (x)
P/E*** 26.3 174.2 84.0 69.5 71.8
P/B*** 6.0 6.1 5.7 5.3 4.9
EV/EBITDA 16.5 63.1 36.1 31.7 32.7
Ratios (%)
ROE 25.7 3.5 7.1 7.9 7.1
ROA 11.8 1.8 3.9 4.6 4.2
ROIC 20.6 12.2 8.1 9.4 9.2
Payout ratio 13.2 0.0 0.0 0.0 0.0
Dividend yield (common) 0.5 0.0 0.0 0.0 0.0
Net debt to equity 24.9 0.3 (0.3) (10.1) (19.9)
Interest coverage (x) 17.3 2.7 8.9 12.8 12.3
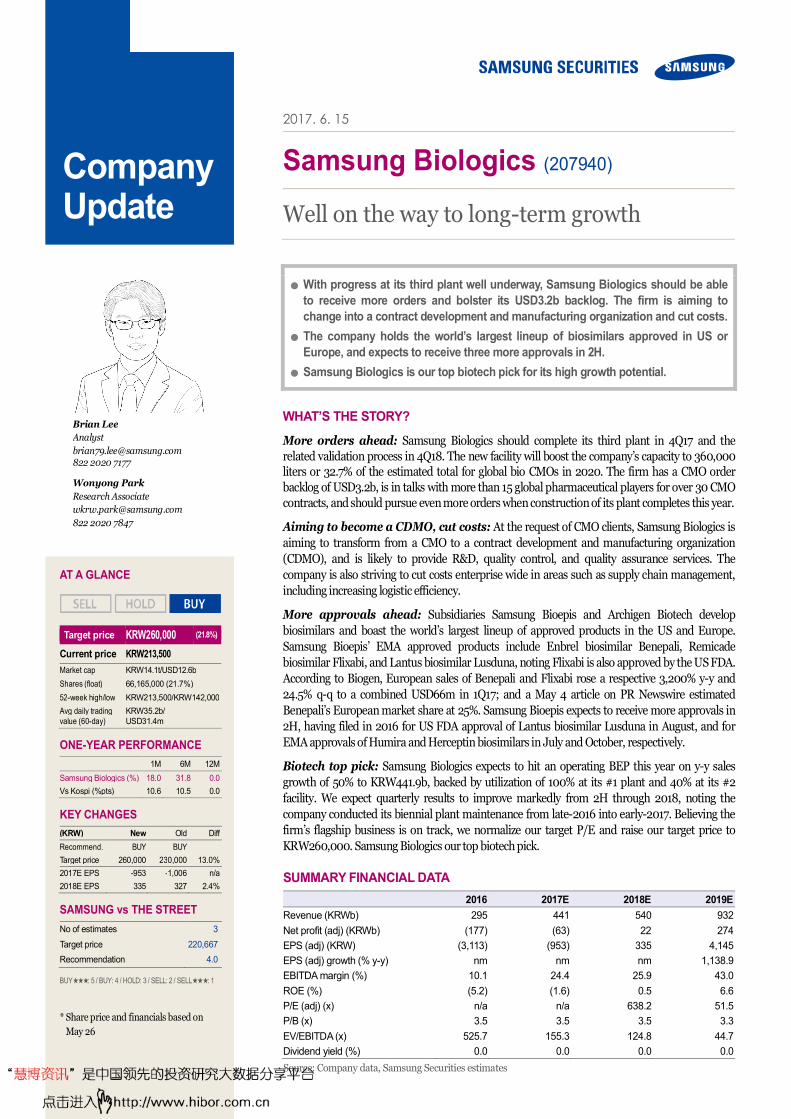
2017. 6. 15
Samsung Biologics (207940)
Well on the way to long-term growth
● With progress at its third plant well underway, Samsung Biologics should be able
to receive more orders and bolster its USD3.2b backlog. The firm is aiming to
change into a contract development and manufacturing organization and cut costs.
● The company holds the world’s largest lineup of biosimilars approved in US or
Europe, and expects to receive three more approvals in 2H. ● Samsung Biologics is our top biotech pick for its high growth potential.
WHAT’S THE STORY?
More orders ahead: Samsung Biologics should complete its third plant in 4Q17 and the
related validation process in 4Q18. The new facility will boost the company’s capacity to 360,000 liters or 32.7% of the estimated total for global bio CMOs in 2020. The firm has a CMO order
backlog of USD3.2b, is in talks with more than 15 global pharmaceutical players for over 30 CMO
contracts, and should pursue even more orders when construction of its plant completes this year.
Aiming to become a CDMO, cut costs: At the request of CMO clients, Samsung Biologics is
aiming to transform from a CMO to a contract development and manufacturing organization
(CDMO), and is likely to provide R&D, quality control, and quality assurance services. The
company is also striving to cut costs enterprise wide in areas such as supply chain management,
including increasing logistic efficiency.
More approvals ahead: Subsidiaries Samsung Bioepis and Archigen Biotech develop
biosimilars and boast the world’s largest lineup of approved products in the US and Europe.
Samsung Bioepis’ EMA approved products include Enbrel biosimilar Benepali, Remicade
biosimilar Flixabi, and Lantus biosimilar Lusduna, noting Flixabi is also approved by the US FDA.
According to Biogen, European sales of Benepali and Flixabi rose a respective 3,200% y-y and
24.5% q-q to a combined USD66m in 1Q17; and a May 4 article on PR Newswire estimated
Benepali’s European market share at 25%. Samsung Bioepis expects to receive more approvals in
2H, having filed in 2016 for US FDA approval of Lantus biosimilar Lusduna in August, and for
EMA approvals of Humira and Herceptin biosimilars in July and October, respectively.
Biotech top pick: Samsung Biologics expects to hit an operating BEP this year on y-y sales
growth of 50% to KRW441.9b, backed by utilization of 100% at its #1 plant and 40% at its #2
facility. We expect quarterly results to improve markedly from 2H through 2018, noting the
company conducted its biennial plant maintenance from late-2016 into early-2017. Believing the
firm’s flagship business is on track, we normalize our target P/E and raise our target price to
KRW260,000. Samsung Biologics our top biotech pick.
Company Update
SUMMARY FINANCIAL DATA
2016 2017E 2018E 2019E
Revenue (KRWb) 295 441 540 932
Net profit (adj) (KRWb) (177) (63) 22 274
EPS (adj) (KRW) (3,113) (953) 335 4,145
EPS (adj) growth (% y-y) nm nm nm 1,138.9
EBITDA margin (%) 10.1 24.4 25.9 43.0
ROE (%) (5.2) (1.6) 0.5 6.6
P/E (adj) (x) n/a n/a 638.2 51.5
P/B (x) 3.5 3.5 3.5 3.3
EV/EBITDA (x) 525.7 155.3 124.8 44.7
Dividend yield (%) 0.0 0.0 0.0 0.0
Source: Company data, Samsung Securities estimates
Brian Lee
Analyst
[email protected] 822 2020 7177
Wonyong Park
Research Associate
822 2020 7847
AT A GLANCE
Target price KRW260,000 (21.8%)
Current price KRW213,500
Market cap KRW14.1t/USD12.6b
Shares (float) 66,165,000 (21.7%)
52-week high/low KRW213,500/KRW142,000
Avg daily trading value (60-day)
KRW35.2b/ USD31.4m
ONE-YEAR PERFORMANCE
1M 6M 12M
Samsung Biologics (%) 18.0 31.8 0.0
Vs Kospi (%pts) 10.6 10.5 0.0
KEY CHANGES
(KRW) New Old Diff
Recommend. BUY BUY
Target price 260,000 230,000 13.0%
2017E EPS -953 -1,006 n/a
2018E EPS 335 327 2.4%
SAMSUNG vs THE STREET
No of estimates 3
Target price 220,667
Recommendation 4.0
BUY★★★: 5 / BUY: 4 / HOLD: 3 / SELL: 2 / SELL★★★: 1
* Share price and financials based on
May 26
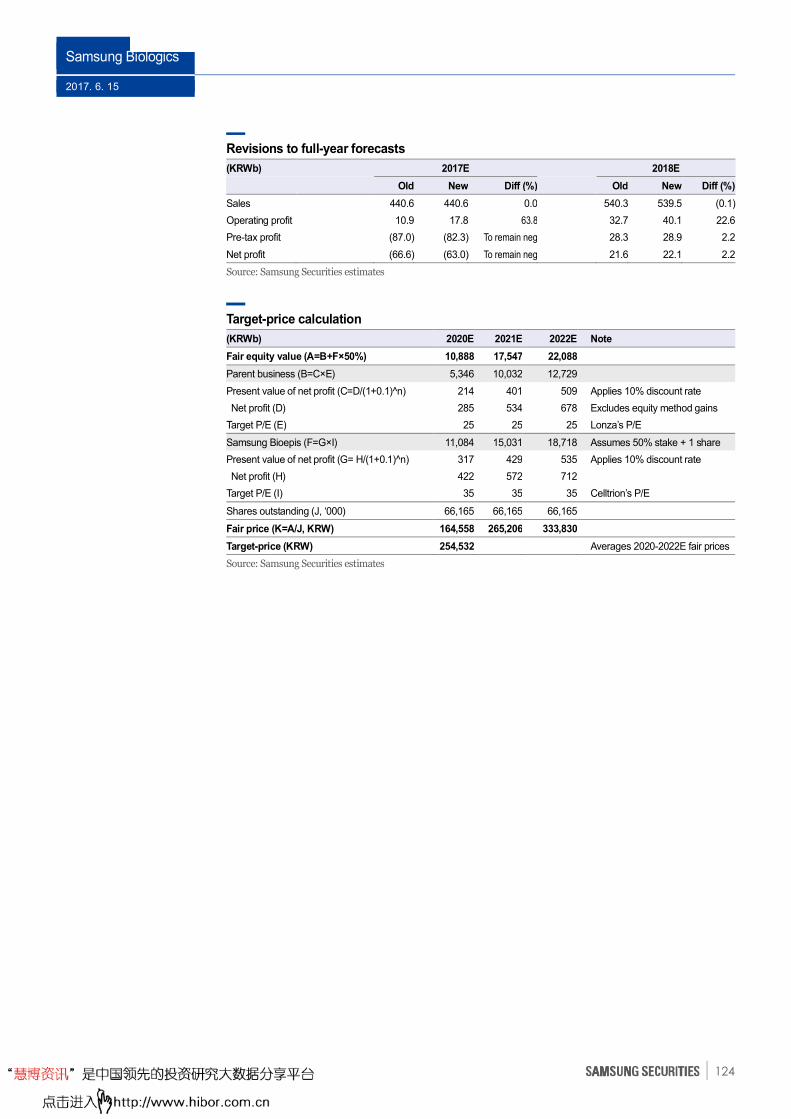
Samsung Biologics
2017. 6. 15
124
Revisions to full-year forecasts
(KRWb) 2017E 2018E
Old New Diff (%) Old New Diff (%)
Sales 440.6 440.6 0.0 540.3 539.5 (0.1)
Operating profit 10.9 17.8 63.8 32.7 40.1 22.6
Pre-tax profit (87.0) (82.3) To remain neg 28.3 28.9 2.2
Net profit (66.6) (63.0) To remain neg 21.6 22.1 2.2
Source: Samsung Securities estimates
Target-price calculation
(KRWb) 2020E 2021E 2022E Note
Fair equity value (A=B+F×50%) 10,888 17,547 22,088
Parent business (B=C×E) 5,346 10,032 12,729
Present value of net profit (C=D/(1+0.1)^n) 214 401 509 Applies 10% discount rate
Net profit (D) 285 534 678 Excludes equity method gains
Target P/E (E) 25 25 25 Lonza’s P/E
Samsung Bioepis (F=G×I) 11,084 15,031 18,718 Assumes 50% stake + 1 share
Present value of net profit (G= H/(1+0.1)^n) 317 429 535 Applies 10% discount rate
Net profit (H) 422 572 712
Target P/E (I) 35 35 35 Celltrion’s P/E
Shares outstanding (J, ‘000) 66,165 66,165 66,165
Fair price (K=A/J, KRW) 164,558 265,206 333,830
Target-price (KRW) 254,532 Averages 2020-2022E fair prices
Source: Samsung Securities estimates
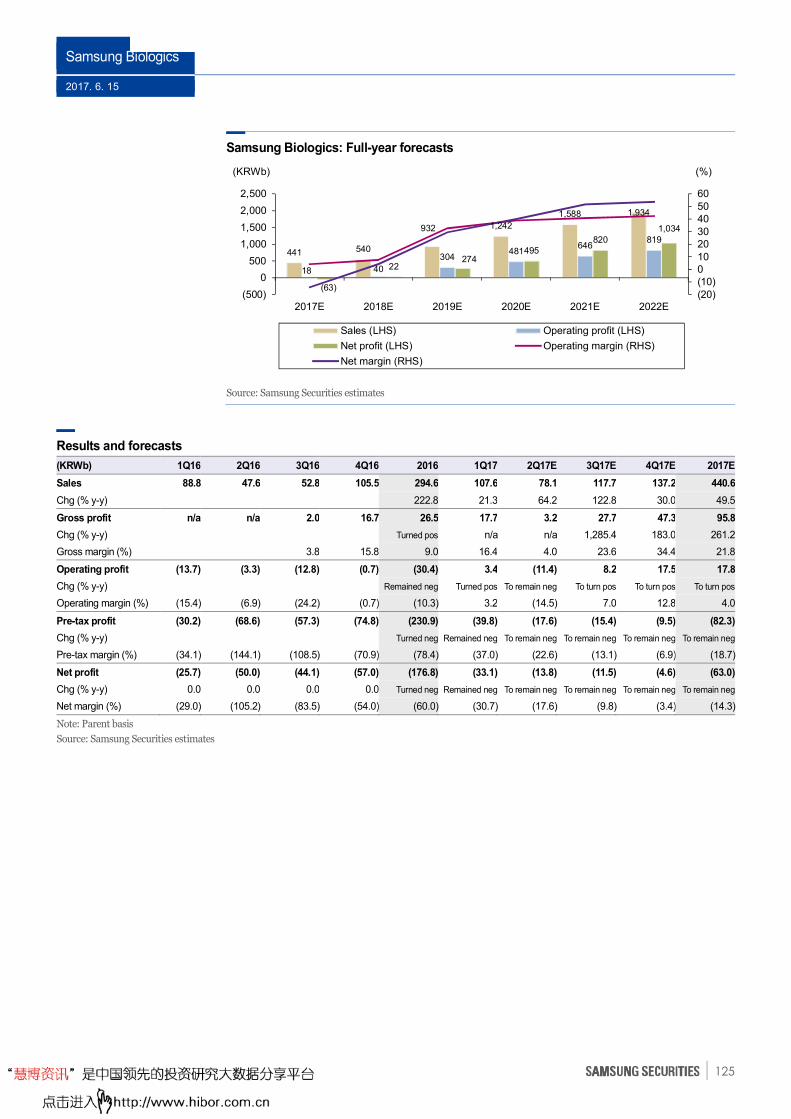
Samsung Biologics
2017. 6. 15
125
Samsung Biologics: Full-year forecasts
Source: Samsung Securities estimates
Results and forecasts
(KRWb) 1Q16 2Q16 3Q16 4Q16 2016 1Q17 2Q17E 3Q17E 4Q17E 2017E
Sales 88.8 47.6 52.8 105.5 294.6 107.6 78.1 117.7 137.2 440.6
Chg (% y-y) 222.8 21.3 64.2 122.8 30.0 49.5
Gross profit n/a n/a 2.0 16.7 26.5 17.7 3.2 27.7 47.3 95.8
Chg (% y-y) Turned pos n/a n/a 1,285.4 183.0 261.2
Gross margin (%) 3.8 15.8 9.0 16.4 4.0 23.6 34.4 21.8
Operating profit (13.7) (3.3) (12.8) (0.7) (30.4) 3.4 (11.4) 8.2 17.5 17.8
Chg (% y-y) Remained neg Turned pos To remain neg To turn pos To turn pos To turn pos
Operating margin (%) (15.4) (6.9) (24.2) (0.7) (10.3) 3.2 (14.5) 7.0 12.8 4.0
Pre-tax profit (30.2) (68.6) (57.3) (74.8) (230.9) (39.8) (17.6) (15.4) (9.5) (82.3)
Chg (% y-y) Turned neg Remained neg To remain neg To remain neg To remain neg To remain neg
Pre-tax margin (%) (34.1) (144.1) (108.5) (70.9) (78.4) (37.0) (22.6) (13.1) (6.9) (18.7)
Net profit (25.7) (50.0) (44.1) (57.0) (176.8) (33.1) (13.8) (11.5) (4.6) (63.0)
Chg (% y-y) 0.0 0.0 0.0 0.0 Turned neg Remained neg To remain neg To remain neg To remain neg To remain neg
Net margin (%) (29.0) (105.2) (83.5) (54.0) (60.0) (30.7) (17.6) (9.8) (3.4) (14.3)
Note: Parent basis
Source: Samsung Securities estimates
441 540
932 1,242
1,588 1,934
18 40
304 481
646 819
(63)
22 274
495 820
1,034
(20)(10)0102030405060
(500)
0
500
1,000
1,500
2,000
2,500
2017E 2018E 2019E 2020E 2021E 2022E
Sales (LHS) Operating profit (LHS)
Net profit (LHS) Operating margin (RHS)
Net margin (RHS)
(KRWb) (%)
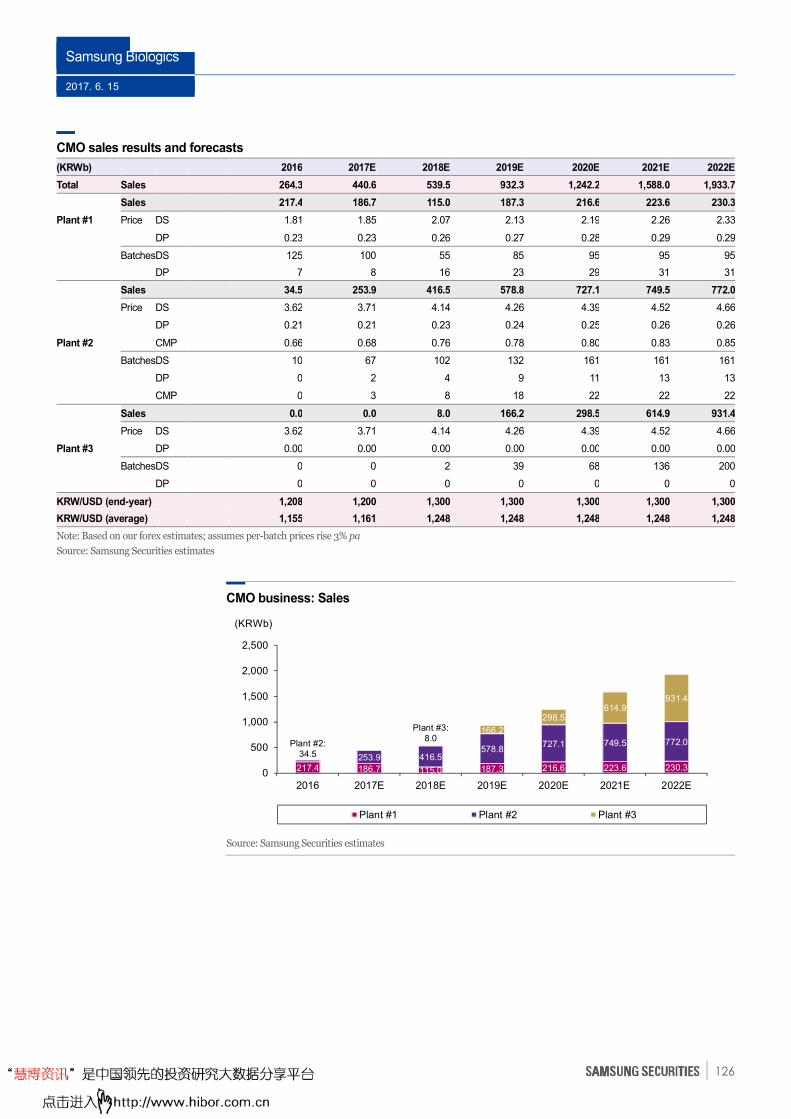
Samsung Biologics
2017. 6. 15
126
CMO sales results and forecasts
(KRWb) 2016 2017E 2018E 2019E 2020E 2021E 2022E
Total Sales 264.3 440.6 539.5 932.3 1,242.2 1,588.0 1,933.7
Plant #1
Sales 217.4 186.7 115.0 187.3 216.6 223.6 230.3
Price DS 1.81 1.85 2.07 2.13 2.19 2.26 2.33
DP 0.23 0.23 0.26 0.27 0.28 0.29 0.29
Batches DS 125 100 55 85 95 95 95
DP 7 8 16 23 29 31 31
Plant #2
Sales 34.5 253.9 416.5 578.8 727.1 749.5 772.0
Price DS 3.62 3.71 4.14 4.26 4.39 4.52 4.66
DP 0.21 0.21 0.23 0.24 0.25 0.26 0.26
CMP 0.66 0.68 0.76 0.78 0.80 0.83 0.85
Batches DS 10 67 102 132 161 161 161
DP 0 2 4 9 11 13 13
CMP 0 3 8 18 22 22 22
Plant #3
Sales 0.0 0.0 8.0 166.2 298.5 614.9 931.4
Price DS 3.62 3.71 4.14 4.26 4.39 4.52 4.66
DP 0.00 0.00 0.00 0.00 0.00 0.00 0.00
Batches DS 0 0 2 39 68 136 200
DP 0 0 0 0 0 0 0
KRW/USD (end-year) 1,208 1,200 1,300 1,300 1,300 1,300 1,300
KRW/USD (average) 1,155 1,161 1,248 1,248 1,248 1,248 1,248
Note: Based on our forex estimates; assumes per-batch prices rise 3% pa
Source: Samsung Securities estimates
CMO business: Sales
Source: Samsung Securities estimates
217.4 186.7 115.0 187.3 216.6 223.6 230.3
Plant #2:34.5 253.9 416.5
578.8 727.1 749.5 772.0
Plant #3:8.0
166.2
298.5 614.9
931.4
0
500
1,000
1,500
2,000
2,500
2016 2017E 2018E 2019E 2020E 2021E 2022E
Plant #1 Plant #2 Plant #3
(KRWb)
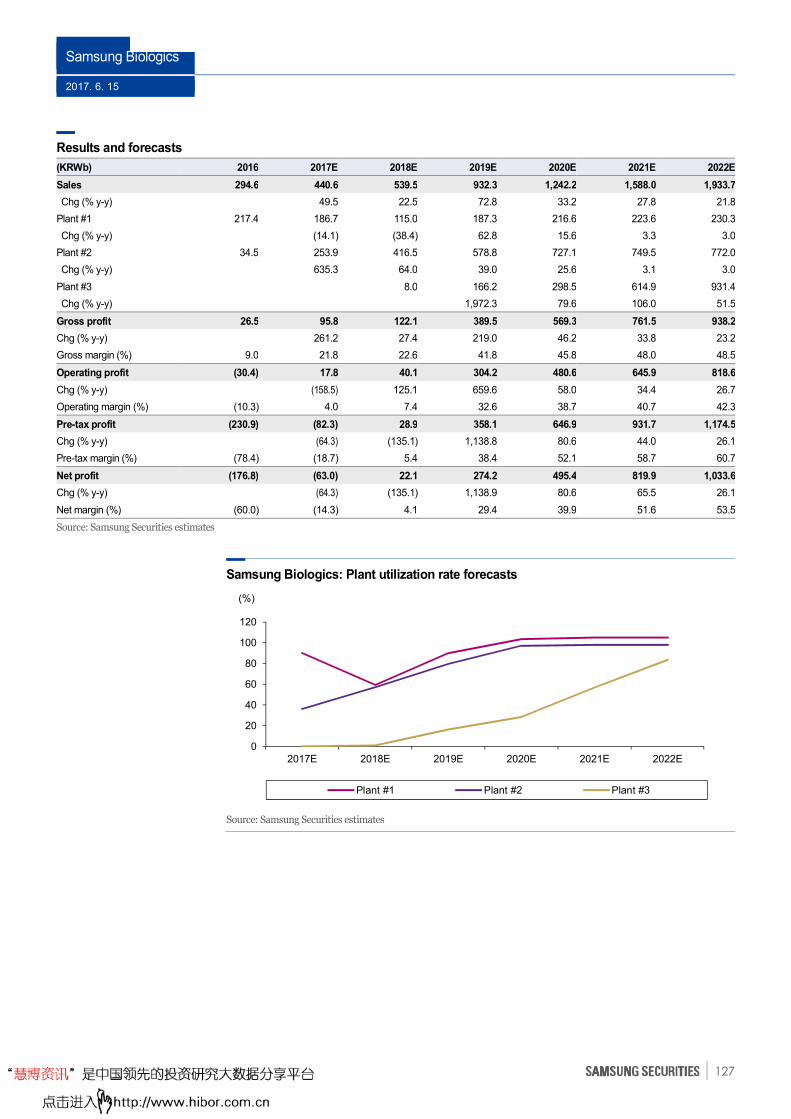
Samsung Biologics
2017. 6. 15
127
Results and forecasts
(KRWb) 2016 2017E 2018E 2019E 2020E 2021E 2022E
Sales 294.6 440.6 539.5 932.3 1,242.2 1,588.0 1,933.7
Chg (% y-y) 49.5 22.5 72.8 33.2 27.8 21.8
Plant #1 217.4 186.7 115.0 187.3 216.6 223.6 230.3
Chg (% y-y) (14.1) (38.4) 62.8 15.6 3.3 3.0
Plant #2 34.5 253.9 416.5 578.8 727.1 749.5 772.0
Chg (% y-y) 635.3 64.0 39.0 25.6 3.1 3.0
Plant #3 8.0 166.2 298.5 614.9 931.4
Chg (% y-y) 1,972.3 79.6 106.0 51.5
Gross profit 26.5 95.8 122.1 389.5 569.3 761.5 938.2
Chg (% y-y) 261.2 27.4 219.0 46.2 33.8 23.2
Gross margin (%) 9.0 21.8 22.6 41.8 45.8 48.0 48.5
Operating profit (30.4) 17.8 40.1 304.2 480.6 645.9 818.6
Chg (% y-y) (158.5) 125.1 659.6 58.0 34.4 26.7
Operating margin (%) (10.3) 4.0 7.4 32.6 38.7 40.7 42.3
Pre-tax profit (230.9) (82.3) 28.9 358.1 646.9 931.7 1,174.5
Chg (% y-y) (64.3) (135.1) 1,138.8 80.6 44.0 26.1
Pre-tax margin (%) (78.4) (18.7) 5.4 38.4 52.1 58.7 60.7
Net profit (176.8) (63.0) 22.1 274.2 495.4 819.9 1,033.6
Chg (% y-y) (64.3) (135.1) 1,138.9 80.6 65.5 26.1
Net margin (%) (60.0) (14.3) 4.1 29.4 39.9 51.6 53.5
Source: Samsung Securities estimates
Samsung Biologics: Plant utilization rate forecasts
Source: Samsung Securities estimates
0
20
40
60
80
100
120
2017E 2018E 2019E 2020E 2021E 2022E
Plant #1 Plant #2 Plant #3
(%)
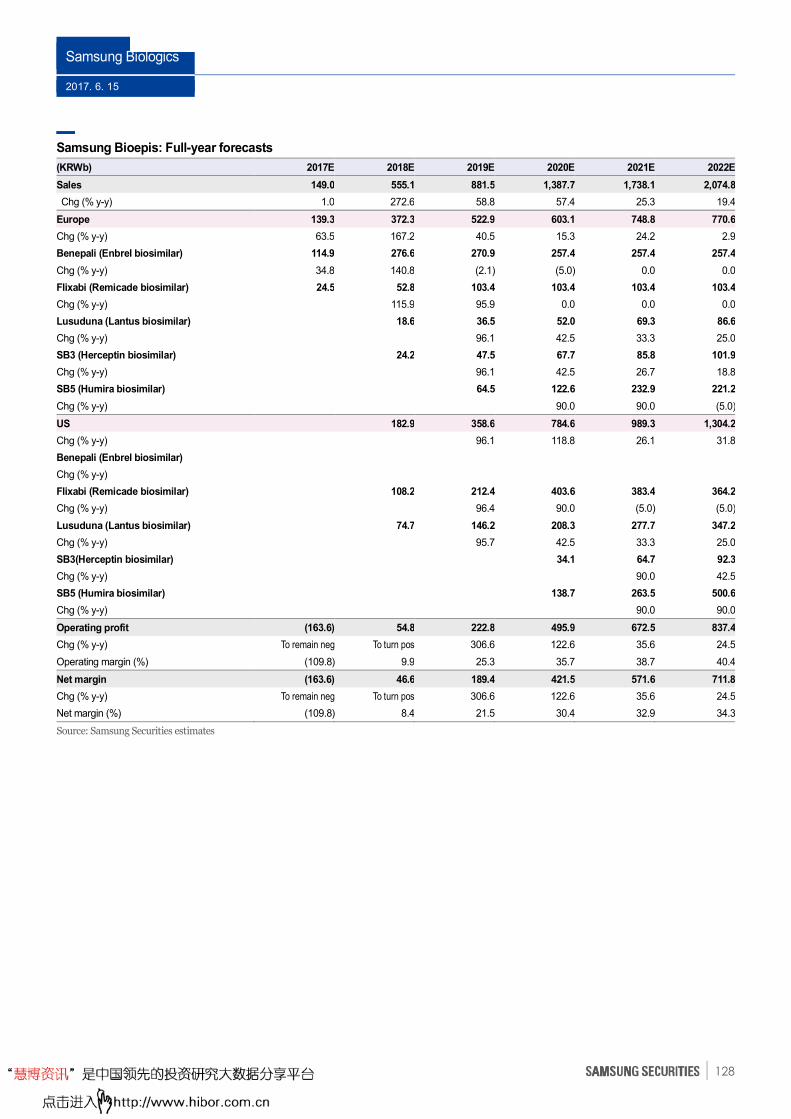
Samsung Biologics
2017. 6. 15
128
Samsung Bioepis: Full-year forecasts
(KRWb) 2017E 2018E 2019E 2020E 2021E 2022E
Sales 149.0 555.1 881.5 1,387.7 1,738.1 2,074.8
Chg (% y-y) 1.0 272.6 58.8 57.4 25.3 19.4
Europe 139.3 372.3 522.9 603.1 748.8 770.6
Chg (% y-y) 63.5 167.2 40.5 15.3 24.2 2.9
Benepali (Enbrel biosimilar) 114.9 276.6 270.9 257.4 257.4 257.4
Chg (% y-y) 34.8 140.8 (2.1) (5.0) 0.0 0.0
Flixabi (Remicade biosimilar) 24.5 52.8 103.4 103.4 103.4 103.4
Chg (% y-y) 115.9 95.9 0.0 0.0 0.0
Lusuduna (Lantus biosimilar) 18.6 36.5 52.0 69.3 86.6
Chg (% y-y) 96.1 42.5 33.3 25.0
SB3 (Herceptin biosimilar) 24.2 47.5 67.7 85.8 101.9
Chg (% y-y) 96.1 42.5 26.7 18.8
SB5 (Humira biosimilar) 64.5 122.6 232.9 221.2
Chg (% y-y) 90.0 90.0 (5.0)
US 182.9 358.6 784.6 989.3 1,304.2
Chg (% y-y) 96.1 118.8 26.1 31.8
Benepali (Enbrel biosimilar) Chg (% y-y)
Flixabi (Remicade biosimilar) 108.2 212.4 403.6 383.4 364.2
Chg (% y-y) 96.4 90.0 (5.0) (5.0)
Lusuduna (Lantus biosimilar) 74.7 146.2 208.3 277.7 347.2
Chg (% y-y) 95.7 42.5 33.3 25.0
SB3(Herceptin biosimilar) 34.1 64.7 92.3
Chg (% y-y) 90.0 42.5
SB5 (Humira biosimilar) 138.7 263.5 500.6
Chg (% y-y) 90.0 90.0
Operating profit (163.6) 54.8 222.8 495.9 672.5 837.4
Chg (% y-y) To remain neg To turn pos 306.6 122.6 35.6 24.5
Operating margin (%) (109.8) 9.9 25.3 35.7 38.7 40.4
Net margin (163.6) 46.6 189.4 421.5 571.6 711.8
Chg (% y-y) To remain neg To turn pos 306.6 122.6 35.6 24.5
Net margin (%) (109.8) 8.4 21.5 30.4 32.9 34.3
Source: Samsung Securities estimates
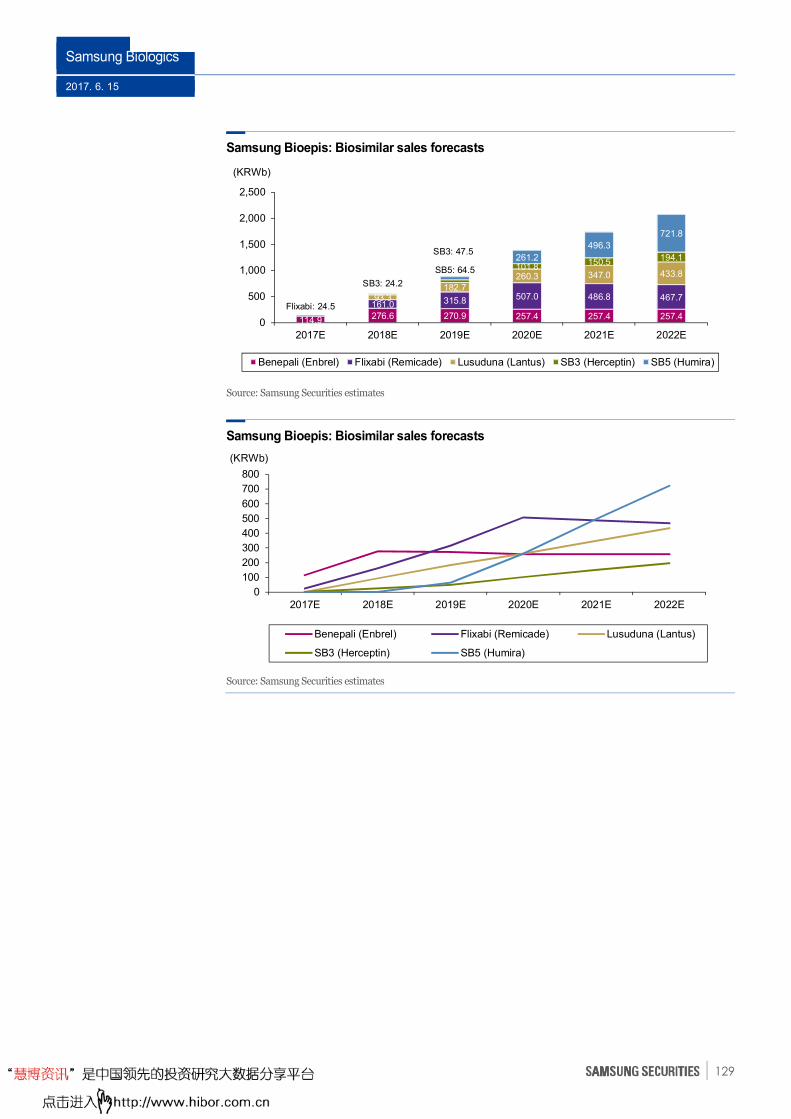
Samsung Biologics
2017. 6. 15
129
Samsung Bioepis: Biosimilar sales forecasts
Source: Samsung Securities estimates
Samsung Bioepis: Biosimilar sales forecasts
Source: Samsung Securities estimates
0
100
200
300
400
500
600
700
800
2017E 2018E 2019E 2020E 2021E 2022E
Benepali (Enbrel) Flixabi (Remicade) Lusuduna (Lantus)
SB3 (Herceptin) SB5 (Humira)
(KRWb)
114.9 276.6 270.9 257.4 257.4 257.4 Flixabi: 24.5 161.0 315.8 507.0 486.8 467.7 93.3
182.7 260.3 347.0 433.8
SB3: 24.2
SB3: 47.5
101.8 150.5 194.1
SB5: 64.5
261.2
496.3
721.8
0
500
1,000
1,500
2,000
2,500
2017E 2018E 2019E 2020E 2021E 2022E
Benepali (Enbrel) Flixabi (Remicade) Lusuduna (Lantus) SB3 (Herceptin) SB5 (Humira)
(KRWb)
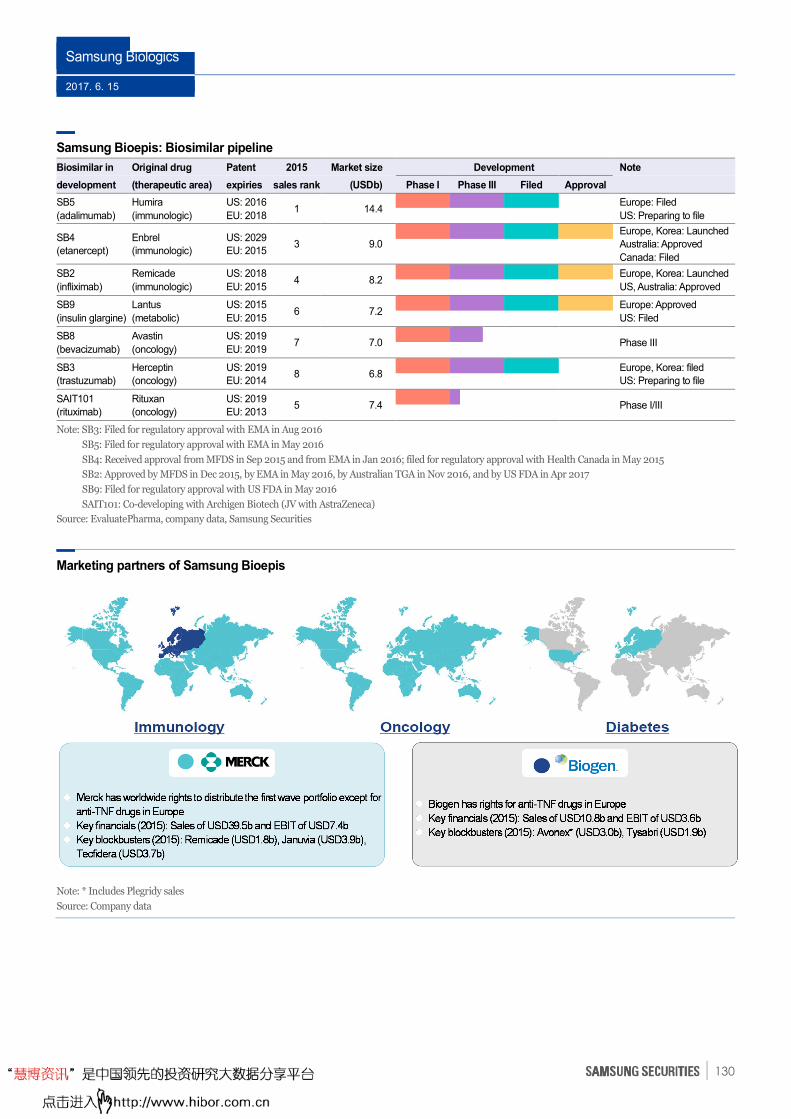
Samsung Biologics
2017. 6. 15
130
Samsung Bioepis: Biosimilar pipeline
Biosimilar in Original drug Patent 2015 Market size Development Note
development (therapeutic area) expiries sales rank (USDb) Phase I Phase III Filed Approval
SB5
(adalimumab)
Humira
(immunologic)
US: 2016
EU: 2018 1 14.4
Europe: Filed
US: Preparing to file SB4
(etanercept)
Enbrel
(immunologic)
US: 2029
EU: 2015 3 9.0
Europe, Korea: Launched
Australia: Approved
Canada: Filed
SB2
(infliximab)
Remicade
(immunologic)
US: 2018
EU: 2015 4 8.2
Europe, Korea: Launched
US, Australia: Approved SB9
(insulin glargine)
Lantus
(metabolic)
US: 2015
EU: 2015 6 7.2
Europe: Approved
US: Filed SB8
(bevacizumab)
Avastin
(oncology)
US: 2019
EU: 2019 7 7.0
Phase III
SB3
(trastuzumab)
Herceptin
(oncology)
US: 2019
EU: 2014 8 6.8
Europe, Korea: filed
US: Preparing to file SAIT101
(rituximab)
Rituxan
(oncology)
US: 2019
EU: 2013 5 7.4
Phase I/III
Note: SB3: Filed for regulatory approval with EMA in Aug 2016
SB5: Filed for regulatory approval with EMA in May 2016
SB4: Received approval from MFDS in Sep 2015 and from EMA in Jan 2016; filed for regulatory approval with Health Canada in May 2015
SB2: Approved by MFDS in Dec 2015, by EMA in May 2016, by Australian TGA in Nov 2016, and by US FDA in Apr 2017
SB9: Filed for regulatory approval with US FDA in May 2016
SAIT101: Co-developing with Archigen Biotech (JV with AstraZeneca)
Source: EvaluatePharma, company data, Samsung Securities
Marketing partners of Samsung Bioepis
Note: * Includes Plegridy sales
Source: Company data
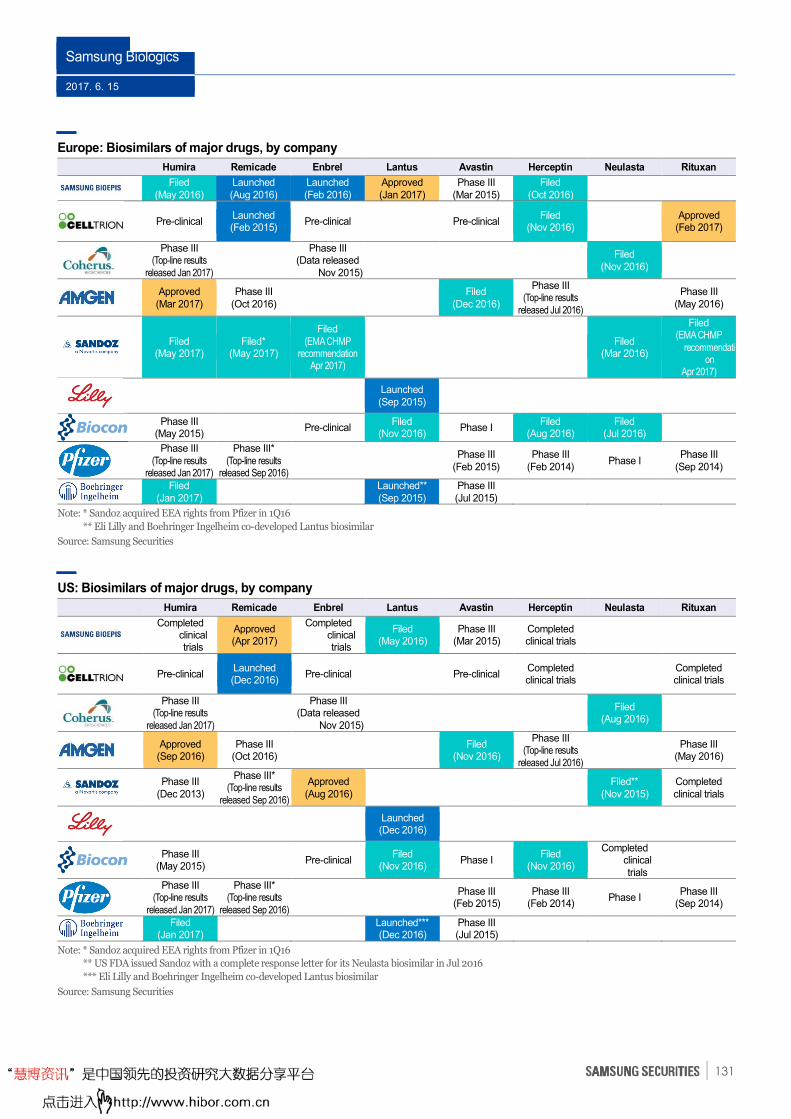
Samsung Biologics
2017. 6. 15
131
Europe: Biosimilars of major drugs, by company
Humira Remicade Enbrel Lantus Avastin Herceptin Neulasta Rituxan
Filed
(May 2016) Launched (Aug 2016)
Launched (Feb 2016)
Approved (Jan 2017)
Phase III (Mar 2015)
Filed (Oct 2016)
Pre-clinical
Launched (Feb 2015)
Pre-clinical Pre-clinical Filed
(Nov 2016)
Approved (Feb 2017)
Phase III
(Top-line results released Jan 2017)
Phase III
(Data released Nov 2015)
Filed
(Nov 2016)
Approved
(Mar 2017) Phase III
(Oct 2016)
Filed (Dec 2016)
Phase III (Top-line results
released Jul 2016)
Phase III (May 2016)
Filed
(May 2017) Filed*
(May 2017)
Filed (EMA CHMP
recommendation Apr 2017)
Filed
(Mar 2016)
Filed (EMA CHMP
recommendation
Apr 2017)
Launched (Sep 2015)
Phase III
(May 2015) Pre-clinical
Filed (Nov 2016)
Phase I Filed
(Aug 2016) Filed
(Jul 2016)
Phase III
(Top-line results released Jan 2017)
Phase III* (Top-line results
released Sep 2016)
Phase III (Feb 2015)
Phase III (Feb 2014)
Phase I Phase III
(Sep 2014)
Filed
(Jan 2017)
Launched** (Sep 2015)
Phase III (Jul 2015)
Note: * Sandoz acquired EEA rights from Pfizer in 1Q16
** Eli Lilly and Boehringer Ingelheim co-developed Lantus biosimilar
Source: Samsung Securities
US: Biosimilars of major drugs, by company
Humira Remicade Enbrel Lantus Avastin Herceptin Neulasta Rituxan
Completed
clinical trials
Approved (Apr 2017)
Completed clinical trials
Filed (May 2016)
Phase III (Mar 2015)
Completed clinical trials
Pre-clinical
Launched (Dec 2016)
Pre-clinical Pre-clinical Completed clinical trials
Completed clinical trials
Phase III
(Top-line results released Jan 2017)
Phase III
(Data released Nov 2015)
Filed
(Aug 2016)
Approved
(Sep 2016) Phase III
(Oct 2016)
Filed (Nov 2016)
Phase III (Top-line results
released Jul 2016)
Phase III (May 2016)
Phase III
(Dec 2013)
Phase III* (Top-line results
released Sep 2016)
Approved (Aug 2016)
Filed**
(Nov 2015) Completed clinical trials
Launched (Dec 2016)
Phase III
(May 2015) Pre-clinical
Filed (Nov 2016)
Phase I Filed
(Nov 2016)
Completed clinical trials
Phase III
(Top-line results released Jan 2017)
Phase III* (Top-line results
released Sep 2016)
Phase III (Feb 2015)
Phase III (Feb 2014)
Phase I Phase III
(Sep 2014)
Filed
(Jan 2017)
Launched*** (Dec 2016)
Phase III (Jul 2015)
Note: * Sandoz acquired EEA rights from Pfizer in 1Q16
** US FDA issued Sandoz with a complete response letter for its Neulasta biosimilar in Jul 2016
*** Eli Lilly and Boehringer Ingelheim co-developed Lantus biosimilar
Source: Samsung Securities
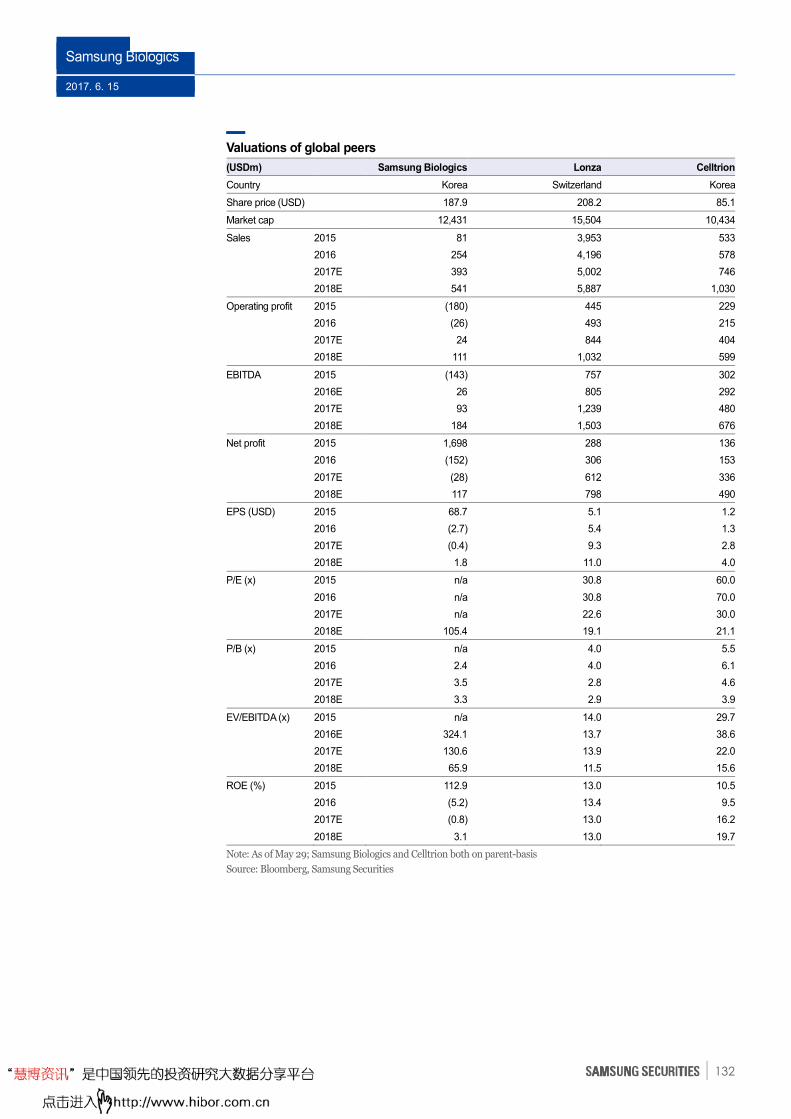
Samsung Biologics
2017. 6. 15
132
Valuations of global peers
(USDm) Samsung Biologics Lonza Celltrion
Country Korea Switzerland Korea
Share price (USD) 187.9 208.2 85.1
Market cap 12,431 15,504 10,434
Sales 2015 81 3,953 533
2016 254 4,196 578
2017E 393 5,002 746
2018E 541 5,887 1,030
Operating profit 2015 (180) 445 229
2016 (26) 493 215
2017E 24 844 404
2018E 111 1,032 599
EBITDA 2015 (143) 757 302
2016E 26 805 292
2017E 93 1,239 480
2018E 184 1,503 676
Net profit 2015 1,698 288 136
2016 (152) 306 153
2017E (28) 612 336
2018E 117 798 490
EPS (USD) 2015 68.7 5.1 1.2
2016 (2.7) 5.4 1.3
2017E (0.4) 9.3 2.8
2018E 1.8 11.0 4.0
P/E (x) 2015 n/a 30.8 60.0
2016 n/a 30.8 70.0
2017E n/a 22.6 30.0
2018E 105.4 19.1 21.1
P/B (x) 2015 n/a 4.0 5.5
2016 2.4 4.0 6.1
2017E 3.5 2.8 4.6
2018E 3.3 2.9 3.9
EV/EBITDA (x) 2015 n/a 14.0 29.7
2016E 324.1 13.7 38.6
2017E 130.6 13.9 22.0
2018E 65.9 11.5 15.6
ROE (%) 2015 112.9 13.0 10.5
2016 (5.2) 13.4 9.5
2017E (0.8) 13.0 16.2
2018E 3.1 13.0 19.7
Note: As of May 29; Samsung Biologics and Celltrion both on parent-basis
Source: Bloomberg, Samsung Securities
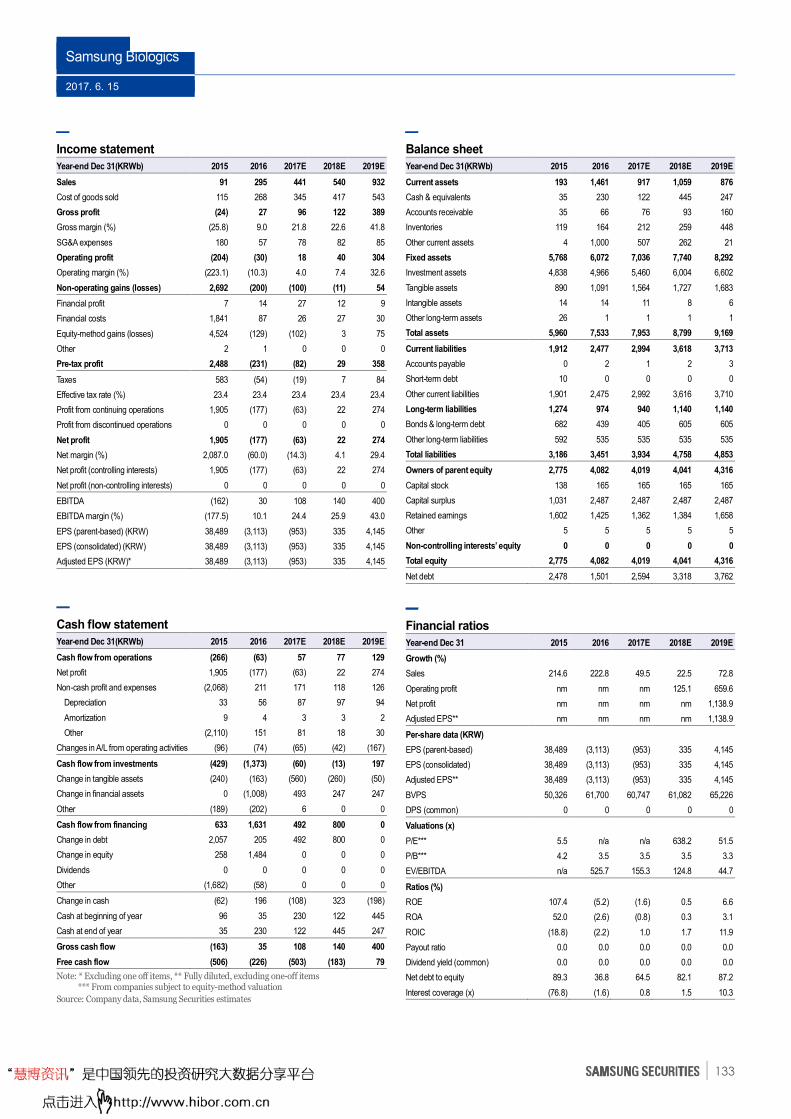
Samsung Biologics
2017. 6. 15
133
Income statement
Year-end Dec 31(KRWb) 2015 2016 2017E 2018E 2019E
Sales 91 295 441 540 932
Cost of goods sold 115 268 345 417 543
Gross profit (24) 27 96 122 389
Gross margin (%) (25.8) 9.0 21.8 22.6 41.8
SG&A expenses 180 57 78 82 85
Operating profit (204) (30) 18 40 304
Operating margin (%) (223.1) (10.3) 4.0 7.4 32.6
Non-operating gains (losses) 2,692 (200) (100) (11) 54
Financial profit 7 14 27 12 9
Financial costs 1,841 87 26 27 30
Equity-method gains (losses) 4,524 (129) (102) 3 75
Other 2 1 0 0 0
Pre-tax profit 2,488 (231) (82) 29 358
Taxes 583 (54) (19) 7 84
Effective tax rate (%) 23.4 23.4 23.4 23.4 23.4
Profit from continuing operations 1,905 (177) (63) 22 274
Profit from discontinued operations 0 0 0 0 0
Net profit 1,905 (177) (63) 22 274
Net margin (%) 2,087.0 (60.0) (14.3) 4.1 29.4
Net profit (controlling interests) 1,905 (177) (63) 22 274
Net profit (non-controlling interests) 0 0 0 0 0
EBITDA (162) 30 108 140 400
EBITDA margin (%) (177.5) 10.1 24.4 25.9 43.0
EPS (parent-based) (KRW) 38,489 (3,113) (953) 335 4,145
EPS (consolidated) (KRW) 38,489 (3,113) (953) 335 4,145
Adjusted EPS (KRW)* 38,489 (3,113) (953) 335 4,145
Cash flow statement
Year-end Dec 31(KRWb) 2015 2016 2017E 2018E 2019E
Cash flow from operations (266) (63) 57 77 129
Net profit 1,905 (177) (63) 22 274
Non-cash profit and expenses (2,068) 211 171 118 126
Depreciation 33 56 87 97 94
Amortization 9 4 3 3 2
Other (2,110) 151 81 18 30
Changes in A/L from operating activities (96) (74) (65) (42) (167)
Cash flow from investments (429) (1,373) (60) (13) 197
Change in tangible assets (240) (163) (560) (260) (50)
Change in financial assets 0 (1,008) 493 247 247
Other (189) (202) 6 0 0
Cash flow from financing 633 1,631 492 800 0
Change in debt 2,057 205 492 800 0
Change in equity 258 1,484 0 0 0
Dividends 0 0 0 0 0
Other (1,682) (58) 0 0 0
Change in cash (62) 196 (108) 323 (198)
Cash at beginning of year 96 35 230 122 445
Cash at end of year 35 230 122 445 247
Gross cash flow (163) 35 108 140 400
Free cash flow (506) (226) (503) (183) 79
Note: * Excluding one off items, ** Fully diluted, excluding one-off items *** From companies subject to equity-method valuation
Source: Company data, Samsung Securities estimates
Balance sheet
Year-end Dec 31(KRWb) 2015 2016 2017E 2018E 2019E
Current assets 193 1,461 917 1,059 876
Cash & equivalents 35 230 122 445 247
Accounts receivable 35 66 76 93 160
Inventories 119 164 212 259 448
Other current assets 4 1,000 507 262 21
Fixed assets 5,768 6,072 7,036 7,740 8,292
Investment assets 4,838 4,966 5,460 6,004 6,602
Tangible assets 890 1,091 1,564 1,727 1,683
Intangible assets 14 14 11 8 6
Other long-term assets 26 1 1 1 1
Total assets 5,960 7,533 7,953 8,799 9,169
Current liabilities 1,912 2,477 2,994 3,618 3,713
Accounts payable 0 2 1 2 3
Short-term debt 10 0 0 0 0
Other current liabilities 1,901 2,475 2,992 3,616 3,710
Long-term liabilities 1,274 974 940 1,140 1,140
Bonds & long-term debt 682 439 405 605 605
Other long-term liabilities 592 535 535 535 535
Total liabilities 3,186 3,451 3,934 4,758 4,853
Owners of parent equity 2,775 4,082 4,019 4,041 4,316
Capital stock 138 165 165 165 165
Capital surplus 1,031 2,487 2,487 2,487 2,487
Retained earnings 1,602 1,425 1,362 1,384 1,658
Other 5 5 5 5 5
Non-controlling interests’ equity 0 0 0 0 0
Total equity 2,775 4,082 4,019 4,041 4,316
Net debt 2,478 1,501 2,594 3,318 3,762
Financial ratios
Year-end Dec 31 2015 2016 2017E 2018E 2019E
Growth (%)
Sales 214.6 222.8 49.5 22.5 72.8
Operating profit nm nm nm 125.1 659.6
Net profit nm nm nm nm 1,138.9
Adjusted EPS** nm nm nm nm 1,138.9
Per-share data (KRW)
EPS (parent-based) 38,489 (3,113) (953) 335 4,145
EPS (consolidated) 38,489 (3,113) (953) 335 4,145
Adjusted EPS** 38,489 (3,113) (953) 335 4,145
BVPS 50,326 61,700 60,747 61,082 65,226
DPS (common) 0 0 0 0 0
Valuations (x)
P/E*** 5.5 n/a n/a 638.2 51.5
P/B*** 4.2 3.5 3.5 3.5 3.3
EV/EBITDA n/a 525.7 155.3 124.8 44.7
Ratios (%)
ROE 107.4 (5.2) (1.6) 0.5 6.6
ROA 52.0 (2.6) (0.8) 0.3 3.1
ROIC (18.8) (2.2) 1.0 1.7 11.9
Payout ratio 0.0 0.0 0.0 0.0 0.0
Dividend yield (common) 0.0 0.0 0.0 0.0 0.0
Net debt to equity 89.3 36.8 64.5 82.1 87.2
Interest coverage (x) (76.8) (1.6) 0.8 1.5 10.3
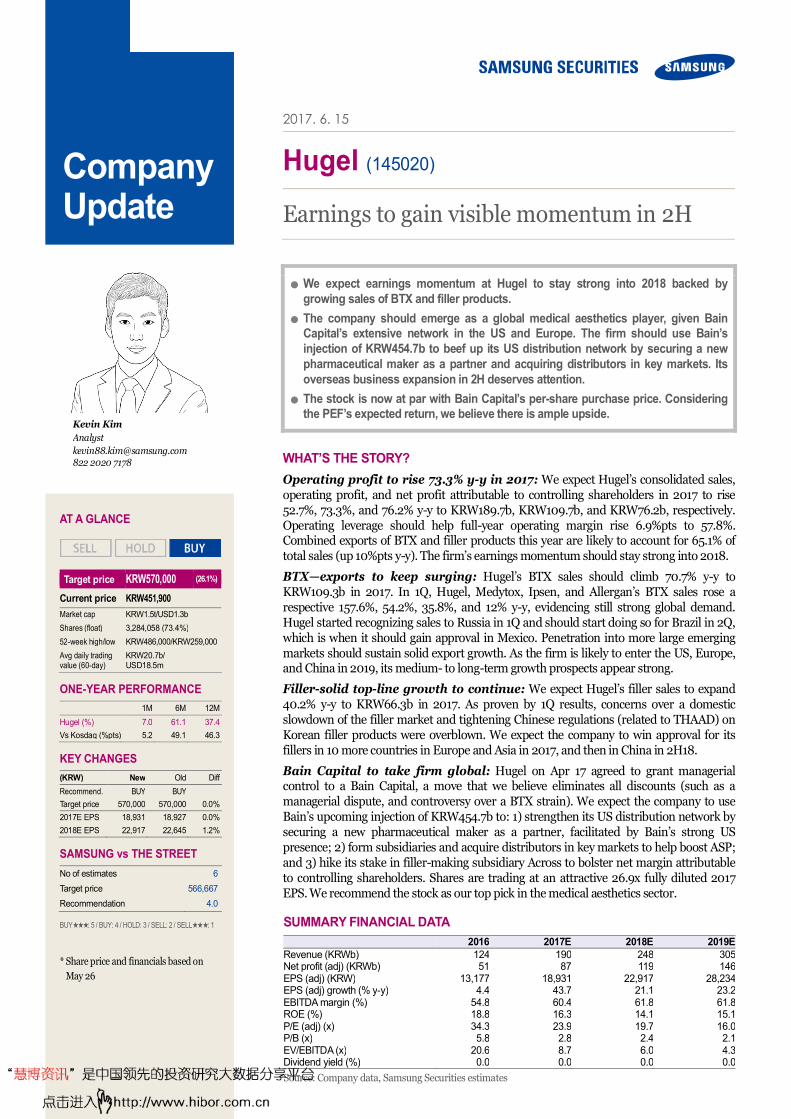
2017. 6. 15
Hugel (145020)
Earnings to gain visible momentum in 2H
● We expect earnings momentum at Hugel to stay strong into 2018 backed by
growing sales of BTX and filler products.
● The company should emerge as a global medical aesthetics player, given Bain
Capital’s extensive network in the US and Europe. The firm should use Bain’s
injection of KRW454.7b to beef up its US distribution network by securing a new
pharmaceutical maker as a partner and acquiring distributors in key markets. Its
overseas business expansion in 2H deserves attention. ● The stock is now at par with Bain Capital’s per-share purchase price. Considering
the PEF’s expected return, we believe there is ample upside.
WHAT’S THE STORY?
Operating profit to rise 73.3% y-y in 2017: We expect Hugel’s consolidated sales, operating profit, and net profit attributable to controlling shareholders in 2017 to rise 52.7%, 73.3%, and 76.2% y-y to KRW189.7b, KRW109.7b, and KRW76.2b, respectively. Operating leverage should help full-year operating margin rise 6.9%pts to 57.8%. Combined exports of BTX and filler products this year are likely to account for 65.1% of total sales (up 10%pts y-y). The firm’s earnings momentum should stay strong into 2018.
BTX—exports to keep surging: Hugel’s BTX sales should climb 70.7% y-y to KRW109.3b in 2017. In 1Q, Hugel, Medytox, Ipsen, and Allergan’s BTX sales rose a respective 157.6%, 54.2%, 35.8%, and 12% y-y, evidencing still strong global demand. Hugel started recognizing sales to Russia in 1Q and should start doing so for Brazil in 2Q, which is when it should gain approval in Mexico. Penetration into more large emerging markets should sustain solid export growth. As the firm is likely to enter the US, Europe, and China in 2019, its medium- to long-term growth prospects appear strong.
Filler-solid top-line growth to continue: We expect Hugel’s filler sales to expand 40.2% y-y to KRW66.3b in 2017. As proven by 1Q results, concerns over a domestic slowdown of the filler market and tightening Chinese regulations (related to THAAD) on Korean filler products were overblown. We expect the company to win approval for its fillers in 10 more countries in Europe and Asia in 2017, and then in China in 2H18.
Bain Capital to take firm global: Hugel on Apr 17 agreed to grant managerial control to a Bain Capital, a move that we believe eliminates all discounts (such as a managerial dispute, and controversy over a BTX strain). We expect the company to use Bain’s upcoming injection of KRW454.7b to: 1) strengthen its US distribution network by securing a new pharmaceutical maker as a partner, facilitated by Bain’s strong US presence; 2) form subsidiaries and acquire distributors in key markets to help boost ASP; and 3) hike its stake in filler-making subsidiary Across to bolster net margin attributable to controlling shareholders. Shares are trading at an attractive 26.9x fully diluted 2017 EPS. We recommend the stock as our top pick in the medical aesthetics sector.
Company Update
SUMMARY FINANCIAL DATA
2016 2017E 2018E 2019E
Revenue (KRWb) 124 190 248 305Net profit (adj) (KRWb) 51 87 119 146EPS (adj) (KRW) 13,177 18,931 22,917 28,234EPS (adj) growth (% y-y) 4.4 43.7 21.1 23.2EBITDA margin (%) 54.8 60.4 61.8 61.8ROE (%) 18.8 16.3 14.1 15.1P/E (adj) (x) 34.3 23.9 19.7 16.0P/B (x) 5.8 2.8 2.4 2.1EV/EBITDA (x) 20.6 8.7 6.0 4.3Dividend yield (%) 0.0 0.0 0.0 0.0
Source: Company data, Samsung Securities estimates
Kevin Kim
Analyst
[email protected] 822 2020 7178
AT A GLANCE
Target price KRW570,000 (26.1%)
Current price KRW451,900
Market cap KRW1.5t/USD1.3b
Shares (float) 3,284,058 (73.4%)
52-week high/low KRW486,000/KRW259,000
Avg daily trading value (60-day)
KRW20.7b/ USD18.5m
ONE-YEAR PERFORMANCE
1M 6M 12M
Hugel (%) 7.0 61.1 37.4
Vs Kosdaq (%pts) 5.2 49.1 46.3
KEY CHANGES
(KRW) New Old Diff
Recommend. BUY BUY
Target price 570,000 570,000 0.0%
2017E EPS 18,931 18,927 0.0%
2018E EPS 22,917 22,645 1.2%
SAMSUNG vs THE STREET
No of estimates 6
Target price 566,667
Recommendation 4.0
BUY★★★: 5 / BUY: 4 / HOLD: 3 / SELL: 2 / SELL★★★: 1
* Share price and financials based on
May 26
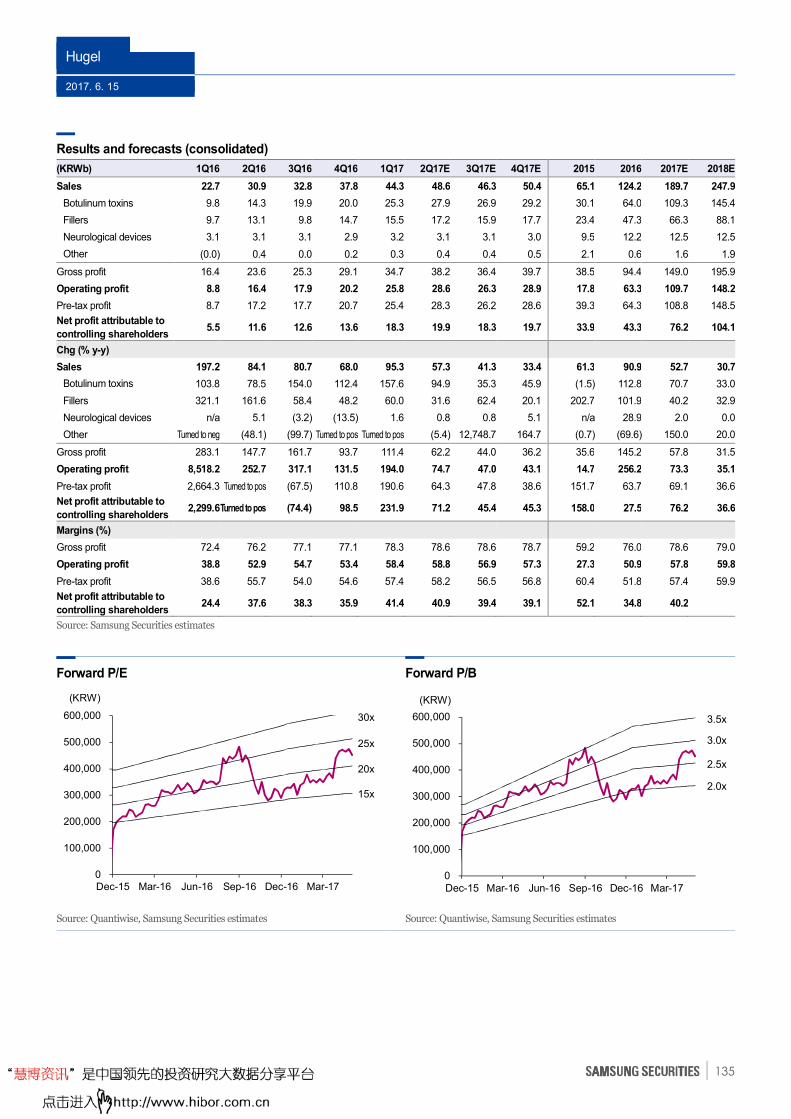
Hugel
2017. 6. 15
135
Results and forecasts (consolidated)
(KRWb) 1Q16 2Q16 3Q16 4Q16 1Q17 2Q17E 3Q17E 4Q17E 2015 2016 2017E 2018E
Sales 22.7 30.9 32.8 37.8 44.3 48.6 46.3 50.4 65.1 124.2 189.7 247.9
Botulinum toxins 9.8 14.3 19.9 20.0 25.3 27.9 26.9 29.2 30.1 64.0 109.3 145.4
Fillers 9.7 13.1 9.8 14.7 15.5 17.2 15.9 17.7 23.4 47.3 66.3 88.1
Neurological devices 3.1 3.1 3.1 2.9 3.2 3.1 3.1 3.0 9.5 12.2 12.5 12.5
Other (0.0) 0.4 0.0 0.2 0.3 0.4 0.4 0.5 2.1 0.6 1.6 1.9
Gross profit 16.4 23.6 25.3 29.1 34.7 38.2 36.4 39.7 38.5 94.4 149.0 195.9
Operating profit 8.8 16.4 17.9 20.2 25.8 28.6 26.3 28.9 17.8 63.3 109.7 148.2
Pre-tax profit 8.7 17.2 17.7 20.7 25.4 28.3 26.2 28.6 39.3 64.3 108.8 148.5
Net profit attributable to
controlling shareholders 5.5 11.6 12.6 13.6 18.3 19.9 18.3 19.7 33.9 43.3 76.2 104.1
Chg (% y-y) Sales 197.2 84.1 80.7 68.0 95.3 57.3 41.3 33.4 61.3 90.9 52.7 30.7
Botulinum toxins 103.8 78.5 154.0 112.4 157.6 94.9 35.3 45.9 (1.5) 112.8 70.7 33.0
Fillers 321.1 161.6 58.4 48.2 60.0 31.6 62.4 20.1 202.7 101.9 40.2 32.9
Neurological devices n/a 5.1 (3.2) (13.5) 1.6 0.8 0.8 5.1 n/a 28.9 2.0 0.0
Other Turned to neg (48.1) (99.7) Turned to pos Turned to pos (5.4) 12,748.7 164.7 (0.7) (69.6) 150.0 20.0
Gross profit 283.1 147.7 161.7 93.7 111.4 62.2 44.0 36.2 35.6 145.2 57.8 31.5
Operating profit 8,518.2 252.7 317.1 131.5 194.0 74.7 47.0 43.1 14.7 256.2 73.3 35.1
Pre-tax profit 2,664.3 Turned to pos (67.5) 110.8 190.6 64.3 47.8 38.6 151.7 63.7 69.1 36.6
Net profit attributable to
controlling shareholders 2,299.6 Turned to pos (74.4) 98.5 231.9 71.2 45.4 45.3 158.0 27.5 76.2 36.6
Margins (%) Gross profit 72.4 76.2 77.1 77.1 78.3 78.6 78.6 78.7 59.2 76.0 78.6 79.0
Operating profit 38.8 52.9 54.7 53.4 58.4 58.8 56.9 57.3 27.3 50.9 57.8 59.8
Pre-tax profit 38.6 55.7 54.0 54.6 57.4 58.2 56.5 56.8 60.4 51.8 57.4 59.9
Net profit attributable to
controlling shareholders 24.4 37.6 38.3 35.9 41.4 40.9 39.4 39.1 52.1 34.8 40.2
Source: Samsung Securities estimates
Forward P/E Forward P/B
Source: Quantiwise, Samsung Securities estimates Source: Quantiwise, Samsung Securities estimates
0
100,000
200,000
300,000
400,000
500,000
600,000
Dec-15 Mar-16 Jun-16 Sep-16 Dec-16 Mar-17
(KRW)
30x
25x
20x
15x
0
100,000
200,000
300,000
400,000
500,000
600,000
Dec-15 Mar-16 Jun-16 Sep-16 Dec-16 Mar-17
(KRW)
3.5x
3.0x
2.5x
2.0x
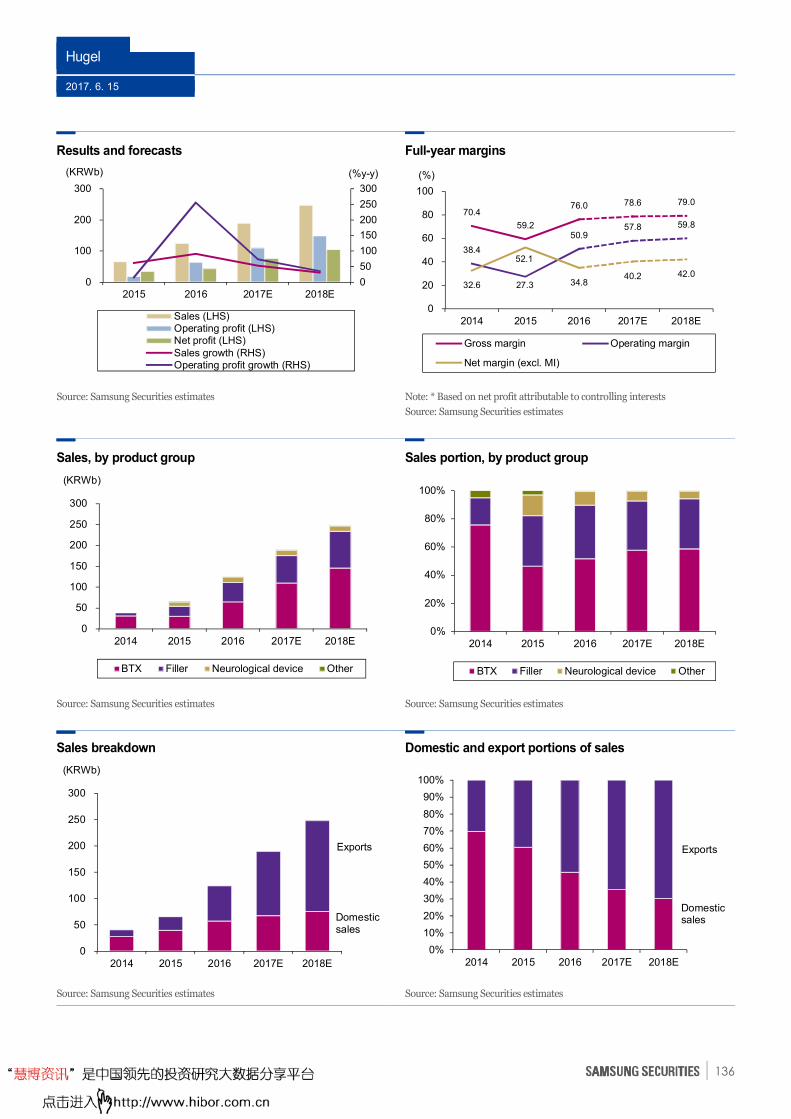
Hugel
2017. 6. 15
136
Results and forecasts Full-year margins
Source: Samsung Securities estimates
Note: * Based on net profit attributable to controlling interests
Source: Samsung Securities estimates
Sales, by product group Sales portion, by product group
Source: Samsung Securities estimates
Source: Samsung Securities estimates
Sales breakdown Domestic and export portions of sales
Source: Samsung Securities estimates Source: Samsung Securities estimates
0
50
100
150
200
250
300
0
100
200
300
2015 2016 2017E 2018E
(KRWb)
Sales (LHS)Operating profit (LHS)Net profit (LHS)Sales growth (RHS)Operating profit growth (RHS)
(%y-y)
70.4
59.2
76.0 78.6 79.0
38.4
27.3
50.9 57.8 59.8
32.6
52.1
34.8 40.2 42.0
0
20
40
60
80
100
2014 2015 2016 2017E 2018E
(%)
Gross margin Operating margin
Net margin (excl. MI)
0
50
100
150
200
250
300
2014 2015 2016 2017E 2018E
(KRWb)
BTX Filler Neurological device Other
0%
20%
40%
60%
80%
100%
2014 2015 2016 2017E 2018E
BTX Filler Neurological device Other
0
50
100
150
200
250
300
2014 2015 2016 2017E 2018E
(KRWb)
Exports
Domesticsales
0%
10%
20%
30%
40%
50%
60%
70%
80%
90%
100%
2014 2015 2016 2017E 2018E
Exports
Domesticsales
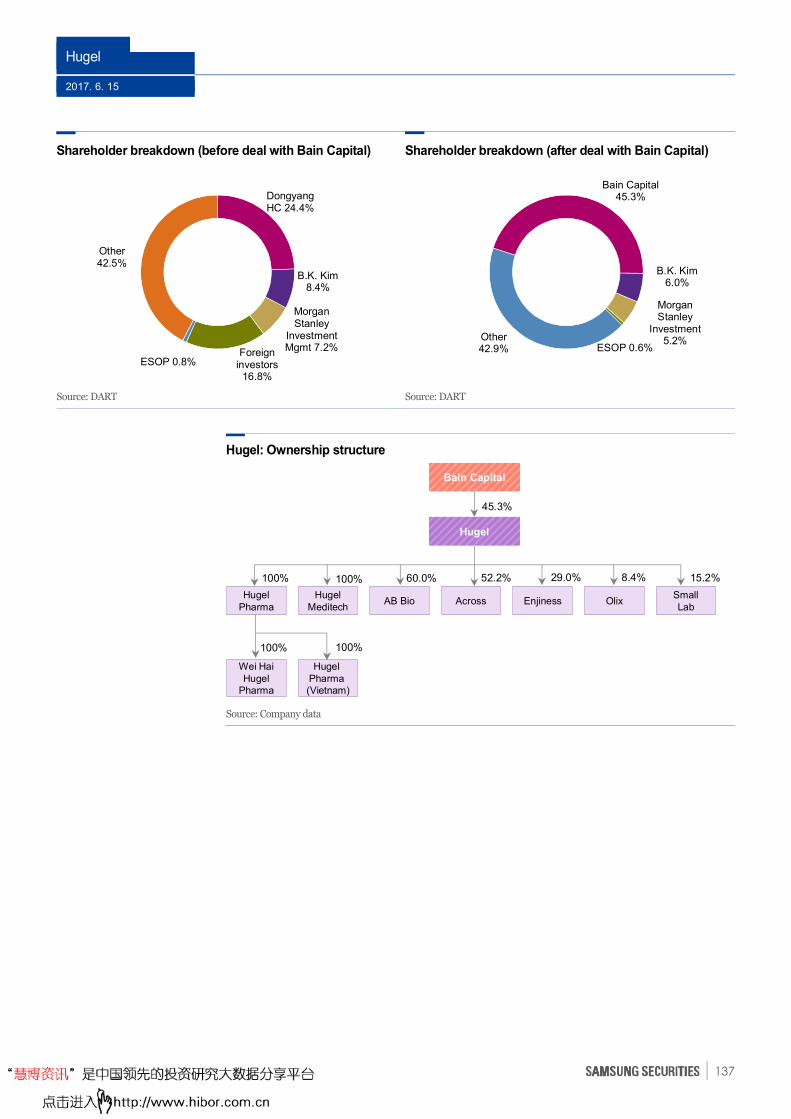
Hugel
2017. 6. 15
137
Shareholder breakdown (before deal with Bain Capital) Shareholder breakdown (after deal with Bain Capital)
Source: DART Source: DART
Hugel: Ownership structure
Source: Company data
Dongyang HC 24.4%
B.K. Kim 8.4%
Morgan Stanley
Investment Mgmt 7.2%Foreign
investors 16.8%
ESOP 0.8%
Other 42.5%
Bain Capital 45.3%
B.K. Kim 6.0%
Morgan Stanley
Investment 5.2%
ESOP 0.6%Other42.9%
45.3%
HugelPharma
HugelMeditech
AB Bio Across Enjiness OlixSmall Lab
100% 100% 60.0% 52.2% 29.0% 15.2%8.4%
Wei Hai Hugel
Pharma
HugelPharma (Vietnam)
100% 100%
Bain Capital
Hugel
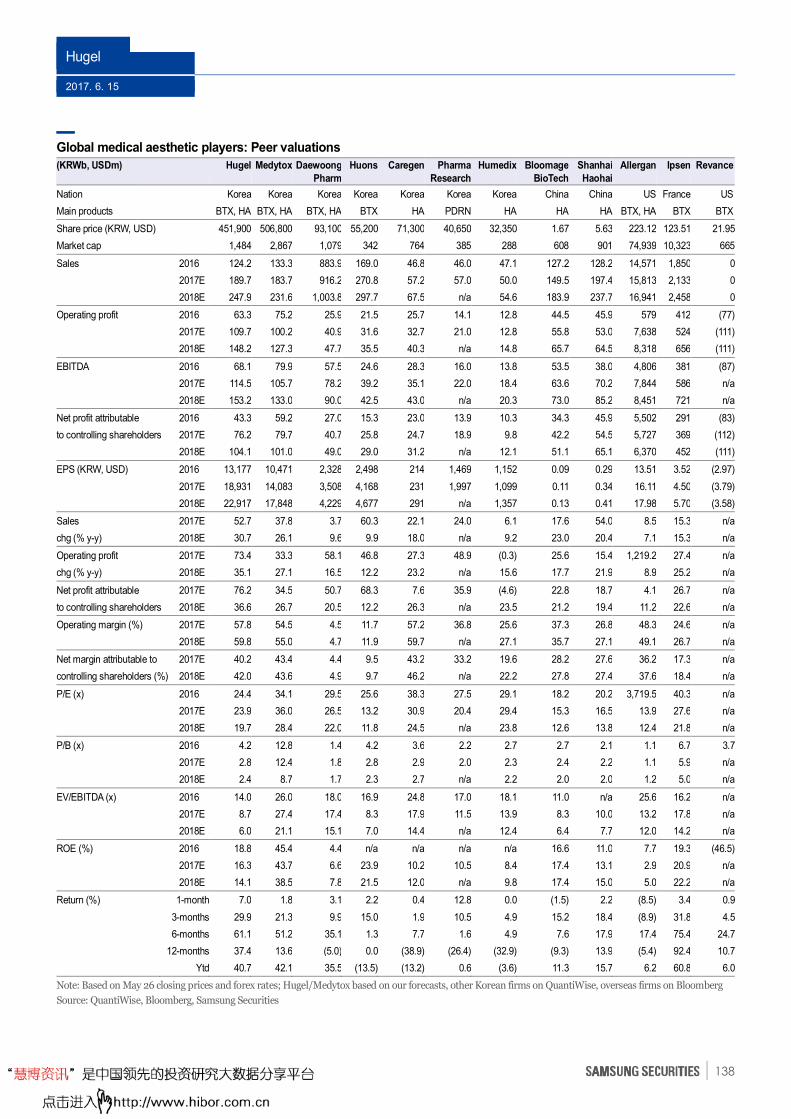
Hugel
2017. 6. 15
138
Global medical aesthetic players: Peer valuations
(KRWb, USDm)
Hugel Medytox Daewoong
Pharm
Huons Caregen Pharma
Research
Humedix Bloomage
BioTech
Shanhai
Haohai
Allergan Ipsen Revance
Nation Korea Korea Korea Korea Korea Korea Korea China China US France US
Main products BTX, HA BTX, HA BTX, HA BTX HA PDRN HA HA HA BTX, HA BTX BTX
Share price (KRW, USD) 451,900 506,800 93,100 55,200 71,300 40,650 32,350 1.67 5.63 223.12 123.51 21.95
Market cap 1,484 2,867 1,079 342 764 385 288 608 901 74,939 10,323 665
Sales 2016 124.2 133.3 883.9 169.0 46.8 46.0 47.1 127.2 128.2 14,571 1,850 0
2017E 189.7 183.7 916.2 270.8 57.2 57.0 50.0 149.5 197.4 15,813 2,133 0
2018E 247.9 231.6 1,003.8 297.7 67.5 n/a 54.6 183.9 237.7 16,941 2,458 0
Operating profit 2016 63.3 75.2 25.9 21.5 25.7 14.1 12.8 44.5 45.9 579 412 (77)
2017E 109.7 100.2 40.9 31.6 32.7 21.0 12.8 55.8 53.0 7,638 524 (111)
2018E 148.2 127.3 47.7 35.5 40.3 n/a 14.8 65.7 64.5 8,318 656 (111)
EBITDA 2016 68.1 79.9 57.5 24.6 28.3 16.0 13.8 53.5 38.0 4,806 381 (87)
2017E 114.5 105.7 78.2 39.2 35.1 22.0 18.4 63.6 70.2 7,844 586 n/a
2018E 153.2 133.0 90.0 42.5 43.0 n/a 20.3 73.0 85.2 8,451 721 n/a
Net profit attributable 2016 43.3 59.2 27.0 15.3 23.0 13.9 10.3 34.3 45.9 5,502 291 (83)
to controlling shareholders 2017E 76.2 79.7 40.7 25.8 24.7 18.9 9.8 42.2 54.5 5,727 369 (112)
2018E 104.1 101.0 49.0 29.0 31.2 n/a 12.1 51.1 65.1 6,370 452 (111)
EPS (KRW, USD) 2016 13,177 10,471 2,328 2,498 214 1,469 1,152 0.09 0.29 13.51 3.52 (2.97)
2017E 18,931 14,083 3,508 4,168 231 1,997 1,099 0.11 0.34 16.11 4.50 (3.79)
2018E 22,917 17,848 4,229 4,677 291 n/a 1,357 0.13 0.41 17.98 5.70 (3.58)
Sales 2017E 52.7 37.8 3.7 60.3 22.1 24.0 6.1 17.6 54.0 8.5 15.3 n/a
chg (% y-y) 2018E 30.7 26.1 9.6 9.9 18.0 n/a 9.2 23.0 20.4 7.1 15.3 n/a
Operating profit 2017E 73.4 33.3 58.1 46.8 27.3 48.9 (0.3) 25.6 15.4 1,219.2 27.4 n/a
chg (% y-y) 2018E 35.1 27.1 16.5 12.2 23.2 n/a 15.6 17.7 21.9 8.9 25.2 n/a
Net profit attributable 2017E 76.2 34.5 50.7 68.3 7.6 35.9 (4.6) 22.8 18.7 4.1 26.7 n/a
to controlling shareholders 2018E 36.6 26.7 20.5 12.2 26.3 n/a 23.5 21.2 19.4 11.2 22.6 n/a
Operating margin (%) 2017E 57.8 54.5 4.5 11.7 57.2 36.8 25.6 37.3 26.8 48.3 24.6 n/a
2018E 59.8 55.0 4.7 11.9 59.7 n/a 27.1 35.7 27.1 49.1 26.7 n/a
Net margin attributable to 2017E 40.2 43.4 4.4 9.5 43.2 33.2 19.6 28.2 27.6 36.2 17.3 n/a
controlling shareholders (%) 2018E 42.0 43.6 4.9 9.7 46.2 n/a 22.2 27.8 27.4 37.6 18.4 n/a
P/E (x) 2016 24.4 34.1 29.5 25.6 38.3 27.5 29.1 18.2 20.2 3,719.5 40.3 n/a
2017E 23.9 36.0 26.5 13.2 30.9 20.4 29.4 15.3 16.5 13.9 27.6 n/a
2018E 19.7 28.4 22.0 11.8 24.5 n/a 23.8 12.6 13.8 12.4 21.8 n/a
P/B (x) 2016 4.2 12.8 1.4 4.2 3.6 2.2 2.7 2.7 2.1 1.1 6.7 3.7
2017E 2.8 12.4 1.8 2.8 2.9 2.0 2.3 2.4 2.2 1.1 5.9 n/a
2018E 2.4 8.7 1.7 2.3 2.7 n/a 2.2 2.0 2.0 1.2 5.0 n/a
EV/EBITDA (x) 2016 14.0 26.0 18.0 16.9 24.8 17.0 18.1 11.0 n/a 25.6 16.2 n/a
2017E 8.7 27.4 17.4 8.3 17.9 11.5 13.9 8.3 10.0 13.2 17.8 n/a
2018E 6.0 21.1 15.1 7.0 14.4 n/a 12.4 6.4 7.7 12.0 14.2 n/a
ROE (%) 2016 18.8 45.4 4.4 n/a n/a n/a n/a 16.6 11.0 7.7 19.3 (46.5)
2017E 16.3 43.7 6.6 23.9 10.2 10.5 8.4 17.4 13.1 2.9 20.9 n/a
2018E 14.1 38.5 7.8 21.5 12.0 n/a 9.8 17.4 15.0 5.0 22.2 n/a
Return (%) 1-month 7.0 1.8 3.1 2.2 0.4 12.8 0.0 (1.5) 2.2 (8.5) 3.4 0.9
3-months 29.9 21.3 9.9 15.0 1.9 10.5 4.9 15.2 18.4 (8.9) 31.8 4.5
6-months 61.1 51.2 35.1 1.3 7.7 1.6 4.9 7.6 17.9 17.4 75.4 24.7
12-months 37.4 13.6 (5.0) 0.0 (38.9) (26.4) (32.9) (9.3) 13.9 (5.4) 92.4 10.7
Ytd 40.7 42.1 35.5 (13.5) (13.2) 0.6 (3.6) 11.3 15.7 6.2 60.8 6.0
Note: Based on May 26 closing prices and forex rates; Hugel/Medytox based on our forecasts, other Korean firms on QuantiWise, overseas firms on Bloomberg
Source: QuantiWise, Bloomberg, Samsung Securities

Hugel
2017. 6. 15
139
Income statement
Year-end Dec 31(KRWb) 2015 2016 2017E 2018E 2019E
Sales 65 124 190 248 305
Cost of goods sold 27 30 41 52 63
Gross profit 39 94 149 196 242
Gross margin (%) 59.2 76.0 78.6 79.0 79.5
SG&A expenses 21 31 39 48 59
Operating profit 18 63 110 148 183
Operating margin (%) 27.3 50.9 57.8 59.8 60.0
Non-operating gains (losses) 22 1 (1) 0 (0)
Financial profit 1 2 1 1 1
Financial costs 0 1 1 0 0
Equity-method gains (losses) 2 (1) (1) (1) (1)
Other 19 1 (0) (0) (0)
Pre-tax profit 39 64 109 149 183
Taxes 3 13 22 30 37
Effective tax rate (%) 8.8 20.9 20.0 20.0 20.0
Profit from continuing operations 36 51 87 119 146
Profit from discontinued operations 0 0 0 0 0
Net profit 36 51 87 119 146
Net margin (%) 55.1 41.0 45.9 47.9 48.0
Net profit (controlling interests) 34 43 76 104 128
Net profit (non-controlling interests) 2 8 11 15 18
EBITDA 19 68 115 153 189
EBITDA margin (%) 29.7 54.8 60.4 61.8 61.8
EPS (parent-based) (KRW) 12,620 13,177 18,931 22,917 28,234
EPS (consolidated) (KRW) 13,337 15,499 21,609 26,160 32,229
Adjusted EPS (KRW)* 12,620 13,177 18,931 22,917 28,234
Cash flow statement
Year-end Dec 31(KRWb) 2015 2016 2017E 2018E 2019E
Cash flow from operations 20 45 79 112 140
Net profit 36 51 87 119 146
Non-cash profit and expenses (15) 20 27 34 42
Depreciation 1 4 4 4 5
Amortization 1 1 1 1 1
Other (17) 16 22 29 37
Changes in A/L from operating activities 2 (24) (14) (12) (12)
Cash flow from investments (17) (54) (14) (14) (17)
Change in tangible assets (12) (15) (7) (7) (10)
Change in financial assets 4 (38) (7) (7) (7)
Other (9) (0) (0) 0 0
Cash flow from financing 50 3 455 0 0
Change in debt (45) (1) 100 0 0
Change in equity 131 4 355 0 0
Dividends 0 0 0 0 0
Other (35) 0 0 0 0
Change in cash 53 (6) 516 95 120
Cash at beginning of year 17 70 65 581 676
Cash at end of year 70 65 581 676 796
Gross cash flow 20 71 114 153 189
Free cash flow 7 30 72 105 130
Note: * Excluding one off items ** Fully diluted, excluding one-off items *** From companies subject to equity-method valuation
Source: Company data, Samsung Securities estimates
Balance sheet
Year-end Dec 31(KRWb) 2015 2016 2017E 2018E 2019E
Current assets 107 151 685 801 943
Cash & equivalents 70 65 581 676 796
Accounts receivable 21 31 42 55 68
Inventories 8 14 18 24 29
Other current assets 8 42 44 47 50
Fixed assets 126 143 154 164 176
Investment assets 12 17 25 33 41
Tangible assets 49 59 62 65 70
Intangible assets 64 64 63 62 62
Other long-term assets 1 4 4 4 4
Total assets 234 294 839 965 1,119
Current liabilities 18 20 23 30 37
Accounts payable 4 3 4 5 6
Short-term debt 1 0 0 0 0
Other current liabilities 13 16 19 25 30
Long-term liabilities 1 0 101 101 101
Bonds & long-term debt 0 0 100 100 100
Other long-term liabilities 1 0 1 1 1
Total liabilities 18 20 124 131 138
Owners of parent equity 208 253 684 788 916
Capital stock 2 2 2 2 2
Capital surplus 141 145 499 499 499
Retained earnings 63 106 183 287 415
Other 2 (0) (0) (0) (0)
Non-controlling interests’ equity 7 21 32 47 65
Total equity 215 274 716 834 981
Net debt (76) (104) (521) (618) (739)
Financial ratios
Year-end Dec 31 2015 2016 2017E 2018E 2019E
Growth (%)
Sales 61.3 90.9 52.7 30.7 23.1
Operating profit 14.7 256.2 73.4 35.1 23.6
Net profit 172.7 42.0 71.0 36.6 23.2
Adjusted EPS** 138.4 4.4 43.7 21.1 23.2
Per-share data (KRW)
EPS (parent-based) 12,620 13,177 18,931 22,917 28,234
EPS (consolidated) 13,337 15,499 21,609 26,160 32,229
Adjusted EPS** 12,620 13,177 18,931 22,917 28,234
BVPS 63,290 77,438 160,883 185,379 215,558
DPS (common) 0 0 0 0 0
Valuations (x)
P/E*** 35.8 34.3 23.9 19.7 16.0
P/B*** 7.1 5.8 2.8 2.4 2.1
EV/EBITDA 73.3 20.6 8.7 6.0 4.3
Ratios (%)
ROE 27.1 18.8 16.3 14.1 15.1
ROA 21.7 19.3 15.4 13.2 14.1
ROIC 18.5 35.9 55.1 67.8 76.7
Payout ratio 0.0 0.0 0.0 0.0 0.0
Dividend yield (common) 0.0 0.0 0.0 0.0 0.0
Net debt to equity (35.5) (37.9) (72.8) (74.0) (75.4)
Interest coverage (x) 520.8 n/a n/a n/a n/a

2017. 6. 15
Dentium (145720)
Discount unwarranted
● Our forecasts show Dentium’s full-year sales and operating profit up a respective
23.7% and 27.2%, with it retaining significant growth potential.
● Shares in the firm trade at 16.1x 2017 P/E, which is a 37.4% discount to the 25.7x
average of Korean rivals Osstem Implant (26x) and Dio (25.4x), while its solid cash
flow increases the likelihood of treasury share cancelation. Given such positives,
we initiate coverage on the stock at BUY with a 12-month target price of
KRW50,000 and make it our medical device sector top pick.
WHAT’S THE STORY?
No. 2 domestic dental implant player: Dentium is Korea’s number-two dental
implant player with a market share of 15% in 2015, while competitive pricing have helped
it to gain presence elsewhere in Asia. The firm’s export portion of total sales rose by
3.9%pts to 59.3% in 2016, with most bound for China (27.9%), the UAE (10.6%), and
Russia (6.8%).
Attractive product mix: Dentium’s profitability edge over rivals owes to in-house
developed products accounting for over 90% of total sales, while its 1Q gross margin of
73.8% outpaced Dio (72.8%) and Osstem Implant (60.3%). The firm plans to internalize
digital dentistry device production (as it does for implants and bone graft materials), and
recently won domestic approval for cone beam computed tomography devices (CBCTs),
with an advanced 3D intraoral scanner set to debut next year.
China operation: Dentium entered China in 2009, last year becoming that nation’s
number-three player with sales growth of 37.3% to KRW33.5b. The firm established a
local dental subsidiary in 2015, which should commence annual production of 300,000
units from 2H18 and thus help mitigate risk related to protectionist measures undertaken
by that government against foreign firms. Expectations of such localization efforts paying
off still seem valid, with Dentium set to be the only foreign player with local production.
The firm’s China-bound exports were sluggish in 1Q, but they are likely normalizing this
quarter. (Continued on the next page)
*This report originally published on Jun 2
Company Initiation
SUMMARY FINANCIAL DATA
2016 2017E 2018E 2019E
Revenue (KRWb) 120 148 178 206
Net profit (adj) (KRWb) 20 26 32 40
EPS (adj) (KRW) 1,788 2,329 2,899 3,561
EPS (adj) growth (% y-y) 36.7 30.3 24.5 22.9
EBITDA margin (%) 27.1 27.1 27.0 27.9
ROE (%) 33.7 21.1 16.8 17.4
P/E (adj) (x) 20.9 16.1 12.9 10.5
P/B (x) 6.0 1.8 1.6 1.3
EV/EBITDA (x) 14.8 10.9 9.7 7.5
Dividend yield (%) 0.3 0.3 0.3 0.3
Source: Company data, Samsung Securities estimates
Kevin Kim
Analyst
[email protected] 822 2020 7178
AT A GLANCE
Target price KRW50,000 (26.3%)
Current price KRW39,600
Market cap KRW438.33b/USD390.67m
Shares (float) 11,068,830 (54.7%)
52-week high/low KRW41,700/KRW32,800
Avg daily trading value (60-day)
KRW6.7b/ USD6.0m
ONE-YEAR PERFORMANCE
1M 6M 12M
DENTIUM (%) 3.0 n/a n/a
Vs Kospi (%pts) -3.1 n/a n/a
KEY CHANGES
(KRW) New Old Diff
Recommend. BUY Not Rated
Target price 50,000 n/a n/a
2017E EPS 2,329 n/a n/a
2018E EPS 2,899 n/a n/a
SAMSUNG vs THE STREET
No of estimates 3
Target price 45,667
Recommendation 3.7
BUY★★★: 5 / BUY: 4 / HOLD: 3 / SELL: 2 / SELL★★★: 1
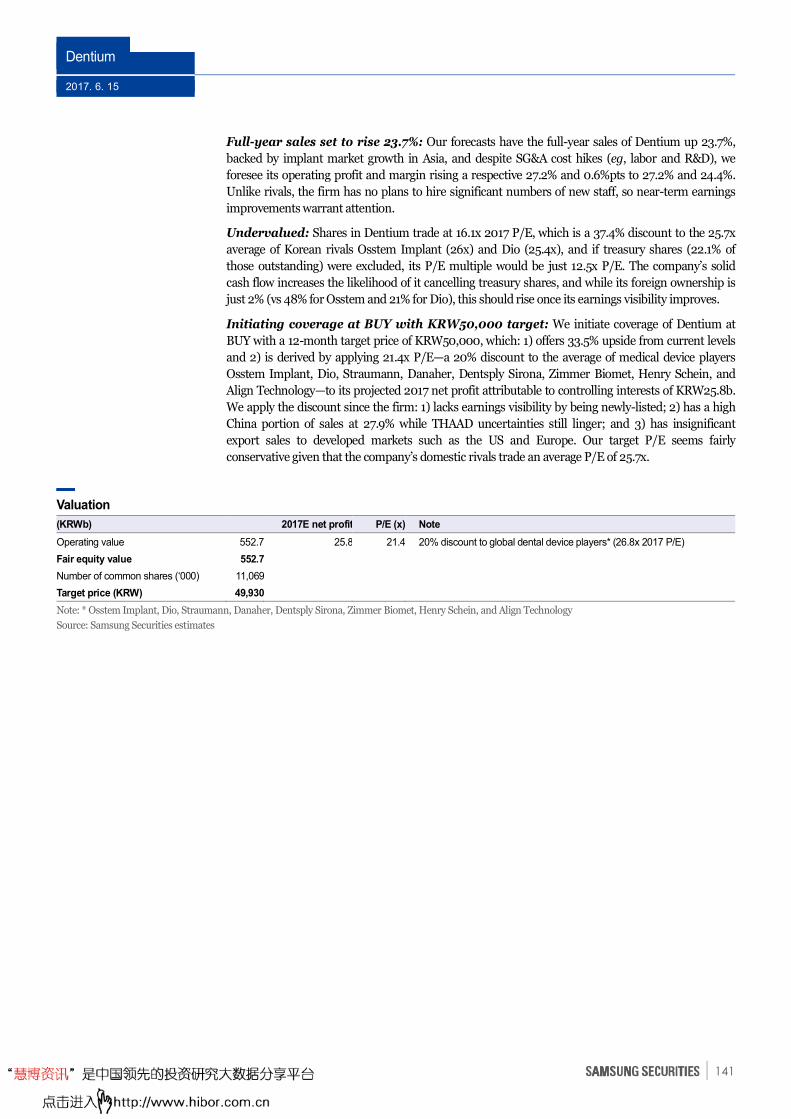
Dentium
2017. 6. 15
141
Full-year sales set to rise 23.7%: Our forecasts have the full-year sales of Dentium up 23.7%,
backed by implant market growth in Asia, and despite SG&A cost hikes (eg, labor and R&D), we
foresee its operating profit and margin rising a respective 27.2% and 0.6%pts to 27.2% and 24.4%.
Unlike rivals, the firm has no plans to hire significant numbers of new staff, so near-term earnings
improvements warrant attention.
Undervalued: Shares in Dentium trade at 16.1x 2017 P/E, which is a 37.4% discount to the 25.7x
average of Korean rivals Osstem Implant (26x) and Dio (25.4x), and if treasury shares (22.1% of
those outstanding) were excluded, its P/E multiple would be just 12.5x P/E. The company’s solid
cash flow increases the likelihood of it cancelling treasury shares, and while its foreign ownership is
just 2% (vs 48% for Osstem and 21% for Dio), this should rise once its earnings visibility improves.
Initiating coverage at BUY with KRW50,000 target: We initiate coverage of Dentium at
BUY with a 12-month target price of KRW50,000, which: 1) offers 33.5% upside from current levels
and 2) is derived by applying 21.4x P/E—a 20% discount to the average of medical device players
Osstem Implant, Dio, Straumann, Danaher, Dentsply Sirona, Zimmer Biomet, Henry Schein, and
Align Technology—to its projected 2017 net profit attributable to controlling interests of KRW25.8b.
We apply the discount since the firm: 1) lacks earnings visibility by being newly-listed; 2) has a high
China portion of sales at 27.9% while THAAD uncertainties still linger; and 3) has insignificant
export sales to developed markets such as the US and Europe. Our target P/E seems fairly
conservative given that the company’s domestic rivals trade an average P/E of 25.7x.
Valuation
(KRWb) 2017E net profit P/E (x) Note
Operating value 552.7 25.8 21.4 20% discount to global dental device players* (26.8x 2017 P/E)
Fair equity value 552.7 Number of common shares (‘000) 11,069 Target price (KRW) 49,930 Note: * Osstem Implant, Dio, Straumann, Danaher, Dentsply Sirona, Zimmer Biomet, Henry Schein, and Align Technology
Source: Samsung Securities estimates
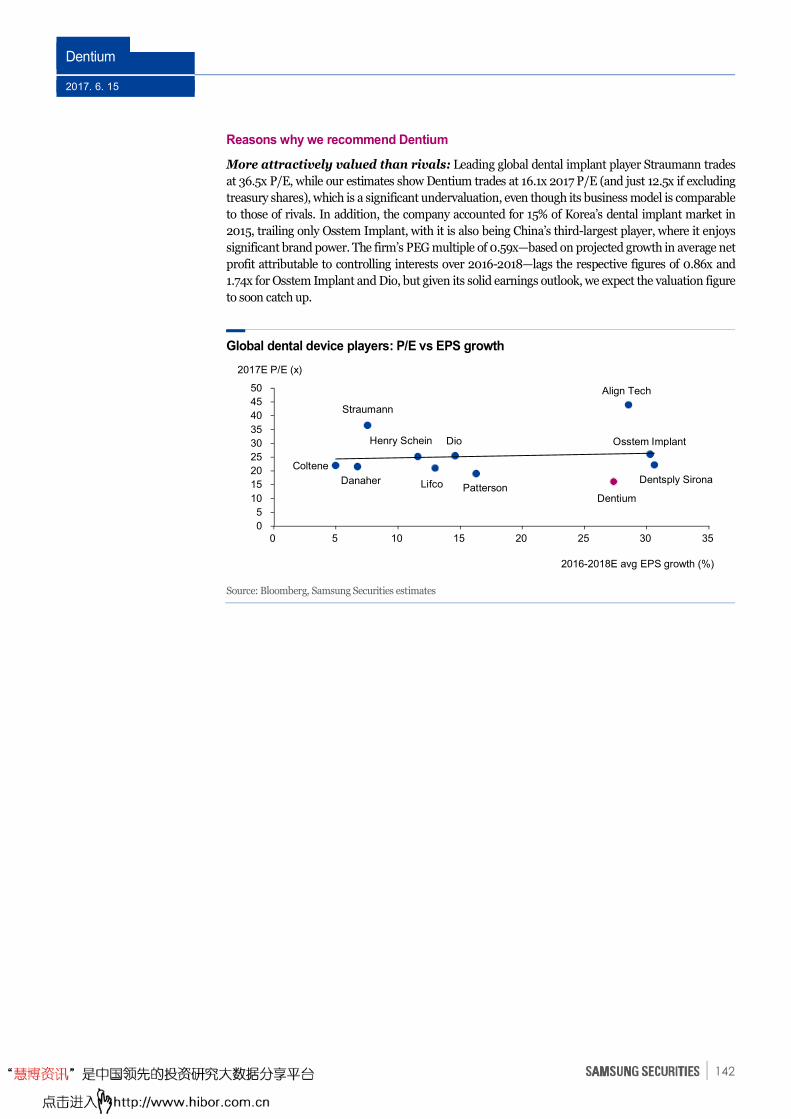
Dentium
2017. 6. 15
142
Reasons why we recommend Dentium
More attractively valued than rivals: Leading global dental implant player Straumann trades
at 36.5x P/E, while our estimates show Dentium trades at 16.1x 2017 P/E (and just 12.5x if excluding
treasury shares), which is a significant undervaluation, even though its business model is comparable
to those of rivals. In addition, the company accounted for 15% of Korea’s dental implant market in
2015, trailing only Osstem Implant, with it is also being China’s third-largest player, where it enjoys
significant brand power. The firm’s PEG multiple of 0.59x—based on projected growth in average net
profit attributable to controlling interests over 2016-2018—lags the respective figures of 0.86x and
1.74x for Osstem Implant and Dio, but given its solid earnings outlook, we expect the valuation figure
to soon catch up.
Global dental device players: P/E vs EPS growth
Source: Bloomberg, Samsung Securities estimates
0
5
10
15
20
25
30
35
40
45
50
0 5 10 15 20 25 30 35
2017E P/E (x)
2016-2018E avg EPS growth (%)
Patterson
Henry Schein
Straumann
Danaher Lifco
Align Tech
Dentium
Coltene
Osstem Implant
Dentsply Sirona
Dio
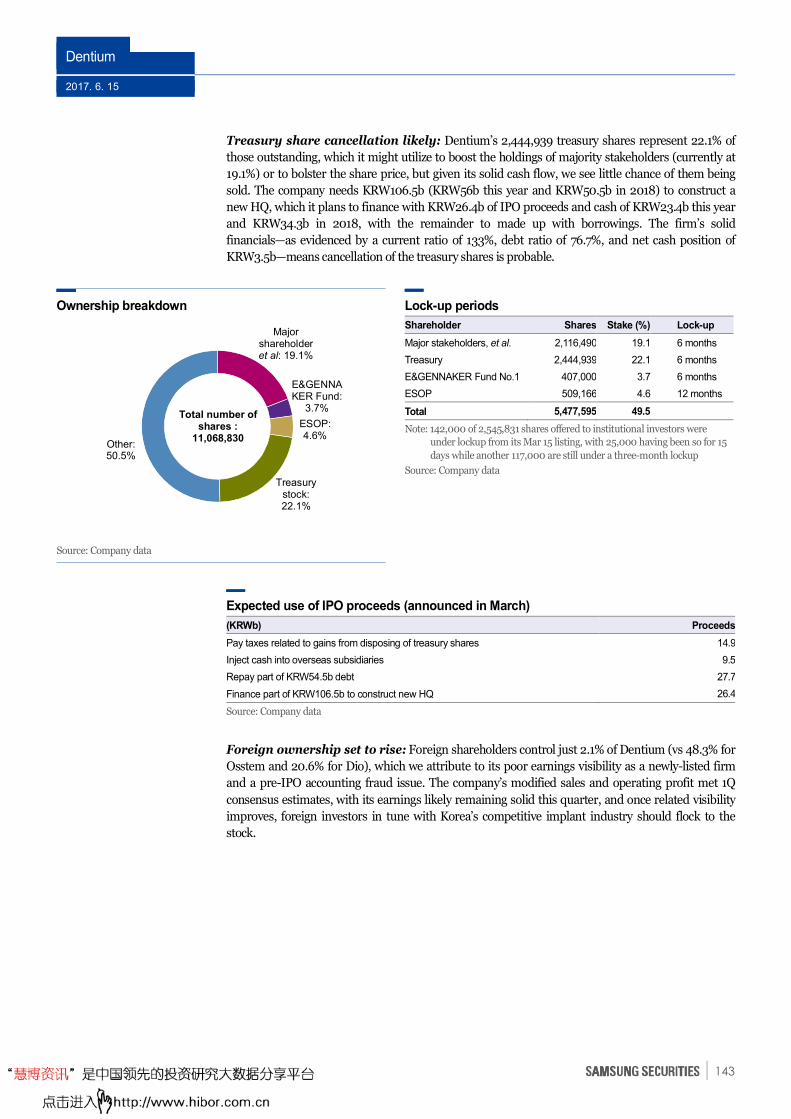
Dentium
2017. 6. 15
143
Treasury share cancellation likely: Dentium’s 2,444,939 treasury shares represent 22.1% of
those outstanding, which it might utilize to boost the holdings of majority stakeholders (currently at
19.1%) or to bolster the share price, but given its solid cash flow, we see little chance of them being
sold. The company needs KRW106.5b (KRW56b this year and KRW50.5b in 2018) to construct a
new HQ, which it plans to finance with KRW26.4b of IPO proceeds and cash of KRW23.4b this year
and KRW34.3b in 2018, with the remainder to made up with borrowings. The firm’s solid
financials—as evidenced by a current ratio of 133%, debt ratio of 76.7%, and net cash position of
KRW3.5b—means cancellation of the treasury shares is probable.
Ownership breakdown Lock-up periods
Shareholder Shares Stake (%) Lock-up
Major stakeholders, et al. 2,116,490 19.1 6 months
Treasury 2,444,939 22.1 6 months
E&GENNAKER Fund No.1 407,000 3.7 6 months
ESOP 509,166 4.6 12 months
Total 5,477,595 49.5
Note: 142,000 of 2,545,831 shares offered to institutional investors were
under lockup from its Mar 15 listing, with 25,000 having been so for 15
days while another 117,000 are still under a three-month lockup
Source: Company data
Source: Company data
Expected use of IPO proceeds (announced in March)
(KRWb) Proceeds
Pay taxes related to gains from disposing of treasury shares 14.9
Inject cash into overseas subsidiaries 9.5
Repay part of KRW54.5b debt 27.7
Finance part of KRW106.5b to construct new HQ 26.4
Source: Company data
Foreign ownership set to rise: Foreign shareholders control just 2.1% of Dentium (vs 48.3% for
Osstem and 20.6% for Dio), which we attribute to its poor earnings visibility as a newly-listed firm
and a pre-IPO accounting fraud issue. The company’s modified sales and operating profit met 1Q
consensus estimates, with its earnings likely remaining solid this quarter, and once related visibility
improves, foreign investors in tune with Korea’s competitive implant industry should flock to the
stock.
Major shareholder et al: 19.1%
E&GENNAKER Fund:
3.7%
ESOP: 4.6%
Treasury stock: 22.1%
Other: 50.5%
Total number of shares :
11,068,830
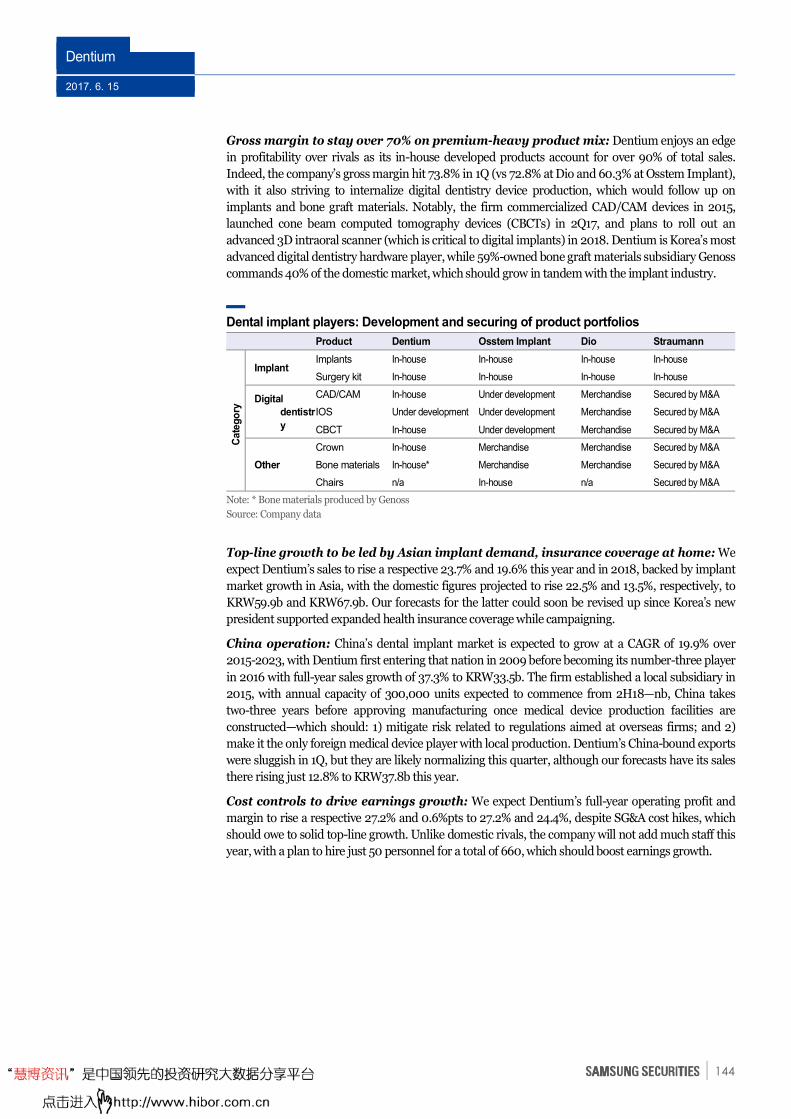
Dentium
2017. 6. 15
144
Gross margin to stay over 70% on premium-heavy product mix: Dentium enjoys an edge
in profitability over rivals as its in-house developed products account for over 90% of total sales.
Indeed, the company’s gross margin hit 73.8% in 1Q (vs 72.8% at Dio and 60.3% at Osstem Implant),
with it also striving to internalize digital dentistry device production, which would follow up on
implants and bone graft materials. Notably, the firm commercialized CAD/CAM devices in 2015,
launched cone beam computed tomography devices (CBCTs) in 2Q17, and plans to roll out an
advanced 3D intraoral scanner (which is critical to digital implants) in 2018. Dentium is Korea’s most
advanced digital dentistry hardware player, while 59%-owned bone graft materials subsidiary Genoss
commands 40% of the domestic market, which should grow in tandem with the implant industry.
Dental implant players: Development and securing of product portfolios
Product Dentium Osstem Implant Dio Straumann
Cate
go
ry
Implant Implants In-house In-house In-house In-house
Surgery kit In-house In-house In-house In-house
Digital
dentistr
y
CAD/CAM In-house Under development Merchandise Secured by M&A
IOS Under development Under development Merchandise Secured by M&A
CBCT In-house Under development Merchandise Secured by M&A
Other
Crown In-house Merchandise Merchandise Secured by M&A
Bone materials In-house* Merchandise Merchandise Secured by M&A
Chairs n/a In-house n/a Secured by M&A
Note: * Bone materials produced by Genoss
Source: Company data
Top-line growth to be led by Asian implant demand, insurance coverage at home: We
expect Dentium’s sales to rise a respective 23.7% and 19.6% this year and in 2018, backed by implant
market growth in Asia, with the domestic figures projected to rise 22.5% and 13.5%, respectively, to
KRW59.9b and KRW67.9b. Our forecasts for the latter could soon be revised up since Korea’s new
president supported expanded health insurance coverage while campaigning.
China operation: China’s dental implant market is expected to grow at a CAGR of 19.9% over
2015-2023, with Dentium first entering that nation in 2009 before becoming its number-three player
in 2016 with full-year sales growth of 37.3% to KRW33.5b. The firm established a local subsidiary in
2015, with annual capacity of 300,000 units expected to commence from 2H18—nb, China takes
two-three years before approving manufacturing once medical device production facilities are
constructed—which should: 1) mitigate risk related to regulations aimed at overseas firms; and 2)
make it the only foreign medical device player with local production. Dentium’s China-bound exports
were sluggish in 1Q, but they are likely normalizing this quarter, although our forecasts have its sales
there rising just 12.8% to KRW37.8b this year.
Cost controls to drive earnings growth: We expect Dentium’s full-year operating profit and
margin to rise a respective 27.2% and 0.6%pts to 27.2% and 24.4%, despite SG&A cost hikes, which
should owe to solid top-line growth. Unlike domestic rivals, the company will not add much staff this
year, with a plan to hire just 50 personnel for a total of 660, which should boost earnings growth.
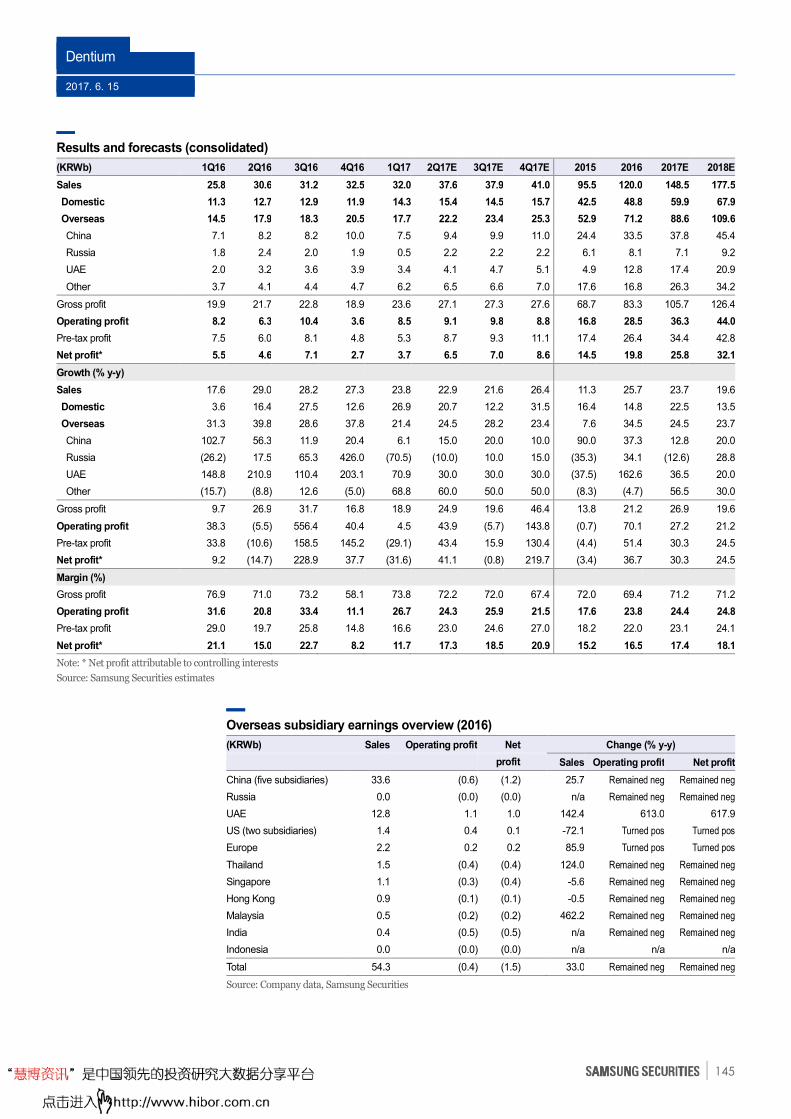
Dentium
2017. 6. 15
145
Results and forecasts (consolidated)
(KRWb) 1Q16 2Q16 3Q16 4Q16 1Q17 2Q17E 3Q17E 4Q17E 2015 2016 2017E 2018E
Sales 25.8 30.6 31.2 32.5 32.0 37.6 37.9 41.0 95.5 120.0 148.5 177.5
Domestic 11.3 12.7 12.9 11.9 14.3 15.4 14.5 15.7 42.5 48.8 59.9 67.9
Overseas 14.5 17.9 18.3 20.5 17.7 22.2 23.4 25.3 52.9 71.2 88.6 109.6
China 7.1 8.2 8.2 10.0 7.5 9.4 9.9 11.0 24.4 33.5 37.8 45.4
Russia 1.8 2.4 2.0 1.9 0.5 2.2 2.2 2.2 6.1 8.1 7.1 9.2
UAE 2.0 3.2 3.6 3.9 3.4 4.1 4.7 5.1 4.9 12.8 17.4 20.9
Other 3.7 4.1 4.4 4.7 6.2 6.5 6.6 7.0 17.6 16.8 26.3 34.2
Gross profit 19.9 21.7 22.8 18.9 23.6 27.1 27.3 27.6 68.7 83.3 105.7 126.4
Operating profit 8.2 6.3 10.4 3.6 8.5 9.1 9.8 8.8 16.8 28.5 36.3 44.0
Pre-tax profit 7.5 6.0 8.1 4.8 5.3 8.7 9.3 11.1 17.4 26.4 34.4 42.8
Net profit* 5.5 4.6 7.1 2.7 3.7 6.5 7.0 8.6 14.5 19.8 25.8 32.1
Growth (% y-y)
Sales 17.6 29.0 28.2 27.3 23.8 22.9 21.6 26.4 11.3 25.7 23.7 19.6
Domestic 3.6 16.4 27.5 12.6 26.9 20.7 12.2 31.5 16.4 14.8 22.5 13.5
Overseas 31.3 39.8 28.6 37.8 21.4 24.5 28.2 23.4 7.6 34.5 24.5 23.7
China 102.7 56.3 11.9 20.4 6.1 15.0 20.0 10.0 90.0 37.3 12.8 20.0
Russia (26.2) 17.5 65.3 426.0 (70.5) (10.0) 10.0 15.0 (35.3) 34.1 (12.6) 28.8
UAE 148.8 210.9 110.4 203.1 70.9 30.0 30.0 30.0 (37.5) 162.6 36.5 20.0
Other (15.7) (8.8) 12.6 (5.0) 68.8 60.0 50.0 50.0 (8.3) (4.7) 56.5 30.0
Gross profit 9.7 26.9 31.7 16.8 18.9 24.9 19.6 46.4 13.8 21.2 26.9 19.6
Operating profit 38.3 (5.5) 556.4 40.4 4.5 43.9 (5.7) 143.8 (0.7) 70.1 27.2 21.2
Pre-tax profit 33.8 (10.6) 158.5 145.2 (29.1) 43.4 15.9 130.4 (4.4) 51.4 30.3 24.5
Net profit* 9.2 (14.7) 228.9 37.7 (31.6) 41.1 (0.8) 219.7 (3.4) 36.7 30.3 24.5
Margin (%)
Gross profit 76.9 71.0 73.2 58.1 73.8 72.2 72.0 67.4 72.0 69.4 71.2 71.2
Operating profit 31.6 20.8 33.4 11.1 26.7 24.3 25.9 21.5 17.6 23.8 24.4 24.8
Pre-tax profit 29.0 19.7 25.8 14.8 16.6 23.0 24.6 27.0 18.2 22.0 23.1 24.1
Net profit* 21.1 15.0 22.7 8.2 11.7 17.3 18.5 20.9 15.2 16.5 17.4 18.1
Note: * Net profit attributable to controlling interests
Source: Samsung Securities estimates
Overseas subsidiary earnings overview (2016)
(KRWb) Sales Operating profit Net Change (% y-y)
profit Sales Operating profit Net profit
China (five subsidiaries) 33.6 (0.6) (1.2) 25.7 Remained neg Remained neg
Russia 0.0 (0.0) (0.0) n/a Remained neg Remained neg
UAE 12.8 1.1 1.0 142.4 613.0 617.9
US (two subsidiaries) 1.4 0.4 0.1 -72.1 Turned pos Turned pos
Europe 2.2 0.2 0.2 85.9 Turned pos Turned pos
Thailand 1.5 (0.4) (0.4) 124.0 Remained neg Remained neg
Singapore 1.1 (0.3) (0.4) -5.6 Remained neg Remained neg
Hong Kong 0.9 (0.1) (0.1) -0.5 Remained neg Remained neg
Malaysia 0.5 (0.2) (0.2) 462.2 Remained neg Remained neg
India 0.4 (0.5) (0.5) n/a Remained neg Remained neg
Indonesia 0.0 (0.0) (0.0) n/a n/a n/a
Total 54.3 (0.4) (1.5) 33.0 Remained neg Remained neg
Source: Company data, Samsung Securities
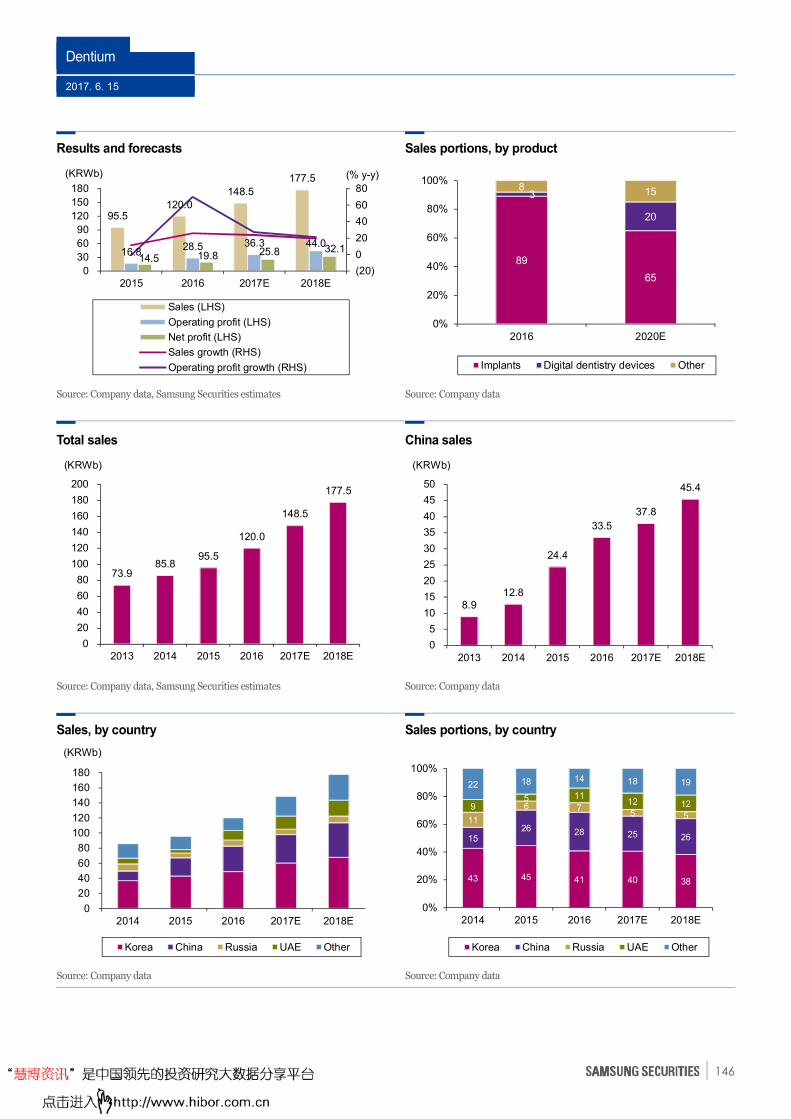
Dentium
2017. 6. 15
146
Results and forecasts Sales portions, by product
Source: Company data, Samsung Securities estimates
Source: Company data
Total sales China sales
Source: Company data, Samsung Securities estimates
Source: Company data
Sales, by country Sales portions, by country
Source: Company data Source: Company data
89
65
3
20
8 15
0%
20%
40%
60%
80%
100%
2016 2020E
Implants Digital dentistry devices Other
95.5 120.0
148.5
177.5
16.8 28.5 36.3 44.0
14.5 19.8 25.8 32.1
(20)
0
20
40
60
80
0
30
60
90
120
150
180
2015 2016 2017E 2018E
(% y-y)(KRWb)
Sales (LHS)
Operating profit (LHS)
Net profit (LHS)
Sales growth (RHS)
Operating profit growth (RHS)
73.9 85.8
95.5
120.0
148.5
177.5
0
20
40
60
80
100
120
140
160
180
200
2013 2014 2015 2016 2017E 2018E
(KRWb)
8.9 12.8
24.4
33.5
37.8
45.4
0
5
10
15
20
25
30
35
40
45
50
2013 2014 2015 2016 2017E 2018E
(KRWb)
43 45 41 40 38
15 26 28 25 26
11
6 7 5 5
9 5 11
12 12
22 18 14 18 19
0%
20%
40%
60%
80%
100%
2014 2015 2016 2017E 2018E
Korea China Russia UAE Other
0
20
40
60
80
100
120
140
160
180
2014 2015 2016 2017E 2018E
(KRWb)
Korea China Russia UAE Other
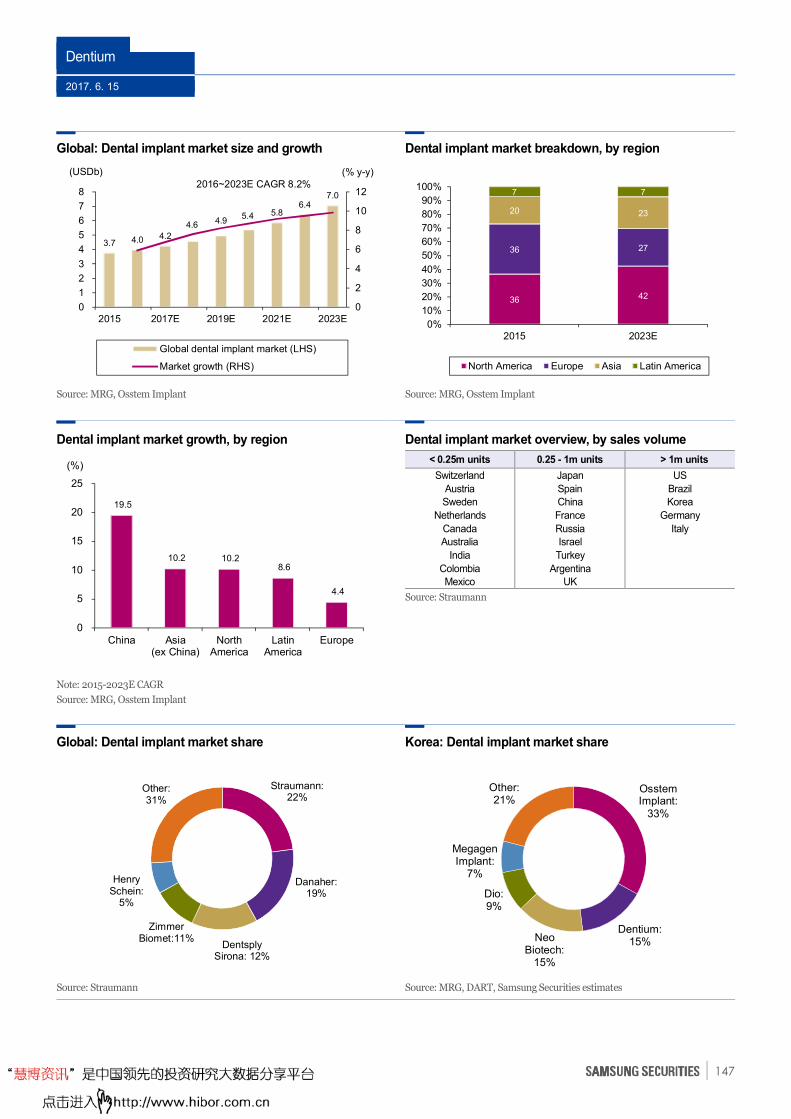
Dentium
2017. 6. 15
147
Global: Dental implant market size and growth Dental implant market breakdown, by region
Source: MRG, Osstem Implant
Source: MRG, Osstem Implant
Dental implant market growth, by region Dental implant market overview, by sales volume
< 0.25m units 0.25 - 1m units > 1m units
Switzerland
Austria
Sweden
Netherlands
Canada
Australia
India
Colombia
Mexico
Japan
Spain
China
France
Russia
Israel
Turkey
Argentina
UK
US
Brazil
Korea
Germany
Italy
Source: Straumann
Note: 2015-2023E CAGR
Source: MRG, Osstem Implant
Global: Dental implant market share Korea: Dental implant market share
Source: Straumann Source: MRG, DART, Samsung Securities estimates
19.5
10.2 10.2 8.6
4.4
0
5
10
15
20
25
China Asia(ex China)
NorthAmerica
LatinAmerica
Europe
(%)
3.7 4.0 4.2
4.6 4.9 5.4 5.8
6.4 7.0
0
2
4
6
8
10
12
0
1
2
3
4
5
6
7
8
2015 2017E 2019E 2021E 2023E
(% y-y)(USDb)
Global dental implant market (LHS)
Market growth (RHS)
2016~2023E CAGR 8.2%
36 42
36 27
20 23
7 7
0%
10%
20%
30%
40%
50%
60%
70%
80%
90%
100%
2015 2023E
North America Europe Asia Latin America
Straumann: 22%
Danaher: 19%
Dentsply Sirona: 12%
Zimmer Biomet:11%
Henry Schein:
5%
Other:31%
Osstem Implant:
33%
Dentium:15%Neo
Biotech:15%
Dio:9%
Megagen Implant:
7%
Other:21%
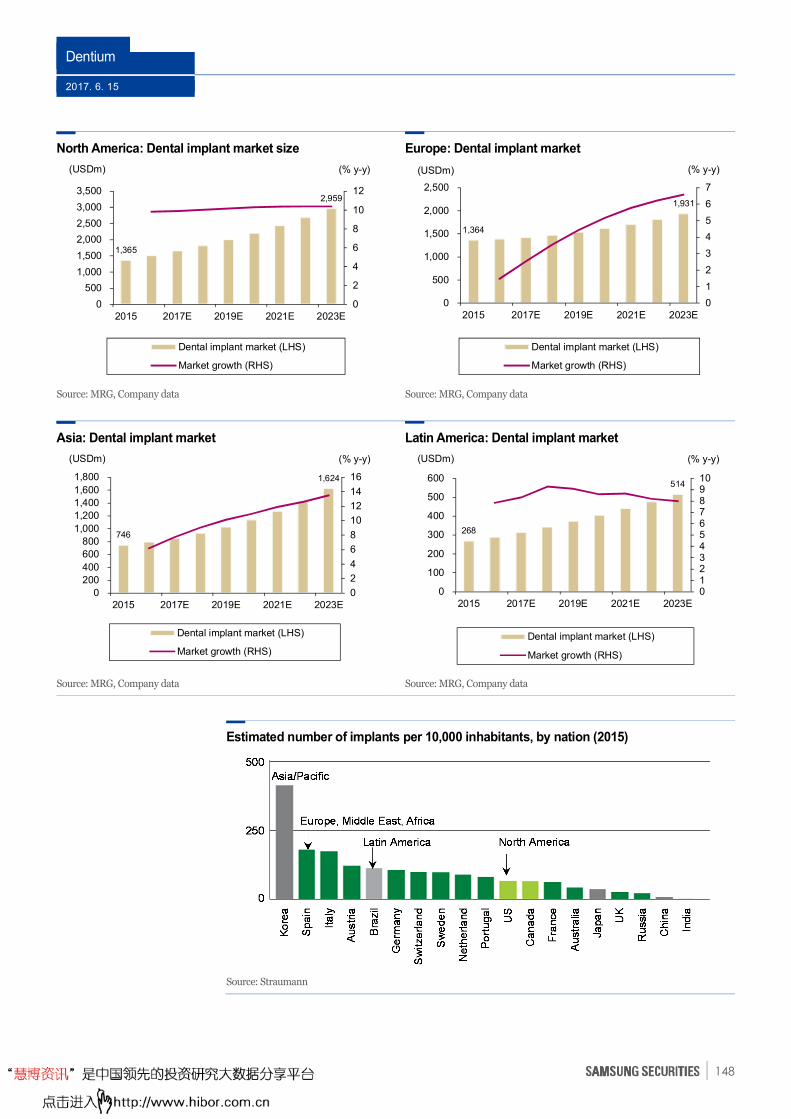
Dentium
2017. 6. 15
148
North America: Dental implant market size Europe: Dental implant market
Source: MRG, Company data
Source: MRG, Company data
Asia: Dental implant market Latin America: Dental implant market
Source: MRG, Company data Source: MRG, Company data
Estimated number of implants per 10,000 inhabitants, by nation (2015)
Source: Straumann
1,365
2,959
0
2
4
6
8
10
12
0
500
1,000
1,500
2,000
2,500
3,000
3,500
2015 2017E 2019E 2021E 2023E
(% y-y)(USDm)
Dental implant market (LHS)
Market growth (RHS)
1,364
1,931
0
1
2
3
4
5
6
7
0
500
1,000
1,500
2,000
2,500
2015 2017E 2019E 2021E 2023E
(% y-y)(USDm)
Dental implant market (LHS)
Market growth (RHS)
746
1,624
0
2
4
6
8
10
12
14
16
0
200
400
600
800
1,000
1,200
1,400
1,600
1,800
2015 2017E 2019E 2021E 2023E
(% y-y)(USDm)
Dental implant market (LHS)
Market growth (RHS)
268
514
012345678910
0
100
200
300
400
500
600
2015 2017E 2019E 2021E 2023E
(% y-y)(USDm)
Dental implant market (LHS)
Market growth (RHS)
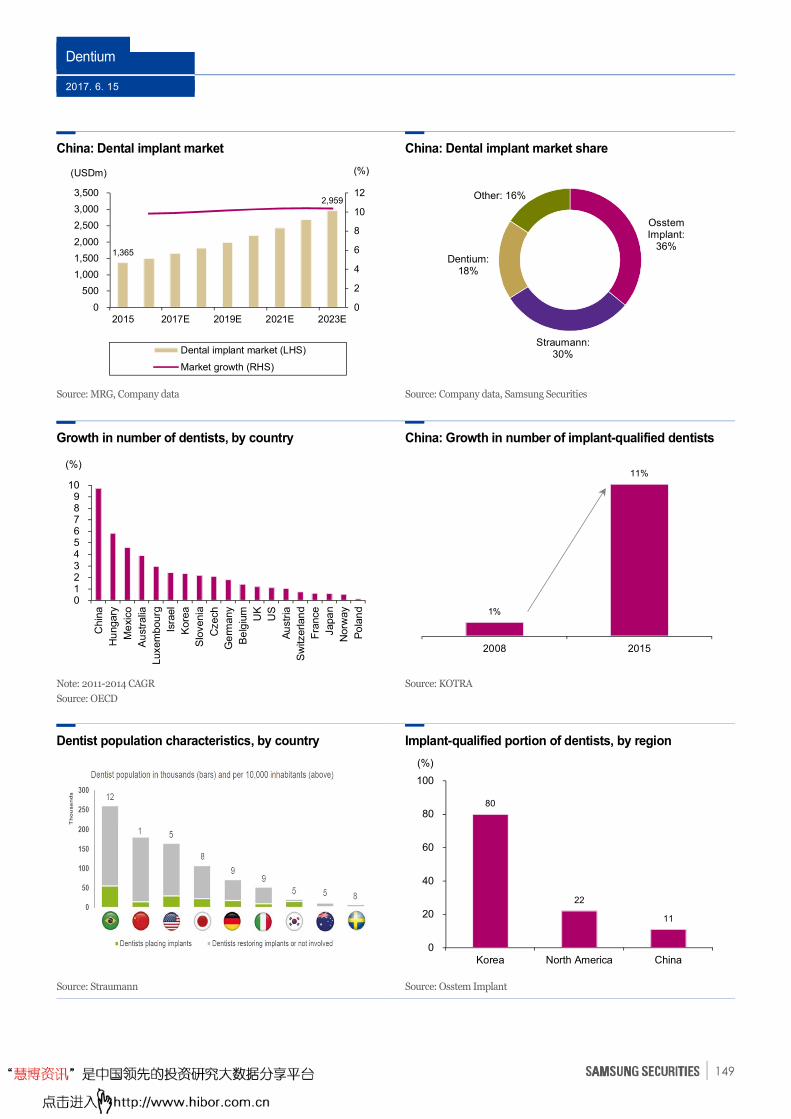
Dentium
2017. 6. 15
149
China: Dental implant market China: Dental implant market share
Source: MRG, Company data
Source: Company data, Samsung Securities
Growth in number of dentists, by country China: Growth in number of implant-qualified dentists
Note: 2011-2014 CAGR
Source: OECD
Source: KOTRA
Dentist population characteristics, by country Implant-qualified portion of dentists, by region
Source: Straumann Source: Osstem Implant
Osstem Implant:
36%
Straumann: 30%
Dentium: 18%
Other: 16%
1,365
2,959
0
2
4
6
8
10
12
0
500
1,000
1,500
2,000
2,500
3,000
3,500
2015 2017E 2019E 2021E 2023E
(%)(USDm)
Dental implant market (LHS)
Market growth (RHS)
0123456789
10
Chin
a
Hu
ngary
Me
xico
Au
stra
lia
Luxem
bourg
Isra
el
Kore
a
Slo
venia
Czech
Ge
rmany
Be
lgiu
m
UK
US
Au
stria
Sw
itzerlan
d
Fra
nce
Japa
n
Norw
ay
Po
lan
d
(%)
1%
11%
2008 2015
80
22
11
0
20
40
60
80
100
Korea North America China
(%)
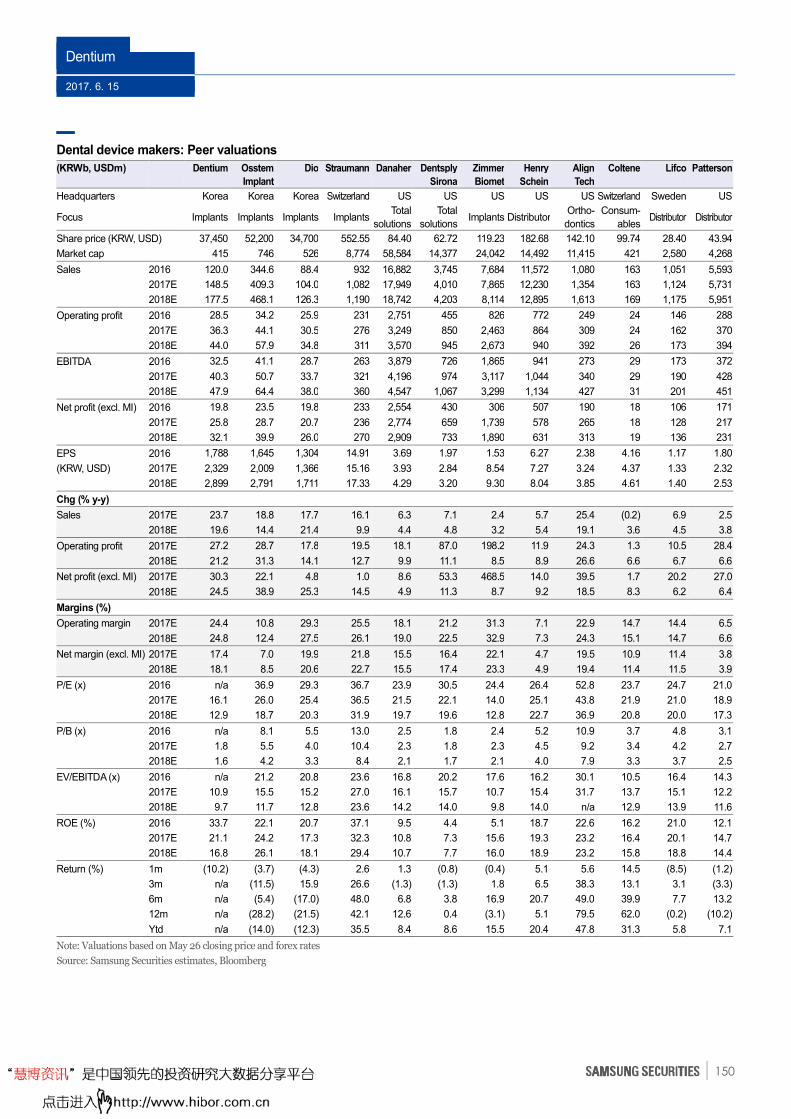
Dentium
2017. 6. 15
150
Dental device makers: Peer valuations
(KRWb, USDm)
Dentium Osstem
Implant
Dio Straumann Danaher Dentsply
Sirona
Zimmer
Biomet
Henry
Schein
Align
Tech
Coltene Lifco Patterson
Headquarters Korea Korea Korea Switzerland US US US US US Switzerland Sweden US
Focus Implants Implants Implants Implants Total
solutions
Total
solutions Implants Distributor
Ortho-
dontics
Consum-
ables Distributor Distributor
Share price (KRW, USD) 37,450 52,200 34,700 552.55 84.40 62.72 119.23 182.68 142.10 99.74 28.40 43.94
Market cap 415 746 526 8,774 58,584 14,377 24,042 14,492 11,415 421 2,580 4,268
Sales 2016 120.0 344.6 88.4 932 16,882 3,745 7,684 11,572 1,080 163 1,051 5,593
2017E 148.5 409.3 104.0 1,082 17,949 4,010 7,865 12,230 1,354 163 1,124 5,731
2018E 177.5 468.1 126.3 1,190 18,742 4,203 8,114 12,895 1,613 169 1,175 5,951
Operating profit 2016 28.5 34.2 25.9 231 2,751 455 826 772 249 24 146 288
2017E 36.3 44.1 30.5 276 3,249 850 2,463 864 309 24 162 370
2018E 44.0 57.9 34.8 311 3,570 945 2,673 940 392 26 173 394
EBITDA 2016 32.5 41.1 28.7 263 3,879 726 1,865 941 273 29 173 372
2017E 40.3 50.7 33.7 321 4,196 974 3,117 1,044 340 29 190 428
2018E 47.9 64.4 38.0 360 4,547 1,067 3,299 1,134 427 31 201 451
Net profit (excl. MI) 2016 19.8 23.5 19.8 233 2,554 430 306 507 190 18 106 171
2017E 25.8 28.7 20.7 236 2,774 659 1,739 578 265 18 128 217
2018E 32.1 39.9 26.0 270 2,909 733 1,890 631 313 19 136 231
EPS 2016 1,788 1,645 1,304 14.91 3.69 1.97 1.53 6.27 2.38 4.16 1.17 1.80
(KRW, USD) 2017E 2,329 2,009 1,366 15.16 3.93 2.84 8.54 7.27 3.24 4.37 1.33 2.32
2018E 2,899 2,791 1,711 17.33 4.29 3.20 9.30 8.04 3.85 4.61 1.40 2.53
Chg (% y-y)
Sales 2017E 23.7 18.8 17.7 16.1 6.3 7.1 2.4 5.7 25.4 (0.2) 6.9 2.5
2018E 19.6 14.4 21.4 9.9 4.4 4.8 3.2 5.4 19.1 3.6 4.5 3.8
Operating profit 2017E 27.2 28.7 17.8 19.5 18.1 87.0 198.2 11.9 24.3 1.3 10.5 28.4
2018E 21.2 31.3 14.1 12.7 9.9 11.1 8.5 8.9 26.6 6.6 6.7 6.6
Net profit (excl. MI) 2017E 30.3 22.1 4.8 1.0 8.6 53.3 468.5 14.0 39.5 1.7 20.2 27.0
2018E 24.5 38.9 25.3 14.5 4.9 11.3 8.7 9.2 18.5 8.3 6.2 6.4
Margins (%)
Operating margin 2017E 24.4 10.8 29.3 25.5 18.1 21.2 31.3 7.1 22.9 14.7 14.4 6.5
2018E 24.8 12.4 27.5 26.1 19.0 22.5 32.9 7.3 24.3 15.1 14.7 6.6
Net margin (excl. MI) 2017E 17.4 7.0 19.9 21.8 15.5 16.4 22.1 4.7 19.5 10.9 11.4 3.8
2018E 18.1 8.5 20.6 22.7 15.5 17.4 23.3 4.9 19.4 11.4 11.5 3.9
P/E (x) 2016 n/a 36.9 29.3 36.7 23.9 30.5 24.4 26.4 52.8 23.7 24.7 21.0
2017E 16.1 26.0 25.4 36.5 21.5 22.1 14.0 25.1 43.8 21.9 21.0 18.9
2018E 12.9 18.7 20.3 31.9 19.7 19.6 12.8 22.7 36.9 20.8 20.0 17.3
P/B (x) 2016 n/a 8.1 5.5 13.0 2.5 1.8 2.4 5.2 10.9 3.7 4.8 3.1
2017E 1.8 5.5 4.0 10.4 2.3 1.8 2.3 4.5 9.2 3.4 4.2 2.7
2018E 1.6 4.2 3.3 8.4 2.1 1.7 2.1 4.0 7.9 3.3 3.7 2.5
EV/EBITDA (x) 2016 n/a 21.2 20.8 23.6 16.8 20.2 17.6 16.2 30.1 10.5 16.4 14.3
2017E 10.9 15.5 15.2 27.0 16.1 15.7 10.7 15.4 31.7 13.7 15.1 12.2
2018E 9.7 11.7 12.8 23.6 14.2 14.0 9.8 14.0 n/a 12.9 13.9 11.6
ROE (%) 2016 33.7 22.1 20.7 37.1 9.5 4.4 5.1 18.7 22.6 16.2 21.0 12.1
2017E 21.1 24.2 17.3 32.3 10.8 7.3 15.6 19.3 23.2 16.4 20.1 14.7
2018E 16.8 26.1 18.1 29.4 10.7 7.7 16.0 18.9 23.2 15.8 18.8 14.4
Return (%) 1m (10.2) (3.7) (4.3) 2.6 1.3 (0.8) (0.4) 5.1 5.6 14.5 (8.5) (1.2)
3m n/a (11.5) 15.9 26.6 (1.3) (1.3) 1.8 6.5 38.3 13.1 3.1 (3.3)
6m n/a (5.4) (17.0) 48.0 6.8 3.8 16.9 20.7 49.0 39.9 7.7 13.2
12m n/a (28.2) (21.5) 42.1 12.6 0.4 (3.1) 5.1 79.5 62.0 (0.2) (10.2)
Ytd n/a (14.0) (12.3) 35.5 8.4 8.6 15.5 20.4 47.8 31.3 5.8 7.1
Note: Valuations based on May 26 closing price and forex rates
Source: Samsung Securities estimates, Bloomberg
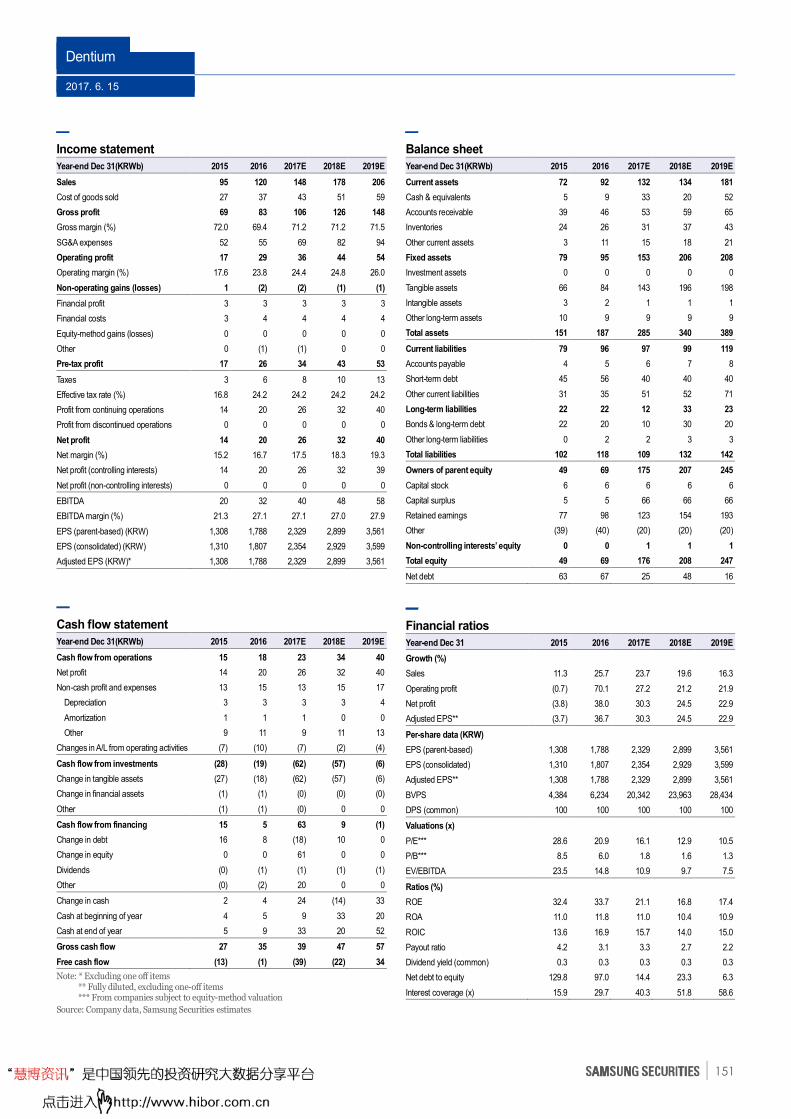
Dentium
2017. 6. 15
151
Income statement
Year-end Dec 31(KRWb) 2015 2016 2017E 2018E 2019E
Sales 95 120 148 178 206
Cost of goods sold 27 37 43 51 59
Gross profit 69 83 106 126 148
Gross margin (%) 72.0 69.4 71.2 71.2 71.5
SG&A expenses 52 55 69 82 94
Operating profit 17 29 36 44 54
Operating margin (%) 17.6 23.8 24.4 24.8 26.0
Non-operating gains (losses) 1 (2) (2) (1) (1)
Financial profit 3 3 3 3 3
Financial costs 3 4 4 4 4
Equity-method gains (losses) 0 0 0 0 0
Other 0 (1) (1) 0 0
Pre-tax profit 17 26 34 43 53
Taxes 3 6 8 10 13
Effective tax rate (%) 16.8 24.2 24.2 24.2 24.2
Profit from continuing operations 14 20 26 32 40
Profit from discontinued operations 0 0 0 0 0
Net profit 14 20 26 32 40
Net margin (%) 15.2 16.7 17.5 18.3 19.3
Net profit (controlling interests) 14 20 26 32 39
Net profit (non-controlling interests) 0 0 0 0 0
EBITDA 20 32 40 48 58
EBITDA margin (%) 21.3 27.1 27.1 27.0 27.9
EPS (parent-based) (KRW) 1,308 1,788 2,329 2,899 3,561
EPS (consolidated) (KRW) 1,310 1,807 2,354 2,929 3,599
Adjusted EPS (KRW)* 1,308 1,788 2,329 2,899 3,561
Cash flow statement
Year-end Dec 31(KRWb) 2015 2016 2017E 2018E 2019E
Cash flow from operations 15 18 23 34 40
Net profit 14 20 26 32 40
Non-cash profit and expenses 13 15 13 15 17
Depreciation 3 3 3 3 4
Amortization 1 1 1 0 0
Other 9 11 9 11 13
Changes in A/L from operating activities (7) (10) (7) (2) (4)
Cash flow from investments (28) (19) (62) (57) (6)
Change in tangible assets (27) (18) (62) (57) (6)
Change in financial assets (1) (1) (0) (0) (0)
Other (1) (1) (0) 0 0
Cash flow from financing 15 5 63 9 (1)
Change in debt 16 8 (18) 10 0
Change in equity 0 0 61 0 0
Dividends (0) (1) (1) (1) (1)
Other (0) (2) 20 0 0
Change in cash 2 4 24 (14) 33
Cash at beginning of year 4 5 9 33 20
Cash at end of year 5 9 33 20 52
Gross cash flow 27 35 39 47 57
Free cash flow (13) (1) (39) (22) 34
Note: * Excluding one off items ** Fully diluted, excluding one-off items *** From companies subject to equity-method valuation
Source: Company data, Samsung Securities estimates
Balance sheet
Year-end Dec 31(KRWb) 2015 2016 2017E 2018E 2019E
Current assets 72 92 132 134 181
Cash & equivalents 5 9 33 20 52
Accounts receivable 39 46 53 59 65
Inventories 24 26 31 37 43
Other current assets 3 11 15 18 21
Fixed assets 79 95 153 206 208
Investment assets 0 0 0 0 0
Tangible assets 66 84 143 196 198
Intangible assets 3 2 1 1 1
Other long-term assets 10 9 9 9 9
Total assets 151 187 285 340 389
Current liabilities 79 96 97 99 119
Accounts payable 4 5 6 7 8
Short-term debt 45 56 40 40 40
Other current liabilities 31 35 51 52 71
Long-term liabilities 22 22 12 33 23
Bonds & long-term debt 22 20 10 30 20
Other long-term liabilities 0 2 2 3 3
Total liabilities 102 118 109 132 142
Owners of parent equity 49 69 175 207 245
Capital stock 6 6 6 6 6
Capital surplus 5 5 66 66 66
Retained earnings 77 98 123 154 193
Other (39) (40) (20) (20) (20)
Non-controlling interests’ equity 0 0 1 1 1
Total equity 49 69 176 208 247
Net debt 63 67 25 48 16
Financial ratios
Year-end Dec 31 2015 2016 2017E 2018E 2019E
Growth (%)
Sales 11.3 25.7 23.7 19.6 16.3
Operating profit (0.7) 70.1 27.2 21.2 21.9
Net profit (3.8) 38.0 30.3 24.5 22.9
Adjusted EPS** (3.7) 36.7 30.3 24.5 22.9
Per-share data (KRW)
EPS (parent-based) 1,308 1,788 2,329 2,899 3,561
EPS (consolidated) 1,310 1,807 2,354 2,929 3,599
Adjusted EPS** 1,308 1,788 2,329 2,899 3,561
BVPS 4,384 6,234 20,342 23,963 28,434
DPS (common) 100 100 100 100 100
Valuations (x)
P/E*** 28.6 20.9 16.1 12.9 10.5
P/B*** 8.5 6.0 1.8 1.6 1.3
EV/EBITDA 23.5 14.8 10.9 9.7 7.5
Ratios (%)
ROE 32.4 33.7 21.1 16.8 17.4
ROA 11.0 11.8 11.0 10.4 10.9
ROIC 13.6 16.9 15.7 14.0 15.0
Payout ratio 4.2 3.1 3.3 2.7 2.2
Dividend yield (common) 0.3 0.3 0.3 0.3 0.3
Net debt to equity 129.8 97.0 14.4 23.3 6.3
Interest coverage (x) 15.9 29.7 40.3 51.8 58.6

2017. 6. 15
ST Pharm (237690)
Three things to monitor in 2H
● In 2H, we recommend investors monitor ST Pharm’s API orders for hepatitis C
treatments, the pace of its oligonucleotide sales growth, and whether or not the
firm adds new global clients.
● The stock already seems to have priced in concerns surrounding order declines for
sofosbuvir, but with anticipation building for oligonucleotides-led growth starting
next year, we make it our top 2H pick among pharmaceutical SMEs.
WHAT’S THE STORY?
Top pick for 2H: ST Pharm has highest exposure to exports (83.1% in 2016) among
Korean pharmaceutical SMEs, including API makers, with it largely insulated from
domestic pharmaceutical regulations thanks to long-term CMO contracts with multi-
national pharmaceutical players in the US and Europe. The company’s high-margin
oligonucleotide sales have been growing unexpectedly fast, thus reducing its API
dependence for hepatitis C treatments. In 2H, we recommend monitoring: 1) the size of
API orders for hepatitis C treatments—expected over September-October; 2)
oligonucleotide sales growth; and 3) whether or not it adds new multi-national clients.
Earnings outlook: We expect the sales of ST Pharm to rise 3.4% to KRW207.2b this
year as its operating profit slips 1% to KRW76.8b and margin falls 1.7%pts to 37.1%, with
the latter to owe to increased: 1) R&D expenses for its in-house pipeline; and 2) hiring of
oligonucleotide QA and QC staff. The company in Sep 2016 received USD135m in
sofosbuvir orders for this year (up 19% y-y), but Gilead’s guidance has us expecting its
sales from the drug declining 15.1% to KRW112.5b in 2018, with our forecasts also having
its total sales and operating profit up a respective 4.4% and 1.6% to KRW216.4b and
KRW78b with a margin drop of 1%pt to 36.1%. We foresee its oligonucleotide sales
jumping 77.2% next year to KRW55b, which should account for 25.4% of the total figure,
vs a projected 15% this year and 10.3% in 2016.
Still a BUY: We base our 12-month target price of KRW56,000 on the abovementioned
forecasts, with the shares already reflecting concerns of falling sofosbuvir orders.
Anticipation of oligonucleotides-led growth from next year appears valid, with ST Pharm
set to use its cash (KRW138b as of 1Q) to build a dedicated factory along with investments
for in-house R&D and open innovation systems overseas. * This report was originally published on Jun 9
Company Update
SUMMARY FINANCIAL DATA
2016 2017E 2018E 2019E
Revenue (KRWb) 200 207 216 236
Net profit (adj) (KRWb) 61 60 62 71
EPS (adj) (KRW) 3,761 3,230 3,337 3,820
EPS (adj) growth (% y-y) n/a (14.1) 3.3 14.5
EBITDA margin (%) 44.1 43.4 42.7 43.9
ROE (%) 19.6 17.8 15.9 15.9
P/E (adj) (x) 12.9 15.0 14.5 12.7
P/B (x) 2.9 2.5 2.2 1.9
EV/EBITDA (x) 8.8 8.3 7.7 6.3
Dividend yield (%) 1.0 1.0 1.2 1.2
Source: Company data, Samsung Securities estimates
SunYoung Yoon
Analyst
[email protected] 822 2020 7840
AT A GLANCE
Target price KRW56,000 (15.7%)
Current price KRW48,400
Market cap KRW894.64b/USD798.29m
Shares (float) 18,484,400 (43.2%)
52-week high/low KRW58,000/KRW36,250
Avg daily trading value (60-day)
KRW4.8b/ USD4.3m
ONE-YEAR PERFORMANCE
1M 6M 12M
ST Pharm (%) 5.9 28.6 n/a
Vs Kosdaq (%pts) 4.1 19.0 n/a
KEY CHANGES
(KRW) New Old Diff
Recommend. BUY BUY
Target price 56,000 56,000 0.0%
2017E EPS 3,230 3,463 -6.7%
2018E EPS 3,337 3,352 -0.4%
SAMSUNG vs THE STREET
No of estimates 7
Target price 64,143
Recommendation 4.0
BUY★★★: 5 / BUY: 4 / HOLD: 3 / SELL: 2 / SELL★★★: 1
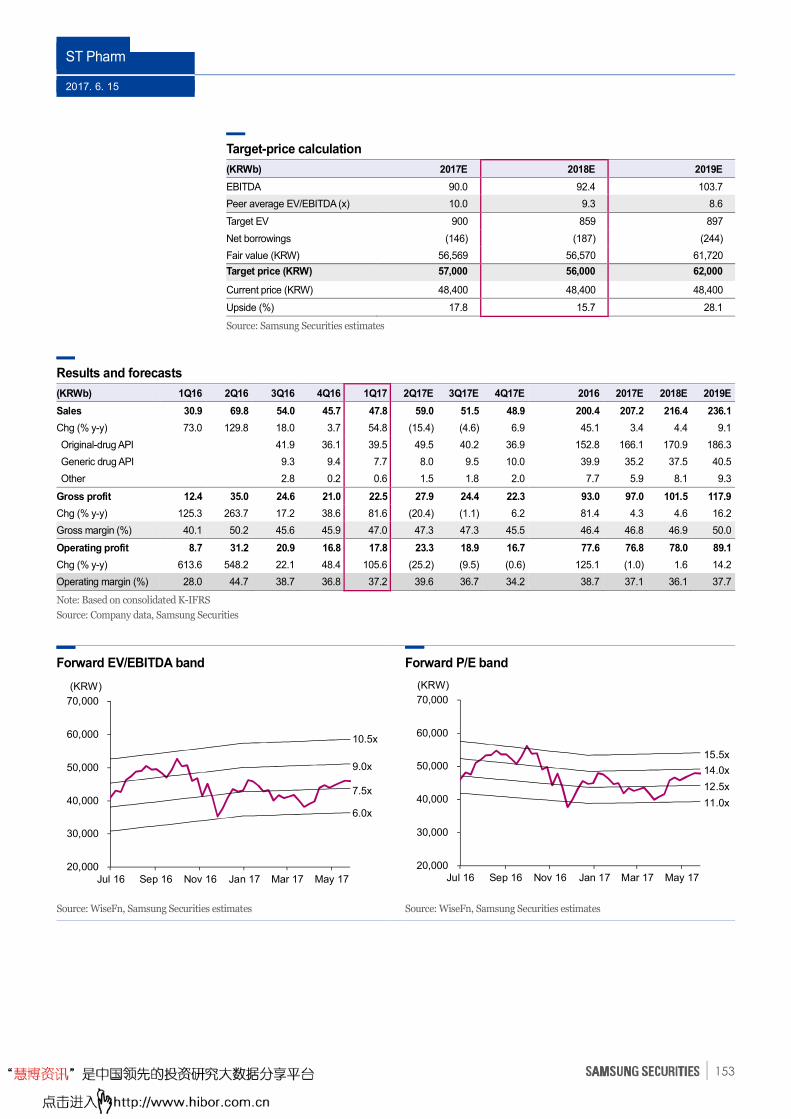
ST Pharm
2017. 6. 15
153
Target-price calculation
(KRWb) 2017E 2018E 2019E
EBITDA 90.0 92.4 103.7
Peer average EV/EBITDA (x) 10.0 9.3 8.6
Target EV 900 859 897
Net borrowings (146) (187) (244)
Fair value (KRW) 56,569 56,570 61,720
Target price (KRW) 57,000 56,000 62,000
Current price (KRW) 48,400 48,400 48,400
Upside (%) 17.8 15.7 28.1
Source: Samsung Securities estimates
Results and forecasts
(KRWb) 1Q16 2Q16 3Q16 4Q16 1Q17 2Q17E 3Q17E 4Q17E 2016 2017E 2018E 2019E
Sales 30.9 69.8 54.0 45.7 47.8 59.0 51.5 48.9 200.4 207.2 216.4 236.1
Chg (% y-y) 73.0 129.8 18.0 3.7 54.8 (15.4) (4.6) 6.9 45.1 3.4 4.4 9.1
Original-drug API 41.9 36.1 39.5 49.5 40.2 36.9 152.8 166.1 170.9 186.3
Generic drug API 9.3 9.4 7.7 8.0 9.5 10.0 39.9 35.2 37.5 40.5
Other 2.8 0.2 0.6 1.5 1.8 2.0 7.7 5.9 8.1 9.3
Gross profit 12.4 35.0 24.6 21.0 22.5 27.9 24.4 22.3 93.0 97.0 101.5 117.9
Chg (% y-y) 125.3 263.7 17.2 38.6 81.6 (20.4) (1.1) 6.2 81.4 4.3 4.6 16.2
Gross margin (%) 40.1 50.2 45.6 45.9 47.0 47.3 47.3 45.5 46.4 46.8 46.9 50.0
Operating profit 8.7 31.2 20.9 16.8 17.8 23.3 18.9 16.7 77.6 76.8 78.0 89.1
Chg (% y-y) 613.6 548.2 22.1 48.4 105.6 (25.2) (9.5) (0.6) 125.1 (1.0) 1.6 14.2
Operating margin (%) 28.0 44.7 38.7 36.8 37.2 39.6 36.7 34.2 38.7 37.1 36.1 37.7
Note: Based on consolidated K-IFRS
Source: Company data, Samsung Securities
Forward EV/EBITDA band Forward P/E band
Source: WiseFn, Samsung Securities estimates Source: WiseFn, Samsung Securities estimates
20,000
30,000
40,000
50,000
60,000
70,000
Jul 16 Sep 16 Nov 16 Jan 17 Mar 17 May 17
(KRW)
10.5x
9.0x
7.5x
6.0x
20,000
30,000
40,000
50,000
60,000
70,000
Jul 16 Sep 16 Nov 16 Jan 17 Mar 17 May 17
(KRW)
15.5x
14.0x
12.5x
11.0x
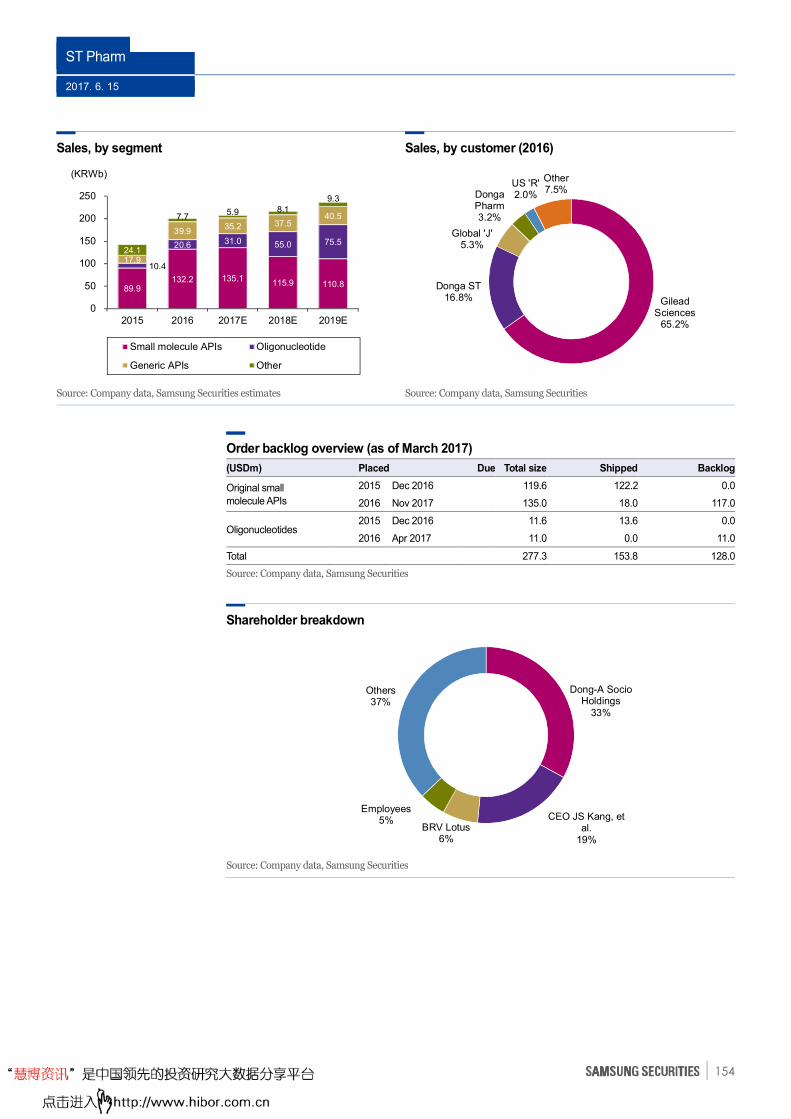
ST Pharm
2017. 6. 15
154
Sales, by segment Sales, by customer (2016)
Source: Company data, Samsung Securities estimates Source: Company data, Samsung Securities
Order backlog overview (as of March 2017)
(USDm) Placed Due Total size Shipped Backlog
Original small
molecule APIs
2015 Dec 2016 119.6 122.2 0.0
2016 Nov 2017 135.0 18.0 117.0
Oligonucleotides 2015 Dec 2016 11.6 13.6 0.0
2016 Apr 2017 11.0 0.0 11.0
Total 277.3 153.8 128.0
Source: Company data, Samsung Securities
Shareholder breakdown
Source: Company data, Samsung Securities
89.9 132.2 135.1
115.9 110.8
10.4
20.6 31.0 55.0 75.5
17.9
39.9 35.2 37.5
40.5
24.1
7.7 5.9 8.1
9.3
0
50
100
150
200
250
2015 2016 2017E 2018E 2019E
Small molecule APIs Oligonucleotide
Generic APIs Other
(KRWb)
Gilead Sciences
65.2%
Donga ST16.8%
Global 'J'5.3%
Donga Pharm3.2%
US 'R'2.0%
Other7.5%
Dong-A Socio Holdings
33%
CEO JS Kang, et al.
19%BRV Lotus
6%
Employees5%
Others37%
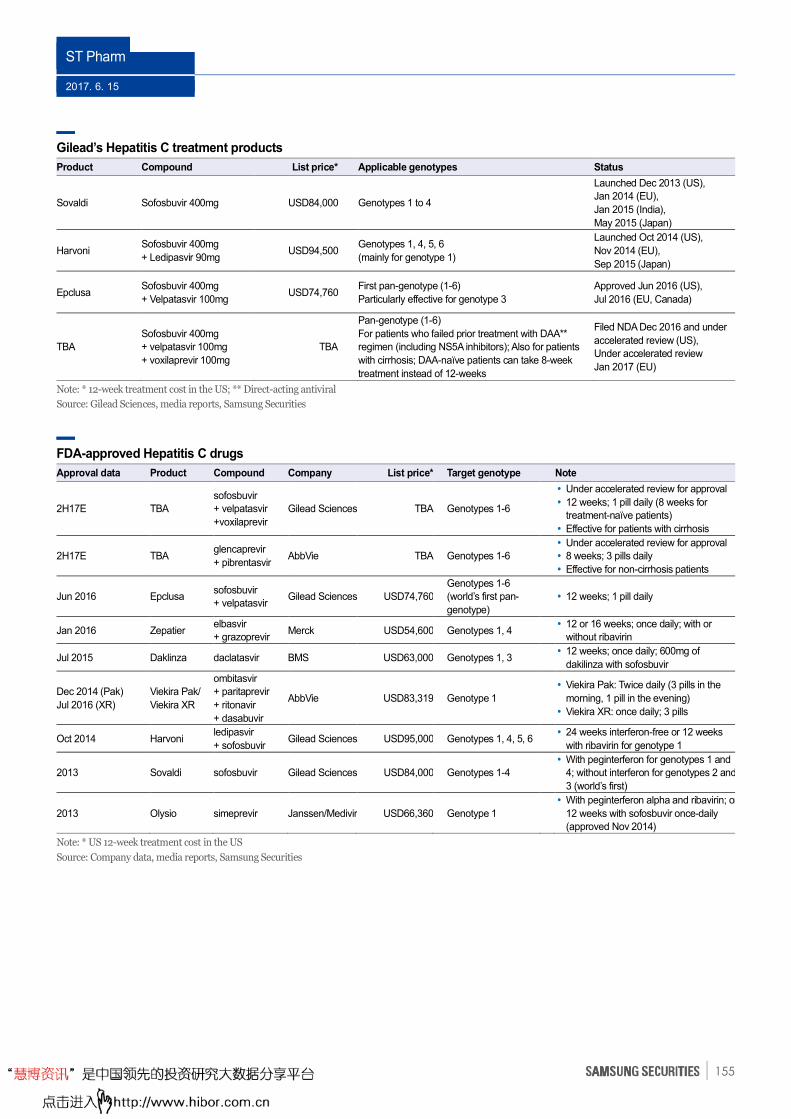
ST Pharm
2017. 6. 15
155
Gilead’s Hepatitis C treatment products
Product Compound List price* Applicable genotypes Status
Sovaldi Sofosbuvir 400mg USD84,000 Genotypes 1 to 4
Launched Dec 2013 (US),
Jan 2014 (EU),
Jan 2015 (India),
May 2015 (Japan)
Harvoni Sofosbuvir 400mg
+ Ledipasvir 90mg USD94,500
Genotypes 1, 4, 5, 6
(mainly for genotype 1)
Launched Oct 2014 (US),
Nov 2014 (EU),
Sep 2015 (Japan)
Epclusa Sofosbuvir 400mg
+ Velpatasvir 100mg USD74,760
First pan-genotype (1-6)
Particularly effective for genotype 3
Approved Jun 2016 (US),
Jul 2016 (EU, Canada)
TBA
Sofosbuvir 400mg
+ velpatasvir 100mg
+ voxilaprevir 100mg
TBA
Pan-genotype (1-6)
For patients who failed prior treatment with DAA**
regimen (including NS5A inhibitors); Also for patients
with cirrhosis; DAA-naïve patients can take 8-week
treatment instead of 12-weeks
Filed NDA Dec 2016 and under
accelerated review (US),
Under accelerated review
Jan 2017 (EU)
Note: * 12-week treatment cost in the US; ** Direct-acting antiviral
Source: Gilead Sciences, media reports, Samsung Securities
FDA-approved Hepatitis C drugs
Approval data Product Compound Company List price* Target genotype Note
2H17E TBA
sofosbuvir
+ velpatasvir
+voxilaprevir
Gilead Sciences TBA Genotypes 1-6
� Under accelerated review for approval
� 12 weeks; 1 pill daily (8 weeks for
treatment-naïve patients)
� Effective for patients with cirrhosis
2H17E TBA glencaprevir
+ pibrentasvir AbbVie TBA Genotypes 1-6
� Under accelerated review for approval
� 8 weeks; 3 pills daily
� Effective for non-cirrhosis patients
Jun 2016 Epclusa sofosbuvir
+ velpatasvir Gilead Sciences USD74,760
Genotypes 1-6
(world’s first pan-
genotype)
� 12 weeks; 1 pill daily
Jan 2016 Zepatier elbasvir
+ grazoprevir Merck USD54,600 Genotypes 1, 4
� 12 or 16 weeks; once daily; with or
without ribavirin
Jul 2015 Daklinza daclatasvir BMS USD63,000 Genotypes 1, 3 � 12 weeks; once daily; 600mg of
dakilinza with sofosbuvir
Dec 2014 (Pak)
Jul 2016 (XR)
Viekira Pak/
Viekira XR
ombitasvir
+ paritaprevir
+ ritonavir
+ dasabuvir
AbbVie USD83,319 Genotype 1
� Viekira Pak: Twice daily (3 pills in the
morning, 1 pill in the evening)
� Viekira XR: once daily; 3 pills
Oct 2014 Harvoni ledipasvir
+ sofosbuvir Gilead Sciences USD95,000 Genotypes 1, 4, 5, 6
� 24 weeks interferon-free or 12 weeks
with ribavirin for genotype 1
2013 Sovaldi sofosbuvir Gilead Sciences USD84,000 Genotypes 1-4
� With peginterferon for genotypes 1 and
4; without interferon for genotypes 2 and
3 (world’s first)
2013 Olysio simeprevir Janssen/Medivir USD66,360 Genotype 1
� With peginterferon alpha and ribavirin; or
12 weeks with sofosbuvir once-daily
(approved Nov 2014)
Note: * US 12-week treatment cost in the US
Source: Company data, media reports, Samsung Securities
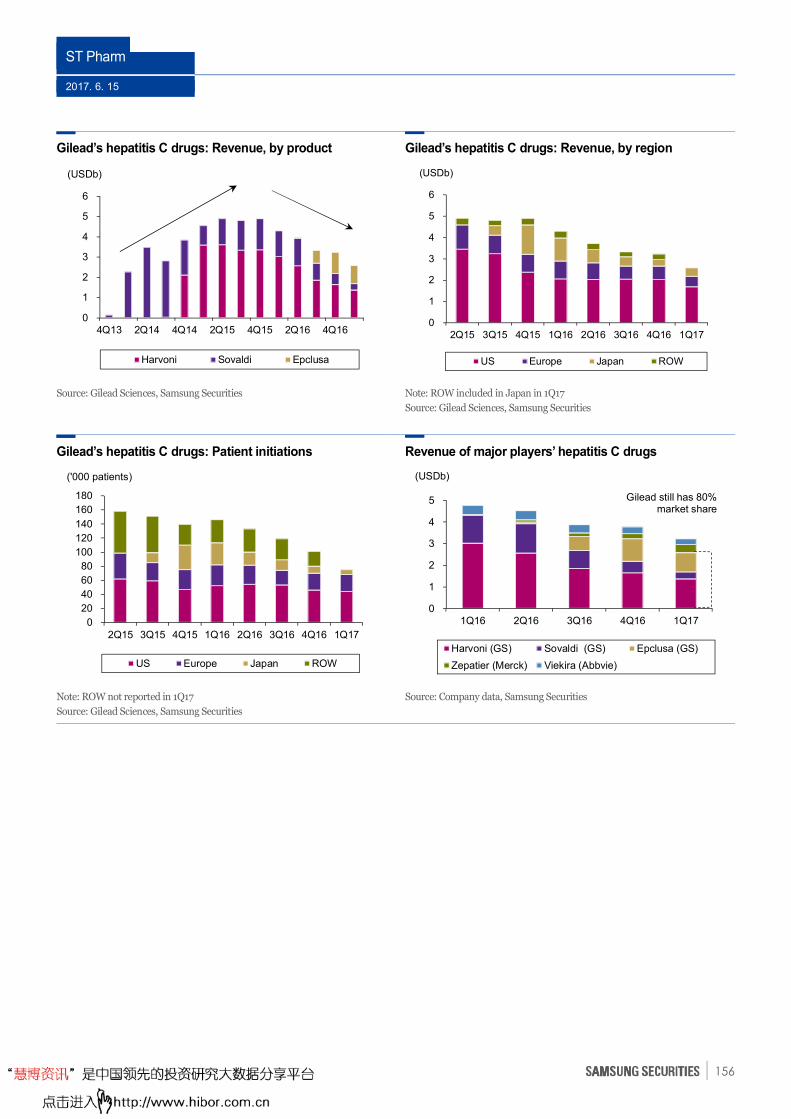
ST Pharm
2017. 6. 15
156
Gilead’s hepatitis C drugs: Revenue, by product Gilead’s hepatitis C drugs: Revenue, by region
Source: Gilead Sciences, Samsung Securities Note: ROW included in Japan in 1Q17
Source: Gilead Sciences, Samsung Securities
Gilead’s hepatitis C drugs: Patient initiations Revenue of major players’ hepatitis C drugs
Note: ROW not reported in 1Q17
Source: Gilead Sciences, Samsung Securities
Source: Company data, Samsung Securities
0
1
2
3
4
5
6
4Q13 2Q14 4Q14 2Q15 4Q15 2Q16 4Q16
Harvoni Sovaldi Epclusa
(USDb)
0
1
2
3
4
5
6
2Q15 3Q15 4Q15 1Q16 2Q16 3Q16 4Q16 1Q17
US Europe Japan ROW
(USDb)
0
20
40
60
80
100
120
140
160
180
2Q15 3Q15 4Q15 1Q16 2Q16 3Q16 4Q16 1Q17
US Europe Japan ROW
('000 patients)
0
1
2
3
4
5
1Q16 2Q16 3Q16 4Q16 1Q17
Harvoni (GS) Sovaldi (GS) Epclusa (GS)
Zepatier (Merck) Viekira (Abbvie)
(USDb)
Gilead still has 80%market share
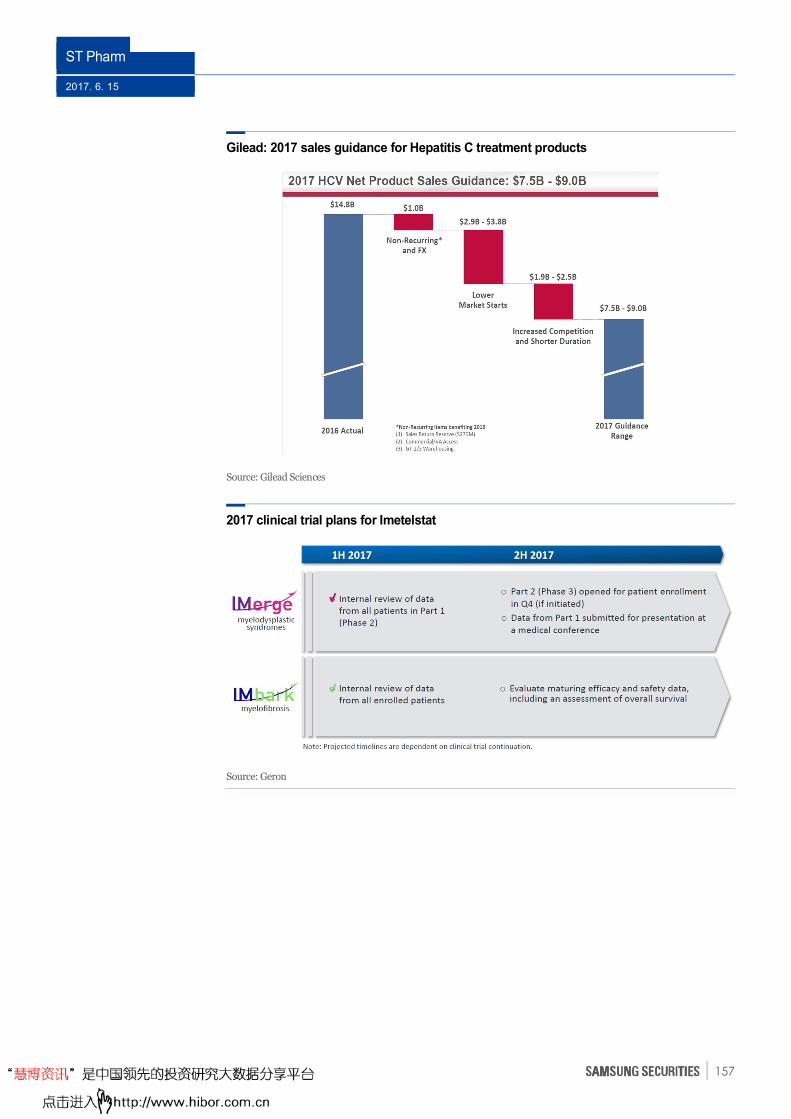
ST Pharm
2017. 6. 15
157
Gilead: 2017 sales guidance for Hepatitis C treatment products
Source: Gilead Sciences
2017 clinical trial plans for Imetelstat
Source: Geron
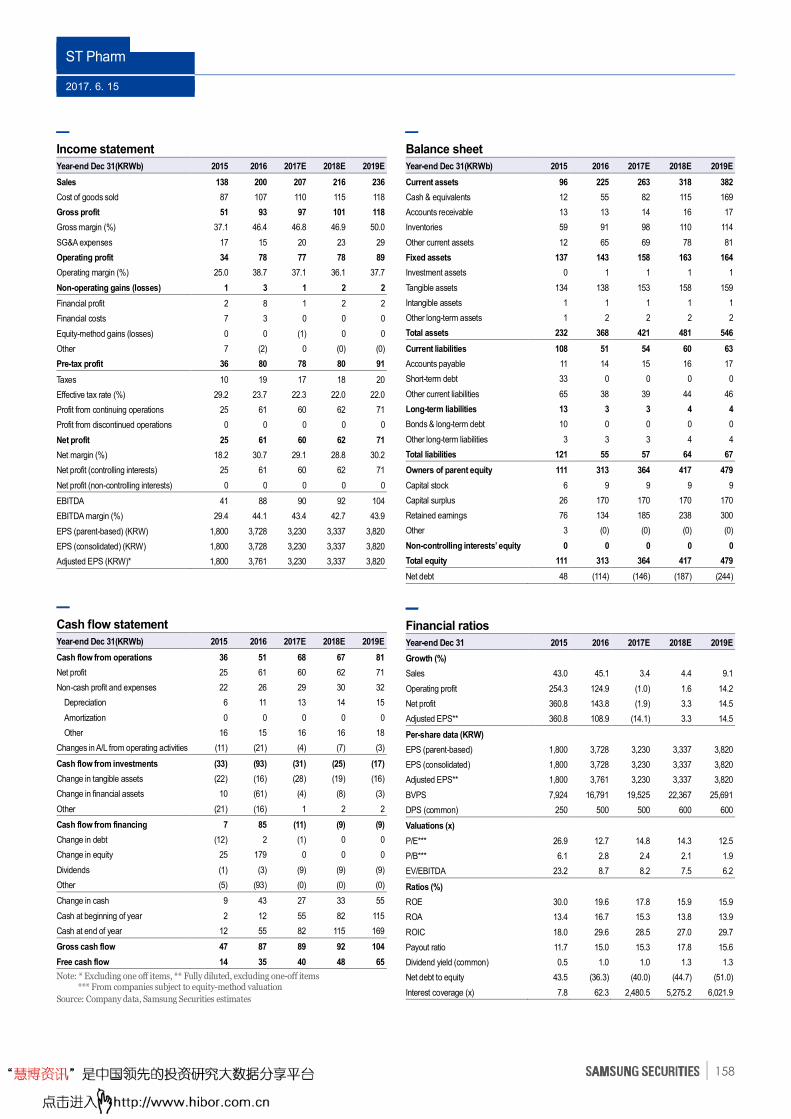
ST Pharm
2017. 6. 15
158
Income statement
Year-end Dec 31(KRWb) 2015 2016 2017E 2018E 2019E
Sales 138 200 207 216 236
Cost of goods sold 87 107 110 115 118
Gross profit 51 93 97 101 118
Gross margin (%) 37.1 46.4 46.8 46.9 50.0
SG&A expenses 17 15 20 23 29
Operating profit 34 78 77 78 89
Operating margin (%) 25.0 38.7 37.1 36.1 37.7
Non-operating gains (losses) 1 3 1 2 2
Financial profit 2 8 1 2 2
Financial costs 7 3 0 0 0
Equity-method gains (losses) 0 0 (1) 0 0
Other 7 (2) 0 (0) (0)
Pre-tax profit 36 80 78 80 91
Taxes 10 19 17 18 20
Effective tax rate (%) 29.2 23.7 22.3 22.0 22.0
Profit from continuing operations 25 61 60 62 71
Profit from discontinued operations 0 0 0 0 0
Net profit 25 61 60 62 71
Net margin (%) 18.2 30.7 29.1 28.8 30.2
Net profit (controlling interests) 25 61 60 62 71
Net profit (non-controlling interests) 0 0 0 0 0
EBITDA 41 88 90 92 104
EBITDA margin (%) 29.4 44.1 43.4 42.7 43.9
EPS (parent-based) (KRW) 1,800 3,728 3,230 3,337 3,820
EPS (consolidated) (KRW) 1,800 3,728 3,230 3,337 3,820
Adjusted EPS (KRW)* 1,800 3,761 3,230 3,337 3,820
Cash flow statement
Year-end Dec 31(KRWb) 2015 2016 2017E 2018E 2019E
Cash flow from operations 36 51 68 67 81
Net profit 25 61 60 62 71
Non-cash profit and expenses 22 26 29 30 32
Depreciation 6 11 13 14 15
Amortization 0 0 0 0 0
Other 16 15 16 16 18
Changes in A/L from operating activities (11) (21) (4) (7) (3)
Cash flow from investments (33) (93) (31) (25) (17)
Change in tangible assets (22) (16) (28) (19) (16)
Change in financial assets 10 (61) (4) (8) (3)
Other (21) (16) 1 2 2
Cash flow from financing 7 85 (11) (9) (9)
Change in debt (12) 2 (1) 0 0
Change in equity 25 179 0 0 0
Dividends (1) (3) (9) (9) (9)
Other (5) (93) (0) (0) (0)
Change in cash 9 43 27 33 55
Cash at beginning of year 2 12 55 82 115
Cash at end of year 12 55 82 115 169
Gross cash flow 47 87 89 92 104
Free cash flow 14 35 40 48 65
Note: * Excluding one off items, ** Fully diluted, excluding one-off items *** From companies subject to equity-method valuation
Source: Company data, Samsung Securities estimates
Balance sheet
Year-end Dec 31(KRWb) 2015 2016 2017E 2018E 2019E
Current assets 96 225 263 318 382
Cash & equivalents 12 55 82 115 169
Accounts receivable 13 13 14 16 17
Inventories 59 91 98 110 114
Other current assets 12 65 69 78 81
Fixed assets 137 143 158 163 164
Investment assets 0 1 1 1 1
Tangible assets 134 138 153 158 159
Intangible assets 1 1 1 1 1
Other long-term assets 1 2 2 2 2
Total assets 232 368 421 481 546
Current liabilities 108 51 54 60 63
Accounts payable 11 14 15 16 17
Short-term debt 33 0 0 0 0
Other current liabilities 65 38 39 44 46
Long-term liabilities 13 3 3 4 4
Bonds & long-term debt 10 0 0 0 0
Other long-term liabilities 3 3 3 4 4
Total liabilities 121 55 57 64 67
Owners of parent equity 111 313 364 417 479
Capital stock 6 9 9 9 9
Capital surplus 26 170 170 170 170
Retained earnings 76 134 185 238 300
Other 3 (0) (0) (0) (0)
Non-controlling interests’ equity 0 0 0 0 0
Total equity 111 313 364 417 479
Net debt 48 (114) (146) (187) (244)
Financial ratios
Year-end Dec 31 2015 2016 2017E 2018E 2019E
Growth (%)
Sales 43.0 45.1 3.4 4.4 9.1
Operating profit 254.3 124.9 (1.0) 1.6 14.2
Net profit 360.8 143.8 (1.9) 3.3 14.5
Adjusted EPS** 360.8 108.9 (14.1) 3.3 14.5
Per-share data (KRW)
EPS (parent-based) 1,800 3,728 3,230 3,337 3,820
EPS (consolidated) 1,800 3,728 3,230 3,337 3,820
Adjusted EPS** 1,800 3,761 3,230 3,337 3,820
BVPS 7,924 16,791 19,525 22,367 25,691
DPS (common) 250 500 500 600 600
Valuations (x)
P/E*** 26.9 12.7 14.8 14.3 12.5
P/B*** 6.1 2.8 2.4 2.1 1.9
EV/EBITDA 23.2 8.7 8.2 7.5 6.2
Ratios (%)
ROE 30.0 19.6 17.8 15.9 15.9
ROA 13.4 16.7 15.3 13.8 13.9
ROIC 18.0 29.6 28.5 27.0 29.7
Payout ratio 11.7 15.0 15.3 17.8 15.6
Dividend yield (common) 0.5 1.0 1.0 1.3 1.3
Net debt to equity 43.5 (36.3) (40.0) (44.7) (51.0)
Interest coverage (x) 7.8 62.3 2,480.5 5,275.2 6,021.9
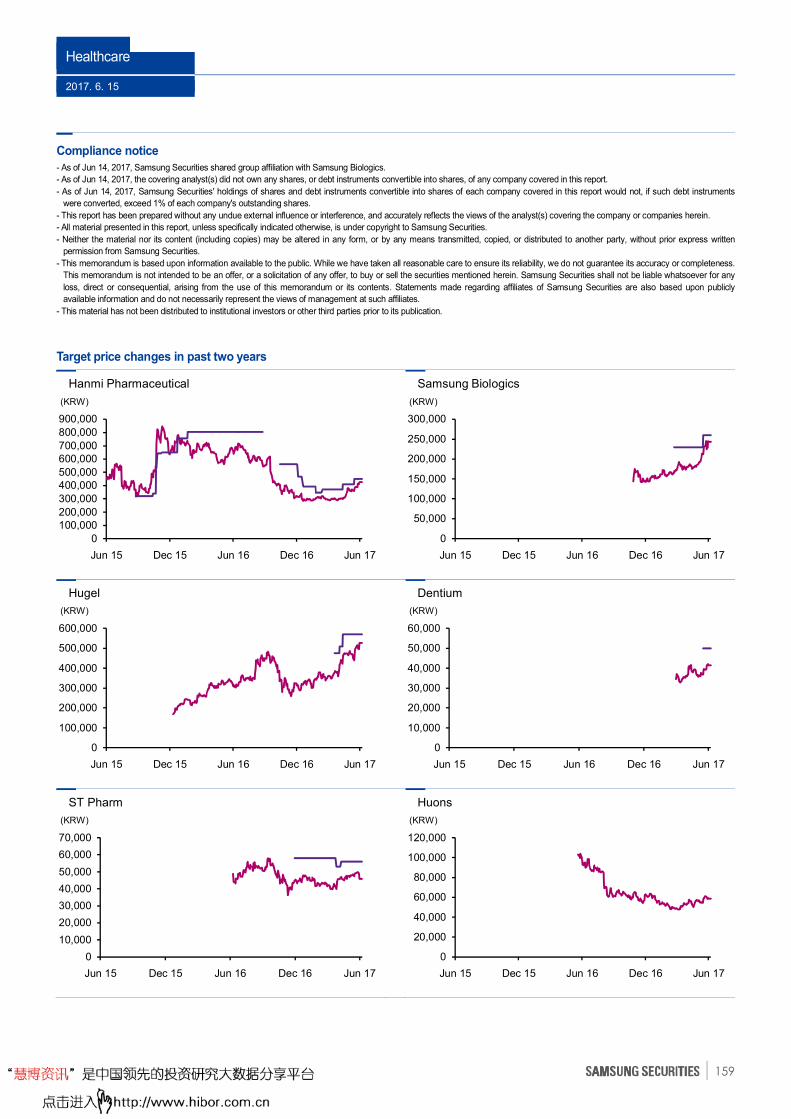
Healthcare
2017. 6. 15
159
Compliance notice
- As of Jun 14, 2017, Samsung Securities shared group affiliation with Samsung Biologics.
- As of Jun 14, 2017, the covering analyst(s) did not own any shares, or debt instruments convertible into shares, of any company covered in this report.
- As of Jun 14, 2017, Samsung Securities' holdings of shares and debt instruments convertible into shares of each company covered in this report would not, if such debt instruments
were converted, exceed 1% of each company's outstanding shares.
- This report has been prepared without any undue external influence or interference, and accurately reflects the views of the analyst(s) covering the company or companies herein.
- All material presented in this report, unless specifically indicated otherwise, is under copyright to Samsung Securities.
- Neither the material nor its content (including copies) may be altered in any form, or by any means transmitted, copied, or distributed to another party, without prior express written
permission from Samsung Securities.
- This memorandum is based upon information available to the public. While we have taken all reasonable care to ensure its reliability, we do not guarantee its accuracy or completeness.
This memorandum is not intended to be an offer, or a solicitation of any offer, to buy or sell the securities mentioned herein. Samsung Securities shall not be liable whatsoever for any
loss, direct or consequential, arising from the use of this memorandum or its contents. Statements made regarding affiliates of Samsung Securities are also based upon publicly
available information and do not necessarily represent the views of management at such affiliates.
- This material has not been distributed to institutional investors or other third parties prior to its publication.
Target price changes in past two years
0
100,000200,000
300,000
400,000500,000
600,000700,000
800,000
900,000
Jun 15 Dec 15 Jun 16 Dec 16 Jun 17
(KRW)
Hanmi Pharmaceutical
0
50,000
100,000
150,000
200,000
250,000
300,000
Jun 15 Dec 15 Jun 16 Dec 16 Jun 17
(KRW)
Samsung Biologics
0
100,000
200,000
300,000
400,000
500,000
600,000
Jun 15 Dec 15 Jun 16 Dec 16 Jun 17
(KRW)
Hugel
0
10,000
20,000
30,000
40,000
50,000
60,000
Jun 15 Dec 15 Jun 16 Dec 16 Jun 17
(KRW)
Dentium
0
10,000
20,000
30,000
40,000
50,000
60,000
70,000
Jun 15 Dec 15 Jun 16 Dec 16 Jun 17
(KRW)
ST Pharm
0
20,000
40,000
60,000
80,000
100,000
120,000
Jun 15 Dec 15 Jun 16 Dec 16 Jun 17
(KRW)
Huons
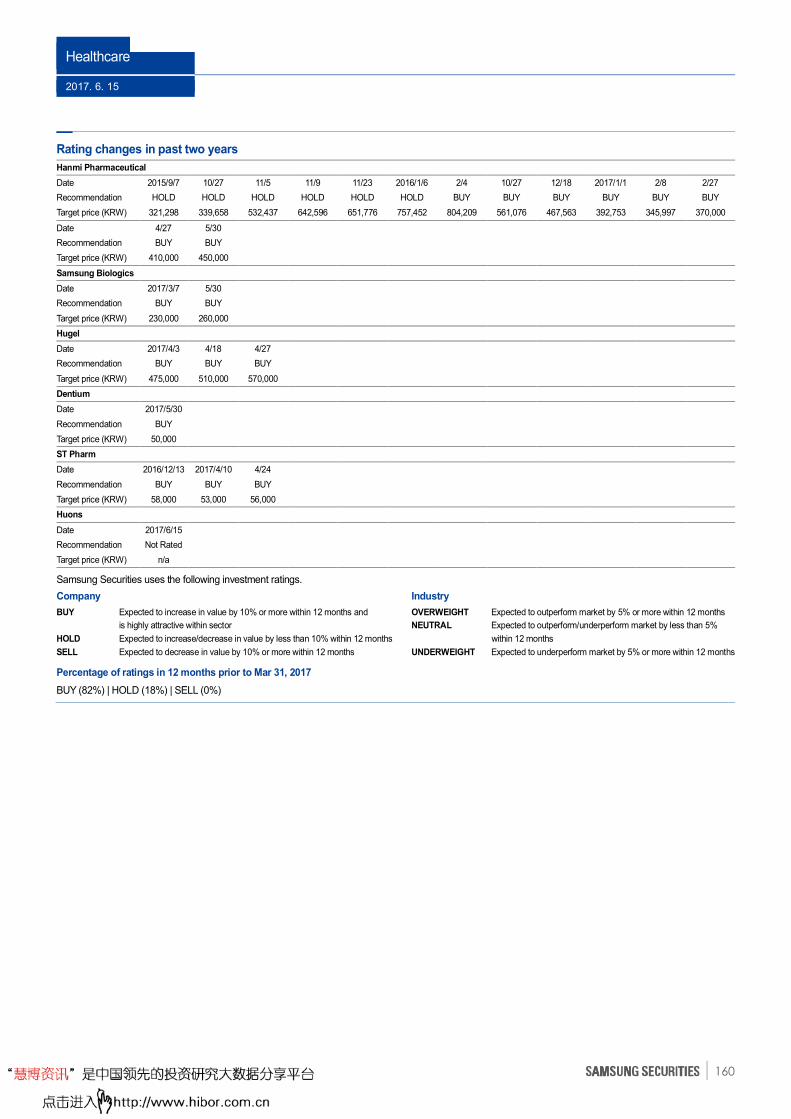
Healthcare
2017. 6. 15
160
Rating changes in past two years
Hanmi Pharmaceutical
Date 2015/9/7 10/27 11/5 11/9 11/23 2016/1/6 2/4 10/27 12/18 2017/1/1 2/8 2/27
Recommendation HOLD HOLD HOLD HOLD HOLD HOLD BUY BUY BUY BUY BUY BUY
Target price (KRW) 321,298 339,658 532,437 642,596 651,776 757,452 804,209 561,076 467,563 392,753 345,997 370,000
Date 4/27 5/30
Recommendation BUY BUY
Target price (KRW) 410,000 450,000
Samsung Biologics
Date 2017/3/7 5/30
Recommendation BUY BUY
Target price (KRW) 230,000 260,000
Hugel
Date 2017/4/3 4/18 4/27
Recommendation BUY BUY BUY
Target price (KRW) 475,000 510,000 570,000
Dentium
Date 2017/5/30
Recommendation BUY
Target price (KRW) 50,000
ST Pharm
Date 2016/12/13 2017/4/10 4/24
Recommendation BUY BUY BUY
Target price (KRW) 58,000 53,000 56,000
Huons
Date 2017/6/15
Recommendation Not Rated
Target price (KRW) n/a
Samsung Securities uses the following investment ratings.
Company
BUY Expected to increase in value by 10% or more within 12 months and
is highly attractive within sector
HOLD Expected to increase/decrease in value by less than 10% within 12 months
SELL Expected to decrease in value by 10% or more within 12 months
Industry
OVERWEIGHT Expected to outperform market by 5% or more within 12 months
NEUTRAL Expected to outperform/underperform market by less than 5%
within 12 months
UNDERWEIGHT Expected to underperform market by 5% or more within 12 months
Percentage of ratings in 12 months prior to Mar 31, 2017
BUY (82%) | HOLD (18%) | SELL (0%)
Healthcare
2017. 6. 15
161
Global Disclosures & Disclaimers
General
This research report is for information purposes only. It is not and should not be construed as an offer or solicitation of an offer to purchase or sell any securities or other financial instruments or to participate in any trading strategy. This report does not provide individually tailored investment advice. This report does not take into account individual client circumstances, objectives, or needs and is not intended as recommendations of particular securities, financial instruments or strategies to any particular client. The securities and other
financial instruments discussed in this report may not be suitable for all investors. The recipient of this report must make its own independent decisions regarding any securities or financial instruments mentioned herein and investors should seek the advice of a financial adviser.
This report may not be altered, reproduced, distributed, transmitted or published in whole or in part for any purpose. References to "Samsung Securities" are references to any company in the Samsung Securities, Co., Ltd. group of companies.
Samsung Securities and/or other affiliated companies, its and their directors, officers, representatives, or employees may have long or short positions in any of the securities or other
financial instruments mentioned in this report or of issuers described herein and may purchase and/or sell, or offer to purchase and/or sell, at any time, such securities or other financial instruments in the open market or otherwise, as either a principal or agent. Any pricing of securities or other financial instrument contained herein is as of the close of market for such day,
unless otherwise stated. Opinions and estimates contained herein constitute our judgment as of the date of this report and are subject to change without notice.
The information provided in this report is provided "AS IS". Although the information contained herein has been obtained from sources believed to be reliable, no representation or warranty, either expressed or implied, is provided by Samsung Securities in relation to the accuracy, completeness or reliability of such information or that such information was provided
for any particular purpose and Samsung Securities expressly disclaims any warranties of merchantability or fitness for a particular purpose. Furthermore, this report is not intended to be a complete statement or summary of the securities, markets or developments referred to herein.
Samsung Securities does not undertake that investors will obtain any profits, nor will it share with investors any investment profits. Samsung Securities, its affiliates, or any of its and their affiliates, directors, officers, employees or agents disclaim any and all responsibility or liability whatsoever for any loss (direct or consequential) or damage arising out of the use of all or any part of this report or its contents or otherwise arising in connection therewith. Information and opinions contained herein are subject to change without notice. Past performance is not
indicative of future results. Foreign currency rates of exchange may adversely affect the value, price or income of any security or financial instrument mentioned in this report. For investment advice, trade execution or other enquiries, clients should contact their local sales representative. Any opinions expressed in this report are subject to change without notice and
may differ or be contrary to opinions expressed by other business areas or groups of Samsung Securities. Any analysis contained herein is based on numerous assumptions. Different assumptions may result in materially different results. Samsung Securities is under no obligation to update or keep current the information contained herein. Samsung Securities relies on
information barriers to control the flow of information contained in one or more areas or groups within Samsung Securities into other areas or groups of Samsung Securities. Any prices stated in this report are for information purposes only and do not represent valuations for individual securities or other financial instruments. Samsung Securities makes no representation
that any transaction can or could have been effected at those prices and any prices contained herein may not reflect Samsung Securities’ internal books and records or theoretical model-based valuations and may be based on certain assumptions. Different assumptions by Samsung Securities or any other source may yield substantially different results. Additional
information is available upon request.
For reports to be distributed to US:
Securities research is prepared, issued and exclusively distributed by Samsung Securities Co., Ltd., an organization licensed with the Financial Supervisory Service of South Korea. This research may be distributed in the United States only to major institutional investors as defined in Rule 15a-6 of the U.S. Securities Exchange Act of 1934, as amended, and may not be
circulated to any other person otherwise. All transactions by U.S. investors involving securities discussed in this report must be effected through Samsung Securities (America) Inc., a broker-dealer registered with the U.S. Securities & Exchange Commission and a member of the Financial Industry Regulatory Authority/SIPC, and not through any non-U.S. affiliate
thereof. The analysts listed [on the front of this report] are employees of Samsung Securities Co., Ltd., or a non-U.S. affiliate thereof, and are not registered/qualified as research analysts under applicable U.S. rules and regulations and may not be subject to U.S. restrictions on communications with covered companies, public appearances, and trading securities held by a
research analyst account.
For reports to be distributed to UK:
This report is not an invitation nor is it intended to be an inducement to engage in investment activity for the purpose of section 21 of the Financial Services and Markets Act 2000 of the United Kingdom ("FSMA"). To the extent that this report does constitute such an invitation or inducement, it is directed only at (i) persons who are investment professionals within the meaning of Article 19(5) of the Financial Services and Markets Act 2000 (Financial Promotion) Order 2001 (as amended) of the United Kingdom (the "Financial Promotion Order"); (ii)
persons who fall within Articles 49(2)(a) to (d) ("high-net-worth companies, unincorporated associations etc.") of the Financial Promotion Order; and (iii) any other persons to whom this report can, for the purposes of section 21 of FSMA, otherwise lawfully be made (all such persons together being referred to as "relevant persons").
Any investment or investment activity to which this report relates is available only to relevant persons and will be engaged in only with relevant persons. Persons who are not relevant persons must not act or rely on this report.
For reports to be distributed to Korea:
This report is for private circulation only, not for sale, and is issued and distributed only to persons permitted under the laws and regulations of Korea.
For reports to be distributed to Singapore:
This report is provided pursuant to the financial advisory licensing exemption under Regulation 27(1)(e) of the Financial Advisers Regulation of Singapore and accordingly may only be provided to persons in Singapore who are "institutional investors" as defined in Section 4A of the Securities and Futures Act, Chapter 289 of Singapore. This report is intended only for the person to whom Samsung Securities has provided this report and such person may not send, forward or transmit in any way this report or any copy of this report to any other person.
Analyst certification
The views expressed in this research report accurately reflect the personal views of the analyst(s) about the subject securities or issuers and no part of the compensation of such analyst(s) was, is, or will be directly or indirectly related to the inclusion of specific recommendations or views in this research report. The analyst(s) principally responsible for the preparation of this research
report receives compensation based on determination by research management and senior management (not including investment banking), based on the overall revenues, including investment banking revenues of Samsung Securities Co., Ltd. and its related entities and has taken reasonable care to achieve and maintain independence and objectivity in making any
recommendations.
Copyright 2010 Samsung Securities Co., Ltd. All rights reserved. This report or any portion hereof may not be reprinted, sold or redistributed without the prior written consent of Samsung Securities America Inc.