Embed Size (px)
Citation preview
1
JPIP Proxy Server with Prefetching Strategies Based
on User-Navigation Model and Semantic MapJ. Lino Monteagudo-Pereira, Francesc Aulı-Llinas, Member, IEEE, and Joan Serra-Sagrista, Senior Member, IEEE
Abstract—The efficient transmission of large resolution im-ages and, in particular, the interactive transmission of imagesin a client-server scenario, is an important aspect for manyapplications. Among the current image compression standards,JPEG2000 excels for its interactive transmission capabilities. Ingeneral, three mechanisms are employed to optimize the trans-mission of images when using the JPEG2000 Interactive Protocol(JPIP): 1) packet re-sequencing at the server; 2) prefetching atthe client; and 3) proxy servers along the network infrastructure.To avoid the congestion of the network, prefetching mechanismsare not commonly employed when many clients within a localarea network (LAN) browse images from a remote server. Aimedto maximize the responsiveness of all the clients within a LAN,this work proposes the use of prefetching strategies at the proxyserver –rather than at the clients. The main insight behindthe proposed prefetching strategies is a user-navigation modeland a semantic map that predict the future requests of theclients. Experimental results indicate that the introduction ofthese strategies into a JPIP proxy server enhances the browsingexperience of the end-users notably.
Index Terms—Interactive image transmission, JPEG2000,JPIP, prefetching strategies, user-navigation model, semanticmap.
I. INTRODUCTION
THE efficient transmission of large resolution images
is a requirement in many applications related to terri-
tory management, telemedicine, disaster monitoring, or map
navigation, among others. To provide a pleasant browsing
experience, the transmission of the image areas requested by
the users has to be optimized. Compression and scalability are
fundamental aspects of the employed coding system to do so.
Among the current standards to code and transmit images,
JPEG2000 excels for its coding performance and transmission
capabilities. Part 1 of the standard [3] defines the core coding
system, which is wavelet-based with a two tiered coding
strategy. Fundamental features of JPEG2000 are support for
high resolution images (in terms of spatial, spectral, or bit-
depth), and scalability by spatial location, by quality, by
resolution, and by component. This high degree of scalability
Copyright (c) 2013 IEEE. Personal use of this material is permitted.However, permission to use this material for any other purposes must beobtained from the IEEE by sending a request to [email protected].
J. Lino Monteagudo-Pereira, Dr. Francesc Aulı-Llinas, and Dr. JoanSerra-Sagrista are with the Department of Information and Com-munications Engineering, Universitat Autonoma de Barcelona, Spain(phone: +34 935813571; fax: +34 935814477; e-mail: [email protected],[email protected], [email protected]). A preliminary version of this workwas presented at the IEEE Data Compression Conference 2010 and 2012 [1],[2]. This work has been partially supported by the Spanish Government(MINECO), by FEDER, and by the Catalan Government, under Grants RYC-2010-05671, TIN2009-14426-C02-01, TIN2012-38102-C03-03, and 2009-SGR-1224.
is partially provided by a rich codestream syntax that allows
random access to the file. The ability to work in the codestream
domain, i.e., to identify and potentially transmit any portion of
the image without needing to decode the codestream, makes
JPEG2000 one of the most suitable coding standards for
interactive image transmission.
The potential of JPEG2000 to interactively transmit images
was explored soon after the publication of Part 1 [4]–[8]. In
November 2005, JPEG2000 Part 9 [9] was published providing
a versatile client-server syntax for the interchange of imagery
that is named JPEG2000 Interactive Protocol (JPIP). Since
then, JPIP has been adopted in fields such as medicine [10],
[11], remote sensing [12], [13], or video-on-demand [14]–[16],
among others.
The main asset of JPIP is the rapid recovery of the image
areas requested by the client. Several mechanisms have been
proposed in the literature to improve this aspect. An efficient
technique employed in the server is to dismantle and re-
sequence the original codestream [17]. Another mechanism
is to utilize prefetching at the client. Prefetching refers to the
ability to anticipate the future movements of the user so that
the corresponding data can be retrieved during the moments
in which the connection between the server and the client is
idle [18]. The use of a proxy server is yet another mechanism
that improves the interactive transmission capabilities of JPIP
in some scenarios. Let us explain further. Commonly, in
centers or institutions users browse images located in a remote
server sharing the same Internet connection. In general, the
channel capacity of the local area network (LAN) is much
larger than that of the Internet. In such a scenario, a proxy
server caches and reuses the data transmitted from the server
to any of the clients, avoiding the transmission of the same
information more than once. Fig. 1 illustrates this scenario.
In the framework of JPEG2000, proxy mechanisms were
first explored in [19] re-defining the JPIP syntax so that the
conventional HTTP proxy infrastructure deployed in centers
and in the Internet were able to understand the dialog between
a JPIP server and a client. Unfortunately, that approach is
not compliant with the standard. The first compliant JPIP
proxy server was introduced in [20] employing re-sequencing
techniques similar to those of [17] to optimize the delivery of
data to the clients in the LAN.
As seen in the experiments reported in Section V, it is not
recommendable that the clients use prefetching individually
in the scenario of Fig. 1 because that might saturate the
Internet connection. None of the JPIP proxy servers proposed
in the literature employs prefetching strategies, either. So,
typically, the Internet connection {B,C} depicted in Fig. 1
2
Fig. 1: JPIP clients within a LAN share the same Internet
connection to browse images located in a remote JPIP server.
Data transmitted from the server to the clients is cached and
reused by a JPIP proxy server.
is left idle when users have retrieved the requested areas. The
purpose of this work is to introduce prefetching strategies in
the JPIP proxy server –rather than to each client– to enhance
the browsing experience of the clients within the LAN. The
JPIP proxy server proposed herein employs a rate-distortion
optimized algorithm that maximizes the responsiveness of the
whole system taking into account the current and (possible)
future areas requested by the clients. The functionality of the
proposed algorithm is the same if the proxy is introduced in
scenarios with a more complex topology than that of Fig. 1.
Prefetching is carried out only by the proxy when the Internet
connection is idle. Two strategies are put in practice to predict
the areas that the clients may request in the future. The first
employs a user-navigation model that has been extracted from
the logs collected by several image servers belonging to the
remote sensing community. The second strategy utilizes a
semantic map that prioritizes areas of the image depending on
their content. Experimental results report significant gains with
respect to classical client-server approaches and with respect to
conventional JPIP proxy servers without prefetching strategies.
The research of this paper extends our previous works [1], [2]
by describing a more accurate user-navigation model, the novel
semantic map-based prefetching strategy, and by providing
extended experimental results.
The paper is structured as follows. Section II reviews fun-
damentals concepts of the JPEG2000 core coding system, the
codestream organization, and the JPIP protocol. The architec-
ture and functionalities of the proposed JPIP proxy server are
described in Section III, whereas Section IV introduces the two
prefetching strategies proposed. The performance achieved by
our JPIP proxy server and other conventional transmission
strategies is assessed in Section V through experimental results
carried out for large remote sensing images. The last section
concludes this work with a brief summary and some remarks.
II. OVERVIEW OF JPEG2000 AND JPIP
The JPEG2000 core coding system is constituted by four
main coding stages [21]: sample data transformation, sample
data coding (tier-1), rate-distortion optimization, and code-
stream re-organization (tier-2). The first stage applies a wavelet
transform that decorrelates and decomposes the image in
successive levels of resolution. Then, the image is conceptually
partitioned in small sets of wavelet coefficients, called code-
blocks, that are coded by the tier-1 coding stage by means of
a bitplane coding engine. Tier-1 produces a quality embedded
bitstream for each codeblock that can be truncated at increas-
ing rates. The third stage of the coding system forms quality
layers using rate-distortion optimization techniques. A quality
layer is defined as a collection of bitstream segments from dif-
ferent codeblocks. Its transmission and/or decoding represents
an increment on the quality of the image. Commonly, the rate-
distortion optimization stage employs Lagrange optimization
to minimize the distortion at the target rates selected for the
quality layers and for the final codestream. To do so, first
the convex hull of individual codeblocks is established by
identifying those truncation points with strictly decreasing
distortion-rate slope. If dn and rn respectively denote the
distortion and the rate achieved at the truncation points of
the bitstream generated for a codeblock, the distortion-rate
slope is defined as sn =dn−1 − dnrn − rn−1
. Quality layers are then
formed selecting bitstream segments from the union of all
codeblocks with the highest distortion-rate slopes. Through
this process, each layer contains bitstream segments with equal
or higher distortion-rate slope than the threshold achieved for
that layer, which is referred to as Sq with 1 ≤ q ≤ Q,
Q denoting the number of layers of the codestream. The
last stage of the coding pipeline is the tier-2, which codes
auxiliary information. In this and following discussions we
assume that the image is not partitioned in tiles [21, Ch. 11.2]
since interactive transmission is commonly not benefited from
such partitions [5].
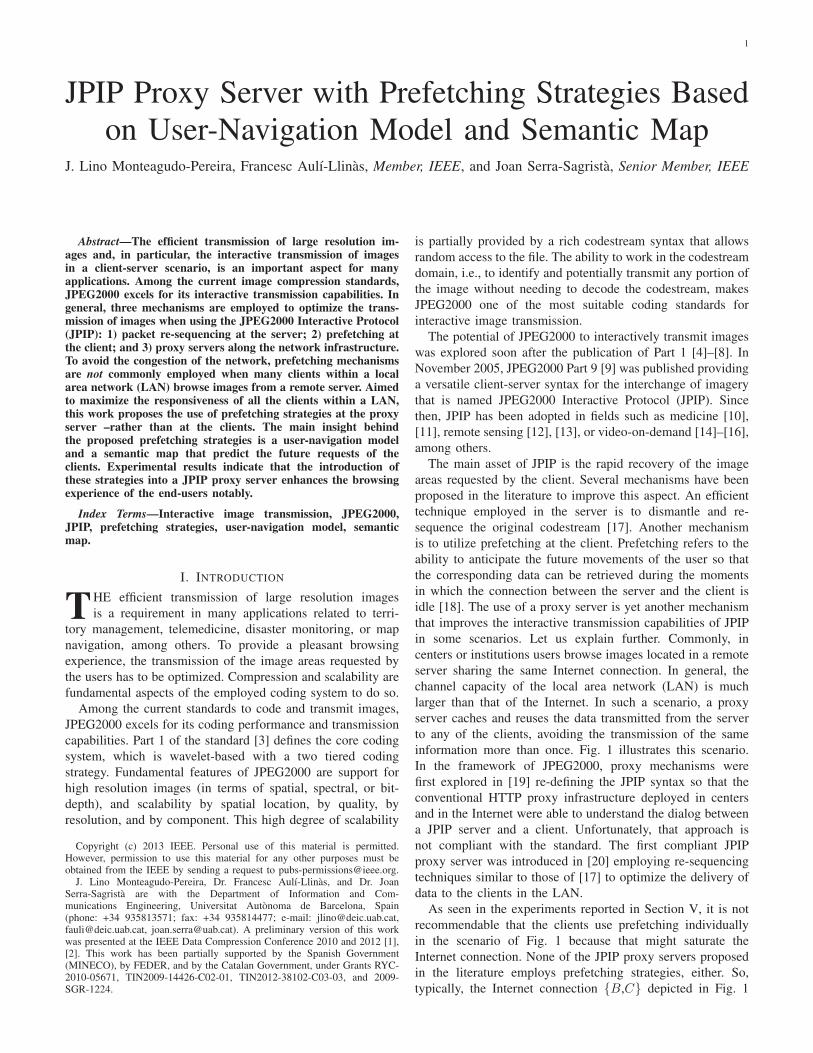
As depicted in Fig. 2, the JPEG2000 codestream is struc-
tured in containers. The smallest container is the packet,
which encapsulates segments of the bitstreams generated from
codeblocks that belong to the same component, resolution
level, and spatial area of the image, the so-called precinct. Data
produced for each precinct are distributed in as many packets
(some of them possibly null) as quality layers has the final
codestream. When the image is interactively transmitted, JPIP
servers generally dismantle the codestream into a collection of
data-bins that contain all packets belonging to one precinct.
When the client requests an image region, called window of
interest (WOI), the server identifies those data-bins containing
encoded data from that WOI and transmits segments of these
data-bins to the client. Rather than to interact directly with the
codestream, JPIP defines a versatile dialog between client and
server in which the client requests a WOI specifying spatial
location, resolution, and components on the image domain,
and the server identifies that WOI in the compressed domain.
Messages containing one or several segments of data-bins are
referred to as JPP-streams.
As mentioned above, an important issue that JPIP servers
contemplate is the delivery of data in an optimized fashion.
Let us denote the packets of the codestream as Tc,r,p,q , where
subindexes c, r, p, q identify the component, resolution level,
spatial location, and quality layer of the packet, respectively.
When the client requests a WOI, say W , the server identifies
the packets related to the WOI, which we denote as Tc,r,p,q ≻W , and determines adequate rates for JPP-streams transmitted
to the client.
To optimize the rate-distortion efficiency, the server com-
3
Fig. 2: Simplified overview of the JPEG2000 partitioning system, the organization of the codestream, and the data transmitted
by the JPIP server, proxy, and client.
monly selects packets according to the layer’s order, i.e., pack-
ets in first quality layers are transmitted first. Since W does not
typically match exactly with image precincts, [17] suggested
the application of a window scaling factor Fc,r,p ∈ (0, 1] that
accounts for the percentage of coefficients within that precinct
that are relevant to W . Through Fc,r,p, data is re-sequenced
and transmitted to the client according to artificial distortion-
rate slopes computed for individual packets as
S′
c,r,p,q = Sq · Fc,r,p. (1)
This re-sequenced packet ordering does not assure the min-
imization of distortion per transmitted unit since Sq is only
an approximation of the real distortion-rate slope for packet
Tc,r,p,q . The real distortion-rate slope of Tc,r,p,q is not stored
in the codestream because it requires a significant rate and is
not necessary to decode the image. This poses an issue that
has been approached in the literature from different points of
view [14], [17], [18], [22], [23]. As reported in these works,
the use of Sq in Equation 1 provides near optimal performance
in practice. As common, we assume that values for Sq are
recorded in the codestream.
All data transmitted by the server is cached by the client.
The server can maintain a model of the client’s cache to avoid
the retransmission of the same data. In this case the connection
is named stateful. When the server does not maintain the model
of the client’s cache, the client may include a description of its
cache when requesting WOIs. In this case, the connection is
named stateless. Of the two, stateful connections are more con-
venient to minimize the transmission of side information [24].
III. PROPOSED JPIP PROXY SERVER
A. System architecture
The proposed JPIP proxy server maintains the full set of
JPIP features, keeping compliance with the standard. The main
ability of the proxy is to understand the JPIP protocol so
that it can dismantle and cache the JPP-streams transmitted
by the server as a collection of data-bins (see Fig. 2). These
data-bins are associated to packets in the codestream and to
precincts in the image domain, which allows their optimized
re-sequencing to respond the clients’ requests. To replace the
server efficiently, the JPIP proxy also maintains a model of
the clients’ cache to allow stateful connections.
As observed by many authors [18], [25], [26], there exists
a delay between the emission of data by the server and the
feedback provided by the user before requesting a new WOI.
This delay includes the transmission time, decoding latency,
and the time that the user needs to interpret newly received
visual information. During this time, the connection between
the client and the server is idle. As stated before, idle moments
can be employed to prefetch data that may be requested in the
future by the client(s). In the scenario of Fig. 1, prefetching
should not be directly applied to all clients within a LAN as
formulated in [18] because the joint transmission of WOIs
that are in current use, with WOIs that might possibly be
required, could cause the assignment of the available channel
resources to useless queries, providing negligible gains on the
overall system performance, as is experimentally demonstrated
in Section V.
Our approach introduces prefetching strategies in the JPIP
proxy server combining techniques of rate-distortion optimiza-
tion with a model of probabilities that predicts the next users’
movements. The proxy provides prefetching to all clients
4
within the LAN simultaneously. The proposed proxy server
has two modes of operation: normal and prefetching. The
normal mode is active when at least one client requests a
WOI that is not fully contained in the proxy’s cache. The
prefetching mode is active when all client’s petitions can be
responded with the cached data, and so the connection between
the proxy and the server is idle.
The functions that are carried out by the proxy server when
it is in normal mode are similar to those of a conventional
proxy [20]. When a client within the LAN requests a WOI
to the JPIP proxy server (link Ak in Fig. 1), the proxy
checks whether that WOI is contained in its cache or not.
In the case that there are no data-bins belonging to the
requested WOI in the cache, the proxy sends the petition
to the server (connection {B,C}), and responds to the client
caching all data transmitted from the server. In the case that the
WOI is partially contained in the cache, the proxy transmits
cached data to the client and, simultaneously, re-formulates
the petition to the server requesting non-cached data. In the
case that the WOI is totally contained in the cache, the proxy
responds to the client transmitting JPP-streams (link Dk).
Evidently, the proxy can handle more than one request at the
same time, so this procedure is executed in parallel for all
concurrent requests.
To minimize the interchange of image data between the
proxy and the server when the proxy is in normal mode,
WOIs requested to the server are re-formulated. Rather than
including several areas demanded by clients as in [20], our
proxy requests specific WOIs one by one in the order that
maximizes the overall system’s performance. Let us extend the
notation of the previous section to denote the WOIs currently
requested by the clients as Wk, with 1 ≤ k ≤ K, K being the
number of active clients. In normal mode, the proxy computes
artificial distortion-rate slopes S′′
c,r,p,q for packets considering
all clients browsing the same image according to
S′′
c,r,p,q = Sq · F′
c,r,p ·1
K
∑
k
δ(Tc,r,p,q, k) ∀ c, r, p, q , (2)
with
δ(Tc,r,p,q, k) =
{
1 if Tc,r,p,q ≻ Wk
0 otherwise. (3)
δ(Tc,r,p,q, k) is a binary function that ascertains whether packet
Tc,r,p,q is necessary to serve the current WOI Wk requested
by client k. When a packet is necessary to serve the WOIs
from all the clients,1
K
∑
k
δ(Tc,r,p,q, k) in (2) results in
1. Otherwise, it results in the fraction of clients requesting
that packet. F ′
c,r,p ∈ (0, 1] in Equation (2) accounts for the
percentage of coefficients in the precinct that are relevant to
the WOIs of all clients. We note that S′′
c,r,p,q is computed for
all the packets of the codestream.
Packets are requested by the proxy in decreasing order of
S′′
c,r,p,q. This strategy maximizes the overall system’s perfor-
mance since the highest S′′
c,r,p,q corresponds to that packet
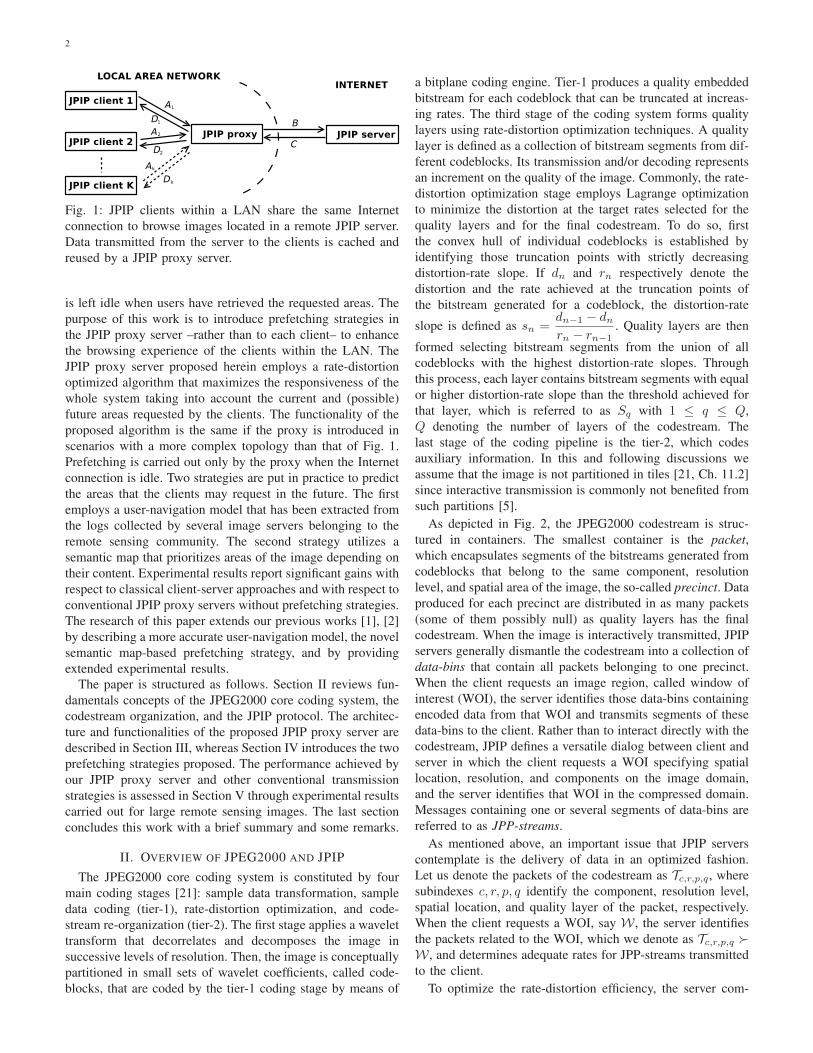
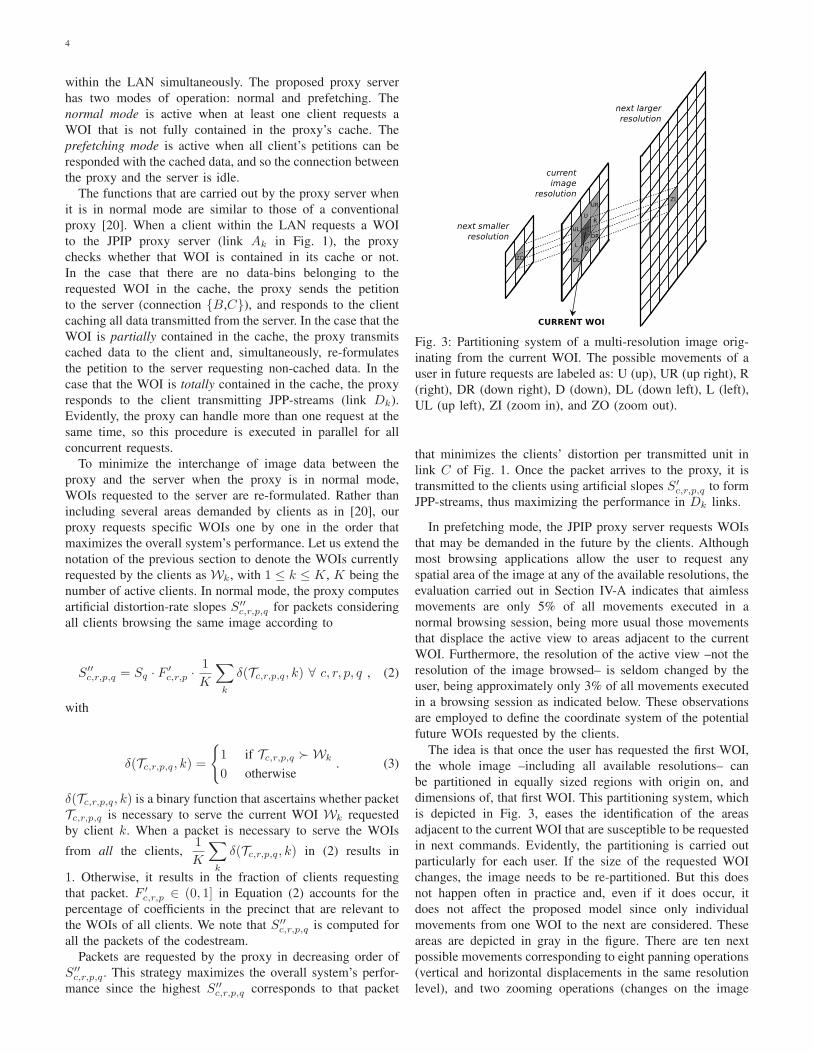
Fig. 3: Partitioning system of a multi-resolution image orig-
inating from the current WOI. The possible movements of a
user in future requests are labeled as: U (up), UR (up right), R
(right), DR (down right), D (down), DL (down left), L (left),
UL (up left), ZI (zoom in), and ZO (zoom out).
that minimizes the clients’ distortion per transmitted unit in
link C of Fig. 1. Once the packet arrives to the proxy, it is
transmitted to the clients using artificial slopes S′
c,r,p,q to form
JPP-streams, thus maximizing the performance in Dk links.
In prefetching mode, the JPIP proxy server requests WOIs
that may be demanded in the future by the clients. Although
most browsing applications allow the user to request any
spatial area of the image at any of the available resolutions, the
evaluation carried out in Section IV-A indicates that aimless
movements are only 5% of all movements executed in a
normal browsing session, being more usual those movements
that displace the active view to areas adjacent to the current
WOI. Furthermore, the resolution of the active view –not the
resolution of the image browsed– is seldom changed by the
user, being approximately only 3% of all movements executed
in a browsing session as indicated below. These observations
are employed to define the coordinate system of the potential
future WOIs requested by the clients.
The idea is that once the user has requested the first WOI,
the whole image –including all available resolutions– can
be partitioned in equally sized regions with origin on, and
dimensions of, that first WOI. This partitioning system, which
is depicted in Fig. 3, eases the identification of the areas
adjacent to the current WOI that are susceptible to be requested
in next commands. Evidently, the partitioning is carried out
particularly for each user. If the size of the requested WOI
changes, the image needs to be re-partitioned. But this does
not happen often in practice and, even if it does occur, it
does not affect the proposed model since only individual
movements from one WOI to the next are considered. These
areas are depicted in gray in the figure. There are ten next
possible movements corresponding to eight panning operations
(vertical and horizontal displacements in the same resolution
level), and two zooming operations (changes on the image
5
resolution). We note that the “zoom in” operation may consider
not only the central region of the current WOI in the next
larger resolution (as it is depicted in Fig. 3) but all regions at
the larger resolution level that correspond to the current WOI.
Our partitioning system considers only the central region due
to the empirical observations reported in Section IV-A indicate
that that is the most frequent “zoom in” operation carried out
by users.
The movements carried out by the user are denoted as
X , with X = { up | up right | right | down right | down
| down left | left | up left | zoom in | zoom out }. The WOIs
that the clients can request in the future are defined as a
function of the current WOI Wk and a user movement Xas f(Wk, X). Evidently, f(·) always returns a WOI side by
side Wk (including different resolutions) since X is defined
only as adjacent movements. When the JPIP proxy server is
in prefetching mode, artificial distortion-rate slopes S′′′
c,r,p,q are
computed as
S′′′
c,r,p,q = Sq · F′
c,r,p ·1
K
∑
k
δ′(Tc,r,p,q, k) ∀ c, r, p, q , (4)
with
δ′(Tc,r,p,q, k) =∑
X
{
P (X) if Tc,r,p,q ≻ f(Wk, X)
0 otherwise. (5)
Equation (4) is equal to (2) except for the use of δ′(·). δ′(·)is a function that returns the probability of packet Tc,r,p,q to
be requested by client k in future movements. The summation
in Equation (5) accounts for the probabilities of all possible
future movements of the client with regard to that packet.
P (X) in (5) is the probability that the user executes the
movement in future requests. It is determined through the
strategies described in the next section. When the proxy is
in prefetching mode, it requests WOIs in decreasing order
of S′′′
c,r,p,q and caches the response hoping that future user
movements will request prefetched data. Prefetched data are
kept in cache even when the prediction fails because other
users may browse that area of the image in future requests.
Briefly summarized, the functions carried out by the JPIP
proxy server are the delivery of data to the clients through links
Dk using S′
c,r,p,q, and the requesting of WOIs to the server
through link B using S′′
c,r,p,q when the proxy is in normal
mode, and using S′′′
c,r,p,q when the proxy is in prefetching
mode. As in [17], [20], strict optimal performance is not
guaranteed due to the use of artificial distortion-rate slope for
packets.
B. Implementation considerations
Some considerations have to be taken into account to
implement the proposed JPIP proxy server:
• The connection {B,C} between proxy and server must
use the JPIP options ALIGN and AUX. ALIGN forces
the JPIP server to deliver non-segmented packets, which
is required by the proxy to identify individual packets
Tc,r,p,q without needing to decode data. AUX forces the
JPIP server to include a field that specifies the layers to
which packets belong to. These options are not required
in links Ak, Dk.
• The JPIP proxy server requests WOIs (link B) specifying
the number of layers through the JPIP option LAYERS.
This is mandatory to force the server to transmit a specific
number of layers for the requested precinct. Note that
this blocks any rate control mechanism used in the server
to transmit data, intentionally leaving the control to the
proxy. Although this causes requests of multiple WOIs in
a short period of time, the results reported in Section V in-
dicate that this strategy does not saturate the network link
to the server, working efficiently in practice. To force the
server to complete the transmission of requested WOIs,
the proxy must include the parameter WAIT in requests.
This assures that the delivery of packets is carried out
as intended by the proxy and that transmissions are not
interrupted as more requests arrive to the server.
• We assume that values for Sq are available to the proxy
through their transmission in COM markers of the code-
stream, or through rough estimations as described in [27].
• As seen in Fig. 1, the server sees the proxy as a single
client, thus the use of a stateful connection is highly rec-
ommended in connection {B,C}. Connections between
the proxy and clients can be stateless.
• The operations carried out by the proxy do not entail the
re-encoding of any part of the codestream, so the system
can be escalated with the proxy handling many clients
simultaneously [20].
• The administration of the LAN must consider that a
failure in the proxy server is critic since it leaves all
clients without connection. This may be solved using a
high availability cluster, for example.
IV. PREFETCHING STRATEGIES
The goal of the JPIP proxy server when it is in prefetching
mode is to optimize the responsiveness of all clients. Key
to achieve this goal is to foresee the WOIs that are more
likely to be requested by the clients. The objective is then
to obtain a precise model for probabilities P (X) employed in
Equation (5). Two approaches are used. The first is based on
a user-navigation model that captures the common behavior
of users when navigating on an image. The second approach
utilizes the content of the image to predict the probability of
an image area to be visited more or less frequently. The former
approach can be employed when the content of the image is
not known or when it is too arduous to determine, whereas
the latter can be employed otherwise.
A. User-navigation model
The user-navigation model is described first. The main
insight behind this approach is to observe the chain of move-
ments carried out by users when navigating on an image.
The individual probabilities of the 10 movements defined in
Fig. 3 are obtained as follows. The first step was to record
WOIs requested by clients when browsing four large resolution
6
5%
10%
15%
20%
25%
up up rightrightdow
n rightdow
ndow
n leftleftup leftzoom
inzoom
out
P(X
)
(a)
5%
10%
15%
20%
25%
up up rightrightdow
n rightdow
ndow
n leftleftup leftzoom
inzoom
out
P(X
)(b)
5%
10%
15%
20%
25%
up up rightrightdow
n rightdow
ndow
n leftleftup leftzoom
inzoom
out
P(X
)
(c)
5%
10%
15%
20%
25%
up up rightrightdow
n rightdow
ndow
n leftleftup leftzoom
inzoom
out
P(X
)
(d)
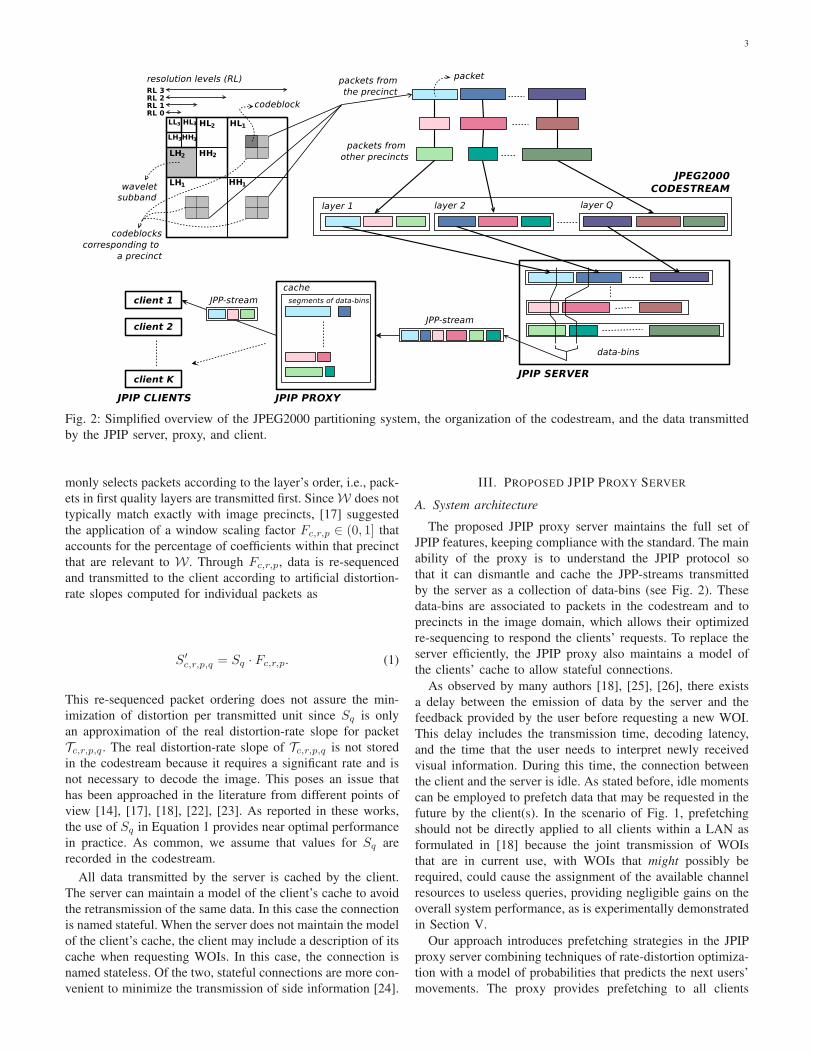
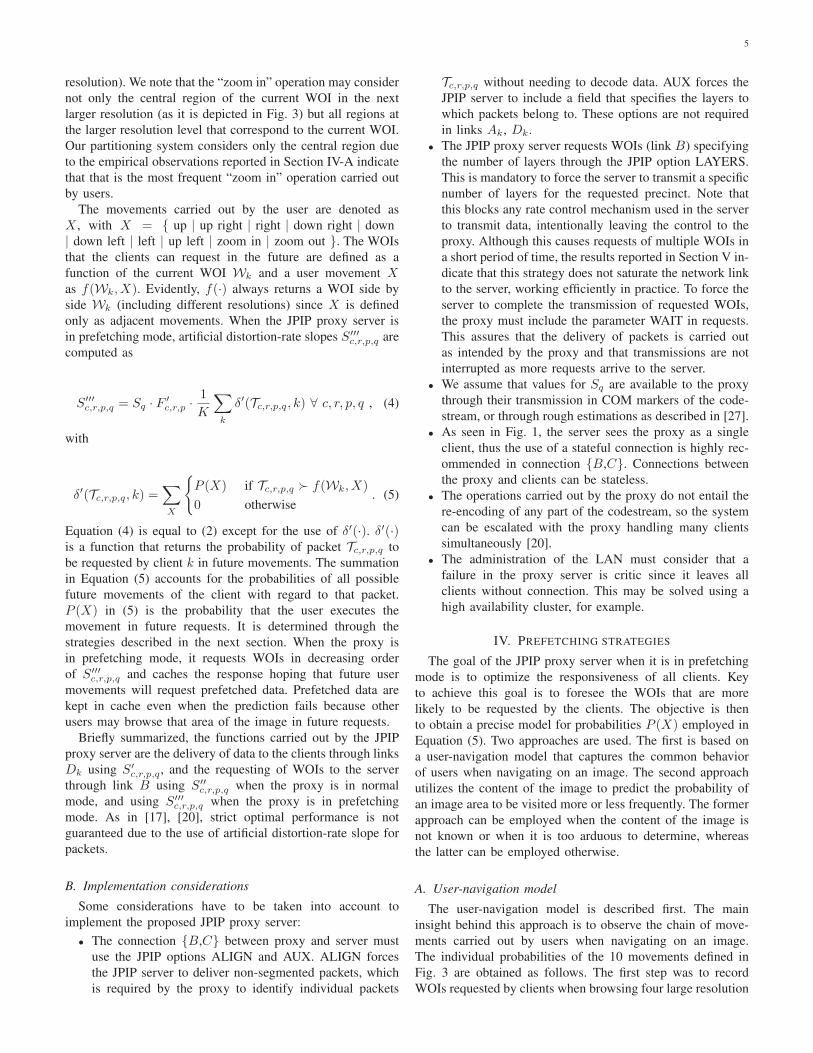
Fig. 4: Evaluation of the movements carried out by users when navigating on the images of the remote sensing corpus (a)
“Barcelona” 1629 sessions, (b) “Girona” 1203 sessions, (c) “Lleida” 923 sessions, and (d) “Catalunya” 228016 sessions.
images during a period of approximately 3 years. Images
employed in this experiment are referred to as “Barcelona”,
“Girona”, “Lleida”, and “Catalunya”, and are available with
a large variety of resolution sizes in the server. The size of
the largest resolution is approximately 13000×13000 pixels.
The images belong to the remote sensing community and
cover large areas of Catalunya (a region of Spain). They are
browsed through MiraMon, which is a popular remote sensing
application developed by CREAF [28]. In general, the size of
the user’s view is set to 800×600 pixels in this application.
To analyze only browsing commands relevant to our pur-
poses, the second step of this analysis is to identify the so-
called sessions in the logs gathered by the server. One session
collects all commands executed by one client considering a
maximum time interval of 30 minutes between consecutive
requests. If two consecutive commands are delayed in more
than 30 minutes, they are considered as two different sessions.
This time window gives spare time to the user to receive and
observe the requested WOI. Only sessions with more than
three movements are considered; the remaining are irrelevant
to our purposes and are discarded. In total, the selected
sessions accumulate 1629, 1203, 923, and 228016 client re-
quests for “Barcelona”, “Girona”, “Lleida”, and “Catalunya”,
respectively.
The third step of the analysis is to translate the rele-
vant WOI requests into the ten movements defined by X .
Movements that do not correspond to any of these categories
represent less than 8% of all requests analyzed and are
discarded. The discarded movements correspond to changes
on the resolution of the active view, or aimless movements.
On average, the number of movements in each session is
approximately 13. The average time that the users spend
on a browsing session is 7 minutes, approximately. The
probability of user movements (i.e., P (X)) is determined for
each image considering all commands of all sessions. Fig. 4
reports the individual probabilities achieved for P (X), for
the four images. Results suggest that users navigate similarly
on images “Barcelona”, “Girona”, and “Lleida”. For these
images, the navigational commands that are most frequent
correspond to the zooming operations, which have a prob-
ability of 40% to be executed, approximately. There is no
significant difference between “zoom in” and “zoom out”. The
remaining movements corresponding to panning operations
present slight differences among the three images, though they
are not significant. Our experience indicates that P ′(X) =20% when X = {zoom in | zoom out} and P ′(X) =7.5% when X = { up | up right | right | down right | down |down left | left | up left } is a model that, in this context,
captures well the behavior of most users browsing an image.
Finer adjustment of these probabilities does not seem to
improve performance significantly. The use of conditional
probabilities considering the last movement of the user to
predict the next one (not shown in the figures) does not provide
any significant gain either.
The experimental results reported in Fig. 4(d) for
“Catalunya” suggest that the users have a slightly differ-
ent behavior when navigating on this image. The main
difference compared with the previous images is that the
users move more frequently downward than upward. More
precisely, the probability of panning movements X ={ down right | down | down left } is 22% against the 17%achieved for X = { up left | up | up right }. Such a differ-
ence is only found in this image. It is caused due to the
positioning of the first WOI, which is fixed by the server at the
top of the image. This compels most users to reach their areas
of interest moving downward. Also, the zooming operations
carried out on this image have a slightly higher probability of
being executed than that found in the previous three images.
This may be caused due to the high spatial resolution available
for this image, which reaches 10 meters per pixel at the highest
resolution level. This may trigger the curiosity of the users
to zoom in and out more frequently to explore the requested
areas in more detail. As seen in Section V, a slight increment
on performance is achieved for this image when probabil-
ities P (X) correspond to those reported in Fig. 4(d) (i.e.,
P ′′(X) = {7.7% | 6.6% | 6.2% | 2.9% | 12.6% | 5.9% | 7% |3.3% | 25.7% | 22.3%} in the movement order reported in the
figure). We remark that these observations result in a slight
change in the model that has little impact on the performance
of the system. The user-navigation models employing P ′(X)and P ′′(X) mainly describe the same underlying user behav-
ior.
The user-navigation model determined in this analysis is
valid for applications that transmit interactively remote sensing
7
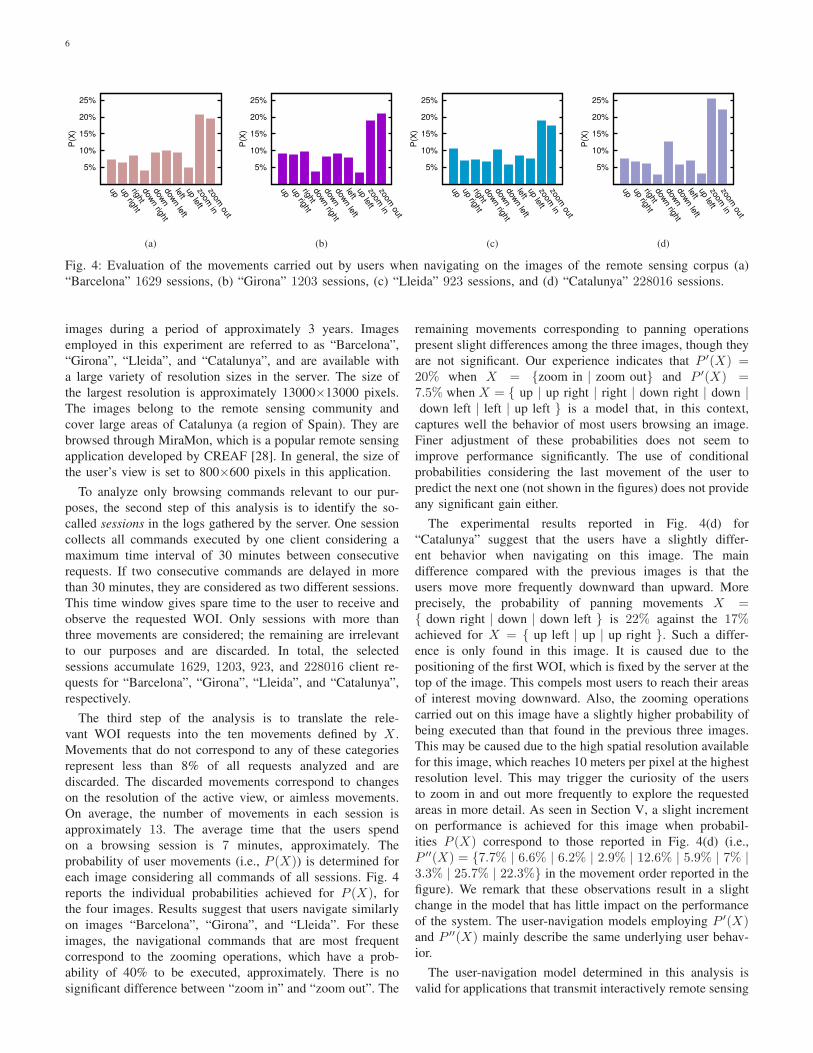
Fig. 5: Semantic map and precincts employed for the “Port-au-Prince city” image (see the details of this image in Section V).
The semantic regions are delimited in red. The label on each region indicates its priority, which is denoted as M and is
determined depending on the content of the image. The areas corresponding to the city center and its surroundings have the
highest priorities, whereas the forest and the sea have lower priorities. The white lines forming the grid correspond to the
JPEG2000 precincts of resolution level 3 (resolution level 0 and 5 are the smallest and the largest, respectively).
images of high resolution. Other applications that transmit
images with different particularities and/or users behaving
differently may require different models. The methodology de-
scribed above can be employed in other scenarios to determine
suitable user-navigation models for them.
B. Semantic map
The content of the image is also a good indicator for the
probability of an area to be visited. This observation has
been used recently by the remote sensing community with the
aim to optimize the computational resources of a web map
server [26]. To the best of our knowledge, such an approach
has never been employed in the framework of JPIP. The main
idea is to assign high probabilities to those movements that
displace the WOI to image areas whose contents are more
appealing to the user. This strategy is implemented in the JPIP
proxy server as follows. First, the image is partitioned in re-
gions containing different types of content. In a remote sensing
image, these regions may correspond to cities, roads, seas, or
deserted areas, for instance. As stated in [26], each type of
region has a different chance to be visited. Cities are more
commonly browsed by users than deserted areas, for example.
So selected priorities are assigned to each region type. The
higher the priority, the higher the chance that that image area
is visited. Depending on how this operation is implemented, it
may require the supervision of an expert in the field, or the use
of other techniques such as classification [29]. It is important
to employ accurate methods of supervision/classification since
otherwise the performance of the system may be penalized.
The selected regions together with their priorities form the
so-called semantic map. The semantic map is employed to
obtain individual priorities for packets. As described above,
packets Tc,r,p,q are quality increments corresponding to the
precinct of component c, resolution level r, and spatial location
p. Fig. 5 illustrates the relation between the semantic map and
the precincts of one resolution level of an image employed
in the experimental tests of the next section. As seen in the
figure, each precinct may be contained in one or more semantic
regions. When a precinct is fully contained in one region,
the priority of that region is assigned to all packets of that
precinct. When a precinct is partially contained in more than
one region, the priority for packets of that precinct is computed
as a weighted average among the regions to which it belongs.
More precisely, probabilities P (X) employed in Equation (5)
are determined according to
P ′′′(X) =δ′′(Tc,r,p,q, X)
∑
X′
δ′′(Tc,r,p,q, X′)
, (6)
with
δ′′(Tc,r,p,q, X) =
∑
s
F ′′
c,r,p,e ·Mc,r,p,e if Tc,r,p,q ≻ f(Wk, X)
0 otherwise
.
(7)
8
δ′′(·) is a function that returns the priority assigned through
the semantic map to packet Tc,r,p,q when the user executes
movement X . When the packet is related to WOI Wk, this
priority is computed in Equation (7) as∑
s
F ′′
c,r,p,e ·Mc,r,p,e.
Mc,r,p,e, with 1 ≤ e ≤ E, denotes the priorities of the
E semantic regions that correspond to the precinct located
at c, r, p. F ′′
c,r,p,e accounts for the percentage of coefficients
within the precinct located at c, r, p that are relevant to the
semantic region e. Equation (6) computes P (X) as the priority
of movement X divided by the summation of priorities of all
possible movements.
V. EXPERIMENTAL RESULTS
All the infrastructure used to evaluate the proposed method,
including the client, the server, and the JPIP proxy server are
implemented in our JPEG2000 Part 9 implementation CADI
[30]. Experiments are carried out in a LAN with a channel
capacity of 100 Mbps and a connection to the Internet shared
by all clients with a channel capacity of 10 Mbps. The images
employed in the experiments are two satellite images from
GeoEye Inc. that were provided to help missions responding to
the earthquake that struck Haiti in 2010. Our aim is that rescue
teams in similar situations employ the proposed mechanisms
to enhance their transmission infrastructure. The images cover
areas of Port-au-Prince and its surroundings, are referred to
as “Port-au-Prince airport” and “Port-au-Prince city”, and are
8-bit gray scale with size 32768×19456 and 31744×20480,
respectively. The 8-bit gray scale Landsat image “Catalunya”
utilized in Section IV-A is also employed in the experiments. It
is provided by CREAF and has a size of 13561×13161. These
images are compressed with JPEG2000 using the following
coding parameters: 5 levels of irreversible CDF 9/7 wavelet
transform, codeblock size of 64×64, restart coding variation,
and 25 quality layers logarithmically spaced in terms of bitrate.
The server adjusts on-the-fly the precinct size in all resolution
levels according to the codeblock size to enhance interactivity
options.
Results are obtained when four or five users browse an im-
age simultaneously. Eight transmission strategies are evaluated
along the following experiments:
1) Client-server: the image transmission is carried out
without using any proxy infrastructure.
2) Client-server with prefetching at the clients: the image
transmission is carried out without using any proxy
infrastructure, and prefetching is employed individually
at each client.
3) Conventional JPIP proxy: all data transmitted between
the server and the clients are cached by a proxy that
reuses already transmitted packets. This strategy is (al-
most) equivalent to that introduced in [20].
4) Conventional JPIP proxy with prefetching at the clients:
prefetching is employed individually at each client and
all data transmitted between the server and the clients
are cached by a proxy.
5) JPIP proxy with simple prefetching: this strategy uses the
proxy described in Section III but employing a uniform
model of probabilities for the prefetching mode, i.e.,
P (X) = 1/10 ∀ X . This strategy was introduced in our
previous work [1]. Here, it serves to appraise the gain
that is achieved when prefetching is carried out employ-
ing the probability models described in Section IV.
6) JPIP proxy with prefetching based on the user-
navigation model: this strategy uses the proxy described
in Section III with prefetching based on the user-
navigation model described in Section IV-A. Employed
probabilities are P ′(X) or P ′′(X) as indicated.
7) JPIP proxy with prefetching based on the user-
navigation model and Quality of Service (QoS) consider-
ations: this strategy is as the previous one except for the
consideration of clients that may have a higher priority
during the prefetching mode of the proxy (see below).
8) JPIP proxy with prefetching based on the semantic map:
this strategy uses the proxy described in Section III
with prefetching based on the semantic map described
in Section IV-B. Employed probabilities are P ′′′(X).
The results are reported for these strategies when the clients
execute their browsing sessions identically. Evidently, each
client browse different areas of the image, but the same chain
of movements is reproduced by each client when evaluating
different strategies. The chain of movements selected for each
user corresponds to typical browsing sessions exploring areas
of an image. We allow users to perform up to 13 movements
during a session that lasts 7 minutes approximately. This is a
behavior typically observed in browsing sessions, as described
in Section IV-A.
Fig. 6 reports the results achieved when four clients browse
the “Port-au-Prince airport” image. The vertical axis of these
and following figures is the quality of the retrieved WOI, in
terms of Peak Signal to Noise Ratio (PSNR). The horizontal
axis is the browsing session time. Only three representative
WOIs selected for each client are reported in these figures for
the sake of clarity. The WOIs correspond to three consecutive
movements of the user and are selected to illustrate the behav-
ior of each strategy. Similar results hold for the remaining –not
reported– WOIs. To enhance the presentation, the horizontal
axes of the figures are broken between WOIs. All plots starting
from the same point, approximately, correspond to the same
WOI retrieved by the client. WOIs are decoded at the end
of each quality layer, hence, the quality achieved by all
strategies when decoding the same WOI is equal, changing
only the instant of time at which the layer is completely
available at the client. Fig. 6 reports results for five of the
strategies described before, namely, client-server, conventional
JPIP proxy, JPIP proxy with simple prefetching, JPIP proxy
with prefetching based on the user-navigation model, and JPIP
proxy with prefetching based on the user-navigation model and
QoS considerations.
In general, the WOIs requested by the clients at the
beginning of their sessions are recovered similarly by all
strategies since there are no data in the cache of the proxy.
See, for instance, in Fig. 6(c) that all transmission strategies
recover WOI 2 of client 3 at the same pace. As the browsing
session advances, transmission strategies that employ proxy
infrastructure recover WOIs more rapidly than the client-server
strategy due to data already transmitted for other clients can
9
25
30
35
40
45
50
55
60
65
250 255 260 265
session time (in seconds)
PS
NR
(in
dB
)
client-serverconventional proxy [20]prefetching proxy (simple) [1]prefetching proxy (user-nav with P’(X))prefetching proxy (user-nav with P’(X) and QoS) - premium client
315 320 325 330 380 385 390 395
(a)
25
30
35
40
45
50
55
60
160 165
session time (in seconds)
PS
NR
(in
dB
)
client-serverconventional proxy [20]prefetching proxy (simple) [1]prefetching proxy (user-nav with P’(X))prefetching proxy (user-nav with P’(X) and QoS) - NON-premium client
205 210 215 255 260 265
(b)
25
30
35
40
45
50
80 85
session time (in seconds)
PS
NR
(in
dB
)
client-serverconventional proxy [20]prefetching proxy (simple) [1]prefetching proxy (user-nav with P’(X))prefetching proxy (user-nav with P’(X) and QoS) - NON-premium client
120 125 130 165 170 175
(c)
25
30
35
40
45
50
55
60
285 290 295
session time (in seconds)
PS
NR
(in
dB
)
client-serverconventional proxy [20]prefetching proxy (simple) [1]prefetching proxy (user-nav with P’(X))prefetching proxy (user-nav with P’(X) and QoS) - NON-premium client
340 345 350 355 415 420 425
(d)
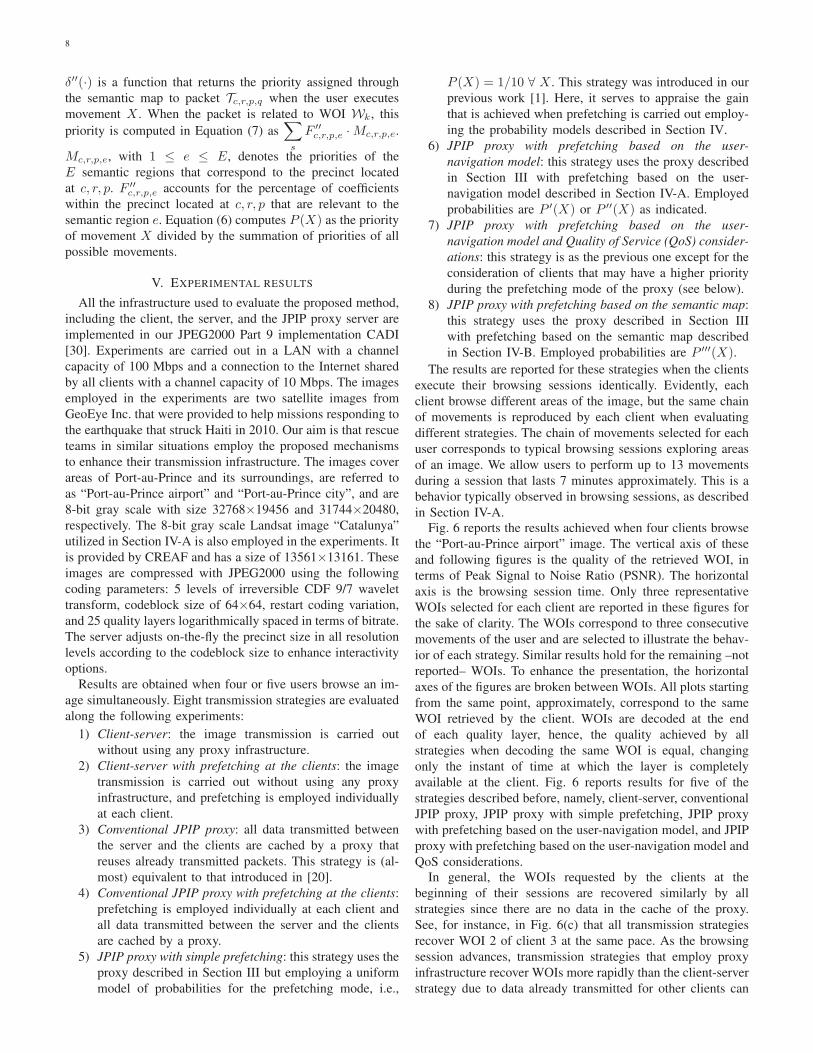
Fig. 6: Evaluation of the performance achieved by a proxy server with a prefetching strategy based on a user-navigation model
compared to three other strategies. The image browsed is “Port-au-Prince airport”. The following WOIs are reported: (a) 5, 6,
and 7 from client 1; (b) 5, 6, and 7 from client 2; (c) 2, 3, and 4 from client 3; and (d) 6, 7, and 8 from client 4.
be reused. This is seen in WOIs 3 and 4 requested by client
3 (Fig. 6(c)). Although it is not usual, in some occasions a
WOI requested in the middle, or at the end, of a session is
also recovered by all strategies similarly. See, for instance,
WOI 6 requested by client 4 in Fig. 6(d). This happens only
when the user moves to an area that was neither browsed by
other clients nor prefetched by the proxy. As seen in Fig. 6,
the most typical behavior is that the proxy using prefetching
strategies based on the user-navigation model serves the WOI
more rapidly than the other strategies. Note, for example, that
the last WOI reported in Fig. 6(a) is delivered by our proxy
to the client almost 10 seconds before all other transmission
strategies. The differences between the conventional proxy and
the proxies using prefetching become evident after the second
minute of the session (not shown in the figure), approximately,
since there have been enough idle moments to prefetch more
data from the server. As seen in the figure, the differences
are relevant for some WOIs (e.g., second and third WOI
reported in Fig. 6(d)). It is also worth noting the improvement
on performance achieved when the prefetching is carried out
employing the user-navigation instead of uniform probabilities.
For all WOIs reported in Fig. 6, to prefetch data employing the
user-navigation model achieves equal or superior performance
than when prefetching employs uniform probabilities. This
demonstrates the superiority of the prefetching strategy based
on the user-navigation model.
The proposed scheme to prefetch data also allows that one
(group of) client(s) is served with a higher quality than the
others. This mechanism is commonly referred to as QoS. In
this context QoS is devised so that some of the JPIP clients
have a higher priority during the prefetching mode than the
others. The objective is to provide better responsiveness to
some premium clients of the LAN. The framework deployed
by the proposed JPIP proxy server allows the introduction of
QoS by multiplying the probability P (X) of the potential
future WOIs requested by the client with premium service
by a factor selected depending on the service that the client
requires. See, for example, in Fig. 6(a) the results achieved
when the probabilities of client 1 are multiplied by a factor of
4. The WOIs requested by this client are, in general, already
in the cache of the proxy when it requires them, so they are
delivered to the client almost instantly. Evidently, this degrades
the responsiveness for some of the other clients because
the proxy may not prefetch data for them. QoS strategies
such as these may be useful in pay-per-service scenarios or
emergencies in which a rescue team is in a critical situation.
The results achieved by the proxy server using the simple
prefetching (i.e., that with uniform probabilities) are not re-
ported in the following figures to avoid cluttering them, though
similar results as those reported in Fig. 6 hold.
Fig. 7 reports the results achieved when five clients browse
the “Catalunya” image. We recall that –only for this image–
the first WOI transmitted by the server is situated at the
top of the image. Results are reported for the proxy using
the prefetching strategies based on the user-navigation model
that employs probabilities P ′(X) and P ′′(X). We recall that
probabilities P ′′(X) correspond to those reported in Fig. 4(d).
Results for the the client-server strategy and the conventional
proxy are also reported in this figure. Again, the experimental
results indicate that proxy servers that employ prefetching
10
15
20
25
30
35
40
45
50
55
60
280 285 290 295
session time (in seconds)
PS
NR
(in
dB
)
client-serverconventional proxy [20]prefetching proxy (user-nav with P’(X))prefetching proxy (user-nav with P’’(X))
320 325 330 335 380 385 390
(a)
20
25
30
35
40
45
50
55
60
285 290
session time (in seconds)
PS
NR
(in
dB
)
client-serverconventional proxy [20]prefetching proxy (user-nav with P’(X))prefetching proxy (user-nav with P’’(X))
335 340 380 385 390
(b)
18
20
22
24
26
28
30
66 68
session time (in seconds)
PS
NR
(in
dB
)
client-serverconventional proxy [20]prefetching proxy (user-nav with P’(X))prefetching proxy (user-nav with P’’(X))
109 111 145 150
(c)
20
30
40
50
60
245 250 255 260
session time (in seconds)
PS
NR
(in
dB
)
client-serverconventional proxy [20]prefetching proxy (user-nav with P’(X))prefetching proxy (user-nav with P’’(X))
285 290 295 300 305 310 355 360 365 370
(d)
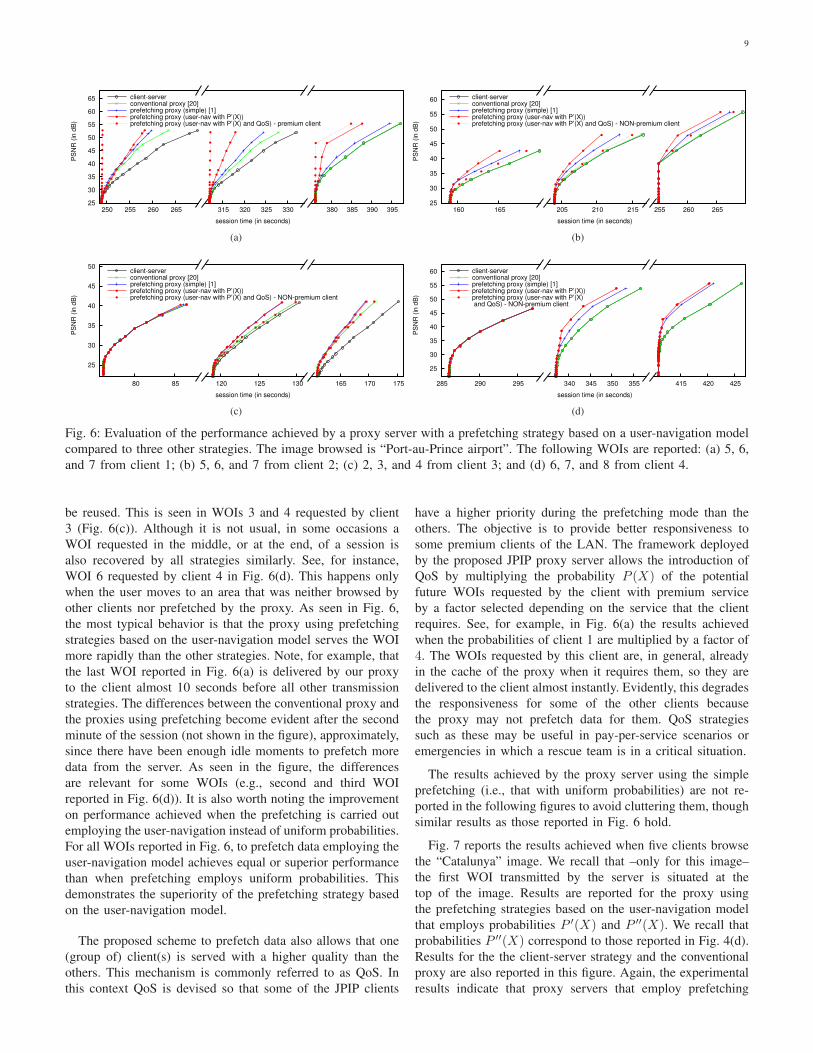
Fig. 7: Evaluation of the performance achieved by a proxy server with a prefetching strategy based on a user-navigation model
extracted for the image “Catalunya” compared to three other strategies. The following WOIs are reported: (a) 8, 9, and 10
from client 1; (b) 7, 8, and 9 from client 2; (c) 2, 3, and 4 from client 4; and (d) 7, 8, and 9 from client 5.
strategies deliver WOIs to clients more rapidly than a con-
ventional proxy server or a client-server strategy. The use of
probabilities that have a major incidence on movements that
go downward (i.e., P ′′(X)) permits the recovery of WOIs
slightly faster than when probabilities of the user-navigation
model are more generic (i.e., P ′(X)). For the WOIs reported
in this figure, the difference between these two prefetching
strategies is two seconds, at most. These results suggest
that the responsiveness of clients can be enhanced by using
a specific probability model for images whose first WOI
transmitted is not at the center of the image, though the gains
achieved when doing so are modest.
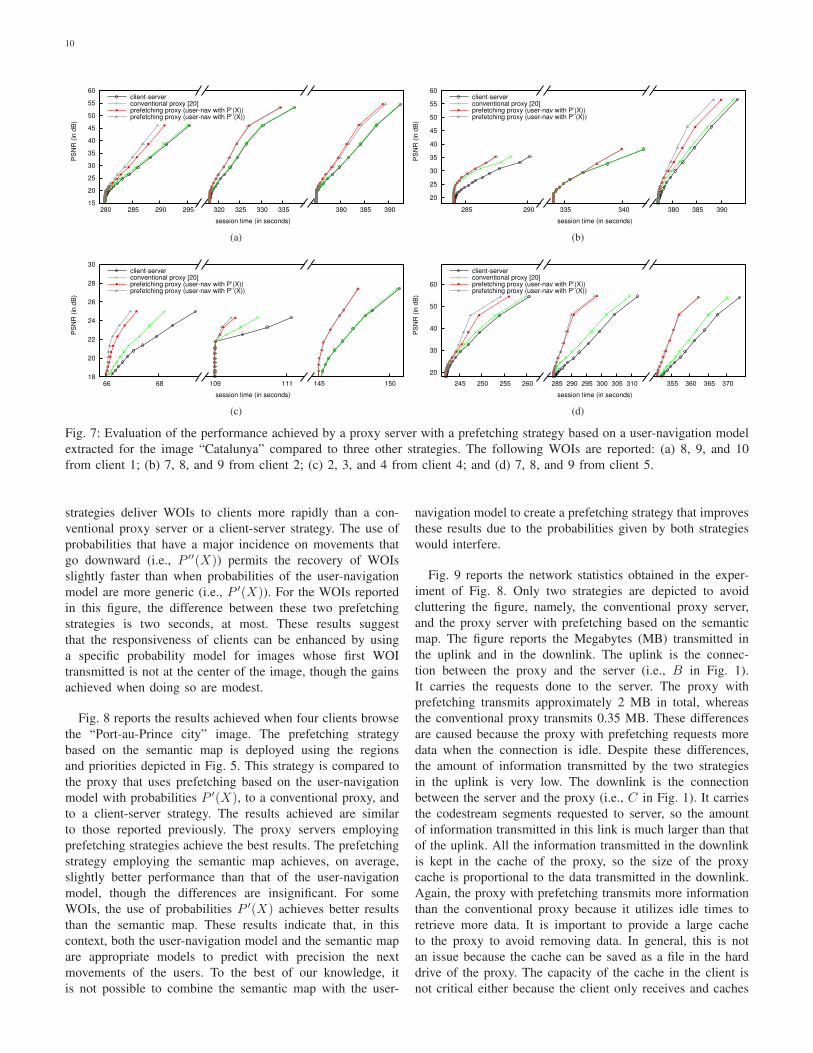
Fig. 8 reports the results achieved when four clients browse
the “Port-au-Prince city” image. The prefetching strategy
based on the semantic map is deployed using the regions
and priorities depicted in Fig. 5. This strategy is compared to
the proxy that uses prefetching based on the user-navigation
model with probabilities P ′(X), to a conventional proxy, and
to a client-server strategy. The results achieved are similar
to those reported previously. The proxy servers employing
prefetching strategies achieve the best results. The prefetching
strategy employing the semantic map achieves, on average,
slightly better performance than that of the user-navigation
model, though the differences are insignificant. For some
WOIs, the use of probabilities P ′(X) achieves better results
than the semantic map. These results indicate that, in this
context, both the user-navigation model and the semantic map
are appropriate models to predict with precision the next
movements of the users. To the best of our knowledge, it
is not possible to combine the semantic map with the user-
navigation model to create a prefetching strategy that improves
these results due to the probabilities given by both strategies
would interfere.
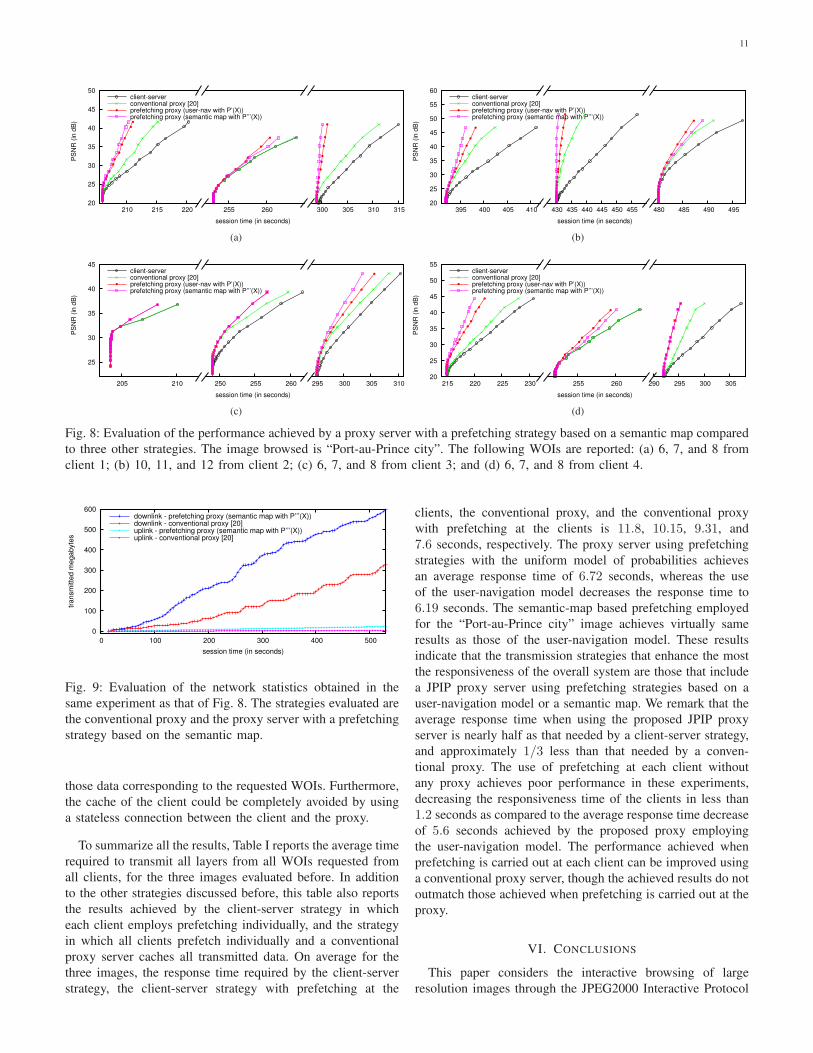
Fig. 9 reports the network statistics obtained in the exper-
iment of Fig. 8. Only two strategies are depicted to avoid
cluttering the figure, namely, the conventional proxy server,
and the proxy server with prefetching based on the semantic
map. The figure reports the Megabytes (MB) transmitted in
the uplink and in the downlink. The uplink is the connec-
tion between the proxy and the server (i.e., B in Fig. 1).
It carries the requests done to the server. The proxy with
prefetching transmits approximately 2 MB in total, whereas
the conventional proxy transmits 0.35 MB. These differences
are caused because the proxy with prefetching requests more
data when the connection is idle. Despite these differences,
the amount of information transmitted by the two strategies
in the uplink is very low. The downlink is the connection
between the server and the proxy (i.e., C in Fig. 1). It carries
the codestream segments requested to server, so the amount
of information transmitted in this link is much larger than that
of the uplink. All the information transmitted in the downlink
is kept in the cache of the proxy, so the size of the proxy
cache is proportional to the data transmitted in the downlink.
Again, the proxy with prefetching transmits more information
than the conventional proxy because it utilizes idle times to
retrieve more data. It is important to provide a large cache
to the proxy to avoid removing data. In general, this is not
an issue because the cache can be saved as a file in the hard
drive of the proxy. The capacity of the cache in the client is
not critical either because the client only receives and caches
11
20
25
30
35
40
45
50
210 215 220
session time (in seconds)
PS
NR
(in
dB
)
client-serverconventional proxy [20]prefetching proxy (user-nav with P’(X))prefetching proxy (semantic map with P’’’(X))
255 260 300 305 310 315
(a)
20
25
30
35
40
45
50
55
60
395 400 405 410
session time (in seconds)
PS
NR
(in
dB
)
client-serverconventional proxy [20]prefetching proxy (user-nav with P’(X))prefetching proxy (semantic map with P’’’(X))
430 435 440 445 450 455 480 485 490 495
(b)
25
30
35
40
45
205 210
session time (in seconds)
PS
NR
(in
dB
)
client-serverconventional proxy [20]prefetching proxy (user-nav with P’(X))prefetching proxy (semantic map with P’’’(X))
250 255 260 295 300 305 310
(c)
20
25
30
35
40
45
50
55
215 220 225 230
session time (in seconds)
PS
NR
(in
dB
)
client-serverconventional proxy [20]prefetching proxy (user-nav with P’(X))prefetching proxy (semantic map with P’’’(X))
255 260 290 295 300 305
(d)
Fig. 8: Evaluation of the performance achieved by a proxy server with a prefetching strategy based on a semantic map compared
to three other strategies. The image browsed is “Port-au-Prince city”. The following WOIs are reported: (a) 6, 7, and 8 from
client 1; (b) 10, 11, and 12 from client 2; (c) 6, 7, and 8 from client 3; and (d) 6, 7, and 8 from client 4.
0
100
200
300
400
500
600
0 100 200 300 400 500
tra
nsm
itte
d m
eg
ab
yte
s
session time (in seconds)
downlink - prefetching proxy (semantic map with P’’’(X))downlink - conventional proxy [20]uplink - prefetching proxy (semantic map with P’’’(X))uplink - conventional proxy [20]
Fig. 9: Evaluation of the network statistics obtained in the
same experiment as that of Fig. 8. The strategies evaluated are
the conventional proxy and the proxy server with a prefetching
strategy based on the semantic map.
those data corresponding to the requested WOIs. Furthermore,
the cache of the client could be completely avoided by using
a stateless connection between the client and the proxy.
To summarize all the results, Table I reports the average time
required to transmit all layers from all WOIs requested from
all clients, for the three images evaluated before. In addition
to the other strategies discussed before, this table also reports
the results achieved by the client-server strategy in which
each client employs prefetching individually, and the strategy
in which all clients prefetch individually and a conventional
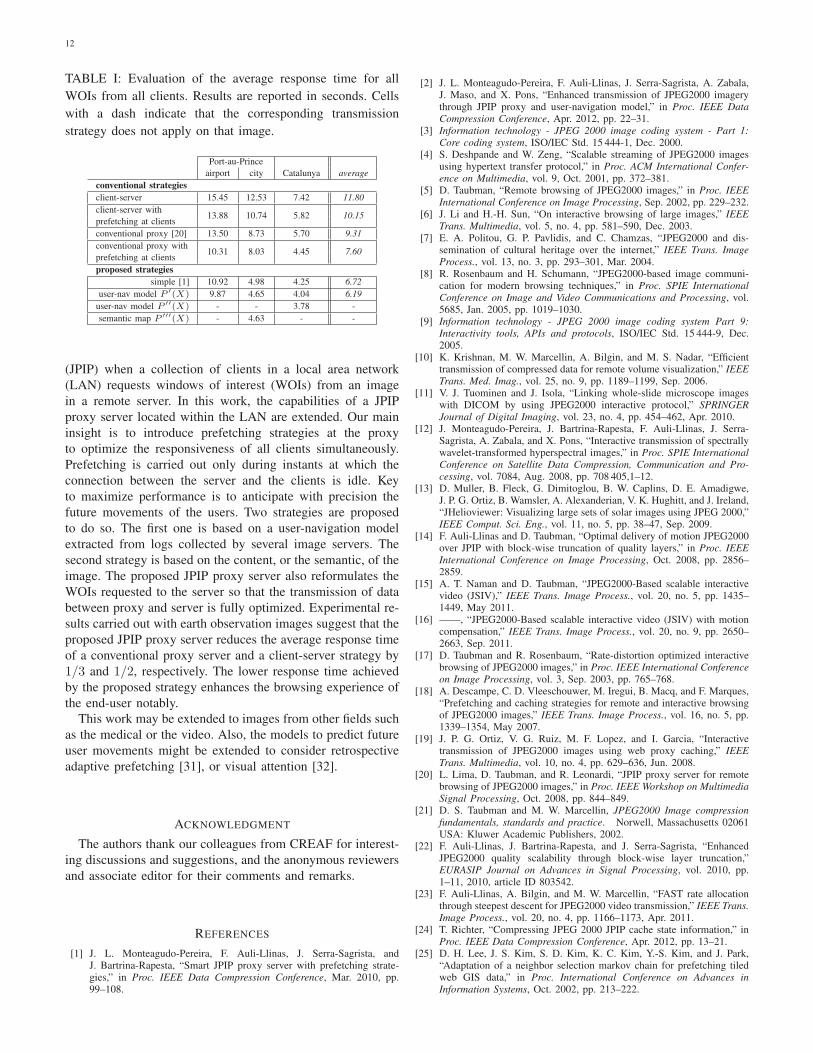
proxy server caches all transmitted data. On average for the
three images, the response time required by the client-server
strategy, the client-server strategy with prefetching at the
clients, the conventional proxy, and the conventional proxy
with prefetching at the clients is 11.8, 10.15, 9.31, and
7.6 seconds, respectively. The proxy server using prefetching
strategies with the uniform model of probabilities achieves
an average response time of 6.72 seconds, whereas the use
of the user-navigation model decreases the response time to
6.19 seconds. The semantic-map based prefetching employed
for the “Port-au-Prince city” image achieves virtually same
results as those of the user-navigation model. These results
indicate that the transmission strategies that enhance the most
the responsiveness of the overall system are those that include
a JPIP proxy server using prefetching strategies based on a
user-navigation model or a semantic map. We remark that the
average response time when using the proposed JPIP proxy
server is nearly half as that needed by a client-server strategy,
and approximately 1/3 less than that needed by a conven-
tional proxy. The use of prefetching at each client without
any proxy achieves poor performance in these experiments,
decreasing the responsiveness time of the clients in less than
1.2 seconds as compared to the average response time decrease
of 5.6 seconds achieved by the proposed proxy employing
the user-navigation model. The performance achieved when
prefetching is carried out at each client can be improved using
a conventional proxy server, though the achieved results do not
outmatch those achieved when prefetching is carried out at the
proxy.
VI. CONCLUSIONS
This paper considers the interactive browsing of large
resolution images through the JPEG2000 Interactive Protocol
12
TABLE I: Evaluation of the average response time for all
WOIs from all clients. Results are reported in seconds. Cells
with a dash indicate that the corresponding transmission
strategy does not apply on that image.
Port-au-Prince
airport city Catalunya average
conventional strategies
client-server 15.45 12.53 7.42 11.80
client-server with13.88 10.74 5.82 10.15
prefetching at clients
conventional proxy [20] 13.50 8.73 5.70 9.31
conventional proxy with10.31 8.03 4.45 7.60
prefetching at clients
proposed strategies
simple [1] 10.92 4.98 4.25 6.72
user-nav model P ′(X) 9.87 4.65 4.04 6.19
user-nav model P ′′(X) - - 3.78 -
semantic map P ′′′(X) - 4.63 - -
(JPIP) when a collection of clients in a local area network
(LAN) requests windows of interest (WOIs) from an image
in a remote server. In this work, the capabilities of a JPIP
proxy server located within the LAN are extended. Our main
insight is to introduce prefetching strategies at the proxy
to optimize the responsiveness of all clients simultaneously.
Prefetching is carried out only during instants at which the
connection between the server and the clients is idle. Key
to maximize performance is to anticipate with precision the
future movements of the users. Two strategies are proposed
to do so. The first one is based on a user-navigation model
extracted from logs collected by several image servers. The
second strategy is based on the content, or the semantic, of the
image. The proposed JPIP proxy server also reformulates the
WOIs requested to the server so that the transmission of data
between proxy and server is fully optimized. Experimental re-
sults carried out with earth observation images suggest that the
proposed JPIP proxy server reduces the average response time
of a conventional proxy server and a client-server strategy by
1/3 and 1/2, respectively. The lower response time achieved
by the proposed strategy enhances the browsing experience of
the end-user notably.
This work may be extended to images from other fields such
as the medical or the video. Also, the models to predict future
user movements might be extended to consider retrospective
adaptive prefetching [31], or visual attention [32].
ACKNOWLEDGMENT
The authors thank our colleagues from CREAF for interest-
ing discussions and suggestions, and the anonymous reviewers
and associate editor for their comments and remarks.
REFERENCES
[1] J. L. Monteagudo-Pereira, F. Auli-Llinas, J. Serra-Sagrista, andJ. Bartrina-Rapesta, “Smart JPIP proxy server with prefetching strate-gies,” in Proc. IEEE Data Compression Conference, Mar. 2010, pp.99–108.
[2] J. L. Monteagudo-Pereira, F. Auli-Llinas, J. Serra-Sagrista, A. Zabala,J. Maso, and X. Pons, “Enhanced transmission of JPEG2000 imagerythrough JPIP proxy and user-navigation model,” in Proc. IEEE Data
Compression Conference, Apr. 2012, pp. 22–31.[3] Information technology - JPEG 2000 image coding system - Part 1:
Core coding system, ISO/IEC Std. 15 444-1, Dec. 2000.[4] S. Deshpande and W. Zeng, “Scalable streaming of JPEG2000 images
using hypertext transfer protocol,” in Proc. ACM International Confer-
ence on Multimedia, vol. 9, Oct. 2001, pp. 372–381.[5] D. Taubman, “Remote browsing of JPEG2000 images,” in Proc. IEEE
International Conference on Image Processing, Sep. 2002, pp. 229–232.[6] J. Li and H.-H. Sun, “On interactive browsing of large images,” IEEE
Trans. Multimedia, vol. 5, no. 4, pp. 581–590, Dec. 2003.[7] E. A. Politou, G. P. Pavlidis, and C. Chamzas, “JPEG2000 and dis-
semination of cultural heritage over the internet,” IEEE Trans. Image
Process., vol. 13, no. 3, pp. 293–301, Mar. 2004.[8] R. Rosenbaum and H. Schumann, “JPEG2000-based image communi-
cation for modern browsing techniques,” in Proc. SPIE International
Conference on Image and Video Communications and Processing, vol.5685, Jan. 2005, pp. 1019–1030.
[9] Information technology - JPEG 2000 image coding system Part 9:
Interactivity tools, APIs and protocols, ISO/IEC Std. 15 444-9, Dec.2005.
[10] K. Krishnan, M. W. Marcellin, A. Bilgin, and M. S. Nadar, “Efficienttransmission of compressed data for remote volume visualization,” IEEE
Trans. Med. Imag., vol. 25, no. 9, pp. 1189–1199, Sep. 2006.[11] V. J. Tuominen and J. Isola, “Linking whole-slide microscope images
with DICOM by using JPEG2000 interactive protocol,” SPRINGER
Journal of Digital Imaging, vol. 23, no. 4, pp. 454–462, Apr. 2010.[12] J. Monteagudo-Pereira, J. Bartrina-Rapesta, F. Auli-Llinas, J. Serra-
Sagrista, A. Zabala, and X. Pons, “Interactive transmission of spectrallywavelet-transformed hyperspectral images,” in Proc. SPIE International
Conference on Satellite Data Compression, Communication and Pro-
cessing, vol. 7084, Aug. 2008, pp. 708 405,1–12.[13] D. Muller, B. Fleck, G. Dimitoglou, B. W. Caplins, D. E. Amadigwe,
J. P. G. Ortiz, B. Wamsler, A. Alexanderian, V. K. Hughitt, and J. Ireland,“JHelioviewer: Visualizing large sets of solar images using JPEG 2000,”IEEE Comput. Sci. Eng., vol. 11, no. 5, pp. 38–47, Sep. 2009.
[14] F. Auli-Llinas and D. Taubman, “Optimal delivery of motion JPEG2000over JPIP with block-wise truncation of quality layers,” in Proc. IEEE
International Conference on Image Processing, Oct. 2008, pp. 2856–2859.
[15] A. T. Naman and D. Taubman, “JPEG2000-Based scalable interactivevideo (JSIV),” IEEE Trans. Image Process., vol. 20, no. 5, pp. 1435–1449, May 2011.
[16] ——, “JPEG2000-Based scalable interactive video (JSIV) with motioncompensation,” IEEE Trans. Image Process., vol. 20, no. 9, pp. 2650–2663, Sep. 2011.
[17] D. Taubman and R. Rosenbaum, “Rate-distortion optimized interactivebrowsing of JPEG2000 images,” in Proc. IEEE International Conference
on Image Processing, vol. 3, Sep. 2003, pp. 765–768.[18] A. Descampe, C. D. Vleeschouwer, M. Iregui, B. Macq, and F. Marques,
“Prefetching and caching strategies for remote and interactive browsingof JPEG2000 images,” IEEE Trans. Image Process., vol. 16, no. 5, pp.1339–1354, May 2007.
[19] J. P. G. Ortiz, V. G. Ruiz, M. F. Lopez, and I. Garcia, “Interactivetransmission of JPEG2000 images using web proxy caching,” IEEE
Trans. Multimedia, vol. 10, no. 4, pp. 629–636, Jun. 2008.[20] L. Lima, D. Taubman, and R. Leonardi, “JPIP proxy server for remote
browsing of JPEG2000 images,” in Proc. IEEE Workshop on Multimedia
Signal Processing, Oct. 2008, pp. 844–849.[21] D. S. Taubman and M. W. Marcellin, JPEG2000 Image compression
fundamentals, standards and practice. Norwell, Massachusetts 02061USA: Kluwer Academic Publishers, 2002.
[22] F. Auli-Llinas, J. Bartrina-Rapesta, and J. Serra-Sagrista, “EnhancedJPEG2000 quality scalability through block-wise layer truncation,”EURASIP Journal on Advances in Signal Processing, vol. 2010, pp.1–11, 2010, article ID 803542.
[23] F. Auli-Llinas, A. Bilgin, and M. W. Marcellin, “FAST rate allocationthrough steepest descent for JPEG2000 video transmission,” IEEE Trans.
Image Process., vol. 20, no. 4, pp. 1166–1173, Apr. 2011.[24] T. Richter, “Compressing JPEG 2000 JPIP cache state information,” in
Proc. IEEE Data Compression Conference, Apr. 2012, pp. 13–21.[25] D. H. Lee, J. S. Kim, S. D. Kim, K. C. Kim, Y.-S. Kim, and J. Park,
“Adaptation of a neighbor selection markov chain for prefetching tiledweb GIS data,” in Proc. International Conference on Advances in
Information Systems, Oct. 2002, pp. 213–222.
13
[26] S. Quinn and M. Gahegan, “A predictive model for frequently viewedtiles in a web map,” Transactions in GIS, vol. 14, no. 2, pp. 193–216,Apr. 2010.
[27] D. S. Taubman, “Localized distortion estimation from already com-pressed JPEG2000 images,” in Proc. IEEE International Conference on
Image Processing, Oct. 2006, pp. 3089–3092.[28] X. Pons. (2004) MiraMon. Geographic Information System and Remote
Sensing software. Centre de Recerca Ecolgica i Aplicacions Forestals,CREAF. Bellaterra. ISBN: 84-931323-5-7. [Online]. Available: http://opengis.uab.cat/wms/satcat/
[29] G. Camps-Valls and L. Bruzzone, “Kernel-based methods for hyperspec-tral image classification,” vol. 43, no. 6, pp. 1351–1362, Jun. 2005.
[30] J. L. Monteagudo-Pereira. (2012) CADI. [Online]. Available: http://www.gici.uab.cat/CADI
[31] S. Yesilmurat and V. Isler, “Retrospective adaptive prefetching forinteractive web GIS applications,” SPRINGER Geoinformatica, vol. 16,no. 3, pp. 435–466, Jul. 2012.
[32] Z. Li, S. Qin, and L. Itti, “Visual attention guided bit allocation in videocompression,” ELSEVIER Image and Vision Computing, vol. 29, pp. 1–14, Jan. 2011.
Jose Lino Monteagudo-Pereira recieved the B.E.and M.S. degrees in 2002 and 2004, respectively,both in Telecommunications Engineering from theUniversidad de Vigo (Spain). From October 2002 toAugust 2004 he was with the faculty of the Schoolof Telecommunications Engineering, Universidad deVigo, as a researcher on image processing and mul-timedia. He joined the Group on Interactive Codingof Images at the Universitat Autonoma de Barcelona(Spain) in September 2004 where he is currentlyworking towards his Ph.D. degree. Since January
2009 he has been with the Ministry of Finance and Public Administrations(Spain) as a Network and Computer Systems Administrator. His research inter-ests lie in the areas of image compression and interactive image transmission.
Francesc Aulı-Llinas (S’2006-M’2008) is a Fellowof the Ramon y Cajal program funded by the SpanishGovernment. He is currently in the Department ofInformation and Communications Engineering, atthe Universitat Autonoma de Barcelona (Spain). Hereceived the B.Sc. and B.E. degrees in ComputerManagement Engineering and Computer Engineer-ing in 2000 and 2002, respectively, both from theUniversitat Autonoma de Barcelona (Spain), and forwhich he was granted with two extraordinary awardsof Bachelor (awards given to the first students of the
promotion). In 2004 and 2006 he respectively received the M.S. degree andthe Ph.D. degree (with honors), both in Computer Science from the UniversitatAutonoma de Barcelona. Since 2002 he has been consecutively awarded withdoctoral and postdoctoral fellowships in competitive calls. From 2007 to2009 he carried out two research stages of one year each with the groupof David Taubman, at the University of New South Wales (Australia), andwith the group of Michael Marcellin, at the University of Arizona (USA).He is the main developer of BOI, a JPEG2000 Part 1 implementation thatwas awarded with a free software mention from the Catalan Government.His research interests include a wide range of image coding topics, includinghighly scalable image and video coding systems, rate-distortion optimization,distortion estimation, and interactive transmission, among others.
Joan Serra-Sagrista (S’97-M’05-SM’11) receivedthe Ph.D. degree in Computer Science from Univer-sitat Autonoma de Barcelona (UAB), Spain, in 1999.He is currently an Associate Professor at the Depart-ment of Information and Communications Engineer-ing, UAB. From September 1997 to December 1998,he was at University of Bonn, Germany, funded byDAAD. His current research interests focus on datacompression, with special attention to image codingfor remote sensing and telemedicine applications. Heserves as Associate Editor of IEEE Trans. on Image
Processing and as Program Committee co-chair for IEEE Data CompressionConference. He has co-authored over one hundred publications. He was therecipient of the Spanish Intensification Young Investigator Award in 2006.