Embed Size (px)
Citation preview

JPET #165381
1
CONCENTRATION-EFFECT RELATIONSHIPS FOR THE DRUG OF ABUSE
γ-HYDROXYBUTYRIC ACID
Melanie A. Felmlee, Samuel A. Roiko, Bridget L. Morse and Marilyn E. Morris
Department of Pharmaceutical Sciences (MAF, SAR, BLM, MEM)
School of Pharmacy and Pharmaceutical Sciences
University at Buffalo, State University of New York
Amherst, New York 14260, USA
JPET Fast Forward. Published on March 9, 2010 as DOI:10.1124/jpet.109.165381
Copyright 2010 by the American Society for Pharmacology and Experimental Therapeutics.
This article has not been copyedited and formatted. The final version may differ from this version.JPET Fast Forward. Published on March 9, 2010 as DOI: 10.1124/jpet.109.165381
at ASPE
T Journals on O
ctober 18, 2021jpet.aspetjournals.org
Dow
nloaded from
JPET #165381
2
Running Title: Concentration-Effect Relationships for GHB
Corresponding Author: Dr. Marilyn E. Morris, Department of Pharmaceutical Sciences, School
of Pharmacy and Pharmaceutical Sciences, University at Buffalo, The State University of New
York, Buffalo, NY 14260, USA; Phone: 716-645-4839; Fax: 716-645-3893; E-mail:
Manuscript Details:
Text Pages: 20
Tables: 2
Figures: 7
References: 44
Words in: Abstract: 250
Introduction: 694
Discussion: 1651
Abbreviations: aCSF, artificial cerebrospinal fluid; CSF, cerebrospinal fluid; ECF, extracellular
fluid; GABA, γ-aminobutyric acid; GHB, γ-hydroxybutyric acid; LC/MS/MS, liquid
chromatography tandem mass spectrometry; LRR, loss of righting reflex; RRR, return to righting
reflex.
This article has not been copyedited and formatted. The final version may differ from this version.JPET Fast Forward. Published on March 9, 2010 as DOI: 10.1124/jpet.109.165381
at ASPE
T Journals on O
ctober 18, 2021jpet.aspetjournals.org
Dow
nloaded from

JPET #165381
3
ABSTRACT
γ-hydroxybutyric acid (GHB) is an endogenous neurotransmitter that is abused due to its
sedative/hypnotic and euphoric effects. The objectives of this study were to evaluate the
concentration-effect relationships of GHB in plasma, cerebrospinal fluid (CSF), brain (whole and
discrete brain regions) and brain frontal cortex extracellular fluid. This information is crucial for
future studies to evaluate effects of therapeutic interventions on the toxicodynamics of GHB.
GHB (200 – 1000 mg/kg) was administered intravenously to rats and plasma and frontal cortex
microdialysate samples were collected for up to 6 hours post-dose or plasma, CSF, and brain
(whole, frontal cortex, striatum and hippocampus) concentrations were determined at the offset
of its sedative/hypnotic effect (return to righting reflex, RRR). GHB-induced changes in the
brain neurotransmitters γ-aminobutyric acid (GABA) and glutamate were also determined.
GHB, GABA and glutamate concentrations were measured by LC/MS/MS. GHB-induced sleep
time significantly increased in a dose-dependent manner (20-fold increase from 200 mg/kg -
1000 mg/kg). GHB concentrations in plasma (300 – 400 µg/ml), whole brain (70 µg/g), discrete
brain regions (80 – 100 µg/g), and brain microdialysate (29-39 µg/ml) correlated with RRR. In
contrast, CSF GHB and GABA and glutamate concentrations in discrete brain regions exhibited
no relationship with RRR. Our results suggest that GHB-induced sedative/hypnotic effects are
mediated directly by GHB and that at high GHB doses, GABA formation from GHB may not
contribute to the observed sedative/hypnotic effect. These results support the use of a clinical
GHB detoxification strategy aimed at decreasing plasma and brain GHB concentrations
following GHB overdoses.
This article has not been copyedited and formatted. The final version may differ from this version.JPET Fast Forward. Published on March 9, 2010 as DOI: 10.1124/jpet.109.165381
at ASPE
T Journals on O
ctober 18, 2021jpet.aspetjournals.org
Dow
nloaded from

JPET #165381
4
INTRODUCTION
γ-hydroxybutyrate (GHB) is an endogenous short chain fatty acid formed from γ-aminobutyric
acid (GABA) (Gold and Roth, 1977) and found in the mammalian brain, heart, liver, intestine
and kidney (Maitre, 1997; Tedeschi et al., 2003). Clinically, GHB is marketed in the US as
Xyrem® (Jazz Pharmaceuticals, Palo Alto, CA) to treat narcolepsy with cataplexy (Mamelak et
al., 1986) and in Europe for the treatment of alcohol withdrawal (Gallimberti et al., 2000).
However, the illicit use and abuse of GHB are likely due to its sedative/hypnotic and euphoric
effects. GHB is referred to as a ‘club drug’ based on its wide spread use at nightclubs and raves
(Carter et al., 2009). Abuse of GHB has lead to an increase in overdoses and toxicological
effects, characterized by dizziness, respiratory depression, vomiting, and unconsciousness, as
well as coma and death (Okun et al., 2001; Carter et al., 2009). Current therapeutic strategies for
GHB overdose are limited to supportive care with antidotes such as physostigmine and naloxone
having little to no effect (Mason and Kerns, 2002).
GHB pharmacokinetics are nonlinear in rats (Lettieri and Fung, 1979) and humans (Ferrara et al.,
1992; Palatini et al., 1993) with decreased total clearance at higher doses. The observed
nonlinearity results from capacity-limited metabolism (Lettieri and Fung, 1979; Ferrara et al.,
1992; Palatini et al., 1993), and transporter-mediated and saturable absorption (Arena and Fung,
1980) and renal reabsorption (Morris et al., 2005). At high doses, the decreased clearance of
GHB results in sustained high plasma GHB concentrations and a corresponding increase in
sedative/hypnotic effect as measured by loss and return to righting reflex (Raybon and Boje,
2007; Wang et al., 2008b). Reductions in GHB sedative/hypnotic effect have been observed
This article has not been copyedited and formatted. The final version may differ from this version.JPET Fast Forward. Published on March 9, 2010 as DOI: 10.1124/jpet.109.165381
at ASPE
T Journals on O
ctober 18, 2021jpet.aspetjournals.org
Dow
nloaded from

JPET #165381
5
following the co-administration of L-lactate (Wang et al., 2008a) or luteolin (Wang et al.,
2008b). These compounds increase the renal clearance of GHB by inhibiting active renal
reabsorption, mediated by monocarboxylate transporters (MCTs), resulting in a concomitant
decrease in plasma concentrations.
While the physiological effects of GHB on sleep and sleep disorders (Carai et al., 2001;
Mamelak, 2009) are postulated to occur via the GHB receptor, the pharmacological and
toxicological effects of GHB are thought to occur through interactions with the GABAB receptor
(Maitre, 1997). The observed behavioral effects associated with GHB exposure, including
discriminative stimulus (Carter et al., 2006; Koek et al., 2006; Koek and France, 2008),
hypolocomotion (Kaupmann et al., 2003) and loss of righting reflex (Carai et al., 2001), are
consistent with the involvement of the GABAB receptor. These behavioral effects are observed
with the prototypical GABAB receptor agonist baclofen (Carter et al., 2003; Carter et al., 2006;
Smith et al., 2006). However, the mechanism of action contributing to the observed toxicological
effects of GHB is controversial, and appears to vary based on the dose administered and the
behavioral or physiological endpoint that is measured (Carter et al., 2009; Mamelak, 2009).
Three potential mechanisms of action have been suggested based on the role of the GABAB
receptor: 1) direct interaction with the GABAB receptor (Mathivet et al., 1997); 2) indirect
interaction through the metabolic conversion of GHB to GABA (Hechler et al., 1997); or 3)
GHB-mediated stimulation of GABA release (Hechler et al., 1997). Additional mechanisms of
action for GHB have been suggested including the involvement of GABAC receptors, and
GABAB-mediated increase in synthesis of GABAA modulating neuroactive steroids (Carter et al.,
2009; Mamelak, 2009).
This article has not been copyedited and formatted. The final version may differ from this version.JPET Fast Forward. Published on March 9, 2010 as DOI: 10.1124/jpet.109.165381
at ASPE
T Journals on O
ctober 18, 2021jpet.aspetjournals.org
Dow
nloaded from

JPET #165381
6
Few studies have examined the relationship between GHB toxicokinetics and sedative/hypnotic
effect (Lettieri and Fung, 1979; Wang et al., 2008a; Wang et al., 2008b). Previous investigations
have focused on plasma concentration-effect relationships and have not examined the
relationships with respect to CSF and discrete brain region concentrations. The objectives of the
present study were 1) to examine exposure-response relationships for GHB-induced
sedative/hypnotic effect; 2) to evaluate toxicokinetic/toxicodynamic relationships at the offset of
the GHB-induced sedative/hypnotic effect, in plasma, CSF and discrete brain regions; and 3) to
evaluate the relationship between changes in GABA and glutamate and GHB-induced sedative
hypnotic effects in discrete brain regions.
This article has not been copyedited and formatted. The final version may differ from this version.JPET Fast Forward. Published on March 9, 2010 as DOI: 10.1124/jpet.109.165381
at ASPE
T Journals on O
ctober 18, 2021jpet.aspetjournals.org
Dow
nloaded from
JPET #165381
7
METHODS
Chemicals and Reagents. GHB (sodium salt) and formic acid were purchased from Sigma-
Aldrich (St. Louis, MO). Deuterated GHB (GHB-d6) was obtained from Cerilliant (Round Rock,
TX). Artificial cerebrospinal fluid (aCSF) was obtained from Harvard Apparatus (Holliston,
MA). Ketamine, xylazine, heparin and carprofen were purchased from Henry Schein (Melville,
NY). HPLC-grade acetonitrile, methanol, water and acetic acid were purchased from Honeywell
Burdick and Jackson (Morristown, NJ).
Animals and Surgery. Male Sprague-Dawley rats (280 – 320 grams) were used in all studies.
Rats were randomly assigned to dose groups and were housed individually following surgical
procedures. Rats were used in a single study and were administered GHB on a single occasion.
Rats were housed under controlled lighting (12-h light/dark cycle) and temperature (20 ± 2oC)
conditions with food and water provided ad libitum. All animal experiments were approved by
the Institutional Animal Care and Use Committee, University at Buffalo, State University of
New York. All rats had cannulas implanted as previously described (Morris et al., 2005). Briefly,
right jugular vein cannulas were implanted under anesthesia after an i.p. injection of 90 mg/kg
ketamine and 9 mg/kg xylazine. Animals were allowed 3 days for surgical recovery prior to the
start of experiments. Jugular vein catheters were flushed daily with heparinized saline (40 IU
heparin per ml saline) to maintain patency.
Microdialysis study. Rats were implanted with a jugular vein cannula and were then mounted in
a stereotaxic frame (Harvard Apparatus, Holliston, MA). Microdialysis guide cannulae (for
This article has not been copyedited and formatted. The final version may differ from this version.JPET Fast Forward. Published on March 9, 2010 as DOI: 10.1124/jpet.109.165381
at ASPE
T Journals on O
ctober 18, 2021jpet.aspetjournals.org
Dow
nloaded from
JPET #165381
8
CMA 11 probes, CMA Microdialysis, North Chelmsford, MA) containing dummy probes were
implanted in the frontal cortex (AP +3.2mm and ML ±2.5 mm from Bregma, and DV -0.5mm
from dura (Paxinos and Watson, 1986) with the incisor bar set 0.5 mm below the interaural line.
The side of the brain in which the cannula was placed was alternated across animals. The
cannula was fixed in place using jeweler’s screws (Plastics One, Roanoke, VA) and dental resin.
Rats were administered carprofen 5mg/kg twice daily for two days post surgery, and allowed at
least 6 days for surgical recovery prior to microdialysis probe implantation.
Dosing and Sleep Time Determination. GHB was dissolved in sterile water (200 mg/ml) and
filtered with a 0.2 μm filter to ensure sterility. GHB (200, 400, 600, 800 or 1000 mg/kg) was
administered by iv bolus injection via the jugular vein cannulation to rats. GHB doses were
selected based on previous studies to ensure a range of sedative/hypnotic effects. The onset of
sedative/hypnotic effect (time of loss of righting reflex, LRR) and offset of sedative/hypnotic
effect (return to righting reflex, RRR) were recorded in all animals. LRR and RRR are defined as
the time at which the animal lost or regained the ability to right itself when placed on its back.
Animals were placed on their backs immediately following dose administration and every 30
seconds thereafter until LRR. The sedative/hypnotic duration of effect (sleep time) of GHB was
determined as the difference between RRR and LRR.
Experimental Design.
Evaluation of GHB Toxicokinetics(TK)/Toxicodynamics(TD). GHB (200, 400, 600 or 1000
mg/kg) was administered to male Sprague-Dawley rats (N = 7 - 10 per dose; Total = 34). Blood
This article has not been copyedited and formatted. The final version may differ from this version.JPET Fast Forward. Published on March 9, 2010 as DOI: 10.1124/jpet.109.165381
at ASPE
T Journals on O
ctober 18, 2021jpet.aspetjournals.org
Dow
nloaded from

JPET #165381
9
samples (200 µl) for analysis of GHB were withdrawn from the jugular vein cannula at different
time-points (5, 10, 20, 30, 60, 90, 120, 180, 240, 300, and 360 minutes) and transferred to
heparinized 0.6 ml microcentrifuge tubes. Plasma was separated by centrifugation at 1000 g for
10 minutes at 4oC and stored at -80oC.
Evaluation of GHB TK/TD at Offset of Effect. Male Sprague-Dawley rats (N = 7 – 8 per dose;
Total = 22) were administered GHB (400, 600 or 800 mg/kg iv). This study was designed to
detect a change of 25% with 15% variability (90% power). At RRR, ketamine/xylazine (90/9
mg/kg) were administered and blood, CSF and brain (whole brain, frontal cortex, striatum, and
hippocampus) samples were collected. Plasma was separated by centrifugation at 1000 g for 10
minutes at 4oC. Whole brain and brain regions were immediately snap frozen in liquid nitrogen.
All samples were stored at -80oC until analysis.
Evaluation of GHB TK Using In Vivo Microdialysis. Microdialysis probes (CMA11, CMA
Microdialysis) were prepared according to manufacturer’s instructions and implanted 24 hours
prior to the experiment to allow the blood-brain barrier to reform after implantation (de Lange et
al., 2000). All experiments were conducted in metabolic cages in awake and freely moving rats
with ad libitum access to water. Microdialysis probes were perfused with blank aCSF at a rate of
2 µl/min and allowed to stabilize for 2 hours. Microdialysate fractions were collected every 20
minutes. After stabilization, the probe was perfused with GHB 1µg/ml with aCSF for 80
minutes to calculate in vivo probe recovery of GHB for each rat using the established
retrodialysis method (Bouw and Hammarlund-Udenaes, 1998). The retrodialysis was followed
This article has not been copyedited and formatted. The final version may differ from this version.JPET Fast Forward. Published on March 9, 2010 as DOI: 10.1124/jpet.109.165381
at ASPE
T Journals on O
ctober 18, 2021jpet.aspetjournals.org
Dow
nloaded from

JPET #165381
10
by a washout period where blank aCSF was perfused for 80 minutes to remove any residual
GHB. Rats were then administered GHB 400, 600, or 800 mg/kg i.v. (N = 3 per dose; Total =
6), and dialysate samples collected for 6 hours post-dose (20 minute intervals), and times of LRR
and RRR were recorded for each rat. Upon completion of the time-course, rats were sacrificed
and the probe tracks were stained with dye. Brains were collected to confirm probe location.
Dialysate samples were stored at -80oC until analysis.
Effects of GHB on Neurotransmitter Levels in Discrete Brain Regions. Male Sprague-Dawley
rats were administered GHB (400, 600 or 800 mg/kg iv). Under anesthesia, rats were
exsanguinated followed by collection of the frontal cortex, striatum and hippocampus at 0, 10,
20, 30, 60, 90, 120, 150, 180, 210, 240, 270, 300, and 330 minutes post-dose (N = 3 per time
point; N = 30 per dose; Total = 90). Tissue samples were snap frozen in liquid nitrogen and
stored at -80oC until analysis.
Plasma, CSF and Brain Sample Preparation. GHB was extracted from plasma using an anion
exchange solid phase extraction procedure previously described (Fung et al., 2004; Raybon and
Boje, 2007) with slight modifications. Briefly, 5 µl of GHB-d6 (1 mg/ml) and 5 µl of double-
distilled water were added to 50 µl of plasma. Standards and quality controls were prepared by
the addition of 5 µl GHB-d6 (1 mg/ml) and 5 µl of GHB stock solution to 50 µl of blank plasma.
Plasma proteins were precipitated by the addition of 0.4 ml acetonitrile followed by
centrifugation at 10,000 g for 20 minutes. Supernatant (0.2 ml) was aspirated and then diluted
with 0.8 ml double-distilled water. Bond Elute SAX cartridges (100 mg resin, 1 ml volume,
Varian, Palo Alto, CA) were preconditioned, washed and samples and standards eluted as
This article has not been copyedited and formatted. The final version may differ from this version.JPET Fast Forward. Published on March 9, 2010 as DOI: 10.1124/jpet.109.165381
at ASPE
T Journals on O
ctober 18, 2021jpet.aspetjournals.org
Dow
nloaded from

JPET #165381
11
described previously (Raybon and Boje, 2007). The eluent was evaporated under a gentle stream
of N2 gas, reconstituted in 1.25 ml of 0.1% formic acid in double-distilled water and 5%
acetonitrile, and stored at -80oC until LC/MS/MS analysis.
CSF and microdialysate samples were diluted 1:40 and 1:10, respectively, with aCSF to bring
GHB concentrations within the range of the standard curve. GHB-d6 (5 µl of 5 µg/ml) was
added to 35 µl of diluted CSF or dialysate sample. Standards and quality controls were prepared
by the addition of 5 µl of GHB-d6 (5 µg/ml) to 35 µl of GHB stock solution in ACSF. Samples
and standards were stored at -80oC until LC/MS/MS analysis.
Whole brain and brain sub-region samples were homogenized in 4 ml/g tissue double-distilled
water. Ten microliters of GHB-d6 (200 µg/ml) and 10 μl of GABA-d6 (50 µg/ml) were added to
100 µl of sample homogenate. GHB standards and quality controls were prepared by the addition
of 10 µl GHB-d6 (200 µg/ml) and 10 µl of GHB stock solution to 100 µl of blank brain
homogenate. The neurotransmitter standards and quality controls (GABA and glutamate
combined) were prepared in double-distilled water to which 10 μl GABA-d6 (50 µg/ml) and 10
μl of double-distilled water was added. Double-distilled water (880 µl) was added to samples and
standards followed by 1 ml acetonitrile to precipitate proteins. Samples and standards were
centrifuged at 10,000 g for 20 minutes. The supernatant was aspirated and stored at -80oC until
LC/MS/MS analysis.
This article has not been copyedited and formatted. The final version may differ from this version.JPET Fast Forward. Published on March 9, 2010 as DOI: 10.1124/jpet.109.165381
at ASPE
T Journals on O
ctober 18, 2021jpet.aspetjournals.org
Dow
nloaded from

JPET #165381
12
LC/MS/MS Assay for GHB, GABA and Glutamate. GHB in plasma, aCSF and brain were
quantified using a validated LC/MS/MS assay that was previously described (Raybon and Boje,
2007) with minor modifications. The LC/MS/MS method for GHB was extended to
simultaneously quantify GABA and glutamate in discrete brain regions. The LC/MS/MS system
consisted of an Agilent 1100 series HPLC consisting of an online degasser, binary pump, and
autosampler (Agilent Technologies, Palo Alto, CA) connected to a PE Sciex API 3000 triple-
quadruple tandem mass spectrometer equipped with a turbo ion spray (Applied Biosystems,
Foster City, CA). Seven microliters of sample was injected on an Xterra MS C18 column (250 x
2.1 mm i.d., 5 µm particle size; Waters Co., Milford, MA). Mobile phase A consisted of 0.1%
formic acid in HPLC-grade water with 5% acetonitrile while mobile phase B consisted of 0.1%
formic acid in acetonitrile with 5% HPLC grade water. A gradient elution with a flow rate of 0.2
ml/min was used to separate compounds; 100 to 90 % A over 5 minutes, 90 to 10 % A over 2.5
minutes and 10 to 100 % A over 4.5 minutes. The retention times were 2.60, 2.75, and 3.6
minutes for GABA, glutamate and GHB, respectively. The mass spectrometer was operated in
positive ionization mode with multiple reaction monitoring. Compound specific mass
spectrometer parameters are listed in Table 1. The peak area ratios of the analyte and internal
standard were determined using Analyst Version 1.4.2 (Applied Biosystems, Foster City, CA).
Data and Statistical Analysis. Plasma AUC was calculated by the log-linear trapezoidal method
in WinNonLin version 5.2 (Pharsight Corp., Mountain View, CA). Plasma and brain ECF GHB
concentrations at RRR were determined by noncompartmental analysis from time-course data.
Statistical analyses were performed in GraphPad Prism version 4.0 (GraphPad Inc., San Diego,
CA). Significant differences between means were determined by one-way ANOVA followed by
This article has not been copyedited and formatted. The final version may differ from this version.JPET Fast Forward. Published on March 9, 2010 as DOI: 10.1124/jpet.109.165381
at ASPE
T Journals on O
ctober 18, 2021jpet.aspetjournals.org
Dow
nloaded from

JPET #165381
13
a Tukey’s multiple comparison. P < 0.05 was considered statistically significant. Nonlinear
regression analysis in GraphPad Prism version 4.0 (GraphPad Inc., San Diego, CA) was utilized
to evaluate the relationship between sedative/hypnotic effect and exposure.
Retrodialysis recovery of drug was used to calculate the relative in vivo recovery of GHB from
the dialysis probe. The recovery of GHB from the probe was calculated using the equation
below:
perfusate
dialysateperfusateobe C
CCery
−=PrcovRe Equation 1
where Cperfusate is the perfusate GHB concentration (inlet) and Cdialysate is the dialysate GHB
concentration (outlet). To determine GHB concentrations in frontal cortex ECF, dialysate GHB
concentrations after iv administration of GHB were divided by the experimentally-determined
GHB probe recovery.
This article has not been copyedited and formatted. The final version may differ from this version.JPET Fast Forward. Published on March 9, 2010 as DOI: 10.1124/jpet.109.165381
at ASPE
T Journals on O
ctober 18, 2021jpet.aspetjournals.org
Dow
nloaded from

JPET #165381
14
RESULTS
LC/MS/MS Assay for GHB, GABA and Glutamate. The lower limits of quantitation for GHB
were 1 µg/ml, 0.05 µg/ml and 8 µg/g in plasma, CSF and brain, respectively. Endogenous GHB
was undetectable in untreated matrix samples, and therefore, was not included in the calculation
of GHB concentration. The standard curve ranges were 1 to 500 µg/ml, 0.05 to 10 µg/ml and 8 to
800 µg/g in plasma, CSF and brain, respectively, based on regression analysis (r2 > 0.99) of peak
area ratios (GHB/GHB-d6) versus GHB concentration. GABA and glutamate had lower limits of
quantification of 0.05 and 0.5 µg/ml in all brain regions. The standard curve ranges were 0.05 to
10 µg/ml and 0.5 to 15 µg/ml for GABA and glutamate based on regression analysis of peak
ratios (GABA/GABA-d6 and glutamate/GABA-d6) versus GABA or glutamate concentration.
Accuracy and precision for GHB (all matrices), GABA and glutamate were 90 – 105% and 0.5 –
1.5 %, respectively.
Dose-dependent Effects of GHB on Sedative/Hypnotic Effect
The sedative/hypnotic effect of GHB increases in a dose-dependent manner (Figure 1) with a
significant increase in sleep time observed in animals treated with 400, 600 and 1000 mg/kg
when compared to the 200 mg/kg dose group. The observed increases in sedative/hypnotic effect
are correlated to increases in GHB exposure with increasing dose. Figure 2 illustrates the
relationship between sedative/hypnotic effect (sleep time) and overall plasma exposure (AUC).
Sleep time was only observed in 2 out of 10 rats administered 200 mg/kg GHB iv, indicating that
there is a threshold exposure required to observe sedative/hypnotic effects of GHB. In addition,
that data presented in Figure 2 corresponds to exposure data from studies where GHB was
This article has not been copyedited and formatted. The final version may differ from this version.JPET Fast Forward. Published on March 9, 2010 as DOI: 10.1124/jpet.109.165381
at ASPE
T Journals on O
ctober 18, 2021jpet.aspetjournals.org
Dow
nloaded from

JPET #165381
15
concomitantly administered with lactate or luteolin (Wang et al., 2008a; Wang et al., 2008b)
which resulted in increased renal clearance and decreased plasma GHB AUCs. This relationship
further demonstrates that any reductions in plasma GHB exposure would correlate with a
reduction in sedative/hypnotic effect.
Concentration-dependence of Sedative/Hypnotic Effect
To further investigate the relationship between GHB concentration and sedative/hypnotic effect,
GHB concentrations were assessed in plasma, CSF and brain (total and unbound) at RRR (offset
of effect). Figures 3a and 3b illustrate the plasma GHB concentrations at RRR following
administration of 200 to 1000 mg/kg GHB iv and calculated based on interpolation from the
concentration-time profiles (Figure 3a; TK/TD study) or directly measured at RRR (Figure 3b;
TK/TD at offset of effect study). Mean plasma GHB concentrations were between 300 and 400
µg/ml at RRR, independent of the dose administered, demonstrating that there is a direct
relationship between plasma GHB concentration and offset of sedative/hypnotic effect. In
contrast, a significant dose-dependent increase in CSF GHB concentration was observed at RRR
indicating that CSF concentrations do not correlate with effect (Figure 4). Consistent with the
observed results in plasma, GHB concentrations in whole brain and discrete brain regions
correlated with RRR (Figure 5). Frontal cortex and hippocampus GHB concentrations at RRR
were slightly higher than observed in whole brain consistent with previous findings of enriched
endogenous GHB concentrations in these regions. Figure 6 illustrates the unbound GHB
concentration in the frontal cortex ECF at RRR, as measured by microdialysis. Unbound GHB
This article has not been copyedited and formatted. The final version may differ from this version.JPET Fast Forward. Published on March 9, 2010 as DOI: 10.1124/jpet.109.165381
at ASPE
T Journals on O
ctober 18, 2021jpet.aspetjournals.org
Dow
nloaded from
JPET #165381
16
concentrations correlated with RRR, which is consistent with total GHB concentrations in the
frontal cortex.
Effect of GHB on GABA and Glutamate in Discrete Brain Regions
Table 2 details the percentage change from baseline of GABA and glutamate at offset of the
sedative/hypnotic effect (RRR). Data was calculated from time-course data based on mean RRR
for the specific dose. The brain concentrations of neurotransmitters do not correlate with the
offset of toxicodynamic effect in any of the discrete brain regions assessed. In addition, the
changes in neurotransmitter concentrations were evaluated over 5 hours post-dose. Figure 7
represents the time-course of percentage changes of GABA in the frontal cortex. While both
GABA and glutamate levels deviate from baseline in the frontal cortex, a dose-response trend
was not observed over the dose range utilized in this study. These results were consistent with
the results observed in the striatum and hippocampus of the same group of rats (data not shown).
This article has not been copyedited and formatted. The final version may differ from this version.JPET Fast Forward. Published on March 9, 2010 as DOI: 10.1124/jpet.109.165381
at ASPE
T Journals on O
ctober 18, 2021jpet.aspetjournals.org
Dow
nloaded from

JPET #165381
17
DISCUSSION
Given the lack of available therapeutic strategies for the effective treatment of GHB overdoses, it
is important to elucidate the mechanisms contributing to the observed TD effects of GHB.
Further understanding of these mechanisms and the relationships between systemic GHB
concentrations and sedative/hypnotic effect will facilitate the development of therapeutic
strategies aimed at reducing toxic effects of GHB. The present study demonstrates the TD
relationship between plasma and brain (whole and discrete brain regions) concentrations and
offset of sedative/hypnotic effect. Furthermore, we identified a threshold GHB plasma exposure
for its sedative/hypnotic effect (total sleep time). In addition, the absence of a direct relationship
between the neurotransmitters GABA and glutamate and offset of TD effect was observed.
The results of the present study are consistent with literature reports investigating the dose and
concentration-response relationships for GHB. Consistent with our observations, Van
Sassenbroek et al. (Van Sassenbroeck et al., 2001) demonstrated that plasma GHB
concentrations at RRR in rats treated with 300 mg/kg (5 minute iv infusion) were 452 ± 35
ug/ml. Furthermore, a threshold for sedative/hypnotic effect was observed at 150 mg/kg iv GHB
consistent with the lack of effect observed with 200 mg/kg iv in the present study (Van
Sassenbroeck et al., 2001). In addition, brain GHB concentrations have been reported to parallel
plasma concentrations and show similar relationships with offset of sedative/hypnotic effect
(Snead et al., 1976; Snead, 1978). The relationship between plasma and brain GHB
concentrations (and total exposure) is not limited to the sedative/hypnotic effect; literature
reports have illustrated exposure- and concentration-effect for electroencephalographic effects
This article has not been copyedited and formatted. The final version may differ from this version.JPET Fast Forward. Published on March 9, 2010 as DOI: 10.1124/jpet.109.165381
at ASPE
T Journals on O
ctober 18, 2021jpet.aspetjournals.org
Dow
nloaded from

JPET #165381
18
(Snead et al., 1976; Snead, 1978; Snead, 1991), time to complete fine motor task (Goodwin et
al., 2009) and ataxia (Goodwin et al., 2009). Interestingly, GHB exhibits complex dose-response
relationships with body temperature suggesting there are multiple pathways contributing to the
observed toxicological effects of GHB (Snead, 1990).
Previous studies have identified a number of potential mechanisms of action for GHB-induced
toxicological effects including direct binding to the GABAB receptor, metabolic conversion of
GHB to GABA or GHB-mediated stimulation of GABA release (Hechler et al., 1997; Maitre,
1997). The results of the present study extend the findings to demonstrate the relationship
between GHB concentration and sedative/hypnotic effect (offset of effect and total sleep time).
Carai et al. (2001) used receptor specific antagonists SCH 50911 (GABAB receptor specific) and
NCS-382 (GHB receptor specific) to demonstrate that the GHB-induced sedative/hypnotic effect
resulted from activation of the GABAB receptor and not the GHB receptor. In addition, studies
conducted in GABAB1(-/-) mice did not show any sedative effects following administration of
1000 mg/kg GHB intraperitoneally (Kaupmann et al., 2003), suggesting that activation of the
GABAB receptor is responsible for the toxicological action of GHB. Furthermore, GHB
associated hypothermia was also absent in GABAB1(-/-) mice treated with high doses of GHB
(Kaupmann et al., 2003).
While these results confirm the involvement of the GABAB receptor, they do not distinguish
between direct and indirect interactions of GHB with the receptor. To investigate the effects of
GHB on GABA formation (indirect interaction), we evaluated changes in GABA levels
This article has not been copyedited and formatted. The final version may differ from this version.JPET Fast Forward. Published on March 9, 2010 as DOI: 10.1124/jpet.109.165381
at ASPE
T Journals on O
ctober 18, 2021jpet.aspetjournals.org
Dow
nloaded from

JPET #165381
19
following the administration of a range of GHB doses. Literature reports indicate that 0.5 – 2 %
of GHB is converted to GABA (Hechler et al., 1997; Gobaille et al., 1999); however, there is a
delay in the formation of GABA of 160 minutes after the administration of 416 mg/kg GHB
intraperitoneally (Gobaille et al., 1999). The delay in formation of GABA is inconsistent with the
rapid onset of pharmacological and toxicological effects of GHB following GHB administration.
We observed initial decreases in total GABA levels in the frontal cortex and hippocampus at all
doses but GABA levels did not correlate with offset of the sedative/hypnotic effect in any brain
region evaluated. Within the brain, GHB is metabolized to succinic acid which is thought to
inhibit the formation of GABA from glutamate. It is possible that at the high doses of GHB
administered in this study (brain concentrations are approximately 5 times higher than utilized by
Hechler et al. (1997), a sufficient amount of succinnic acid is formed within the brain to cause
the observed decreases in GABA levels. These results suggest that at high GHB doses the
formation of GABA does not contribute to the observed sedative/hypnotic effects.
Another potential indirect interaction with the GABAB receptor is the GHB-mediated stimulation
of GABA release (Gobaille et al., 1999). Gobaille et al. (1999) demonstrated alterations in
GABA release in the rat frontal cortex using intracerebral microdialysis. However, in their
study, GHB concentrations in the dialysate were not directly measured, so concentration-effect
relationships cannot be determined for the observed responses. Linear extrapolations of GHB
brain concentrations from previous studies may be inaccurate due to the nonlinearity of GHB
pharmacokinetics. Interestingly, GHB had divergent effects on GABA release, dependent on the
administered dose; the low dose decreased GABA release while the high dose increased GABA
release (Gobaille et al., 1999). In addition, decreased release of GABA following low dose GHB
This article has not been copyedited and formatted. The final version may differ from this version.JPET Fast Forward. Published on March 9, 2010 as DOI: 10.1124/jpet.109.165381
at ASPE
T Journals on O
ctober 18, 2021jpet.aspetjournals.org
Dow
nloaded from
JPET #165381
20
has been observed in the thalamus (Banerjee and Snead, 1995). To confirm the influence of high
doses of GHB on GABA release, GHB and GABA should be studied simultaneously using
intracerebral microdialysis or equilibrium dialysis. These endpoints could then be further
correlated to the sedative/hypnotic effect utilized in the present study.
An interesting finding of the present study is the lack of a relationship between sedative/hypnotic
effect and CSF GHB concentrations. In contrast to the observed results in plasma and brain,
there was a significant dose-dependent increase in CSF GHB concentrations at RRR. CSF
concentrations have been commonly used as surrogate markers for unbound brain concentrations
(Liu et al., 2006). However, studies examining transporter expression at the blood-CSF barrier
(BCSFB) have shown the expression of many efflux transporters (Kusuhara and Sugiyama,
2004) suggesting that CSF concentrations may not be reflective of unbound brain concentrations
in all situations (de Lange and Danhof, 2002; Lin, 2008). Drugs that are lipophilic and pass the
BBB and BCSFB by passive diffusion typically have CSF concentrations that correlate well with
unbound concentrations in the brain (de Lange and Danhof, 2002). In contrast, hydrophilic drugs
are primarily transported transcellularly and may require an active transport mechanism to pass
the BBB or BCSFB (de Lange and Danhof, 2002). For such drugs, CSF concentrations may not
correlate with unbound concentrations in the brain as the CSF functions as a slow equilibrium
compartment (Lin, 2008). It appears that the lack of correlation between sedative/hypnotic effect
and GHB CSF concentrations is likely due to its hydrophilic nature and need for an influx
transporter at the BBB. The present study also demonstrated regional differences in GHB brain
concentrations which further complicates the relationship between CSF and unbound brain
concentrations. An additional possibility for the lack of a relationship between CSF and brain
This article has not been copyedited and formatted. The final version may differ from this version.JPET Fast Forward. Published on March 9, 2010 as DOI: 10.1124/jpet.109.165381
at ASPE
T Journals on O
ctober 18, 2021jpet.aspetjournals.org
Dow
nloaded from

JPET #165381
21
concentrations is the saturation of an efflux transporter on the BCSFB which would result in
increasing CSF concentrations with increasing dose consistent with the observed results for
GHB. Further studies are required to assess the influence of efflux transporters on GHB
disposition. GHB is a known substrate of the monocarboxylate transporters (isoforms 1 -4)
(Wang et al., 2008a); however, there is a lack of information in the literature with respect to the
affinity of GHB for efflux transporters. To clarify the observed relationships, we conducted a
study to directly assess unbound GHB concentrations at RRR in the frontal cortex using
intracerebral microdialysis. The observed relationship between frontal cortex ECF GHB
concentrations and RRR confirms that CSF GHB concentrations are not an accurate marker of
unbound concentrations in the brain. However, the mechanism(s) contributing to the disparity
between CSF and unbound brain GHB concentrations needs to be further explored.
Current therapeutic strategies for the treatment of GHB overdose involve supportive care, such
as intubation and mechanical ventilation to overcome respiratory depression (Mason and Kerns,
2002). The observed relationships between GHB concentration and sedative/hypnotic effect
suggest that the use of strategies that decrease GHB concentrations in the plasma and/or brain
would result in reduced sedative/hypnotic effect. One such strategy involves the inhibition of
active renal reabsorption of GHB mediated by the monocarboxylate transporters (MCTs),
thereby increasing the renal clearance of GHB (Morris et al., 2005; Wang et al., 2008a). Co-
administration of L-lactate (an endogenous MCT substrate) and GHB results in increased GHB
renal clearance and decreased plasma concentrations (Wang et al., 2008a); however, the time-
course of GHB in the brain was not assessed in that study. GHB brain ECF has been
demonstrated to correlate with GHB sedative/hypnotic effects (Kapadia et al., 2007; Raybon and
This article has not been copyedited and formatted. The final version may differ from this version.JPET Fast Forward. Published on March 9, 2010 as DOI: 10.1124/jpet.109.165381
at ASPE
T Journals on O
ctober 18, 2021jpet.aspetjournals.org
Dow
nloaded from
JPET #165381
22
Boje, 2007) and future studies evaluating the effectiveness of this therapeutic strategy should
evaluate this concentration-effect relationship in the presence of MCT inhibitors, such as L-
lactate and luteolin. Alternatively, the use of GABAB receptor antagonists has been proposed for
the treatment of acute GHB overdoses (Jensen and Mody, 2001). Administration of the GABAB
receptor antagonists SCH 50911 and CGP 46381 prior to GHB resulted in a decreased
sedative/hypnotic effect (Carai et al., 2001). The advantage of the strategy using L-lactate to
increase GHB renal clearance is ease of translation of this strategy to the clinic as lactate
preparations are already available clinically. Additionally, the potential exists for lactate to be
used in combination with a GABAB antagonist as they work via distinct targets. This approach
may lead to synergistic effects improving upon the affects of the individual components.
However, all strategies should be investigated further to optimize a detoxification strategy.
In summary, we have demonstrated the exposure- and concentration-response relationships for
GHB-induced sedative/hypnotic effect. The offset of sedative/hypnotic effect correlated to GHB
concentrations in plasma and brain (whole and discrete brain regions) over a range of GHB
doses. In addition, we have shown the absence of a relationship between GABA and glutamate
changes at the offset of sedative/hypnotic effect. These results support the use of a therapeutic
detoxification strategy that improves GHB clearance and reduces exposure thereby decreasing
the sedative effects of GHB.
This article has not been copyedited and formatted. The final version may differ from this version.JPET Fast Forward. Published on March 9, 2010 as DOI: 10.1124/jpet.109.165381
at ASPE
T Journals on O
ctober 18, 2021jpet.aspetjournals.org
Dow
nloaded from

JPET #165381
23
REFERENCES
Arena C and Fung HL (1980) Absorption of sodium gamma-hydroxybutyrate and its prodrug
gamma-butyrolactone: relationship between in vitro transport and in vivo absorption. J
Pharm Sci 69:356-358.
Banerjee PK and Snead OC, 3rd (1995) Presynaptic gamma-hydroxybutyric acid (GHB) and
gamma-aminobutyric acidB (GABAB) receptor-mediated release of GABA and
glutamate (GLU) in rat thalamic ventrobasal nucleus (VB): a possible mechanism for the
generation of absence-like seizures induced by GHB. J Pharmacol Exp Ther 273:1534-
1543.
Bouw MR and Hammarlund-Udenaes M (1998) Methodological aspects of the use of a calibrator
in in vivo microdialysis-further development of the retrodialysis method. Pharm Res
15:1673-1679.
Carai MA, Colombo G, Brunetti G, Melis S, Serra S, Vacca G, Mastinu S, Pistuddi AM, Solinas
C, Cignarella G, Minardi G and Gessa GL (2001) Role of GABA(B) receptors in the
sedative/hypnotic effect of gamma-hydroxybutyric acid. Eur J Pharmacol 428:315-321.
Carter LP, Chen W, Coop A, Koek W and France CP (2006) Discriminative stimulus effects of
GHB and GABA(B) agonists are differentially attenuated by CGP35348. Eur J
Pharmacol 538:85-93.
Carter LP, Flores LR, Wu H, Chen W, Unzeitig AW, Coop A and France CP (2003) The role of
GABAB receptors in the discriminative stimulus effects of gamma-hydroxybutyrate in
rats: time course and antagonism studies. J Pharmacol Exp Ther 305:668-674.
This article has not been copyedited and formatted. The final version may differ from this version.JPET Fast Forward. Published on March 9, 2010 as DOI: 10.1124/jpet.109.165381
at ASPE
T Journals on O
ctober 18, 2021jpet.aspetjournals.org
Dow
nloaded from

JPET #165381
24
Carter LP, Koek W and France CP (2009) Behavioral analyses of GHB: receptor mechanisms.
Pharmacol Ther 121:100-114.
de Lange EC and Danhof M (2002) Considerations in the use of cerebrospinal fluid
pharmacokinetics to predict brain target concentrations in the clinical setting:
implications of the barriers between blood and brain. Clin Pharmacokinet 41:691-703.
de Lange EC, de Boer AG and Breimer DD (2000) Methodological issues in microdialysis
sampling for pharmacokinetic studies. Adv Drug Deliv Rev 45:125-148.
Ferrara SD, Zotti S, Tedeschi L, Frison G, Castagna F, Gallimberti L, Gessa GL and Palatini P
(1992) Pharmacokinetics of gamma-hydroxybutyric acid in alcohol dependent patients
after single and repeated oral doses. Br J Clin Pharmacol 34:231-235.
Fung HL, Haas E, Raybon J, Xu J and Fung SM (2004) Liquid chromatographic-mass
spectrometric determination of endogenous gamma-hydroxybutyrate concentrations in rat
brain regions and plasma. J Chromatogr B Analyt Technol Biomed Life Sci 807:287-291.
Gallimberti L, Spella MR, Soncini CA and Gessa GL (2000) Gamma-hydroxybutyric acid in the
treatment of alcohol and heroin dependence. Alcohol 20:257-262.
Gobaille S, Hechler V, Andriamampandry C, Kemmel V and Maitre M (1999) gamma-
Hydroxybutyrate modulates synthesis and extracellular concentration of gamma-
aminobutyric acid in discrete rat brain regions in vivo. J Pharmacol Exp Ther 290:303-
309.
This article has not been copyedited and formatted. The final version may differ from this version.JPET Fast Forward. Published on March 9, 2010 as DOI: 10.1124/jpet.109.165381
at ASPE
T Journals on O
ctober 18, 2021jpet.aspetjournals.org
Dow
nloaded from

JPET #165381
25
Gold BI and Roth RH (1977) Kinetics of in vivo conversion of gamma-[3H]aminobutyric acid to
gamma-[3H]hydroxybutyric acid by rat brain. J Neurochem 28:1069-1073.
Goodwin AK, Brown PR, Jansen EE, Jakobs C, Gibson KM and Weerts EM (2009) Behavioral
effects and pharmacokinetics of gamma-hydroxybutyrate (GHB) precursors gamma-
butyrolactone (GBL) and 1,4-butanediol (1,4-BD) in baboons. Psychopharmacology
(Berl) 204:465-476.
Hechler V, Ratomponirina C and Maitre M (1997) gamma-Hydroxybutyrate conversion into
GABA induces displacement of GABAB binding that is blocked by valproate and
ethosuximide. J Pharmacol Exp Ther 281:753-760.
Jensen K and Mody I (2001) L-type Ca2+ channel-mediated short-term plasticity of GABAergic
synapses. Nat Neurosci 4:975-976.
Kapadia R, Bohlke M and Maher TJ (2007) Detection of gamma-hydroxybutyrate in striatal
microdialysates following peripheral 1,4-butanediol administration in rats. Life Sci
80:1046-1050.
Kaupmann K, Cryan JF, Wellendorph P, Mombereau C, Sansig G, Klebs K, Schmutz M, Froestl
W, van der Putten H, Mosbacher J, Brauner-Osborne H, Waldmeier P and Bettler B
(2003) Specific gamma-hydroxybutyrate-binding sites but loss of pharmacological effects
of gamma-hydroxybutyrate in GABA(B)(1)-deficient mice. Eur J Neurosci 18:2722-
2730.
Koek W, Chen W, Mercer SL, Coop A and France CP (2006) Discriminative stimulus effects of
gamma-hydroxybutyrate: role of training dose. J Pharmacol Exp Ther 317:409-417.
This article has not been copyedited and formatted. The final version may differ from this version.JPET Fast Forward. Published on March 9, 2010 as DOI: 10.1124/jpet.109.165381
at ASPE
T Journals on O
ctober 18, 2021jpet.aspetjournals.org
Dow
nloaded from
JPET #165381
26
Koek W and France CP (2008) Cataleptic effects of gamma-hydroxybutyrate (GHB) and
baclofen in mice: mediation by GABA(B) receptors, but differential enhancement by N-
methyl-d-aspartate (NMDA) receptor antagonists. Psychopharmacology (Berl).
Kusuhara H and Sugiyama Y (2004) Efflux transport systems for organic anions and cations at
the blood-CSF barrier. Adv Drug Deliv Rev 56:1741-1763.
Lettieri JT and Fung HL (1979) Dose-dependent pharmacokinetics and hypnotic effects of
sodium gamma-hydroxybutyrate in the rat. J Pharmacol Exp Ther 208:7-11.
Lin JH (2008) CSF as a surrogate for assessing CNS exposure: an industrial perspective. Curr
Drug Metab 9:46-59.
Liu X, Smith BJ, Chen C, Callegari E, Becker SL, Chen X, Cianfrogna J, Doran AC, Doran SD,
Gibbs JP, Hosea N, Liu J, Nelson FR, Szewc MA and Van Deusen J (2006) Evaluation of
cerebrospinal fluid concentration and plasma free concentration as a surrogate
measurement for brain free concentration. Drug Metab Dispos 34:1443-1447.
Maitre M (1997) The gamma-hydroxybutyrate signalling system in brain: organization and
functional implications. Prog Neurobiol 51:337-361.
Mamelak M (2009) Narcolepsy and depression and the neurobiology of gammahydroxybutyrate.
Prog Neurobiol 89:193-219.
Mamelak M, Scharf MB and Woods M (1986) Treatment of narcolepsy with gamma-
hydroxybutyrate. A review of clinical and sleep laboratory findings. Sleep 9:285-289.
This article has not been copyedited and formatted. The final version may differ from this version.JPET Fast Forward. Published on March 9, 2010 as DOI: 10.1124/jpet.109.165381
at ASPE
T Journals on O
ctober 18, 2021jpet.aspetjournals.org
Dow
nloaded from

JPET #165381
27
Mason PE and Kerns WP, 2nd (2002) Gamma hydroxybutyric acid (GHB) intoxication. Acad
Emerg Med 9:730-739.
Mathivet P, Bernasconi R, De Barry J, Marescaux C and Bittiger H (1997) Binding
characteristics of gamma-hydroxybutyric acid as a weak but selective GABAB receptor
agonist. Eur J Pharmacol 321:67-75.
Morris ME, Hu K and Wang Q (2005) Renal clearance of gamma-hydroxybutyric acid in rats:
increasing renal elimination as a detoxification strategy. J Pharmacol Exp Ther
313:1194-1202.
Okun MS, Boothby LA, Bartfield RB and Doering PL (2001) GHB: an important pharmacologic
and clinical update. J Pharm Pharm Sci 4:167-175.
Palatini P, Tedeschi L, Frison G, Padrini R, Zordan R, Orlando R, Gallimberti L, Gessa GL and
Ferrara SD (1993) Dose-dependent absorption and elimination of gamma-hydroxybutyric
acid in healthy volunteers. Eur J Clin Pharmacol 45:353-356.
Paxinos G and Watson C (1986) The Rat Brain in Stereotaxic Coordinates. Academic Press,
New York.
Raybon JJ and Boje KM (2007) Pharmacokinetics and pharmacodynamics of gamma-
hydroxybutyric acid during tolerance in rats: effects on extracellular dopamine. J
Pharmacol Exp Ther 320:1252-1260.
This article has not been copyedited and formatted. The final version may differ from this version.JPET Fast Forward. Published on March 9, 2010 as DOI: 10.1124/jpet.109.165381
at ASPE
T Journals on O
ctober 18, 2021jpet.aspetjournals.org
Dow
nloaded from

JPET #165381
28
Smith MA, Gergans SR and Lyle MA (2006) The motor-impairing effects of GABA(A) and
GABA(B) agonists in gamma-hydroxybutyrate (GHB)-treated rats: cross-tolerance to
baclofen but not flunitrazepam. Eur J Pharmacol 552:83-89.
Snead OC, 3rd (1978) Gamma hydroxybutyrate in the monkey. I. Electroencephalographic,
behavioral, and pharmacokinetic studies. Neurology 28:636-642.
Snead OC, 3rd (1990) gamma-Hydroxybutyric acid-induced seizures bear no relation to core
temperature. Epilepsia 31:253-258.
Snead OC, 3rd (1991) The gamma-hydroxybutyrate model of absence seizures: correlation of
regional brain levels of gamma-hydroxybutyric acid and gamma-butyrolactone with spike
wave discharges. Neuropharmacology 30:161-167.
Snead OC, 3rd, Yu RK and Huttenlocher PR (1976) Gamma hydroxybutyrate. Correlation of
serum and cerebrospinal fluid levels with electroencephalographic and behavioral effects.
Neurology 26:51-56.
Tedeschi L, Carai MA, Frison G, Favretto D, Colombo G, Ferrara SD and Gessa GL (2003)
Endogenous gamma-hydroxybutyric acid is in the rat, mouse and human gastrointestinal
tract. Life Sci 72:2481-2488.
Van Sassenbroeck DK, De Paepe P, Belpaire FM, Rosseel MT, Martens P, Boon PA and
Buylaert WA (2001) Relationship between gamma-hydroxybutyrate plasma
concentrations and its electroencephalographic effects in the rat. J Pharm Pharmacol
53:1687-1696.
This article has not been copyedited and formatted. The final version may differ from this version.JPET Fast Forward. Published on March 9, 2010 as DOI: 10.1124/jpet.109.165381
at ASPE
T Journals on O
ctober 18, 2021jpet.aspetjournals.org
Dow
nloaded from

JPET #165381
29
Wang Q, Wang X and Morris ME (2008a) Effects of L-lactate and D-mannitol on gamma-
hydroxybutyrate toxicokinetics and toxicodynamics in rats. Drug Metab Dispos 36:2244-
2251.
Wang X, Wang Q and Morris ME (2008b) Pharmacokinetic interaction between the flavonoid
luteolin and gamma-hydroxybutyrate in rats: potential involvement of monocarboxylate
transporters. AAPS J 10:47-55.
This article has not been copyedited and formatted. The final version may differ from this version.JPET Fast Forward. Published on March 9, 2010 as DOI: 10.1124/jpet.109.165381
at ASPE
T Journals on O
ctober 18, 2021jpet.aspetjournals.org
Dow
nloaded from

JPET #165381
30
FOOTNOTES
This work was supported by the National Institute of Health National Institute of Drug Abuse
[Grant DA 023223]. MAF received a Graduate Fellowship from Pfizer Global Research and
Development.
This article has not been copyedited and formatted. The final version may differ from this version.JPET Fast Forward. Published on March 9, 2010 as DOI: 10.1124/jpet.109.165381
at ASPE
T Journals on O
ctober 18, 2021jpet.aspetjournals.org
Dow
nloaded from
JPET #165381
31
LEGENDS FOR FIGURES
Figure 1: Relationship between GHB dose and sedative/hypnotic effect. Animals were
administered GHB by iv bolus (200, 400, 600 or 1000 mg/kg, iv bolus). Data are presented as
mean ± S.D. (N = 7 – 10 per dose). Sleep time represents the difference between return to
righting reflex (RRR) and loss of righting reflex (LRR). *P < 0.05 when compared to 200 mg/kg
dose.
Figure 2: Toxicokinetic/toxicodynamic relationship between GHB-induced sleep time
(sedative/hypnotic effect) and plasma AUC. Data are presented as mean ± S.D. of a specific dose
(N = 7 – 10 per data point). Data were obtained from the current toxicokinetic/toxicodynamic
study involving iv administration of GHB (200 to 1000 mg/kg). Plasma AUC was calculated by
noncompartmental analysis. The solid line is the fitted line based on linear regression while the
dashed lines represent the 95% confidence intervals.
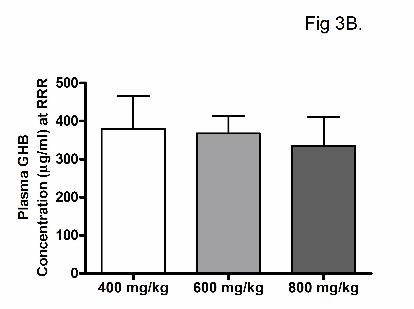
Figure 3: Dependence of RRR on plasma GHB concentration. (A) Plasma GHB concentrations
at RRR were calculated by non-compartmental analysis from the GHB pharmacokinetic profiles.
Rats were administered GHB by iv bolus (200, 400, 600 or 1000 mg/kg) and plasma samples
were obtained for up to 6 hours post-dose. (B) Plasma GHB concentrations were obtained by
destructive sampling at RRR. Rats were administered GHB by iv bolus (400, 600 or 800 mg/kg).
Data are presented as mean ± S.D. (N = 7 – 10 per dose, except 200 mg/kg where N = 2). There
were no statistically significant differences.
This article has not been copyedited and formatted. The final version may differ from this version.JPET Fast Forward. Published on March 9, 2010 as DOI: 10.1124/jpet.109.165381
at ASPE
T Journals on O
ctober 18, 2021jpet.aspetjournals.org
Dow
nloaded from
JPET #165381
32
Figure 4: Toxicokinetic/toxicodynamic relationships between GHB cerebrospinal fluid
concentrations and RRR. GHB (400, 600 or 800 mg/kg) was administered by iv bolus. When
animals regained their righting reflex, CSF was obtained from the cisterna magna. Data are
presented as mean ± S.D. (N = 7 – 8 per dose). *P < 0.05 when compared to 400 mg/kg dose.
Figure 5: Toxicokinetic/toxicodynamic relationships between GHB concentrations in whole
brain and discrete brain regions and RRR. GHB (400, 600 or 800 mg/kg) was administered by iv
bolus. When animals regained their righting reflex, brain regions [(A) whole brain (right
hemisphere), (B) frontal cortex, (C) striatum and (D) hippocampus] were obtained following
exsanguination of anesthetized animals. Data are presented as mean ± S.D. (N = 7 – 8 for whole
brain and N = 3 – 4 for discrete brain regions).
Figure 6: Toxicokinetic/toxicodynamic relationships between GHB concentrations in frontal
cortex extracellular fluid (ECF) and RRR. GHB (400, 600 or 800 mg/kg) was administered by iv
bolus. Dialysate samples were collected in twenty minute intervals for 6 hours post-dose. Frontal
cortex ECF GHB concentration at RRR was determined by noncompartmental analysis. Data are
presented as mean ± S.D. (N = 3 per dose). There were no statistically significant differences.
This article has not been copyedited and formatted. The final version may differ from this version.JPET Fast Forward. Published on March 9, 2010 as DOI: 10.1124/jpet.109.165381
at ASPE
T Journals on O
ctober 18, 2021jpet.aspetjournals.org
Dow
nloaded from
JPET #165381
33
Figure 7: Time-course of GABA changes from baseline in frontal cortex following
administration of iv GHB at doses of 400 (dotted line), 600 (dashed line) or 800 (solid line)
mg/kg. Results are presented as a percentage of the mean baseline GABA level in GHB naïve
animals (N = 3 per time-point).
This article has not been copyedited and formatted. The final version may differ from this version.JPET Fast Forward. Published on March 9, 2010 as DOI: 10.1124/jpet.109.165381
at ASPE
T Journals on O
ctober 18, 2021jpet.aspetjournals.org
Dow
nloaded from

JPET #165381
34
TABLES
Table 1. Mass spectrometer conditions for MRM of GHB, GABA and glutamate.
Parameter (units) GHB GABA Glutamate
Q1/Q3 105.2/87.2 104.2/87.0 148.0/84.0
Declustering potential (V) 20 20 22
Focusing Potential (V) 125 100 150
Collision Energy 20 18 22
Collision Cell Exit Potential (V) 10 8 12
This article has not been copyedited and formatted. The final version may differ from this version.JPET Fast Forward. Published on March 9, 2010 as DOI: 10.1124/jpet.109.165381
at ASPE
T Journals on O
ctober 18, 2021jpet.aspetjournals.org
Dow
nloaded from

JPET #165381
35
Table 2. Mean percentage changes in GABA and glutamate in discrete brain regions at RRR
following administration of 400, 600 or 800 mg/kg GHB iv. Percentage changes were calculated
based on mean RRR for a given dose group.
GABA (% of baseline) Glutamate (% of baseline)
Dose (mg/kg) Frontal Cortex Striatum Hippocampus Frontal Cortex Striatum Hippocampus
400 92.9 97.8 93.4 78.4 79.9 93.9
600 94.9 119.0 91.6 92.5 87.1 97.8
800 102.5 98.3 91.8 99.7 66.7 81.8
This article has not been copyedited and formatted. The final version may differ from this version.JPET Fast Forward. Published on March 9, 2010 as DOI: 10.1124/jpet.109.165381
at ASPE
T Journals on O
ctober 18, 2021jpet.aspetjournals.org
Dow
nloaded from

This article has not been copyedited and formatted. The final version may differ from this version.JPET Fast Forward. Published on March 9, 2010 as DOI: 10.1124/jpet.109.165381
at ASPE
T Journals on O
ctober 18, 2021jpet.aspetjournals.org
Dow
nloaded from

This article has not been copyedited and formatted. The final version may differ from this version.JPET Fast Forward. Published on March 9, 2010 as DOI: 10.1124/jpet.109.165381
at ASPE
T Journals on O
ctober 18, 2021jpet.aspetjournals.org
Dow
nloaded from

This article has not been copyedited and formatted. The final version may differ from this version.JPET Fast Forward. Published on March 9, 2010 as DOI: 10.1124/jpet.109.165381
at ASPE
T Journals on O
ctober 18, 2021jpet.aspetjournals.org
Dow
nloaded from
This article has not been copyedited and formatted. The final version may differ from this version.JPET Fast Forward. Published on March 9, 2010 as DOI: 10.1124/jpet.109.165381
at ASPE
T Journals on O
ctober 18, 2021jpet.aspetjournals.org
Dow
nloaded from

This article has not been copyedited and formatted. The final version may differ from this version.JPET Fast Forward. Published on March 9, 2010 as DOI: 10.1124/jpet.109.165381
at ASPE
T Journals on O
ctober 18, 2021jpet.aspetjournals.org
Dow
nloaded from

This article has not been copyedited and formatted. The final version may differ from this version.JPET Fast Forward. Published on March 9, 2010 as DOI: 10.1124/jpet.109.165381
at ASPE
T Journals on O
ctober 18, 2021jpet.aspetjournals.org
Dow
nloaded from

This article has not been copyedited and formatted. The final version may differ from this version.JPET Fast Forward. Published on March 9, 2010 as DOI: 10.1124/jpet.109.165381
at ASPE
T Journals on O
ctober 18, 2021jpet.aspetjournals.org
Dow
nloaded from

This article has not been copyedited and formatted. The final version may differ from this version.JPET Fast Forward. Published on March 9, 2010 as DOI: 10.1124/jpet.109.165381
at ASPE
T Journals on O
ctober 18, 2021jpet.aspetjournals.org
Dow
nloaded from