Embed Size (px)
Citation preview
Latest insights and themes across J.P. Morgan Model Portfolios
J.P. Morgan Quarterly Models & Markets
January 2022
Amy Moroz, CFAInvestment Specialist,J.P. Morgan Multi-Asset [email protected]
2
J.P. Morgan Model Portfolios
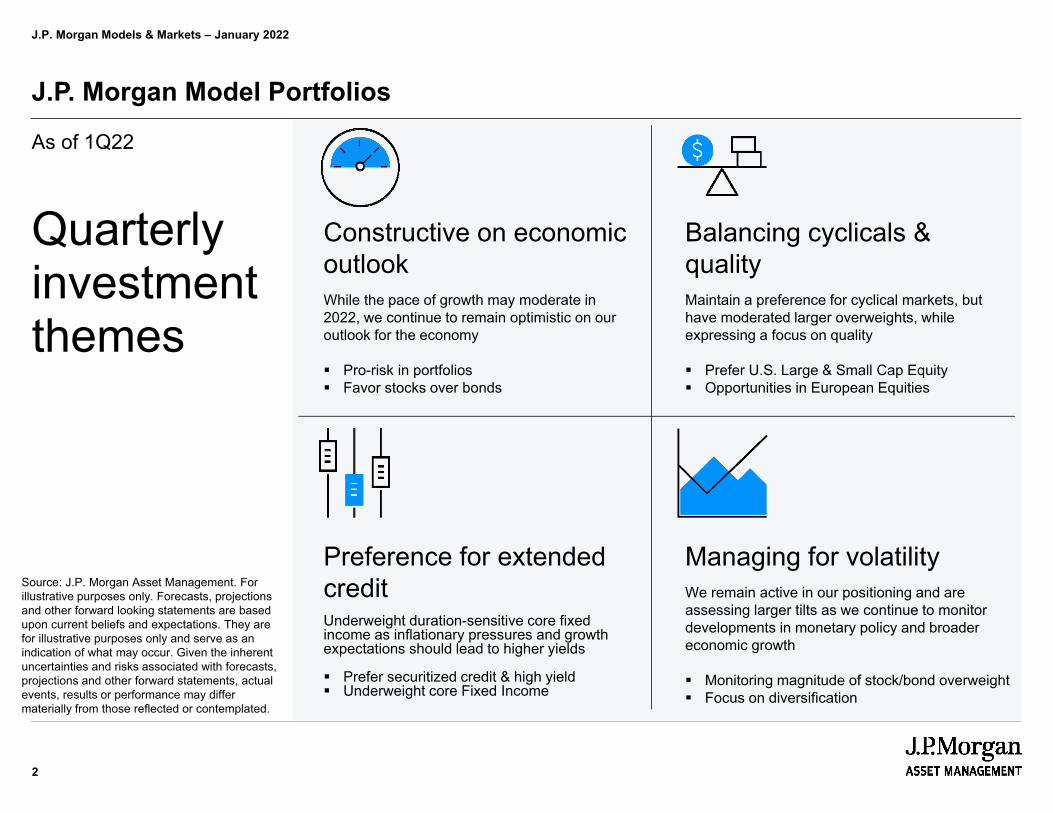
Quarterly investment themes
As of 1Q22
Source: J.P. Morgan Asset Management. For illustrative purposes only. Forecasts, projections and other forward looking statements are based upon current beliefs and expectations. They are for illustrative purposes only and serve as an indication of what may occur. Given the inherent uncertainties and risks associated with forecasts, projections and other forward statements, actual events, results or performance may differ materially from those reflected or contemplated.
J.P. Morgan Models & Markets – January 2022
Constructive on economic outlookWhile the pace of growth may moderate in 2022, we continue to remain optimistic on our outlook for the economy
Pro-risk in portfolios Favor stocks over bonds
Balancing cyclicals & qualityMaintain a preference for cyclical markets, but have moderated larger overweights, while expressing a focus on quality
Prefer U.S. Large & Small Cap Equity Opportunities in European Equities
Preference for extended creditUnderweight duration-sensitive core fixed income as inflationary pressures and growth expectations should lead to higher yields
Prefer securitized credit & high yield Underweight core Fixed Income
Managing for volatilityWe remain active in our positioning and are assessing larger tilts as we continue to monitor developments in monetary policy and broader economic growth
Monitoring magnitude of stock/bond overweight Focus on diversification
3
J.P. Morgan Model Portfolios – Themes summary
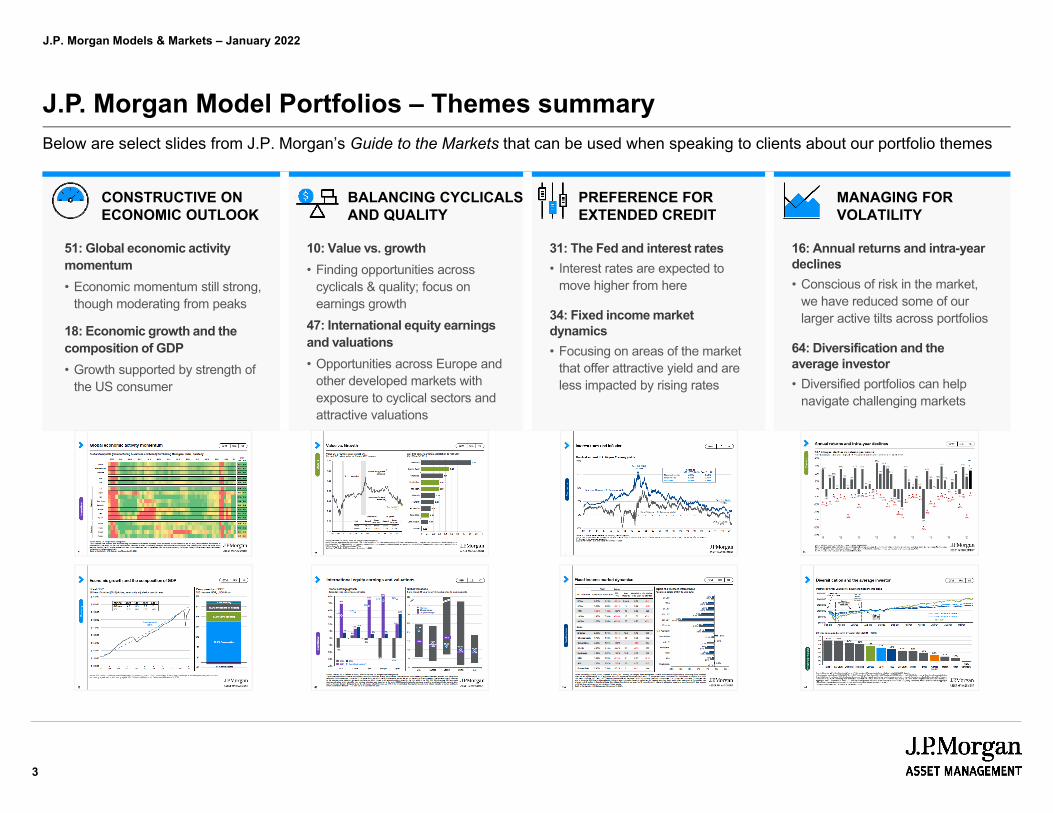
CONSTRUCTIVE ON ECONOMIC OUTLOOK
BALANCING CYCLICALS AND QUALITY
PREFERENCE FOR EXTENDED CREDIT
MANAGING FOR VOLATILITY
51: Global economic activity momentum• Economic momentum still strong,
though moderating from peaks
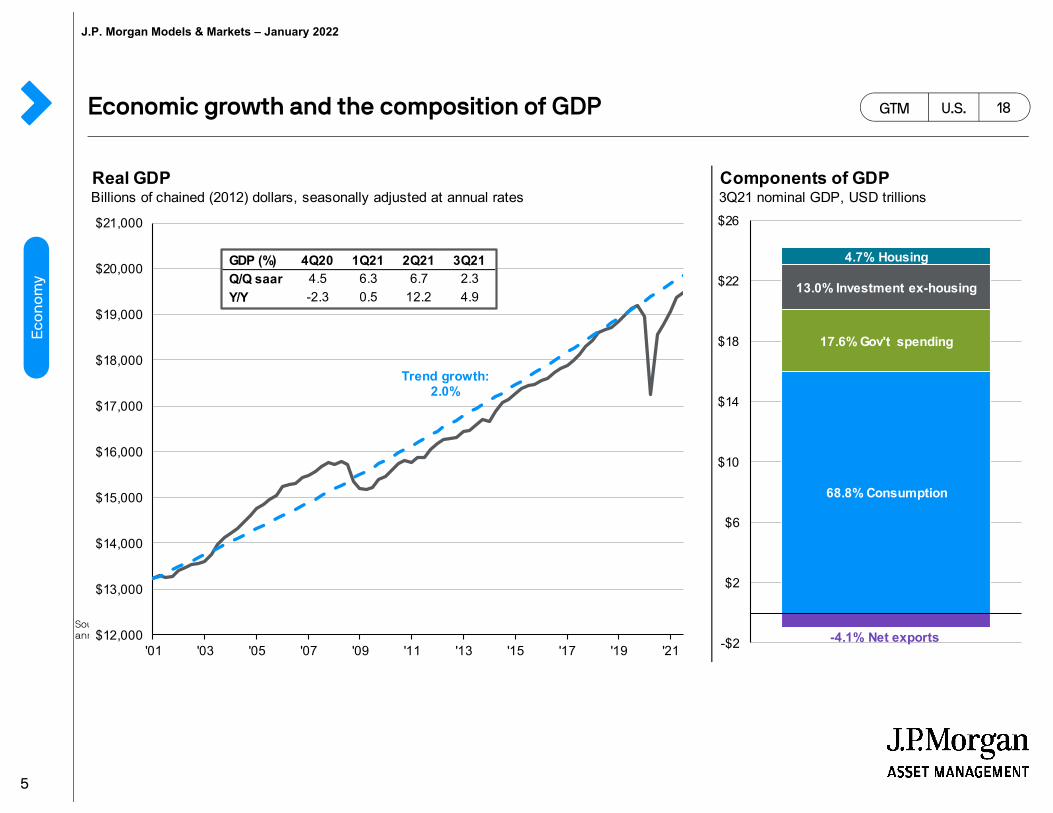
18: Economic growth and the composition of GDP• Growth supported by strength of
the US consumer
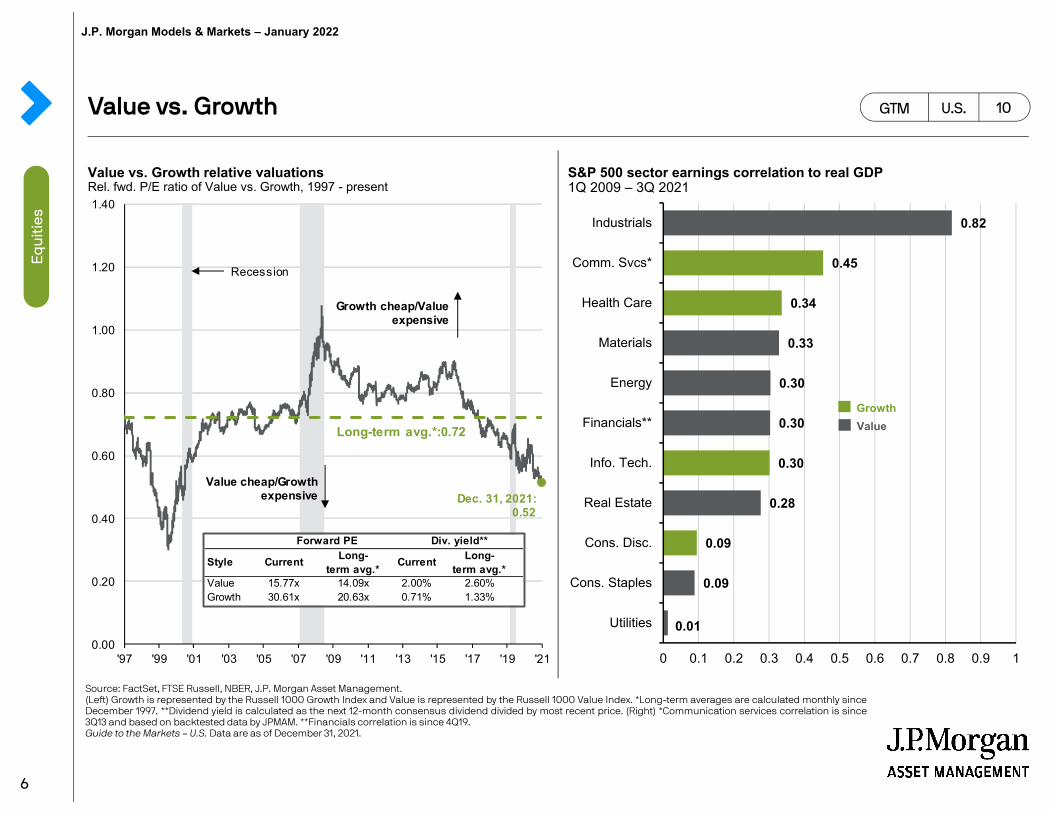
10: Value vs. growth• Finding opportunities across
cyclicals & quality; focus on earnings growth
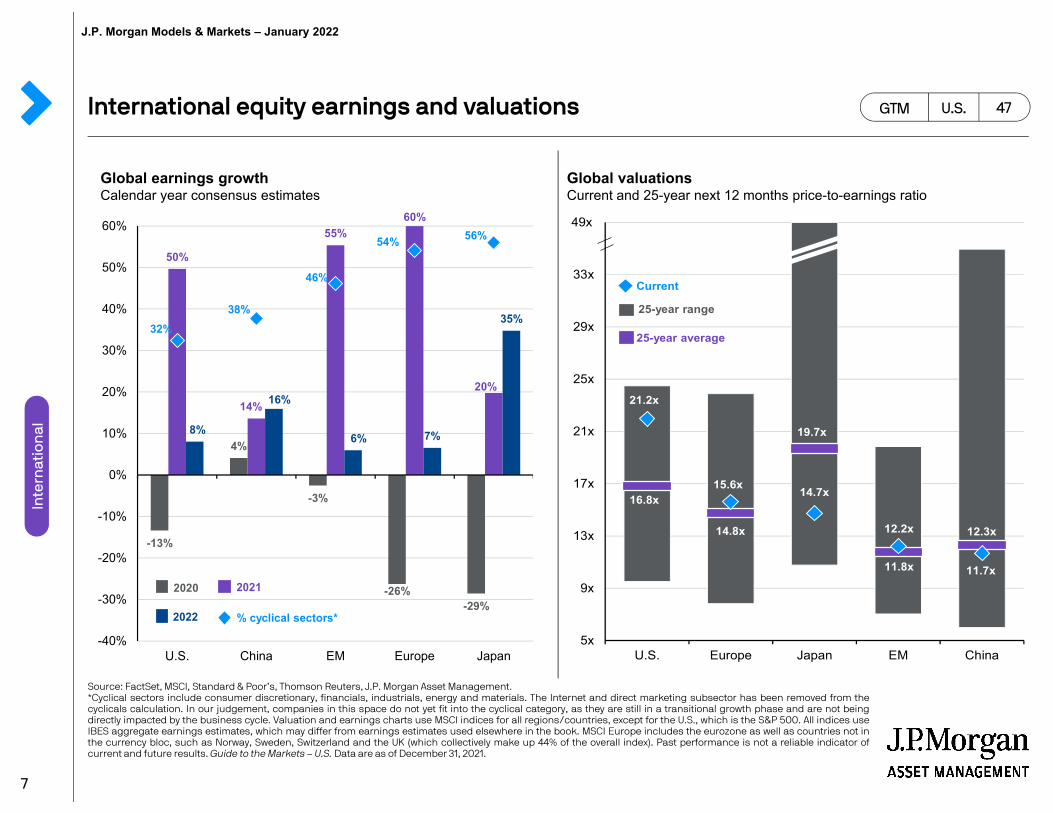
47: International equity earnings and valuations• Opportunities across Europe and
other developed markets with exposure to cyclical sectors and attractive valuations
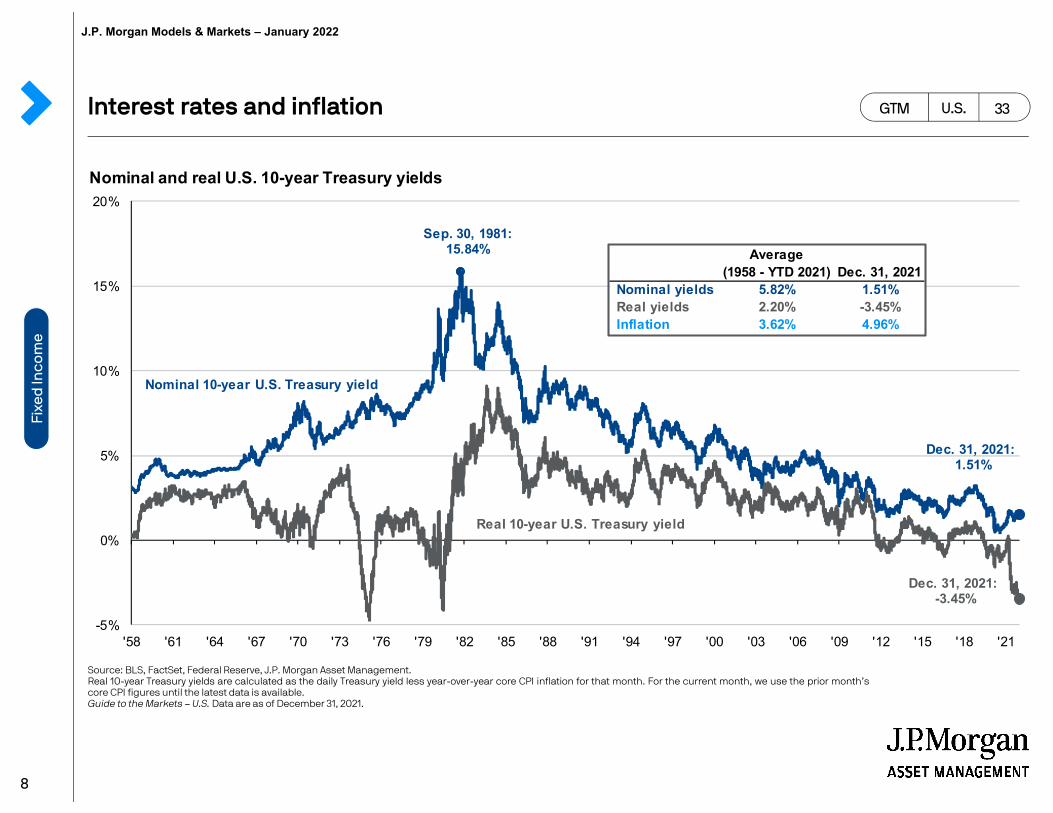
31: The Fed and interest rates• Interest rates are expected to
move higher from here
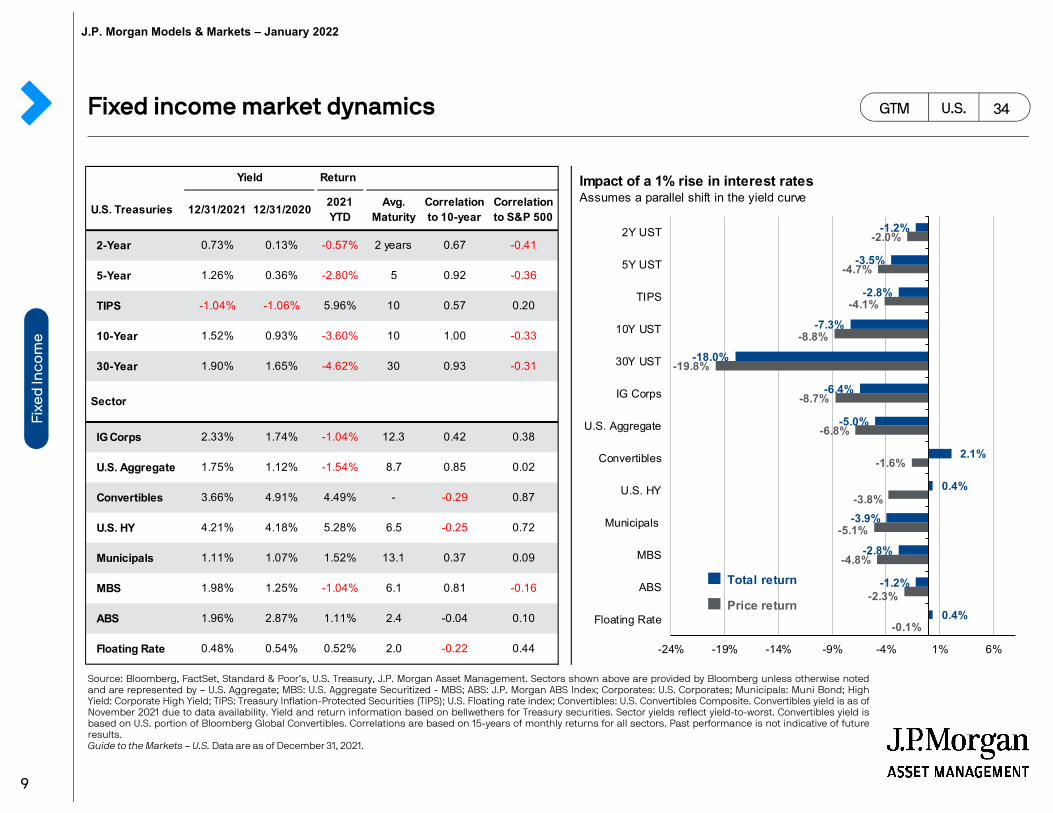
34: Fixed income market dynamics• Focusing on areas of the market
that offer attractive yield and are less impacted by rising rates
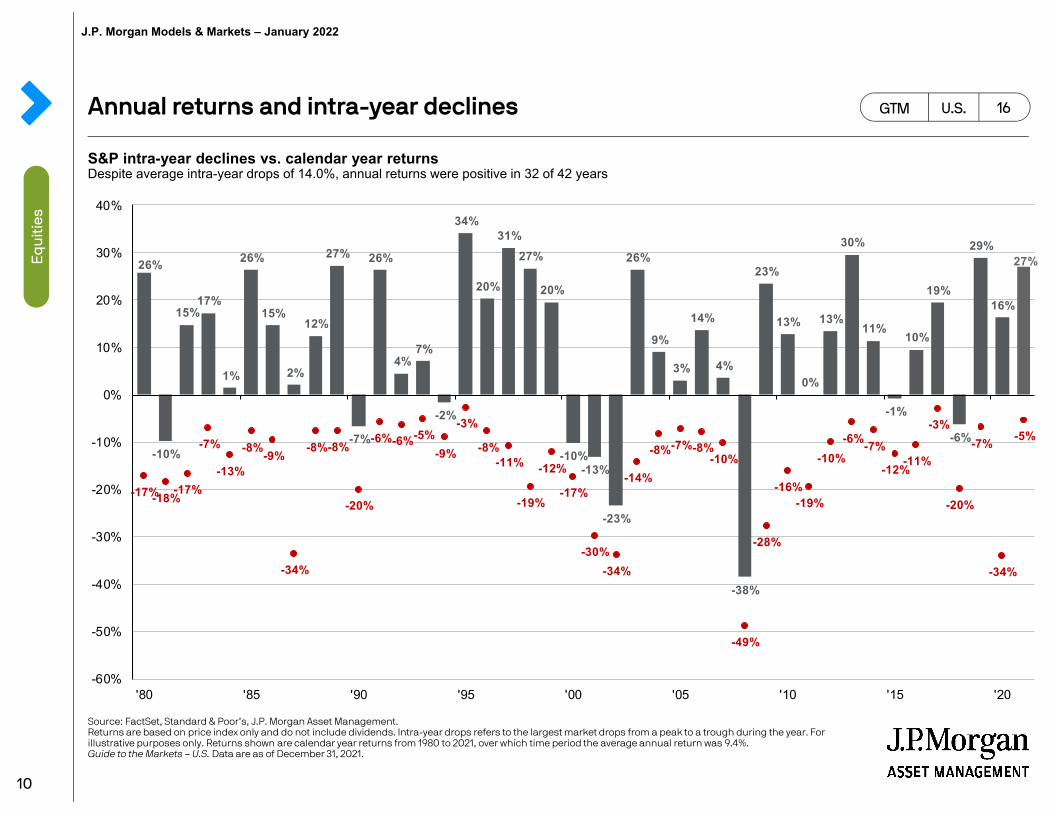
16: Annual returns and intra-year declines• Conscious of risk in the market,
we have reduced some of our larger active tilts across portfolios
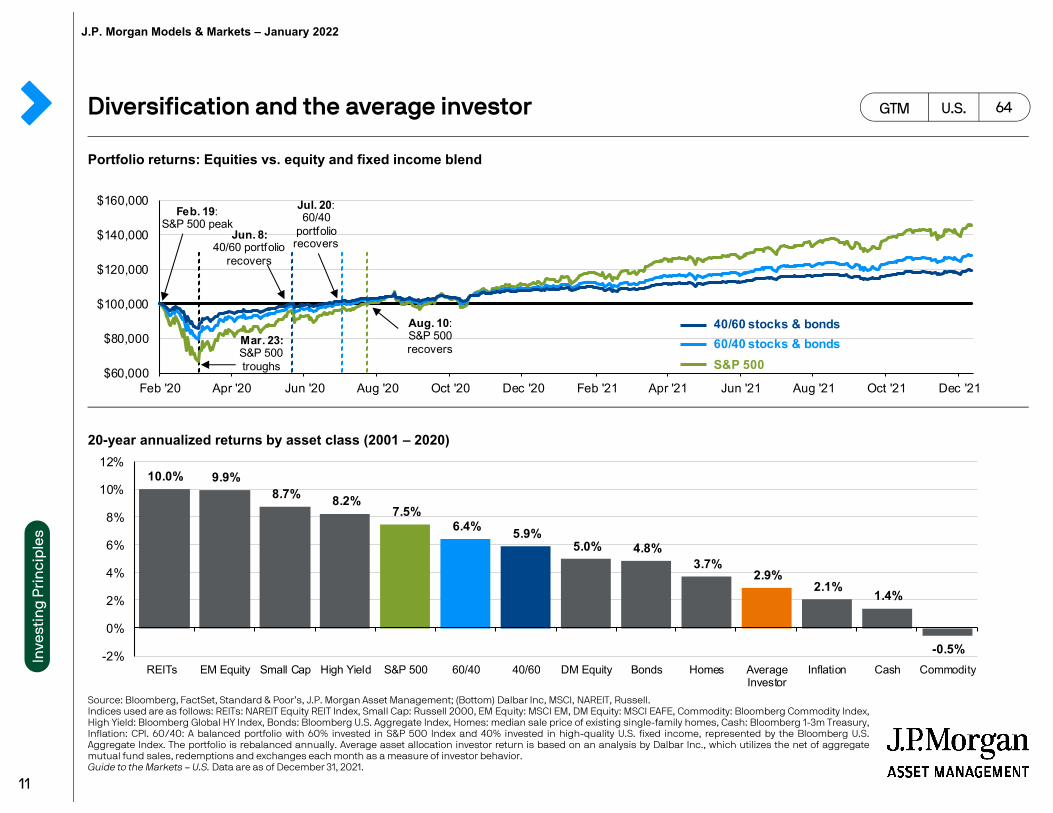
64: Diversification and the average investor• Diversified portfolios can help
navigate challenging markets
Below are select slides from J.P. Morgan’s Guide to the Markets that can be used when speaking to clients about our portfolio themes
J.P. Morgan Models & Markets – January 2022
4
Nov Dec
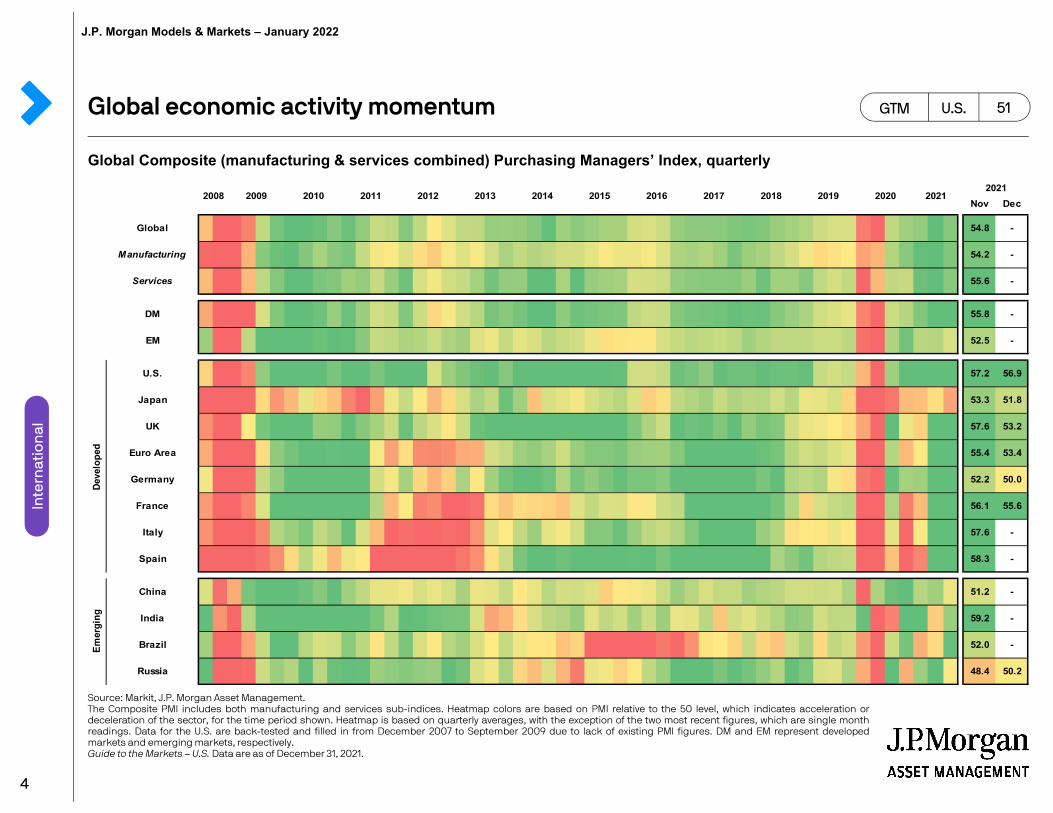
Global 54.8 -
Manufacturing 54.2 -
Services 55.6 -
DM 55.8 -
EM 52.5 -
U.S. 57.2 56.9
Japan 53.3 51.8
UK 57.6 53.2
Euro Area 55.4 53.4
Germany 52.2 50.0
France 56.1 55.6
Italy 57.6 -
Spain 58.3 -
China 51.2 -
India 59.2 -
Brazil 52.0 -
Russia 48.4 50.2
2018 2019 2020 20212013 2014 2015 2016 20172021
Deve
lope
dEm
ergi
ng
2008 2009 2010 2011 2012
Global economic activity momentum
Global Composite (manufacturing & services combined) Purchasing Managers’ Index, quarterly
Source: Markit, J.P. Morgan Asset Management.The Composite PMI includes both manufacturing and services sub-indices. Heatmap colors are based on PMI relative to the 50 level, which indicates acceleration ordeceleration of the sector, for the time period shown. Heatmap is based on quarterly averages, with the exception of the two most recent figures, which are single monthreadings. Data for the U.S. are back-tested and filled in from December 2007 to September 2009 due to lack of existing PMI figures. DM and EM represent developedmarkets and emerging markets, respectively.Guide to the Markets – U.S. Data are as of December 31, 2021.
GTM U.S. 51
Inte
rnat
ion
alJ.P. Morgan Models & Markets – January 2022
5
Economic growth and the composition of GDP GTM U.S.
Source: BEA, FactSet, J.P. Morgan Asset Management. Values may not sum to 100% due to rounding. Trend growth is measured as the averageannual growth rate from business cycle peak 1Q01 to business cycle peak 4Q19. Guide to the Markets – U.S. Data are as of December 31, 2021.
Eco
no
my
18
Real GDP Components of GDPBillions of chained (2012) dollars, seasonally adjusted at annual rates 3Q21 nominal GDP, USD trillions
68.8% Consumption
17.6% Gov't spending
13.0% Investment ex-housing
4.7% Housing
-4.1% Net exports-$2
$2
$6
$10
$14
$18
$22
$26
$12,000
$13,000
$14,000
$15,000
$16,000
$17,000
$18,000
$19,000
$20,000
$21,000
'01 '03 '05 '07 '09 '11 '13 '15 '17 '19 '21
Trend growth: 2.0%
GDP (%) 4Q20 1Q21 2Q21 3Q21 Q/Q saar 4.5 6.3 6.7 2.3 Y/Y -2.3 0.5 12.2 4.9
J.P. Morgan Models & Markets – January 2022
6
0.00
0.20
0.40
0.60
0.80
1.00
1.20
1.40
'97 '99 '01 '03 '05 '07 '09 '11 '13 '15 '17 '19 '21
Dec. 31, 2021:0.52
Recession
Value cheap/Growth expensive
Growth cheap/Value expensive
Style Current Long-term avg.* Current Long-
term avg.*Value 15.77x 14.09x 2.00% 2.60%Growth 30.61x 20.63x 0.71% 1.33%
Forward PE Div. yield**
Long-term avg.*:0.72
Value vs. Growth
Value vs. Growth relative valuationsRel. fwd. P/E ratio of Value vs. Growth, 1997 - present
S&P 500 sector earnings correlation to real GDP1Q 2009 – 3Q 2021
Source: FactSet, FTSE Russell, NBER, J.P. Morgan Asset Management.(Left) Growth is represented by the Russell 1000 Growth Index and Value is represented by the Russell 1000 Value Index. *Long-term averages are calculated monthly sinceDecember 1997. **Dividend yield is calculated as the next 12-month consensus dividend divided by most recent price. (Right) *Communication services correlation is since3Q13 and based on backtested data by JPMAM. **Financials correlation is since 4Q19.Guide to the Markets – U.S. Data are as of December 31, 2021.
GTM U.S. 10
Eq
uit
ies
0.01
0.09
0.09
0.28
0.30
0.30
0.30
0.33
0.34
0.45
0.82
0 0.1 0.2 0.3 0.4 0.5 0.6 0.7 0.8 0.9 1
Utilities
Cons. Staples
Cons. Disc.
Real Estate
Info. Tech.
Financials**
Energy
Materials
Health Care
Comm. Svcs*
Industrials
GrowthValue
J.P. Morgan Models & Markets – January 2022
7
International equity earnings and valuations
Source: FactSet, MSCI, Standard & Poor’s, Thomson Reuters, J.P. Morgan Asset Management.*Cyclical sectors include consumer discretionary, financials, industrials, energy and materials. The Internet and direct marketing subsector has been removed from thecyclicals calculation. In our judgement, companies in this space do not yet fit into the cyclical category, as they are still in a transitional growth phase and are not beingdirectly impacted by the business cycle. Valuation and earnings charts use MSCI indices for all regions/countries, except for the U.S., which is the S&P 500. All indices useIBES aggregate earnings estimates, which may differ from earnings estimates used elsewhere in the book. MSCI Europe includes the eurozone as well as countries not inthe currency bloc, such as Norway, Sweden, Switzerland and the UK (which collectively make up 44% of the overall index). Past performance is not a reliable indicator ofcurrent and future results. Guide to the Markets – U.S. Data are as of December 31, 2021.
GTM U.S.
Global earnings growth Calendar year consensus estimates
Global valuationsCurrent and 25-year next 12 months price-to-earnings ratio
47
Inte
rnat
ion
al
-13%
4%
-3%
-26%-29%
50%
14%
55%60%
20%
8%
16%
6% 7%
35%32%
38%
46%
54% 56%
-40%
-30%
-20%
-10%
0%
10%
20%
30%
40%
50%
60%
U.S. China EM Europe Japan
2020
2022
2021
% cyclical sectors*
16.8x
14.8x
19.7x
11.8x
12.3x
21.2x
15.6x 14.7x
12.2x
11.7x
5x
9x
13x
17x
21x
25x
29x
33x
37x
U.S. Europe Japan EM China
Current
25-year range
25-year average
49x
J.P. Morgan Models & Markets – January 2022
8
Interest rates and inflation GTM U.S.
Source: BLS, FactSet, Federal Reserve, J.P. Morgan Asset Management.Real 10-year Treasury yields are calculated as the daily Treasury yield less year-over-year core CPI inflation for that month. For the current month, we use the prior month’score CPI figures until the latest data is available.Guide to the Markets – U.S. Data are as of December 31, 2021.
33
Nominal and real U.S. 10-year Treasury yields
-5%
0%
5%
10%
15%
20%
'58 '61 '64 '67 '70 '73 '76 '79 '82 '85 '88 '91 '94 '97 '00 '03 '06 '09 '12 '15 '18 '21
Sep. 30, 1981: 15.84%
Dec. 31, 2021:-3.45%
Dec. 31, 2021:1.51%
Average(1958 - YTD 2021) Dec. 31, 2021
Nominal yields 5.82% 1.51% Real yields 2.20% -3.45% Inflation 3.62% 4.96%
Real 10-year U.S. Treasury yield
Nominal 10-year U.S. Treasury yield
Fixe
d In
com
eJ.P. Morgan Models & Markets – January 2022
9
Fixed income market dynamics GTM U.S.
Source: Bloomberg, FactSet, Standard & Poor’s, U.S. Treasury, J.P. Morgan Asset Management. Sectors shown above are provided by Bloomberg unless otherwise notedand are represented by – U.S. Aggregate; MBS: U.S. Aggregate Securitized - MBS; ABS: J.P. Morgan ABS Index; Corporates: U.S. Corporates; Municipals: Muni Bond; HighYield: Corporate High Yield; TIPS: Treasury Inflation-Protected Securities (TIPS); U.S. Floating rate index; Convertibles: U.S. Convertibles Composite. Convertibles yield is as ofNovember 2021 due to data availability. Yield and return information based on bellwethers for Treasury securities. Sector yields reflect yield-to-worst. Convertibles yield isbased on U.S. portion of Bloomberg Global Convertibles. Correlations are based on 15-years of monthly returns for all sectors. Past performance is not indicative of futureresults.Guide to the Markets – U.S. Data are as of December 31, 2021.
34
Return Impact of a 1% rise in interest rates
U.S. Treasuries 12/31/2021 12/31/2020 2021 YTD
Avg. Maturity
Correlation to 10-year
Correlation to S&P 500
Assumes a parallel shift in the yield curve
2-Year 0.73% 0.13% -0.57% 2 years 0.67 -0.41
5-Year 1.26% 0.36% -2.80% 5 0.92 -0.36
TIPS -1.04% -1.06% 5.96% 10 0.57 0.20
10-Year 1.52% 0.93% -3.60% 10 1.00 -0.33
30-Year 1.90% 1.65% -4.62% 30 0.93 -0.31
Sector
IG Corps 2.33% 1.74% -1.04% 12.3 0.42 0.38
U.S. Aggregate 1.75% 1.12% -1.54% 8.7 0.85 0.02
Convertibles 3.66% 4.91% 4.49% - -0.29 0.87
U.S. HY 4.21% 4.18% 5.28% 6.5 -0.25 0.72
Municipals 1.11% 1.07% 1.52% 13.1 0.37 0.09
MBS 1.98% 1.25% -1.04% 6.1 0.81 -0.16
ABS 1.96% 2.87% 1.11% 2.4 -0.04 0.10
Floating Rate 0.48% 0.54% 0.52% 2.0 -0.22 0.44
Yield
-0.1%
-2.3%
-4.8%
-5.1%
-3.8%
-1.6%
-6.8%
-8.7%
-19.8%
-8.8%
-4.1%
-4.7%
-2.0%
0.4%
-1.2%
-2.8%
-3.9%
0.4%
2.1%
-5.0%
-6.4%
-18.0%
-7.3%
-2.8%
-3.5%
-1.2%
-24% -19% -14% -9% -4% 1% 6%
Floating Rate
ABS
MBS
Municipals
U.S. HY
Convertibles
U.S. Aggregate
IG Corps
30Y UST
10Y UST
TIPS
5Y UST
2Y UST
Total return
Price return
Fixe
d In
com
eJ.P. Morgan Models & Markets – January 2022
10
Annual returns and intra-year declines
S&P intra-year declines vs. calendar year returnsDespite average intra-year drops of 14.0%, annual returns were positive in 32 of 42 years
Source: FactSet, Standard & Poor’s, J.P. Morgan Asset Management.Returns are based on price index only and do not include dividends. Intra-year drops refers to the largest market drops from a peak to a trough during the year. For illustrative purposes only. Returns shown are calendar year returns from 1980 to 2021, over which time period the average annual return was 9.4%.Guide to the Markets – U.S. Data are as of December 31, 2021.
GTM U.S. 16
Eq
uit
ies
26%
-10%
15%17%
1%
26%
15%
2%
12%
27%
-7%
26%
4%7%
-2%
34%
20%
31%27%
20%
-10%-13%
-23%
26%
9%
3%
14%
4%
-38%
23%
13%
0%
13%
30%
11%
-1%
10%
19%
-6%
29%
16%
27%
-17%-18%-17%
-7%
-13%
-8%-9%
-34%
-8%-8%
-20%
-6%-6%-5%-9%
-3%
-8%-11%
-19%
-12%
-17%
-30%-34%
-14%
-8%-7%-8%-10%
-49%
-28%
-16%-19%
-10%-6%-7%
-12%-11%
-3%
-20%
-7%
-34%
-5%
-60%
-50%
-40%
-30%
-20%
-10%
0%
10%
20%
30%
40%
'80 '85 '90 '95 '00 '05 '10 '15 '20
J.P. Morgan Models & Markets – January 2022
11
Portfolio returns: Equities vs. equity and fixed income blend
20-year annualized returns by asset class (2001 – 2020)
Diversification and the average investor
Source: Bloomberg, FactSet, Standard & Poor’s, J.P. Morgan Asset Management; (Bottom) Dalbar Inc, MSCI, NAREIT, Russell.Indices used are as follows: REITs: NAREIT Equity REIT Index, Small Cap: Russell 2000, EM Equity: MSCI EM, DM Equity: MSCI EAFE, Commodity: Bloomberg Commodity Index,High Yield: Bloomberg Global HY Index, Bonds: Bloomberg U.S. Aggregate Index, Homes: median sale price of existing single-family homes, Cash: Bloomberg 1-3m Treasury,Inflation: CPI. 60/40: A balanced portfolio with 60% invested in S&P 500 Index and 40% invested in high-quality U.S. fixed income, represented by the Bloomberg U.S.Aggregate Index. The portfolio is rebalanced annually. Average asset allocation investor return is based on an analysis by Dalbar Inc., which utilizes the net of aggregatemutual fund sales, redemptions and exchanges each month as a measure of investor behavior.Guide to the Markets – U.S. Data are as of December 31, 2021.
GTM U.S. 64
Inve
stin
g P
rin
cip
les
$60,000
$80,000
$100,000
$120,000
$140,000
$160,000
Feb '20 Apr '20 Jun '20 Aug '20 Oct '20 Dec '20 Feb '21 Apr '21 Jun '21 Aug '21 Oct '21 Dec '21
Mar. 23: S&P 500 troughs
Jul. 20: 60/40
portfolio recovers
Jun. 8:40/60 portfolio
recovers
Aug. 10: S&P 500 recovers
Feb. 19: S&P 500 peak
10.0% 9.9%8.7% 8.2%
7.5%6.4% 5.9%
5.0% 4.8%3.7%
2.9%2.1%
1.4%
-0.5%-2%
0%
2%
4%
6%
8%
10%
12%
REITs EM Equity Small Cap High Yield S&P 500 60/40 40/60 DM Equity Bonds Homes AverageInvestor
Inflation Cash Commodity
40/60 stocks & bonds60/40 stocks & bondsS&P 500
J.P. Morgan Models & Markets – January 2022

12
Disclosures and other legal copySlides only to be used with JPMorgan Models & Markets audio: www.jpmorgan.com/modelportfoliosThis material is not an offer or solicitation for the purchase or sale of any financial instrument in any jurisdiction, nor is it a commitment by JPMorgan Asset Management or any of its subsidiaries (collectively “JPMAM”) to enter into any transaction referenced herein. All information provided by JPMAM herein is indicative, based on certain assumptions and current market conditions and subject to change without notice. Opinions, estimates, forecasts, and statements of financial market trends based on current market conditions constitute our judgment and subject to change without notice. We believe the information provided here is reliable. These views and strategies described may not be suitable for all investors. References to specific securities, asset classes and financial markets are for illustrative purposes only and not intended to be, and should not be interpreted as, recommendations. Past performance is no guarantee of future results.
RISKS ASSOCIATED WITH INVESTING: Stock investing involves risk including loss of principal. Small Cap stocks may be subject to a higher degree of risk than more established companies’ securities. The illiquidity of the Small Cap market may adversely affect the value of these investments. Investing in real estate/REITs involves special risks such as potential illiquidity and may not be suitable for all investors. There is no assurance that the investment objectives of this program will be attained. International investing involves a greater degree of risk and increased volatility. Changes in currency exchange rates and differences in accounting and taxation policies outside the U.S. can raise or lower returns. Some overseas markets may not be as politically and economically stable as the United States and other nations.
Bonds are subject to market and interest rate risk if sold prior to maturity. Bond values will decline as interest rates rise and are subject to availability and change in price. High yield/junk bonds (grade BB or below) are not investment grade securities, and are subject to higher interest rate, credit, and liquidity risks than those graded BBB and above. They generally should be part of a diversified portfolio for sophisticated investors. There is no guarantee that a diversified portfolio will enhance overall returns or outperform a non-diversified portfolio. Diversification does not protect against market risk. The target return, volatility target and controlled beta target (collectively, the `Targets') shown are not meant to represent actual experience of the Strategy.
These Targets are provided for illustrative purposes only and are subject to significant limitations. An investor should not expect to achieve actual Strategy experience similar to the Targets shown herein. The Targets are the manager's goals based on the manager's calculations using available data, assumptions based on past and current market conditions, and available investment opportunities, each of which are subject to change. Because of the inherent limitations involved in setting these Targets, potential investors should not rely on them when making a decision on whether or not to invest in this Strategy. The Targets cannot account for the impact that economic, market, and other factors may have on the implementation of an actual investment program. Unlike actual performance, the Targets do not reflect actual trading, liquidity constraints, fees, expenses, taxes and other factors that could impact the future performance of the Strategy. The manager's ability to achieve the Targets is subject to risk factors over which the manager may have no or limited control. Prospective investors should understand the risks factors associated with the Strategy.
No representation is being made that the Strategy will achieve the Targets or its investment objective. Actual Strategy experience could be higher or lower than the Targets. Managers seek to achieve the stated objectives. There is no guarantee the objectives will be met. There can be no assurance that the professionals currently employed by JPMAM will continue to be employed by JPMAM or that the past performance or success of any such professional serves as an indicator of such professional’s future performance or success.
Any securities/portfolio holdings mentioned throughout the presentation are shown for illustrative purposes only and should not be interpreted as recommendations to buy or sell. A full list of firm recommendations for the past year are available upon request.
J.P. Morgan ETFs are distributed by JPMorgan Distribution Services, Inc., (1111 Polaris Pkwy, Columbus, OH 43240) which is an affiliate of JPMorgan Chase & Co. Affiliates of JPMorgan Chase & Co. receive fees for providing various services to the funds. JPMorgan Distribution Services, Inc. is a member of FINRA. JPMorgan Funds are distributed by JPMorgan Distribution Services, Inc. (JPMDS) and offered by J.P. Morgan Institutional Investments, Inc. (JPMII); both affiliates of JPMorgan Chase & Co. Affiliates of JPMorgan Chase & Co. receive fees for providing various services to the funds. JPMDS and JPMII are both members of FINRA.
J.P. Morgan Asset Management is the marketing name for the asset management businesses of JPMorgan Chase & Co. and its affiliates worldwide.
Copyright 2022 JPMorgan Chase & Co. All rights reserved.
J.P. Morgan Models & Markets – January 2022