Embed Size (px)
Citation preview

JP MORGAN GLOBAL HIGH YIELD AND LEVERAGED FINANCE CONFERENCEMarch 1, 2016
1
FORWARD-LOOKING AND OTHER INFORMATIONIMPORTANT INFORMATIONThis information is current only as of its date and may have changed. We undertake no obligation to update this information in light of new information, future events or otherwise. This information contains certain financial projections and forecasts and other forward looking information concerning our business, prospects, financial condition and results of operations, and we are not making any representation or warranty that this information is accurate or complete. See “Forward-Looking Information” below.BASIS OF PRESENTATIONWe have recently completed the sale of our recycling and specification alloys and extrusions businesses. We have reported these businesses as discontinued operations for all periods presented, and reclassified the results of operations of these businesses as discontinued operations. Except as otherwise indicated, the discussion of the Company’s business and financial information throughout this presentation refers to the Company’s continuing operations and the financial position and results of operations of its continuing operations.FORWARD-LOOKING INFORMATIONCertain statements contained in this presentation are “forward-looking statements” within the meaning of the federal securities laws. Statements about our beliefs and expectations and statements containing the words “may,” “could,” “would,” “should,” “will,” “believe,” “expect,” “anticipate,” “plan,” “estimate,” “target,” “project,” “look forward to,” “intend” and similar expressions intended to connote future events and circumstances constitute forward-looking statements. Forward-looking statements include statements about, among other things, future costs and prices of commodities, production volumes, industry trends, anticipated cost savings, anticipated benefits from new products, facilities, acquisitions or divestitures, projected results of operations, achievement of production efficiencies, capacity expansions, future prices and demand for our products and estimated cash flows and sufficiency of cash flows to fund capital expenditures. Forward-looking statements involve known and unknown risks and uncertainties, which could cause actual results to differ materially from those contained in or implied by any forward-looking statement. Some of the important factors that could cause actual results to differ materially from those expressed or implied by forward-looking statements include, but are not limited to, the following: (1) our ability to successfully implement our business strategy; (2) the success of past and future acquisitions and divestitures; (3) the cyclical nature of the aluminum industry, material adverse changes in the aluminum industry or our end-use segments, such as global and regional supply and demand conditions for aluminum and aluminum products, and changes in our customers’ industries; (4) our ability to enter into effective metal, energy and other commodity derivatives or arrangements with customers to manage effectively our exposure to commodity price fluctuations and changes in the pricing of metals, especially London Metal Exchange-based aluminum prices; (5) increases in the cost of raw materials and energy; (6) our ability to generate sufficient cash flows to fund our capital expenditure requirements and to meet our debt service obligations; (7) our ability to fulfill our substantial capital investment requirements; (8) our ability to retain the services of certain members of our management; (9) our internal controls over financial reporting and our disclosure controls and procedures may not prevent all possible errors that could occur; (10) the loss of order volumes from any of our largest customers; (11) our ability to retain customers, a substantial number of whom do not have long-term contractual arrangements with us; (12) competitor pricing activity, competition of aluminum with alternative materials and the general impact of competition in the industry segments we serve; (13) risks of investing in and conducting operations on a global basis, including political, social, economic, currency and regulatory factors; (14) variability in general economic conditions on a global or regional basis; (15) current environmental liabilities and the cost of compliance with and liabilities under health and safety laws; (16) labor relations (i.e., disruptions, strikes or work stoppages) and labor costs; (17) our levels of indebtedness and debt service obligations, including changes in our credit ratings, material increases in our cost of borrowing or the failure of financial institutions to fulfill their commitments to us under committed facilities; (18) our ability to access the credit and capital markets; (19) the possibility that we may incur additional indebtedness in the future; (20) limitations on operating our business as a result of covenant restrictions under our indebtedness, and our ability to pay amounts due under the Senior Notes; and (21) other factors discussed in our filings with the Securities and Exchange Commission, including the sections entitled “Risk Factors” contained therein. Investors, potential investors and other readers are urged to consider these factors carefully in evaluating the forward-looking statements and are cautioned not to place undue reliance on such forward-looking statements. We undertake no obligation to publicly update or revise any forward-looking statements, whether in response to new information, futures events or otherwise, except as otherwise required by law.NON-GAAP INFORMATIONThe non-GAAP financial measures contained in this presentation (including, without limitation, EBITDA, Adjusted EBITDA, Commercial Margin, Cash Conversion Costs and variations thereof) are not measures of financial performance calculated in accordance with U.S. GAAP and should not be considered as alternatives to net income and loss attributable to Aleris Corporation or any other performance measure derived in accordance with GAAP or as alternatives to cash flows from operating activities as a measure of our liquidity. Non-GAAP measures have limitations as analytical tools and should be considered in addition to, not in isolation or as a substitute for, or as superior to, our measures of financial performance prepared in accordance with GAAP. Management believes that certain non-GAAP performance measures may provide investors with additional meaningful comparisons between current results and results in prior periods. Management uses non-GAAP financial measures as performance metrics and believes these measures provide additional information commonly used by the holders of our senior debt securities and parties to the 2015 ABL Facility with respect to the ongoing performance of our underlying business activities, as well as our ability to meet our future debt service, capital expenditures and working capital needs. These adjustments are based on currently available information and certain adjustments that we believe are reasonable and are presented as an aid in understanding our operating results. They are not necessarily indicative of future results of operations that may be obtained by the Company.INDUSTRY INFORMATIONInformation regarding market and industry statistics contained in this presentation is based on information from third party sources as well as estimates prepared by us using certain assumptions and our knowledge of these industries. Our estimates, in particular as they relate to our general expectations concerning the aluminum industry, involve risks and uncertainties and are subject to changes based on various factors, including those discussed under “Risk Factors” in our filings with the Securities and Exchange Commission.
2
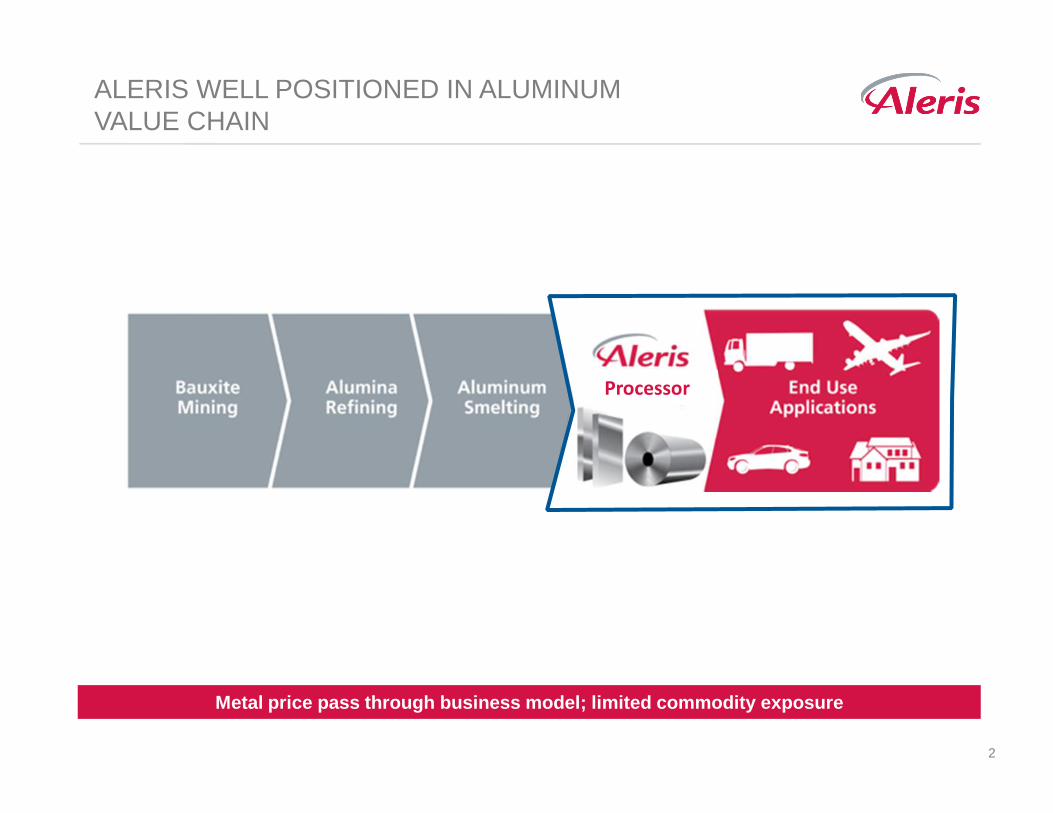
ALERIS WELL POSITIONED IN ALUMINUM VALUE CHAIN
Metal price pass through business model; limited co mmodity exposure
Processor
3
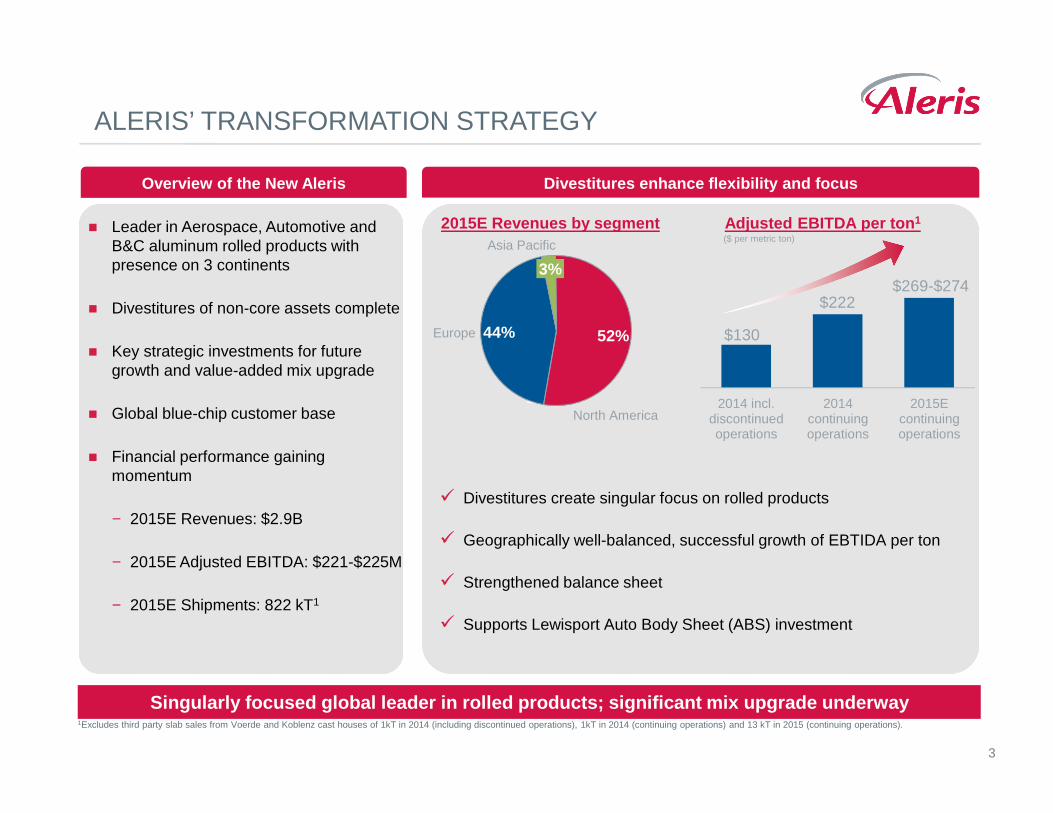
ALERIS’ TRANSFORMATION STRATEGY
Overview of the New Aleris
29%
38%
Divestitures enhance flexibility and focus
Singularly focused global leader in rolled products ; significant mix upgrade underway
2015E Revenues by segment Adjusted EBITDA per ton 1
� Divestitures create singular focus on rolled products
� Geographically well-balanced, successful growth of EBTIDA per ton
� Strengthened balance sheet
� Supports Lewisport Auto Body Sheet (ABS) investment
1Excludes third party slab sales from Voerde and Koblenz cast houses of 1kT in 2014 (including discontinued operations), 1kT in 2014 (continuing operations) and 13 kT in 2015 (continuing operations).
$130
$222
2014 incl.discontinuedoperations
2014continuingoperations
2015Econtinuingoperations
($ per metric ton)� Leader in Aerospace, Automotive and
B&C aluminum rolled products with presence on 3 continents
� Divestitures of non-core assets complete
� Key strategic investments for future growth and value-added mix upgrade
� Global blue-chip customer base
� Financial performance gaining momentum
− 2015E Revenues: $2.9B
− 2015E Adjusted EBITDA: $221-$225M
− 2015E Shipments: 822 kT1
44%Europe
3%
Asia Pacific
52%
North America
$269-$274
4
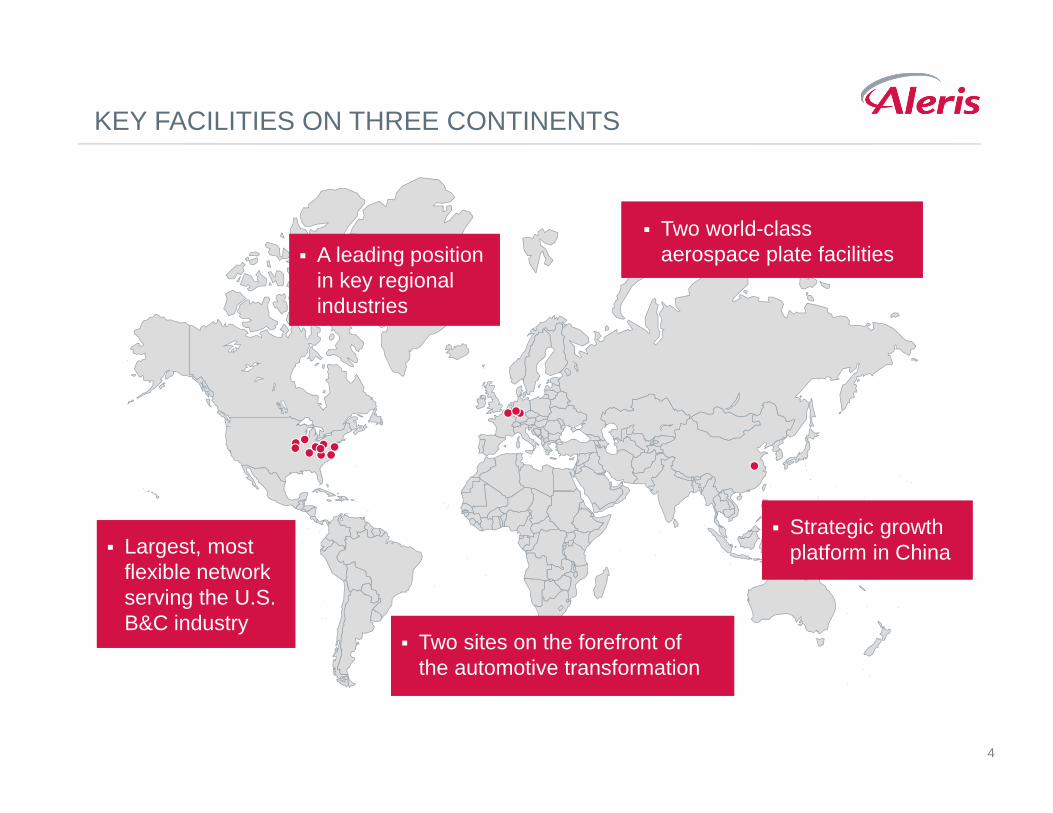
� Two world-class aerospace plate facilities
� Two sites on the forefront of the automotive transformation
� Largest, most flexible network serving the U.S. B&C industry
� A leading position in key regional industries
� Strategic growth platform in China
KEY FACILITIES ON THREE CONTINENTS
5
Switzerland
GermanyBelgium
Koblenz
VoerdeDuffel
China
Zhenjiang
Shanghai
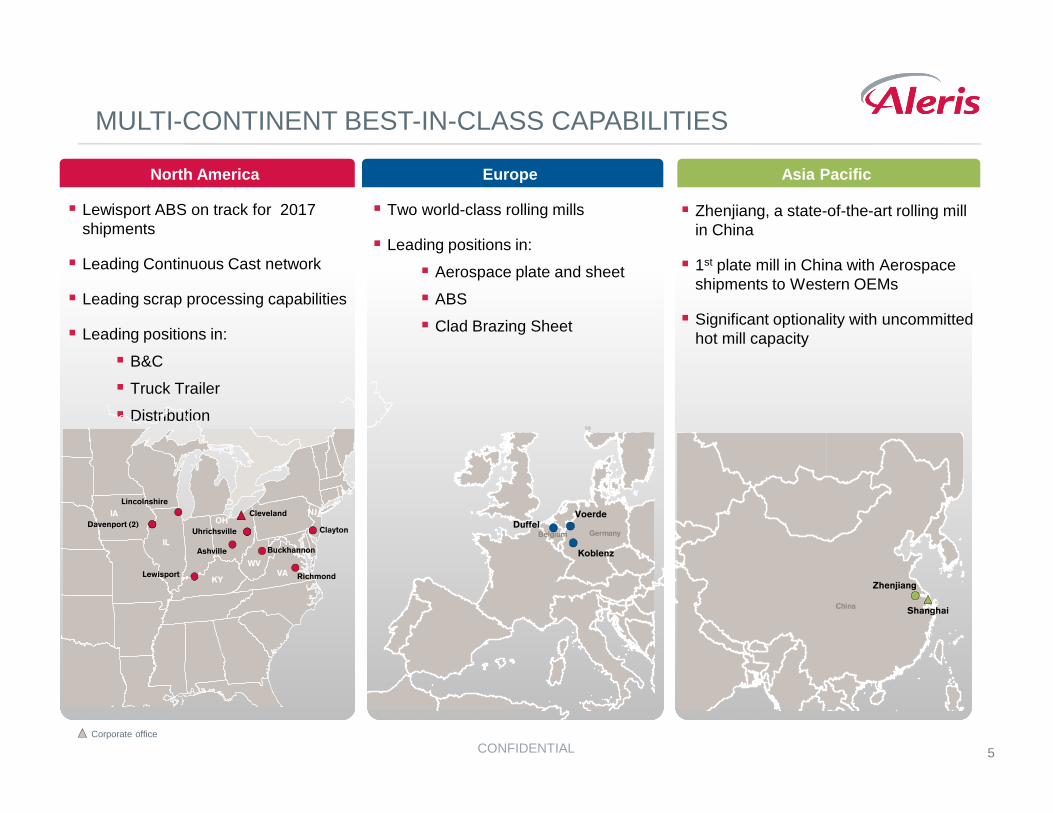
MULTI-CONTINENT BEST-IN-CLASS CAPABILITIES
North America Europe Asia Pacific
� Lewisport ABS on track for 2017 shipments
� Leading Continuous Cast network
� Leading scrap processing capabilities
� Leading positions in:
� B&C
� Truck Trailer
� Distribution
� Two world-class rolling mills
� Leading positions in:
� Aerospace plate and sheet
� ABS
� Clad Brazing Sheet
� Zhenjiang, a state-of-the-art rolling mill in China
� 1st plate mill in China with Aerospace shipments to Western OEMs
� Significant optionality with uncommitted hot mill capacity
CONFIDENTIALCorporate office
OHIA NJ
VA
WV
IL
KY
AL
Uhrichsville
Richmond
Lincolnshire
Lewisport
Davenport (2)Clayton
BuckhannonAshville
Cleveland
6
KEY HIGHLIGHTS
Flexible capital structure
Significant growth investments underpin future perf ormance
Well-positioned to benefit from growth in aluminum consumption
Company-wide focus on best-in-class performance
7
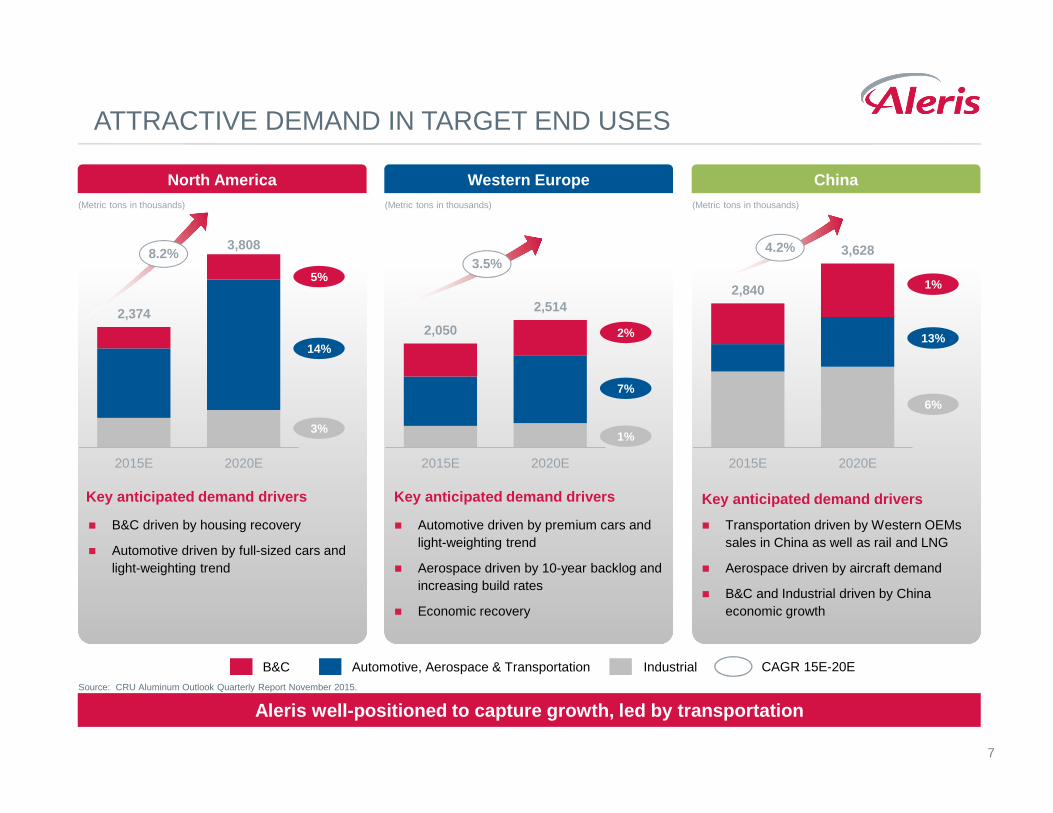
ATTRACTIVE DEMAND IN TARGET END USES
Aleris well-positioned to capture growth, led by tr ansportationSource: CRU Aluminum Outlook Quarterly Report November 2015.
2,374
3,808
2015E 2020E
5%
14%
3%
(Metric tons in thousands)
North America Western Europe China
� B&C driven by housing recovery
� Automotive driven by full-sized cars and light-weighting trend
� Automotive driven by premium cars and light-weighting trend
� Aerospace driven by 10-year backlog and increasing build rates
� Economic recovery
� Transportation driven by Western OEMs sales in China as well as rail and LNG
� Aerospace driven by aircraft demand
� B&C and Industrial driven by China economic growth
8.2%
2,050
2,514
2015E 2020E
2%
7%
1%
(Metric tons in thousands)
3.5%
1%
13%
6%
(Metric tons in thousands)
Automotive, Aerospace & TransportationB&C Industrial CAGR 15E-20E
2,840
3,628
2015E 2020E
4.2%
Key anticipated demand drivers Key anticipated demand driversKey anticipated demand drivers
8
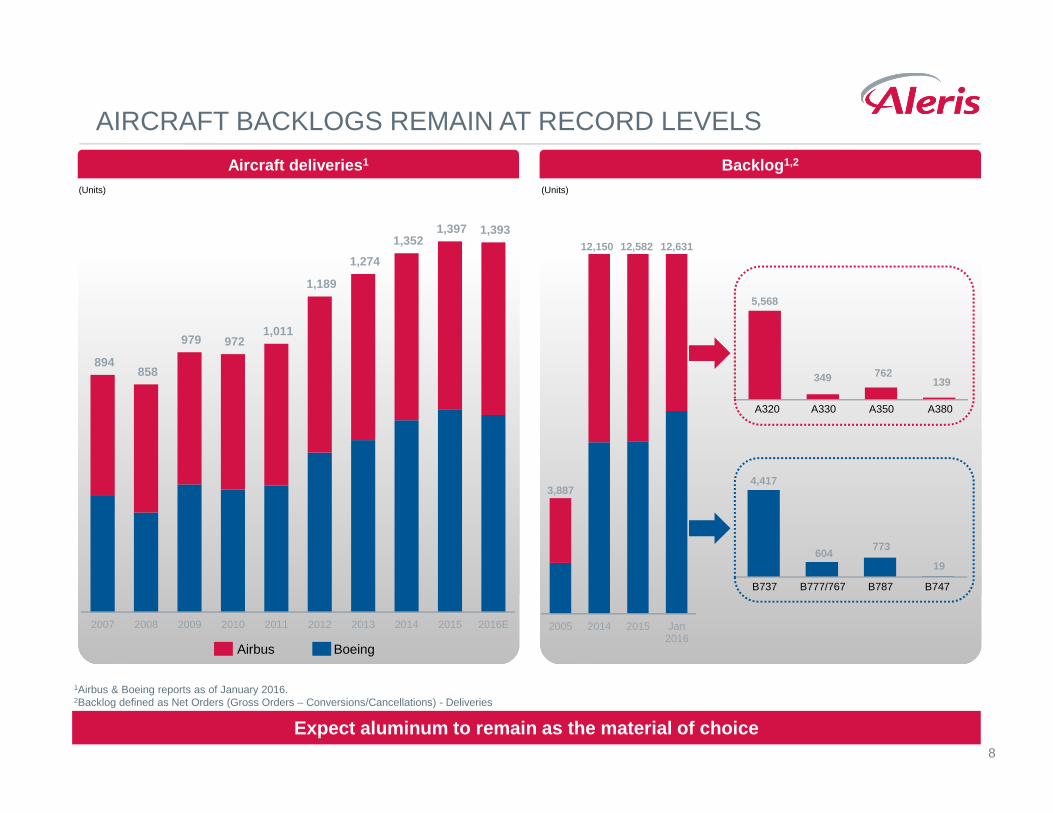
894 858
979 972 1,011
1,189
1,274
1,352 1,397 1,393
2007 2008 2009 2010 2011 2012 2013 2014 2015 2016E
AIRCRAFT BACKLOGS REMAIN AT RECORD LEVELS
1Airbus & Boeing reports as of January 2016.2Backlog defined as Net Orders (Gross Orders – Conversions/Cancellations) - Deliveries
Expect aluminum to remain as the material of choice
349 762 139
A380A350A330A320
5,568
604773
19
B747B787B777/767B737
4,417
2005 2014 2015 Jan2016
12,150
3,887
Aircraft deliveries 1 Backlog 1,2
(Units) (Units)
Airbus Boeing
12,582 12,631
9
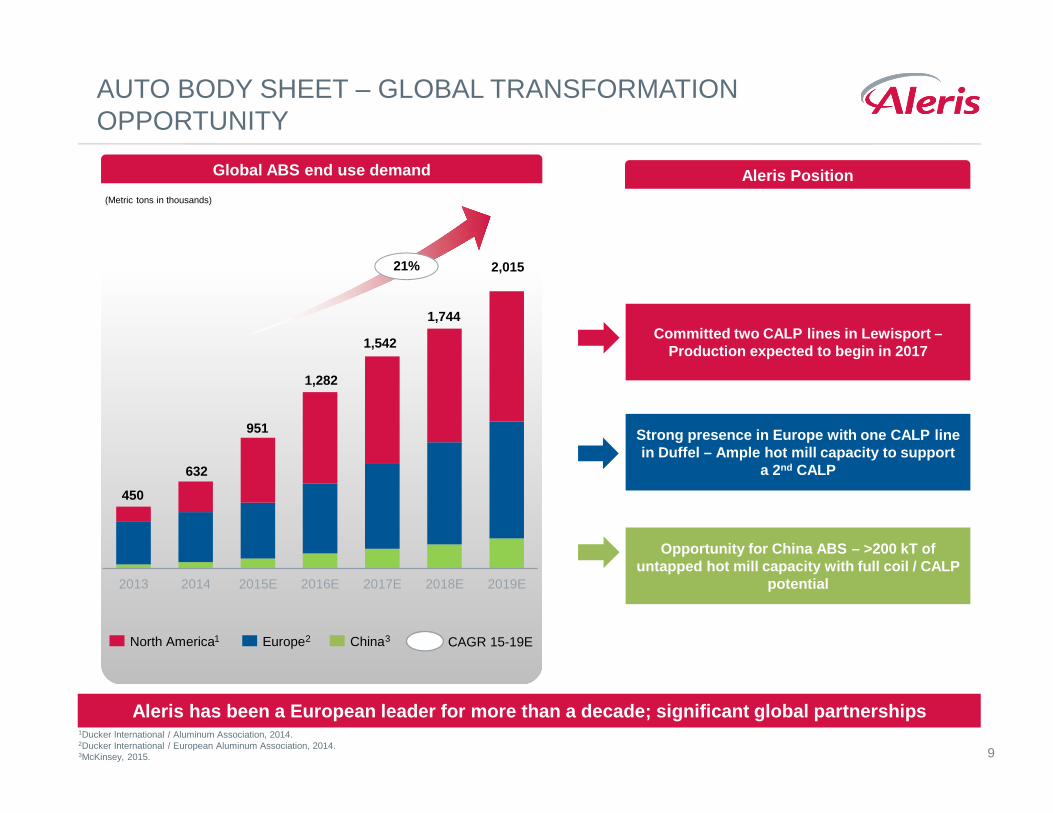
AUTO BODY SHEET – GLOBAL TRANSFORMATION OPPORTUNITY
Opportunity for China ABS – >200 kT of untapped hot mill capacity with full coil / CALP
potential
Committed two CALP lines in Lewisport –Production expected to begin in 2017
Strong presence in Europe with one CALP line in Duffel – Ample hot mill capacity to support
a 2nd CALP
Aleris Position
1Ducker International / Aluminum Association, 2014.2Ducker International / European Aluminum Association, 2014.3McKinsey, 2015.
Aleris has been a European leader for more than a de cade; significant global partnerships
2013 2014 2015E 2016E 2017E 2018E 2019E
2,015
1,744
632
1,542
1,282
951
Europe ChinaNorth America
(Metric tons in thousands)
Global ABS end use demand
21%
450
1 2 3 CAGR 15-19E
10
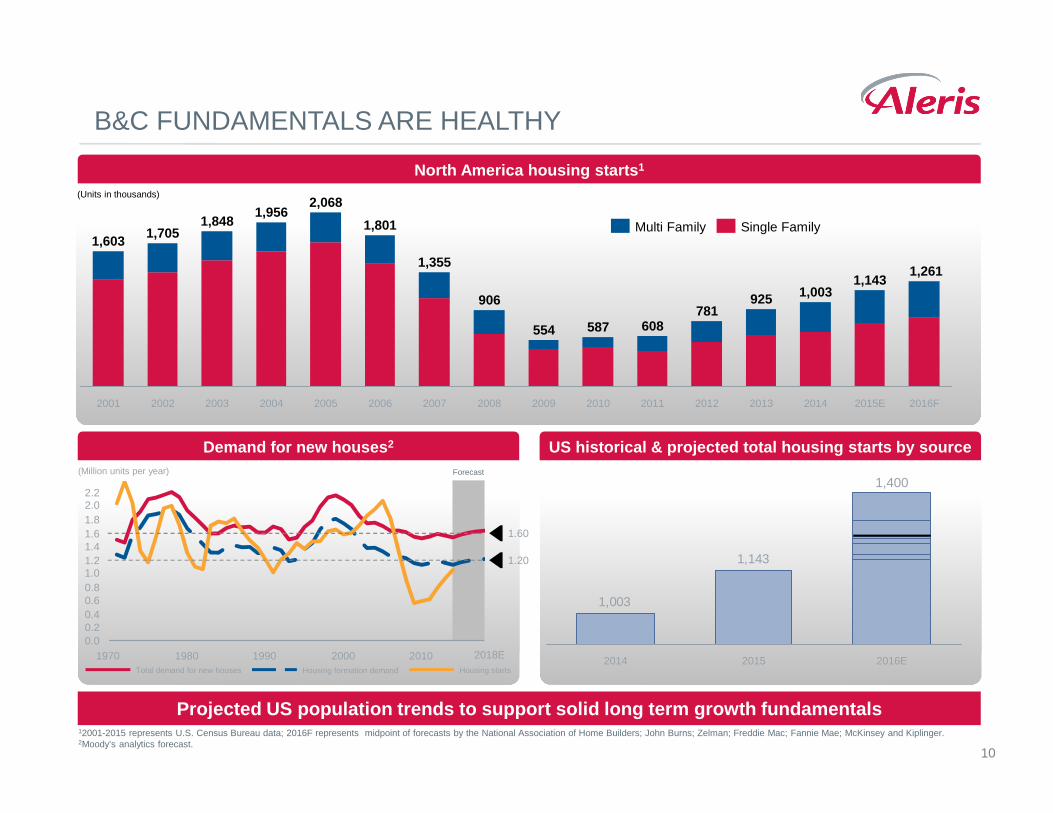
Projected US population trends to support solid lon g term growth fundamentals
2.01.8
2.2
1.61.4
0.81.01.2
0.20.40.6
0.01970 1980 1990 2000 2010 2018E
1.60
1.20
Total demand for new houses Housing formation demand Housing starts
Forecast
12001-2015 represents U.S. Census Bureau data; 2016F represents midpoint of forecasts by the National Association of Home Builders; John Burns; Zelman; Freddie Mac; Fannie Mae; McKinsey and Kiplinger.2Moody’s analytics forecast.
North America housing starts 1
US historical & projected total housing starts by so urceDemand for new houses 2
(Million units per year)
B&C FUNDAMENTALS ARE HEALTHY
(Units in thousands)
1,261
2015E
1,143
2014
1,003
2013
925
2012
781
20112010
608554
2009
587
2016F
906
2008
1,355
2006
1,801
2005
2,068
2004
1,956
2003
1,848
20022001
1,6031,705
2007
Single FamilyMulti Family
1,143
1,003
2016E
1,400
20152014
11
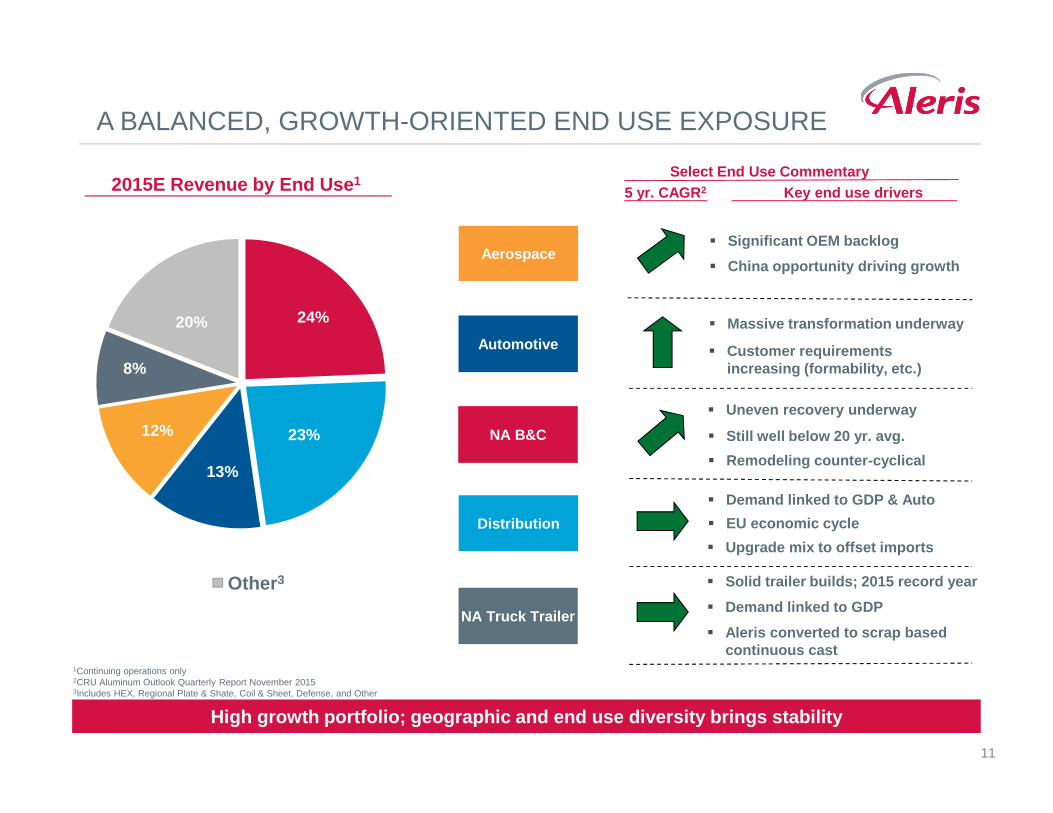
A BALANCED, GROWTH-ORIENTED END USE EXPOSURE
22%
20%13%
24%
6%15%
Other 3
Automotive
NA B&C
Key end use drivers
Aerospace
Distribution
NA Truck Trailer
� Significant OEM backlog
� China opportunity driving growth
� Massive transformation underway
� Customer requirements increasing (formability, etc.)
5 yr. CAGR 22015E Revenue by End Use 1Select End Use Commentary
� Demand linked to GDP & Auto
� EU economic cycle
� Uneven recovery underway
� Still well below 20 yr. avg.
� Remodeling counter-cyclical
High growth portfolio; geographic and end use diver sity brings stability
1Continuing operations only2CRU Aluminum Outlook Quarterly Report November 20153Includes HEX, Regional Plate & Shate, Coil & Sheet, Defense, and Other
24%
23%
13%
12%
8%
20%
� Upgrade mix to offset imports
� Solid trailer builds; 2015 record year
� Demand linked to GDP
� Aleris converted to scrap based continuous cast
12
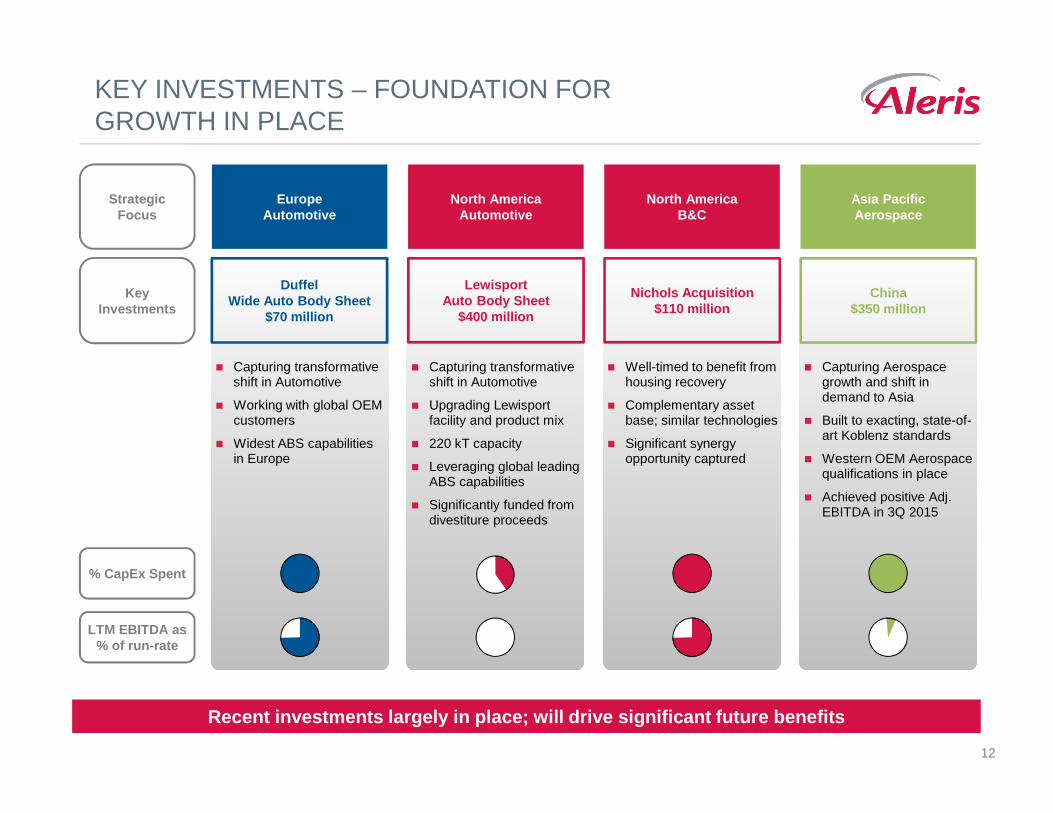
KEY INVESTMENTS – FOUNDATION FOR GROWTH IN PLACE
Recent investments largely in place; will drive sig nificant future benefits
% CapEx Spent
LTM EBITDA as % of run-rate
China$350 million
Duffel Wide Auto Body Sheet
$70 million
Nichols Acquisition$110 million
Lewisport Auto Body Sheet
$400 million
� Capturing Aerospace growth and shift in demand to Asia
� Built to exacting, state-of-art Koblenz standards
� Western OEM Aerospace qualifications in place
� Achieved positive Adj. EBITDA in 3Q 2015
� Capturing transformative shift in Automotive
� Working with global OEM customers
� Widest ABS capabilities in Europe
� Well-timed to benefit from housing recovery
� Complementary asset base; similar technologies
� Significant synergy opportunity captured
� Capturing transformative shift in Automotive
� Upgrading Lewisport facility and product mix
� 220 kT capacity
� Leveraging global leading ABS capabilities
� Significantly funded from divestiture proceeds
Asia PacificAerospace
EuropeAutomotive
North AmericaAutomotive
Strategic Focus
Key Investments
North America B&C
13
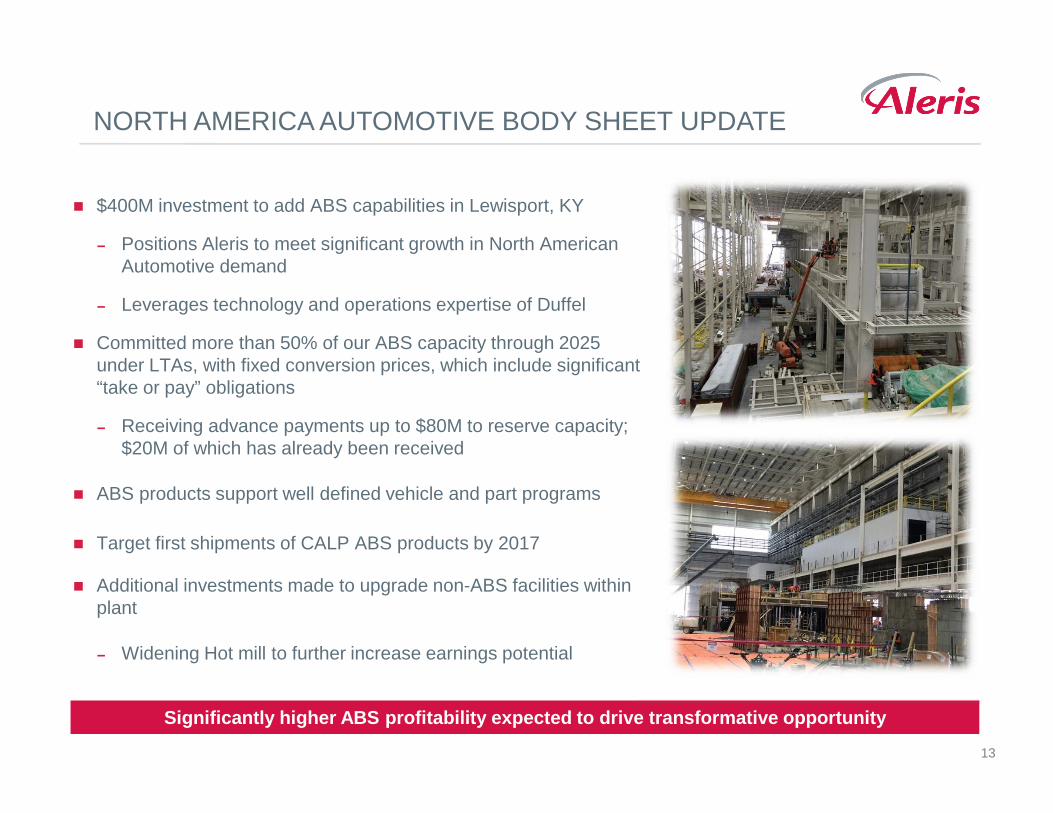
NORTH AMERICA AUTOMOTIVE BODY SHEET UPDATE
Significantly higher ABS profitability expected to drive transformative opportunity
� $400M investment to add ABS capabilities in Lewisport, KY
− Positions Aleris to meet significant growth in North American Automotive demand
− Leverages technology and operations expertise of Duffel
� Committed more than 50% of our ABS capacity through 2025 under LTAs, with fixed conversion prices, which include significant “take or pay” obligations
− Receiving advance payments up to $80M to reserve capacity; $20M of which has already been received
� ABS products support well defined vehicle and part programs
� Target first shipments of CALP ABS products by 2017
� Additional investments made to upgrade non-ABS facilities within plant
− Widening Hot mill to further increase earnings potential
14
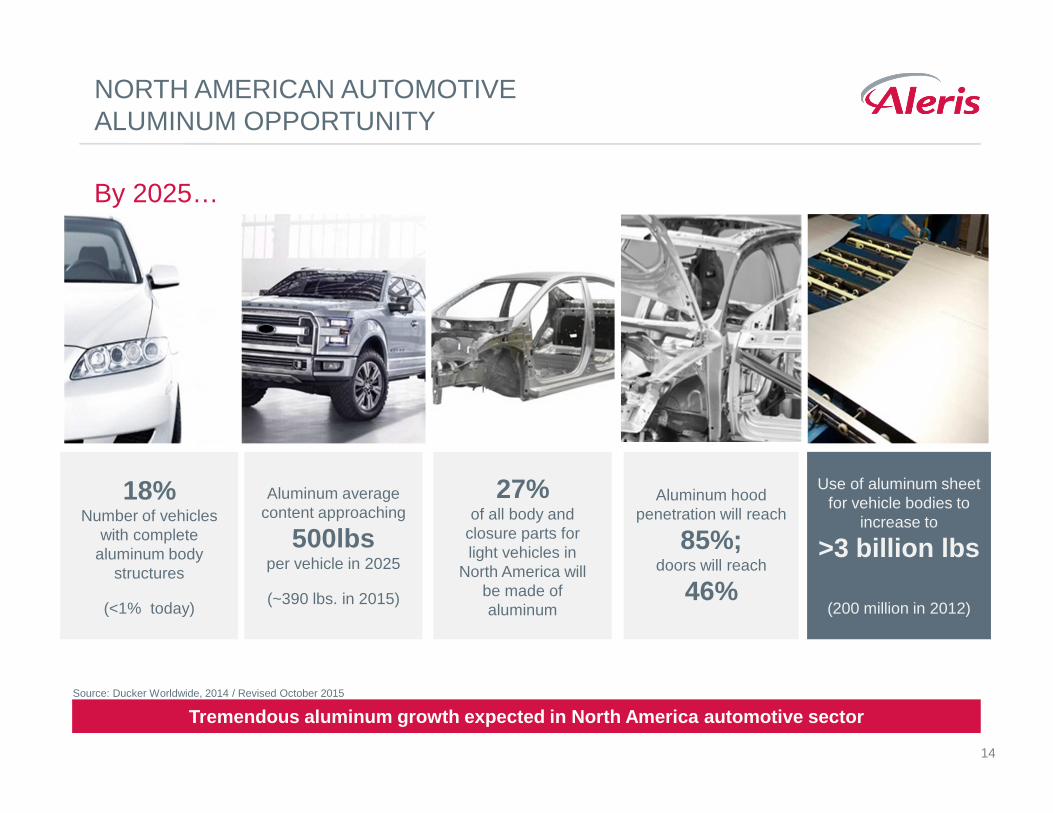
NORTH AMERICAN AUTOMOTIVE ALUMINUM OPPORTUNITY
Tremendous aluminum growth expected in North Americ a automotive sectorSource: Ducker Worldwide, 2014 / Revised October 2015
By 2025…
27% of all body and
closure parts forlight vehicles in
North America willbe made of aluminum
Aluminum hood penetration will reach
85%;doors will reach
46%
Use of aluminum sheet for vehicle bodies to
increase to
>3 billion lbs
(200 million in 2012)
18%Number of vehicles
with complete aluminum body
structures
(<1% today)
Aluminum average content approaching
500lbsper vehicle in 2025
(~390 lbs. in 2015)
15
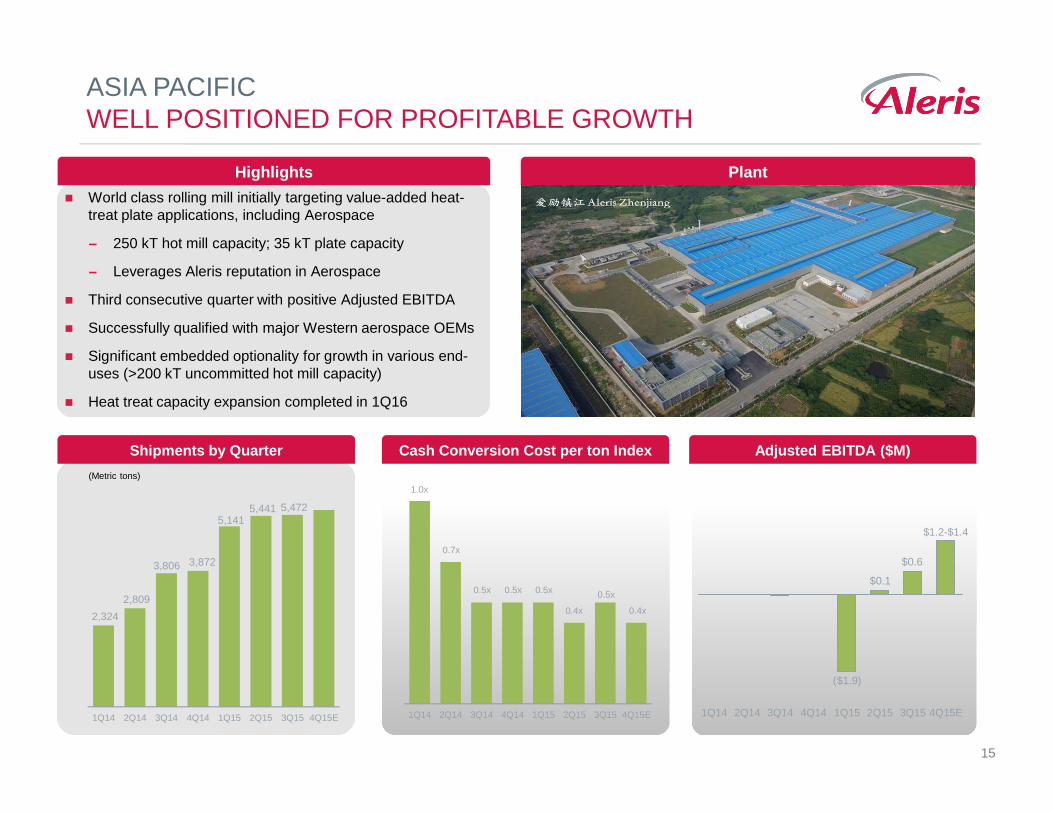
ASIA PACIFICWELL POSITIONED FOR PROFITABLE GROWTH
Highlights Plant
� World class rolling mill initially targeting value-added heat-treat plate applications, including Aerospace
− 250 kT hot mill capacity; 35 kT plate capacity
− Leverages Aleris reputation in Aerospace
� Third consecutive quarter with positive Adjusted EBITDA
� Successfully qualified with major Western aerospace OEMs
� Significant embedded optionality for growth in various end-uses (>200 kT uncommitted hot mill capacity)
� Heat treat capacity expansion completed in 1Q16
(Metric tons)
2,324
2,809
3,806 3,872
5,141 5,441 5,472
1Q14 2Q14 3Q14 4Q14 1Q15 2Q15 3Q15 4Q15E
1.0x
0.7x
0.5x 0.5x 0.5x
0.4x
0.5x
0.4x
1Q14 2Q14 3Q14 4Q14 1Q15 2Q15 3Q15 4Q15E
Shipments by Quarter Cash Conversion Cost per ton Index Adjusted EBITDA ($M)
$0.6
$0.1
($1.9)
$1.2-$1.4
2Q151Q154Q143Q142Q141Q14 3Q15 4Q15E
16
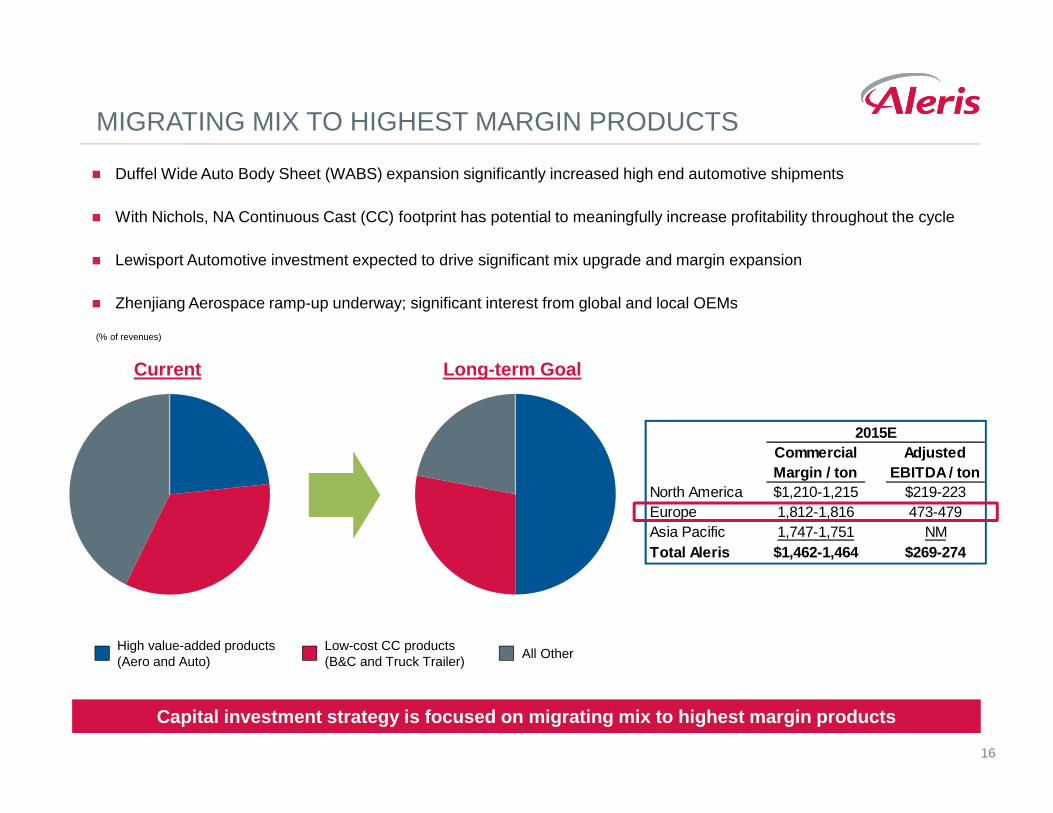
Commercial Margin / ton
Adjusted EBITDA / ton
North America $1,210-1,215 $219-223Europe 1,812-1,816 473-479Asia Pacific 1,747-1,751 NMTotal Aleris $1,462-1,464 $269-274
2015E
MIGRATING MIX TO HIGHEST MARGIN PRODUCTS
(% of revenues)
High value-added products(Aero and Auto)
Current Long-term Goal
All Other
� Duffel Wide Auto Body Sheet (WABS) expansion significantly increased high end automotive shipments
� With Nichols, NA Continuous Cast (CC) footprint has potential to meaningfully increase profitability throughout the cycle
� Lewisport Automotive investment expected to drive significant mix upgrade and margin expansion
� Zhenjiang Aerospace ramp-up underway; significant interest from global and local OEMs
Low-cost CC products(B&C and Truck Trailer)
Capital investment strategy is focused on migrating mix to highest margin products
17
ALERIS OPERATING SYSTEM
The Aleris Operating System is a global common approach of principles, practices, and tools that engage our employees
Overview
Company-wide focus on continuous improvement
18
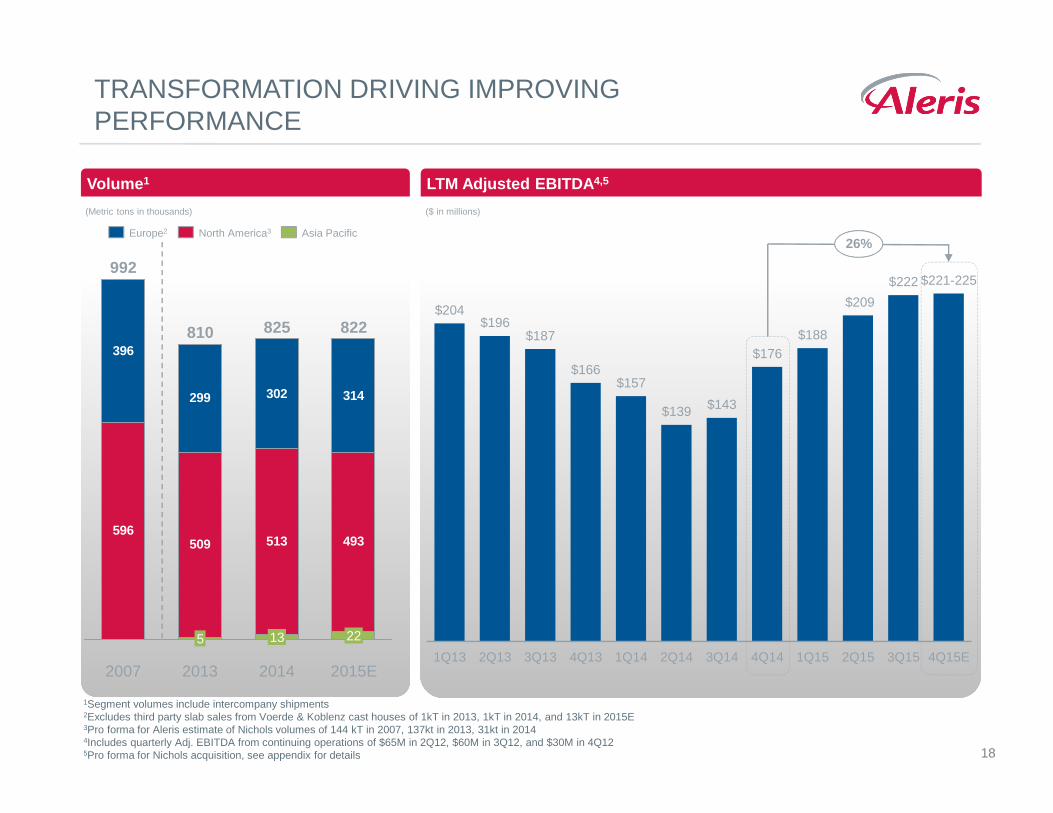
$204 $196
$187
$166 $157
$139 $143
$176 $188
$209
$222 $221-225
1Q13 2Q13 3Q13 4Q13 1Q14 2Q14 3Q14 4Q14 1Q15 2Q15 3Q15 4Q15E
LTM Adjusted EBITDA 4,5Volume 1
1Segment volumes include intercompany shipments2Excludes third party slab sales from Voerde & Koblenz cast houses of 1kT in 2013, 1kT in 2014, and 13kT in 2015E3Pro forma for Aleris estimate of Nichols volumes of 144 kT in 2007, 137kt in 2013, 31kt in 2014 4Includes quarterly Adj. EBITDA from continuing operations of $65M in 2Q12, $60M in 3Q12, and $30M in 4Q125Pro forma for Nichols acquisition, see appendix for details
TRANSFORMATION DRIVING IMPROVING PERFORMANCE
(Metric tons in thousands) ($ in millions)
596509 513 493
396
299 302 314
2007
992
2015E
822
22
2014
825
13
2013
810
5
Asia PacificEurope2 North America3
26%
19
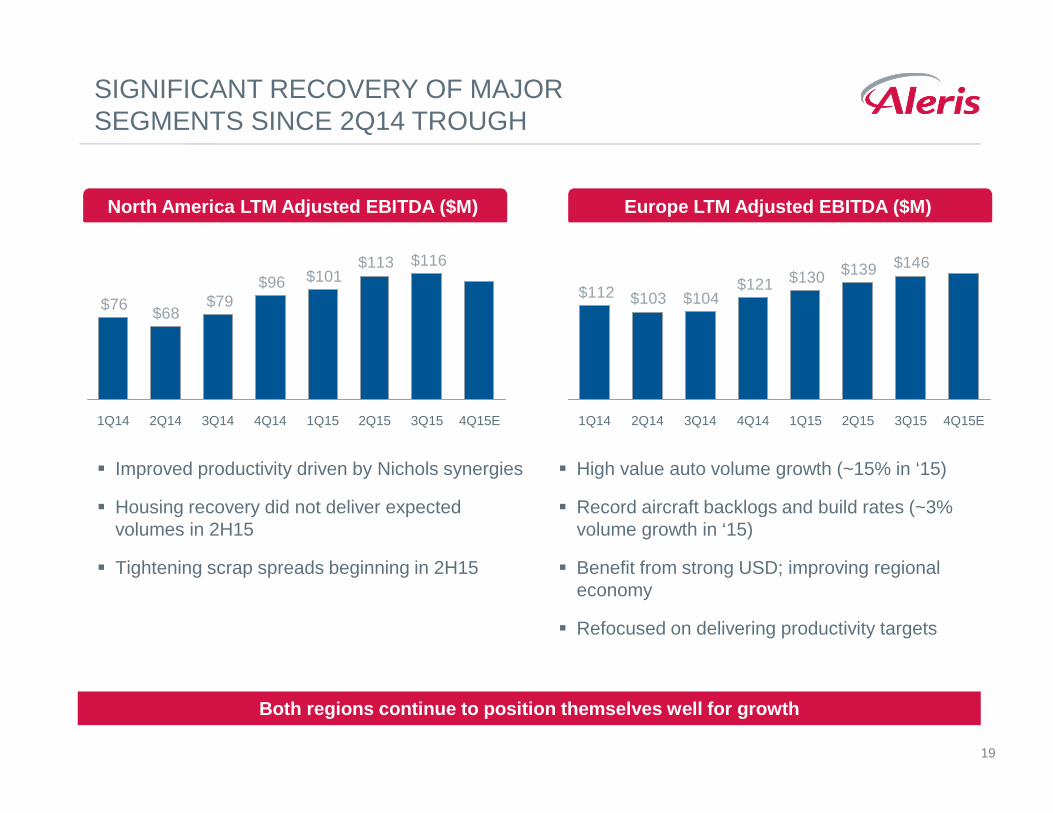
SIGNIFICANT RECOVERY OF MAJOR SEGMENTS SINCE 2Q14 TROUGH
Both regions continue to position themselves well f or growth
Europe LTM Adjusted EBITDA ($M)North America LTM Adjusted EBITDA ($M)
$116$113$101$96
$79$68$76
4Q143Q142Q141Q14 1Q15 2Q15 3Q15 4Q15E
$146$139$130$121$104$103$112
2Q14 3Q14 4Q141Q14 2Q151Q15 3Q15 4Q15E
� Improved productivity driven by Nichols synergies
� Housing recovery did not deliver expected volumes in 2H15
� Tightening scrap spreads beginning in 2H15
� High value auto volume growth (~15% in ‘15)
� Record aircraft backlogs and build rates (~3% volume growth in ‘15)
� Benefit from strong USD; improving regional economy
� Refocused on delivering productivity targets
20
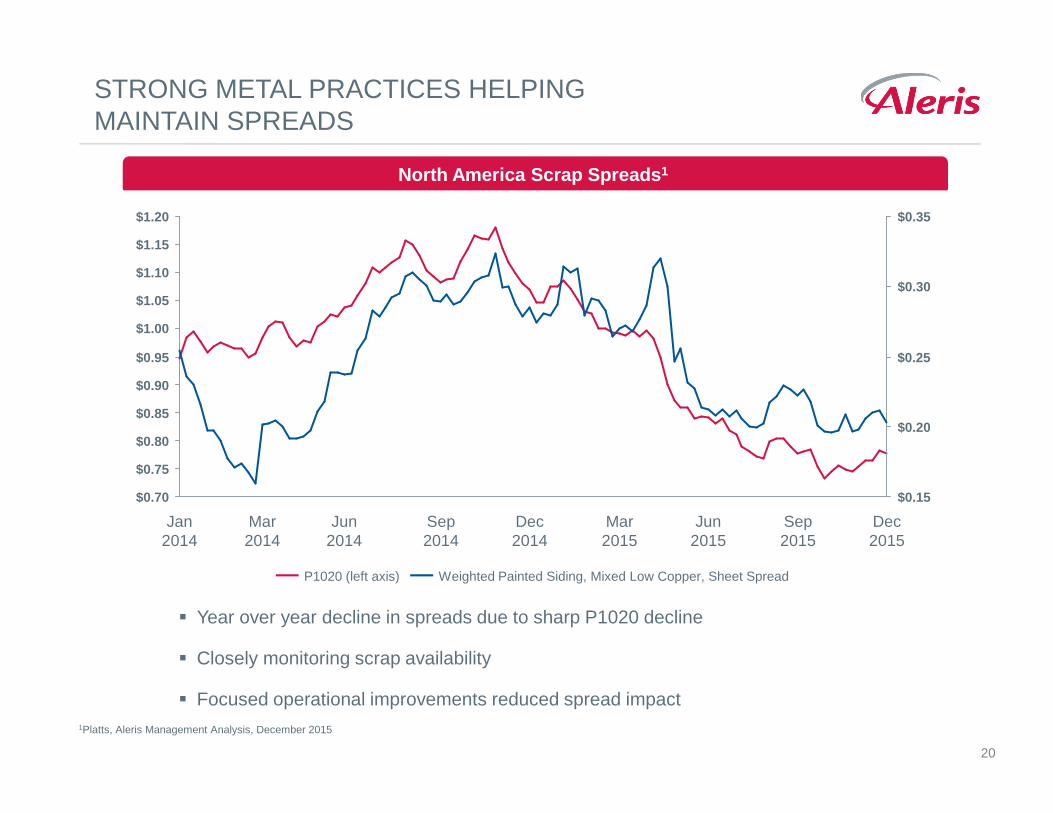
STRONG METAL PRACTICES HELPING MAINTAIN SPREADS
North America Scrap Spreads 1
$0.35
$0.30
$0.25
$0.20
$0.15
$1.20
$1.15
$1.10
$1.05
$1.00
$0.95
$0.90
$0.85
$0.80
$0.75
$0.70
Sep 2015
Jun 2015
Mar 2015
Dec 2015
Sep 2014
Jun 2014
Mar 2014
Dec 2014
Jan 2014
� Year over year decline in spreads due to sharp P1020 decline
� Closely monitoring scrap availability
� Focused operational improvements reduced spread impact
Weighted Painted Siding, Mixed Low Copper, Sheet SpreadP1020 (left axis)
1Platts, Aleris Management Analysis, December 2015
21
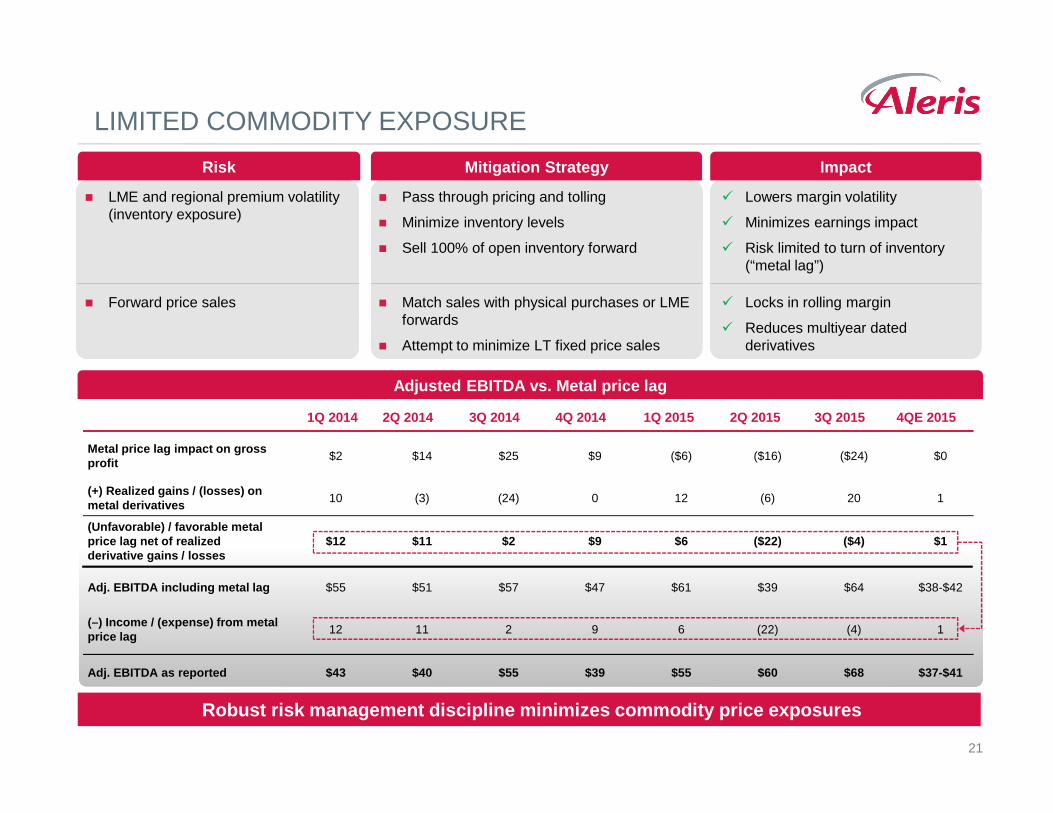
� Pass through pricing and tolling
� Minimize inventory levels
� Sell 100% of open inventory forward
� LME and regional premium volatility (inventory exposure)
Risk ImpactMitigation Strategy
� Lowers margin volatility
� Minimizes earnings impact
� Risk limited to turn of inventory (“metal lag”)
� Match sales with physical purchases or LME forwards
� Attempt to minimize LT fixed price sales
� Forward price sales � Locks in rolling margin
� Reduces multiyear dated derivatives
Robust risk management discipline minimizes commodi ty price exposures
Adjusted EBITDA vs. Metal price lag
Adj. EBITDA including metal lag $55 $51 $57 $47 $61 $39 $64 $38-$42
(–) Income / (expense) from metal price lag
12 11 2 9 6 (22) (4) 1
Adj. EBITDA as reported $43 $40 $55 $39 $55 $60 $68 $37-$41
1Q 2014 2Q 2014 3Q 2014 4Q 2014 1Q 2015 2Q 2015 3Q 2015 4QE 2015
Metal price lag impact on gross profit
$2 $14 $25 $9 ($6) ($16) ($24) $0
(+) Realized gains / (losses) on metal derivatives
10 (3) (24) 0 12 (6) 20 1
(Unfavorable) / favorable metal price lag net of realized derivative gains / losses
$12 $11 $2 $9 $6 ($22) ($4) $1
LIMITED COMMODITY EXPOSURE
22
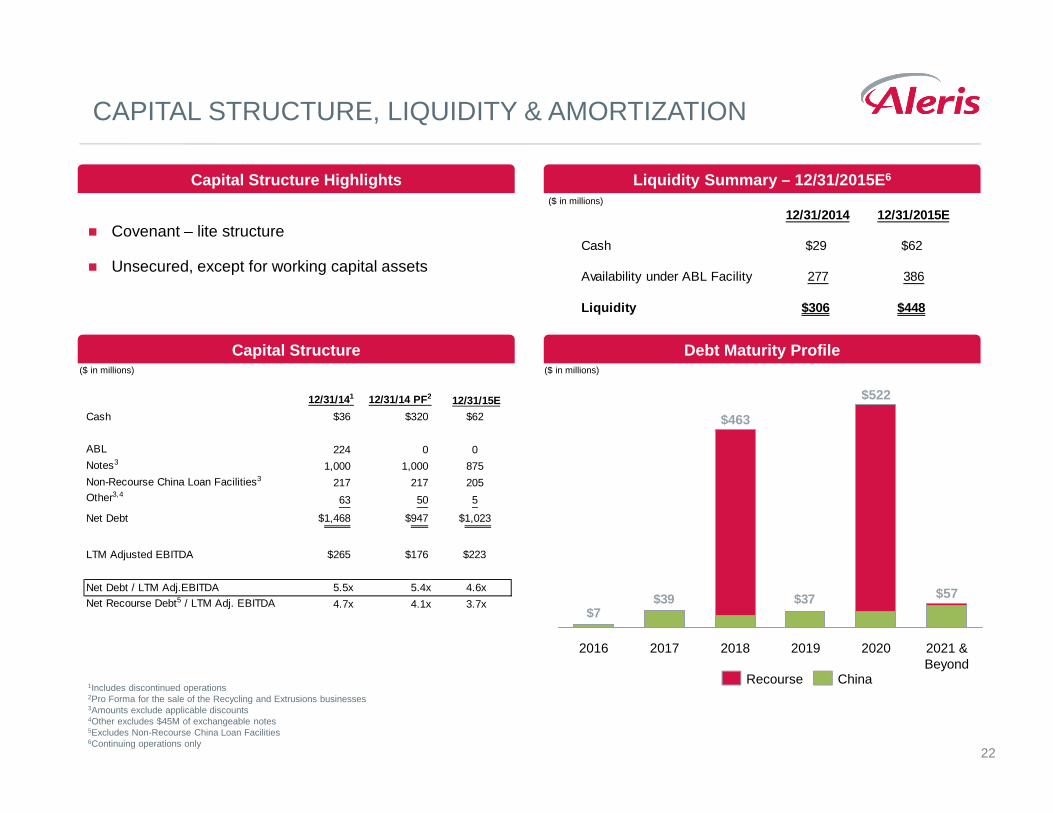
12/31/2014 12/31/2015E
Cash $29 $62
Availability under ABL Facility 277 386
Liquidity $306 $448
� Covenant – lite structure
� Unsecured, except for working capital assets
12/31/141 12/31/14 PF2 12/31/15E
Cash $36 $320 $62
ABL 224 0 0
Notes3 1,000 1,000 875
Non-Recourse China Loan Facilities3 217 217 205Other3,4
63 50 5
Net Debt $1,468 $947 $1,023
LTM Adjusted EBITDA $265 $176 $223
Net Debt / LTM Adj.EBITDA 5.5x 5.4x 4.6x
Net Recourse Debt5 / LTM Adj. EBITDA 4.7x 4.1x 3.7x
CAPITAL STRUCTURE, LIQUIDITY & AMORTIZATION
Capital Structure Highlights
Capital Structure
Liquidity Summary – 12/31/2015E 6
Debt Maturity Profile($ in millions)($ in millions)
$37$39$7
2021 & Beyond
$57
2020
$522
20192018
$463
20172016
Recourse China1Includes discontinued operations2Pro Forma for the sale of the Recycling and Extrusions businesses3Amounts exclude applicable discounts4Other excludes $45M of exchangeable notes5Excludes Non-Recourse China Loan Facilities6Continuing operations only
($ in millions)

23
KEY HIGHLIGHTS
Significant growth investments underpin future perf ormance
Well-positioned to benefit from growth in aluminum consumption
Company-wide focus on best-in-class performance
Flexible capital structure
24
APPENDIX
25
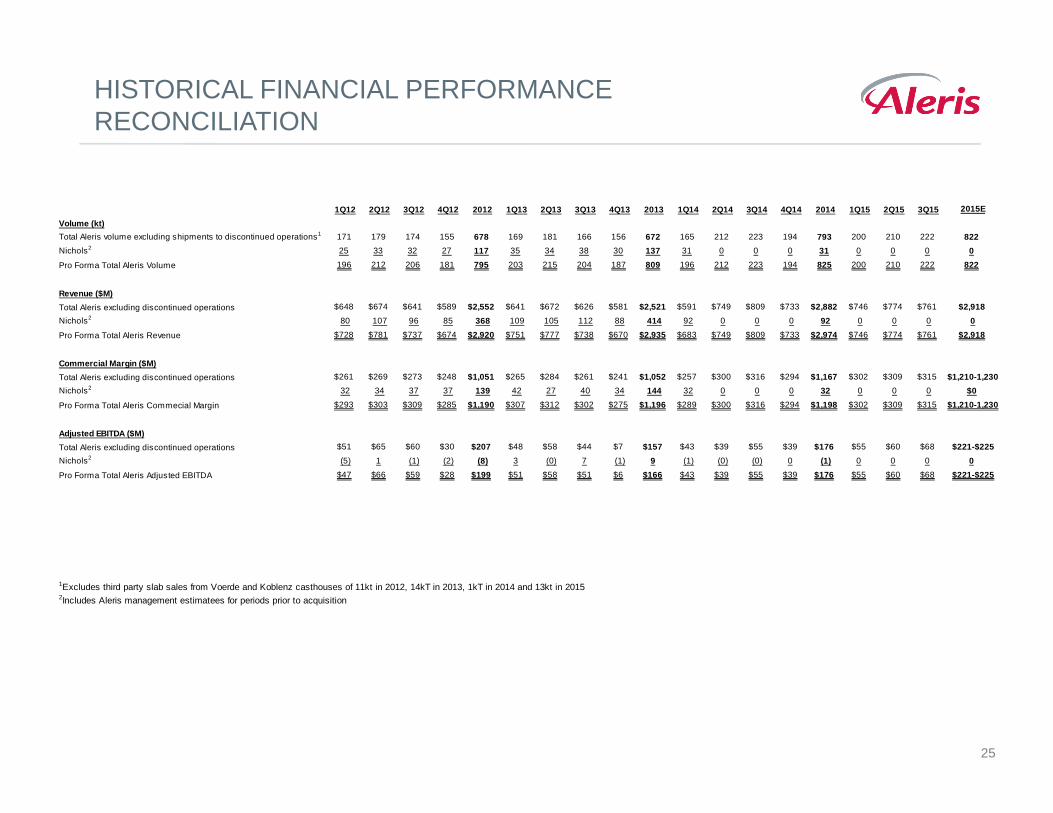
HISTORICAL FINANCIAL PERFORMANCE RECONCILIATION
1Q12 2Q12 3Q12 4Q12 2012 1Q13 2Q13 3Q13 4Q13 2013 1Q14 2Q14 3Q14 4Q14 2014 1Q15 2Q15 3Q15 2015E
Volume (kt)
Total Aleris volume excluding shipments to discontinued operations1 171 179 174 155 678 169 181 166 156 672 165 212 223 194 793 200 210 222 822
Nichols2 25 33 32 27 117 35 34 38 30 137 31 0 0 0 31 0 0 0 0
Pro Forma Total Aleris Volume 196 212 206 181 795 203 215 204 187 809 196 212 223 194 825 200 210 222 822
Revenue ($M)
Total Aleris excluding discontinued operations $648 $674 $641 $589 $2,552 $641 $672 $626 $581 $2,521 $591 $749 $809 $733 $2,882 $746 $774 $761 $2,918
Nichols2 80 107 96 85 368 109 105 112 88 414 92 0 0 0 92 0 0 0 0
Pro Forma Total Aleris Revenue $728 $781 $737 $674 $2,920 $751 $777 $738 $670 $2,935 $683 $749 $809 $733 $2,974 $746 $774 $761 $2,918
Commercial Margin ($M)
Total Aleris excluding discontinued operations $261 $269 $273 $248 $1,051 $265 $284 $261 $241 $1,052 $257 $300 $316 $294 $1,167 $302 $309 $315 $1,210-1,230
Nichols2 32 34 37 37 139 42 27 40 34 144 32 0 0 0 32 0 0 0 $0
Pro Forma Total Aleris Commecial Margin $293 $303 $309 $285 $1,190 $307 $312 $302 $275 $1,196 $289 $300 $316 $294 $1,198 $302 $309 $315 $1,210-1,230
Adjusted EBITDA ($M)
Total Aleris excluding discontinued operations $51 $65 $60 $30 $207 $48 $58 $44 $7 $157 $43 $39 $55 $39 $176 $55 $60 $68 $221-$225
Nichols2 (5) 1 (1) (2) (8) 3 (0) 7 (1) 9 (1) (0) (0) 0 (1) 0 0 0 0
Pro Forma Total Aleris Adjusted EBITDA $47 $66 $59 $28 $199 $51 $58 $51 $6 $166 $43 $39 $55 $39 $176 $55 $60 $68 $221-$225
1Excludes third party slab sales from Voerde and Koblenz casthouses of 11kt in 2012, 14kT in 2013, 1kT in 2014 and 13kt in 20152Includes Aleris management estimatees for periods prior to acquisition
26