Embed Size (px)
DESCRIPTION
IKMAS
Citation preview
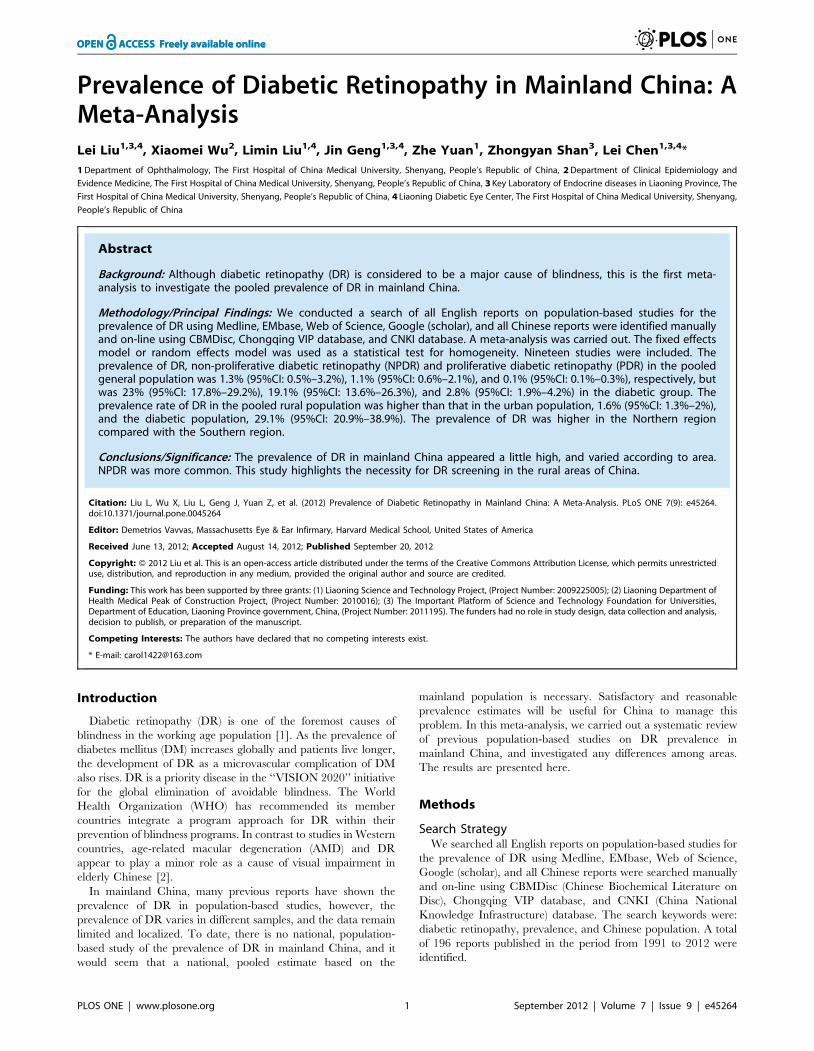
Prevalence of Diabetic Retinopathy in Mainland China: AMeta-AnalysisLei Liu1,3,4, Xiaomei Wu2, Limin Liu1,4, Jin Geng1,3,4, Zhe Yuan1, Zhongyan Shan3, Lei Chen1,3,4*
1 Department of Ophthalmology, The First Hospital of China Medical University, Shenyang, People’s Republic of China, 2 Department of Clinical Epidemiology and
Evidence Medicine, The First Hospital of China Medical University, Shenyang, People’s Republic of China, 3 Key Laboratory of Endocrine diseases in Liaoning Province, The
First Hospital of China Medical University, Shenyang, People’s Republic of China, 4 Liaoning Diabetic Eye Center, The First Hospital of China Medical University, Shenyang,
People’s Republic of China
Abstract
Background: Although diabetic retinopathy (DR) is considered to be a major cause of blindness, this is the first meta-analysis to investigate the pooled prevalence of DR in mainland China.
Methodology/Principal Findings: We conducted a search of all English reports on population-based studies for theprevalence of DR using Medline, EMbase, Web of Science, Google (scholar), and all Chinese reports were identified manuallyand on-line using CBMDisc, Chongqing VIP database, and CNKI database. A meta-analysis was carried out. The fixed effectsmodel or random effects model was used as a statistical test for homogeneity. Nineteen studies were included. Theprevalence of DR, non-proliferative diabetic retinopathy (NPDR) and proliferative diabetic retinopathy (PDR) in the pooledgeneral population was 1.3% (95%CI: 0.5%–3.2%), 1.1% (95%CI: 0.6%–2.1%), and 0.1% (95%CI: 0.1%–0.3%), respectively, butwas 23% (95%CI: 17.8%–29.2%), 19.1% (95%CI: 13.6%–26.3%), and 2.8% (95%CI: 1.9%–4.2%) in the diabetic group. Theprevalence rate of DR in the pooled rural population was higher than that in the urban population, 1.6% (95%CI: 1.3%–2%),and the diabetic population, 29.1% (95%CI: 20.9%–38.9%). The prevalence of DR was higher in the Northern regioncompared with the Southern region.
Conclusions/Significance: The prevalence of DR in mainland China appeared a little high, and varied according to area.NPDR was more common. This study highlights the necessity for DR screening in the rural areas of China.
Citation: Liu L, Wu X, Liu L, Geng J, Yuan Z, et al. (2012) Prevalence of Diabetic Retinopathy in Mainland China: A Meta-Analysis. PLoS ONE 7(9): e45264.doi:10.1371/journal.pone.0045264
Editor: Demetrios Vavvas, Massachusetts Eye & Ear Infirmary, Harvard Medical School, United States of America
Received June 13, 2012; Accepted August 14, 2012; Published September 20, 2012
Copyright: � 2012 Liu et al. This is an open-access article distributed under the terms of the Creative Commons Attribution License, which permits unrestricteduse, distribution, and reproduction in any medium, provided the original author and source are credited.
Funding: This work has been supported by three grants: (1) Liaoning Science and Technology Project, (Project Number: 2009225005); (2) Liaoning Department ofHealth Medical Peak of Construction Project, (Project Number: 2010016); (3) The Important Platform of Science and Technology Foundation for Universities,Department of Education, Liaoning Province government, China, (Project Number: 2011195). The funders had no role in study design, data collection and analysis,decision to publish, or preparation of the manuscript.
Competing Interests: The authors have declared that no competing interests exist.
* E-mail: [email protected]
Introduction
Diabetic retinopathy (DR) is one of the foremost causes of
blindness in the working age population [1]. As the prevalence of
diabetes mellitus (DM) increases globally and patients live longer,
the development of DR as a microvascular complication of DM
also rises. DR is a priority disease in the ‘‘VISION 2020’’ initiative
for the global elimination of avoidable blindness. The World
Health Organization (WHO) has recommended its member
countries integrate a program approach for DR within their
prevention of blindness programs. In contrast to studies in Western
countries, age-related macular degeneration (AMD) and DR
appear to play a minor role as a cause of visual impairment in
elderly Chinese [2].
In mainland China, many previous reports have shown the
prevalence of DR in population-based studies, however, the
prevalence of DR varies in different samples, and the data remain
limited and localized. To date, there is no national, population-
based study of the prevalence of DR in mainland China, and it
would seem that a national, pooled estimate based on the
mainland population is necessary. Satisfactory and reasonable
prevalence estimates will be useful for China to manage this
problem. In this meta-analysis, we carried out a systematic review
of previous population-based studies on DR prevalence in
mainland China, and investigated any differences among areas.
The results are presented here.
Methods
Search StrategyWe searched all English reports on population-based studies for
the prevalence of DR using Medline, EMbase, Web of Science,
Google (scholar), and all Chinese reports were searched manually
and on-line using CBMDisc (Chinese Biochemical Literature on
Disc), Chongqing VIP database, and CNKI (China National
Knowledge Infrastructure) database. The search keywords were:
diabetic retinopathy, prevalence, and Chinese population. A total
of 196 reports published in the period from 1991 to 2012 were
identified.
PLOS ONE | www.plosone.org 1 September 2012 | Volume 7 | Issue 9 | e45264
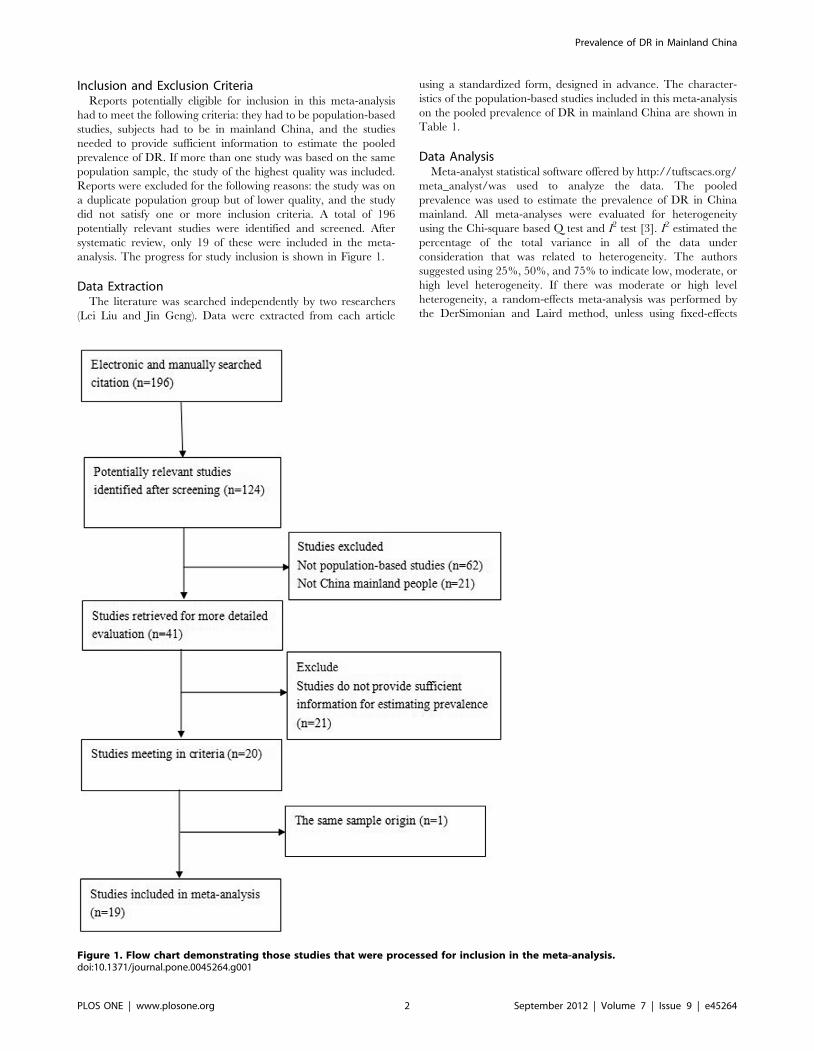
Inclusion and Exclusion CriteriaReports potentially eligible for inclusion in this meta-analysis
had to meet the following criteria: they had to be population-based
studies, subjects had to be in mainland China, and the studies
needed to provide sufficient information to estimate the pooled
prevalence of DR. If more than one study was based on the same
population sample, the study of the highest quality was included.
Reports were excluded for the following reasons: the study was on
a duplicate population group but of lower quality, and the study
did not satisfy one or more inclusion criteria. A total of 196
potentially relevant studies were identified and screened. After
systematic review, only 19 of these were included in the meta-
analysis. The progress for study inclusion is shown in Figure 1.
Data ExtractionThe literature was searched independently by two researchers
(Lei Liu and Jin Geng). Data were extracted from each article
using a standardized form, designed in advance. The character-
istics of the population-based studies included in this meta-analysis
on the pooled prevalence of DR in mainland China are shown in
Table 1.
Data AnalysisMeta-analyst statistical software offered by http://tuftscaes.org/
meta_analyst/was used to analyze the data. The pooled
prevalence was used to estimate the prevalence of DR in China
mainland. All meta-analyses were evaluated for heterogeneity
using the Chi-square based Q test and I2 test [3]. I2 estimated the
percentage of the total variance in all of the data under
consideration that was related to heterogeneity. The authors
suggested using 25%, 50%, and 75% to indicate low, moderate, or
high level heterogeneity. If there was moderate or high level
heterogeneity, a random-effects meta-analysis was performed by
the DerSimonian and Laird method, unless using fixed-effects
Figure 1. Flow chart demonstrating those studies that were processed for inclusion in the meta-analysis.doi:10.1371/journal.pone.0045264.g001
Prevalence of DR in Mainland China
PLOS ONE | www.plosone.org 2 September 2012 | Volume 7 | Issue 9 | e45264
Ta
ble
1.
Ch
arac
teri
stic
so
fp
op
ula
tio
n-b
ase
dst
ud
ies
on
the
pre
vale
nce
of
dia
be
tic
reti
no
pat
hy
(DR
)in
mai
nla
nd
Ch
ina.
Fir
stA
uth
or
Pu
bli
cati
on
ye
ar
Are
aR
eg
ion
Ru
ral/
Urb
an
Ex
am
ina
tio
nm
eth
od
olo
gie
sfo
rD
RD
iag
no
sis
sta
nd
ard
for
DR
Dia
gn
osi
sst
an
da
rdfo
rD
MA
ge
(ye
ar)
Su
rve
yd
ay
Sa
mp
le(n
)D
M(n
)D
R(n
)
tota
lN
PD
RP
DR
Yin
gh
ua
HU
[17
]1
99
1D
aqin
gN
ort
he
rnU
rban
MD
OC
+fu
nd
us
ph
oto
gra
ph
yN
AW
HO
25
–7
41
98
61
10
66
04
23
12
91
19
10
Sho
uzh
iH
e[1
8]
19
97
Be
ijin
gN
ort
he
rnU
rban
MD
OC
+FFA
Stag
ing
of
DR
for
Ch
ine
se*
WH
O.
30
NA
29
93
85
34
90
88
2
Sho
ulin
gLi
[19
]1
99
8A
nh
ui
Sou
the
rnR
ura
l+U
rban
MD
OC
Stag
ing
of
DR
for
Ch
ine
se*
WH
O.
15
19
94
–1
99
51
16
18
21
66
7N
AN
A
Gu
ang
luW
ang
[20]
20
01
Be
ijin
gN
ort
he
rnR
ura
l+U
rban
MD
OC
NA
WH
O$
25
19
94
–1
99
51
48
33
26
37
30
7
Hai
do
ng
Zh
ou
[21]
20
06
Shan
gh
aiSo
uth
ern
Urb
anN
MFP
for
45
dig
ree
fie
ldSt
agin
go
fD
Rfo
rC
hin
ese
*N
A4
4–
87
Jul
20
03
–A
pr
20
04
43
76
25
35
14
61
23
23
Xia
nju
nLi
ang
[22
]2
00
6Fo
shan
Sou
the
rnU
rban
MD
OC
NA
WH
O.
18
20
03
–2
00
51
07
23
35
63
8N
AN
A
Xiw
ei
Xie
[23
]2
00
9B
eiji
ng
No
rth
ern
Ru
ral+
Urb
anM
FPfo
r5
0d
igre
efi
eld
ETD
RS
Self
-re
po
rte
dh
isto
ry.
40
20
01
43
91
43
42
85
27
31
2
Lei
Liu
[24
]2
00
9Sh
en
yan
gN
ort
he
rnU
rban
NM
FPfo
r4
5d
igre
efi
eld
ETD
RS
WH
O1
4–
82
Oct
-De
c2
00
71
53
41
37
17
17
NA
Xia
ng
wen
Shu
[25]
20
10
Shan
do
ng
No
rth
ern
Ru
ral
MD
OC
ETD
RS
WH
O.
25
20
07
–2
00
81
63
30
68
91
81
10
77
4
Zh
on
gX
in[2
6]
20
10
Be
ijin
gN
ort
he
rnR
ura
lM
FPfo
rse
ven
fie
ldP
rop
ose
din
tern
atio
nal
seve
rity
scal
es**
WH
O.
35
May
-Ju
l2
00
81
29
31
14
27
25
2
Yan
Te
ng
[27
]2
01
0Sh
uan
gch
en
gN
ort
he
rnR
ura
lM
FPfo
r4
5d
igre
efi
eld
Stag
ing
of
DR
for
Ch
ine
se*
WH
O.
50
No
v2
00
6–
Feb
20
07
50
53
NA
56
49
7
Hai
lian
Do
ng
[28
]2
01
0Sh
un
yiN
ort
he
rnR
ura
lN
MFP
for
thre
efie
ldN
A.
18
Jan
-De
c2
00
95
73
45
54
94
76
18
Min
gzh
uY
nag
[29]
20
10
Shiji
azh
uan
gN
ort
he
rnU
rban
MD
OC
Stag
ing
of
DR
for
Ch
ine
se*
WH
O3
5–
80
Sep
20
06
-Se
p2
00
83
31
83
81
87
69
18
Ho
ng
bo
Wan
g[3
0]2
01
0C
han
gzh
iN
ort
he
rnR
ura
lN
MFP
for
45
dig
ree
fie
ldSt
agin
go
fD
Rfo
rC
hin
ese
*W
HO
.1
5O
ct2
00
7-D
ec
20
08
57
50
02
63
29
86
NA
NA
Xiu
qu
nY
e[3
1]
20
10
Hu
izh
ou
Sou
the
rnU
rban
MD
OC
+fu
nd
us
ph
oto
gra
ph
y+FF
AET
DR
SW
HO
.2
02
00
3–
20
05
11
72
31
04
61
01
71
30
Fen
gh
ua
Wan
g[3
2]2
01
1H
and
anN
ort
he
rnR
ura
lM
FPfo
rtw
ofi
eld
ETD
RS
self
-re
po
rte
dh
isto
ryan
dFP
G.
30
20
06
–2
00
76
83
03
68
16
51
45
20
Bin
gzh
en
Li[3
3]
20
11
Be
ijin
gSh
un
yiN
ort
he
rnU
rban
NM
FPfo
ro
ne
fie
ldET
DR
SW
HO
$4
0M
ay-O
ct2
00
54
16
74
45
13
01
24
6
Can
Pan
g[3
4]
20
11
Shan
gh
aiSo
uth
ern
Urb
anN
MFP
for
45
dig
ree
fie
ldD
iab
etic
Ret
ino
pat
hy
Dis
ease
Seve
rity
Scal
eO
GT
T.
15
19
96
–2
00
73
25
97
99
75
74
1
Jie
Xu
[35
]2
01
2B
eiji
ng
No
rth
ern
Urb
anN
MFP
for
45
dig
ree
fie
ldET
DR
SW
HO
20
–8
0A
ug
ust
20
08
-Ju
ly2
00
9N
A2
00
74
96
32
96
7
Ab
bre
viat
ion
:ET
DR
S,Ea
rly
Tre
atm
en
tD
iab
eti
cR
eti
no
pat
hy
Stu
dy;
DR
,d
iab
eti
cre
tin
op
ath
y;N
PD
R,
no
n-p
rolif
era
tive
dia
be
tic
reti
no
pat
hy;
PD
R,
pro
life
rati
ved
iab
eti
cre
tin
op
ath
y.D
M,
dia
be
tes
me
llitu
s;M
DO
C,
myd
rias
isd
ire
cto
ph
thal
mo
sco
pe
che
ck;
FFA
,fu
nd
us
flu
ore
sce
inan
gio
gra
ph
y;N
MFP
,n
on
-myd
riat
icfu
nd
us
ph
oto
gra
ph
y;M
FP,
myd
riat
icfu
nd
us
ph
oto
gra
ph
y.N
A,
no
tav
aila
ble
.*S
tag
ing
of
DR
by
Ch
ine
seac
ade
my
of
ocu
lar
fun
du
sd
ise
ase
.**
Pro
po
sed
inte
rnat
ion
alcl
inic
ald
iab
eti
cre
tin
op
ath
yan
dd
iab
eti
cm
acu
lar
ed
em
ad
ise
ase
seve
rity
scal
es.
do
i:10
.13
71
/jo
urn
al.p
on
e.0
04
52
64
.t0
01
Prevalence of DR in Mainland China
PLOS ONE | www.plosone.org 3 September 2012 | Volume 7 | Issue 9 | e45264
models. Publication bias was assessed by visually inspecting a
funnel plot. A p value less than 0.05 was considered statistically
significant [4,5]. The results were analyzed statistically using the x2
(Chi-square) test with the SPSS 13.0 program (SPSS Software,
Chicago, USA) to compare the difference between two groups
with different prevalence rates.
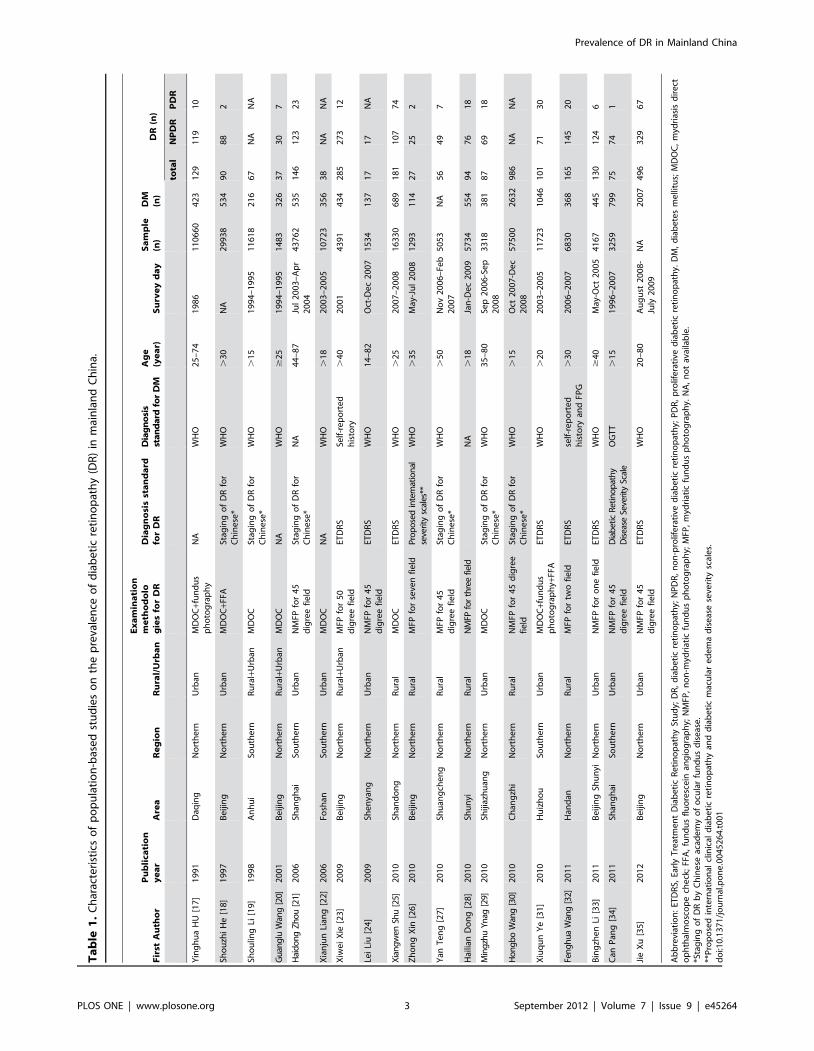
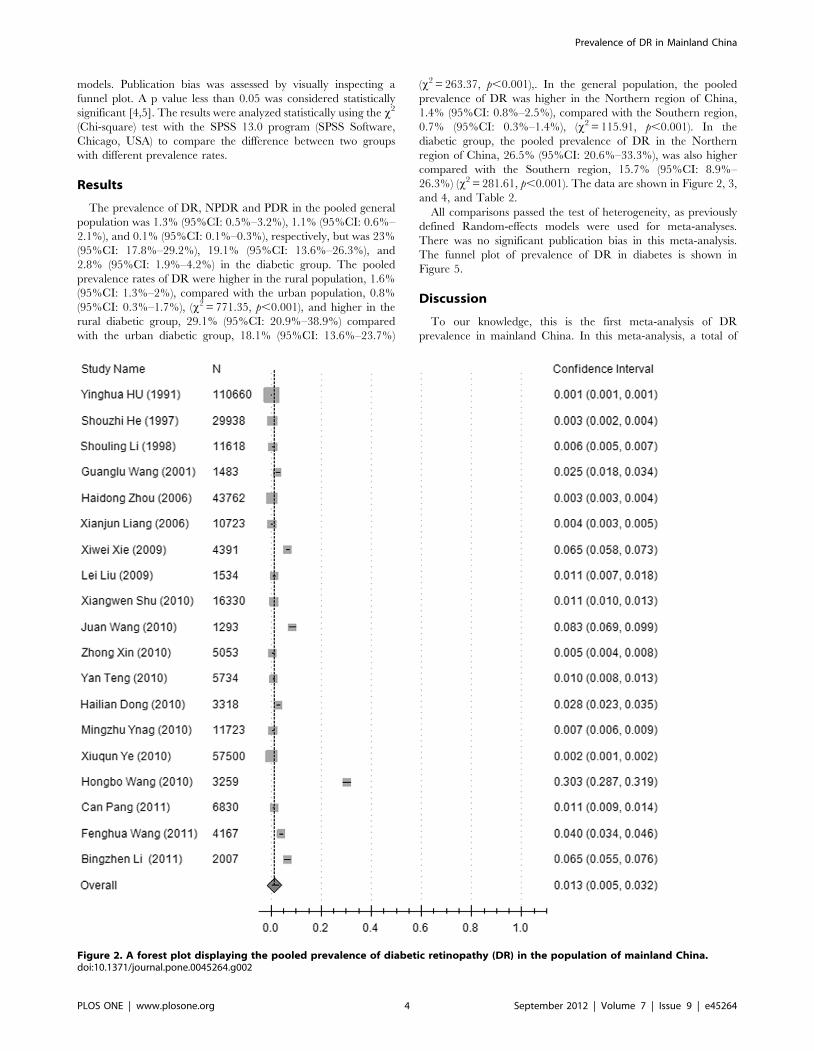
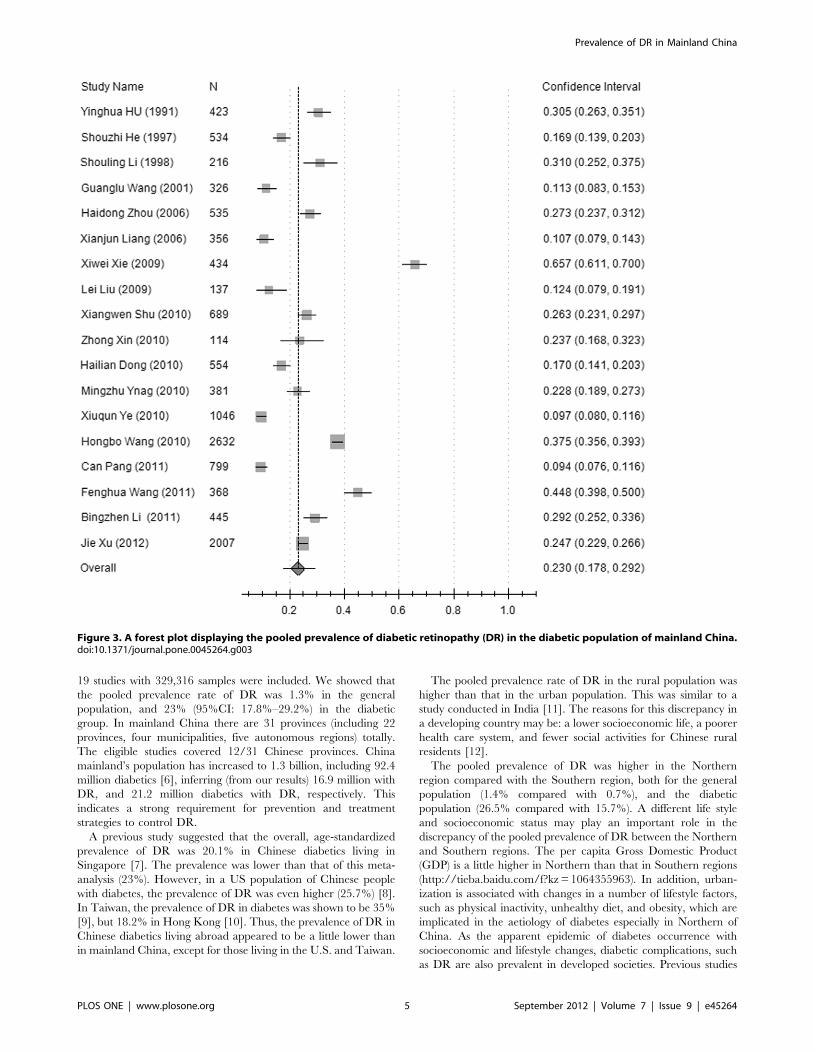
Results
The prevalence of DR, NPDR and PDR in the pooled general
population was 1.3% (95%CI: 0.5%–3.2%), 1.1% (95%CI: 0.6%–
2.1%), and 0.1% (95%CI: 0.1%–0.3%), respectively, but was 23%
(95%CI: 17.8%–29.2%), 19.1% (95%CI: 13.6%–26.3%), and
2.8% (95%CI: 1.9%–4.2%) in the diabetic group. The pooled
prevalence rates of DR were higher in the rural population, 1.6%
(95%CI: 1.3%–2%), compared with the urban population, 0.8%
(95%CI: 0.3%–1.7%), (x2 = 771.35, p,0.001), and higher in the
rural diabetic group, 29.1% (95%CI: 20.9%–38.9%) compared
with the urban diabetic group, 18.1% (95%CI: 13.6%–23.7%)
(x2 = 263.37, p,0.001),. In the general population, the pooled
prevalence of DR was higher in the Northern region of China,
1.4% (95%CI: 0.8%–2.5%), compared with the Southern region,
0.7% (95%CI: 0.3%–1.4%), (x2 = 115.91, p,0.001). In the
diabetic group, the pooled prevalence of DR in the Northern
region of China, 26.5% (95%CI: 20.6%–33.3%), was also higher
compared with the Southern region, 15.7% (95%CI: 8.9%–
26.3%) (x2 = 281.61, p,0.001). The data are shown in Figure 2, 3,
and 4, and Table 2.
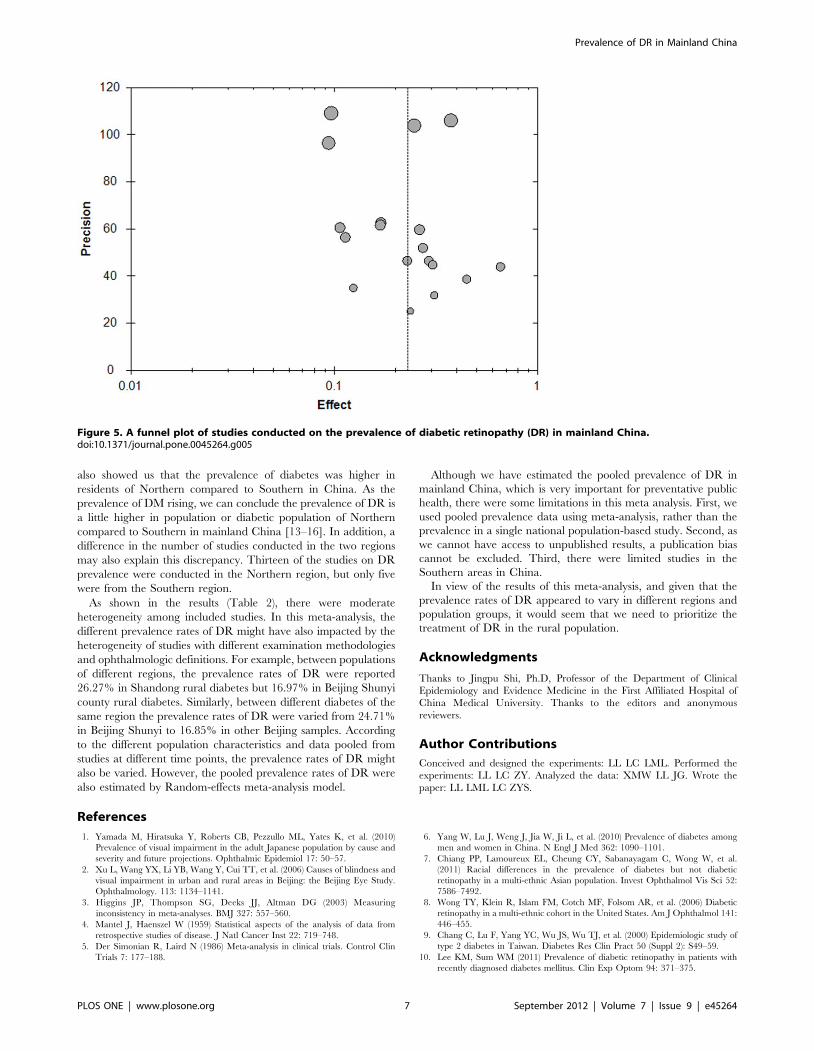
All comparisons passed the test of heterogeneity, as previously
defined Random-effects models were used for meta-analyses.
There was no significant publication bias in this meta-analysis.
The funnel plot of prevalence of DR in diabetes is shown in
Figure 5.
Discussion
To our knowledge, this is the first meta-analysis of DR
prevalence in mainland China. In this meta-analysis, a total of
Figure 2. A forest plot displaying the pooled prevalence of diabetic retinopathy (DR) in the population of mainland China.doi:10.1371/journal.pone.0045264.g002
Prevalence of DR in Mainland China
PLOS ONE | www.plosone.org 4 September 2012 | Volume 7 | Issue 9 | e45264
19 studies with 329,316 samples were included. We showed that
the pooled prevalence rate of DR was 1.3% in the general
population, and 23% (95%CI: 17.8%–29.2%) in the diabetic
group. In mainland China there are 31 provinces (including 22
provinces, four municipalities, five autonomous regions) totally.
The eligible studies covered 12/31 Chinese provinces. China
mainland’s population has increased to 1.3 billion, including 92.4
million diabetics [6], inferring (from our results) 16.9 million with
DR, and 21.2 million diabetics with DR, respectively. This
indicates a strong requirement for prevention and treatment
strategies to control DR.
A previous study suggested that the overall, age-standardized
prevalence of DR was 20.1% in Chinese diabetics living in
Singapore [7]. The prevalence was lower than that of this meta-
analysis (23%). However, in a US population of Chinese people
with diabetes, the prevalence of DR was even higher (25.7%) [8].
In Taiwan, the prevalence of DR in diabetes was shown to be 35%
[9], but 18.2% in Hong Kong [10]. Thus, the prevalence of DR in
Chinese diabetics living abroad appeared to be a little lower than
in mainland China, except for those living in the U.S. and Taiwan.
The pooled prevalence rate of DR in the rural population was
higher than that in the urban population. This was similar to a
study conducted in India [11]. The reasons for this discrepancy in
a developing country may be: a lower socioeconomic life, a poorer
health care system, and fewer social activities for Chinese rural
residents [12].
The pooled prevalence of DR was higher in the Northern
region compared with the Southern region, both for the general
population (1.4% compared with 0.7%), and the diabetic
population (26.5% compared with 15.7%). A different life style
and socioeconomic status may play an important role in the
discrepancy of the pooled prevalence of DR between the Northern
and Southern regions. The per capita Gross Domestic Product
(GDP) is a little higher in Northern than that in Southern regions
(http://tieba.baidu.com/f?kz = 1064355963). In addition, urban-
ization is associated with changes in a number of lifestyle factors,
such as physical inactivity, unhealthy diet, and obesity, which are
implicated in the aetiology of diabetes especially in Northern of
China. As the apparent epidemic of diabetes occurrence with
socioeconomic and lifestyle changes, diabetic complications, such
as DR are also prevalent in developed societies. Previous studies
Figure 3. A forest plot displaying the pooled prevalence of diabetic retinopathy (DR) in the diabetic population of mainland China.doi:10.1371/journal.pone.0045264.g003
Prevalence of DR in Mainland China
PLOS ONE | www.plosone.org 5 September 2012 | Volume 7 | Issue 9 | e45264
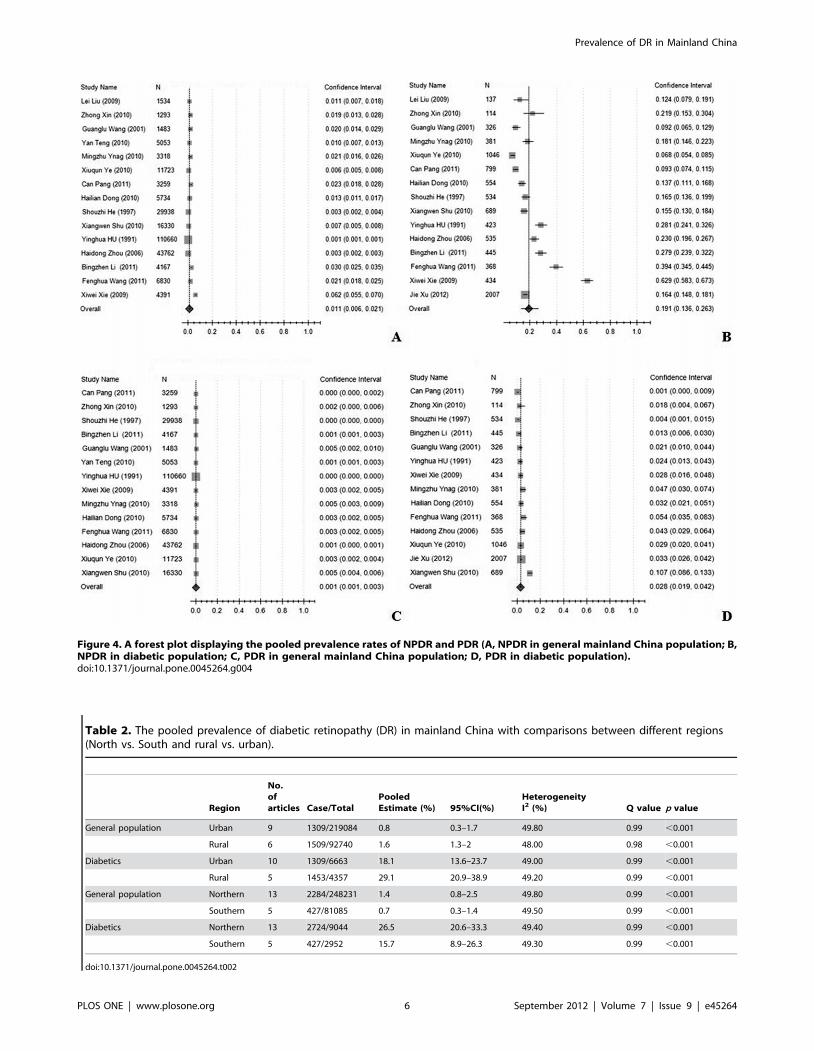
Figure 4. A forest plot displaying the pooled prevalence rates of NPDR and PDR (A, NPDR in general mainland China population; B,NPDR in diabetic population; C, PDR in general mainland China population; D, PDR in diabetic population).doi:10.1371/journal.pone.0045264.g004
Table 2. The pooled prevalence of diabetic retinopathy (DR) in mainland China with comparisons between different regions(North vs. South and rural vs. urban).
Region
No.ofarticles Case/Total
PooledEstimate (%) 95%CI(%)
HeterogeneityI2 (%) Q value p value
General population Urban 9 1309/219084 0.8 0.3–1.7 49.80 0.99 ,0.001
Rural 6 1509/92740 1.6 1.3–2 48.00 0.98 ,0.001
Diabetics Urban 10 1309/6663 18.1 13.6–23.7 49.00 0.99 ,0.001
Rural 5 1453/4357 29.1 20.9–38.9 49.20 0.99 ,0.001
General population Northern 13 2284/248231 1.4 0.8–2.5 49.80 0.99 ,0.001
Southern 5 427/81085 0.7 0.3–1.4 49.50 0.99 ,0.001
Diabetics Northern 13 2724/9044 26.5 20.6–33.3 49.40 0.99 ,0.001
Southern 5 427/2952 15.7 8.9–26.3 49.30 0.99 ,0.001
doi:10.1371/journal.pone.0045264.t002
Prevalence of DR in Mainland China
PLOS ONE | www.plosone.org 6 September 2012 | Volume 7 | Issue 9 | e45264
also showed us that the prevalence of diabetes was higher in
residents of Northern compared to Southern in China. As the
prevalence of DM rising, we can conclude the prevalence of DR is
a little higher in population or diabetic population of Northern
compared to Southern in mainland China [13–16]. In addition, a
difference in the number of studies conducted in the two regions
may also explain this discrepancy. Thirteen of the studies on DR
prevalence were conducted in the Northern region, but only five
were from the Southern region.
As shown in the results (Table 2), there were moderate
heterogeneity among included studies. In this meta-analysis, the
different prevalence rates of DR might have also impacted by the
heterogeneity of studies with different examination methodologies
and ophthalmologic definitions. For example, between populations
of different regions, the prevalence rates of DR were reported
26.27% in Shandong rural diabetes but 16.97% in Beijing Shunyi
county rural diabetes. Similarly, between different diabetes of the
same region the prevalence rates of DR were varied from 24.71%
in Beijing Shunyi to 16.85% in other Beijing samples. According
to the different population characteristics and data pooled from
studies at different time points, the prevalence rates of DR might
also be varied. However, the pooled prevalence rates of DR were
also estimated by Random-effects meta-analysis model.
Although we have estimated the pooled prevalence of DR in
mainland China, which is very important for preventative public
health, there were some limitations in this meta analysis. First, we
used pooled prevalence data using meta-analysis, rather than the
prevalence in a single national population-based study. Second, as
we cannot have access to unpublished results, a publication bias
cannot be excluded. Third, there were limited studies in the
Southern areas in China.
In view of the results of this meta-analysis, and given that the
prevalence rates of DR appeared to vary in different regions and
population groups, it would seem that we need to prioritize the
treatment of DR in the rural population.
Acknowledgments
Thanks to Jingpu Shi, Ph.D, Professor of the Department of Clinical
Epidemiology and Evidence Medicine in the First Affiliated Hospital of
China Medical University. Thanks to the editors and anonymous
reviewers.
Author Contributions
Conceived and designed the experiments: LL LC LML. Performed the
experiments: LL LC ZY. Analyzed the data: XMW LL JG. Wrote the
paper: LL LML LC ZYS.
References
1. Yamada M, Hiratsuka Y, Roberts CB, Pezzullo ML, Yates K, et al. (2010)
Prevalence of visual impairment in the adult Japanese population by cause and
severity and future projections. Ophthalmic Epidemiol 17: 50–57.
2. Xu L, Wang YX, Li YB, Wang Y, Cui TT, et al. (2006) Causes of blindness and
visual impairment in urban and rural areas in Beijing: the Beijing Eye Study.
Ophthalmology. 113: 1134–1141.
3. Higgins JP, Thompson SG, Deeks JJ, Altman DG (2003) Measuring
inconsistency in meta-analyses. BMJ 327: 557–560.
4. Mantel J, Haenszel W (1959) Statistical aspects of the analysis of data from
retrospective studies of disease. J Natl Cancer Inst 22: 719–748.
5. Der Simonian R, Laird N (1986) Meta-analysis in clinical trials. Control Clin
Trials 7: 177–188.
6. Yang W, Lu J, Weng J, Jia W, Ji L, et al. (2010) Prevalence of diabetes among
men and women in China. N Engl J Med 362: 1090–1101.
7. Chiang PP, Lamoureux EL, Cheung CY, Sabanayagam C, Wong W, et al.
(2011) Racial differences in the prevalence of diabetes but not diabetic
retinopathy in a multi-ethnic Asian population. Invest Ophthalmol Vis Sci 52:
7586–7492.
8. Wong TY, Klein R, Islam FM, Cotch MF, Folsom AR, et al. (2006) Diabetic
retinopathy in a multi-ethnic cohort in the United States. Am J Ophthalmol 141:
446–455.
9. Chang C, Lu F, Yang YC, Wu JS, Wu TJ, et al. (2000) Epidemiologic study of
type 2 diabetes in Taiwan. Diabetes Res Clin Pract 50 (Suppl 2): S49–59.
10. Lee KM, Sum WM (2011) Prevalence of diabetic retinopathy in patients with
recently diagnosed diabetes mellitus. Clin Exp Optom 94: 371–375.
Figure 5. A funnel plot of studies conducted on the prevalence of diabetic retinopathy (DR) in mainland China.doi:10.1371/journal.pone.0045264.g005
Prevalence of DR in Mainland China
PLOS ONE | www.plosone.org 7 September 2012 | Volume 7 | Issue 9 | e45264
11. Rani PK, Raman R, Sharma V, Mahuli SV, Tarigopala A, et al. (2007) Analysis
of a comprehensive diabetic retinopathy screening model for rural and urban
diabetics in developing countries. Br J Ophthalmol 91: 1425–1429.
12. Zhang L, Xu Y, Nie H, Zhang Y, Wu Y (2012) The prevalence of depressive
symptoms among the older in China: a meta-analysis. Int J Geriatr Psychiatry
doi: 10.1002/gps.2821.
13. Gu D, Reynolds K, Duan X, Xin X, Chen J, et al. (2003) Prevalence of diabetes
and impaired fasting glucose in the Chinese adult population: International
Collaborative Study of Cardiovascular Disease in Asia (InterASIA). Diabetologia
46: 1190–1198.
14. Cockram CS (2000) The epidemiology of diabetes mellitus in the Asia-Pacific
region. Hong Kong Med J 6: 43–52.
15. Reynolds K, Gu D, Whelton PK, Wu X, Duan X, et al. (2007) Prevalence and
risk factors of overweight and obesity in China. Obesity (Silver Spring) 15: 10–
18.
16. Sanchez-Thorin JC (1998) The epidemiology of diabetes mellitus and diabetic
retinopathy. Int Ophthalmol Clin 38: 11–18.
17. Hu YH, Pan XR, Liu PA, Li GW, Howard BV, et al. (1991) Coronary heart
disease and diabetic retinopathy in newly diagnosed diabetes in Da Qing, China:
the Da Qing IGT and Diabetes Study. Acta Diabetol 28: 169–173.
18. He S, Guo Y, Li Z (1997) Epidemiologic study of diabetic retinopathy in Capital
Steel Company. Zhonghua Yan Ke Za Zhi 33: 381–383.
19. Shouling Li, Yanfeng Zhou, Di Chen, Minggong Yang, Meiling Zhu (1998)
Epidemiological investigation of diabetic retinopathy risk factors. Chin J Ocul
Fundus Dis 14: 119–121.
20. Wang G, Zhang F, Yuan S, Meng S, Zhu L, et al. (2001) A screening survey of
diabetic retinopathy and other chronic complications in Beijing district.
Ophthalmology In China 10: 180–182.
21. Zou H, Zhang X, Wang F, Xu X, Wang W, et al. (2006) Epidemiological
investigation of diabetic retinopathy in Beixinjing blocks, Shanghai. Chin J Ocul
Fundus Dis 22: 31–34.
22. Liang X, Lin J, Huang Z, Li G, Wu X (2006) Prevalence and risk factors of
diabetic retinopathy in Foshan City. Guangdong Medical Journal 27: 1552–
1553.
23. Xie X, Xu L, Yang H, Wang S, Jonas JB (2009) Frequency of diabetic
retinopathy in the adult population in China: the Beijing Eye Study 2001. IntOphthalmol 29: 485–493.
24. Liu L, Chen L, Hu Y, Liu L (2009) Analysis risk factors for diabetic retinopathy.
Shandong Medical Journal 49: 52–53.25. Shu X, Wang Y, Fan C, Sheng Y, Zhang H, et al. (2010) Epidemiology study on
the prevalence rate and risk factors of diabetic retinopathy in rural residents inShandong. Chin J Ocul Fundus Dis 26: 113–115.
26. Zhong X, Yahong MA, Lei Z, Yi L, Jing S, et al. (2010) Prevalence and risk
factors of diabetic retinopathy in rural population of Beijing. Clinical Focus 25:672–675.
27. Teng Y, Cui H, Zhang QS, Teng YF, Su Y, et al. (2010) Prevalence of diabeticretinopathy among the elderly in rural southern Shuangcheng city, Heilongjiang
province. Zhonghua Liu Xing Bing Xue Za Zhi 31: 856–859.28. Dong H (2010) Screening procession for diabetic retinopathy for Shunyi District
Houshayu Valley residents. Medical Information 10: 2701–2702.
29. Yang M, Wei S (2010) Early detection for diabetic retinopathy in Grassrootscommunity and results analysis. Hebei Medical Journal 32: 844–845.
30. Wang H, Sun F, Zhang Q, Zhai M, Wang S, et al. (2010) Epidemiologic studyon the prevalence rate and risk factors of diabetic retinopathy in eastern
countryside of Changzhi. Chin J Ocul Fundus Dis 26: 109–112.
31. Ye X (2010) The Analysis about Epidemiological Survey of DiabeticRetinopathy in Huizhou City. Guide of China Medicine 8: 27–28.
32. Wang FH, Liang YB, Peng XY, Wang JJ, Zhang F, et al. (2011) Risk factors fordiabetic retinopathy in a rural Chinese population with type 2 diabetes: the
Handan Eye Study. Acta Ophthalmol 89: e336–343.33. Li B, Liu Y, Han L, You D, Wang T, et al. (2011) Epidemiological survey of
diabetic retinopathy in Shunyi district of Beijing. Chin J Exp Ophthalmol 29:
747–752.34. Pang C, Jia L, Jiang S, Liu W, Hou X, et al. (2012) Determination of diabetic
retinopathy prevalence and associated risk factors in Chinese diabetic and pre-diabetic subjects: Shanghai diabetic complications study. Diabetes Metab Res
Rev 28: 276–283.
35. Xu J, Wei WB, Yuan MX, Yuan SY, Wan G, et al. (2012) Prevalence and riskfactors for diabetic retinopathy: the Beijing Communities Diabetes Study 6.
Retina 32: 322–329.
Prevalence of DR in Mainland China
PLOS ONE | www.plosone.org 8 September 2012 | Volume 7 | Issue 9 | e45264


![Boundary violations and adolescent drinking: Observational …eprints.lse.ac.uk/102547/1/journal.pone.0224185.pdf · 2020. 5. 30. · influence [10,11]; also[12,13], yetthoseargumentshave](https://img.pdfslide.us/doc/110x75/60ad66d460981a6cb719f952/boundary-violations-and-adolescent-drinking-observational-2020-5-30-influence.jpg)