Embed Size (px)
Citation preview
RESEARCH ARTICLE
Varicella-Zoster Virus in Perth, WesternAustralia: Seasonality and ReactivationIgor A. Korostil¤*, David G. Regan
The Kirby Institute, UNSWAustralia, Sydney, New South Wales, Australia
¤ Current address: School of Information Technologies, University of Sydney, Sydney, New South Wales,Australia* [email protected]
Abstract
Background
Identification of the factors affecting reactivation of varicella-zoster virus (VZV) largely
remains an open question. Exposure to solar ultra violet (UV) radiation is speculated to facil-
itate reactivation. Should the role of UV in reactivation be significant, VZV reactivation pat-
terns would generally be expected to be synchronous with seasonal UV profiles in
temperate climates.
Methods
We analysed age and gender specific VZV notification time series data from Perth, Western
Australia (WA). This city has more daily sunshine hours than any other major Australian
city. Using the cosinor and generalized linear models, we tested these data for seasonality
and correlation with UV and temperature.
Results
We established significant seasonality of varicella notifications and showed that while her-
pes-zoster (HZ) was not seasonal it had a more stable seasonal component in males over
60 than in any other subpopulation tested. We also detected significant association
between HZ notifications and UV for the entire Perth population as well as for females and
males separately. In most cases, temperature proved to be a significant factor as well.
Conclusions
Our findings suggest that UV radiation may be important for VZV reactivation, under the
assumption that notification data represent an acceptably accurate qualitative measure of
true VZV incidence.
PLOS ONE | DOI:10.1371/journal.pone.0151319 March 10, 2016 1 / 13
OPEN ACCESS
Citation: Korostil IA, Regan DG (2016) Varicella-Zoster Virus in Perth, Western Australia: Seasonalityand Reactivation. PLoS ONE 11(3): e0151319.doi:10.1371/journal.pone.0151319
Editor: Richard L. Thompson, University of CincinnatiSchool of Medicine, UNITED STATES
Received: January 9, 2015
Accepted: February 26, 2016
Published: March 10, 2016
Copyright: © 2016 Korostil, Regan. This is an openaccess article distributed under the terms of theCreative Commons Attribution License, which permitsunrestricted use, distribution, and reproduction in anymedium, provided the original author and source arecredited.
Data Availability Statement: The data used in thisstudy belongs to a third party (the Government ofWestern Australia). Anyone interested in obtainingthe data can file an official request. Requests may besent to: Government of Western Australia,Communicable Disease Control Directorate. POBox 8172 Perth Business Centre. Perth WA 6849Australia. Contact person: Dr Gary Dowse, MedicalEpidemiologist. Email: [email protected].
Funding: This research was funded by the CapitalMarkets Co-operative Research Centre. The fundershad no role in study design, data collection and
IntroductionVaricella-zoster virus (VZV) infection often observed in children is known as varicella orchickenpox. This disease usually lasts a short time and its main symptom is a rash. However,VZV remains dormant in the nervous system and can reactivate causing a vesicular rashknown as herpes zoster (HZ) or shingles [1]. The latter usually happens in older adults.
Current understanding of VZV epidemiology is not comprehensive and interpretation ofsome of its aspects remains limited to speculations based on inconsistent evidence. One exam-ple is the apparent dependence of VZV epidemiology on climate. As tropical and temperate cli-matic zones substantially differ in the amount and extent of variation of UV radiation(henceforth UV) they receive, a recently proposed hypothesis is that UV is likely to be a factorin determining the differences in global epidemiology of VZV [2–4]. It is possible that VZVcan be deactivated by UV which would explain increased (decreased) incidence of varicella intemperate climates during the periods characterised by lower (higher) UV [3]. On the otherhand, suppression of cellular immunity by UV [2] was proposed as a potential biological factordriving reactivation of VZV as HZ [5]. In addition, a recent Taiwanese study reported a strongassociation of the number of HZ related insurance claims with both UV and temperature [6].
In this study, we tested varicella and herpes zoster notification time series data for seasonal-ity and correlation with UV and temperature. Previously, there were no studies investigatingAustralian VZV data in this context. As Australia is a vast and scarcely populated country with8 climate zones, rather than attempting to analyse the nation-wide data we focused on a metro-politan location where population would be relatively large and UV would be generally highbut substantially varying between seasons. The notification data collected in Perth, WesternAustralia (WA) were particularly suitable for this purpose. Perth has a large population byAustralian standards—over 1.9 million in 2013 [7], concentrated in an area characterised bythe same UV index. Perth has the most sunshine hours of the major Australian cities (8 to 9hours daily) [8] and is located in a temperate climatic zone where the seasons are described interms of European seasons applied to the southern hemisphere, so substantial variations inboth temperature and UV take place every year [8, 9].
We note from the outset that notification data may not be an accurate representation of theactual incidence as they only represent the number of patients seeking medical attention. Inaddition, we acknowledge that a degree of case under-ascertainment and underreporting bydoctors can be assumed. However, for the type of analyses we perform in this paper it is notcrucial that the notification data should be as close to the real incidence as possible. We onlyneed our data to behave qualitatively similarly to the real incidence in terms of seasonality. It ispertinent to mention that notification data are currently the only available kind of VZV datathat can be used for systematic description of VZV dynamics in Australia. As there are usuallyno feasible mechanisms of collecting accurate VZV incidence data, VZV modelling studiescommonly deal with some form of notifications such as insurance claims or dermatologistreports (see, for example, [5, 6, 10]), no matter that this may impose serious limitations on theresults they obtain.
Materials and Methods
DataWe obtained the varicella and herpes zoster (shingles) notifications data collected in the PerthMetropolitan area from the Department of Health, Government of Western Australia. Thedata covered the period from January, 2009 to April, 2014 and were classified according to theterminology used by the National Notifiable Diseases Surveillance System (NNDSS): a
Varicella-Zoster Virus in Perth: Seasonality and Reactivation
PLOS ONE | DOI:10.1371/journal.pone.0151319 March 10, 2016 2 / 13
analysis, decision to publish, or preparation of themanuscript.
Competing Interests: The authors have declaredthat no competing interests exist.
confirmed case in this dataset was either based on laboratory definitive evidence and clinicalevidence or clinical evidence and epidemiological evidence [11]. The data were stratified by sexand age (five-year age groups) and only included Perth residents. The age of individuals rangedfrom 0 to over 100 and there were 702 and 666 confirmed varicella cases, and 1,698 and 1,992confirmed HZ cases in males and females, respectively. There were 2,237 and 2,591 casesmarked as unspecified (i.e. VZV was confirmed but it was unclear whether it was varicella orHZ) in males and females, respectively. The number of notifications in our dataset suggeststhat the incidence of VZV in Perth may be low as compared with estimations for other coun-tries [12].
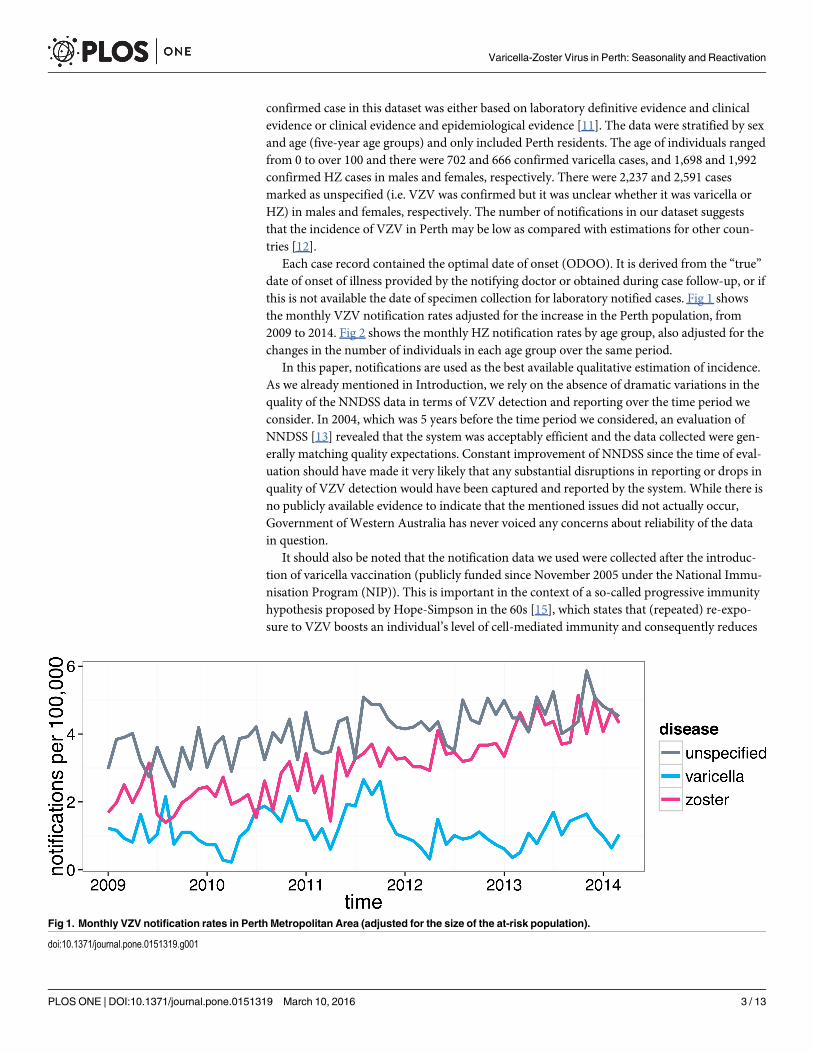
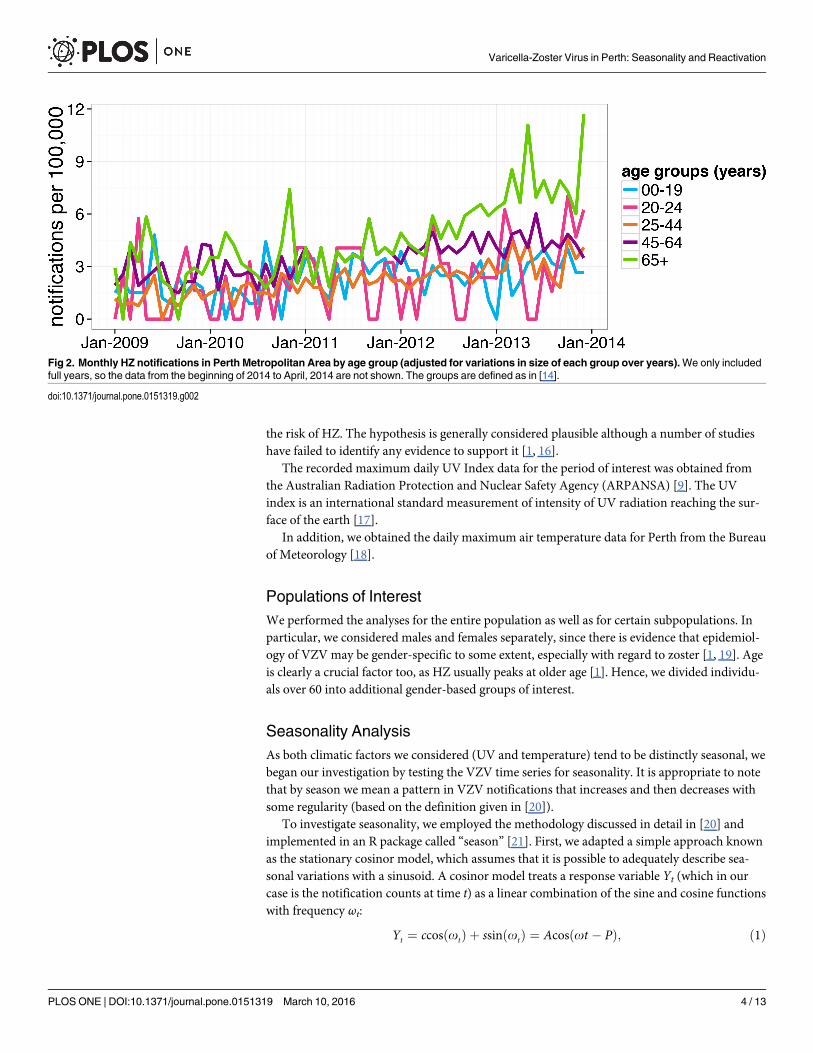
Each case record contained the optimal date of onset (ODOO). It is derived from the “true”date of onset of illness provided by the notifying doctor or obtained during case follow-up, or ifthis is not available the date of specimen collection for laboratory notified cases. Fig 1 showsthe monthly VZV notification rates adjusted for the increase in the Perth population, from2009 to 2014. Fig 2 shows the monthly HZ notification rates by age group, also adjusted for thechanges in the number of individuals in each age group over the same period.
In this paper, notifications are used as the best available qualitative estimation of incidence.As we already mentioned in Introduction, we rely on the absence of dramatic variations in thequality of the NNDSS data in terms of VZV detection and reporting over the time period weconsider. In 2004, which was 5 years before the time period we considered, an evaluation ofNNDSS [13] revealed that the system was acceptably efficient and the data collected were gen-erally matching quality expectations. Constant improvement of NNDSS since the time of eval-uation should have made it very likely that any substantial disruptions in reporting or drops inquality of VZV detection would have been captured and reported by the system. While there isno publicly available evidence to indicate that the mentioned issues did not actually occur,Government of Western Australia has never voiced any concerns about reliability of the datain question.
It should also be noted that the notification data we used were collected after the introduc-tion of varicella vaccination (publicly funded since November 2005 under the National Immu-nisation Program (NIP)). This is important in the context of a so-called progressive immunityhypothesis proposed by Hope-Simpson in the 60s [15], which states that (repeated) re-expo-sure to VZV boosts an individual’s level of cell-mediated immunity and consequently reduces
Fig 1. Monthly VZV notification rates in Perth Metropolitan Area (adjusted for the size of the at-risk population).
doi:10.1371/journal.pone.0151319.g001
Varicella-Zoster Virus in Perth: Seasonality and Reactivation
PLOS ONE | DOI:10.1371/journal.pone.0151319 March 10, 2016 3 / 13
the risk of HZ. The hypothesis is generally considered plausible although a number of studieshave failed to identify any evidence to support it [1, 16].
The recorded maximum daily UV Index data for the period of interest was obtained fromthe Australian Radiation Protection and Nuclear Safety Agency (ARPANSA) [9]. The UVindex is an international standard measurement of intensity of UV radiation reaching the sur-face of the earth [17].
In addition, we obtained the daily maximum air temperature data for Perth from the Bureauof Meteorology [18].
Populations of InterestWe performed the analyses for the entire population as well as for certain subpopulations. Inparticular, we considered males and females separately, since there is evidence that epidemiol-ogy of VZV may be gender-specific to some extent, especially with regard to zoster [1, 19]. Ageis clearly a crucial factor too, as HZ usually peaks at older age [1]. Hence, we divided individu-als over 60 into additional gender-based groups of interest.
Seasonality AnalysisAs both climatic factors we considered (UV and temperature) tend to be distinctly seasonal, webegan our investigation by testing the VZV time series for seasonality. It is appropriate to notethat by season we mean a pattern in VZV notifications that increases and then decreases withsome regularity (based on the definition given in [20]).
To investigate seasonality, we employed the methodology discussed in detail in [20] andimplemented in an R package called “season” [21]. First, we adapted a simple approach knownas the stationary cosinor model, which assumes that it is possible to adequately describe sea-sonal variations with a sinusoid. A cosinor model treats a response variable Yt (which in ourcase is the notification counts at time t) as a linear combination of the sine and cosine functionswith frequency ωt:
Yt ¼ ccosðotÞ þ ssinðotÞ ¼ Acosðot � PÞ; ð1Þ
Fig 2. Monthly HZ notifications in Perth Metropolitan Area by age group (adjusted for variations in size of each group over years).We only includedfull years, so the data from the beginning of 2014 to April, 2014 are not shown. The groups are defined as in [14].
doi:10.1371/journal.pone.0151319.g002
Varicella-Zoster Virus in Perth: Seasonality and Reactivation
PLOS ONE | DOI:10.1371/journal.pone.0151319 March 10, 2016 4 / 13
where A ¼ ffiffiffiffiffiffiffiffiffiffiffiffiffi
c2 þ s2p
is the amplitude and P is a phase (the peak location). The model can be fit-ted as a generalized linear model (GLM).
A typical GLM is written as
gðE½Yt�Þ ¼ b0 þ b1tX1t þ . . .þ bptXpt ð2Þ
where g() is a link function that describes how the mean of the response E[Yt] and a linear com-bination of explanatory variables X1,X2,. . .,Xp (also known as predictors or independent vari-ables) are related.
Next, we used the non-stationary parametric cosinor. This is a time series decompositionmethod using the Kalman filter [22] and Markov chain Monte Carlo sampling [23] that allowsboth amplitude and phase to be dependent on time. Decomposition here means that a timeseries is represented as a combination of the trend, season and error component. A full descrip-tion of the methodology used in the non-stationary cosinor analysis is beyond the scope of thispaper (see [20] for a detailed description).
Finally, we considered GLMs with months fitted as categorical independent variables toaccount for the possibility of non-sinusoidal seasonal patterns.
All computations were performed in the R environment for statistical computing [24].
Interpretation of Unspecified CasesConsidering that the database we worked with contained a large number of unspecified cases(see Fig 1), we repeated our analysis under a number of assumptions regarding the proportionsof unspecified cases representing varicella or HZ to determine how our results would beaffected. The purpose of this was to verify if the reasonable expectation that nearly all cases inadults are HZ would translate into emergence or disappearance of seasonal patterns or changein the significance of any association of notifications with UV and/or temperature. Our basecase assumption was that all unspecified cases in young children aged 0 to 9 were varicella,while all other unspecified cases were HZ. We considered variations of this assumption, assign-ing at least 70% of unspecified cases to HZ in individuals aged 10–14, at least 80% in those aged15–19 and at least 90% in all older age groups. This analysis did not yield any results related toseasonality or association of notifications with UV and/or temperature that differed signifi-cantly from those obtained using the confirmed varicella and HZ cases.
Results
Seasonality using the cosinor modelsThe cosinor model [20] is suitable for describing simple seasonal patterns such as a sinusoid.This model only requires two parameters to produce a seasonal pattern (see Eq (1)) and is fittedas a part of a GLM. The cosinor model was fitted to varicella notifications and a statistically sig-nificant varicella annual seasonal pattern was detected based on an adjusted significance levelof 0.025 (i.e. we would reject the null hypothesis if the p-value for either s or c from (1) wasp<0.05/2). Varicella notifications peaked in August-September and were at their lowest in Feb-ruary-March. Both sine and cosine coefficients s and c were significant (p<0.001). The HZnotifications were clearly non-stationary (see Fig 1) and thus predictably not captured by thecosinor.
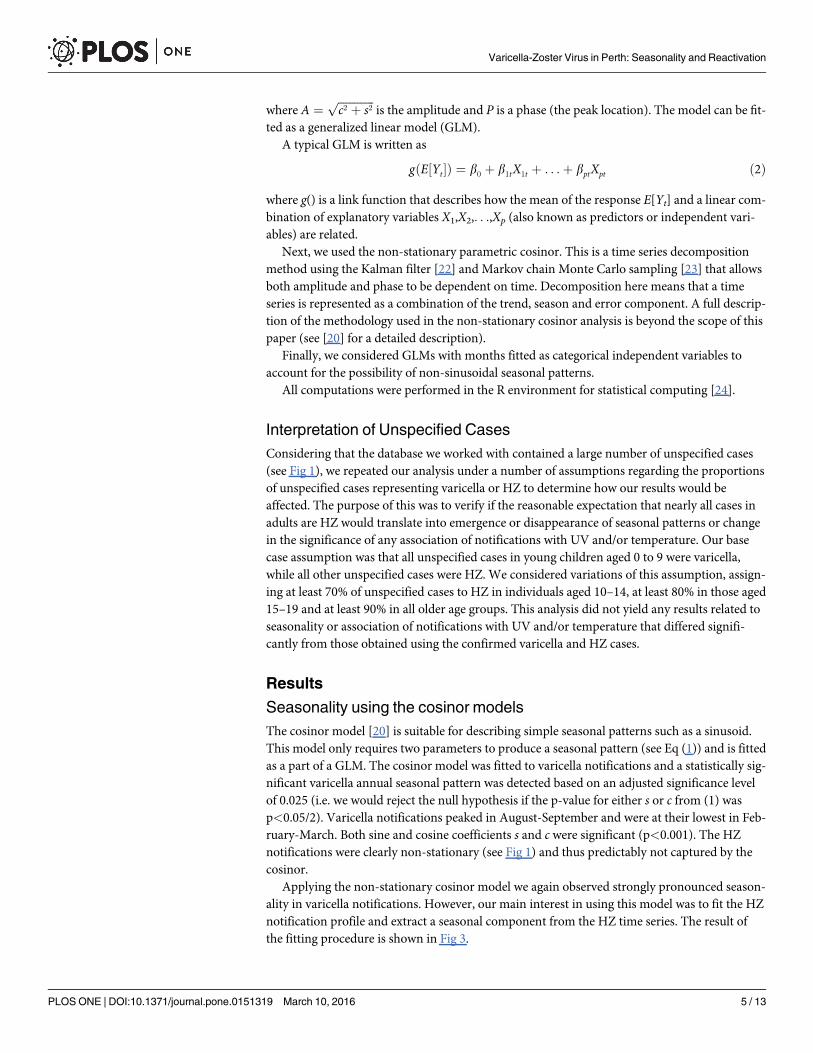
Applying the non-stationary cosinor model we again observed strongly pronounced season-ality in varicella notifications. However, our main interest in using this model was to fit the HZnotification profile and extract a seasonal component from the HZ time series. The result ofthe fitting procedure is shown in Fig 3.
Varicella-Zoster Virus in Perth: Seasonality and Reactivation
PLOS ONE | DOI:10.1371/journal.pone.0151319 March 10, 2016 5 / 13
Note that monthly counts were adjusted for the size of the at-risk population and the num-ber of days per month. The former adjustment is particularly important because the Perth pop-ulation has been rapidly growing since 2009. For example, between 2013 and 2014 it increasedby 2.5% [7]. The seasonal component did not follow any apparent annual pattern as can beseen in Fig 4.
The seasonal component of the varicella time series is also shown in Fig 4. Note that themean phase for varicella was around August, in agreement with the fit produced by the station-ary cosinor.
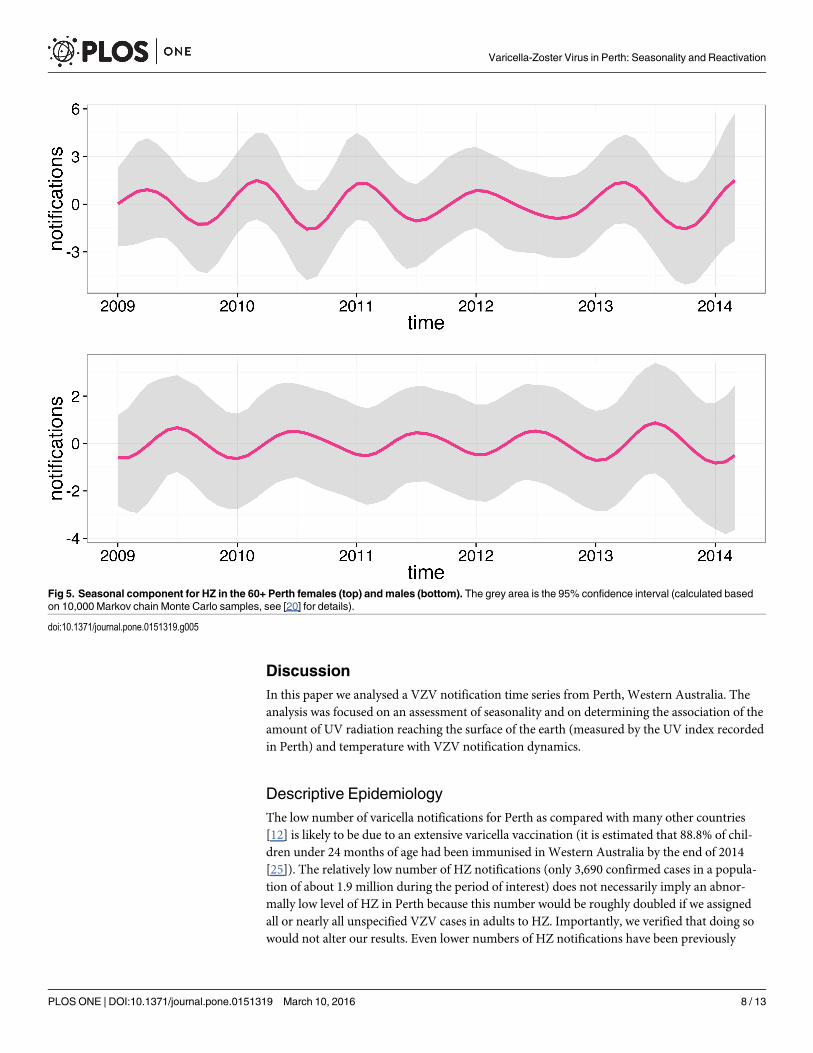
When we fitted the HZ notifications for males and females separately we observed that infemales the seasonal component was weak but it did show consistent amplitude until 2012when it started to flatten. On the contrary, in males the amplitude was hardly noticeable until2011 when it became clearly pronounced and showed signs of further growth in early 2014. Wealso fitted the HZ notifications for males and females over 60 (together and separately) as theyare at a high risk of HZ due to older age. Seasonal components for the 60+ groups are shown inFig 5.
For 60+ females we observed a varying phase and a temporarily flattening sinusoid in 2012while in 60+ males the sinusoid had roughly the same amplitude each year peaking consistentlyaround June.
GLM for HZ Notifications with Months as Categorical VariablesIn order to assess the association of climatic factors we considered a GLM with monthsincluded as categorical variables. Specifically, our model was of the form
gðE½Yt�Þ ¼ b0 þ b1tX1t þ b2tX2t þ b12tðX1t � X2tÞ þ ½months� ð3Þ
where the response Y was the HZ counts assumed to be Poisson distributed, X1 was the temper-ature, X2 was the UV, and the term X1 � X2 corresponded to their interaction. We utilised a g()= log() link function typically used for counts. Implementation of the model was based on amodification of the standard R function glm() called monthglm() available in the R package“season” [21].
Fig 3. Non-stationary cosinor model fitted (red) to HZ notifications for Perth (blue). The fitted line is the mean and the grey area is the 95% confidenceinterval (both calculated based on 10,000 Markov chain Monte Carlo samples; see [20] for details).
doi:10.1371/journal.pone.0151319.g003
Varicella-Zoster Virus in Perth: Seasonality and Reactivation
PLOS ONE | DOI:10.1371/journal.pone.0151319 March 10, 2016 6 / 13
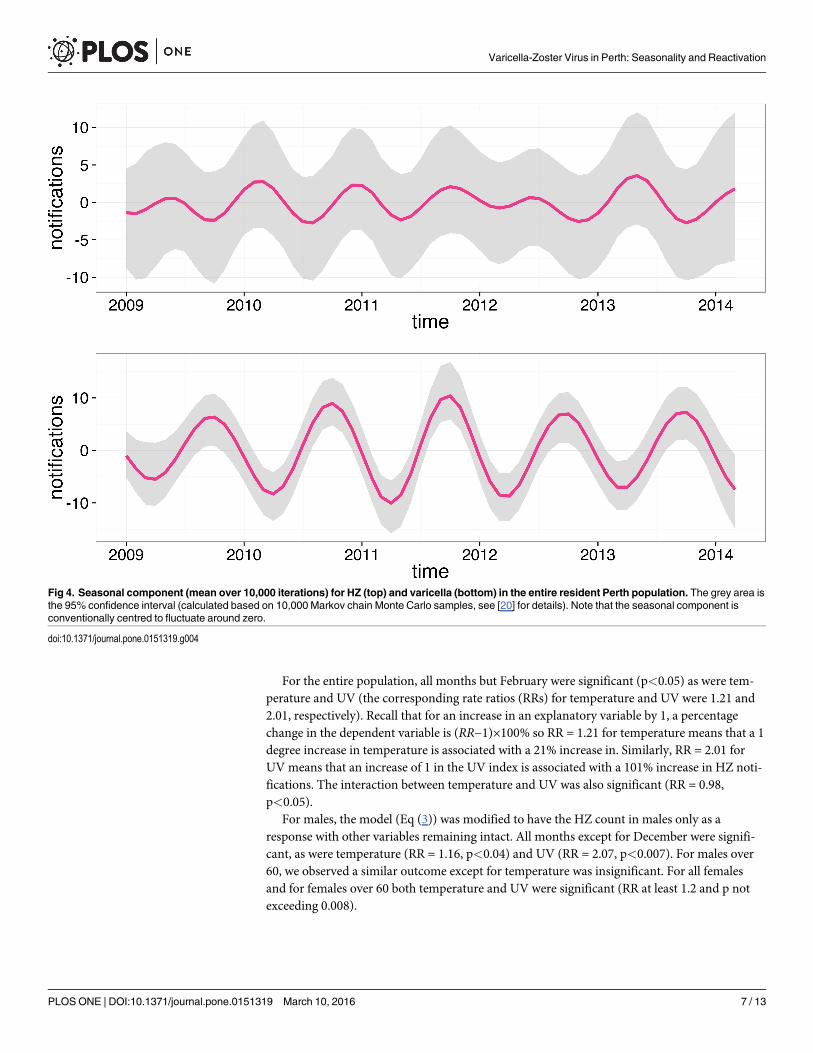
For the entire population, all months but February were significant (p<0.05) as were tem-perature and UV (the corresponding rate ratios (RRs) for temperature and UV were 1.21 and2.01, respectively). Recall that for an increase in an explanatory variable by 1, a percentagechange in the dependent variable is (RR−1)×100% so RR = 1.21 for temperature means that a 1degree increase in temperature is associated with a 21% increase in. Similarly, RR = 2.01 forUV means that an increase of 1 in the UV index is associated with a 101% increase in HZ noti-fications. The interaction between temperature and UV was also significant (RR = 0.98,p<0.05).
For males, the model (Eq (3)) was modified to have the HZ count in males only as aresponse with other variables remaining intact. All months except for December were signifi-cant, as were temperature (RR = 1.16, p<0.04) and UV (RR = 2.07, p<0.007). For males over60, we observed a similar outcome except for temperature was insignificant. For all femalesand for females over 60 both temperature and UV were significant (RR at least 1.2 and p notexceeding 0.008).
Fig 4. Seasonal component (mean over 10,000 iterations) for HZ (top) and varicella (bottom) in the entire resident Perth population. The grey area isthe 95% confidence interval (calculated based on 10,000 Markov chain Monte Carlo samples, see [20] for details). Note that the seasonal component isconventionally centred to fluctuate around zero.
doi:10.1371/journal.pone.0151319.g004
Varicella-Zoster Virus in Perth: Seasonality and Reactivation
PLOS ONE | DOI:10.1371/journal.pone.0151319 March 10, 2016 7 / 13
DiscussionIn this paper we analysed a VZV notification time series from Perth, Western Australia. Theanalysis was focused on an assessment of seasonality and on determining the association of theamount of UV radiation reaching the surface of the earth (measured by the UV index recordedin Perth) and temperature with VZV notification dynamics.
Descriptive EpidemiologyThe low number of varicella notifications for Perth as compared with many other countries[12] is likely to be due to an extensive varicella vaccination (it is estimated that 88.8% of chil-dren under 24 months of age had been immunised in Western Australia by the end of 2014[25]). The relatively low number of HZ notifications (only 3,690 confirmed cases in a popula-tion of about 1.9 million during the period of interest) does not necessarily imply an abnor-mally low level of HZ in Perth because this number would be roughly doubled if we assignedall or nearly all unspecified VZV cases in adults to HZ. Importantly, we verified that doing sowould not alter our results. Even lower numbers of HZ notifications have been previously
Fig 5. Seasonal component for HZ in the 60+ Perth females (top) andmales (bottom). The grey area is the 95% confidence interval (calculated basedon 10,000 Markov chain Monte Carlo samples, see [20] for details).
doi:10.1371/journal.pone.0151319.g005
Varicella-Zoster Virus in Perth: Seasonality and Reactivation
PLOS ONE | DOI:10.1371/journal.pone.0151319 March 10, 2016 8 / 13
reported for some cities (see for example [26] where 1,798 HZ cases over 8 years were docu-mented for Madrid whose population exceeds 3 million).
The HZ notification rate has been increasing in Perth since 2009, particularly in older agegroups (Fig 2). This is consistent with the trends reported to be taking place in a number ofother countries [27] and generally in Australia [28, 29]. At the same time, varicella notificationshave been declining and the ratio of HZ notifications to varicella notifications has been increas-ing (Fig 1). Vaccination is a possible cause of this effect [27]. The Hope-Simpson hypothesis[15] implies that an extensive varicella vaccination would drastically reduce VZV incidence inchildren and consequently exposure to VZV in adults, which then would result in increasingHZ incidence. Note that the time period shown in Fig 1 starts 4 years after publicly funded var-icella vaccination commenced in Australia [25].
While vaccination is arguably the most convincing explanation for increasing HZ notifica-tions, in some countries an increase in HZ was noted before the introduction of varicella vacci-nation programmes [6, 12]. In addition, results from the only study to date that examinedtrends in HZ notifications following the introduction of universal funding for varicella immu-nization in Australia indicated that it was not possible to directly attribute the increasing trendsin observed HZ notifications to the immunization programme [28].
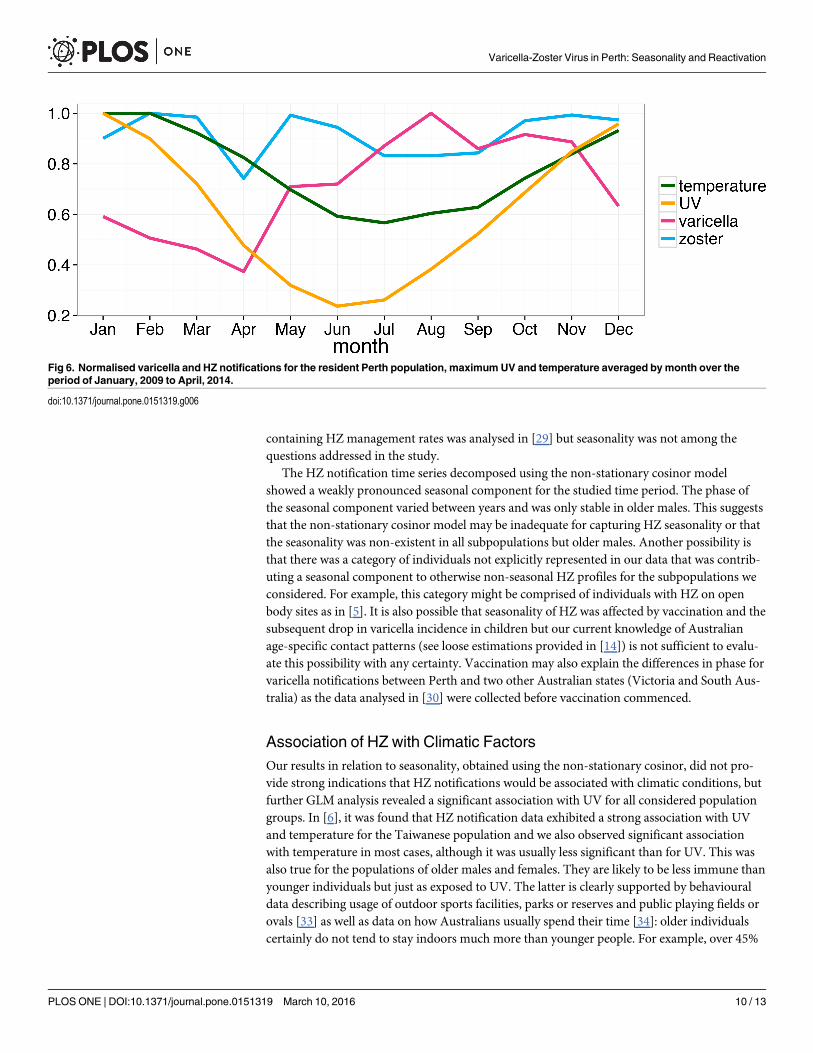
Seasonality of VaricellaPrevious studies have suggested that varicella incidence can exhibit seasonal patterns, particu-larly in temperate climates [6], however in only a few cases it was strongly pronounced [10,19]. We identified significant seasonality of varicella notifications that is well described by bothstationary and non-stationary sinusoids. Previously, seasonality was detected in varicella datafrom Victoria and South Australia using Edward’s test [30] but it was concluded that a sinusoidcould be unsuitable to describe it. In our analysis of varicella notifications for Perth we identi-fied seasonality with the largest number of notifications typically observed in August-Septem-ber. This was not the case in the aforementioned analyses of notification data for Victoria andSouth Australia, where varicella tended to peak in summer months (December-February). LikePerth, Victoria and South Australia are predominantly in the temperate climate zone. As men-tioned in [31], several studies have found the highest incidence of varicella to occur in the cool-est months of the year (see, for example, [32]), which is not dissimilar to what we observe forPerth where the coolest period lasts from June to August (winter), with July being the coldestmonth on average (see Fig 6).
Seasonality of Herpes ZosterNearly all studies conducted in Australia or elsewhere that have attempted to detect seasonalityof HZ were unsuccessful in this matter [1]. To our knowledge there are two exceptions: onestudy conducted in Lodz, Poland showed that there was significant seasonality of zoster notifi-cations for open body sites in males but not in females in the period 1999–2000 [5]; a morerecent and much more extensive Japanese and Taiwanese studies [6, 10] demonstrated season-ality of both varicella and HZ notifications that mirrored each other [10], suggesting that whenvaricella was increasing HZ was declining and vice versa. Note that we did not see this mirror-ing effect consistently showing in Perth (see Fig 1 and Fig 4).
An Australian study that addressed the question of HZ seasonality using sinusoidal models[30] failed to detect it, although an increase in HZ-specific antiviral prescriptions during sum-mer months was reported [28]. The National GP Disease Surveillance Network data for 1994–1995 also showed no seasonal variation in rates for HZ [30]. We should also mention that anextensive Bettering the Evaluation and Care of Health (BEACH) national cross-survey dataset
Varicella-Zoster Virus in Perth: Seasonality and Reactivation
PLOS ONE | DOI:10.1371/journal.pone.0151319 March 10, 2016 9 / 13
containing HZ management rates was analysed in [29] but seasonality was not among thequestions addressed in the study.
The HZ notification time series decomposed using the non-stationary cosinor modelshowed a weakly pronounced seasonal component for the studied time period. The phase ofthe seasonal component varied between years and was only stable in older males. This suggeststhat the non-stationary cosinor model may be inadequate for capturing HZ seasonality or thatthe seasonality was non-existent in all subpopulations but older males. Another possibility isthat there was a category of individuals not explicitly represented in our data that was contrib-uting a seasonal component to otherwise non-seasonal HZ profiles for the subpopulations weconsidered. For example, this category might be comprised of individuals with HZ on openbody sites as in [5]. It is also possible that seasonality of HZ was affected by vaccination and thesubsequent drop in varicella incidence in children but our current knowledge of Australianage-specific contact patterns (see loose estimations provided in [14]) is not sufficient to evalu-ate this possibility with any certainty. Vaccination may also explain the differences in phase forvaricella notifications between Perth and two other Australian states (Victoria and South Aus-tralia) as the data analysed in [30] were collected before vaccination commenced.
Association of HZ with Climatic FactorsOur results in relation to seasonality, obtained using the non-stationary cosinor, did not pro-vide strong indications that HZ notifications would be associated with climatic conditions, butfurther GLM analysis revealed a significant association with UV for all considered populationgroups. In [6], it was found that HZ notification data exhibited a strong association with UVand temperature for the Taiwanese population and we also observed significant associationwith temperature in most cases, although it was usually less significant than for UV. This wasalso true for the populations of older males and females. They are likely to be less immune thanyounger individuals but just as exposed to UV. The latter is clearly supported by behaviouraldata describing usage of outdoor sports facilities, parks or reserves and public playing fields orovals [33] as well as data on how Australians usually spend their time [34]: older individualscertainly do not tend to stay indoors much more than younger people. For example, over 45%
Fig 6. Normalised varicella and HZ notifications for the resident Perth population, maximumUV and temperature averaged bymonth over theperiod of January, 2009 to April, 2014.
doi:10.1371/journal.pone.0151319.g006
Varicella-Zoster Virus in Perth: Seasonality and Reactivation
PLOS ONE | DOI:10.1371/journal.pone.0151319 March 10, 2016 10 / 13
of males over 65 attend parks, which is the highest proportion among males of any age. Hence,the older Perth residents are unlikely to be less exposed to UV due to their lifestyle.
LimitationsOut study has two important limitations. First of all, there was no reliable way to ascertain howclosely the notification dataset we used reflected the actual varicella and HZ incidence. Therecould be variations in quality of detection and notification that affected the recorded notifica-tion counts. Specifically, there could be changes in testing and notification by doctors as well asavailability and use of more sensitive polymerase chain reaction tests. In addition, some indi-viduals with milder cases of varicella and zoster may not seek medical attention, so these mayremain unreported.
As detailed in Introduction, many VZV modeling studies face similar limitations as theactual VZV incidence data are usually unavailable (see, for example, [5], [6] or [10]). In view ofthis, our efforts to verify the robustness of our results by re-applying analysis to the originaldata augmented via re-categorizations of the unidentified VZV notifications gave us an addi-tional degree of confidence regarding suitability of our data for the purpose of the study.
Secondly, we had no suitable data to properly assess the actual UV exposure for various cat-egories of individuals. While the recorded UV index values inform about the UV level at thesurface of the earth, behavioral data are needed to understand how these are correlated withthe amount of time people spend in the sun and related factors such as the use of sunscreen.Whereas convincing biological explanations of the observed differences in VZV between malesand females are currently absent, we can only presume that the apparently higher HZ incidencein females may be due to some differences in behavior, which is an assumption similar to thatmade in [5]. There are data suggesting that Australian males tend to spend more time outdoorsthan females [34] and still males appear to be less prone to HZ. This emphasizes that eventhough we established a significant association of HZ notifications with UV, we do not have anunderstanding of what mechanism underlies this observation.
SummaryIn conclusion, we confirmed seasonality of varicella in Perth, Western Australia, which peakedduring August-September (Australian spring when both UV and temperature are relativelylow). The HZ seasonal component was most consistent between years in older males, peakingin around June (one of the coldest months in Australia). Significant association between HZnotifications and UV for the Perth resident population was established and in most cases, tem-perature proved to be a significant factor as well. These findings may contribute to our under-standing of the importance of UV in VZV epidemiology. High quality behavioural data clearlydescribing the actual unprotected exposure to UV are needed in order to further clarify theeffect of UV and temperature on VZV.
AcknowledgmentsWe would like to thank Gary Dowse and Paul Saunders from Communicable Disease ControlDirectorate, Department of Health, Government of Western Australia for their valuable helpwith varicella-zoster notification data. The Kirby Institute receives funding from the AustralianGovernment Department of Health and Ageing. The views expressed in this publication do notnecessarily represent the position of the Australian Government.
This research was funded by the Capital Markets Co-operative Research Centre.
Varicella-Zoster Virus in Perth: Seasonality and Reactivation
PLOS ONE | DOI:10.1371/journal.pone.0151319 March 10, 2016 11 / 13
Author ContributionsConceived and designed the experiments: IAK. Analyzed the data: IAK. Wrote the paper: IAKDGR.
References1. Thomas SL, Hall AJ. What does epidemiology tell us about risk factors for herpes zoster? The Lancet
infectious diseases. 2004; 4(1):26–33. PMID: 14720565.
2. Hanneman KK, Cooper KD, Baron ED. Ultraviolet immunosuppression: mechanisms and conse-quences. Dermatologic clinics. 2006; 24(1):19–25. doi: 10.1016/j.det.2005.08.003 PMID: 16311164.
3. Rice PS. Ultra-violet radiation is responsible for the differences in global epidemiology of chickenpoxand the evolution of varicella-zoster virus as man migrated out of Africa. Virology journal. 2011; 8:189.doi: 10.1186/1743-422X-8-189 PMID: 21513563; PubMed Central PMCID: PMC3094303.
4. Vaughan G, Rodriguez-Castillo A, Cruz-Rivera MY, Ruiz-Tovar K, Ramirez-Gonzalez JE, Rivera-Osorio P, et al. Is ultra-violet radiation the main force shaping molecular evolution of varicella-zostervirus? Virology journal. 2011; 8:370. doi: 10.1186/1743-422X-8-370 PMID: 21794170; PubMed CentralPMCID: PMC3162543.
5. Zak-Prelich M, Borkowski JL, Alexander F, Norval M. The role of solar ultraviolet irradiation in zoster.Epidemiology and infection. 2002; 129(3):593–7. PMID: 12558343; PubMed Central PMCID:PMC2869922.
6. Wu PY,Wu HD, Chou TC, Sung FC. Varicella vaccination alters the chronological trends of herpes zos-ter and varicella. PloS one. 2013; 8(10):e77709. doi: 10.1371/journal.pone.0077709 PMID: 24204928;PubMed Central PMCID: PMC3813742.
7. Australian Bureau of Statistics. 3218.0—Regional Population Growth, Australia. Available: http://www.abs.gov.au/ausstats/[email protected]/mf/3218.0.
8. Australian Government. Bureau of Meteorology. Average annual and monthly sunshine duration. Avail-able: http://www.bom.gov.au/jsp/ncc/climate_averages/sunshine-hours/index.jsp.
9. Australian Government. Australian Radiation Protection and Nuclear Safety Agency. Monthly UV IndexSummaries for Perth. Available: http://www.arpansa.gov.au/uvindex/monthly/permonthlysumm.htm.
10. Toyama N, Shiraki K, Society of the Miyazaki Prefecture D. Epidemiology of herpes zoster and its rela-tionship to varicella in Japan: A 10-year survey of 48,388 herpes zoster cases in Miyazaki prefecture.Journal of medical virology. 2009; 81(12):2053–8. doi: 10.1002/jmv.21599 PMID: 19856466.
11. Australian Government. Department of Health. National Notifiable Deseases Surveillance System.Available: http://www9.health.gov.au/cda/source/cda-index.cfm.
12. Kawai K, Gebremeskel BG, Acosta CJ. Systematic review of incidence and complications of herpeszoster: towards a global perspective. BMJ open. 2014; 4(6):e004833. doi: 10.1136/bmjopen-2014-004833 PMID: 24916088; PubMed Central PMCID: PMC4067812.
13. Miller M, Roche P, Spencer J, Deeble M. Evaluation of Australia's National Notifiable Disease Surveil-lance System. Commun Dis Intell Q Rep. 2004; 28(3):311–23. PMID: 15574055.
14. Gidding HF, Brisson M, Macintyre CR, Burgess MA. Modelling the impact of vaccination on the epide-miology of varicella zoster virus in Australia. Australian and New Zealand journal of public health. 2005;29(6):544–51. PMID: 16366065.
15. Hope-Simpson RE. The Nature of Herpes Zoster: A Long-Term Study and a New Hypothesis. Proceed-ings of the Royal Society of Medicine. 1965; 58:9–20. PMID: 14267505; PubMed Central PMCID:PMC1898279.
16. Donahue JG, Kieke BA, Gargiullo PM, Jumaan AO, Berger NR, McCauley JS, et al. Herpes zoster andexposure to the varicella zoster virus in an era of varicella vaccination. American journal of publichealth. 2010; 100(6):1116–22. doi: 10.2105/AJPH.2009.160002 PMID: 20075320; PubMed CentralPMCID: PMC2866606.
17. Australian Government. Bureau of Meteorology. About the UV index. Available: http://www.bom.gov.au/uv/about_uv_index.shtml.
18. Australian Government. Bureau of Meteorology. Climate Data Online. Daily maximum temperature.Perth Metro. Available: http://www.bom.gov.au/climate/data/.
19. Heininger U, Seward JF. Varicella. Lancet. 2006; 368(9544):1365–76. doi: 10.1016/S0140-6736(06)69561-5 PMID: 17046469.
20. Barnett AG, Dobson AJ. Analysing Seasonal Health Data: Springer; 2010.
Varicella-Zoster Virus in Perth: Seasonality and Reactivation
PLOS ONE | DOI:10.1371/journal.pone.0151319 March 10, 2016 12 / 13
21. Barnett AG, Baker PJ, Dobson AJ. season: Analysing Seasonal Data R Functions. R package version0.3–4 2014. Available: http://cran.r-project.org/web/packages/season/index.html.
22. Brookner E. Tracking and Kalman Filtering Made Easy. New York: Wiley; 1998.
23. Robert CP, Casella G. Monte Carlo Statistical Methods. Second ed: Springer; 2010.
24. R Core Team. R: A language and Environment for Statistical Computing. R Foundation for StatisticalComputing, 2014.
25. National Centre for Immunization Research and Surveillance. Childhood Immunisation Coverage esti-mates. Available: http://www.ncirs.edu.au/provider-resources/coverage-information/coverage-estimages 2014.
26. Perez-Farinos N, Ordobas M, Garcia-Fernandez C, Garcia-Comas L, Canellas S, Rodero I, et al. Vari-cella and herpes zoster in Madrid, based on the Sentinel General Practitioner Network: 1997–2004.BMC Infect Dis. 2007; 7:59. doi: 10.1186/1471-2334-7-59 PMID: 17570859; PubMed Central PMCID:PMC1913920.
27. Guzzetta G, Poletti P, Del Fava E, Ajelli M, Scalia Tomba GP, Merler S, et al. Hope-Simpson's progres-sive immunity hypothesis as a possible explanation for herpes zoster incidence data. American journalof epidemiology. 2013; 177(10):1134–42. doi: 10.1093/aje/kws370 PMID: 23548754.
28. Jardine A, Conaty SJ, Vally H. Herpes zoster in Australia: evidence of increase in incidence in adultsattributable to varicella immunization? Epidemiology and infection. 2011; 139(5):658–65. doi: 10.1017/S0950268810001949 PMID: 20727248.
29. Nelson MR, Britt HC, Harrison CM. Evidence of increasing frequency of herpes zoster management inAustralian general practice since the introduction of a varicella vaccine. The Medical journal of Austra-lia. 2010; 193(2):110–3. PMID: 20642419.
30. Miller ER, Kelly HA. Varicella infection—evidence for peak activity in summer months. The Journal ofinfection. 2008; 56(5):360–5. doi: 10.1016/j.jinf.2008.01.050 PMID: 18359087.
31. Jackson C, Mangtani P, Fine P, Vynnycky E. The effects of school holidays on transmission of varicellazoster virus, England andWales, 1967–2008. PloS one. 2014; 9(6):e99762. doi: 10.1371/journal.pone.0099762 PMID: 24932994; PubMed Central PMCID: PMC4059708.
32. Vergara-Castaneda A, Escobar-Gutierrez A, Ruiz-Tovar K, Sotelo J, Ordonez G, Cruz-Rivera MY,et al. Epidemiology of varicella in Mexico. Journal of clinical virology: the official publication of the PanAmerican Society for Clinical Virology. 2012; 55(1):51–7. doi: 10.1016/j.jcv.2012.06.004 PMID:22750018.
33. Australian Bureau of Statistics. 4177.0—Participation in Sport and Physical Recreation, Australia,2011–12—Western Australia. Available: http://www.abs.gov.au/ausstats/[email protected]/mf/4177.0.
34. Australian Bureau of Statistics. 4153.0—How Australians Use Their Time, 2006. Available: http://www.abs.gov.au/.
Varicella-Zoster Virus in Perth: Seasonality and Reactivation
PLOS ONE | DOI:10.1371/journal.pone.0151319 March 10, 2016 13 / 13


![RESEARCHARTICLE CyclophilinInhibitorsRemodelthe … · 2016. 9. 20. · year[1–2].Two-thirds oflivercancerand transplant cases inthedeveloped worldarecaused PLOSONE ... tureofHCV-infected](https://img.pdfslide.us/doc/110x75/60c78c2333a17d336e7f202f/researcharticle-cyclophilininhibitorsremodelthe-2016-9-20-year1a2two-thirds.jpg)