Embed Size (px)
Citation preview
Journal of Volcanology and Geothermal Research 302 (2015) 81–86
Contents lists available at ScienceDirect
Journal of Volcanology and Geothermal Research
j ourna l homepage: www.e lsev ie r .com/ locate / jvo lgeores
Temperature profile around a basaltic sill intruded into wet sediments
Leslie L. Baker a,⁎, Andrew Bernard a,1, William C. Rember a, Moses Milazzo b, Colin Dundas b,Oleg Abramov b, Laszlo Keszthelyi b
a Department of Geological Sciences, 875 Perimeter Drive, MS 3022, University of Idaho, Moscow, ID 83844-3022, United Statesb USGS Astrogeology Science Center, 2255 N. Gemini Drive, Flagstaff, AZ 86001, United States
⁎ Corresponding author.E-mail address: [email protected] (L.L. Baker).
1 Now at Department of Chemistry, University of CalifoUnited States.
http://dx.doi.org/10.1016/j.jvolgeores.2015.06.0120377-0273/© 2015 The Authors. Published by Elsevier B.V
a b s t r a c t
a r t i c l e i n f oArticle history:Received 6 February 2015Accepted 13 June 2015Available online 19 June 2015
Keywords:BasaltSillLava–water interactionHeat flow
The transfer of heat into wet sediments frommagmatic intrusions or lava flows is not well constrained from fielddata. Such field constraints on numerical models of heat transfer could significantly improve our understandingof water–lava interactions. We use experimentally calibrated pollen darkening to measure the temperature pro-file around a basaltic sill emplaced intowet lakebed sediments. It iswell known that, upon heating, initially trans-parent palynomorphs darken progressively through golden, brown, and black shades before being destroyed;however, this approach tomeasuring temperature has not been applied to volcanological questions.We collectedsediment samples from establishedMiocene fossil localities at Clarkia, Idaho. Fossils in the sediments include pol-len fromnumerous tree and shrub species.We experimentally calibrated changes in the color of Clarkia sedimentpollen and used this calibration to determine sediment temperatures around a Miocene basaltic sill emplaced inthe sediments. Results indicated a flat temperature profile above and below the sill, with T N325 °Cwithin 1 cmofthe basalt-sediment contact, near 300 °C at 1–2 cm from the contact, and ~250 °C at 1m from the sill contact. Thisprofile suggests that heat transport in the sediments was hydrothermally rather than conductively controlled.This information will be used to test numerical models of heat transfer in wet sediments on Earth and Mars.
© 2015 The Authors. Published by Elsevier B.V. This is an open access article under the CC BY-NC-ND license(http://creativecommons.org/licenses/by-nc-nd/4.0/).
1. Introduction
Interaction of lava and magma with wet sediments is a frequentoccurrence in volcanically active regions on the Earth's surface. Thephysical signs of this interaction are well described and include pillowbasalts, spiracles, peperites, hyaloclastites, and rootless cones, amongother features (Waters, 1960; Kokelaar, 1986; Skilling et al., 2002;Hamilton et al., 2010). Some similar features have been described onMars, and as their presence suggests interaction between lava andwater or wet sediments, they offer clues to the history of near-surfacewater and ice on Mars, including its location and age (Greeley andFagents, 2001; Jaeger et al., 2007; Milazzo et al., 2009; Keszthelyi et al.,2010; Dundas and Keszthelyi, 2013). The formation of many of thesefeatures fundamentally depends on heating of wet sediments by hotlava. Heat transport at the lava–sediment interface is not well under-stood, however. This study uses experimentally calibrated pollen dark-ening to measure the temperature profile around a thin basaltic sillintruded into wet lake sediments. This result will provide field-based
rnia at Davis, Davis, CA 95616,
. This is an open access article under
constraints on modeling of the interaction between lava and wet sedi-ments on Earth and Mars.
1.1. Regional geology
Miocene Clarkia Lake formed in north Idaho, USA approximately14 Ma ago when a flow of the Priest Rapids Basalt of the ColumbiaRiver Basalt Group dammed the ancestral drainage of the St. MariesRiver, flooding upstream valleys (Smiley and Rember, 1981; Campet al., 1982). The depth of the lava-dammed lake is notwell constrained,but Smiley and Rember (1979) approximate its shoreline at thepresent-daymapped 2960 foot contour (902m), based on a topograph-ic break at this altitude. The present-day valley bottom is at the 2800foot (853 m) contour, suggesting a lake depth of approximately 50 mat the deepest points. This depth estimate agrees with the observationthat sediments at the Clarkia P-33 site near Bechtel Butte, 4 km SW ofthe town of Clarkia, have a total thickness of 45 m (Smiley andRember, 1981). Sediment textures suggest relatively rapid depositionrates of ≥ 1 cm/year in the lake (Smiley and Rember, 1981). This rapidsedimentation, together with anoxic bottom conditions, resulted in ex-quisite preservation of plant, insect, and fish fossils in the lake-bottomsediments (Smiley and Rember, 1981). Palynomorphs from extantplant species are abundant in the sediments. After sediment deposition,basalt from slightly younger eruptions intruded the wet sediments as
the CC BY-NC-ND license (http://creativecommons.org/licenses/by-nc-nd/4.0/).
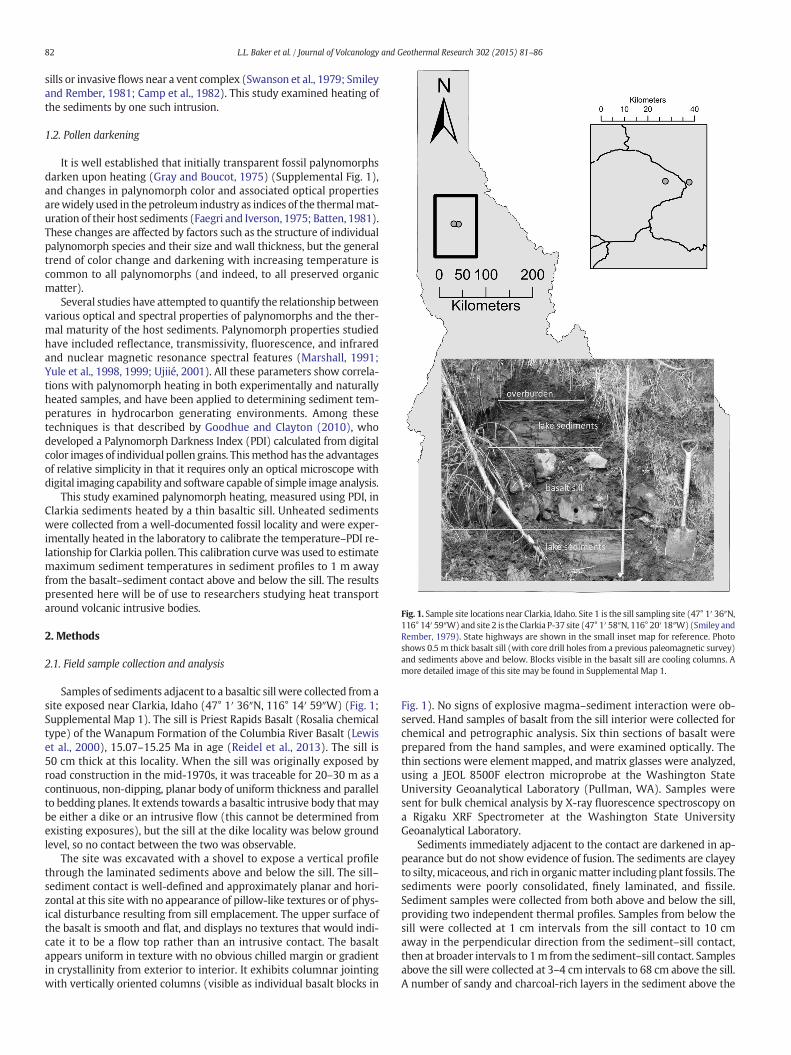
Fig. 1. Sample site locations near Clarkia, Idaho. Site 1 is the sill sampling site (47° 1′ 36″N,116° 14′ 59″W)and site 2 is the Clarkia P-37 site (47° 1′ 58″N, 116° 20′ 18″W)(Smiley andRember, 1979). State highways are shown in the small inset map for reference. Photoshows 0.5 m thick basalt sill (with core drill holes from a previous paleomagnetic survey)and sediments above and below. Blocks visible in the basalt sill are cooling columns. Amore detailed image of this site may be found in Supplemental Map 1.
82 L.L. Baker et al. / Journal of Volcanology and Geothermal Research 302 (2015) 81–86
sills or invasive flows near a vent complex (Swanson et al., 1979; Smileyand Rember, 1981; Camp et al., 1982). This study examined heating ofthe sediments by one such intrusion.
1.2. Pollen darkening
It is well established that initially transparent fossil palynomorphsdarken upon heating (Gray and Boucot, 1975) (Supplemental Fig. 1),and changes in palynomorph color and associated optical propertiesarewidely used in thepetroleum industry as indices of the thermalmat-uration of their host sediments (Faegri and Iverson, 1975; Batten, 1981).These changes are affected by factors such as the structure of individualpalynomorph species and their size and wall thickness, but the generaltrend of color change and darkening with increasing temperature iscommon to all palynomorphs (and indeed, to all preserved organicmatter).
Several studies have attempted to quantify the relationship betweenvarious optical and spectral properties of palynomorphs and the ther-mal maturity of the host sediments. Palynomorph properties studiedhave included reflectance, transmissivity, fluorescence, and infraredand nuclear magnetic resonance spectral features (Marshall, 1991;Yule et al., 1998, 1999; Ujiié, 2001). All these parameters show correla-tions with palynomorph heating in both experimentally and naturallyheated samples, and have been applied to determining sediment tem-peratures in hydrocarbon generating environments. Among thesetechniques is that described by Goodhue and Clayton (2010), whodeveloped a Palynomorph Darkness Index (PDI) calculated from digitalcolor images of individual pollen grains. Thismethod has the advantagesof relative simplicity in that it requires only an optical microscope withdigital imaging capability and software capable of simple image analysis.
This study examined palynomorph heating, measured using PDI, inClarkia sediments heated by a thin basaltic sill. Unheated sedimentswere collected from a well-documented fossil locality and were exper-imentally heated in the laboratory to calibrate the temperature–PDI re-lationship for Clarkia pollen. This calibration curvewas used to estimatemaximum sediment temperatures in sediment profiles to 1 m awayfrom the basalt–sediment contact above and below the sill. The resultspresented here will be of use to researchers studying heat transportaround volcanic intrusive bodies.
2. Methods
2.1. Field sample collection and analysis
Samples of sediments adjacent to a basaltic sill were collected from asite exposed near Clarkia, Idaho (47° 1′ 36″N, 116° 14′ 59″W) (Fig. 1;Supplemental Map 1). The sill is Priest Rapids Basalt (Rosalia chemicaltype) of the Wanapum Formation of the Columbia River Basalt (Lewiset al., 2000), 15.07–15.25 Ma in age (Reidel et al., 2013). The sill is50 cm thick at this locality. When the sill was originally exposed byroad construction in the mid-1970s, it was traceable for 20–30 m as acontinuous, non-dipping, planar body of uniform thickness and parallelto bedding planes. It extends towards a basaltic intrusive body that maybe either a dike or an intrusive flow (this cannot be determined fromexisting exposures), but the sill at the dike locality was below groundlevel, so no contact between the two was observable.
The site was excavated with a shovel to expose a vertical profilethrough the laminated sediments above and below the sill. The sill–sediment contact is well-defined and approximately planar and hori-zontal at this site with no appearance of pillow-like textures or of phys-ical disturbance resulting from sill emplacement. The upper surface ofthe basalt is smooth and flat, and displays no textures that would indi-cate it to be a flow top rather than an intrusive contact. The basaltappears uniform in texture with no obvious chilled margin or gradientin crystallinity from exterior to interior. It exhibits columnar jointingwith vertically oriented columns (visible as individual basalt blocks in
Fig. 1). No signs of explosive magma–sediment interaction were ob-served. Hand samples of basalt from the sill interior were collected forchemical and petrographic analysis. Six thin sections of basalt wereprepared from the hand samples, and were examined optically. Thethin sections were element mapped, and matrix glasses were analyzed,using a JEOL 8500F electron microprobe at the Washington StateUniversity Geoanalytical Laboratory (Pullman, WA). Samples weresent for bulk chemical analysis by X-ray fluorescence spectroscopy ona Rigaku XRF Spectrometer at the Washington State UniversityGeoanalytical Laboratory.
Sediments immediately adjacent to the contact are darkened in ap-pearance but do not show evidence of fusion. The sediments are clayeyto silty,micaceous, and rich in organicmatter includingplant fossils. Thesediments were poorly consolidated, finely laminated, and fissile.Sediment samples were collected from both above and below the sill,providing two independent thermal profiles. Samples from below thesill were collected at 1 cm intervals from the sill contact to 10 cmaway in the perpendicular direction from the sediment–sill contact,then at broader intervals to 1m from the sediment–sill contact. Samplesabove the sill were collected at 3–4 cm intervals to 68 cm above the sill.A number of sandy and charcoal-rich layers in the sediment above the
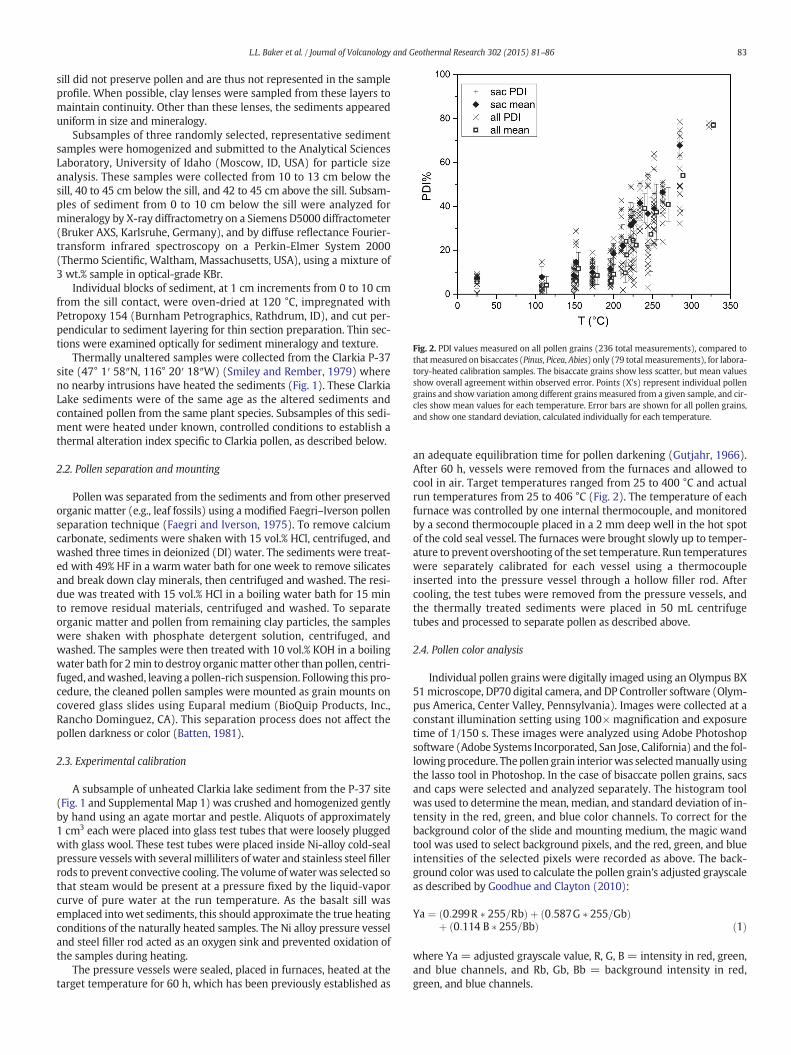
Fig. 2. PDI values measured on all pollen grains (236 total measurements), compared tothatmeasured on bisaccates (Pinus, Picea, Abies) only (79 total measurements), for labora-tory-heated calibration samples. The bisaccate grains show less scatter, but mean valuesshow overall agreement within observed error. Points (X's) represent individual pollengrains and show variation among different grainsmeasured from a given sample, and cir-cles show mean values for each temperature. Error bars are shown for all pollen grains,and show one standard deviation, calculated individually for each temperature.
83L.L. Baker et al. / Journal of Volcanology and Geothermal Research 302 (2015) 81–86
sill did not preserve pollen and are thus not represented in the sampleprofile. When possible, clay lenses were sampled from these layers tomaintain continuity. Other than these lenses, the sediments appeareduniform in size and mineralogy.
Subsamples of three randomly selected, representative sedimentsamples were homogenized and submitted to the Analytical SciencesLaboratory, University of Idaho (Moscow, ID, USA) for particle sizeanalysis. These samples were collected from 10 to 13 cm below thesill, 40 to 45 cm below the sill, and 42 to 45 cm above the sill. Subsam-ples of sediment from 0 to 10 cm below the sill were analyzed formineralogy by X-ray diffractometry on a Siemens D5000 diffractometer(Bruker AXS, Karlsruhe, Germany), and by diffuse reflectance Fourier-transform infrared spectroscopy on a Perkin-Elmer System 2000(Thermo Scientific, Waltham, Massachusetts, USA), using a mixture of3 wt.% sample in optical-grade KBr.
Individual blocks of sediment, at 1 cm increments from 0 to 10 cmfrom the sill contact, were oven-dried at 120 °C, impregnated withPetropoxy 154 (Burnham Petrographics, Rathdrum, ID), and cut per-pendicular to sediment layering for thin section preparation. Thin sec-tions were examined optically for sediment mineralogy and texture.
Thermally unaltered samples were collected from the Clarkia P-37site (47° 1′ 58″N, 116° 20′ 18″W) (Smiley and Rember, 1979) whereno nearby intrusions have heated the sediments (Fig. 1). These ClarkiaLake sediments were of the same age as the altered sediments andcontained pollen from the same plant species. Subsamples of this sedi-ment were heated under known, controlled conditions to establish athermal alteration index specific to Clarkia pollen, as described below.
2.2. Pollen separation and mounting
Pollen was separated from the sediments and from other preservedorganic matter (e.g., leaf fossils) using a modified Faegri–Iverson pollenseparation technique (Faegri and Iverson, 1975). To remove calciumcarbonate, sediments were shaken with 15 vol.% HCl, centrifuged, andwashed three times in deionized (DI) water. The sediments were treat-ed with 49% HF in a warm water bath for one week to remove silicatesand break down clay minerals, then centrifuged and washed. The resi-due was treated with 15 vol.% HCl in a boiling water bath for 15 minto remove residual materials, centrifuged and washed. To separateorganic matter and pollen from remaining clay particles, the sampleswere shaken with phosphate detergent solution, centrifuged, andwashed. The samples were then treated with 10 vol.% KOH in a boilingwater bath for 2min to destroy organicmatter other than pollen, centri-fuged, andwashed, leaving a pollen-rich suspension. Following this pro-cedure, the cleaned pollen samples were mounted as grain mounts oncovered glass slides using Euparal medium (BioQuip Products, Inc.,Rancho Dominguez, CA). This separation process does not affect thepollen darkness or color (Batten, 1981).
2.3. Experimental calibration
A subsample of unheated Clarkia lake sediment from the P-37 site(Fig. 1 and Supplemental Map 1) was crushed and homogenized gentlyby hand using an agate mortar and pestle. Aliquots of approximately1 cm3 each were placed into glass test tubes that were loosely pluggedwith glass wool. These test tubes were placed inside Ni-alloy cold-sealpressure vessels with severalmilliliters of water and stainless steel fillerrods to prevent convective cooling. The volume ofwaterwas selected sothat steam would be present at a pressure fixed by the liquid-vaporcurve of pure water at the run temperature. As the basalt sill wasemplaced into wet sediments, this should approximate the true heatingconditions of the naturally heated samples. The Ni alloy pressure vesseland steel filler rod acted as an oxygen sink and prevented oxidation ofthe samples during heating.
The pressure vessels were sealed, placed in furnaces, heated at thetarget temperature for 60 h, which has been previously established as
an adequate equilibration time for pollen darkening (Gutjahr, 1966).After 60 h, vessels were removed from the furnaces and allowed tocool in air. Target temperatures ranged from 25 to 400 °C and actualrun temperatures from 25 to 406 °C (Fig. 2). The temperature of eachfurnace was controlled by one internal thermocouple, and monitoredby a second thermocouple placed in a 2 mm deep well in the hot spotof the cold seal vessel. The furnaces were brought slowly up to temper-ature to prevent overshooting of the set temperature. Run temperatureswere separately calibrated for each vessel using a thermocoupleinserted into the pressure vessel through a hollow filler rod. Aftercooling, the test tubes were removed from the pressure vessels, andthe thermally treated sediments were placed in 50 mL centrifugetubes and processed to separate pollen as described above.
2.4. Pollen color analysis
Individual pollen grains were digitally imaged using an Olympus BX51microscope, DP70 digital camera, and DP Controller software (Olym-pus America, Center Valley, Pennsylvania). Images were collected at aconstant illumination setting using 100× magnification and exposuretime of 1/150 s. These images were analyzed using Adobe Photoshopsoftware (Adobe Systems Incorporated, San Jose, California) and the fol-lowingprocedure. Thepollen grain interiorwas selectedmanually usingthe lasso tool in Photoshop. In the case of bisaccate pollen grains, sacsand caps were selected and analyzed separately. The histogram toolwas used to determine the mean, median, and standard deviation of in-tensity in the red, green, and blue color channels. To correct for thebackground color of the slide and mounting medium, the magic wandtool was used to select background pixels, and the red, green, and blueintensities of the selected pixels were recorded as above. The back-ground color was used to calculate the pollen grain's adjusted grayscaleas described by Goodhue and Clayton (2010):
Ya ¼ 0:299R � 255=Rbð Þ þ 0:587G � 255=Gbð Þþ 0:114 B � 255=Bbð Þ ð1Þ
where Ya = adjusted grayscale value, R, G, B = intensity in red, green,and blue channels, and Rb, Gb, Bb = background intensity in red,green, and blue channels.
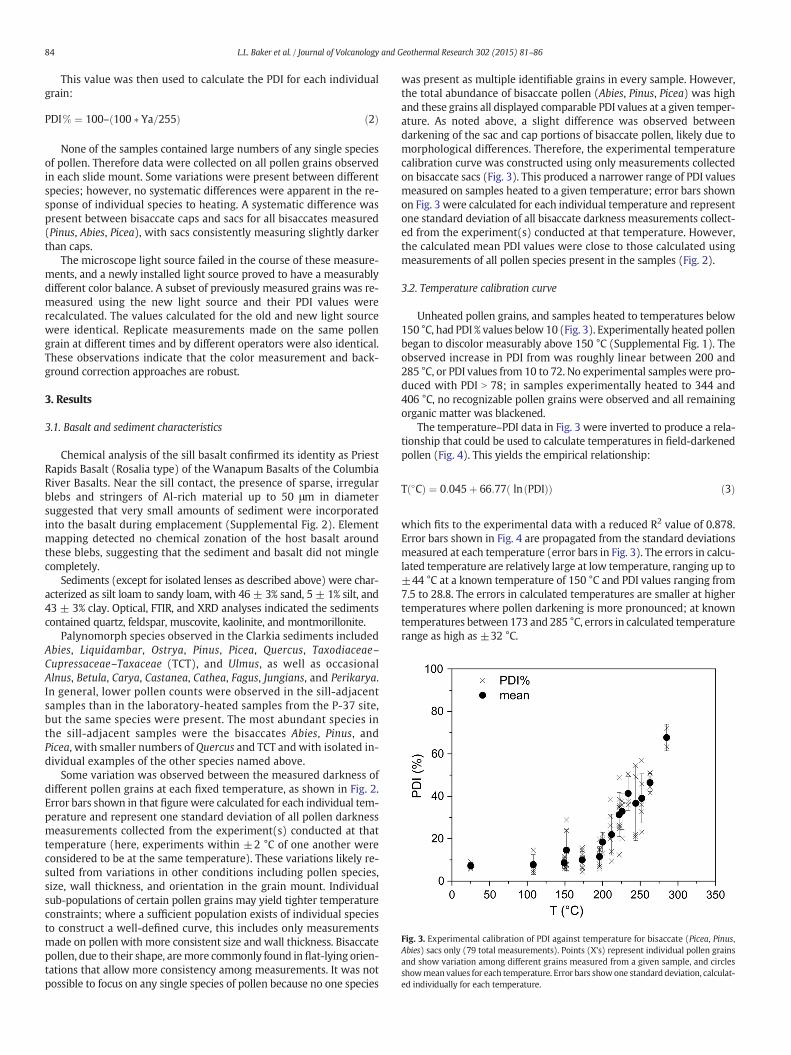
Fig. 3. Experimental calibration of PDI against temperature for bisaccate (Picea, Pinus,Abies) sacs only (79 total measurements). Points (X's) represent individual pollen grainsand show variation among different grains measured from a given sample, and circlesshowmean values for each temperature. Error bars showone standard deviation, calculat-ed individually for each temperature.
84 L.L. Baker et al. / Journal of Volcanology and Geothermal Research 302 (2015) 81–86
This value was then used to calculate the PDI for each individualgrain:
PDI% ¼ 100– 100 � Ya=255ð Þ ð2Þ
None of the samples contained large numbers of any single speciesof pollen. Therefore data were collected on all pollen grains observedin each slide mount. Some variations were present between differentspecies; however, no systematic differences were apparent in the re-sponse of individual species to heating. A systematic difference waspresent between bisaccate caps and sacs for all bisaccates measured(Pinus, Abies, Picea), with sacs consistently measuring slightly darkerthan caps.
The microscope light source failed in the course of these measure-ments, and a newly installed light source proved to have a measurablydifferent color balance. A subset of previously measured grains was re-measured using the new light source and their PDI values wererecalculated. The values calculated for the old and new light sourcewere identical. Replicate measurements made on the same pollengrain at different times and by different operators were also identical.These observations indicate that the color measurement and back-ground correction approaches are robust.
3. Results
3.1. Basalt and sediment characteristics
Chemical analysis of the sill basalt confirmed its identity as PriestRapids Basalt (Rosalia type) of the Wanapum Basalts of the ColumbiaRiver Basalts. Near the sill contact, the presence of sparse, irregularblebs and stringers of Al-rich material up to 50 μm in diametersuggested that very small amounts of sediment were incorporatedinto the basalt during emplacement (Supplemental Fig. 2). Elementmapping detected no chemical zonation of the host basalt aroundthese blebs, suggesting that the sediment and basalt did not minglecompletely.
Sediments (except for isolated lenses as described above) were char-acterized as silt loam to sandy loam, with 46 ± 3% sand, 5 ± 1% silt, and43 ± 3% clay. Optical, FTIR, and XRD analyses indicated the sedimentscontained quartz, feldspar, muscovite, kaolinite, and montmorillonite.
Palynomorph species observed in the Clarkia sediments includedAbies, Liquidambar, Ostrya, Pinus, Picea, Quercus, Taxodiaceae–Cupressaceae–Taxaceae (TCT), and Ulmus, as well as occasionalAlnus, Betula, Carya, Castanea, Cathea, Fagus, Jungians, and Perikarya.In general, lower pollen counts were observed in the sill-adjacentsamples than in the laboratory-heated samples from the P-37 site,but the same species were present. The most abundant species inthe sill-adjacent samples were the bisaccates Abies, Pinus, andPicea, with smaller numbers of Quercus and TCT and with isolated in-dividual examples of the other species named above.
Some variation was observed between the measured darkness ofdifferent pollen grains at each fixed temperature, as shown in Fig. 2.Error bars shown in that figure were calculated for each individual tem-perature and represent one standard deviation of all pollen darknessmeasurements collected from the experiment(s) conducted at thattemperature (here, experiments within ±2 °C of one another wereconsidered to be at the same temperature). These variations likely re-sulted from variations in other conditions including pollen species,size, wall thickness, and orientation in the grain mount. Individualsub-populations of certain pollen grains may yield tighter temperatureconstraints; where a sufficient population exists of individual speciesto construct a well-defined curve, this includes only measurementsmade on pollen with more consistent size and wall thickness. Bisaccatepollen, due to their shape, aremore commonly found in flat-lying orien-tations that allow more consistency among measurements. It was notpossible to focus on any single species of pollen because no one species
was present as multiple identifiable grains in every sample. However,the total abundance of bisaccate pollen (Abies, Pinus, Picea) was highand these grains all displayed comparable PDI values at a given temper-ature. As noted above, a slight difference was observed betweendarkening of the sac and cap portions of bisaccate pollen, likely due tomorphological differences. Therefore, the experimental temperaturecalibration curve was constructed using only measurements collectedon bisaccate sacs (Fig. 3). This produced a narrower range of PDI valuesmeasured on samples heated to a given temperature; error bars shownon Fig. 3 were calculated for each individual temperature and representone standard deviation of all bisaccate darkness measurements collect-ed from the experiment(s) conducted at that temperature. However,the calculated mean PDI values were close to those calculated usingmeasurements of all pollen species present in the samples (Fig. 2).
3.2. Temperature calibration curve
Unheated pollen grains, and samples heated to temperatures below150 °C, had PDI % values below 10 (Fig. 3). Experimentally heated pollenbegan to discolor measurably above 150 °C (Supplemental Fig. 1). Theobserved increase in PDI from was roughly linear between 200 and285 °C, or PDI values from 10 to 72. No experimental sampleswere pro-duced with PDI N 78; in samples experimentally heated to 344 and406 °C, no recognizable pollen grains were observed and all remainingorganic matter was blackened.
The temperature–PDI data in Fig. 3 were inverted to produce a rela-tionship that could be used to calculate temperatures in field-darkenedpollen (Fig. 4). This yields the empirical relationship:
T �Cð Þ ¼ 0:045þ 66:77 ln PDIð Þð Þ ð3Þ
which fits to the experimental data with a reduced R2 value of 0.878.Error bars shown in Fig. 4 are propagated from the standard deviationsmeasured at each temperature (error bars in Fig. 3). The errors in calcu-lated temperature are relatively large at low temperature, ranging up to±44 °C at a known temperature of 150 °C and PDI values ranging from7.5 to 28.8. The errors in calculated temperatures are smaller at highertemperatures where pollen darkening is more pronounced; at knowntemperatures between 173 and 285 °C, errors in calculated temperaturerange as high as ±32 °C.
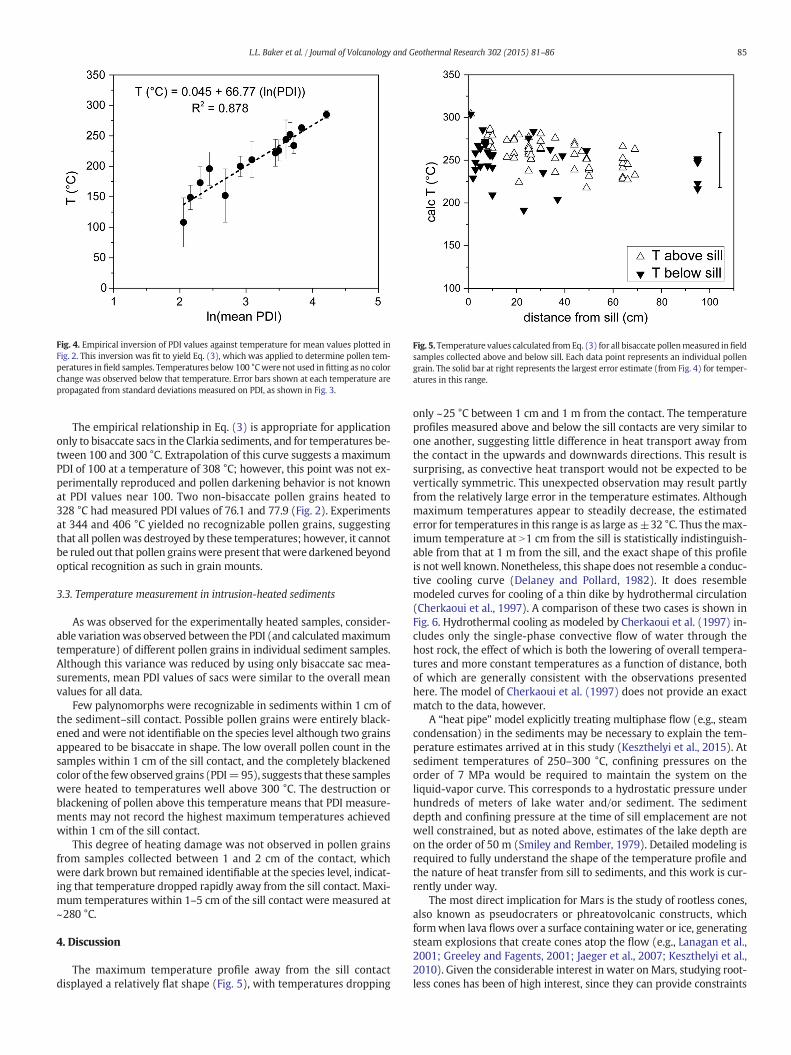
Fig. 4. Empirical inversion of PDI values against temperature for mean values plotted inFig. 2. This inversion was fit to yield Eq. (3), which was applied to determine pollen tem-peratures in field samples. Temperatures below 100 °Cwere not used in fitting as no colorchange was observed below that temperature. Error bars shown at each temperature arepropagated from standard deviations measured on PDI, as shown in Fig. 3.
Fig. 5.Temperature values calculated fromEq. (3) for all bisaccate pollenmeasured infieldsamples collected above and below sill. Each data point represents an individual pollengrain. The solid bar at right represents the largest error estimate (from Fig. 4) for temper-atures in this range.
85L.L. Baker et al. / Journal of Volcanology and Geothermal Research 302 (2015) 81–86
The empirical relationship in Eq. (3) is appropriate for applicationonly to bisaccate sacs in the Clarkia sediments, and for temperatures be-tween 100 and 300 °C. Extrapolation of this curve suggests a maximumPDI of 100 at a temperature of 308 °C; however, this point was not ex-perimentally reproduced and pollen darkening behavior is not knownat PDI values near 100. Two non-bisaccate pollen grains heated to328 °C had measured PDI values of 76.1 and 77.9 (Fig. 2). Experimentsat 344 and 406 °C yielded no recognizable pollen grains, suggestingthat all pollenwas destroyed by these temperatures; however, it cannotbe ruled out that pollen grainswere present thatwere darkened beyondoptical recognition as such in grain mounts.
3.3. Temperature measurement in intrusion-heated sediments
As was observed for the experimentally heated samples, consider-able variationwas observed between the PDI (and calculatedmaximumtemperature) of different pollen grains in individual sediment samples.Although this variance was reduced by using only bisaccate sac mea-surements, mean PDI values of sacs were similar to the overall meanvalues for all data.
Few palynomorphs were recognizable in sediments within 1 cm ofthe sediment–sill contact. Possible pollen grains were entirely black-ened and were not identifiable on the species level although two grainsappeared to be bisaccate in shape. The low overall pollen count in thesamples within 1 cm of the sill contact, and the completely blackenedcolor of the fewobserved grains (PDI=95), suggests that these sampleswere heated to temperatures well above 300 °C. The destruction orblackening of pollen above this temperature means that PDI measure-ments may not record the highest maximum temperatures achievedwithin 1 cm of the sill contact.
This degree of heating damage was not observed in pollen grainsfrom samples collected between 1 and 2 cm of the contact, whichwere dark brown but remained identifiable at the species level, indicat-ing that temperature dropped rapidly away from the sill contact. Maxi-mum temperatures within 1–5 cm of the sill contact were measured at~280 °C.
4. Discussion
The maximum temperature profile away from the sill contactdisplayed a relatively flat shape (Fig. 5), with temperatures dropping
only ~25 °C between 1 cm and 1 m from the contact. The temperatureprofiles measured above and below the sill contacts are very similar toone another, suggesting little difference in heat transport away fromthe contact in the upwards and downwards directions. This result issurprising, as convective heat transport would not be expected to bevertically symmetric. This unexpected observation may result partlyfrom the relatively large error in the temperature estimates. Althoughmaximum temperatures appear to steadily decrease, the estimatederror for temperatures in this range is as large as±32 °C. Thus themax-imum temperature at N1 cm from the sill is statistically indistinguish-able from that at 1 m from the sill, and the exact shape of this profileis not well known. Nonetheless, this shape does not resemble a conduc-tive cooling curve (Delaney and Pollard, 1982). It does resemblemodeled curves for cooling of a thin dike by hydrothermal circulation(Cherkaoui et al., 1997). A comparison of these two cases is shown inFig. 6. Hydrothermal cooling as modeled by Cherkaoui et al. (1997) in-cludes only the single-phase convective flow of water through thehost rock, the effect of which is both the lowering of overall tempera-tures and more constant temperatures as a function of distance, bothof which are generally consistent with the observations presentedhere. The model of Cherkaoui et al. (1997) does not provide an exactmatch to the data, however.
A “heat pipe” model explicitly treating multiphase flow (e.g., steamcondensation) in the sediments may be necessary to explain the tem-perature estimates arrived at in this study (Keszthelyi et al., 2015). Atsediment temperatures of 250–300 °C, confining pressures on theorder of 7 MPa would be required to maintain the system on theliquid-vapor curve. This corresponds to a hydrostatic pressure underhundreds of meters of lake water and/or sediment. The sedimentdepth and confining pressure at the time of sill emplacement are notwell constrained, but as noted above, estimates of the lake depth areon the order of 50 m (Smiley and Rember, 1979). Detailed modeling isrequired to fully understand the shape of the temperature profile andthe nature of heat transfer from sill to sediments, and this work is cur-rently under way.
The most direct implication for Mars is the study of rootless cones,also known as pseudocraters or phreatovolcanic constructs, whichformwhen lava flows over a surface containingwater or ice, generatingsteam explosions that create cones atop the flow (e.g., Lanagan et al.,2001; Greeley and Fagents, 2001; Jaeger et al., 2007; Keszthelyi et al.,2010). Given the considerable interest in water on Mars, studying root-less cones has been of high interest, since they can provide constraints
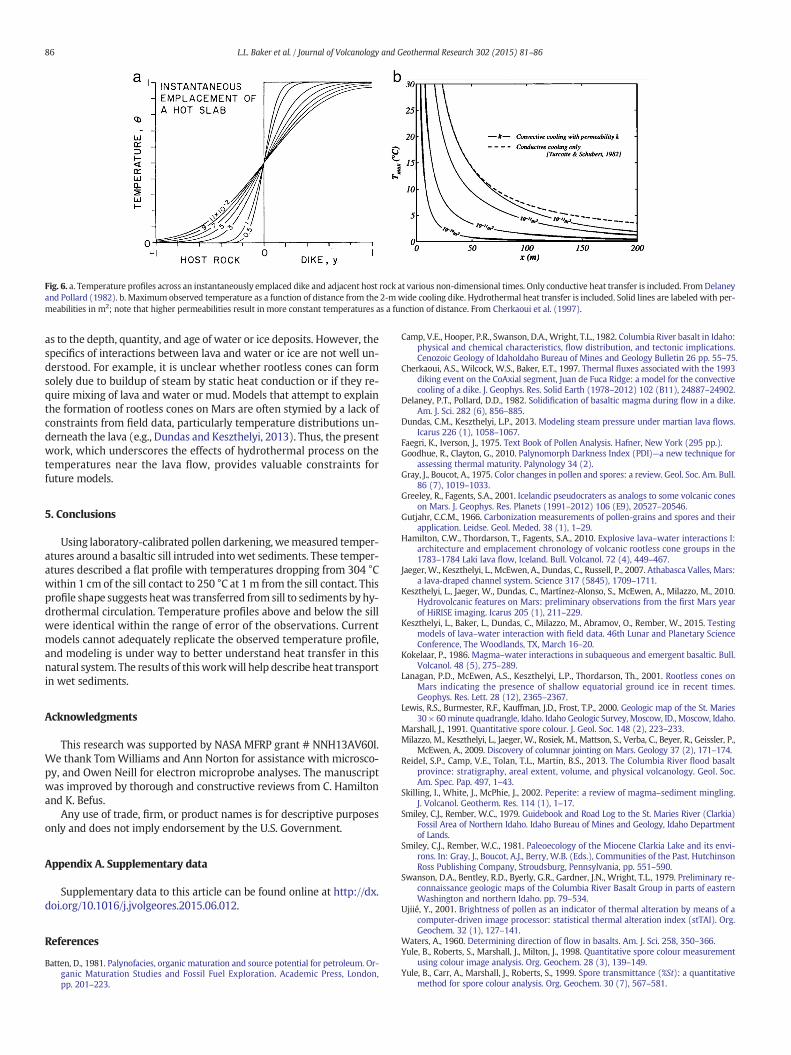
Fig. 6. a. Temperature profiles across an instantaneously emplaced dike and adjacent host rock at various non-dimensional times. Only conductive heat transfer is included. FromDelaneyand Pollard (1982). b. Maximum observed temperature as a function of distance from the 2-mwide cooling dike. Hydrothermal heat transfer is included. Solid lines are labeled with per-meabilities in m2; note that higher permeabilities result in more constant temperatures as a function of distance. From Cherkaoui et al. (1997).
86 L.L. Baker et al. / Journal of Volcanology and Geothermal Research 302 (2015) 81–86
as to the depth, quantity, and age of water or ice deposits. However, thespecifics of interactions between lava and water or ice are not well un-derstood. For example, it is unclear whether rootless cones can formsolely due to buildup of steam by static heat conduction or if they re-quire mixing of lava and water or mud. Models that attempt to explainthe formation of rootless cones on Mars are often stymied by a lack ofconstraints from field data, particularly temperature distributions un-derneath the lava (e.g., Dundas and Keszthelyi, 2013). Thus, the presentwork, which underscores the effects of hydrothermal process on thetemperatures near the lava flow, provides valuable constraints forfuture models.
5. Conclusions
Using laboratory-calibrated pollen darkening, wemeasured temper-atures around a basaltic sill intruded into wet sediments. These temper-atures described a flat profile with temperatures dropping from 304 °Cwithin 1 cm of the sill contact to 250 °C at 1m from the sill contact. Thisprofile shape suggests heatwas transferred from sill to sediments byhy-drothermal circulation. Temperature profiles above and below the sillwere identical within the range of error of the observations. Currentmodels cannot adequately replicate the observed temperature profile,and modeling is under way to better understand heat transfer in thisnatural system. The results of thisworkwill help describe heat transportin wet sediments.
Acknowledgments
This research was supported by NASA MFRP grant # NNH13AV60I.We thank TomWilliams and Ann Norton for assistance with microsco-py, and Owen Neill for electron microprobe analyses. The manuscriptwas improved by thorough and constructive reviews from C. Hamiltonand K. Befus.
Any use of trade, firm, or product names is for descriptive purposesonly and does not imply endorsement by the U.S. Government.
Appendix A. Supplementary data
Supplementary data to this article can be found online at http://dx.doi.org/10.1016/j.jvolgeores.2015.06.012.
References
Batten, D., 1981. Palynofacies, organic maturation and source potential for petroleum. Or-ganic Maturation Studies and Fossil Fuel Exploration. Academic Press, London,pp. 201–223.
Camp, V.E., Hooper, P.R., Swanson, D.A., Wright, T.L., 1982. Columbia River basalt in Idaho:physical and chemical characteristics, flow distribution, and tectonic implications.Cenozoic Geology of IdahoIdaho Bureau of Mines and Geology Bulletin 26 pp. 55–75.
Cherkaoui, A.S., Wilcock, W.S., Baker, E.T., 1997. Thermal fluxes associated with the 1993diking event on the CoAxial segment, Juan de Fuca Ridge: a model for the convectivecooling of a dike. J. Geophys. Res. Solid Earth (1978–2012) 102 (B11), 24887–24902.
Delaney, P.T., Pollard, D.D., 1982. Solidification of basaltic magma during flow in a dike.Am. J. Sci. 282 (6), 856–885.
Dundas, C.M., Keszthelyi, L.P., 2013. Modeling steam pressure under martian lava flows.Icarus 226 (1), 1058–1067.
Faegri, K., Iverson, J., 1975. Text Book of Pollen Analysis. Hafner, New York (295 pp.).Goodhue, R., Clayton, G., 2010. Palynomorph Darkness Index (PDI)—a new technique for
assessing thermal maturity. Palynology 34 (2).Gray, J., Boucot, A., 1975. Color changes in pollen and spores: a review. Geol. Soc. Am. Bull.
86 (7), 1019–1033.Greeley, R., Fagents, S.A., 2001. Icelandic pseudocraters as analogs to some volcanic cones
on Mars. J. Geophys. Res. Planets (1991–2012) 106 (E9), 20527–20546.Gutjahr, C.C.M., 1966. Carbonization measurements of pollen-grains and spores and their
application. Leidse. Geol. Meded. 38 (1), 1–29.Hamilton, C.W., Thordarson, T., Fagents, S.A., 2010. Explosive lava–water interactions I:
architecture and emplacement chronology of volcanic rootless cone groups in the1783–1784 Laki lava flow, Iceland. Bull. Volcanol. 72 (4), 449–467.
Jaeger, W., Keszthelyi, L., McEwen, A., Dundas, C., Russell, P., 2007. Athabasca Valles, Mars:a lava-draped channel system. Science 317 (5845), 1709–1711.
Keszthelyi, L., Jaeger, W., Dundas, C., Martínez-Alonso, S., McEwen, A., Milazzo, M., 2010.Hydrovolcanic features on Mars: preliminary observations from the first Mars yearof HiRISE imaging. Icarus 205 (1), 211–229.
Keszthelyi, L., Baker, L., Dundas, C., Milazzo, M., Abramov, O., Rember, W., 2015. Testingmodels of lava–water interaction with field data. 46th Lunar and Planetary ScienceConference, The Woodlands, TX, March 16–20.
Kokelaar, P., 1986. Magma–water interactions in subaqueous and emergent basaltic. Bull.Volcanol. 48 (5), 275–289.
Lanagan, P.D., McEwen, A.S., Keszthelyi, L.P., Thordarson, Th., 2001. Rootless cones onMars indicating the presence of shallow equatorial ground ice in recent times.Geophys. Res. Lett. 28 (12), 2365–2367.
Lewis, R.S., Burmester, R.F., Kauffman, J.D., Frost, T.P., 2000. Geologic map of the St. Maries30 × 60minute quadrangle, Idaho. Idaho Geologic Survey, Moscow, ID., Moscow, Idaho.
Marshall, J., 1991. Quantitative spore colour. J. Geol. Soc. 148 (2), 223–233.Milazzo, M., Keszthelyi, L., Jaeger, W., Rosiek, M., Mattson, S., Verba, C., Beyer, R., Geissler, P.,
McEwen, A., 2009. Discovery of columnar jointing on Mars. Geology 37 (2), 171–174.Reidel, S.P., Camp, V.E., Tolan, T.L., Martin, B.S., 2013. The Columbia River flood basalt
province: stratigraphy, areal extent, volume, and physical volcanology. Geol. Soc.Am. Spec. Pap. 497, 1–43.
Skilling, I., White, J., McPhie, J., 2002. Peperite: a review of magma–sediment mingling.J. Volcanol. Geotherm. Res. 114 (1), 1–17.
Smiley, C.J., Rember, W.C., 1979. Guidebook and Road Log to the St. Maries River (Clarkia)Fossil Area of Northern Idaho. Idaho Bureau of Mines and Geology, Idaho Departmentof Lands.
Smiley, C.J., Rember, W.C., 1981. Paleoecology of the Miocene Clarkia Lake and its envi-rons. In: Gray, J., Boucot, A.J., Berry, W.B. (Eds.), Communities of the Past. HutchinsonRoss Publishing Company, Stroudsburg, Pennsylvania, pp. 551–590.
Swanson, D.A., Bentley, R.D., Byerly, G.R., Gardner, J.N., Wright, T.L., 1979. Preliminary re-connaissance geologic maps of the Columbia River Basalt Group in parts of easternWashington and northern Idaho. pp. 79–534.
Ujiié, Y., 2001. Brightness of pollen as an indicator of thermal alteration by means of acomputer-driven image processor: statistical thermal alteration index (stTAI). Org.Geochem. 32 (1), 127–141.
Waters, A., 1960. Determining direction of flow in basalts. Am. J. Sci. 258, 350–366.Yule, B., Roberts, S., Marshall, J., Milton, J., 1998. Quantitative spore colour measurement
using colour image analysis. Org. Geochem. 28 (3), 139–149.Yule, B., Carr, A., Marshall, J., Roberts, S., 1999. Spore transmittance (%St): a quantitative
method for spore colour analysis. Org. Geochem. 30 (7), 567–581.