Embed Size (px)
Citation preview
Journal of Volcanology and Geothermal Research 198 (2010) 205–216
Contents lists available at ScienceDirect
Journal of Volcanology and Geothermal Research
j ourna l homepage: www.e lsev ie r.com/ locate / jvo lgeores
Effects of caldera collapse on magma decompression rate: An example from the1800 14C yr BP eruption of Ksudach Volcano, Kamchatka, Russia
Benjamin J. Andrews ⁎, James E. GardnerDepartment of Geological Sciences, Jackson School of Geosciences, 1 University Station C1100, The University of Texas at Austin, Austin, TX 78712-0254, United States
⁎ Corresponding author. Earth and Planetary ScienceUniversity of California, Berkeley, Berkeley, CA 94720-4
E-mail address: [email protected] (B.J. And
0377-0273/$ – see front matter © 2010 Elsevier B.V. Aldoi:10.1016/j.jvolgeores.2010.08.021
a b s t r a c t
a r t i c l e i n f oArticle history:Received 11 February 2010Accepted 20 August 2010Available online 21 September 2010
Keywords:calderamagma decompressionexperimental petrologyKamchatkaeruption conduit
Caldera collapse changes volcanic eruption behavior and mass flux. Many models of caldera formation predictthat those changes in eruption dynamics result from changes in conduit and vent structure during and aftercollapse. Unfortunately, no previous studies have quantified or described how conduits change in response tocaldera collapse. Changes in pumice texture coincident with caldera formation during the 1800 14C yr BP KS1eruption of Ksudach Volcano, Kamchatka, provide an opportunity to constrain magma decompression ratesbefore and after collapse and thus estimate changes in conduit geometry. Prior to caldera collapse, only whiterhyodacite pumice with few microlites and elongate vesicles were erupted. Following collapse, only grayrhyodacite pumice containing abundant microlites and round vesicles were erupted. Bulk compositions, phaseassemblages, phenocryst compositions, and geothermometry of the two pumice types are indistinguishable, thusthe two pumice types originated from the samemagma. Geothermobarometry and phase equilibria experimentsindicate that magma was stored at 100–125 MPa and 895±5 °C prior to eruption. Decompression experimentssuggestmicrolite textures observed in thewhite pumice require decompression rates of N0.01 MPa s−1, whereasthe textures of gray pumice require decompression at ~0.0025 MPa s−1. Balancing those decompression rateswith eruptivemass fluxes requires conduit size to have increased by a factor of ~4 during caldera collapse. Slowerascent through a broader conduit following collapse is also consistent with the change from highly stretchedvesicles present in white pumice and to round vesicles in gray pumice. Numerical modeling suggests that themassflux and lowdecompression rates during theGrayphase canbeaccommodatedby thepost-collapse conduitdeveloping a very broad base and narrow upper region.
Department, 307 McCone Hall,767, United States.rews).
l rights reserved.
© 2010 Elsevier B.V. All rights reserved.
1. Introduction
Calderas form during voluminous eruptions, when a volcanic edificecollapses into an emptying magma chamber. Observations of moderneruptions and interpretations of ancient deposits indicate that collapseis frequently accompanied by increased mass flux and a change fromdominantly buoyant, Plinian behavior to generation of dominantly non-buoyant pyroclastic flows (Sigurdsson and Carey, 1989; Scott et al.,1996; Andrews et al., 2007). Such observations have been incorporatedinto models of caldera formation that predict both increased mass fluxand pyroclastic flow generation after collapse (Bacon, 1983; Druitt andSparks, 1984; Hildreth and Mahood, 1986; Suzuki-Kamata et al., 1993;Wilson and Hildreth, 1997; Lipman, 2000). Those models, primarilydeveloped for eruptions of N30 km3 magma (dense rock equivalent,DRE) describe initial activity at a single vent, initiation of collapse after asmall (~10%) fraction of magma is erupted, and the opening of multipleor ring vents during and after collapse. The increased number and size ofthose vents, and the conduits that supply them, is believed to
accommodate the increased mass flux (e.g., Wilson and Hildreth,1997). Contrary to such general models, caldera collapse likely occursrelatively late in eruptions of more modest volume (b10 km3 magma,DRE), after ~3/4 of themagma ormore has been expelled (Gardner andTait, 2000; Roche and Druitt, 2001; Andrews et al., 2007). Interestingly,although pyroclastic flow generation may increase following calderacollapse in those smaller eruptions, mass flux does not necessarilyincrease (Gardner and Tait, 2000; Andrews et al., 2007).
Absent from most studies of caldera-forming eruptions are quanti-tative descriptions of changes in conduit geometry following collapse orthorough examinations of the effects of collapse on magma ascent rate.Becausemassflux is theproduct of conduit geometry andmagmaascentrate, understandingwhymass flux changes during an eruption requiresknowledge of at least one of those other parameters.Moreover, becausemagma ascent may be driven by buoyancy, overpressure in thechamber, or some combination of those forces, and is strongly affectedby conduit size (Druitt and Sparks, 1984; Jaupart, 2000; Mastin andGhiorso, 2000; Mastin, 2002), balancing mass flux, conduit geometry,and magma ascent rate can provide insight regarding changes insubsurface structure following caldera collapse.
Here, we quantify changes in decompression and ascent rate duringcaldera collapse and infer changes in conduit structure by comparing
II
IV
III
IVS
b
200
40
20
5
KSU12
02IPE18
02IPE45
53
51159
a
Longitude (oE)
50 km
5 km
156
Latit
ude
(o N)
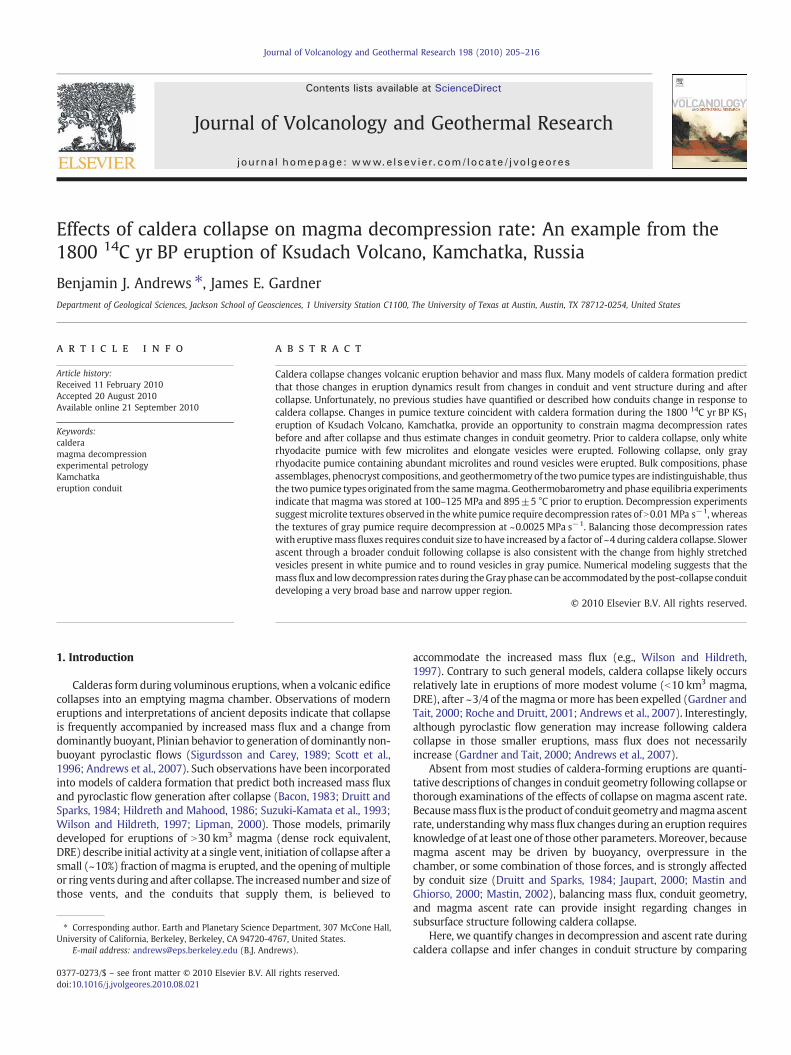
Fig. 1. Location of Ksudach volcano in southern Kamchatka. a) Cumulative deposits fromthe KS1 eruption are dispersed over much of Kamchatka along a NNE depositional axis(Andrews et al., 2007). b) The1800 14C KS1 eruption formedCaldera V, the youngest offivenested calderas (I–V) in the Ksudach massif; recent activity has been focused at Shtuybelcone, S (after Braitseva et al., 1996). Sample sites from Andrews et al. (2007) are shownwith black circles, locations of samples used in this study are indicated by black boxes(location KSU23 in a, and locations 02IPE18, 02IPE45, and KSU12 in b).
206 B.J. Andrews, J.E. Gardner / Journal of Volcanology and Geothermal Research 198 (2010) 205–216
textures of decompression experiments with measured changes ingroundmass textures within pumice erupted during the KS1 caldera-forming eruption of Ksudach volcano. That eruption, in ~1800 14C yr BP,occurred in four phases, and caldera collapsehappened after ~65%of thetotal volume erupted in this eruptive sequence was ejected. Mass fluxremained relatively constant or decreased slightly after collapse began(Andrews et al., 2007). Our work shows that a change in pumice colorfrom white to gray coincident with caldera collapse (Andrews et al.,2007) reflects changes in vesicle texture and increased microlitecontent, and those differences reflect a reduced decompression rate.Interestingly, the balance between mass flux, conduit size, anddecompression rate suggests that although the conduit base widenedsignificantly following collapse, upper regions of the conduit narrowed.
1.1. KS1 eruption background
The ~1800 14C yr BP KS1 eruption deposited ~8.5 km3 of composi-tionally uniform rhyodacite magma (DRE) along much of the length ofthe Kamchatka Peninsula (Fig. 1) (Braitseva et al., 1996; Andrews et al.,2007). A complete description of the eruption and its deposits can befound in Andrews et al. (2007). In summary, the eruption can besubdivided into four phases, Initial, Main, Lithic, and Gray, based onmass flux, lithic concentration, and pumice color. During the Initialphase, mass flux doubled from 5×10⁷ to 108 kg s−1 and 1–1.4 km3 ofmagma (DRE) was erupted. Mass flux during the Main phase increasedto 2–6×10⁸ kg s−1 and 4.5–5.5 km3 of magma (DRE) was deposited.Although the Lithic phase deposits are volumetrically small, ~0.2 km3
magma (DRE), mass flux remained relatively high during this phase, 1–4×10⁸ kg s−1. Gray phase mass flux did not change significantly fromthe previous two phases, remaining at 2–3×10⁸ kg s−1, and 2–2.5 km3
of magma (DRE) was erupted. All mass fluxes were calculated usingisopleth maps of maximum lithic size (Carey and Sparks, 1986).
Lithic eruption rates and the concentration of lithics in fall depositsvary substantially with the eruption phases. During the Initial phase,approximately 0.2 km3 of accidental lithics were erupted at rates of0.5–2×10⁷ kg s−1, resulting in fall deposits with up to ~20 wt.%lithics. The eruption rate of lithics during most of the Main phase was1–2×10⁷ kg s−1, as nearly 0.5 km3 of lithics were ejected to producefall deposits with generally b10 wt.% lithics. Lithic phase fall depositscontain N50 wt.% lithics, reflecting the eruption of ~0.3 km3 of lithicsat rates of 2–7×10⁷ kg s−1. Lithic eruption rates during the Grayphase decreased to 0.5–1×10⁷ kg s−1, as approximately 0.25 km3 oflithics were erupted, resulting in fall deposits with ~10 wt.% lithics.
Collapse of Ksudach Caldera V likely began during the Lithic phase(Andrews et al., 2007). The deposits represent eruption of a singlemagma and pumice color thus indicates the timing of eruptionrelative to caldera collapse: careful and thorough inspection showsthat no gray pumice were erupted before and no white pumice afterthe start of the Gray phase (Andrews et al., 2007). In addition, calderaformation caused an increase in the eruption of pyroclastic flows:during the Main phase, ~1/3 of the eruptive mass flux fed flows,whereas ~2/3 of the Gray phase mass flux supplied pyroclastic flows(Andrews et al., 2007).
2. Experimental and analytical methods
Samples of pumice were collected from near the southern calderarim and at locations ~11 kmNNE and ~50 km N of the caldera (Fig. 1).Bulk chemical analyses were collected for Initial phase pumice02IPE45 and Gray phase pumice 02IPE18. Thin sections were madeof those samples and additional thin sections were prepared fromInitial, Main, Lithic, and Gray phase pumice for glass, phenocryst, andtextural analysis. A portion of sample 02IPE45 was gently crushed to ab50 μm powder for use as starting material in phase equilibria anddecompression experiments.
Phase equilibria experiments were prepared by sealing powder in2-mm O.D. Ag70Pd30 tubing with sufficient deionized H2O to ensurethat all experiments were water saturated (Ptotal=PH2O). Thoseexperiments were conducted in externally heatedWaspalloy pressurevessels with nickel filler rods and pressurized with H2O at a range oftemperatures and pressures (Table 1). Oxygen fugacity during theexperiments is estimated at approximately one log unit (±0.5) abovethe Ni–NiO (NNO) buffer curve. All experiments were quenched byfirst cooling the pressure vessels with forced air, and then immersingthem in water. After each experimental run, the sample was mountedin epoxy on thin sections and polished for analysis. Stable phases wereidentified using a petrographic microscope and electron microprobe.
Twohigh-temperature phase equilibria experiments, K-10 andK-22B,were conducted in an externally heated TZM pressure vessel pressurizedwith argon and ~0.1 MPa methane to minimize hydrogen migration.Oxygen fugacity for that experimentwasfixed atNNOby loadingNimetaland NiO powders into a 4-mm Ag70Pd30 tube also loaded with a 2-mm
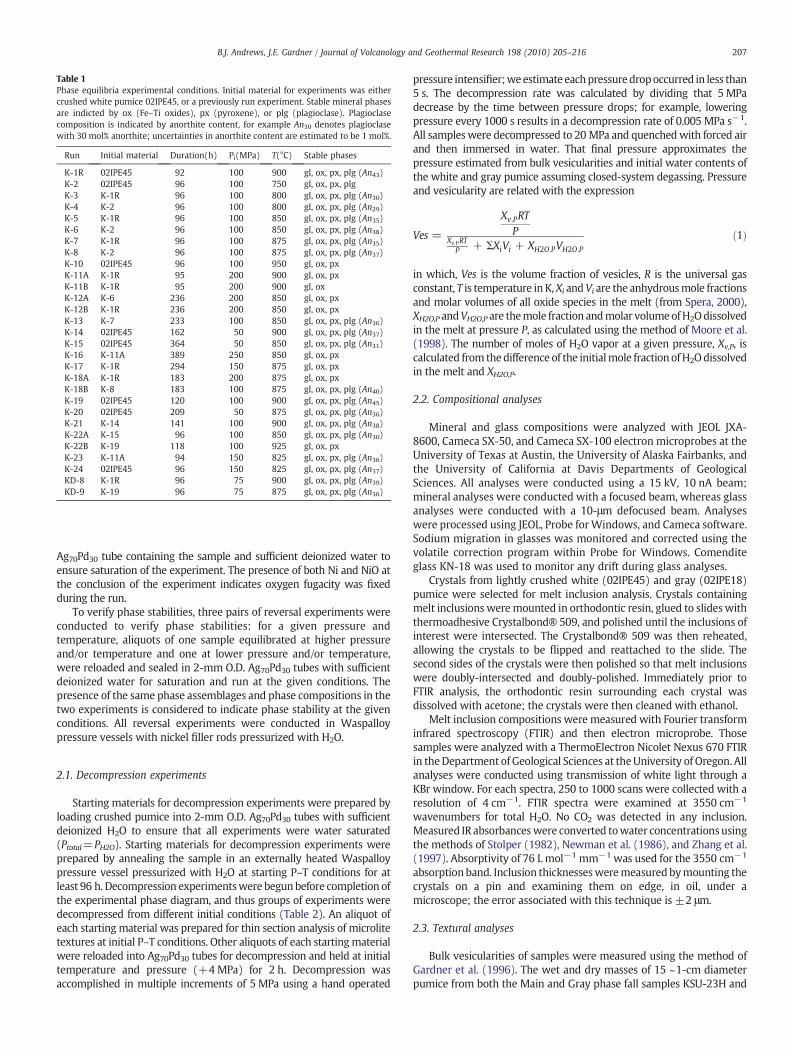
Table 1Phase equilibria experimental conditions. Initial material for experiments was eithercrushed white pumice 02IPE45, or a previously run experiment. Stable mineral phasesare indicted by ox (Fe–Ti oxides), px (pyroxene), or plg (plagioclase). Plagioclasecomposition is indicated by anorthite content, for example An30 denotes plagioclasewith 30 mol% anorthite; uncertainties in anorthite content are estimated to be 1 mol%.
Run Initial material Duration(h) Pi(MPa) T(°C) Stable phases
K-1R 02IPE45 92 100 900 gl, ox, px, plg (An43)K-2 02IPE45 96 100 750 gl, ox, px, plgK-3 K-1R 96 100 800 gl, ox, px, plg (An30)K-4 K-2 96 100 800 gl, ox, px, plg (An29)K-5 K-1R 96 100 850 gl, ox, px, plg (An35)K-6 K-2 96 100 850 gl, ox, px, plg (An38)K-7 K-1R 96 100 875 gl, ox, px, plg (An35)K-8 K-2 96 100 875 gl, ox, px, plg (An37)K-10 02IPE45 96 100 950 gl, ox, pxK-11A K-1R 95 200 900 gl, ox, pxK-11B K-1R 95 200 900 gl, oxK-12A K-6 236 200 850 gl, ox, pxK-12B K-1R 236 200 850 gl, ox, pxK-13 K-7 233 100 850 gl, ox, px, plg (An36)K-14 02IPE45 162 50 900 gl, ox, px, plg (An37)K-15 02IPE45 364 50 850 gl, ox, px, plg (An31)K-16 K-11A 389 250 850 gl, ox, pxK-17 K-1R 294 150 875 gl, ox, pxK-18A K-1R 183 200 875 gl, ox, pxK-18B K-8 183 100 875 gl, ox, px, plg (An40)K-19 02IPE45 120 100 900 gl, ox, px, plg (An45)K-20 02IPE45 209 50 875 gl, ox, px, plg (An36)K-21 K-14 141 100 900 gl, ox, px, plg (An38)K-22A K-15 96 100 850 gl, ox, px, plg (An30)K-22B K-19 118 100 925 gl, ox, pxK-23 K-11A 94 150 825 gl, ox, px, plg (An36)K-24 02IPE45 96 150 825 gl, ox, px, plg (An37)KD-8 K-1R 96 75 900 gl, ox, px, plg (An39)KD-9 K-19 96 75 875 gl, ox, px, plg (An36)
207B.J. Andrews, J.E. Gardner / Journal of Volcanology and Geothermal Research 198 (2010) 205–216
Ag70Pd30 tube containing the sample and sufficient deionized water toensure saturation of the experiment. The presence of both Ni and NiO atthe conclusion of the experiment indicates oxygen fugacity was fixedduring the run.
To verify phase stabilities, three pairs of reversal experiments wereconducted to verify phase stabilities: for a given pressure andtemperature, aliquots of one sample equilibrated at higher pressureand/or temperature and one at lower pressure and/or temperature,were reloaded and sealed in 2-mm O.D. Ag70Pd30 tubes with sufficientdeionized water for saturation and run at the given conditions. Thepresence of the same phase assemblages and phase compositions in thetwo experiments is considered to indicate phase stability at the givenconditions. All reversal experiments were conducted in Waspalloypressure vessels with nickel filler rods pressurized with H2O.
2.1. Decompression experiments
Starting materials for decompression experiments were prepared byloading crushed pumice into 2-mm O.D. Ag70Pd30 tubes with sufficientdeionized H2O to ensure that all experiments were water saturated(Ptotal=PH2O). Starting materials for decompression experiments wereprepared by annealing the sample in an externally heated Waspalloypressure vessel pressurized with H2O at starting P–T conditions for atleast 96 h. Decompression experimentswere begunbefore completion ofthe experimental phase diagram, and thus groups of experiments weredecompressed from different initial conditions (Table 2). An aliquot ofeach starting material was prepared for thin section analysis of microlitetextures at initial P–T conditions. Other aliquots of each startingmaterialwere reloaded into Ag70Pd30 tubes for decompression and held at initialtemperature and pressure (+4 MPa) for 2 h. Decompression wasaccomplished in multiple increments of 5 MPa using a hand operated
pressure intensifier;weestimate eachpressuredropoccurred in less than5 s. The decompression rate was calculated by dividing that 5 MPadecrease by the time between pressure drops; for example, loweringpressure every 1000 s results in a decompression rate of 0.005 MPa s−1.All sampleswere decompressed to 20 MPa and quenchedwith forced airand then immersed in water. That final pressure approximates thepressure estimated from bulk vesicularities and initial water contents ofthe white and gray pumice assuming closed-system degassing. Pressureand vesicularity are related with the expression
Ves =
Xv;PRTP
Xv;PRTP + ΣXiVi + XH2O;PVH2O;P
ð1Þ
in which, Ves is the volume fraction of vesicles, R is the universal gasconstant, T is temperature in K,Xi andVi are the anhydrousmole fractionsand molar volumes of all oxide species in the melt (from Spera, 2000),XH2O,P andVH2O,P are themole fraction andmolar volumeofH2Odissolvedin the melt at pressure P, as calculated using the method of Moore et al.(1998). The number of moles of H2O vapor at a given pressure, Xv,P, iscalculated from thedifference of the initialmole fraction ofH2Odissolvedin the melt and XH2O,P.
2.2. Compositional analyses
Mineral and glass compositions were analyzed with JEOL JXA-8600, Cameca SX-50, and Cameca SX-100 electron microprobes at theUniversity of Texas at Austin, the University of Alaska Fairbanks, andthe University of California at Davis Departments of GeologicalSciences. All analyses were conducted using a 15 kV, 10 nA beam;mineral analyses were conducted with a focused beam, whereas glassanalyses were conducted with a 10-μm defocused beam. Analyseswere processed using JEOL, Probe forWindows, and Cameca software.Sodium migration in glasses was monitored and corrected using thevolatile correction program within Probe for Windows. Comenditeglass KN-18 was used to monitor any drift during glass analyses.
Crystals from lightly crushed white (02IPE45) and gray (02IPE18)pumice were selected for melt inclusion analysis. Crystals containingmelt inclusions weremounted in orthodontic resin, glued to slideswiththermoadhesive Crystalbond® 509, and polished until the inclusions ofinterest were intersected. The Crystalbond® 509 was then reheated,allowing the crystals to be flipped and reattached to the slide. Thesecond sides of the crystals were then polished so that melt inclusionswere doubly-intersected and doubly-polished. Immediately prior toFTIR analysis, the orthodontic resin surrounding each crystal wasdissolved with acetone; the crystals were then cleaned with ethanol.
Melt inclusion compositions were measured with Fourier transforminfrared spectroscopy (FTIR) and then electron microprobe. Thosesamples were analyzed with a ThermoElectron Nicolet Nexus 670 FTIRin theDepartment of Geological Sciences at theUniversity of Oregon. Allanalyses were conducted using transmission of white light through aKBr window. For each spectra, 250 to 1000 scans were collected with aresolution of 4 cm−1. FTIR spectra were examined at 3550 cm−1
wavenumbers for total H2O. No CO2 was detected in any inclusion.Measured IR absorbanceswere converted towater concentrationsusingthe methods of Stolper (1982), Newman et al. (1986), and Zhang et al.(1997). Absorptivity of 76 L mol−1 mm−1 was used for the 3550 cm−1
absorption band. Inclusion thicknessesweremeasuredbymounting thecrystals on a pin and examining them on edge, in oil, under amicroscope; the error associated with this technique is ±2 μm.
2.3. Textural analyses
Bulk vesicularities of samples were measured using the method ofGardner et al. (1996). The wet and dry masses of 15 ~1-cm diameterpumice from both the Main and Gray phase fall samples KSU-23H and
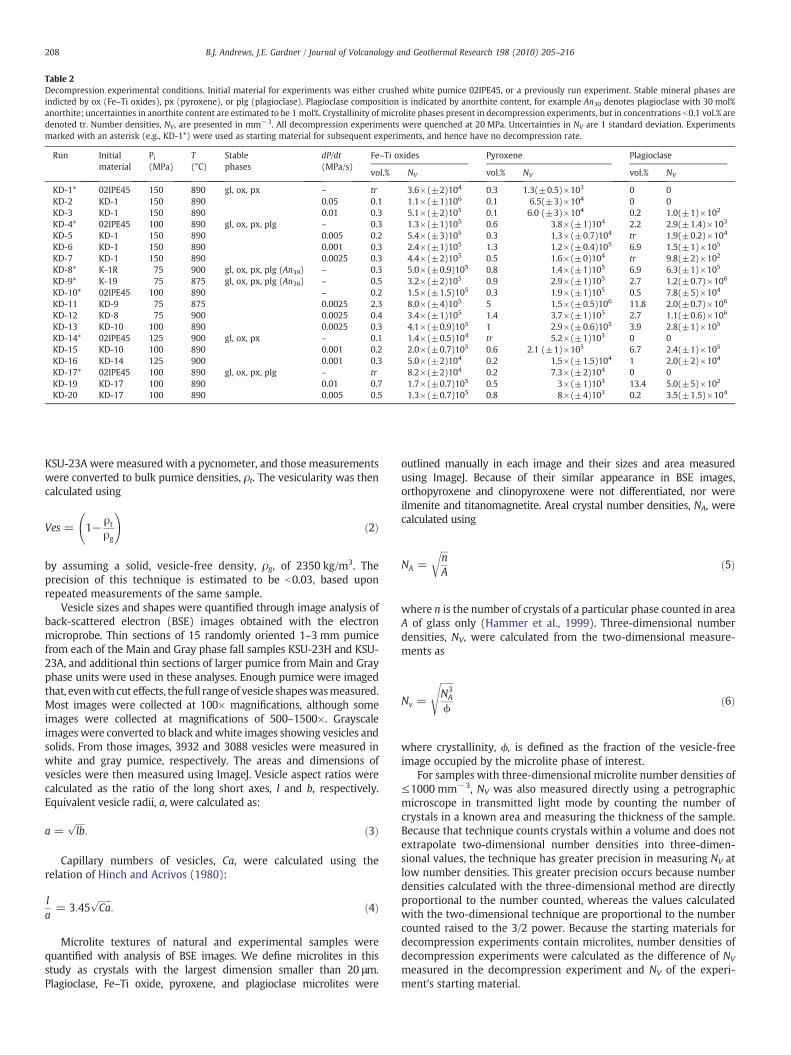
Table 2Decompression experimental conditions. Initial material for experiments was either crushed white pumice 02IPE45, or a previously run experiment. Stable mineral phases areindicted by ox (Fe–Ti oxides), px (pyroxene), or plg (plagioclase). Plagioclase composition is indicated by anorthite content, for example An30 denotes plagioclase with 30 mol%anorthite; uncertainties in anorthite content are estimated to be 1 mol%. Crystallinity of microlite phases present in decompression experiments, but in concentrations b0.1 vol.% aredenoted tr. Number densities, NV, are presented in mm−3. All decompression experiments were quenched at 20 MPa. Uncertainties in NV are 1 standard deviation. Experimentsmarked with an asterisk (e.g., KD-1*) were used as starting material for subsequent experiments, and hence have no decompression rate.
Run Initialmaterial
Pi(MPa)
T(°C)
Stablephases
dP/dt(MPa/s)
Fe–Ti oxides Pyroxene Plagioclase
vol.% NV vol.% NV vol.% NV
KD-1* 02IPE45 150 890 gl, ox, px – tr 3.6×(±2)104 0.3 1.3(±0.5)×103 0 0KD-2 KD-1 150 890 0.05 0.1 1.1×(±1)106 0.1 6.5(±3)×104 0 0KD-3 KD-1 150 890 0.01 0.3 5.1×(±2)105 0.1 6.0 (±3)×104 0.2 1.0(±1)×102
KD-4* 02IPE45 100 890 gl, ox, px, plg – 0.3 1.3×(±1)105 0.6 3.8×(±1)104 2.2 2.9(±1.4)×103
KD-5 KD-1 150 890 0.005 0.2 5.4×(±3)105 0.3 1.3×(±0.7)104 tr 1.9(±0.2)×104
KD-6 KD-1 150 890 0.001 0.3 2.4×(±1)105 1.3 1.2×(±0.4)105 6.9 1.5(±1)×105
KD-7 KD-1 150 890 0.0025 0.3 4.4×(±2)105 0.5 1.6×(±0)104 tr 9.8(±2)×102
KD-8* K-1R 75 900 gl, ox, px, plg (An39) – 0.3 5.0×(±0.9)105 0.8 1.4×(±1)105 6.9 6.3(±1)×105
KD-9* K-19 75 875 gl, ox, px, plg (An36) – 0.5 3.2×(±2)105 0.9 2.9×(±1)105 2.7 1.2(±0.7)×106
KD-10* 02IPE45 100 890 – 0.2 1.5×(±1.5)105 0.3 1.9×(±1)105 0.5 7.8(±5)×104
KD-11 KD-9 75 875 0.0025 2.3 8.0×(±4)105 5 1.5×(±0.5)106 11.8 2.0(±0.7)×106
KD-12 KD-8 75 900 0.0025 0.4 3.4×(±1)105 1.4 3.7×(±1)105 2.7 1.1(±0.6)×106
KD-13 KD-10 100 890 0.0025 0.3 4.1×(±0.9)105 1 2.9×(±0.6)105 3.9 2.8(±1)×105
KD-14* 02IPE45 125 900 gl, ox, px – 0.1 1.4×(±0.5)104 tr 5.2×(±1)103 0 0KD-15 KD-10 100 890 0.001 0.2 2.0×(±0.7)105 0.6 2.1 (±1)×105 6.7 2.4(±1)×105
KD-16 KD-14 125 900 0.001 0.3 5.0×(±2)104 0.2 1.5×(±1.5)104 1 2.0(±2)×104
KD-17* 02IPE45 100 890 gl, ox, px, plg – tr 8.2×(±2)104 0.2 7.3×(±2)104 0 0KD-19 KD-17 100 890 0.01 0.7 1.7×(±0.7)105 0.5 3×(±1)103 13.4 5.0(±5)×102
KD-20 KD-17 100 890 0.005 0.5 1.3×(±0.7)105 0.8 8×(±4)103 0.2 3.5(±1.5)×104
208 B.J. Andrews, J.E. Gardner / Journal of Volcanology and Geothermal Research 198 (2010) 205–216
KSU-23A were measured with a pycnometer, and those measurementswere converted to bulk pumice densities, ρt. The vesicularity was thencalculated using
Ves = 1− ρtρg
!ð2Þ
by assuming a solid, vesicle-free density, ρg, of 2350 kg/m3. Theprecision of this technique is estimated to be b0.03, based uponrepeated measurements of the same sample.
Vesicle sizes and shapes were quantified through image analysis ofback-scattered electron (BSE) images obtained with the electronmicroprobe. Thin sections of 15 randomly oriented 1–3 mm pumicefrom each of the Main and Gray phase fall samples KSU-23H and KSU-23A, and additional thin sections of larger pumice fromMain and Grayphase units were used in these analyses. Enough pumice were imagedthat, evenwith cut effects, the full rangeof vesicle shapeswasmeasured.Most images were collected at 100× magnifications, although someimages were collected at magnifications of 500–1500×. Grayscaleimages were converted to black andwhite images showing vesicles andsolids. From those images, 3932 and 3088 vesicles were measured inwhite and gray pumice, respectively. The areas and dimensions ofvesicles were then measured using ImageJ. Vesicle aspect ratios werecalculated as the ratio of the long short axes, l and b, respectively.Equivalent vesicle radii, a, were calculated as:
a =ffiffiffiffilb
p: ð3Þ
Capillary numbers of vesicles, Ca, were calculated using therelation of Hinch and Acrivos (1980):
la= 3:45
ffiffiffiffiffiffiCa
p: ð4Þ
Microlite textures of natural and experimental samples werequantified with analysis of BSE images. We define microlites in thisstudy as crystals with the largest dimension smaller than 20 μm.Plagioclase, Fe–Ti oxide, pyroxene, and plagioclase microlites were
outlined manually in each image and their sizes and area measuredusing ImageJ. Because of their similar appearance in BSE images,orthopyroxene and clinopyroxene were not differentiated, nor wereilmenite and titanomagnetite. Areal crystal number densities, NA, werecalculated using
NA =ffiffiffinA
rð5Þ
where n is the number of crystals of a particular phase counted in areaA of glass only (Hammer et al., 1999). Three-dimensional numberdensities, NV, were calculated from the two-dimensional measure-ments as
Nv =
ffiffiffiffiffiffiN3A
ϕ
sð6Þ
where crystallinity, ϕ, is defined as the fraction of the vesicle-freeimage occupied by the microlite phase of interest.
For samples with three-dimensional microlite number densities of≤1000 mm−3, NV was also measured directly using a petrographicmicroscope in transmitted light mode by counting the number ofcrystals in a known area and measuring the thickness of the sample.Because that technique counts crystals within a volume and does notextrapolate two-dimensional number densities into three-dimen-sional values, the technique has greater precision in measuring NV atlow number densities. This greater precision occurs because numberdensities calculated with the three-dimensional method are directlyproportional to the number counted, whereas the values calculatedwith the two-dimensional technique are proportional to the numbercounted raised to the 3/2 power. Because the starting materials fordecompression experiments contain microlites, number densities ofdecompression experiments were calculated as the difference of NV
measured in the decompression experiment and NV of the experi-ment's starting material.
209B.J. Andrews, J.E. Gardner / Journal of Volcanology and Geothermal Research 198 (2010) 205–216
3. Results
3.1. Natural compositions
The KS1 white and gray pumice are both rhyodacite, with 71.5–72.1 wt.% SiO2, have nearly identical alkali concentrations (5.2–5.3 wt.%Na2O and 1.4 wt.% K2O), and differ by less than 0.1 wt.% in Al2O3
concentrations (Table 3; Izbekov et al., 2003). Trace element concentra-tions are similarly indistinguishable with, for example, 178–180 ppm Srand 1.40–1.41 ppm Eu in both pumice. With few exceptions, the KS1white and gray pumice compositions differ by less than 5% (relative toeach other).
Both white and gray pumice contain the same phenocrystassemblage: plagioclase, clinopyroxene, orthopyroxene, titanomag-netite, and ilmenite, in order of decreasing abundance. Plagioclasecomposes ~3 vol.% of the rock (vesicle-free) and occurs as 300–600 μm tabular crystals. Those crystals are optically clear, concentri-cally zoned, frequently twinned, and often host glass inclusions.Larger plagioclase phenocrysts often comprise a rounded coresurrounded by a euhedral rim; although the zoning within suchcores is generally concentric, it is rarely euhedral. Most plagioclasezones are An40–An50 in composition, but can range from ~An35 to~An60. Rim compositions are An40–An42.
Clinopyroxene occurs generally as 200–400 μm prismatic pheno-crysts and composes ~1 vol.% of the vesicle-free rocks. Those crystalsare green and optically unzoned. Orthopyroxene is present in a similarabundance and occurs as 200–400 μm brown prisms. Occasional glassinclusions are hosted by pyroxene crystals, but less frequently than inplagioclase. Clinopyroxene is typically ~En38Fs21Wo40, and orthopyr-oxene is typically ~En56Fs41Wo28 (Table 3).
Titanomagnetite and ilmenite are the least abundant phenocrystphases and together compose b1 vol.%. Those two oxides occur asequant, euhedral crystals ~100 μm in size. Titanomagnetite andilmenite crystals that are in contact are occasionally found. Titano-magnetite compositions are typically ~35 mol% ulvospinel; ilmenitephenocrysts range in composition from 76 to 85 mol% ilmenite(Table 3; Izbekov et al., 2003).
Matrix glass compositions of the two pumice types are also verysimilar (Table 3). All matrix glass is rhyolitic, with SiO2 concentrationsof 72.5(±0.9)wt.% and Na2O concentrations of 5.4(±0.6)wt.%. Bothpumice contain 2.7(±0.3)wt.% FeO and 2.3(±0.2)wt.% CaO.
Glass inclusions hosted by phenocrysts fromwhite and gray pumiceare compositionally indistinguishable and rhyodacitic in composition
Table 3Representative whole rock, glass, and mineral compositions of KS1 white and gray pumiceanhydrous. Mineral analyses are presented for plagioclase (plg), clinopyroxene (cpx), orthopypercent oxides. Total iron is reported as FeO*. Uncertainties in matrix glass and melt incompositions were analyzed with XRF at Washington State University. Matrix glass, melt in
Sample SiO2 Al2O3 TiO2 FeO* MnO
WhiteWR 71.48 14.54 0.449 3.14 0.142MG 72.68 14.40 0.43 2.99 0.12MI 73.39 13.13 0.27 2.5 0.14plg 53.76 29.18 0.02 0.62 –
cpx 52.37 1.44 0.33 11.27 0.82opx 52.79 0.62 0.18 23.91 1.86ilm – 0.17 45.48 49.04 1.22mt – 1.99 12.84 81.77 0.98
GrayWR 72.14 14.45 0.448 2.94 0.137MG 73.54 13.38 0.38 2.88 0.15MI 72.6 13.87 0.42 2.47 0.13plg 54.94 28.37 0.04 0.55 –
cpx 52.71 1.05 0.24 12.69 1.11opx 52.79 0.62 0.18 23.91 1.86ilm – 0.32 41.76 52.33 0.85mt – 1.99 12.33 81.54 0.95
Uncertainty 0.26 0.17 0.05 0.15 0.04
(Table 3). Although SiO2 concentrations do not vary substantiallybetween inclusions, water concentrations range from ~1.5 to 8 wt.%.Most of that range is likely a result of post-entrapment hostcrystallization and leaking during decompression and eruption (Sup-plemental material). No CO2 was detected in the inclusions. Excludinginclusions with anomalously high and low water concentrations, themost reasonable pre-eruption water contents recorded by the inclu-sions are 4.4(±1.0) and 3.8(±0.9)wt.% H2O for the white and graypumice, respectively.
3.2. Natural vesicle and microlite textures
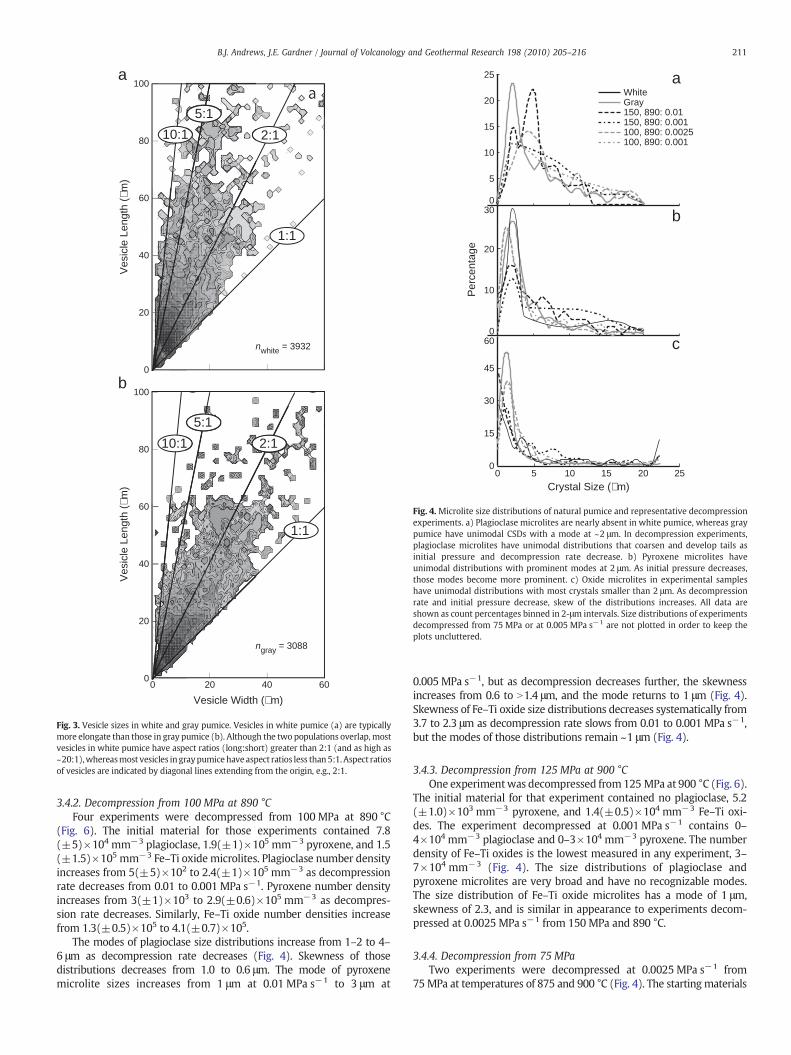
Both white and gray types of pumice have overlapping bulkvesicularities, 78.2±3.8 and 75.2±3.3 vol.%, respectively. Equivalentradii of vesicles in white and gray pumice are indistinguishable, 50(±15)μm for both. Interestingly, however, the two pumice types havedifferent vesicle shapes (Fig. 2). Vesicles in white pumice are moreelongate: aspect ratios are typically N2:1 and can be N10:1 in whitepumice, compared to vesicle aspect ratios b5:1 in gray pumice (Fig. 3).
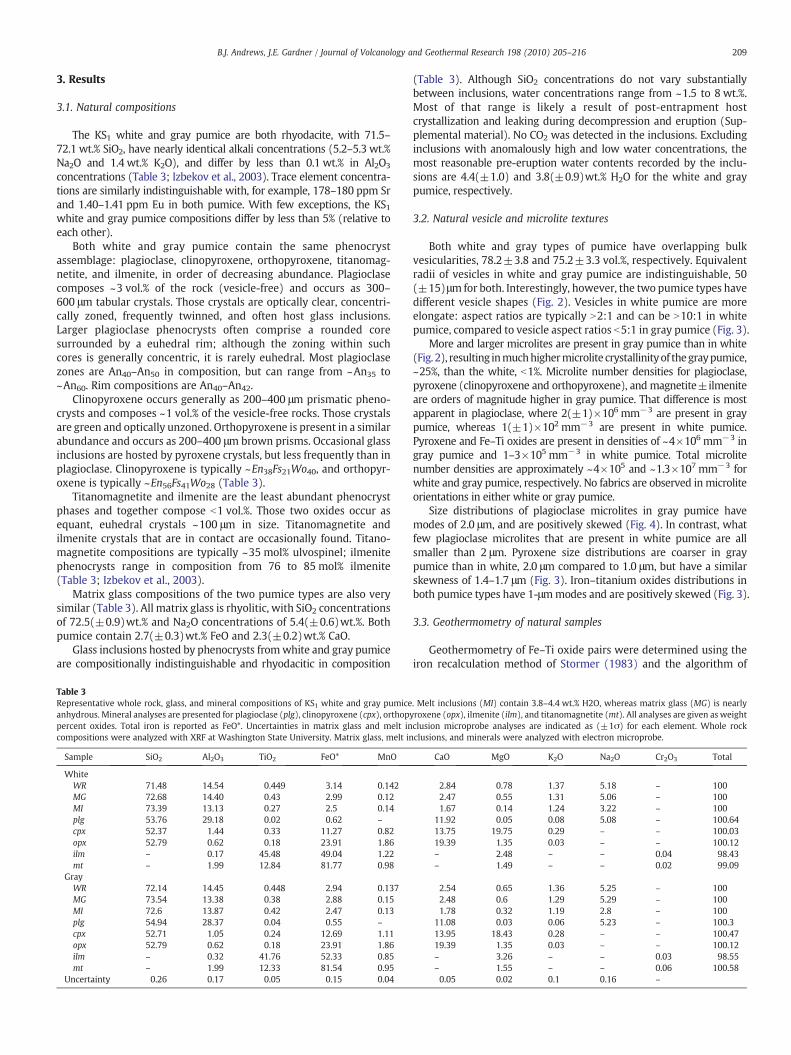
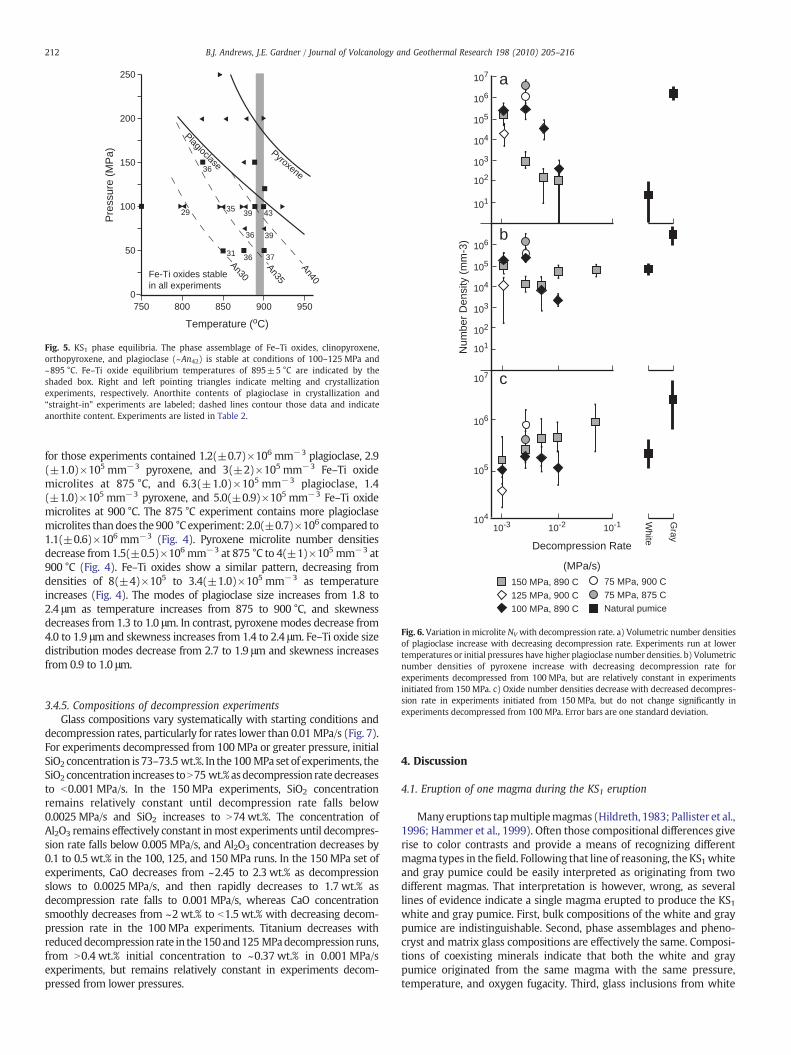
More and larger microlites are present in gray pumice than in white(Fig. 2), resulting inmuchhighermicrolite crystallinityof thegraypumice,~25%, than the white, b1%. Microlite number densities for plagioclase,pyroxene (clinopyroxene and orthopyroxene), and magnetite±ilmeniteare orders of magnitude higher in gray pumice. That difference is mostapparent in plagioclase, where 2(±1)×106 mm−3 are present in graypumice, whereas 1(±1)×102 mm−3 are present in white pumice.Pyroxene and Fe–Ti oxides are present in densities of ~4×106 mm−3 ingray pumice and 1–3×105 mm−3 in white pumice. Total microlitenumber densities are approximately ~4×10⁵ and ~1.3×107 mm−3 forwhite and gray pumice, respectively. No fabrics are observed in microliteorientations in either white or gray pumice.
Size distributions of plagioclase microlites in gray pumice havemodes of 2.0 μm, and are positively skewed (Fig. 4). In contrast, whatfew plagioclase microlites that are present in white pumice are allsmaller than 2 μm. Pyroxene size distributions are coarser in graypumice than in white, 2.0 μm compared to 1.0 μm, but have a similarskewness of 1.4–1.7 μm (Fig. 3). Iron–titanium oxides distributions inboth pumice types have 1-μmmodes and are positively skewed (Fig. 3).
3.3. Geothermometry of natural samples
Geothermometry of Fe–Ti oxide pairs were determined using theiron recalculation method of Stormer (1983) and the algorithm of
. Melt inclusions (MI) contain 3.8–4.4 wt.% H2O, whereas matrix glass (MG) is nearlyroxene (opx), ilmenite (ilm), and titanomagnetite (mt). All analyses are given as weightclusion microprobe analyses are indicated as (±1σ) for each element. Whole rockclusions, and minerals were analyzed with electron microprobe.
CaO MgO K2O Na2O Cr2O3 Total
2.84 0.78 1.37 5.18 – 1002.47 0.55 1.31 5.06 – 1001.67 0.14 1.24 3.22 – 100
11.92 0.05 0.08 5.08 – 100.6413.75 19.75 0.29 – – 100.0319.39 1.35 0.03 – – 100.12– 2.48 – – 0.04 98.43– 1.49 – – 0.02 99.09
2.54 0.65 1.36 5.25 – 1002.48 0.6 1.29 5.29 – 1001.78 0.32 1.19 2.8 – 100
11.08 0.03 0.06 5.23 – 100.313.95 18.43 0.28 – – 100.4719.39 1.35 0.03 – – 100.12– 3.26 – – 0.03 98.55– 1.55 – – 0.06 100.580.05 0.02 0.1 0.16 –
a b
plag
ox
px
KD2
ox
px
c d px
ox
plag
KD6
Pi = 150 MPa
px
dP/dt = 0.001 MPa/sdP/dt = 0.05 MPa/sPi = 150 MPa
Fig. 2. Representative textures of KS1 pumice and decompression experiments. a) White pumice (a) are composed of microlite-free glass. Vesicles in white pumice are commonlyelongate and have aspect ratios N10:1. In contrast, gray pumice (b) contain abundant oxide (ox), pyroxene (px), and plagioclase (plag) microlites. Vesicles in gray pumice aregenerally round with aspect ratios b3:1. In experiments KD-2 (c) and KD-6 (d), decompressed from initial pressures Pi=150 MPa, microlite number density and size increase asdecompression rate slows from 0.05 to 0.001 MPa s−1, such that although no plagioclase microlites are present in KD-2, abundant swallow-tail and skeletal plagioclase microlites arepresent in KD-6. The white scale bars in all images are 10 μm.
210 B.J. Andrews, J.E. Gardner / Journal of Volcanology and Geothermal Research 198 (2010) 205–216
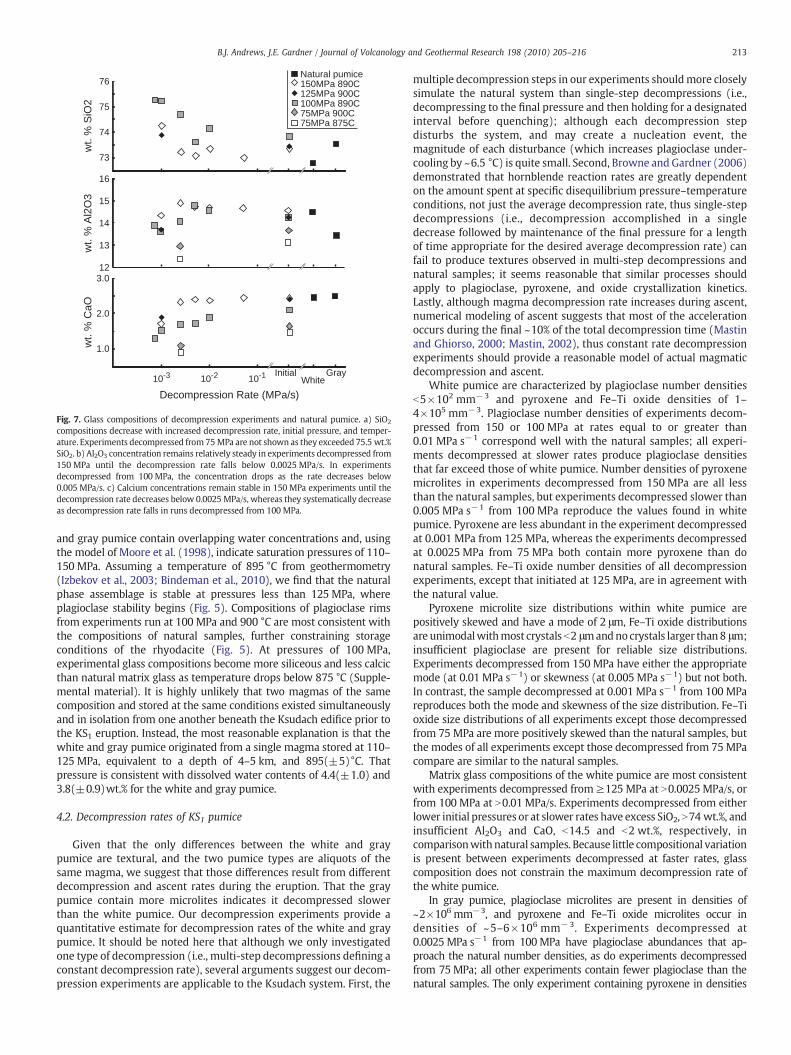
Anderson and Lindsley (1988). Temperature estimates were limitedto touching pairs of titanomagnetite and ilmenite phenocrysts; Mgand Mn contents of those pairs indicate that they are in equilibrium(Bacon and Hirschmann, 1988). In addition, application of theprogram QUILF to electron microprobe analyses of Fe–Ti oxides,clinopyroxene, and orthopyroxene indicates equilibrium between allFe–Ti–Mg phases (Anderson et al., 1993). Analyses of 12 oxide pairsfromwhite pumice and 8 pairs from gray pumice indicate overlappingtemperatures of 891±8 °C for the white and 897±6 °C for the graypumice (Bindeman et al., 2010). Consideration of white and grayoxide pairs together yields equilibrium temperatures of 895±5 °C.Those analyses also indicate oxygen fugacities of ~10−11.5 bars, orapproximately log(fO2)=NNO+1.
3.3.1. Experimental phase equilibriaAt all pressures and temperatures examined, silicate melt (glass)
and Fe–Ti oxides are stable (Fig. 5). We did not distinguish betweentitanomagnetite and ilmenite. As expected, both plagioclase andpyroxene are stable as water pressure and/or temperature decreases.For example, at 200 MPa, plagioclase and pyroxene are stable onlybelow 825 °C and 875 °C, respectively, whereas at 100 MPa they areboth stable above 900 °C.
Plagioclase varies systematically in composition with temperatureand pressure (Fig. 5). For example, at 100 MPa, anorthite content ofplagioclase increases from An30 to An43 as temperature increases from800 to 900 °C. Anorthite content increases by ~5 mol% An over apressure range of ~50 MPa: at 850 °C plagioclase of composition An30and An35 is stable at 50 and 100 MPa, respectively.
Glass compositions vary systematically with temperature (Supple-mental material). Iron and calcium concentrations increase withtemperature: at 100 MPa, FeO increases linearly from 1.5 wt.% to2.75 wt.% and CaO increases from 1.25 to 2.4 wt.% as temperatureincreases from 800 to 925 °C. Silica concentration decreases with
increasing temperature: in samples run at 100 MPa, silica concentrationdecreases from75 wt.% to 69 wt.% as temperature increases from 800 to925 °C. Variation of glass compositionswith pressure is less dramatic. Ingeneral, iron and calcium concentrations increase by ~0.5 wt.% aspressure increases from 100 to 200 MPa. Silica concentration decreasesby 1–2 wt.% as pressure increases from 100 to 200 MPa.
3.4. Decompression experiments
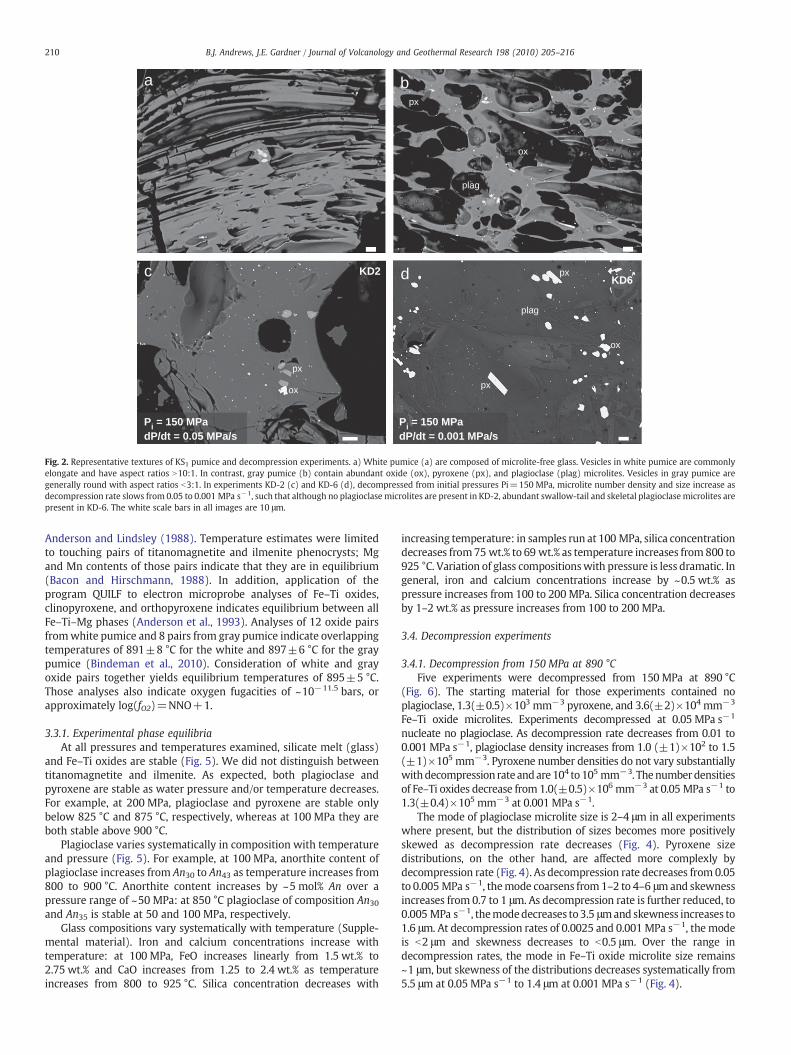
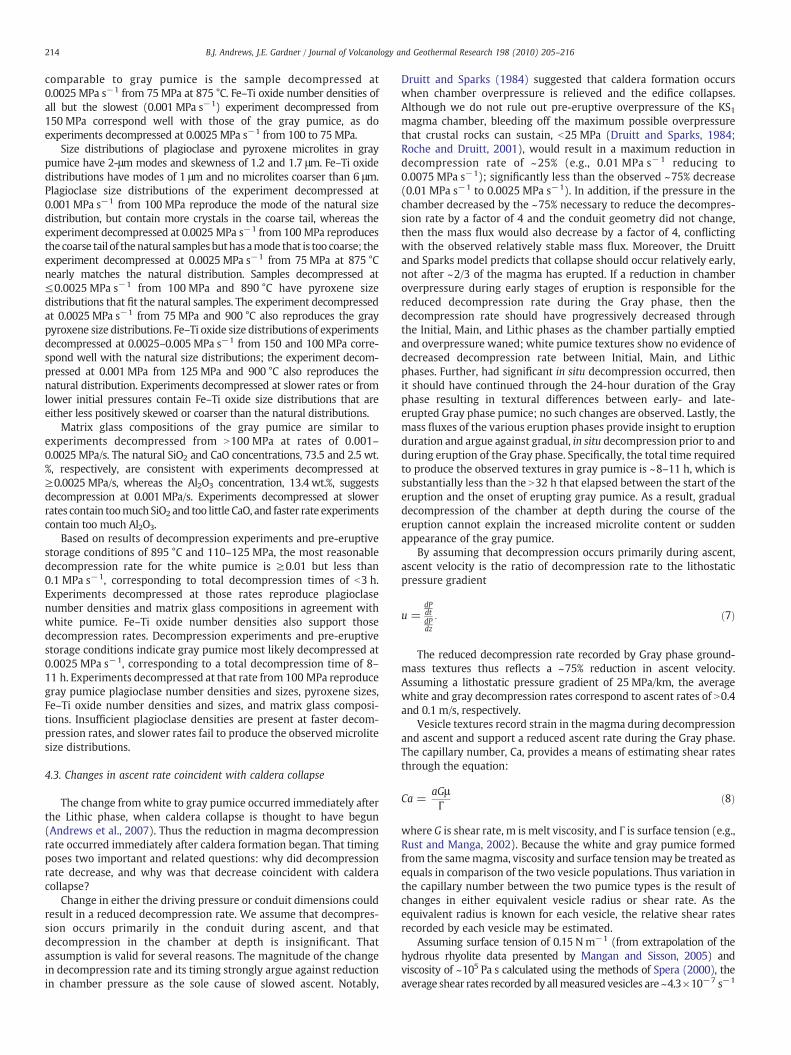
3.4.1. Decompression from 150 MPa at 890 °CFive experiments were decompressed from 150 MPa at 890 °C
(Fig. 6). The starting material for those experiments contained noplagioclase, 1.3(±0.5)×103 mm−3 pyroxene, and 3.6(±2)×104 mm−3
Fe–Ti oxide microlites. Experiments decompressed at 0.05 MPa s−1
nucleate no plagioclase. As decompression rate decreases from 0.01 to0.001 MPa s−1, plagioclase density increases from 1.0 (±1)×102 to 1.5(±1)×105 mm−3. Pyroxene number densities do not vary substantiallywithdecompression rate andare104 to105 mm−3. Thenumberdensitiesof Fe–Ti oxides decrease from 1.0(±0.5)×106 mm−3 at 0.05 MPa s−1 to1.3(±0.4)×105 mm−3 at 0.001 MPa s−1.
The mode of plagioclase microlite size is 2–4 μm in all experimentswhere present, but the distribution of sizes becomes more positivelyskewed as decompression rate decreases (Fig. 4). Pyroxene sizedistributions, on the other hand, are affected more complexly bydecompression rate (Fig. 4). As decompression rate decreases from 0.05to 0.005 MPa s−1, themode coarsens from1–2 to 4–6 μmand skewnessincreases from 0.7 to 1 μm. As decompression rate is further reduced, to0.005 MPa s−1, themodedecreases to3.5 μmand skewness increases to1.6 μm. At decompression rates of 0.0025 and 0.001 MPa s−1, the modeis b2 μm and skewness decreases to b0.5 μm. Over the range indecompression rates, the mode in Fe–Ti oxide microlite size remains~1 μm, but skewness of the distributions decreases systematically from5.5 μm at 0.05 MPa s−1 to 1.4 μm at 0.001 MPa s−1 (Fig. 4).
0
20
40
60
80
100
0 20 40 600
20
40
60
80
100
1:1
2:110:1
1:1
10:1
b
Ves
icle
Len
gth
(µm
)V
esic
le L
engt
h (µ
m)
Vesicle Width (µm)
ngray = 3088
2:1
5:1
5:1
nwhite = 3932
a
Fig. 3. Vesicle sizes in white and gray pumice. Vesicles in white pumice (a) are typicallymore elongate than those in gray pumice (b). Although the two populations overlap,mostvesicles in white pumice have aspect ratios (long:short) greater than 2:1 (and as high as~20:1),whereasmost vesicles in graypumicehaveaspect ratios less than 5:1.Aspect ratiosof vesicles are indicated by diagonal lines extending from the origin, e.g., 2:1.
2520151050
20
10
0
30
White Gray 150, 890: 0.01150, 890: 0.001100, 890: 0.0025100, 890: 0.001
15
10
5
0
20
25 a
b
c45
30
15
0
60
Crystal Size (µm)
Per
cent
age
Fig. 4. Microlite size distributions of natural pumice and representative decompressionexperiments. a) Plagioclase microlites are nearly absent in white pumice, whereas graypumice have unimodal CSDs with a mode at ~2 μm. In decompression experiments,plagioclase microlites have unimodal distributions that coarsen and develop tails asinitial pressure and decompression rate decrease. b) Pyroxene microlites haveunimodal distributions with prominent modes at 2 μm. As initial pressure decreases,those modes become more prominent. c) Oxide microlites in experimental sampleshave unimodal distributions with most crystals smaller than 2 μm. As decompressionrate and initial pressure decrease, skew of the distributions increases. All data areshown as count percentages binned in 2-μm intervals. Size distributions of experimentsdecompressed from 75 MPa or at 0.005 MPa s−1 are not plotted in order to keep theplots uncluttered.
211B.J. Andrews, J.E. Gardner / Journal of Volcanology and Geothermal Research 198 (2010) 205–216
3.4.2. Decompression from 100 MPa at 890 °CFour experiments were decompressed from 100 MPa at 890 °C
(Fig. 6). The initial material for those experiments contained 7.8(±5)×104 mm−3 plagioclase, 1.9(±1)×105 mm−3 pyroxene, and 1.5(±1.5)×105 mm−3 Fe–Ti oxide microlites. Plagioclase number densityincreases from 5(±5)×102 to 2.4(±1)×105 mm−3 as decompressionrate decreases from 0.01 to 0.001 MPa s−1. Pyroxene number densityincreases from 3(±1)×103 to 2.9(±0.6)×105 mm−3 as decompres-sion rate decreases. Similarly, Fe–Ti oxide number densities increasefrom 1.3(±0.5)×105 to 4.1(±0.7)×105.
The modes of plagioclase size distributions increase from 1–2 to 4–6 μm as decompression rate decreases (Fig. 4). Skewness of thosedistributions decreases from 1.0 to 0.6 μm. The mode of pyroxenemicrolite sizes increases from 1 μm at 0.01 MPa s−1 to 3 μm at
0.005 MPa s−1, but as decompression decreases further, the skewnessincreases from 0.6 to N1.4 μm, and the mode returns to 1 μm (Fig. 4).Skewness of Fe–Ti oxide size distributions decreases systematically from3.7 to 2.3 μm as decompression rate slows from 0.01 to 0.001 MPa s−1,but the modes of those distributions remain ~1 μm (Fig. 4).
3.4.3. Decompression from 125 MPa at 900 °COne experimentwas decompressed from125 MPa at 900 °C (Fig. 6).
The initial material for that experiment contained no plagioclase, 5.2(±1.0)×103 mm−3 pyroxene, and 1.4(±0.5)×104 mm−3 Fe–Ti oxi-des. The experiment decompressed at 0.001 MPa s−1 contains 0–4×104 mm−3 plagioclase and 0–3×104 mm−3 pyroxene. The numberdensity of Fe–Ti oxides is the lowest measured in any experiment, 3–7×104 mm−3 (Fig. 4). The size distributions of plagioclase andpyroxene microlites are very broad and have no recognizable modes.The size distribution of Fe–Ti oxide microlites has a mode of 1 μm,skewness of 2.3, and is similar in appearance to experiments decom-pressed at 0.0025 MPa s−1 from 150 MPa and 890 °C.
3.4.4. Decompression from 75 MPaTwo experiments were decompressed at 0.0025 MPa s−1 from
75MPa at temperatures of 875 and 900 °C (Fig. 4). The startingmaterials
250
200
150
100
50
750 800 850 900 950
Plagioclase
Pyroxene
An35
0in all experiments
An30
36 39
29 35 39 43
36
31 36 37
Temperature (oC)
Pre
ssur
e (M
Pa)
Fe-Ti oxides stable
An40
Fig. 5. KS1 phase equilibria. The phase assemblage of Fe–Ti oxides, clinopyroxene,orthopyroxene, and plagioclase (~An42) is stable at conditions of 100–125 MPa and~895 °C. Fe–Ti oxide equilibrium temperatures of 895±5 °C are indicated by theshaded box. Right and left pointing triangles indicate melting and crystallizationexperiments, respectively. Anorthite contents of plagioclase in crystallization and“straight-in” experiments are labeled; dashed lines contour those data and indicateanorthite content. Experiments are listed in Table 2.
101
102
103
104
105
106
107 a
101
102
103
104
105
106b
Num
ber
Den
sity
(m
m-3
)
Decompression Rate
(MPa/s)
10-3 10-2 10-1104
105
106
107 c
White
Gray
150 MPa, 890 C125 MPa, 900 C100 MPa, 890 C
75 MPa, 900 C75 MPa, 875 CNatural pumice
Fig. 6. Variation inmicrolite NV with decompression rate. a) Volumetric number densitiesof plagioclase increase with decreasing decompression rate. Experiments run at lowertemperatures or initial pressures have higher plagioclase number densities. b) Volumetricnumber densities of pyroxene increase with decreasing decompression rate for
212 B.J. Andrews, J.E. Gardner / Journal of Volcanology and Geothermal Research 198 (2010) 205–216
for those experiments contained 1.2(±0.7)×106 mm−3 plagioclase, 2.9(±1.0)×105 mm−3 pyroxene, and 3(±2)×105 mm−3 Fe–Ti oxidemicrolites at 875 °C, and 6.3(±1.0)×105 mm−3 plagioclase, 1.4(±1.0)×105 mm−3 pyroxene, and 5.0(±0.9)×105 mm−3 Fe–Ti oxidemicrolites at 900 °C. The 875 °C experiment contains more plagioclasemicrolites thandoes the 900 °C experiment: 2.0(±0.7)×106 compared to1.1(±0.6)×106 mm−3 (Fig. 4). Pyroxene microlite number densitiesdecrease from 1.5(±0.5)×106 mm−3 at 875 °C to 4(±1)×105 mm−3 at900 °C (Fig. 4). Fe–Ti oxides show a similar pattern, decreasing fromdensities of 8(±4)×105 to 3.4(±1.0)×105 mm−3 as temperatureincreases (Fig. 4). The modes of plagioclase size increases from 1.8 to2.4 μm as temperature increases from 875 to 900 °C, and skewnessdecreases from 1.3 to 1.0 μm. In contrast, pyroxene modes decrease from4.0 to 1.9 μm and skewness increases from 1.4 to 2.4 μm. Fe–Ti oxide sizedistribution modes decrease from 2.7 to 1.9 μm and skewness increasesfrom 0.9 to 1.0 μm.
experiments decompressed from 100 MPa, but are relatively constant in experimentsinitiated from 150 MPa. c) Oxide number densities decrease with decreased decompres-sion rate in experiments initiated from 150 MPa, but do not change significantly inexperiments decompressed from 100 MPa. Error bars are one standard deviation.
3.4.5. Compositions of decompression experimentsGlass compositions vary systematically with starting conditions and
decompression rates, particularly for rates lower than 0.01 MPa/s (Fig. 7).For experiments decompressed from 100MPa or greater pressure, initialSiO2 concentration is 73–73.5 wt.%. In the100 MPaset of experiments, theSiO2 concentration increases toN75 wt.% asdecompression ratedecreasesto b0.001 MPa/s. In the 150 MPa experiments, SiO2 concentrationremains relatively constant until decompression rate falls below0.0025 MPa/s and SiO2 increases to N74 wt.%. The concentration ofAl2O3 remains effectively constant inmost experiments until decompres-sion rate falls below 0.005 MPa/s, and Al2O3 concentration decreases by0.1 to 0.5 wt.% in the 100, 125, and 150 MPa runs. In the 150 MPa set ofexperiments, CaO decreases from ~2.45 to 2.3 wt.% as decompressionslows to 0.0025 MPa/s, and then rapidly decreases to 1.7 wt.% asdecompression rate falls to 0.001 MPa/s, whereas CaO concentrationsmoothly decreases from ~2 wt.% to b1.5 wt.% with decreasing decom-pression rate in the 100 MPa experiments. Titanium decreases withreduceddecompression rate in the150and125MPadecompression runs,from N0.4 wt.% initial concentration to ~0.37 wt.% in 0.001 MPa/sexperiments, but remains relatively constant in experiments decom-pressed from lower pressures.
4. Discussion
4.1. Eruption of one magma during the KS1 eruption
Many eruptions tapmultiplemagmas (Hildreth, 1983; Pallister et al.,1996; Hammer et al., 1999). Often those compositional differences giverise to color contrasts and provide a means of recognizing differentmagma types in the field. Following that line of reasoning, the KS1whiteand gray pumice could be easily interpreted as originating from twodifferent magmas. That interpretation is however, wrong, as severallines of evidence indicate a single magma erupted to produce the KS1white and gray pumice. First, bulk compositions of the white and graypumice are indistinguishable. Second, phase assemblages and pheno-cryst and matrix glass compositions are effectively the same. Composi-tions of coexisting minerals indicate that both the white and graypumice originated from the same magma with the same pressure,temperature, and oxygen fugacity. Third, glass inclusions from white
73
74
75
76
10-3 10-2 10-1 Initial
12
13
14
15
16
1.0
2.0
3.0
WhiteGray
150MPa 890C
100MPa 890C75MPa 900C75MPa 875C
125MPa 900C
Natural pumicew
t. %
SiO
2w
t. %
Al2
O3
wt.
% C
aO
Decompression Rate (MPa/s)
Fig. 7. Glass compositions of decompression experiments and natural pumice. a) SiO2
compositions decrease with increased decompression rate, initial pressure, and temper-ature. Experiments decompressed from75MPa are not shown as they exceeded 75.5 wt.%SiO2. b) Al2O3 concentration remains relatively steady in experiments decompressed from150 MPa until the decompression rate falls below 0.0025 MPa/s. In experimentsdecompressed from 100 MPa, the concentration drops as the rate decreases below0.005 MPa/s. c) Calcium concentrations remain stable in 150 MPa experiments until thedecompression rate decreases below 0.0025 MPa/s, whereas they systematically decreaseas decompression rate falls in runs decompressed from 100 MPa.
213B.J. Andrews, J.E. Gardner / Journal of Volcanology and Geothermal Research 198 (2010) 205–216
and gray pumice contain overlapping water concentrations and, usingthe model of Moore et al. (1998), indicate saturation pressures of 110–150 MPa. Assuming a temperature of 895 °C from geothermometry(Izbekov et al., 2003; Bindeman et al., 2010), we find that the naturalphase assemblage is stable at pressures less than 125 MPa, whereplagioclase stability begins (Fig. 5). Compositions of plagioclase rimsfrom experiments run at 100 MPa and 900 °C are most consistent withthe compositions of natural samples, further constraining storageconditions of the rhyodacite (Fig. 5). At pressures of 100 MPa,experimental glass compositions become more siliceous and less calcicthan natural matrix glass as temperature drops below 875 °C (Supple-mental material). It is highly unlikely that two magmas of the samecomposition and stored at the same conditions existed simultaneouslyand in isolation from one another beneath the Ksudach edifice prior tothe KS1 eruption. Instead, the most reasonable explanation is that thewhite and gray pumice originated from a single magma stored at 110–125 MPa, equivalent to a depth of 4–5 km, and 895(±5)°C. Thatpressure is consistent with dissolved water contents of 4.4(±1.0) and3.8(±0.9)wt.% for the white and gray pumice.
4.2. Decompression rates of KS1 pumice
Given that the only differences between the white and graypumice are textural, and the two pumice types are aliquots of thesame magma, we suggest that those differences result from differentdecompression and ascent rates during the eruption. That the graypumice contain more microlites indicates it decompressed slowerthan the white pumice. Our decompression experiments provide aquantitative estimate for decompression rates of the white and graypumice. It should be noted here that although we only investigatedone type of decompression (i.e., multi-step decompressions defining aconstant decompression rate), several arguments suggest our decom-pression experiments are applicable to the Ksudach system. First, the
multiple decompression steps in our experiments shouldmore closelysimulate the natural system than single-step decompressions (i.e.,decompressing to the final pressure and then holding for a designatedinterval before quenching); although each decompression stepdisturbs the system, and may create a nucleation event, themagnitude of each disturbance (which increases plagioclase under-cooling by ~6.5 °C) is quite small. Second, Browne and Gardner (2006)demonstrated that hornblende reaction rates are greatly dependenton the amount spent at specific disequilibrium pressure–temperatureconditions, not just the average decompression rate, thus single-stepdecompressions (i.e., decompression accomplished in a singledecrease followed by maintenance of the final pressure for a lengthof time appropriate for the desired average decompression rate) canfail to produce textures observed in multi-step decompressions andnatural samples; it seems reasonable that similar processes shouldapply to plagioclase, pyroxene, and oxide crystallization kinetics.Lastly, although magma decompression rate increases during ascent,numerical modeling of ascent suggests that most of the accelerationoccurs during the final ~10% of the total decompression time (Mastinand Ghiorso, 2000; Mastin, 2002), thus constant rate decompressionexperiments should provide a reasonable model of actual magmaticdecompression and ascent.
White pumice are characterized by plagioclase number densitiesb5×102 mm−3 and pyroxene and Fe–Ti oxide densities of 1–4×105 mm−3. Plagioclase number densities of experiments decom-pressed from 150 or 100 MPa at rates equal to or greater than0.01 MPa s−1 correspond well with the natural samples; all experi-ments decompressed at slower rates produce plagioclase densitiesthat far exceed those of white pumice. Number densities of pyroxenemicrolites in experiments decompressed from 150 MPa are all lessthan the natural samples, but experiments decompressed slower than0.005 MPa s−1 from 100 MPa reproduce the values found in whitepumice. Pyroxene are less abundant in the experiment decompressedat 0.001 MPa from 125 MPa, whereas the experiments decompressedat 0.0025 MPa from 75 MPa both contain more pyroxene than donatural samples. Fe–Ti oxide number densities of all decompressionexperiments, except that initiated at 125 MPa, are in agreement withthe natural value.
Pyroxene microlite size distributions within white pumice arepositively skewed and have a mode of 2 μm, Fe–Ti oxide distributionsare unimodalwithmost crystals b2 μmandnocrystals larger than 8 μm;insufficient plagioclase are present for reliable size distributions.Experiments decompressed from 150 MPa have either the appropriatemode (at 0.01 MPa s−1) or skewness (at 0.005 MPa s−1) but not both.In contrast, the sample decompressed at 0.001 MPa s−1 from 100 MPareproduces both the mode and skewness of the size distribution. Fe–Tioxide size distributions of all experiments except those decompressedfrom 75 MPa are more positively skewed than the natural samples, butthe modes of all experiments except those decompressed from 75MPacompare are similar to the natural samples.
Matrix glass compositions of the white pumice are most consistentwith experiments decompressed from ≥125 MPa at N0.0025 MPa/s, orfrom 100 MPa at N0.01 MPa/s. Experiments decompressed from eitherlower initial pressures or at slower rates have excess SiO2, N74 wt.%, andinsufficient Al2O3 and CaO, b14.5 and b2 wt.%, respectively, incomparisonwithnatural samples. Because little compositional variationis present between experiments decompressed at faster rates, glasscomposition does not constrain the maximum decompression rate ofthe white pumice.
In gray pumice, plagioclase microlites are present in densities of~2×106 mm−3, and pyroxene and Fe–Ti oxide microlites occur indensities of ~5–6×106 mm− 3. Experiments decompressed at0.0025 MPa s−1 from 100MPa have plagioclase abundances that ap-proach the natural number densities, as do experiments decompressedfrom 75MPa; all other experiments contain fewer plagioclase than thenatural samples. The only experiment containing pyroxene in densities
214 B.J. Andrews, J.E. Gardner / Journal of Volcanology and Geothermal Research 198 (2010) 205–216
comparable to gray pumice is the sample decompressed at0.0025 MPa s−1 from 75MPa at 875 °C. Fe–Ti oxide number densities ofall but the slowest (0.001 MPa s−1) experiment decompressed from150 MPa correspond well with those of the gray pumice, as doexperiments decompressed at 0.0025 MPa s−1 from 100 to 75 MPa.
Size distributions of plagioclase and pyroxene microlites in graypumice have 2-μm modes and skewness of 1.2 and 1.7 μm. Fe–Ti oxidedistributions have modes of 1 μm and no microlites coarser than 6 μm.Plagioclase size distributions of the experiment decompressed at0.001 MPa s−1 from 100 MPa reproduce the mode of the natural sizedistribution, but contain more crystals in the coarse tail, whereas theexperiment decompressed at 0.0025 MPa s−1 from 100 MPa reproducesthe coarse tail of thenatural samplesbuthas amode that is too coarse; theexperiment decompressed at 0.0025 MPa s−1 from 75MPa at 875 °Cnearly matches the natural distribution. Samples decompressed at≤0.0025 MPa s−1 from 100 MPa and 890 °C have pyroxene sizedistributions that fit the natural samples. The experiment decompressedat 0.0025 MPa s−1 from 75 MPa and 900 °C also reproduces the graypyroxene size distributions. Fe–Ti oxide size distributions of experimentsdecompressed at 0.0025–0.005 MPa s−1 from 150 and 100 MPa corre-spond well with the natural size distributions; the experiment decom-pressed at 0.001 MPa from 125MPa and 900 °C also reproduces thenatural distribution. Experiments decompressed at slower rates or fromlower initial pressures contain Fe–Ti oxide size distributions that areeither less positively skewed or coarser than the natural distributions.
Matrix glass compositions of the gray pumice are similar toexperiments decompressed from N100 MPa at rates of 0.001–0.0025 MPa/s. The natural SiO2 and CaO concentrations, 73.5 and 2.5 wt.%, respectively, are consistent with experiments decompressed at≥0.0025 MPa/s, whereas the Al2O3 concentration, 13.4 wt.%, suggestsdecompression at 0.001 MPa/s. Experiments decompressed at slowerrates contain toomuchSiO2 and too little CaO, and faster rate experimentscontain too much Al2O3.
Based on results of decompression experiments and pre-eruptivestorage conditions of 895 °C and 110–125 MPa, the most reasonabledecompression rate for the white pumice is ≥0.01 but less than0.1 MPa s−1, corresponding to total decompression times of b3 h.Experiments decompressed at those rates reproduce plagioclasenumber densities and matrix glass compositions in agreement withwhite pumice. Fe–Ti oxide number densities also support thosedecompression rates. Decompression experiments and pre-eruptivestorage conditions indicate gray pumice most likely decompressed at0.0025 MPa s−1, corresponding to a total decompression time of 8–11 h. Experiments decompressed at that rate from 100 MPa reproducegray pumice plagioclase number densities and sizes, pyroxene sizes,Fe–Ti oxide number densities and sizes, and matrix glass composi-tions. Insufficient plagioclase densities are present at faster decom-pression rates, and slower rates fail to produce the observed microlitesize distributions.
4.3. Changes in ascent rate coincident with caldera collapse
The change fromwhite to gray pumice occurred immediately afterthe Lithic phase, when caldera collapse is thought to have begun(Andrews et al., 2007). Thus the reduction in magma decompressionrate occurred immediately after caldera formation began. That timingposes two important and related questions: why did decompressionrate decrease, and why was that decrease coincident with calderacollapse?
Change in either the driving pressure or conduit dimensions couldresult in a reduced decompression rate. We assume that decompres-sion occurs primarily in the conduit during ascent, and thatdecompression in the chamber at depth is insignificant. Thatassumption is valid for several reasons. The magnitude of the changein decompression rate and its timing strongly argue against reductionin chamber pressure as the sole cause of slowed ascent. Notably,
Druitt and Sparks (1984) suggested that caldera formation occurswhen chamber overpressure is relieved and the edifice collapses.Although we do not rule out pre-eruptive overpressure of the KS1magma chamber, bleeding off the maximum possible overpressurethat crustal rocks can sustain, b25 MPa (Druitt and Sparks, 1984;Roche and Druitt, 2001), would result in a maximum reduction indecompression rate of ~25% (e.g., 0.01 MPa s− 1 reducing to0.0075 MPa s−1); significantly less than the observed ~75% decrease(0.01 MPa s−1 to 0.0025 MPa s−1). In addition, if the pressure in thechamber decreased by the ~75% necessary to reduce the decompres-sion rate by a factor of 4 and the conduit geometry did not change,then the mass flux would also decrease by a factor of 4, conflictingwith the observed relatively stable mass flux. Moreover, the Druittand Sparks model predicts that collapse should occur relatively early,not after ~2/3 of the magma has erupted. If a reduction in chamberoverpressure during early stages of eruption is responsible for thereduced decompression rate during the Gray phase, then thedecompression rate should have progressively decreased throughthe Initial, Main, and Lithic phases as the chamber partially emptiedand overpressure waned; white pumice textures show no evidence ofdecreased decompression rate between Initial, Main, and Lithicphases. Further, had significant in situ decompression occurred, thenit should have continued through the 24-hour duration of the Grayphase resulting in textural differences between early- and late-erupted Gray phase pumice; no such changes are observed. Lastly, themass fluxes of the various eruption phases provide insight to eruptionduration and argue against gradual, in situ decompression prior to andduring eruption of the Gray phase. Specifically, the total time requiredto produce the observed textures in gray pumice is ~8–11 h, which issubstantially less than the N32 h that elapsed between the start of theeruption and the onset of erupting gray pumice. As a result, gradualdecompression of the chamber at depth during the course of theeruption cannot explain the increased microlite content or suddenappearance of the gray pumice.
By assuming that decompression occurs primarily during ascent,ascent velocity is the ratio of decompression rate to the lithostaticpressure gradient
u =dPdtdPdz
: ð7Þ
The reduced decompression rate recorded by Gray phase ground-mass textures thus reflects a ~75% reduction in ascent velocity.Assuming a lithostatic pressure gradient of 25 MPa/km, the averagewhite and gray decompression rates correspond to ascent rates of N0.4and 0.1 m/s, respectively.
Vesicle textures record strain in the magma during decompressionand ascent and support a reduced ascent rate during the Gray phase.The capillary number, Ca, provides a means of estimating shear ratesthrough the equation:
Ca =aGμΓ
ð8Þ
where G is shear rate, m is melt viscosity, and Γ is surface tension (e.g.,Rust and Manga, 2002). Because the white and gray pumice formedfrom the samemagma, viscosity and surface tensionmay be treated asequals in comparison of the two vesicle populations. Thus variation inthe capillary number between the two pumice types is the result ofchanges in either equivalent vesicle radius or shear rate. As theequivalent radius is known for each vesicle, the relative shear ratesrecorded by each vesicle may be estimated.
Assuming surface tension of 0.15 Nm−1 (from extrapolation of thehydrous rhyolite data presented by Mangan and Sisson, 2005) andviscosity of ~105 Pa s calculated using the methods of Spera (2000), theaverage shear rates recorded by allmeasured vesicles are ~4.3×10⁻⁷ s−1
215B.J. Andrews, J.E. Gardner / Journal of Volcanology and Geothermal Research 198 (2010) 205–216
and~2.9×10⁻⁷ s−1 in thewhite andgraypumice, respectively. If only the5%of vesicleswith the largest capillary numbers are considered, thewhitepumice record ~50%higher shear rates than the gray, 2.8(±1)×10−6 s−1
compared to 1.8(±1)×10−6 s−1. Those higher shear rates are consistentwith faster ascent of the white pumice compared to the gray pumice.
4.4. Changes in conduit geometry coincident with caldera collapse
A simple estimation of conduit size, A, can be made frommass fluxusing
A =
dMdtρu
ð8Þ
where dM/dt is the eruptive mass flux, ρ is magma density, and u isaverage ascent velocity (from Eq. 7). Comparison of mass fluxes andascent velocities of theMain and Gray phases indicate that the conduitsize increased by a factor of ~4 following the initiation of calderacollapse. Such a relation is, however, a simplification and ignores thedependence of ascent rate on conduit size and shape (Jaupart, 2000;Mastin and Ghiorso, 2000; Mastin, 2002).
Numerical models offer a more sophisticated method of balancingconduit size, mass flux, and decompression rate (Mastin and Ghiorso,2000; Mastin, 2002). Specifically, the program Conflow allows us toexamine the effects of conduit geometry on mass flux and decom-pression rate, and thus estimate conduit geometries of the Main andGray phases by comparingmodel runswith estimatedmass fluxes andexperimental decompression rates. For our simulations, we calculatedthe average decompression rate from
dPdt
=ΔP
Σ zi−zi−1ui
ð9Þ
where ΔP and zi are the total pressure drop and distance ascendedthrough step i, and ui is the velocity of that step. The averagedecompression rate of any givenmodel run is taken as the average dP/dt (Eq. 9) calculated from the base of the conduit up to when themodel flow reaches a vesicularity of 70% (the fragmentation point inConflow). We should note that if taken as exact predictors of conduitgeometry, Conflow solutions are often implausible, the model does,however, provide outer bounds for and constrain critical aspects ofconduit geometry. For example, model-predictions of a straight-sidedconemay be geologically accommodated by a generally broad conduitwith a constricted upper region. Although the Conflow solutions tothe KS1 eruptive mass fluxes and decompression rates are not unique,they do provide important insight to syn-eruptive changes in conduitstructure.
The mass flux of the Main phase can be modeled by a singlecylindrical conduit with a diameter of 120–150 m. The decompressionrate within that conduit is 0.30 MPa s−1 to 0.35 MPa s−1. Both of thoserates are significantly higher than the estimated minimum decompres-sion rate for white pumice, 0.01 MPa s−1. If we attempt to solve fordecompression rate, we model decompression rates of 0.01 MPa s−1 ifconduit diameter is 20 m. Such a size, however, results in a mass fluxmore than 2 orders of magnitude below that of the Main phase.
If we consider non-cylindrical conduits, then a single, taperingconduit can simultaneously accommodate the required mass flux andapproach the minimum decompression rate estimated for the Mainphase. Modeling indicates that a single conical (or constricted) conduitwith a basal diameter of ~400 m and a vent diameter of 100 m canaccommodate a mass flux of ~4×10⁸ kg s−1 with a decompression rateof ~0.05 MPa s−1. If the conduit base is broadened to 1000 m, and thevent is constricted to 75 m, mass flux remains N3×108 kg s−1, anddecompression rate slows to ~0.01 MPa s−1.More conical geometries fail
to predict the requiredmassflux and/or predict decompression rates thatare too low.
The Gray phase mass flux can be modeled by a single cylindricalconduit with a diameter of 100–130 m. The decompression rate withinsuch a conduit, ~0.2 MPa s−1, however, is two orders of magnitudegreater than that estimated from decompression experiments,0.0025 MPa s−1. It is thus unlikely that a single cylindrical conduit fedthe Gray phase. Cylindrical conduits with diameters b20 m predictdecompression rates approaching those of the Gray phase, but themassfluxes through those conduits are two orders of magnitude too low.
The presence of multiple, cylindrical conduits during the Grayphase is one way to solve simultaneously for mass flux anddecompression rate, but this solution seems unlikely for severalreasons. First, the Gray phase mass flux requires approximately 100conduits with 20-m diameters to operate simultaneously during theeruption phase. Such a large number is unreasonable because thoseconduits would have to be near enough to one another that they allfed the same Plinian column, but far enough apart that they did notcoalesce, as coalescence would result in a larger conduit and anincrease in decompression rate. Furthermore, it is unlikely that such alarge number of conduits could remain active for the duration of theGray phase without conduit heterogeneities leading to the wideningof some conduits and increases in decompression rate. Similarly, wereall of those conduits to coalesce into a ring-dike, it is hard to imaginethat dike maintaining a uniform aperture throughout the Gray phase,and far more likely that magma ascent would become focused alongcertain segments, leading to changes in mass flux and/or decompres-sion rate.
A single conduit can model the Gray phase mass flux anddecompression rate if it has a conical or constricted geometry. A conicalconduit that tapers from 1200 to 1600 m at its base to a vent of ~60 mcan simultaneously accommodate the required mass flux and decom-pression rate. Ifmassflux is evenly distributed among two, three, or fourconduits, those conduits still require basal diameters of ~1000 m andvent diameters of ~40 m. Conduits with larger vents generatedecompression rates and mass fluxes too high for the Gray phase,whereas conduits with wider bases appear unreasonable given the sizeof Ksudach Caldera V.
A geologically reasonable interpretation of the Conflow results isthat the eruption was fed by a broad conduit that became constrictednear the top prior to and during caldera collapse. Themodeling resultssuggest that a conduit with a basal diameter of ~400 m and an upperregion constricted to ~100 m length scale could have fed the Mainphase of eruption. Through this phase, the constricted length scale ofthe conduit likely remained 75–100 m. As the eruption progressed,the conduit geometry likely evolved through erosion of the upperregions and foundering of the base into the emptying chamber.Foundering of the base of conduit base, however, weakened thevolcanic edifice, such that caldera collapse began during the Lithicphase of eruption. At the culmination of the Lithic phase, enough ofthe edifice foundered into the two-thirds empty chamber that theconduit base widened, but collapse further constricted upper regionsof the conduit to ~60 m. Effectively, the collapsed upper region of thechamber became the conduit base. Comparison of the volume oflithics ejected by the start of the Gray phase, ~1 km3, compared withGray phase conduit volumes as suggested by Conflow, 1.5 to 2 km3,suggest that foundering of b1 km3 of the edifice is required for thismodel to be possible. Given that the Ksudach edifice collapsed duringthe KS1 eruption to form a caldera, it should not be surprising thatsome of the collapse involved foundering of the edifice into thechamber.
Our scenario for the KS1 eruption and caldera collapse describes theobserved changes in mass flux and decompression rate. We proposethat prior to eruption, pressure built in the chamber, fracturing thewallrock until a fracture propagated to the surface to become the eruptionconduit. Further fracturing ofwall rock along the conduit and the roof of
216 B.J. Andrews, J.E. Gardner / Journal of Volcanology and Geothermal Research 198 (2010) 205–216
the chamber occurred during pre-collapse phases of eruption. Collapsebegan during the Lithic phase, as theweakened roof of the chamber andlower regions of the conduit broke apart and foundered orwere ejected.Although the 0.3 km3 of lithics ejected during the Lithic phaserepresents only ~25% of the total amount of erupted lithics, they wereerupted at a rate 3–10 times greater than during any other phase oferuption. That substantial increase in lithic eruption rate reflects thefracturing that occurred as the edifice began to collapse. Importantly,however, only 20–33% of the lithics composing the developingGray phase conduit were ejected during the Lithic phase; the remaining0.5–1 km3 foundered into the emptying chamber. Caldera collapse thusresulted in a conduit with a wider base and narrow top and a N75%reduction in decompression rate.
Supplementarymaterials related to this article can be found onlineat doi:10.1016/j.jvolgeores.2010.08.021.
Acknowledgements
The authors wish to thank P.E. Izbekov for conducting early phaseequilibria experiments at UAF and his analyses of Fe–Ti oxides. V.Ponomareva, I. Melekestsev, and O. Selyangin of the Institute ofVolcanology and Seismology in Petropavlovsk–Kamchatsky providedlogistical assistance and field guiding. This project was partially fundedby a grant from the National Science Foundation (EAR-0711043) to J.G.and through funding from the Alaska Volcano Observatory. Additionalsupport was provided by the Jackson School of Geosciences. Thoughtfulreviews by P.E. Izbekov and one anonymous reviewer significantlyimproved this manuscript.
References
Anderson, D.J., Lindsley, D.H., 1988. Internally consistent solution models for Fe–Mg–Mn–Ti oxides. Am. Mineral. 73, 714–726.
Anderson, D.J., Lindsley, D.H., Davidson, P.M., 1993. QUILF: a Pascal program to assessequilibria among Fe–Mg–Mn–Ti oxides, pyroxenes, olivine, and quartz. Comput.Geosci. 19, 1333–1350.
Andrews, B.J., Gardner, J.E., Tait, S., Ponomareva, V., Melekestsev, I.V., 2007. Dynamics ofthe 1800 14C yr BP caldera-forming eruption of Ksudach Volcano, Kamchatka,Russia. Geophys. Monogr. 172, 325–342.
Bacon, C.R., 1983. Eruption history of Mount Mazama and Crater Lake caldera, CascadeRange, U.S.A. J. Volcanol. Geotherm. Res. 18, 57–115.
Bacon, C.R., Hirschmann, M.M., 1988. Mg/Mn partitioning as a test for equilibriumbetween coexisting Fe–Ti oxides. Am. Mineral. 73, 57–61.
Bindeman, I.N., Leonov, V.L., Izbekov, P.E., Ponomareva, V.V., Watts, K.E., Shipley, N.K.,Perepelov, A.B., Bazanova, L.I., Jicha, B.R., Singer, B.S., Schmitt, A.K., Portnyagin, M.V.,Chen, C.H., 2010. Large-volume silicic volcanism in Kamchatka: Ar–Ar and U–Pbages, isotopic, and geochemical characteristics of major pre-Holocene caldera-forming eruptions. J. Volcanol. Geotherm. Res. 189, 57–80.
Braitseva, O.A., Melekestsev, I.V., Ponomareva, V.V., Kirianov, V.Yu., 1996. The caldera-forming eruption of Ksudach volcano about cal. A.D. 240: the greatest explosiveevent of our era in Kamchatka, Russia. J. Volcanol. Geotherm. Res. 70, 49–65.
Browne, B.L., Gardner, J.E., 2006. The influence of magma ascent path on texture,mineralogy, and formation of hornblende reaction rims. Earth Planet. Sci. Lett. 246,161–176.
Carey, S., Sparks, R.S.J., 1986. Quantitative models of the fallout and dispersal of tephrafrom volcanic eruption columns. Bull. Volcanol. 48, 109–125.
Druitt, T.H., Sparks, R.S.J., 1984. On the formation of calderas during ignimbriteeruptions. Nature 310, 679–681.
Gardner, J.E., Tait, S., 2000. The caldera-forming eruption of Volcano Ceboruco. Mex.Bull. Volcanol. 62, 20–33.
Gardner, J.E., Thomas, R.M.E., Jaupart, C., Tait, S., 1996. Fragmentation of magma duringPlinian volcanic eruptions. Bull. Volcanol. 58, 144–162.
Hammer, J.E., Cashman, K.V., Hoblitt, R.P., Newman, S., 1999. Degassing and microlitecrystallization during pre-climactic events of the 1991 eruption of Mt. Pinatubo,Philippines. Bull. Volcanol. 60, 355–380.
Hildreth, W., 1983. The compositionally zoned eruption of 1912 in the valley of TenThousand Smokes, Katmai National Park, Alaska. J. Volcanol. Geotherm. Res. 18,1–56.
Hildreth, W., Mahood, G.A., 1986. Ring-fracture eruption of the Bishop Tuff. Geol. Soc.Am. Bull. 97, 396–403.
Hinch, E.J., Acrivos, A., 1980. Long slender drops in a simple shear flow. J. Fluid Mech. 98,305–328.
Izbekov, P.E., Gardner, J.E., Andrews, B., Ponomareva, V.V., Melekestev, I.V., 2003.Petrology of Holocene caldera-forming eruptions at Ksudach, Kamchatka. EOSTrans. AGU 84 (46), V42B–V0347B Fall Suppl.
Jaupart, C., 2000. Magma ascent at shallow levels. In: Sigurdsson, H., Houghton, B.F.,McNutt, S.R., Rymer, H., Stix, J. (Eds.), Encylopedia of Volcanoes, pp. 237–248.
Lipman, P.W., 2000. Calderas. In: Sigurdsson, H., Houghton, B.F., McNutt, S.R., Rymer, H.,Stix, J. (Eds.), Encylopedia of Volcanoes, pp. 643–662.
Mangan, M., Sisson, T., 2005. Evolution of melt-vapor surface tension in silicic volcanicsystems: experiments with hydrous melts. J. Geophys. Res. 110, B01202.doi:10.1029/2004JB003215.
Mastin, L.G., 2002. Insights into volcanic conduit flow from an open-source numericalmodel. Geochem. Geophys. Geosyst. 3 (7). doi:10.1029/2001GC000192.
Mastin, L.G., Ghiorso, M.S., 2000. A numerical program for steady-state flow of magma–gas mixtures through vertical eruption conduits. USGS Open-File Report 00-209.
Moore, G., Vennemann, T., Carmichael, I.S.E., 1998. An empirical model for the solubilityof H2O in magmas to 3 kilobars. Am. Mineral. 83, 36–42.
Newman, S., Stolper, E.M., Epstein, S., 1986. Measurements of water in rhyolitic glasses:calibration of an infrared spectroscopic technique. Am. Mineral. 71, 1527–1541.
Pallister, J.S., Hoblitt, R.P., Meeker, G.P., Knight, R.J., Siems, D.F., 1996. Magma mixing atMount Pinatubo: petrographic and chemical evidence from the 1991 deposits. In:Newhall, C.G., Punongbayan, R.S. (Eds.), Fire and Mud: Eruptions and Lahars ofMount Pinatubo, Philippines, pp. 687–731.
Roche, O., Druitt, T.H., 2001. Onset of caldera collapse during ignimbrite eruptions.Earth Planet. Sci. Lett. 191, 191–202.
Rust, A.C., Manga, M., 2002. Bubble shapes and orientations in low Re simple shear flow.J. Colloid Interface Sci. 249, 476–480.
Scott, W.E., Hoblitt, R.P., Torres, R.C., Self, S., Martinez, M.M.L., Nillos Jr., T., 1996.Pyroclastic flows of the June 15, 1991, climactic eruption of Mount Pinatubo. Fireand Mud, pp. 545–570.
Sigurdsson, H., Carey, S., 1989. Plinian and co-ignimbrite tephra fall from the 1815eruption of Tambora volcano. Bull. Volcanol. 51, 243–270.
Spera, F.J., 2000. Physical properties of magmas. In: Sigurdsson, H., Houghton, B.F.,McNutt, S.R., Rymer, H., Stix, J. (Eds.), Encylopedia of Volcanoes, pp. 171–190.
Stolper, E.M., 1982. Water in silicate glasses; an infrared spectroscopic study. Contrib.Mineral. Petrol. 81, 1–17.
Stormer, J.C., 1983. The effects of recalculation on estimates of temperature and oxygenfugacity from analyses of multicomponent iron–titanium oxides. Am. Mineral. 68,586–594.
Suzuki-Kamata, K., Kamata, H., Bacon, C.R., 1993. Evolution of the caldera-formingeruption at Crater Lake, Oregon, indicated by component analysis of lithicfragments. J. Geophys. Res. 98, 14059–14074.
Wilson, C.J.N., Hildreth, W., 1997. The Bishop Tuff: new insights from eruptivestratigraphy. J. Geol. 105, 407–439.
Zhang, Y., Belcher, R., Ihinger, P.D., Wang, L., Xu, Z., Newman, S., 1997. New calibrationof infrared measurement of dissolved water in rhyolitic glasses. Geochim.Cosmochim. 61, 3089–3100.