Embed Size (px)
Citation preview
Journal of Theoretical and Applied Information Technology 31st May 2018. Vol.96. No 10
© 2005 – ongoing JATIT & LLS
ISSN: 1992-8645 www.jatit.org E-ISSN: 1817-3195
3036
APPLICATION OF SPECTROGRAM AND DISCRETE WAVELET TRANSFORM FOR EMG PATTERN
RECOGNITION
1JINGWEI TOO, 2A.R. ABDULLAH, 3NORHASHIMAH MOHD SAAD, 4N MOHD ALI,
5T.N.S. TENGKU.ZAWAWI
1,2,4,5Fakulti Kejuruteraan Elektrik, Universiti Teknikal Malaysia Melaka, 76100 Durian Tunggal, Melaka, Malaysia
2,3Center for Robotics and Industrial Automation, Fakulti Kejuruteraan Elektrik, Universiti Teknikal Malaysia Melaka, 76100 Durian Tunggal, Melaka, Malaysia.
3Fakulti Elektronik dan Kejuruteraan Komputer, Universiti Teknikal Malaysia Melaka, 76100 Durian Tunggal, Melaka, Malaysia
E-mail: [email protected], [email protected]
ABSTRACT
Electromyography (EMG) pattern recognition has recently drawn the attention of the researchers to its potential as an efficient manner in rehabilitation studies. In this paper, two time-frequency methods, discrete wavelet transform (DWT) and spectrogram are employed to obtain the time and frequency information from the EMG signal. Seventeen hand and wrist movements are recognized from the EMG signals acquired from ten intact subjects and eleven amputee subjects in NinaPro database. The root mean square (RMS) feature is extracted from each reconstructed DWT coefficient. On the other hand, the average energy of spectrogram at each frequency bin is extracted. The principal component analysis (PCA) preprocessing is applied to reduce the dimensionality of feature vectors. Four different classifiers namely Support Vector Machines (SVM), Decision Tree (DT), Linear Discriminate Analysis (LDA) and Naïve Bayes (NB) are used for classification. By applying SVM, DWT achieves the highest mean classification accuracy of 95% (intact subjects) and 71.3% (amputees). To validate our experimental results, the performance of DWT and spectrogram features are compared to other conventional methods. The obtained results obviously evince the superiority of DWT in EMG pattern recognition.
Keywords: Electromyography (EMG), Discrete wavelet transform (DWT), Spectrogram, Pattern recognition.
1. INTRODUCTION
Malaysia Social Security Organization (SOCSO) reported almost 25% of workers continued to have upper limb injuries that decreased their independence [1]. Majority of upper limb injuries are related to the hand, wrist and forearm [1], [2]. Workers with injured hand not only endure the pain, but also experience muscle weakness, muscle fatigue and muscle pain [3]. In addition, majority outcome of the surgery is unexpected and disappointed. Furthermore, upper limb is so dexterous and precious to a human. Without upper limb, human is not able to perform daily life actions including wrist and functional motions. Especially, an amputee, who lost his upper limb and the life has become challenge.
In recent days, electromyography (EMG) has been widely used in clinical and rehabilitation
areas. Most of the researchers made use of the surface electromyography (sEMG) to measure and record the electrical activity of muscle contraction for rehabilitation purpose [4]–[7]. For examples, the myoelectric prosthetic hand based EMG not only profits the amputee, but also benefits the stoke survivor and injured worker. However, researchers face difficulties in obtaining high accuracy in classifying EMG signal. The inconsistency of muscle fatigue and noises seriously falsified the pattern recognition [8]–[10]. Therefore, several pre-processing is required to overcome the limitation.
Previous studies focused on the time domain (TD) features in classification of EMG pattern due to its speed and simplicity [11], [12]. However, TD does not contain spectral information and it demands a high number of features in achieving high classification accuracy [13].
Journal of Theoretical and Applied Information Technology 31st May 2018. Vol.96. No 10
© 2005 – ongoing JATIT & LLS
ISSN: 1992-8645 www.jatit.org E-ISSN: 1817-3195
3037
Therefore, the time-frequency distribution, such as wavelet transform (WT) and the short time Fourier Transform (STFT) are introduced. STFT is a time-frequency representation (TFR) which provides high frequency using fixed time-frequency resolution [13]. On the other hand, WT can be categorized into discrete and continuous and it is good in transforming the signal into a flexible time and frequency resolution [9]. Most studies to date indicated that discrete wavelet transform (DWT) has been successfully applied in biomedical application [14], [15]. In one study, WT and STFT have been compared and WT showed to be more useful since it provided a changeable resolution in the analysis of the EMG signal [16]. Moreover, K. Englehart et al. [17] compared the TD, STFT and WT and the authors found that WT offered a better performance in classifying EMG signals. However, only the comparison of four classes was done and the analysis of amputee subject did not include in the study. It is worthwhile to mention that a multifunctional myoelectric prosthetic hand, which including multiple number of hand movement is preferred in rehabilitation. In addition, it is noticed that the classification of EMG pattern recognition for amputee subject is still insufficient. To our knowledge, the performance comparison between DWT and spectrogram are remain unclear and insufficient in EMG pattern recognition, especially for large number of hand movement and amputee subject.
In this study, the performance of DWT and spectrogram of intact and amputee subjects in EMG pattern recognition are investigated. In the first step, DWT and spectrogram are employed to transform the EMG signal into time frequency distribution. Then, the features are extracted from spectrogram and DWT coefficients. However, the extracting features lead to a high dimensional feature vector. To reduce the dimensionality, the principal component analysis (PCA) has been applied. In the second step, the machine learning techniques such as Naïve Bayes (NB), Support Vector Machines (SVM), Linear Discriminate Analysis (LDA) and Decision Tree (DT) are used to classify the hand movement types. After that, the performance of classifier is evaluated using statistical analysis. Finally, the performance of DWT and spectrogram are compared with other conventional methods. Through the analysis, it can be inferred that DWT is a useful tool in EMG pattern recognition.
2. MATERIALS AND METHODS
2.1 Materials The NinaPro database, which consists of a
huge number of EMG dataset for multiple hand movements is used in this work [18], [19]. NinaPro database is a publicly accessible EMG database that has previously been employed for EMG pattern recognition studies [20], [21]. The NinaPro Database 3 (DB3) and 4 (DB4) contain EMG signals recording from 11 amputees and 10 intact subjects, respectively. In DB3 and DB4, the exercise B including 8 isometric and isotonic hand configurations and 9 basic movement of wrist are used in this work. Table 1 outlines the hand movement tasks of exercise B. In the experiment, each movement was repeated for six times with 3 seconds resting state in between. There are 12 electrodes were used and sampled at the rate of 2000 Hz with the resolution of 16 bits. The placement of electrode was described as follow: Electrode 1 to 8 were equally placed around the forearm at the height of the radio-humeral joint. Electrode 9 and 10 were placed on the main activity spot of flexor digitorum superficialis and extensor digitorum superficialis. Finally, electrode 11 and 12 were fixed at the main activity spot of biceps brachii and triceps brachii. The acquired EMG signals were then filtered by a Hampel filter to prevent the 50 Hz power line interference. Note that all resting states are removed before further processing.
Table 1: List of hand movement task [18].
Index Hand Movement 1 Thumb up 2 Extension of index, middle and flexion of
others 3 Flexion of ring, little and extension of
others 4 Thumb opposing base of little finger 5 Abduction of all fingers 6 Fingers flex together in fist 7 Pointing index 8 Adduction of extend fingers 9 Wrist supination (axis: middle finger) 10 Wrist pronation (axis: middle finger) 11 Wrist supination (axis: little finger) 12 Wrist pronation (axis: little finger) 13 Wrist flexion 14 Wrist extension 15 Wrist radial deviation 16 Wrist ulnar deviation 17 Wrist extension with closed hand
Figure 1 presents the flow diagram of the
Journal of Theoretical and Applied Information Technology 31st May 2018. Vol.96. No 10
© 2005 – ongoing JATIT & LLS
ISSN: 1992-8645 www.jatit.org E-ISSN: 1817-3195
3038
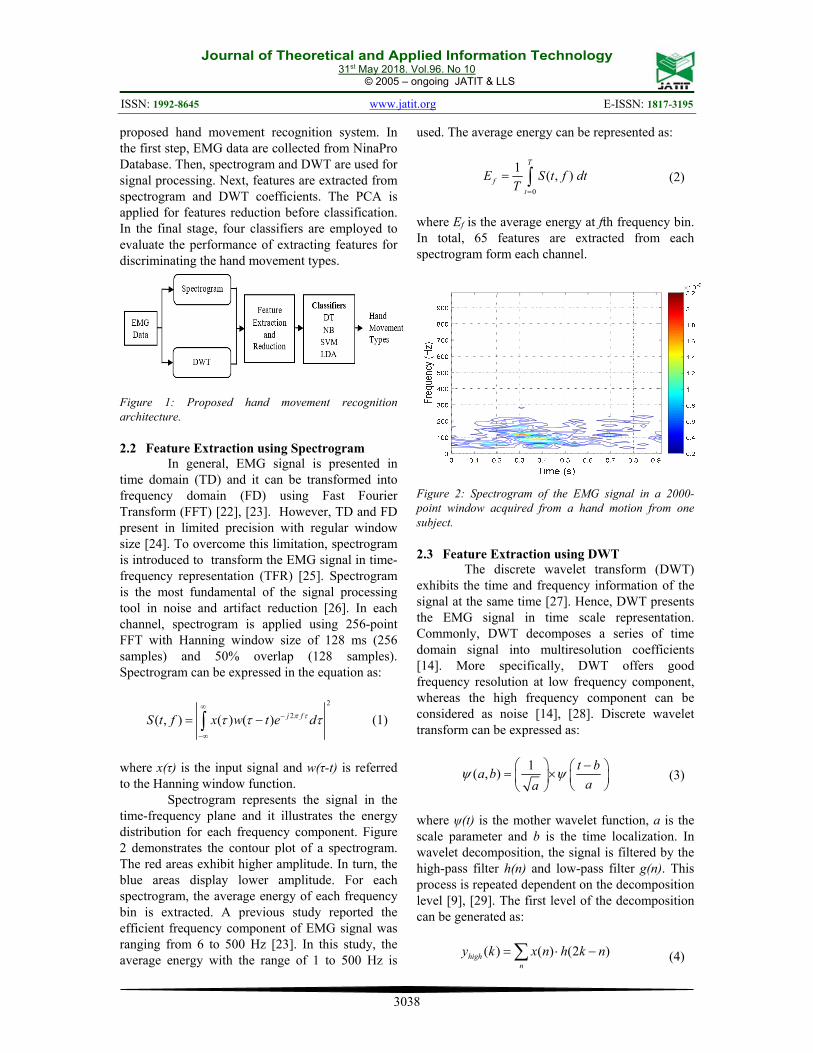
proposed hand movement recognition system. In the first step, EMG data are collected from NinaPro Database. Then, spectrogram and DWT are used for signal processing. Next, features are extracted from spectrogram and DWT coefficients. The PCA is applied for features reduction before classification. In the final stage, four classifiers are employed to evaluate the performance of extracting features for discriminating the hand movement types.
Figure 1: Proposed hand movement recognition architecture. 2.2 Feature Extraction using Spectrogram
In general, EMG signal is presented in time domain (TD) and it can be transformed into frequency domain (FD) using Fast Fourier Transform (FFT) [22], [23]. However, TD and FD present in limited precision with regular window size [24]. To overcome this limitation, spectrogram is introduced to transform the EMG signal in time-frequency representation (TFR) [25]. Spectrogram is the most fundamental of the signal processing tool in noise and artifact reduction [26]. In each channel, spectrogram is applied using 256-point FFT with Hanning window size of 128 ms (256 samples) and 50% overlap (128 samples). Spectrogram can be expressed in the equation as:
2
2( , ) ( ) ( ) j fS t f x w t e d
(1)
where x(τ) is the input signal and w(τ-t) is referred to the Hanning window function.
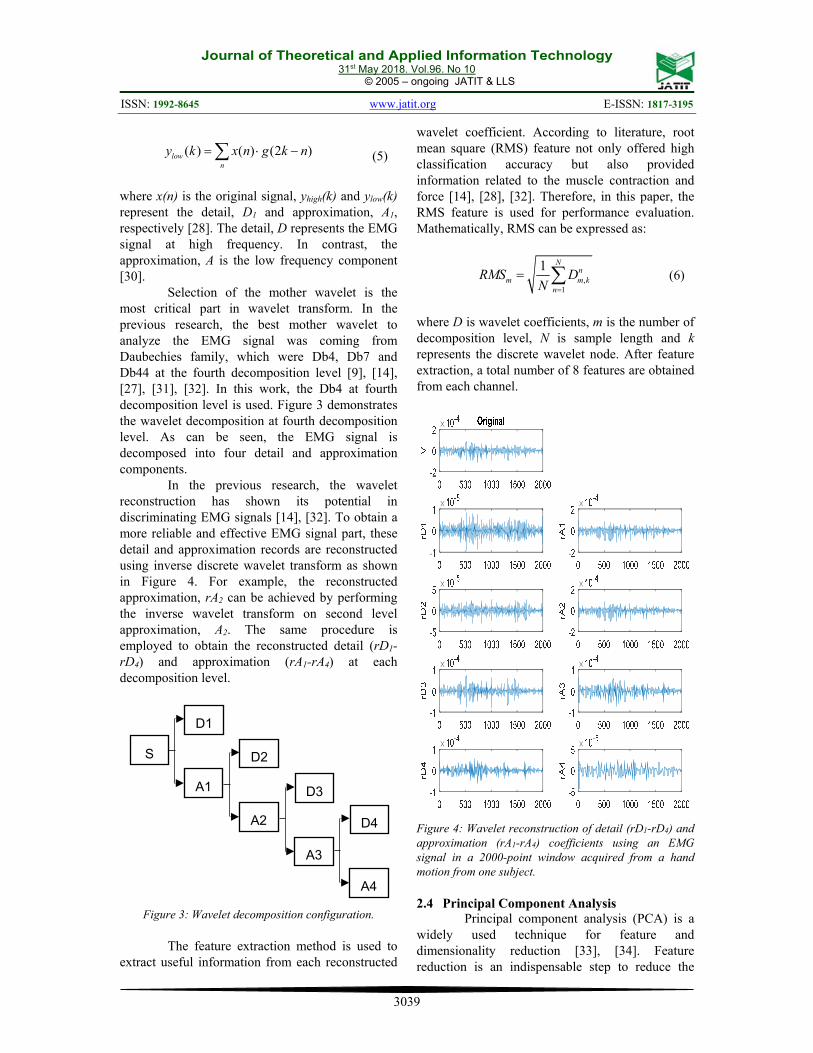
Spectrogram represents the signal in the time-frequency plane and it illustrates the energy distribution for each frequency component. Figure 2 demonstrates the contour plot of a spectrogram. The red areas exhibit higher amplitude. In turn, the blue areas display lower amplitude. For each spectrogram, the average energy of each frequency bin is extracted. A previous study reported the efficient frequency component of EMG signal was ranging from 6 to 500 Hz [23]. In this study, the average energy with the range of 1 to 500 Hz is
used. The average energy can be represented as:
0
1( , )
T
f
t
E S t f dtT
(2)
where Ef is the average energy at fth frequency bin. In total, 65 features are extracted from each spectrogram form each channel.
Figure 2: Spectrogram of the EMG signal in a 2000-point window acquired from a hand motion from one subject. 2.3 Feature Extraction using DWT
The discrete wavelet transform (DWT) exhibits the time and frequency information of the signal at the same time [27]. Hence, DWT presents the EMG signal in time scale representation. Commonly, DWT decomposes a series of time domain signal into multiresolution coefficients [14]. More specifically, DWT offers good frequency resolution at low frequency component, whereas the high frequency component can be considered as noise [14], [28]. Discrete wavelet transform can be expressed as:
1( , )
t ba b
aa
(3)
where ψ(t) is the mother wavelet function, a is the scale parameter and b is the time localization. In wavelet decomposition, the signal is filtered by the high-pass filter h(n) and low-pass filter g(n). This process is repeated dependent on the decomposition level [9], [29]. The first level of the decomposition can be generated as:
( ) ( ) (2 )highn
y k x n h k n (4)
Journal of Theoretical and Applied Information Technology 31st May 2018. Vol.96. No 10
© 2005 – ongoing JATIT & LLS
ISSN: 1992-8645 www.jatit.org E-ISSN: 1817-3195
3039
( ) ( ) (2 )lown
y k x n g k n (5)
where x(n) is the original signal, yhigh(k) and ylow(k) represent the detail, D1 and approximation, A1, respectively [28]. The detail, D represents the EMG signal at high frequency. In contrast, the approximation, A is the low frequency component [30].
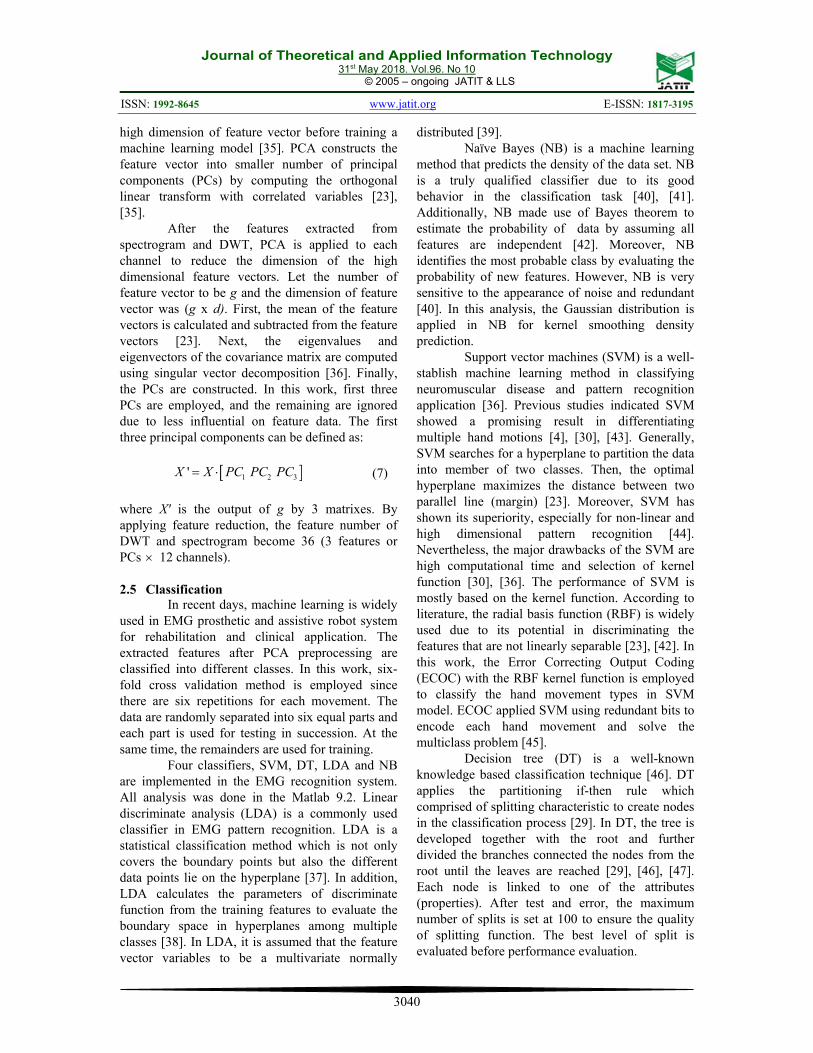
Selection of the mother wavelet is the most critical part in wavelet transform. In the previous research, the best mother wavelet to analyze the EMG signal was coming from Daubechies family, which were Db4, Db7 and Db44 at the fourth decomposition level [9], [14], [27], [31], [32]. In this work, the Db4 at fourth decomposition level is used. Figure 3 demonstrates the wavelet decomposition at fourth decomposition level. As can be seen, the EMG signal is decomposed into four detail and approximation components.
In the previous research, the wavelet reconstruction has shown its potential in discriminating EMG signals [14], [32]. To obtain a more reliable and effective EMG signal part, these detail and approximation records are reconstructed using inverse discrete wavelet transform as shown in Figure 4. For example, the reconstructed approximation, rA2 can be achieved by performing the inverse wavelet transform on second level approximation, A2. The same procedure is employed to obtain the reconstructed detail (rD1-rD4) and approximation (rA1-rA4) at each decomposition level.
Figure 3: Wavelet decomposition configuration.
The feature extraction method is used to
extract useful information from each reconstructed
wavelet coefficient. According to literature, root mean square (RMS) feature not only offered high classification accuracy but also provided information related to the muscle contraction and force [14], [28], [32]. Therefore, in this paper, the RMS feature is used for performance evaluation. Mathematically, RMS can be expressed as:
,1
1 Nn
m m kn
RMS DN
(6)
where D is wavelet coefficients, m is the number of decomposition level, N is sample length and k represents the discrete wavelet node. After feature extraction, a total number of 8 features are obtained from each channel.
Figure 4: Wavelet reconstruction of detail (rD1-rD4) and approximation (rA1-rA4) coefficients using an EMG signal in a 2000-point window acquired from a hand motion from one subject. 2.4 Principal Component Analysis
Principal component analysis (PCA) is a widely used technique for feature and dimensionality reduction [33], [34]. Feature reduction is an indispensable step to reduce the
D1
A1
S D2
A2
D3
A3
D4
A4
Journal of Theoretical and Applied Information Technology 31st May 2018. Vol.96. No 10
© 2005 – ongoing JATIT & LLS
ISSN: 1992-8645 www.jatit.org E-ISSN: 1817-3195
3040
high dimension of feature vector before training a machine learning model [35]. PCA constructs the feature vector into smaller number of principal components (PCs) by computing the orthogonal linear transform with correlated variables [23], [35].
After the features extracted from spectrogram and DWT, PCA is applied to each channel to reduce the dimension of the high dimensional feature vectors. Let the number of feature vector to be g and the dimension of feature vector was (g x d). First, the mean of the feature vectors is calculated and subtracted from the feature vectors [23]. Next, the eigenvalues and eigenvectors of the covariance matrix are computed using singular vector decomposition [36]. Finally, the PCs are constructed. In this work, first three PCs are employed, and the remaining are ignored due to less influential on feature data. The first three principal components can be defined as:
1 2 3'X X PC PC PC (7)
where Xʹ is the output of g by 3 matrixes. By applying feature reduction, the feature number of DWT and spectrogram become 36 (3 features or PCs 12 channels). 2.5 Classification
In recent days, machine learning is widely used in EMG prosthetic and assistive robot system for rehabilitation and clinical application. The extracted features after PCA preprocessing are classified into different classes. In this work, six-fold cross validation method is employed since there are six repetitions for each movement. The data are randomly separated into six equal parts and each part is used for testing in succession. At the same time, the remainders are used for training.
Four classifiers, SVM, DT, LDA and NB are implemented in the EMG recognition system. All analysis was done in the Matlab 9.2. Linear discriminate analysis (LDA) is a commonly used classifier in EMG pattern recognition. LDA is a statistical classification method which is not only covers the boundary points but also the different data points lie on the hyperplane [37]. In addition, LDA calculates the parameters of discriminate function from the training features to evaluate the boundary space in hyperplanes among multiple classes [38]. In LDA, it is assumed that the feature vector variables to be a multivariate normally
distributed [39]. Naïve Bayes (NB) is a machine learning
method that predicts the density of the data set. NB is a truly qualified classifier due to its good behavior in the classification task [40], [41]. Additionally, NB made use of Bayes theorem to estimate the probability of data by assuming all features are independent [42]. Moreover, NB identifies the most probable class by evaluating the probability of new features. However, NB is very sensitive to the appearance of noise and redundant [40]. In this analysis, the Gaussian distribution is applied in NB for kernel smoothing density prediction.
Support vector machines (SVM) is a well-stablish machine learning method in classifying neuromuscular disease and pattern recognition application [36]. Previous studies indicated SVM showed a promising result in differentiating multiple hand motions [4], [30], [43]. Generally, SVM searches for a hyperplane to partition the data into member of two classes. Then, the optimal hyperplane maximizes the distance between two parallel line (margin) [23]. Moreover, SVM has shown its superiority, especially for non-linear and high dimensional pattern recognition [44]. Nevertheless, the major drawbacks of the SVM are high computational time and selection of kernel function [30], [36]. The performance of SVM is mostly based on the kernel function. According to literature, the radial basis function (RBF) is widely used due to its potential in discriminating the features that are not linearly separable [23], [42]. In this work, the Error Correcting Output Coding (ECOC) with the RBF kernel function is employed to classify the hand movement types in SVM model. ECOC applied SVM using redundant bits to encode each hand movement and solve the multiclass problem [45].
Decision tree (DT) is a well-known knowledge based classification technique [46]. DT applies the partitioning if-then rule which comprised of splitting characteristic to create nodes in the classification process [29]. In DT, the tree is developed together with the root and further divided the branches connected the nodes from the root until the leaves are reached [29], [46], [47]. Each node is linked to one of the attributes (properties). After test and error, the maximum number of splits is set at 100 to ensure the quality of splitting function. The best level of split is evaluated before performance evaluation.
Journal of Theoretical and Applied Information Technology 31st May 2018. Vol.96. No 10
© 2005 – ongoing JATIT & LLS
ISSN: 1992-8645 www.jatit.org E-ISSN: 1817-3195
3041
3. RESULT AND DISCUSSION
In this section, the experimental results are clearly presented. For the first part of the experiment, the performance of DWT and spectrogram of intact and amputee subjects are evaluated and compared. Table 2 and 3 summarize the classification accuracy for all ten intact subjects. By using spectrogram feature set and SVM, majority of the subject achieves classification accuracy of above 90% except for subject 2 and 3. In contrast, high classification accuracy above 90% is obtained for nine subjects with DWT feature set.
Across all ten intact subjects, Friedman test is applied to measure the performance of four different classifiers. The results show that there is a statistical significant difference in the classification accuracy of SVM versus DT (p < 0.05), SVM versus NB (p < 0.05), DT versus LDA (p < 0.05) and DT versus NB (p < 0.05) in both DWT and spectrogram feature sets. However, no statistical significant can be found when SVM versus LDA (p = 0.7290) and NB versus LDA (p = 0.5271) for DWT and spectrogram feature set, respectively.
Table 2: Classification accuracy of four different classifiers of intact subjects for DWT feature set.
Subject Classifiers
DT (%) NB (%) SVM (%) LDA (%) 1 77.45 87.25 97.06 98.04 2 60.78 90.20 96.08 97.06 3 72.55 89.22 89.22 89.22 4 73.53 84.31 96.08 93.14 5 69.61 89.22 94.12 93.14 6 75.49 87.25 97.06 95.10 7 79.41 92.16 94.12 97.06 8 64.71 79.41 94.12 91.18 9 74.51 92.16 99.02 96.08 10 73.53 91.18 93.14 95.10 Mean 72.16 88.24 95.00 94.51 STD 5.702 3.949 2.713 2.819
Table 3: Classification accuracy of four different classifiers of intact subjects for spectrogram feature set.
Subject Classifiers
DT (%) NB (%) SVM (%) LDA (%) 1 66.67 87.25 92.16 91.18 2 63.73 83.33 89.22 80.39 3 74.51 82.35 87.25 77.45 4 74.51 88.24 92.16 84.31 5 76.47 81.37 90.20 86.27 6 78.43 79.41 91.18 84.31 7 80.39 88.23 94.12 87.25 8 71.57 84.31 90.20 81.37 9 66.67 84.31 91.18 93.14 10 73.53 83.33 90.20 80.39 Mean 72.65 84.22 90.78 84.61
STD 5.458 2.939 1.860 4.979
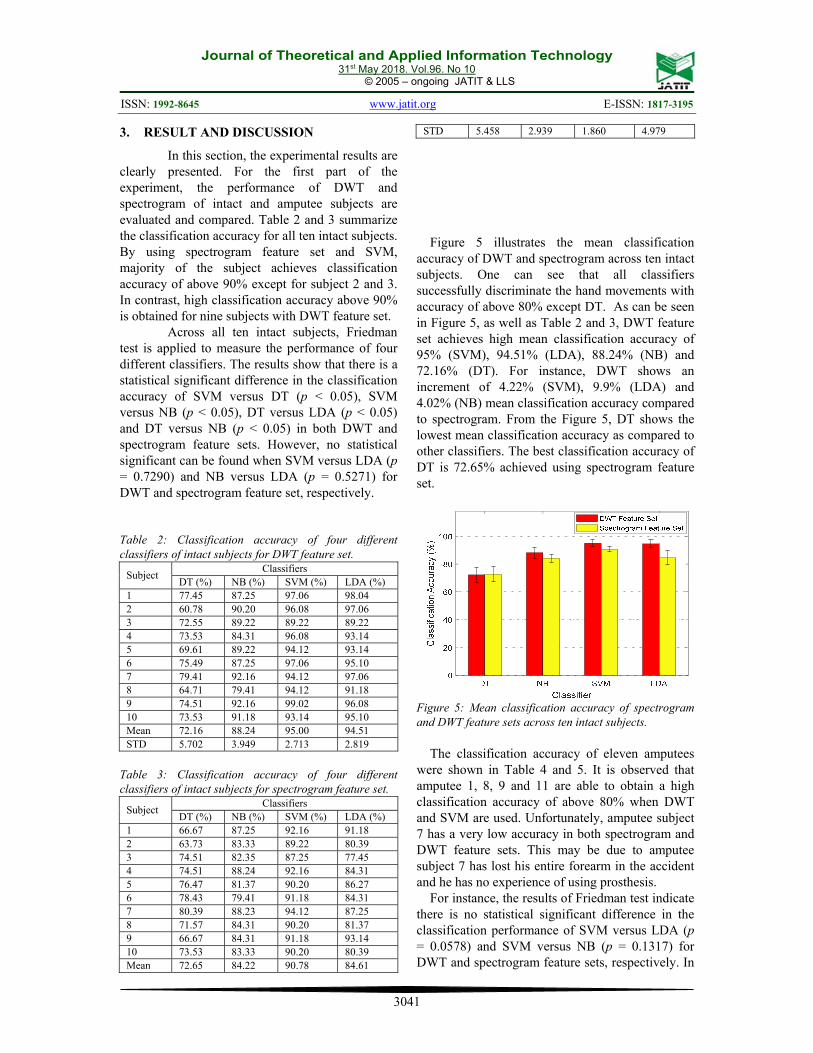
Figure 5 illustrates the mean classification accuracy of DWT and spectrogram across ten intact subjects. One can see that all classifiers successfully discriminate the hand movements with accuracy of above 80% except DT. As can be seen in Figure 5, as well as Table 2 and 3, DWT feature set achieves high mean classification accuracy of 95% (SVM), 94.51% (LDA), 88.24% (NB) and 72.16% (DT). For instance, DWT shows an increment of 4.22% (SVM), 9.9% (LDA) and 4.02% (NB) mean classification accuracy compared to spectrogram. From the Figure 5, DT shows the lowest mean classification accuracy as compared to other classifiers. The best classification accuracy of DT is 72.65% achieved using spectrogram feature set.
Figure 5: Mean classification accuracy of spectrogram and DWT feature sets across ten intact subjects.
The classification accuracy of eleven amputees were shown in Table 4 and 5. It is observed that amputee 1, 8, 9 and 11 are able to obtain a high classification accuracy of above 80% when DWT and SVM are used. Unfortunately, amputee subject 7 has a very low accuracy in both spectrogram and DWT feature sets. This may be due to amputee subject 7 has lost his entire forearm in the accident and he has no experience of using prosthesis.
For instance, the results of Friedman test indicate there is no statistical significant difference in the classification performance of SVM versus LDA (p = 0.0578) and SVM versus NB (p = 0.1317) for DWT and spectrogram feature sets, respectively. In
Journal of Theoretical and Applied Information Technology 31st May 2018. Vol.96. No 10
© 2005 – ongoing JATIT & LLS
ISSN: 1992-8645 www.jatit.org E-ISSN: 1817-3195
3042
contrast, the remaining tests show the statistical difference (p < 0.05) in both DWT and spectrogram feature sets.
Table 4: Classification accuracy of four different classifiers of amputee subjects for DWT feature set.
Amputee Classifiers
DT (%) NB (%) SVM (%) LDA (%) 1 64.71 80.39 84.31 80.39 2 38.24 58.82 74.51 70.59 3 33.33 58.82 70.59 69.61 4 38.24 57.84 71.57 73.53 5 35.29 49.02 56.86 50.98 6 62.75 71.57 75.49 73.53 7 22.55 29.41 40.20 30.39 8 67.65 79.41 88.24 80.39 9 65.69 88.24 90.20 87.25 10 27.45 45.10 44.12 51.96 11 60.78 81.37 88.24 88.24 Mean 46.97 63.64 71.30 68.81 STD 17.56 18.18 17.41 17.31
Table 5: Classification accuracy of four different classifiers of amputee subjects for spectrogram feature set.
Amputee Classifiers
DT (%) NB (%) SVM (%) LDA (%) 1 57.84 76.47 80.39 68.63 2 40.20 61.76 65.69 63.73 3 34.31 57.84 57.84 51.96 4 31.37 62.75 64.71 68.63 5 47.06 47.06 54.90 43.14 6 52.94 64.71 59.80 61.76 7 17.65 26.47 25.49 25.49 8 71.57 75.49 77.45 67.65 9 68.63 84.31 85.29 73.53 10 29.41 34.31 39.22 31.37 11 60.78 84.31 82.35 70.59 Mean 46.52 61.41 63.01 56.95 STD 17.67 18.51 18.43 16.91
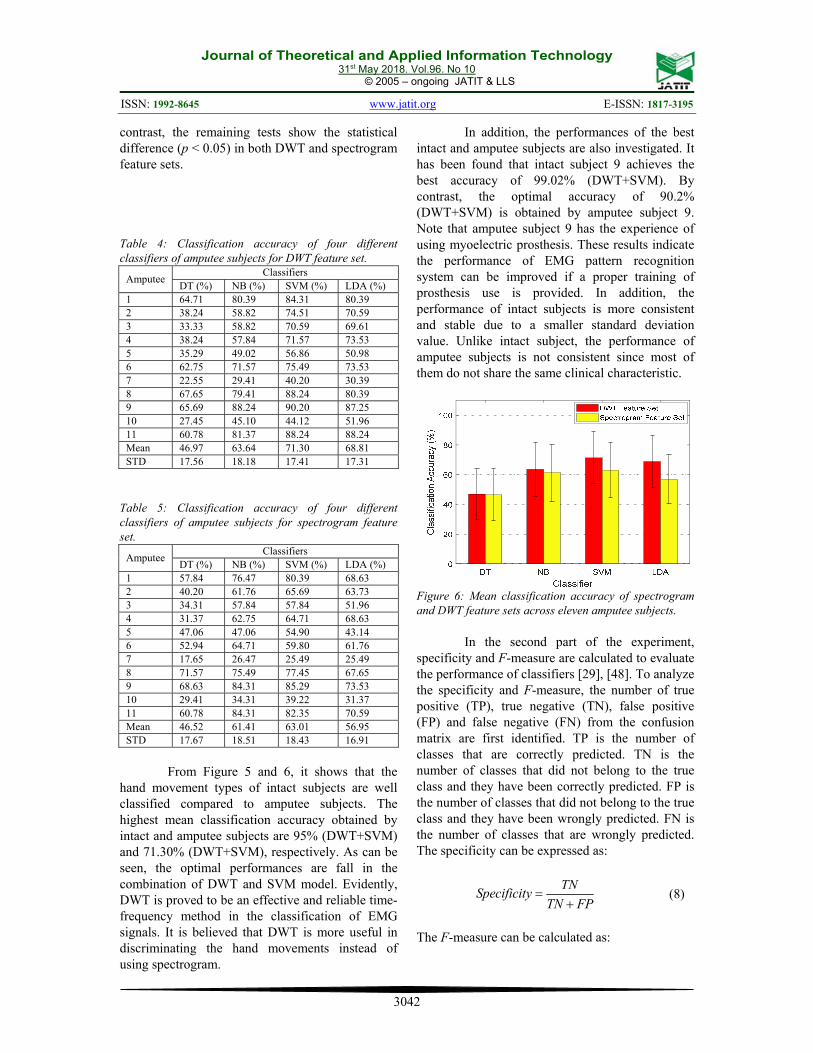
From Figure 5 and 6, it shows that the
hand movement types of intact subjects are well classified compared to amputee subjects. The highest mean classification accuracy obtained by intact and amputee subjects are 95% (DWT+SVM) and 71.30% (DWT+SVM), respectively. As can be seen, the optimal performances are fall in the combination of DWT and SVM model. Evidently, DWT is proved to be an effective and reliable time-frequency method in the classification of EMG signals. It is believed that DWT is more useful in discriminating the hand movements instead of using spectrogram.
In addition, the performances of the best intact and amputee subjects are also investigated. It has been found that intact subject 9 achieves the best accuracy of 99.02% (DWT+SVM). By contrast, the optimal accuracy of 90.2% (DWT+SVM) is obtained by amputee subject 9. Note that amputee subject 9 has the experience of using myoelectric prosthesis. These results indicate the performance of EMG pattern recognition system can be improved if a proper training of prosthesis use is provided. In addition, the performance of intact subjects is more consistent and stable due to a smaller standard deviation value. Unlike intact subject, the performance of amputee subjects is not consistent since most of them do not share the same clinical characteristic.
Figure 6: Mean classification accuracy of spectrogram and DWT feature sets across eleven amputee subjects.
In the second part of the experiment, specificity and F-measure are calculated to evaluate the performance of classifiers [29], [48]. To analyze the specificity and F-measure, the number of true positive (TP), true negative (TN), false positive (FP) and false negative (FN) from the confusion matrix are first identified. TP is the number of classes that are correctly predicted. TN is the number of classes that did not belong to the true class and they have been correctly predicted. FP is the number of classes that did not belong to the true class and they have been wrongly predicted. FN is the number of classes that are wrongly predicted. The specificity can be expressed as:
TNSpecificity
TN FP
(8)
The F-measure can be calculated as:
Journal of Theoretical and Applied Information Technology 31st May 2018. Vol.96. No 10
© 2005 – ongoing JATIT & LLS
ISSN: 1992-8645 www.jatit.org E-ISSN: 1817-3195
3043
2
2
TPF measure
TP FN FP
(9)
The specificity and F-measure are calculated as shown in Table 6 and 7. The results illustrate SVM outperforms other classifiers in both DWT and spectrogram feature sets. In terms of specificity, SVM obtains the highest specificity value, 0.9969 (DWT) and 0.9942 (spectrogram). Moreover, F-measure value indicates SVM is more appropriate for the classification of EMG signals. By contrast, DT is found to be a classifier with higher misclassification rate due to low specificity and F-measure values. It is clear evinced that DT has the worst performance. This might be due to the sensitivity of DT to a greater number of classes. Thus, DT does not classify the hand movements very well. On the other hand, it is worth noting the value of specificity is higher even for the amputee subjects. This would be a smaller number of FN obtained by each classifier. Overall, SVM is found to be the best classifier in this study. SVM not only good in classifying the hand movement types of intact subjects but also offers optimal performance in amputee subjects.
Table 6: Performance comparison of four classifiers for intact subjects.
Classifier
Statistical parameters DWT feature sets Spectrogram feature
sets Specificity F-
measure Specificity F-
measure DT 0.9826 0.7208 0.9829 0.7268 NB 0.9926 0.8826 0.9901 0.8431 SVM 0.9969 0.9498 0.9942 0.9078 LDA 0.9966 0.9452 0.9904 0.8473
Table 7: Performance comparison of four classifiers for amputee subjects.
Classifier
Statistical parameters DWT feature sets Spectrogram feature
sets Specificity F-
measure Specificity F-
measure DT 0.9669 0.4693 0.9666 0.4643 NB 0.9773 0.6382 0.9759 0.6159 SVM 0.9821 0.7125 0.9769 0.6307 LDA 0.9805 0.6888 0.9731 0.5709
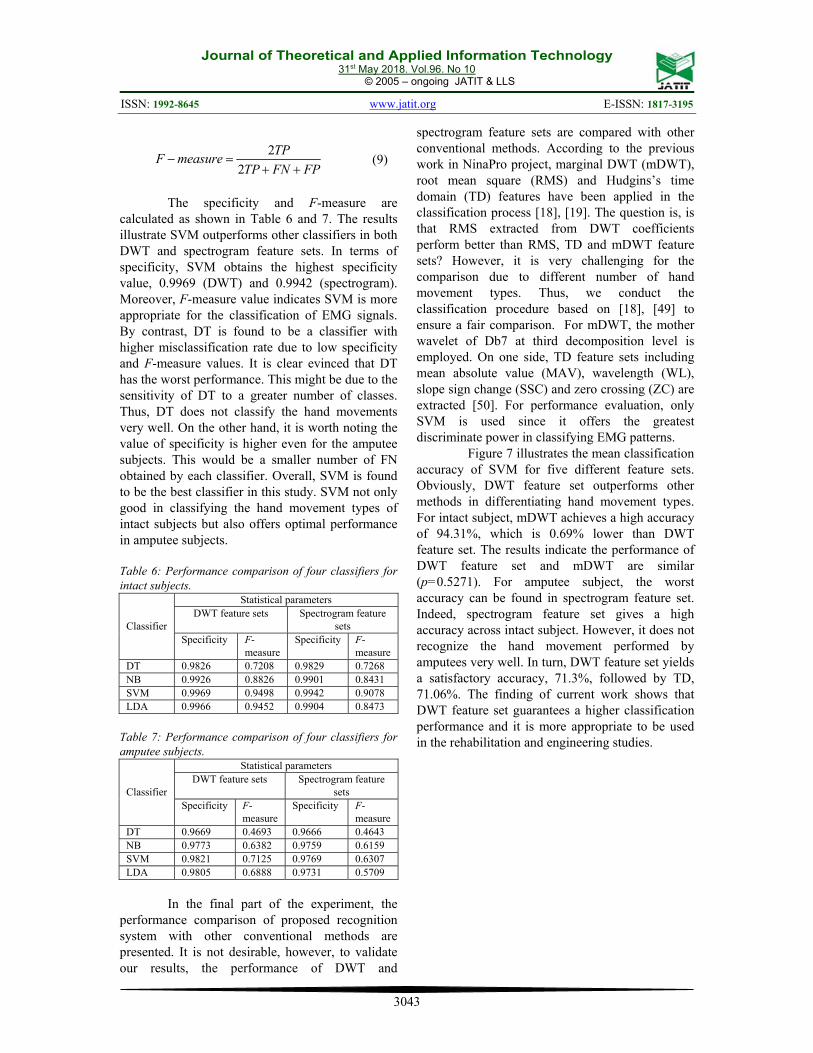
In the final part of the experiment, the
performance comparison of proposed recognition system with other conventional methods are presented. It is not desirable, however, to validate our results, the performance of DWT and
spectrogram feature sets are compared with other conventional methods. According to the previous work in NinaPro project, marginal DWT (mDWT), root mean square (RMS) and Hudgins’s time domain (TD) features have been applied in the classification process [18], [19]. The question is, is that RMS extracted from DWT coefficients perform better than RMS, TD and mDWT feature sets? However, it is very challenging for the comparison due to different number of hand movement types. Thus, we conduct the classification procedure based on [18], [49] to ensure a fair comparison. For mDWT, the mother wavelet of Db7 at third decomposition level is employed. On one side, TD feature sets including mean absolute value (MAV), wavelength (WL), slope sign change (SSC) and zero crossing (ZC) are extracted [50]. For performance evaluation, only SVM is used since it offers the greatest discriminate power in classifying EMG patterns.
Figure 7 illustrates the mean classification accuracy of SVM for five different feature sets. Obviously, DWT feature set outperforms other methods in differentiating hand movement types. For intact subject, mDWT achieves a high accuracy of 94.31%, which is 0.69% lower than DWT feature set. The results indicate the performance of DWT feature set and mDWT are similar (p=0.5271). For amputee subject, the worst accuracy can be found in spectrogram feature set. Indeed, spectrogram feature set gives a high accuracy across intact subject. However, it does not recognize the hand movement performed by amputees very well. In turn, DWT feature set yields a satisfactory accuracy, 71.3%, followed by TD, 71.06%. The finding of current work shows that DWT feature set guarantees a higher classification performance and it is more appropriate to be used in the rehabilitation and engineering studies.
Journal of Theoretical and Applied Information Technology 31st May 2018. Vol.96. No 10
© 2005 – ongoing JATIT & LLS
ISSN: 1992-8645 www.jatit.org E-ISSN: 1817-3195
3044
Figure 7: Mean classification accuracy of SVM for five different feature sets. 4. CONCLUSION
In the current study, the performance of discrete wavelet transform, and spectrogram were compared. The features were extracted from the wavelet and spectrogram coefficients. The PCA was then applied to reduce the high dimension feature vectors into principal components and the first three PCs were fed into the classifiers for classification. By applying SVM, DWT feature set obtained the highest classification accuracy of 95% and 71.3% for intact and amputee subjects, respectively. Evidently, DWT achieved high classification accuracy and it is also showed an increment in specificity and F-measure value. The results showed that DWT not only outperformed spectrogram in classifying large number of hand movements, but also worked better on amputee subjects. Moreover, it has been found that DWT feature set guaranteed a better performance compared to other conventional methods. Therefore, it can be mentioned that DWT is more useful in the rehabilitation and engineering application.
ACKNOWLEDGEMENT The authors would like to thank the Universiti Teknikal Malaysia Melaka (UTeM), Skim Zamalah UTeM, Rehabilitation Engineering & Assistive Technology (REAT) research group under Center of Robotics & Industrial Automation (CeRIA) and Ministry of Higher Education Malaysia (MOHE) for supporting this work under grant PJP/1/2017/FKEKK/H19/S01526.
REFRENCES: [1] A. Z. Che Daud, M. K. Yau, F. Barnett, J.
Judd, R. E. Jones, and R. F. Muhammad Nawawi, “Integration of occupation based intervention in hand injury rehabilitation: A Randomized Controlled Trial”, Journal of hand therapy, vol. 29, no. 1, 2016, pp. 30–40.
[2] A. J. Koestler, “Psychological Perspective on Hand Injury and Pain”, Journal of hand therapy, vol. 23, no. 2, 2010, pp. 199–211.
[3] C. Brogårdh, U.-B. Flansbjer, H. Carlsson, and J. Lexell, “Intra-rater Reliability of Arm and Hand Muscle Strength Measurements in Persons With Late Effects of Polio”, PM&R, vol. 7, no. 10, 2015, pp. 1035–1041.
[4] F. Riillo et al., “Optimization of EMG-based hand gesture recognition: Supervised vs. unsupervised data preprocessing on healthy subjects and transradial amputees”, Biomedical Signal Process and Control, vol. 14, 2014, pp. 117–125.
[5] Z. Ju, G. Ouyang, M. Wilamowska-Korsak, and H. Liu, “Surface EMG Based Hand Manipulation Identification Via Nonlinear Feature Extraction and Classification,” IEEE Sensor Journal, vol. 13, no. 9, 2013, pp. 3302–3311.
[6] X. L. Hu, K. Y. Tong, X. J. Wei, W. Rong, E. A. Susanto, and S. K. Ho, “The effects of post-stroke upper-limb training with an electromyography (EMG)-driven hand robot”, Journal of Electromyography and Kinesiology, vol. 23, no. 5, 2013, pp. 1065–1074.
[7] Y. Ning and Y. Zhang, “A new approach for multi-channel surface EMG signal simulation”, Biomedical Engineering Letters, vol. 7, no. 1, 2017, pp. 45–53.
[8] S. Thongpanja, A. Phinyomark, F. Quaine, Y. Laurillau, C. Limsakul, and P. Phukpattaranont, “Probability Density Functions of Stationary Surface EMG Signals in Noisy Environments”, IEEE Transactions on Instrumentation and Measurement, vol. 65, no. 7, 2016, pp. 1547–1557.
[9] R. H. Chowdhury, M. B. I. Reaz, M. A. B. M. Ali, A. A. A. Bakar, K. Chellappan, and T. G. Chang, “Surface electromyography signal processing and classification techniques”, Sensors, vol. 13, no. 9, 2013, pp. 12431–12466.
[10] A. C. Sy, N. T. Bugtai, A. D. Domingo, S. Y. M. V. Liang, and M. L. R. Santos, “Effects of movement velocity, acceleration and initial degree of muscle flexion on bicep EMG
Journal of Theoretical and Applied Information Technology 31st May 2018. Vol.96. No 10
© 2005 – ongoing JATIT & LLS
ISSN: 1992-8645 www.jatit.org E-ISSN: 1817-3195
3045
signal amplitude”, in 2015 International Conference on Humanoid, Nanotechnology, Information Technology, Communication and Control, Environment and Management (HNICEM), 2015, pp. 1–6.
[11] D. Tkach, H. Huang, and T. A. Kuiken, “Study of stability of time-domain features for electromyographic pattern recognition”, Journal of Neuroengineering and Rehabilitation, vol. 7, 2010, p. 21.
[12] X. Zhang and P. Zhou, “High-Density Myoelectric Pattern Recognition Toward Improved Stroke Rehabilitation”, IEEE Transaction Biomedical Engineering, vol. 59, no. 6, 2012, pp. 1649–1657.
[13] D. Joshi, B. H. Nakamura, and M. E. Hahn, “High energy spectrogram with integrated prior knowledge for EMG-based locomotion classification”, Medical Engineering and Physics, vol. 37, no. 5, 2015, pp. 518–524.
[14] A. Phinyomark, A. Nuidod, P. Phukpattaranont, and C. Limsakul, “Feature Extraction and Reduction of Wavelet Transform Coefficients for EMG Pattern Classification”, Elektronika ir Elektrotechnika, vol. 122, no. 6, 2012, pp. 27–32.
[15] J. Rafiee, M. A. Rafiee, N. Prause, and M. P. Schoen, “Wavelet basis functions in biomedical signal processing”, Expert Systems with Applications, vol. 38, no. 5, 2011, pp. 6190–6201.
[16] M. R. Canal, “Comparison of Wavelet and Short Time Fourier Transform Methods in the Analysis of EMG Signals”, Journal of Medical Systems, vol. 34, no. 1, 2010, pp. 91–94.
[17] K. Englehart, B. Hudgins, P. A. Parker, and M. Stevenson, “Classification of the myoelectric signal using time-frequency based representations”, Medical Engineering and Physics, vol. 21, no. 6, 1999, pp. 431–438.
[18] M. Atzori et al., “Electromyography data for non-invasive naturally-controlled robotic hand prostheses”, Scientific Data, vol. 1, 2014, pp. 140053.
[19] S. Pizzolato, L. Tagliapietra, M. Cognolato, M. Reggiani, H. Müller, and M. Atzori, “Comparison of six electromyography acquisition setups on hand movement classification tasks”, PLOS ONE, vol. 12, no. 10, 2017, pp. e0186132.
[20] X. Zhai, B. Jelfs, R. H. M. Chan, and C. Tin, “Self-Recalibrating Surface EMG Pattern
Recognition for Neuroprosthesis Control Based on Convolutional Neural Network”, Frontiers in Neuroscience, vol. 11, 2017.
[21] A. Krasoulis, S. Vijayakumar, and K. Nazarpour, “Evaluation of regression methods for the continuous decoding of finger movement from surface EMG and accelerometry”, Proceeding of IEEE/EMBS on Neural Engineering (NER), France, April 22-24, 2015, pp. 631–634.
[22] A. Phinyomark, P. Phukpattaranont, and C. Limsakul, “Feature reduction and selection for EMG signal classification”, Expert Systems with Applications, vol. 39, no. 8, 2012, pp. 7420–7431.
[23] A.-C. Tsai, J.-J. Luh, and T.-T. Lin, “A novel STFT-ranking feature of multi-channel EMG for motion pattern recognition”, Expert Systems with Applications, vol. 42, no. 7, 2015, pp. 3327–3341.
[24] E. F. Shair, S. A. Ahmad, M. H. Marhaban, S. T. Mohd, and A. R. Abdullah, “EMG Processing Based Measures of Fatigue Assessment during Manual Lifting”, BioMedical Research International, vol. 2017, 2017, pp. 3937254–3937254.
[25] T. N. S. T.Zawawi, A. R. Abdullah, E. F. Shair, and S. M. Saleh, “Performance Comparison of EMG Signal Analysis for Manual Lifting using Spectrogram”, Journal of Telecommunication, Electronic and Computer Engineering, vol. 8, no. 7, 2016, pp. 29–34.
[26] J. L. Roux, H. Kameoka, N. Ono, and S. Sagayama, “Fast signal reconstruction from magnitude stft spectrogram based on spectrogram consistency”, Proceeding of Digital Audio Effects DAFx ’10, September 6-10, vol. 10, 2010.
[27] A. Subasi, “Classification of EMG signals using combined features and soft computing techniques”, Applied Soft Computing, vol. 12, no. 8, 2012, pp. 2188–2198.
[28] A. B. M. S. U. Doulah, S. A. Fattah, W. P. Zhu, and M. O. Ahmad, “Wavelet Domain Feature Extraction Scheme Based on Dominant Motor Unit Action Potential of EMG Signal for Neuromuscular Disease Classification”, IEEE Transaction Biomedical Circuits and Systems, vol. 8, no. 2, 2014, pp. 155–164.
[29] E. Gokgoz and A. Subasi, “Comparison of decision tree algorithms for EMG signal classification using DWT”, Biomedical
Journal of Theoretical and Applied Information Technology 31st May 2018. Vol.96. No 10
© 2005 – ongoing JATIT & LLS
ISSN: 1992-8645 www.jatit.org E-ISSN: 1817-3195
3046
Signal Processing and Control, vol. 18, 2015, pp. 138–144.
[30] F. A. Omari, J. Hui, C. Mei, and G. Liu, “Pattern Recognition of Eight Hand Motions Using Feature Extraction of Forearm EMG Signal”, Proceedings of the National Academy of Sciences, India Section A: Physical Sciences, vol. 84, no. 3, 2014, pp. 473–480.
[31] P. K. Ray, S. R. Mohanty, and N. Kishor, “Disturbance detection in grid-connected distributed generation system using wavelet and S-transform”, Electrical Power Systems Research, vol. 81, no. 3, 2011, pp. 805–819.
[32] A. Phinyomark, C. Limsakul, and P. Phukpattaranont, “Application of Wavelet Analysis in EMG Feature Extraction for Pattern Classification”, Measurement Science Review, vol. 11, no. 2, 2011, pp. 45–52.
[33] A. Subasi and M. Ismail Gursoy, “EEG signal classification using PCA, ICA, LDA and support vector machines”, Expert Systems with Applications, vol. 37, no. 12, 2010, pp. 8659–8666.
[34] M. Iwai and K. Kobayashi, “Dimensional contraction by principal component analysis as preprocessing for independent component analysis at MCG”, Biomedical Engineering Letters, vol. 7, no. 3, 2017, pp. 221–227.
[35] B. Mwangi, T. S. Tian, and J. C. Soares, “A Review of Feature Reduction Techniques in Neuroimaging”, Neuroinformatics, vol. 12, no. 2, 2014, pp. 229–244.
[36] J. Yousefi and A. Hamilton-Wright, “Characterizing EMG data using machine-learning tools,” Computers Biology and Medicine, vol. 51, 2014, pp. 1–13.
[37] G. Venugopal, M. Navaneethakrishna, and S. Ramakrishnan, “Extraction and analysis of multiple time window features associated with muscle fatigue conditions using sEMG signals”, Expert Systems with Applications, vol. 41, no. 6, 2014, pp. 2652–2659.
[38] A. Alkan and M. Günay, “Identification of EMG signals using discriminant analysis and SVM classifier”, Expert Systems with Applications, vol. 39, no. 1, 2012, pp. 44–47.
[39] K. S. Kim, H. H. Choi, C. S. Moon, and C. W. Mun, “Comparison of k-nearest neighbor, quadratic discriminant and linear discriminant analysis in classification of electromyogram signals based on the wrist-motion directions”, Current Applied Physics, vol. 11, no. 3, 2011, pp. 740–745.
[40] P. Bermejo, J. A. Gámez, and J. M. Puerta, “Speeding up incremental wrapper feature subset selection with Naive Bayes classifier”, Knowledge-Based Systems, vol. 55, 2014, pp. 140–147.
[41] M. Mazher, A. A. Aziz, A. S. Malik, and H. U. Amin, “An EEG-Based Cognitive Load Assessment in Multimedia Learning Using Feature Extraction and Partial Directed Coherence”, IEEE Access, vol. 5, 2017, pp. 14819–14829.
[42] P. A. Karthick, D. M. Ghosh, and S. Ramakrishnan, “Surface Electromyography based muscle fatigue detection using high-resolution time-frequency methods and machine learning algorithms”, Computer Methods and Programs in Biomedicine, vol. 154, 2018, pp. 45–56.
[43] Y. Yoo, “On predicting epileptic seizures from intracranial electroencephalography”, Biomedical Engineering Letter, vol. 7, no. 1, 2017, pp. 1–5.
[44] H. Xu and G. Chen, “An intelligent fault identification method of rolling bearings based on LSSVM optimized by improved PSO”, Mechanical Systems and Signal Processing, vol. 35, no. 1, 2013, pp. 167–175.
[45] M. Hamedi, S.-H. Salleh, and A. M. Noor, “Facial neuromuscular signal classification by means of least square support vector machine for MuCI”, Applied Soft Computing, vol. 30, 2015, pp. 83–93.
[46] P. Geethanjali and K. K. Ray, “Identification of motion from multi-channel EMG signals for control of prosthetic hand”, Australasian Physical & Engineering Sciences in Medicine, vol. 34, no. 3, 2011, pp. 419–427.
[47] G. Purushothaman and K. K. Ray, “EMG based man–machine interaction—A pattern recognition research platform”, Robotics and Autonomous Systems, vol. 62, no. 6, 2014, pp. 864–870.
[48] E. Gokgoz and A. Subasi, “Effect of multiscale PCA de-noising on EMG signal classification for diagnosis of neuromuscular disorders”, Journal of Medical Systems, vol. 38, no. 4, 2014, pp. 31.
[49] M. Atzori, A. Gijsberts, B. Caputo, and H. Müller, “Natural control capabilities of robotic hands by hand amputated subjects”, Proceeding of the IEEE Engineering in Medicine and Biology Society, Chicago, August 26-30, 2014, pp. 4362–4365.
Journal of Theoretical and Applied Information Technology 31st May 2018. Vol.96. No 10
© 2005 – ongoing JATIT & LLS
ISSN: 1992-8645 www.jatit.org E-ISSN: 1817-3195
3047
[50] B. Hudgins, P. Parker, and R. N. Scott, “A new strategy for multifunction myoelectric control”, IEEE Transaction Biomedical Engineering, vol. 40, no. 1, 1993, pp. 82–94.


![INTERNATIONAL JOURNAL OF MATERIALS Volume … Malaysia Melaka (UTeM), Hang Tuah Jaya, 76100 Durian Tunggal, ... [22], servo-hydraulic [23], hydro [24], pneumatics [25] and piezoelectric](https://img.pdfslide.us/doc/110x75/5ae637027f8b9a08778cc21c/international-journal-of-materials-volume-malaysia-melaka-utem-hang-tuah.jpg)