Embed Size (px)
Citation preview

Journal of The Electrochemical Society, 160 (10) A1653-A1660 (2013) A16530013-4651/2013/160(10)/A1653/8/$31.00 © The Electrochemical Society
Supercapacitor Electrodes Produced through EvaporativeConsolidation of Graphene Oxide-Water-Ionic Liquid GelsMichael A. Pope,a Sibel Korkut,a,b Christian Punckt,a,b and Ilhan A. Aksaya,z
aDepartment of Chemical and Biological Engineering, Princeton University, Princeton, New Jersey 08544, USAbVorbeck Princeton Research Center, Vorbeck Materials Corporation, Monmouth Junction, New Jersey 08520, USA
We use colloidal gels of graphene oxide in a water-ethanol-ionic liquid solution to assemble graphene-ionic liquid laminated structuresfor use as electrodes in electrochemical double layer capacitors. Our process involves evaporation of water and ethanol yielding agraphene oxide/ionic liquid composite, followed by thermal reduction of the graphene oxide to electrically conducting functionalizedgraphene. This yields an electrode in which the ionic liquid serves not only as the working electrolyte but also as a spacer to separatethe graphene sheets and to increase their electrolyte-accessible surface area. Using this approach, we achieve an outstanding energydensity of 17.5 Wh/kg at a gravimetric capacitance of 156 F/g and 3 V operating voltage, due to a high effective density of the activeelectrode material of 0.46 g/cm2. By increasing the ionic liquid content and the degree of thermal reduction, we obtain electrodes thatretain >90% of their capacitance at a scan rate of 500 mV/s, illustrating that we can tailor the electrodes toward higher power densityif energy density is not the primary goal. The elimination of the electrolyte infiltration step from manufacturing makes this bottom-upassembly approach scalable and well-suited for combinations of potentially any graphene material with ionic liquid electrolytes.© 2013 The Electrochemical Society. [DOI: 10.1149/2.017310jes] All rights reserved.
Manuscript submitted May 21, 2013; revised manuscript received July 4, 2013. Published July 30, 2013.
Electrochemical double layer capacitors (EDLCs), also known asultracapacitors or supercapacitors, operate by accumulating chargewithin the electrochemical double layer at the electrode/electrolyteinterface.1 A typical EDLC consists of two electrodes which are im-bibed with electrolyte, separated by a porous, ion-permeable mem-brane, sandwiched between two typically metallic current collectors,and packaged in a hermetically sealed pouch or container. The energydensity E of such a device – specific to the entire device mass – isthe performance metric of practical interest1 (alternatively, volume-specific values2 can be reported). E depends on the gravimetric capac-itance CG of the dry (active) electrode material, the operating voltageU, and the mass fraction f of the active electrode material (typically∼30 wt% for commercially viable devices)2,3 accounting for the massof electrolyte, separator, current collectors and packaging:1,4
E = f/8CGU 2. [1]
In order to increase E, research is targeted toward increasing bothCG and U, but the impact of the mass fraction f is often neglected or notreported.2,5–8 Instead, the energy density is defined as E* = 1/8 CGU2
(often, and incorrectly E* = 1/2 CG U2 is used but this does not accountproperly for the 2-electrode configuration), which excludes the weightcontribution of device components other than the active electrode ma-terial. The relation between CG, U, and E* is illustrated in Figure 1,where we plot E* vs. CG for material/electrolyte combinations thatcan operate at voltages U between 1 and 4 V: High values of CG upto 1000 F/g can be achieved with materials such as RuO2,1 MnO2,9
or carbonaceous materials4,8,10–21 in water-based systems, since thesematerials are redox active in aqueous electrolytes, i.e., exhibit faradaicreactions akin to processes within batteries (pseudocapacitance). Inspite of these high CG values, however, E* remains low since aqueoussystems are not stable at U > ∼2 V.22 On the other hand, in order toachieve E* = 100 Wh/kg, an electrode material with CG = 200 F/gsuffices if the device can be operated at 4 V. High operating voltageshave been attained with organic electrolytes1 and, more recently, withionic liquids (ILs)23,24 which therefore are the electrolyte of choice forhigh energy density applications. ILs have been used in conjunctionwith carbonaceous electrodes such as activated carbons, carbide de-rived carbons (CDCs), or carbon aerogels, achieving stable operationand reaching up to E* = 50 Wh/kg at values of CG between 100 and200 F/g.3,5,7,8,12–14,20,25–29 Besides exploring electrolytes which are sta-ble at voltages in excess of 4 V, maximizing CG of the carbonaceouselectrodes is thus the route toward EDLCs with larger E.
CG is proportional to the surface area-specific double layer ca-pacitance (CDL) of the electrode material, its mass specific surface
zE-mail: [email protected]
area (SSA), and the fraction to which the SSA is accessible to theelectrolyte in the final electrode. Due to their exceptionally high the-oretical SSA (2630 m2/g), functionalized graphene sheets (FGSs),derived by the thermal reduction and exfoliation of graphite oxide(GO)30,31 or the chemical reduction of graphene oxide,32 are promis-ing candidates for high-performance electrode materials. In additionto high SSA, our recent work suggests that, due to the presence of alarge number of lattice defects and functional groups,30,31,33 the CDL
of the FGS/electrolyte interface (14–26 μF/cm2 in 0.5 M NaF)34 is notlimited by a low electronic density of states as in pristine graphene35,36
or carbon nanotubes (CNTs)37 (3–4 μF/cm2). At the same time, FGSsprovide electrical resistivities as low as 8 k�/sq.38,39 Combining FGSsand ILs therefore has the potential to yield materials with CG reach-ing 400 F/g (assuming CDL ≈ 20 μF/cm2 in IL electrolyte40 and anion-accessible SSA of 2000 m2/g).
However, obtaining a high ion-accessible surface area with FGSelectrodes has proven difficult in practice due to aggregation andrestacking of sheets during processing.41 A number of recent studiestherefore focused on processing and assembling FGSs into EDLCelectrodes in ways such that the ion-accessible surface area wasmaximized,3,6–8 yielding CG and E* as high as 276 F/g and 150 Wh/kg,respectively (see Figure 1 and Table I). These examples either involvethe use of spacers that act as inactive mass (“dead-weight”)7 or involvethe imbibition of excessive amounts of electrolyte.3,6,8 As a result, theeffective density of the active graphene material ρeff in the electrodesis low (see Table I); electrode mass is dominated by the mass of theimbibed electrolyte and, if present, the spacers. The value of ρeff de-termines the upper limit for the mass fraction f that can be achieved ifthe electrode material is used in a device: For a thick electrode, i.e.,neglecting the mass of charge collectors, membrane and packaging,f (in wt%) can be approximated as:
f ≈ 100ρeff · ρa
ρi · (ρa − ρeff ) + ρeff · ρa, [2]
where ρa and ρi denote the densities of the active electrode material andthe combined effective density of the inactive components includingthe electrolyte, respectively. Equation 2 was derived assuming no gasfilled voids are present in the material. Values for f derived from pub-lished data on FGS-based electrodes (Table I) range from 4 to 25 wt%.Values of E for these FGS-based electrodes (also reported in Table I)are in most cases smaller than those obtained, for example, with CDCelectrodes which, due to their denser packing, achieve high values of Edespite comparably low CG.42 To demonstrate this point, in Figure 1bwe show that the energy density drops substantially when f is con-sidered. Electrodes with the highest CG achieve the lowest E due toexcessive amounts of electrolyte used. Therefore, while FGSs exhibitsuperior gravimetric capacitance, the inability to pack them densely
ecsdl.org/site/terms_use address. Redistribution subject to ECS license or copyright; see 128.112.70.3Downloaded on 2013-07-31 to IP
A1654 Journal of The Electrochemical Society, 160 (10) A1653-A1660 (2013)
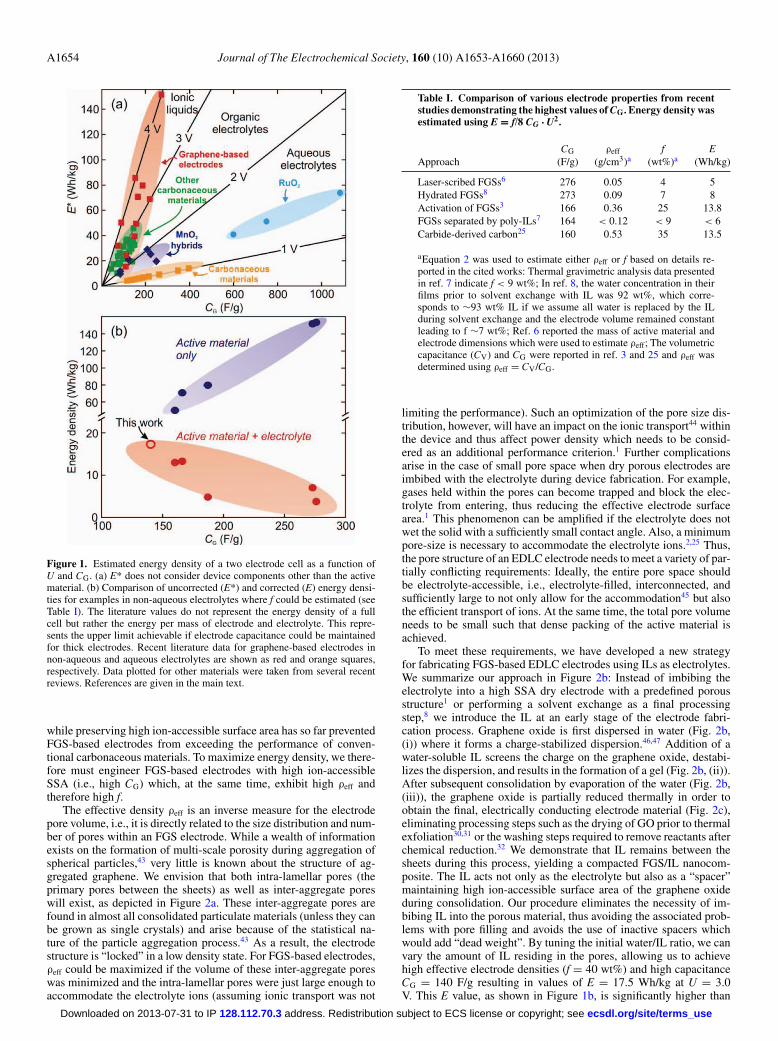
Figure 1. Estimated energy density of a two electrode cell as a function ofU and CG. (a) E* does not consider device components other than the activematerial. (b) Comparison of uncorrected (E*) and corrected (E) energy densi-ties for examples in non-aqueous electrolytes where f could be estimated (seeTable I). The literature values do not represent the energy density of a fullcell but rather the energy per mass of electrode and electrolyte. This repre-sents the upper limit achievable if electrode capacitance could be maintainedfor thick electrodes. Recent literature data for graphene-based electrodes innon-aqueous and aqueous electrolytes are shown as red and orange squares,respectively. Data plotted for other materials were taken from several recentreviews. References are given in the main text.
while preserving high ion-accessible surface area has so far preventedFGS-based electrodes from exceeding the performance of conven-tional carbonaceous materials. To maximize energy density, we there-fore must engineer FGS-based electrodes with high ion-accessibleSSA (i.e., high CG) which, at the same time, exhibit high ρeff andtherefore high f.
The effective density ρeff is an inverse measure for the electrodepore volume, i.e., it is directly related to the size distribution and num-ber of pores within an FGS electrode. While a wealth of informationexists on the formation of multi-scale porosity during aggregation ofspherical particles,43 very little is known about the structure of ag-gregated graphene. We envision that both intra-lamellar pores (theprimary pores between the sheets) as well as inter-aggregate poreswill exist, as depicted in Figure 2a. These inter-aggregate pores arefound in almost all consolidated particulate materials (unless they canbe grown as single crystals) and arise because of the statistical na-ture of the particle aggregation process.43 As a result, the electrodestructure is “locked” in a low density state. For FGS-based electrodes,ρeff could be maximized if the volume of these inter-aggregate poreswas minimized and the intra-lamellar pores were just large enough toaccommodate the electrolyte ions (assuming ionic transport was not
Table I. Comparison of various electrode properties from recentstudies demonstrating the highest values of CG. Energy density wasestimated using E = f/8 CG · U2.
CG ρeff f EApproach (F/g) (g/cm3)a (wt%)a (Wh/kg)
Laser-scribed FGSs6 276 0.05 4 5Hydrated FGSs8 273 0.09 7 8Activation of FGSs3 166 0.36 25 13.8FGSs separated by poly-ILs7 164 < 0.12 < 9 < 6Carbide-derived carbon25 160 0.53 35 13.5
aEquation 2 was used to estimate either ρeff or f based on details re-ported in the cited works: Thermal gravimetric analysis data presentedin ref. 7 indicate f < 9 wt%; In ref. 8, the water concentration in theirfilms prior to solvent exchange with IL was 92 wt%, which corre-sponds to ∼93 wt% IL if we assume all water is replaced by the ILduring solvent exchange and the electrode volume remained constantleading to f ∼7 wt%; Ref. 6 reported the mass of active material andelectrode dimensions which were used to estimate ρeff; The volumetriccapacitance (CV) and CG were reported in ref. 3 and 25 and ρeff wasdetermined using ρeff = CV/CG.
limiting the performance). Such an optimization of the pore size dis-tribution, however, will have an impact on the ionic transport44 withinthe device and thus affect power density which needs to be consid-ered as an additional performance criterion.1 Further complicationsarise in the case of small pore space when dry porous electrodes areimbibed with the electrolyte during device fabrication. For example,gases held within the pores can become trapped and block the elec-trolyte from entering, thus reducing the effective electrode surfacearea.1 This phenomenon can be amplified if the electrolyte does notwet the solid with a sufficiently small contact angle. Also, a minimumpore-size is necessary to accommodate the electrolyte ions.2,25 Thus,the pore structure of an EDLC electrode needs to meet a variety of par-tially conflicting requirements: Ideally, the entire pore space shouldbe electrolyte-accessible, i.e., electrolyte-filled, interconnected, andsufficiently large to not only allow for the accommodation45 but alsothe efficient transport of ions. At the same time, the total pore volumeneeds to be small such that dense packing of the active material isachieved.
To meet these requirements, we have developed a new strategyfor fabricating FGS-based EDLC electrodes using ILs as electrolytes.We summarize our approach in Figure 2b: Instead of imbibing theelectrolyte into a high SSA dry electrode with a predefined porousstructure1 or performing a solvent exchange as a final processingstep,8 we introduce the IL at an early stage of the electrode fabri-cation process. Graphene oxide is first dispersed in water (Fig. 2b,(i)) where it forms a charge-stabilized dispersion.46,47 Addition of awater-soluble IL screens the charge on the graphene oxide, destabi-lizes the dispersion, and results in the formation of a gel (Fig. 2b, (ii)).After subsequent consolidation by evaporation of the water (Fig. 2b,(iii)), the graphene oxide is partially reduced thermally in order toobtain the final, electrically conducting electrode material (Fig. 2c),eliminating processing steps such as the drying of GO prior to thermalexfoliation30,31 or the washing steps required to remove reactants afterchemical reduction.32 We demonstrate that IL remains between thesheets during this process, yielding a compacted FGS/IL nanocom-posite. The IL acts not only as the electrolyte but also as a “spacer”maintaining high ion-accessible surface area of the graphene oxideduring consolidation. Our procedure eliminates the necessity of im-bibing IL into the porous material, thus avoiding the associated prob-lems with pore filling and avoids the use of inactive spacers whichwould add “dead weight”. By tuning the initial water/IL ratio, we canvary the amount of IL residing in the pores, allowing us to achievehigh effective electrode densities (f = 40 wt%) and high capacitanceCG = 140 F/g resulting in values of E = 17.5 Wh/kg at U = 3.0V. This E value, as shown in Figure 1b, is significantly higher than
ecsdl.org/site/terms_use address. Redistribution subject to ECS license or copyright; see 128.112.70.3Downloaded on 2013-07-31 to IP

Journal of The Electrochemical Society, 160 (10) A1653-A1660 (2013) A1655
Figure 2. Comparison of conventional electrode fabrication approach with the strategy used in this work. (a) Conventional approach: Consolidation of grapheneby evaporative drying or filtration leads to partial restacking of the sheets and a distribution of intra-lamellar and inter-aggregate pores. The IL cannot access allpores either because they are too small, blocked, or the wetting properties are not ideal. (b) Our approach: Dispersion of graphene oxide in water (i) followed bythe addition of EMImBF4 (ii). When the water component is removed by evaporation (iii), the EMImBF4 remains between the sheets acting both as the workingelectrolyte and as a spacer, maintaining a high SSA. (c) In-situ thermal reduction: Schematics of the chemical structures of the involved materials (generated withAvogadro) are shown on the left. The graphene oxide structure is based on the Scholz-Boehm model33,65 for the sake of simplicity as the true structure of GO iscurrently debated. The FGS model illustrates the presence of lattice defects and oxygen-containing functional groups in the material.
all the energy densities reported in Table I, providing support for theimportance of the processing scheme we introduce in this paper. Fur-thermore, by variation of f through the IL content, we can tune ourelectrodes from high energy density to high power density behavior.
Experimental
Materials.— GO was produced according to a modified Hummersmethod.48 3 g of natural flake graphite (Asbury grade 3061) and 18 gof KMnO4 were added under stirring to 360 mL of H2SO4 and 40 mLof H3PO4. The resulting oxidation reaction was allowed to proceed at50◦C for approximately 16 h. The mixture was cooled to room tem-perature and subsequently added to approximately 400 g of ice. 6 mLof H2O2 was added to the suspension causing the slurry to turn frompurple/brown to bright yellow. The suspension was distributed intotwo 500 mL centrifuge tubes and centrifuged for 15 min at 1800 gusing an IEC Centra GP8R centrifuge (218A rotor). The supernatantwas discarded and the material was re-suspended in water. This wash-ing procedure was then repeated with 250 mL of HCl and againwith ethanol three to four times until elemental analysis by energydispersive X-ray spectroscopy (EDS) showed no change in residualchloride. The IL used, 1-ethyl-3-methylimidazolium tetrafluoroborate(EMImBF4), had a purity of >99% (Sigma-Aldrich). This IL was se-lected because it is miscible with water and is commonly used as anelectrolyte for supercapacitors due to its high ionic conductivity andwide electrochemical stability window.24
Electrode fabrication.— Ethanol was used to dilute the concen-trated GO slurry (obtained from the washing procedure) to a concen-tration of approximately 10 mg/mL. The diluted GO/ethanol slurrywas then mixed with deionized water at a volume ratio of 3:8. Typi-cally 11 mL of this mixture was horn ultrasonicated at 40% amplitude(Vibracell, Sonics & Materials Inc., CT) for 10 min to break apartloosely aggregated GO particles into single graphene oxide sheets.Under stirring, 1 mL of a solution of EMImBF4 in water was thenadded to the suspension. 450 μL of the resulting mixture was drop-cast onto 1.5 cm diameter Pt disks (99.9% purity) and allowed to dryat room temperature overnight to eliminate the volatile components(i.e., water and ethanol) while the non-volatile IL was retained in the
film. The amount of IL added to the water was varied to generategraphene oxide/IL composites with varying IL content. The com-posite films were then placed in an ashing furnace (Model 47900,Barnstead-Thermolyne, NH) under a flow of nitrogen and heated tovarious reduction temperatures between 200 and 350◦C at a rate of20◦C/min. After reaching the target temperature, the samples werecooled down to room temperature immediately to prevent significantloss of EMImBF4 as a result of decomposition and evaporation of theIL.49 The use of a binder was found unnecessary because the filmsremained coherent after evaporative consolidation and thermal reduc-tion, being held together by both the van der Waals forces betweenFGSs and the capillary forces. Since binder acts as dead-weight in anelectrode, the use of a binder-free electrode increases the projecteddevice energy density further.
Characterization of films.— The mass of the films was determinedby weighing the Pt disks both before coating and after the applicationof the coating and the reduction procedure. An extra electrode wascoated and thermally reduced in each batch so that the resulting filmcould be scraped off and analyzed by thermal gravimetric analysis(TGA) and differential scanning calorimetry (DSC) (449 C Jupiter,Erich Netzsch GmbH & Co., Germany) to determine the fractionof EMImBF4 in each electrode batch. This was done by determin-ing the difference in mass between 500◦C (after IL decomposition)and 200◦C (prior to decomposition). Additional mass loss due to thefurther reduction of FGSs during this measurement does not con-tribute significantly (see Results and Discussion). The mass of FGSson each electrode was determined by multiplying the total mass ofthe reduced film by the mass fraction of FGSs determined by TGA.Typically, films contained 0.5–1 mg of active material. The C/O ra-tio of the FGSs before and after reduction was estimated using EDS(INCA x-act, Oxford Instruments, UK attached to a VEGA1 scanningelectron microscope, Tescan USA). Our EDS procedure was foundcapable of determining the correct stoichiometry of the pure IL andclosely reproduced the C/O ratio data obtained previously by combus-tion analysis for FGSs produced by the thermal reduction method.30,31
Powder X-ray diffraction (XRD) was carried out using a Miniflex II(Rigaku Americas, PA, Cu Kα radiation). The lowest detectable angleof 2θ = 5◦ corresponds to an upper limit in the observable d-spacing
ecsdl.org/site/terms_use address. Redistribution subject to ECS license or copyright; see 128.112.70.3Downloaded on 2013-07-31 to IP

A1656 Journal of The Electrochemical Society, 160 (10) A1653-A1660 (2013)
of 17.6 Å. The specific surface area of dried films was determinedthrough N2 adsorption using a Gemini V unit (Micromeritics Instru-ments) and fitting the isotherm to the Brunauer, Emmett, and Teller(BET)50 equation.
Electrochemical testing of the electrodes was carried out in a two-electrode configuration using a spring-loaded stainless steel test cell(MTI Corp. CA) and a Celgard 3501 membrane separator pre-soakedwith EMImBF4. Electrodes were assembled in an argon-filled glovebox (Innovative Technology, MA). A drop of EMImBF4 (10 μL) wasplaced between each electrode and the membrane before sandwichingthem inside the test cell. This drop was added to ensure good ionic con-tact between the separator and the electrodes and also to show that theCG of the composite electrodes containing smaller amounts of IL wasnot limited by an insufficiently small amount of electrolyte. Additionof IL was unnecessary for films with higher IL content. Tests carriedout with no additional IL showed no significant difference in perfor-mance and therefore the mass of this additional IL was neglected inour estimation of f. Cyclic voltammetry, electrochemical impedancespectroscopy (EIS), and galvanostatic charge/discharge tests were car-ried out on assembled test cells using a computer-controlled poten-tiostat (VSP, Bio-Logic USA). CG was calculated using the followingequation:
CG = 2iavg
υ · m. [3]
When analyzing cyclic voltammograms (CVs), iavg is taken as theaverage of the absolute anodic and cathodic currents at the midpoint ofthe CV, ν is the scan rate, and m is the mass of FGSs on one electrode.CG was also estimated from galvanostatic discharge curves using thesame equation with ν = (U-Udrop)/�t, where U = 3 V is the initialpotential, Udrop is the voltage drop at the reversal of the scan directiondue to Ohmic losses and �t is the time needed to discharge the cellfrom 3 to 0 V at the discharging current iavg. The equivalent seriesresistance was calculated as RS = Udrop/iavg.
Results and Discussion
Electrode consolidation.— Dispersions of graphene oxide in thewater/ethanol mixture are stable, i.e., they show no sign of aggregationor sedimentation over several weeks. This is expected due to the highnumber density of carboxylic acids, phenolic hydroxyls, and otherfunctional groups present on graphene oxide which dissociate in wa-ter and charge-stabilize the suspended sheets.46,47 Adding EMImBF4,however, causes a significant increase in suspension viscosity, indi-cating the formation of a graphene oxide/water gel network. SinceEMImBF4 is fully miscible with water, and since a similar gelationphenomenon is observed when adding other salts such as NaCl tothe system instead of IL, we ascribe this behavior to screening ofthe charge on the graphene oxide (“salting out”) as a result of theionic strength increase, leading to subsequent partial aggregation ofthe graphene oxide by attractive van der Waals forces.51 Drying thesegels results in graphene oxide/IL composite films of typically 5–10 μmin thickness which exhibit different degrees of restacking and aggre-gation depending on EMImBF4 concentration in the initial gel. InFigure 3, we show the XRD data obtained on composite films assem-bled with varying amounts of EMImBF4. The XRD profiles show thatthe characteristic spacing between the graphene oxide sheets varieswith the amount of IL. In the absence of EMImBF4, we observe anXRD peak at 2θ ≈ 9.1◦ which indicates that restacking to a graphiteoxide like structure has occurred and domains with a d0002 spacingof 9.7 Å have formed during drying. This spacing is similar to whathas been reported in the literature for GO prepared using the sameoxidation method employed here (9.5 Å).48 The restacking of singlesheets of graphene oxide into GO is also in accordance with previousstudies where suspensions of graphene oxide were dried or filtered.52
We find that this restacking results in SSAs of less than 10 m2/g.With increasing EMImBF4 concentration, the XRD peak broadens,decreases in amplitude, and shifts to larger d-spacing (smaller scatter-
Figure 3. XRD profiles for graphene oxide/EMImBF4 composite films.
ing angle, Fig. 3) indicating that EMImBF4 has disrupted the forma-tion of GO domains as evidenced by the increased average distancebetween the sheets, consistent with the schematic in Figure 2b. Even-tually, above 60 wt% EMImBF4, the films become X-ray amorphous.Hence, above 60 wt%, the IL-filled spaces between the graphene ox-ide sheets (intra-lamellar pores) become too large or too disorderedto cause a significant signal in XRD. As discussed above, in additionto IL contained in the intra-lamellar space, IL is also likely presentwithin larger inter-aggregate voids (Fig. 2). Those might be generatedat locations where the compressive strength of the graphene oxidegel network exceeds the compressive forces generated by capillaryeffects as the solvent is removed by evaporation.53,54 At 60 wt% ILin the composite, ρeff should be ∼0.66 g/cm3 if the composite werefully dense. However, the measured ρeff was ∼0.46 g/cm3 indicatingthe presence of gas-filled inter-aggregate voids within the composite.
To obtain an order of magnitude estimate for the amount ofEMImBF4 required to cover the theoretical surface area of grapheneoxide (assuming no inter-aggregate voids filled with IL are present),we use the molecular dimensions of the imidazolium cation (0.78 nm× 0.58 nm × 0.33 nm)55 to estimate the amount of IL necessary formonolayer coverage. The exact orientation of the cation on the surfaceof graphene oxide is unknown. Assuming that the IL molecule liesflat on graphene oxide (which is the least favorable orientation forachieving high charge density) we approximate that about 70 wt%EMImBF4 is required for a dense packing of IL on both sides of agraphene oxide sheet. This results in two monolayers of IL separat-ing each graphene oxide sheet from the other, i.e., a shared bilayerwith an approximate thickness of 2.1–2.4 nm. Theoretically, a sharedmonolayer is thus expected to form at half of this IL concentration(∼35 wt%). The fact that in the range of 35 to 70 wt% of IL weonly observe a broad peak shifting to larger d-spacings and no peakcorresponding to shared monolayer coverage (shared bilayer spacinglies outside the limits of our XRD unit) suggests that we do not ob-tain a uniform coverage and an alignment of graphene oxide sheets, incontrast to graphite and GO intercalation compounds which form well-ordered crystalline structures.56 Instead, the EMImBF4 is randomlydistributed, giving rise to an X-ray amorphous structure. Obtaininga uniform IL coating would require that the EMImBF4 completelywet the graphene oxide (vanishing contact angle).57 The contact an-gle of EMImBF4 on graphene oxide is unknown, but the fact that weobserve neither a distinct peak in XRD nor a phase separation of ILand graphene oxide suggests that EMImBF4 may only be partiallywetting. As a consequence, the fraction of the graphene oxide sur-
ecsdl.org/site/terms_use address. Redistribution subject to ECS license or copyright; see 128.112.70.3Downloaded on 2013-07-31 to IP

Journal of The Electrochemical Society, 160 (10) A1653-A1660 (2013) A1657
Figure 4. The electronic charge accumulated by an EDLC electrode. Nelectr= CDL U/2 assuming a symmetric electrode where each electrode traverseshalf the potential window.
face area which is in direct contact with EMImBF4 may have beenreduced, and voids filled with either IL or air/argon may have formedwithin the films lowering their ρeff. Enhancing wettability thus couldlead to more uniform coverage and better packing efficiency. Sincecurrently we have no well-ordered reference system to compare to, wecannot determine whether such random arrangement is in fact benefi-cial for EDLC operation, or whether a more uniform coating and thusmaximized accessible surface area will result in the best electrodeperformance. In the following, we show that packing density can havea direct impact on the electrochemical performance of the IL film (i.e.,on the ionic part of the electrochemical double layer) which needs tobe taken into account when estimating the minimum amount of ILrequired for electrode assembly.
We use our estimate of IL packing density on graphene oxide toillustrate how much IL is necessary to charge the electrochemicaldouble layer at high U. To this end, we calculate the electric chargestored for a given value of CDL and U and estimate the number ofaccumulated electronic charges per nm2 of electrode material (Nelectr).This is compared to the corresponding charge density (Nionic) in amonolayer of (monovalent) IL cations which we estimate to be Nionic
≈ 2.2 nm−2. In Figure 4, we show several values of Nelectr for realisticcombinations of CDL and different potential windows in comparisonto Nionic. The amount of energy stored is limited by the smaller of thetwo values, and the Figure indicates that with high values of CDL andlarge voltage windows, Nelectr is similar to or even greater than Nionic.Therefore, based on our estimations, at least an IL content resulting incoverage in the range from a monolayer to a shared bilayer is requiredto balance the electronic charge density in an EDLC operating at highvoltage. The assumption of a layer of cations without the presenceof any counter ions is probably not completely realistic and Nionic
might in fact be smaller than estimated. Thus, although reducingthe thickness of the IL between each pair of graphene oxide sheetsdown to a shared monolayer would increase ρeff, it would also limitthe maximum amount of charge that can be stored at the interface.Furthermore, it would certainly limit the rate of charge transport inand out of the pore space between the sheets.
Thermal reduction of graphene oxide/IL composites.— For theelectrodes to be used in an EDLC device, the graphene oxide needsto be reduced such that it becomes electrically conducting. UsingTGA/DSC, we therefore determined the thermal stability of GO andneat EMImBF4 and identified suitable temperature ranges for reduc-ing the electrode thermally. In Figure 5a, we show TGA/DSC datafor the separate thermal decomposition of GO and IL. With GO,around 200◦C, mass is lost in an exothermic process, indicative ofthermal decomposition and reduction of GO (or graphene oxide).30,31
The mass of EMImBF4 remains approximately constant until a tem-perature of 300◦C at which mass loss becomes clearly noticeable.Around 500◦C, EMImBF4 is completely decomposed in an endother-
Figure 5. (a) TGA/DSC of neat GO and EMImBF4. (b) TGA/DSC of anelectrode composite (FGS2/EMImBF4) prior to thermal reduction. (c) C/Oratio of thermally reduced FGSs estimated by EDS as a function of compositeheat-treatment temperature.
mic process. The characterization of FGS2/IL composites is shown inFigure 5b. Near 100◦C we observe an endothermic mass loss asso-ciated with the removal of residual water from the films. The fol-lowing exothermic mass loss between 200 and 300◦C is attributed tothe reduction of graphene oxide to FGSs,30,31 and the final endother-mic mass loss at higher temperatures, between 350 and 500◦C, iscaused by the decomposition of EMImBF4. The final mass obtainedis taken to be the mass of the reduced FGSs. In comparison to theTGA data of the neat materials, the GO reduction peak is broadenedand shifted to higher temperatures. The mass loss and the endother-mic peak corresponding to EMImBF4 decomposition are observed atlower temperatures, shifting from approximately 500 to 350◦C as theamount of graphene oxide in the film was increased from 0 to about70 wt%. Although many studies claim that ILs such as EMImBF4
are stable at temperatures above 400◦C, it is now recognized that thisapparent stability may be due to heat transfer limitations during fastheating ramps of 10 to 20◦C/min.58 The high thermal conductivityof FGSs59 as well as their high absorbance60 compared to the neatIL likely increase the rate of diffusive and radiative heat transfer tothe EMImBF4, thus lowering the apparent decomposition tempera-ture. Also, we cannot rule out the possibility that FGSs may catalyzethe decomposition of the IL. The difference in temperature betweenthermal reduction of graphene oxide and EMImBF4 decomposition re-sults in the existence of a temperature window within which grapheneoxide can be thermally reduced without significantly decomposing the
ecsdl.org/site/terms_use address. Redistribution subject to ECS license or copyright; see 128.112.70.3Downloaded on 2013-07-31 to IP

A1658 Journal of The Electrochemical Society, 160 (10) A1653-A1660 (2013)
EMImBF4. We note that a fraction of the mass loss (approximately5 wt%) in the range between 300 and 500◦C is likely caused byfurther reduction of the FGSs, as suggested by the TGA results forGO reduction alone shown in Figure 5a.
The heat-treatment of composite films results in a drastic colorchange from an amber-yellow to black at reduction temperatures above250◦C. This increase in absorbance of the films is the consequenceof increased electrical conductivity of the initially insulating materialdue to the increasing number of conjugated and aromatic carbon struc-tures formed during thermal reduction.60 The C/O ratio of the FGSsas determined by EDS ranges from 2 for the untreated material con-taining graphene oxide to just above 5 for heat treatments up to 340◦Cas shown in Figure 5c. The analysis also indicates that the N/F ratiodeviated from the expected stoichiometric value of 4:1 for EMImBF4
when temperatures above 270◦C were reached (not shown). This de-viation implies that IL decomposition begins above 270◦C. The slightdegree of decomposition was also reflected in the mass loss of thesamples during heat-treatment and is consistent with the EMImBF4
content measured by TGA.
Electrochemical characterization.— CVs for an electrode with78 wt% EMImBF4 are shown in Figure 6a for a series of scan ratesbetween 10 and 100 mV/s. The CVs are all approximately rectan-gular in shape and display a similar CG, suggesting that capacitivecharging is strictly non-faradaic, as expected for electrodes operatedin an aprotic electrolyte. In Figure 6b, the CG values estimated at 5mV/s by cyclic voltammetry and at 0.2 A/g by galvanostatic dischargeare shown for different IL contents. Values <10 F/g are obtained forfilms cast in the absence of EMImBF4. CG increases with increasingEMImBF4 content until above 60 wt%, where CG reaches saturationat an average value of 136 ± 10 F/g. The relatively constant value ofCG above 60 wt% indicates that the retained ion-accessible SSA doesnot increase further as more EMImBF4 is added. This suggests thatabove 60 wt% additional IL, instead of distributing over more FGSsurface area and keeping more sheets apart, either increases the av-erage thickness of the IL-filled regions (i.e., intra-lamellar pores andinter-aggregate pores) between the sheets or continues to fill inter-aggregate pores that are only partially filled with IL. The increase ineffective pore size with increased IL loading corresponds to our XRDdata showing increasing d-spacing.
When we compare electrodes containing varying levels ofEMImBF4 above 60 wt% which are all thermally reduced at 270◦C,we find a significant difference in the scan rate-dependence of CG.Figure 6c demonstrates that composite electrodes which contain moreEMImBF4 better retain their capacitance at high scan rates. At thehighest IL content investigated (80 wt%), CG decreases by only 15%when increasing the scan rate from 5 to 100 mV/s. The same trendas that shown in Figure 6c is also observed in galvanostatic dischargetesting at various current densities. As shown in Figure 7a, the corre-sponding RS decreases from 100 to 30 � when the IL content is variedbetween 45 and 80 wt%. These results suggest that by varying the ILcontent we change the ionic conductivity of the FGS/IL compositenetwork by increasing the size and number of ionic paths. This corre-sponds well to the hypothesized increase in the size of intra-lamellarpores filled with EMImBF4 as the IL content is increased. It is alsolikely that the amount of IL in the inter-aggregate voids increases,which is expected to improve the ionic conductivity even further.Since we do not observe a decrease in rate performance or increase inRS with increasing IL content, at least for the IL contents studied, theelectrical contact between the graphene sheets is not severely affectedby the increased IL loading. Should a loss of electrical conductivityhave occurred, it is over-compensated by the simultaneous improve-ment in ionic transport. This view is also supported by the absenceof a significant increase in CG at higher loadings, as would be ex-pected if FGS-FGS contact area were lost and more surface area wereion-accessible. As discussed above, the graphene oxide aggregatesand yields a gel structure upon addition of EMImBF4 to the suspen-sion, which suggests that the FGSs may form regions of physical and,consequently, electrical contact prior to densification, and the IL can-
Figure 6. Electrochemical characterization of films heat treated at 270◦C.(a) CVs carried out at various scan rates for composite electrodes containing78 wt% EMImBF4. (b) Capacitance of composite films assembled with varyingamounts of EMImBF4 estimated by cyclic voltammetry (scan rate 5 mV/s) andgalvanostatic discharge (at 0.2 A/g) in a 3 V potential window. (c) Scan ratedependence of the capacitance for varying EMImBF4 content.
not separate the sheets at these points during solvent evaporation andfurther processing.
To determine how the degree of reduction affects the performanceof the electrodes, we reduced several electrodes containing 75 wt%EMImBF4 (prior to heat-treatment) at various temperatures. Whenreduced below 250◦C, we obtain low CG (∼5 F/g) due to a lack ofelectronic conductivity. When test cells containing these poorly re-duced FGSs are disassembled, the cathode is found to be darker incolor than the anode, indicating that it has been electrochemicallyreduced further during testing. The anode can be brought to a simi-lar state by reversing the polarity of the device and employing it asthe cathode in a subsequent measurement; but, by doing so, CG in-creases to only ∼10 F/g. Thus, the further electrochemical reductionin EMImBF4 is not sufficient to achieve the necessary level of electricconductivity.
ecsdl.org/site/terms_use address. Redistribution subject to ECS license or copyright; see 128.112.70.3Downloaded on 2013-07-31 to IP

Journal of The Electrochemical Society, 160 (10) A1653-A1660 (2013) A1659
Figure 7. Effect of temperature and IL content on the electrode resistance. (a)RS estimated from the voltage drop in galvanostatic discharge carried out at 3V for films assembled with varying amounts of EMImBF4. (b) RS estimatedfrom the voltage drop in galvanostatic discharge after charging to 3 V for filmstreated at various reduction temperatures. The initial IL content in all filmswas 75 wt% and the final IL content is indicated under the data points. (c) EISmeasurements at a DC bias of 0 V for electrodes heat treated at two differenttemperatures. (d) Magnified view of the high frequency region of the Nyquistplot shown in (c). (e) Scan rate dependence of the capacitance of an electrodewith 86 wt% EMImBF4 heat treated at 300◦C.
Electrodes reduced at different temperatures above 250◦C showonly small variations in CG at a low scan rate of 5 mV/s. With in-creased scan rate, however, differences between electrodes treated atdifferent temperatures became apparent, indicating that, besides ionictransport, electrode conductivity is a performance-limiting factor inour system as well. We therefore examined the effect of heat-treatmenton RS of electrodes with the same initial content of 75 wt% EMImBF4
(Fig. 7a). RS drops from 33 to 10 � as the reduction temperature isincreased from 270 to 340◦C (Fig. 7b). As indicated in Figure 7b, thedecrease in RS with increasing reduction temperature is accompaniedby a loss of IL from the films. Since the loss of IL does not increasethe resistance suggests that, in this case, our system is mainly lim-ited by electronic transport. The change in electrode resistance is alsoapparent in the Nyquist plots of impedance spectra shown in Figure7c, 7d. Films reduced at 270◦C exhibit a Warburg-like constant phaseimpedance in the mid frequency range, typically associated with ionmigration limitations in porous electrodes.44 Warburg-like behavior isstrongly reduced and consequently the diffusion limitations are less-ened in electrodes reduced at 340◦C. However, as mentioned above,the high-temperature heat-treatment is accompanied by a significantloss of IL. This should have extended the constant phase behaviorto lower frequencies (increased diffusive limitation) compared to theresult obtained with lower reduction temperature. Since the oppositeis observed, in our case the Warburg-like behavior is probably pre-dominantly effected by electronic transport effects within the FGSnetwork which, at this low degree of thermal reduction and compa-rably high IL content, may dominate over ionic diffusion effects. Asimilar phenomenon has been observed in impedance spectra mea-
sured for semiconductors such as TiO2 used in dye-sensitized solarcells,61 and at the lowest C/O ratios tested, our reduced graphene ox-ide may exhibit semiconducting behavior62,63 further supporting ourconjecture that Warburg-like behavior at low reduction temperaturesis an electronic effect. In future work, we hope to determine a methodwhich we can use to independently assess the electronic and ionicresistances in our system to better clarify this behavior.
When high reduction temperatures are applied to the electrodeswith the largest IL content, it is possible to achieve nearly constant CG
over a wide range of scan rates. As shown in Figure 7e, films thermallytreated at 300◦C and containing 86 wt% EMImBF4 retained morethan 90% of their capacitance (143 F/g) at scan rates up to 500 mV/s.This value of CG is one of the highest reported at such a high ratefor electrodes using an IL as the electrolyte. For example, in a recentstudy64 carried out with electrodes of similar thickness (7–30 μm)it has been demonstrated that activated graphene retains only 72%of the electrode’s capacitance (120 F/g) at 400 mV/s despite the useof a higher-conductivity organic electrolyte. Adjusting the scan ratedependence and RS by tuning the IL content could thus provide aconvenient means for preparing electrodes for special high power ap-plications. We would expect the rate capability to keep increasing withimprovements to both the thermal reduction protocol and the amountof IL. However, at some point the electronic conductivity will likelysuffer due to decreased FGS-FGS contact area. We did not explorecombinations of higher temperature treatments and higher IL con-tents than 86 wt%. At higher IL loadings we expect to reach the pointwhere the composite is no longer a coherent film but a slurry whichmay no longer be processed into an electrode. As estimated in Table I,binder-free graphene-based electrodes with IL content larger than 93wt% have been fabricated by Yang et al.8 and thus we expect films toremain coherent, at least, up to this IL content.
To properly compare our results to other FGS/IL data reported inthe literature, we must consider the mass of both the FGSs and the ILas explained in the introduction. Our approach provides direct controlover the fraction of each component in the electrodes, and in the thickelectrode limit we only need to subtract the IL content from 100%to obtain the weight fraction f. Already at relatively low IL contentof 60 wt% (f = 40 wt%) we achieve values of CG up to 140 F/g,and, therefore, according to Eq. 1 reach energy densities up toE = 17.5 Wh/kg at only 3 V operating voltage. Compared to values ofE from the literature (Table I) which range from 5 to 13.8 Wh/kgfor FGS-based electrodes and which have been obtained withU > 3 V, our approach thus yields significantly increased energydensity. Preliminary tests have shown that we can operate our elec-trodes at U = 3.5 V, which for our best electrodes increases E to about24 Wh/kg. We have achieved these values with thin film electrodes,similar to the other studies discussed in Table I.6–8 We therefore needto investigate whether the improved performance obtained with ourconsolidation approach can be maintained as we develop our processfurther and increase electrode thickness.
From our data we can also estimate the volumetric capacitanceCV (in F/cm3) and ρeff, for the 60 wt% IL case using their purecomponent densities (IL: ρI = 1.3 g/cm3, FGSs: ρa = 2.2 g/cm3). Ifwe assume the absence of gas-filled voids in the material we obtainCV ≈ 93 F/cm3 and ρeff ≈ 0.66 g/cm3. However, since this estimaterepresents an upper limit for CV, we also determined the volume ofour electrodes by measuring their approximate thickness and diameter.These measurements indicate that we achieve only approximately 70%of the theoretically estimated bulk density (∼0.46 g/cm3), leading toan estimated CV of 65 F/cm3 which is still the highest reported for anFGS-based electrode in an IL.
Conclusions
We have demonstrated a new strategy for the preparation of high-performance graphene-based electrodes for EDLCs with IL elec-trolytes. Instead of using a porous electrode structure and imbibingthe electrolyte or applying solvent exchange techniques, we employan approach which results in the IL acting both as electrolyte and
ecsdl.org/site/terms_use address. Redistribution subject to ECS license or copyright; see 128.112.70.3Downloaded on 2013-07-31 to IP
A1660 Journal of The Electrochemical Society, 160 (10) A1653-A1660 (2013)
spacer between functionalized graphene improving the ion-accessiblesurface area. Composites assembled with increasing amounts of ILincrease the ion-accessible surface area of the electrodes and improvethe performance of the EDLC electrodes at high scan rates by effectingchanges in the pore structure of the electrode composite. The mass-specific capacitance of the electrodes reaches values as high as 140 F/gat an effective electrode density of ρeff ≈ 0.46 g/cm3 (60 wt% IL) re-sulting in a high energy density (17.5 Wh/kg at 3 V) and volumetriccapacitance (65 F/cm3). At a higher IL content of 80 wt%, i.e., at lowerelectrode density, the electrodes retain over 90% of their maximumcapacitance at scan rates up to 500 mV/s. This constitutes the bestcapacitance retention at high rates reported for thin film carbonaceouselectrodes operated in an IL.
Several steps in this approach need to be further improved beforeour results can be extended to predict the performance of a packageddevice. Our current drop-casting approach yields thin film electrodes,and it is known that in many cases electrode performance decreaseswith increasing thickness.2 Furthermore, the rate capabilities improvesignificantly with increasing IL content but this increase negativelyaffects CV. Although our approach is promising, we believe thereis room for improvement which will be facilitated by a deeper un-derstanding of the interactions between various types of FGSs andILs and their aggregation behavior to both improve the ion-accessibleSSA while maximizing ionic transport within the composite matrix.Electronic transport could be improved by developing better reduc-tion strategies which increase the C/O ratio without decomposing theIL, or, alternatively, by extending our electrode assembly approach toFGSs that have been thermally or chemically reduced to a higher C/Oratio prior to dispersion and assembly.
Acknowledgments
This work was supported by the Pacific Northwest National Labo-ratory under grant number DE-AC05-76RL01830, the Princeton Uni-versity Intellectual Property Development Fund, and an Army Re-search Office (ARO)/Multidisciplinary Research Initiative (MURI)under grant number W911NF-09-1-0476. S. K. and C. P. acknowledgesupport from a DOD SBIR under contract number W9111QX-11-C-0079.
References
1. B. E. Conway, Electrochemical Supercapacitors: Scientific Fundamentals and Tech-nological Applications. Kluwer Academic: New York, (1999).
2. Y. Gogotsi and P. Simon, Science, 334, 917 (2011).3. Y. Zhu, S. Murali, M. D. Stoller, K. J. Ganesh, W. Cai, P. J. Ferreira, A. Pirkle,
R. M. Wallace, K. A. Cychosz, M. Thommes, D. Su, E. A. Stach, and R. S. Ruoff,Science, 332, 1537 (2011).
4. A. G. Pandolfo and A. F. Hollenkamp, J. Power Sources, 157, 11 (2006).5. C. Liu, Z. Yu, D. Neff, A. Zhamu, and B. Z. Jang, Nano Lett., 10, 4863 (2010).6. M. F. El-Kady, V. Strong, S. Dubin, and R. B. Kaner, Science, 335, 1326 (2012).7. T. Y. Kim, H. W. Lee, M. Stoller, D. R. Dreyer, C. W. Bielawski, R. S. Ruoff, and
K. S. Suh, ACN Nano, 5, 436 (2010).8. X. Yang, J. Zhu, L. Qiu, and D. Li, Adv. Mater., 23, 2833 (2011).9. D. Belanger, L. Brousse, and J. W. Long, Interface, 17, 49 (2008).
10. M. Inagaki, H. Konno, and O. Tanaike, J. Power Sources, 195, 7880 (2010).11. Y. Y. Shao, J. Wang, M. Engelhard, C. M. Wang, and Y. H. Lin, J. Mater. Chem., 20,
743 (2010).12. S. R. C. Vivekchand, C. S. Rout, K. S. Subrahmanyam, A. Govindaraj, and
C. N. R. Rao, J. Chem. Sci., 120, 9 (2008).13. M. D. Stoller, S. J. Park, Y. W. Zhu, J. H. An, and R. S. Ruoff, Nano Lett., 8, 3498
(2008).14. W. Lv, D.-M. Tang, Y.-B. He, C.-H. You, Z.-Q. Shi, X.-C. Chen, C.-M. Chen,
P.-X. Hou, C. Liu, and Q.-H. Yang, Acs Nano, 3, 3730 (2009).15. J. Yan, T. Wei, B. Shao, F. Ma, Z. Fan, M. Zhang, C. Zheng, Y. Shang, W. Qian, and
F. Wei, Carbon, 48, 1731 (2010).16. Y. Chen, X. Zhang, P. Yu, and Y. W. Ma, J. Power Sources, 195, 3031 (2010).17. X. A. Du, P. Guo, H. H. Song, and X. H. Chen, Electrochim. Acta, 55, 4812 (2010).18. L. T. Le, M. H. Ervin, H. W. Qiu, B. E. Fuchs, and W. Y. Lee, Electrochem. Commun.,
13, 355 (2011).
19. Y. Chen, X. O. Zhang, D. C. Zhang, P. Yu, and Y. W. Ma, Carbon, 49, 573 (2011).20. K. Zhang, B. T. Ang, L. L. Zhang, X. S. Zhao, and J. Wu, J. Mater. Chem., 21, 2663
(2011).21. Y. W. Zhu, S. Murali, M. D. Stoller, A. Velamakanni, R. D. Piner, and R. S. Ruoff,
Carbon, 48, 2118 (2010).22. V. Khomenko, E. Raymundo-Pinero, E. Frackowiak, and F. Beguin, Appl. Phys.
a-Mater, 82, 567 (2006).23. M. Armand, F. Endres, D. R. MacFarlane, H. Ohno, and B. Scrosati, Nat. Mater., 8,
621 (2009).24. A. M. O’Mahony, D. S. Silvester, L. Aldous, C. Hardacre, and R. G. Compton, J.
Chem. Eng. Data, 53, 2884 (2008).25. C. Largeot, C. Portet, J. Chmiola, P.-L. Taberna, Y. Gogotsi, and P. Simon, J. Am.
Chem. Soc., 130, 2730 (2008).26. M. Lazzari, M. Mastragostino, and F. Soavi, Electrochem. Commun., 9, 1567 (2007).27. A. Balducci, R. Dugas, P. L. Taberna, P. Simon, D. Plee, M. Mastragostino, and
S. Passerini, J. Power Sources, 165, 922 (2007).28. M. M. Hantel, T. Kaspar, R. Nesper, A. Wokaun, and R. Kotz, Electrochem. Comm.,
13, 90 (2011).29. Y. Zhu, M. D. Stoller, W. Cai, A. Velamakanni, R. D. Piner, D. Chen, and R. S. Ruoff,
Acs Nano, 4, 1227 (2010).30. H. C. Schniepp, J. L. Li, M. J. McAllister, H. Sai, M. Herrera-Alonso,
D. H. Adamson, R. K. Prud’homme, R. Car, D. A. Saville, and I. A. Aksay, J. Phys.Chem. B, 110, 8535 (2006).
31. M. J. McAllister, J. L. Li, D. H. Adamson, H. C. Schniepp, A. A. Abdala, J. Liu,M. Herrera-Alonso, D. L. Milius, R. Car, R. K. Prud’homme, and I. A. Aksay, Chem.Mater., 19, 4396 (2007).
32. S. Stankovich, D. A. Dikin, R. D. Piner, K. A. Kohlhaas, A. Kleinhammes, Y. Jia,Y. Wu, S. T. Nguyen, and R. S. Ruoff, Carbon, 45, 1558 (2007).
33. K. N. Kudin, B. Ozbas, H. C. Schniepp, R. K. Prud’homme, I. A. Aksay, and R. Car,Nano Lett., 8, 36 (2008).
34. M. A. Pope, C. Punckt, and I. A. Aksay, J. Phys. Chem. C, 115, 20326 (2011).35. J. L. Xia, F. Chen, J. H. Li, and N. J. Tao, Nat. Nanotechnol., 4, 505 (2009).36. M. D. Stoller, C. W. Magnuson, Y. Zhu, S. Murali, J. W. Suk, R. Piner, and
R. S. Ruoff, Energy Environ. Sci., 4, 4685 (2011).37. O. Kimizuka, O. Tanaike, J. Yamashita, T. Hiraoka, D. N. Futaba, K. Hata,
K. Machida, S. Suematsu, K. Tamamitsu, S. Saeki, Y. Yamada, and H. Hatori, Carbon,46, 1999 (2008).
38. L. Yan, C. Punckt, I. A. Aksay, W. Mertin, and G. Bacher, Nano Lett., 11, 3543(2011).
39. C. Punckt, F. Muckel, S. Wolff, I. A. Aksay, C. A. Chavarin, G. Bacher, and W. Mertin,Appl. Phys. Lett., 102, (2013).
40. V. Lockett, R. Sedev, J. Ralston, M. Horne, and T. Rodopoulos, J. Phys. Chem. C,112, 7486 (2008).
41. C. Punckt, M. A. Pope, J. Liu, Y. H. Lin, and I. A. Aksay, Electroanal, 22, 2834(2010).
42. L. L. Zhang and X. S. Zhao, Chem. Soc. Rev., 38, 2520 (2009).43. W. Y. Shih, J. Liu, W. H. Shih, and I. A. Aksay, J. Stat. Phys., 62, 961 (1991).44. R. de Levie, Electrochim. Acta, 8, 751 (1963).45. M. Lazzari, F. Soavi, and M. Mastragostino, Fuel Cells, 10, 840 (2010).46. T. Hwa, E. Kokufuta, and T. Tanaka, Phys. Rev. A, 44, R2235 (1991).47. T. Szabo, O. Berkesi, P. Forgo, K. Josepovits, Y. Sanakis, D. Petridis, and I. Dekany,
Chem. Mater. 18, 2740 (2006).48. D. C. Marcano, D. V. Kosynkin, J. M. Berlin, A. Sinitskii, Z. Sun, A. Slesarev,
L. B. Alemany, W. Lu, and J. M. Tour, Acs Nano, 4, 4806 (2010).49. M. J. Earle, J. M. S. S. Esperanca, M. A. Gilea, J. N. Canongia Lopes,
L. P. N. Rebelo, J. W. Magee, K. R. Seddon, and J. A. Widegren, Nature, 439, 831(2006).
50. S. Brunauer, P. H. Emmett, and E. Teller, J. Am. Chem. Soc., 60, 309 (1938).51. W. B. Russel, D. A. Saville, and W. R. Schowalter, Colloidal dispersions. Cambridge
University Press: Cambridge; New York, (1989).52. D. A. Dikin, S. Stankovich, E. J. Zimney, R. D. Piner, G. H. B. Dommett,
G. Evmenenko, S. T. Nguyen, and R. S. Ruoff, Nature, 448, 457 (2007).53. G. W. Scherer, J. Am. Ceram. Soc., 73, 3 (1990).54. L. Bergstrom, C. H. Schilling, and I. A. Aksay, J. Am. Ceram. Soc., 75, 3305 (1992).55. S. Liu, W. Liu, Y. Liu, J.-H. Lin, X. Zhou, M. J. Janik, R. H. Colby, and Q. Zhang,
Polymer Int., 59, 321 (2010).56. L. B. Ebert, Annu. Rev. Mater. Sci., 6, 181 (1976).57. L. Leger and J. F. Joanny, Rep. Prog. Phys., 55, 431 (1992).58. D. M. Fox, J. W. Gilman, H. C. De Long, and P. C. Trulove, J. Chem. Thermodyn.,
37, 900 (2005).59. A. A. Balandin, S. Ghosh, W. Bao, I. Calizo, D. Teweldebrhan, F. Miao, and C. N. Lau,
Nano Lett., 8, 902 (2008).60. M. Acik, G. Lee, C. Mattevi, M. Chhowalla, K. Cho, and Y. J. Chabal, Nat. Mater.,
9, 840 (2010).61. J. Bisquert, J. Phys. Chem. B, 106, 325 (2001).62. S. Wang, R. Wang, X. Wang, D. Zhang, and X. Qiu, Nanoscale, 4, 2651 (2012).63. X. Wu, M. Sprinkle, X. Li, F. Ming, C. Berger, and W. A. de Heer, Phys. Rev. Lett.,
101, 026801 (2008).64. L. L. Zhang, X. Zhao, M. D. Stoller, Y. Zhu, H. Ji, S. Murali, Y. Wu, S. Perales,
B. Clevenger, and R. S. Ruoff, Nano Lett., 12, 1806 (2012).65. V. W. Scholtz and H. P. Boehm, Z. Anorg. Allg. Chem., 369, 327 (1969).
ecsdl.org/site/terms_use address. Redistribution subject to ECS license or copyright; see 128.112.70.3Downloaded on 2013-07-31 to IP