Embed Size (px)
Citation preview
lable at ScienceDirect
Journal of Power Sources 252 (2014) 90e97
Contents lists avai
Journal of Power Sources
journal homepage: www.elsevier .com/locate/ jpowsour
Sulfurized activated carbon for high energy density supercapacitors
Yunxia Huang a,b, Stephanie L. Candelaria b, Yanwei Li b, Zhimin Li a, Jianjun Tian b,Lili Zhang b, Guozhong Cao b,*
a School of Advanced Materials and Nanotechnology, Xidian University, Xi’an 710071, ChinabDepartment of Materials Science and Engineering, University of Washington, Seattle, WA 98195-2120, United States
h i g h l i g h t s
� Sulfur-modified activated carbon (AC) for supercapacitors was synthesized by the pyrolysis of sulfur flakes.� Sulfur was introduced into the pores of AC through thiophenic sulfur functional groups.� The incorporation of sulfur improves the electrical conductivity of the carbon network.� The addition of sulfur can obviously increase the specific capacitance and energy density of AC.
a r t i c l e i n f o
Article history:Received 22 August 2013Received in revised form21 November 2013Accepted 2 December 2013Available online 11 December 2013
Keywords:SupercapacitorSulfurSpecific capacitanceEnergy densityActivated carbon
* Corresponding author. Tel.: þ1 206 616 9084; faxE-mail address: [email protected] (G. Cao)
0378-7753/$ e see front matter � 2013 Elsevier B.V.http://dx.doi.org/10.1016/j.jpowsour.2013.12.004
a b s t r a c t
Sulfurized activated carbon (SAC), made by coating the pore surface with thiophenic sulfur functionalgroups from the pyrolysis of sulfur flakes, were characterized and tested for supercapacitor applications.From X-ray photoelectron spectroscopy (XPS), the sulfur content in the SAC was found to be 2.7 at%.Electrochemical properties from potentiostatic and galvanostatic measurements, and electrochemicalimpedance spectroscopy (EIS) were used to evaluate the effect of sulfur on porous carbon electrodes. TheSAC electrode exhibits better conductivity, and an obvious increase in specific capacitance that is almost40% higher than plain activated carbons (ACs) electrode at a high current density of 1.4 A g�1. Theproposed mechanism for improved conductivity and capacitive performance due to the sulfur functionalgroups on ACs will be discussed.
� 2013 Elsevier B.V. All rights reserved.
1. Introduction
With the rapid consumption of fossil fuels, green and sustain-able energy is going to play an increasingly important role and oneof the greatest concerns is how the energy will be stored anddeployed when needed. Currently, batteries, fuel cells, and super-capacitors are used as electric energy storage and conversion de-vices and extensive research is ongoing to improve these devices tomeet energy needs. Supercapacitors, also called electrochemicalcapacitors or ultracapacitors, have attracted much attentionbecause of their capability for pulsed power supply, long cycle life(>100,000 cycles), simple working principle, and fast chargepropagation [1e3]. Related to the energy storage mechanism,supercapacitors can be categorized as either electric double layercapacitors (EDLCs) or pseudo-capacitors. The former is based on the
: þ1 206 543 3100..
All rights reserved.
accumulation of charges at the electrode/electrolyte interface, andtherefore, capacitance is strongly dependent on the surface area ofthe electrode materials. The latter depends on the transfer of theelectrons between the electrolyte ions and the surface of theelectrode, i.e., a Faradaic reaction of the electrode materials [4e8].
Activated carbons (ACs) from different precursors and activationprocesses are widely used as electrode materials due to theirchemical stability, large surface area, good electrical conductivity,greater ability for charge accumulation on the electrode/electrolyteinterface, and lowcost [6,9]. Activated carbon electrodes (ACEs) relyon their high surface area to form the electric double layer orpromote pseudo-capacitive reactions. Although the specific surfacearea is an important parameter for carbon materials, the pore sizedistribution and pore morphology can also influence their elec-trochemical performance to a great extent [10]. However, the sur-face functionalized of ACs can also play an important role on thecarbon electrode performance, particularly by affecting the wetta-bility of the carbon surface and introducing pseudo-capacitance[6,11e16]. For example, oxygen functionalities present on the
Y. Huang et al. / Journal of Power Sources 252 (2014) 90e97 91
carbon surface can induce electron acceptor characteristics into thecarbon network to participate in Faradaic reactions, and thus, in-crease the specific capacitance of carbon in aqueous electrolytes[17e19]. However, they would be detrimental in organic electro-lytes due to irreversible redox reactions between the electrolyteand oxygen [14]. Porous carbons modified with nitrogen functionalgroups or nitrogen dopants have attracted much interest becausenitrogen functional groups contribute pseudo-capacitance throughFaradaic reactions in both aqueous [20e22] and organic electro-lytes [14,15]. Additionally, recent research demonstrated thecapacitive performance of phosphorus-rich microporous carbons.The supercapacitors prepared by carbons enriched with phos-phorus groups were stable at voltages higher than 1.3 V in H2SO4aqueous electrolyte and have a uniquely high and stable capacitiveperformance through optimization of the porous structure [23].
Sulfur, similar to the heteroatoms oxygen, nitrogen, and phos-phorus discussed above, possesses lone-pair electrons, which canalso introduce pseudo-capacitance into the carbon network and/orinfluence pore size and structure to improve the specific capaci-tance of porous carbon. So far, little research on sulfur modifiedporous carbon used for EDLCs has been reported, but there aresome researchers have used this material for other applications. Forexample, sulfur-functionalized carbon aerogels were prepared asreceptor sites for metal catalysts [24]. Sulfur-doped microporouscarbons were synthesized for the storage of hydrogen and carbondioxide [25]. For EDLCs, Hasegawa et al. [26] produced macro/meso/microporous carbon monolith electrodes doped with sulfurfrom sulfonated poly(divinyl-benzene) (PDVB) prepared withconcentrated H2SO4 and followed by carbonization and activationat 1000 �C. The resultant monolithic electrodes show high specificcapacitance and good cycle performance in aqueous electrolyteowing to both the oxidationereduction related to sulfur-containinggroups and the hierarchical porous structure. Zhao et al. [27] usedresorcinol and thioldiphenol as reactants to prepare mesoporouscarbon doped with sulfide, sulfoxide, and sulfone functionalgroups. The specific capacitance of mesoporous carbon electrodesimproved by 38% as compared to conventional ordered meso-porous carbon due to redox reactions and added electrons providedby the additional sulfone and sulfoxide species.
It is believed that sulfur-modified carbon will produce similarimprovements in organic electrolyte. In addition to increasingcapacitance, ACEs with sulfur modification might exhibit goodelectrochemical performance in organic electrolyte as the sulfurfunctional groups covering the surface may prevent undesirablechemical reactions between the impurities in AC and the electro-lyte. In this research, sulfur-modified activated carbon (SAC) wasprepared by coating the internal surface of AC with sulfur throughthermal evaporation of pure sulfur flakes. Sulfur is coated on thesurface of the highly porous carbon in order to introduce pseudo-capacitance, improve conductivity, and influence the structure ofthe pores. The SAC is then tested for supercapacitor applications.The chemical composition and pore structure are tested usingscanning electron microscopy (SEM), X-ray photoelectron spec-troscopy (XPS), and nitrogen sorption analysis. The electrochemicalproperties are characterized with cyclic voltammetry (CV), galvaniccycling (GC), and electrochemical impedance spectroscopy (EIS).
2. Experimental section
2.1. Materials synthesis
Commercially available activated carbon (AC) (Calgon CarbonCorporation, USA) and sulfur (reagent grade, flakes, w100 meshparticle size, SigmaeAldrich, Germany) with a weight ratio of 10:1were mixed with a mortar and pestle and ground into uniform
powders. Then the mixture was heat treated at 400 �C for 2 h toproduce AC that is modified by sulfur (referred hereinafter to asSAC), with a heating rate of 5 �C min�1 under a nitrogen atmo-sphere with a flow rate of 10mlmin�1. Due to part of S could be lostthrough evaporation during heating process, the SAC sample yieldof the heating process is 79%.
2.2. Characterization
Surface morphologies of the cross sections of the AC and SACsamples were observed by field emission scanning electron mi-croscopy (FESEM, JEOL JSM-7000) and the content of the sampleswas measured by energy dispersive X-ray spectroscopy (EDAX).Surface functional groups of the SAC sample were determined us-ing XPS. Spectra were taken on a Surface Science Instruments S-probe spectrometer. The X-ray spot size for these acquisitions isapproximately 800 mm with a take-off angle of 55�, correspondingto a sampling depth of approximately 50 �A. Data analyses wascarried out using Service Physics ESCA Hawk 7 Data AnalysisSoftware (Service Physics, Bend, OR).
Nitrogen sorption isotherms were analyzed by means of nitro-gen sorption at �196 �C using a Quantachrome NOVA 4200e.Samples were degassed at 120 �C under vacuum for at least6 h prior to measurement. The multipoint BrunauereEmmetteTeller (BET) method is used to determine the total surface area. Forthe mesopore surface area, pore volume, and pore diameter, theBarretteJoynereHalenda (BJH) method is used. Micropore surfacearea and pore volume are determined using the t-method, and themicropore diameter is determined using the DubinineAstakhov(DA) method.
2.3. Electrochemical analysis
Electrodes for electrochemical measurements were preparedfrom the AC and SAC samples by first grinding the large particlesinto fine powders. Approximately 3 wt% of polytetrafluoroethylene(PTFE) was added as a binder. The mixture was rolled into sheetswith a thickness of 0.07 mm and electrodes were punched out witha diameter of 10.2 mm. The materials loading rates of both the ACand SAC electrodes are 4.16 � 10�3 g cm�2. A Celgard� porous filmseparates the electrodes and specially coated aluminum contactswere used to reduce the interfacial effect. To test the electrodes, asymmetrical two-electrode test cell was constructed with the AC orthe SAC sample as the counter and reference electrode. The elec-trolyte used was tetraethylammonium tetrafluoroborate (TEATFB)in saturated 50/50 propylene carbonate-dimethylcarbonate. Theelectrode assembly was placed in a coin cell and electrolyte wasadded in an argon-rich environment. The samples were placedunder vacuum three times to increase the penetration of theelectrolyte into the pores.
Cyclic voltammograms (CVs) and galvanic cycles (GCs) werecarried out using a Solartron 1287A with a voltage range between0 and 2 V. The CVs were measured at scan rates of 10, 50, and100 mV s�1 and the GCs at 0.07, 0.14, 0.7, and 1.4 A g�1. EIS wasperformed using the Solartron 1287A in conjunction with a Solar-tron 1260FRA/impedance analyzer. An AC voltage amplitude of10 mV and frequency range of 0.1 MHze1 mHz was used for thisscan. The specific capacitance of the single electrode in Farad pergram (F g�1) is calculated from the discharge slope during galvaniccycling according to the following equation [23,28]:
Cspec ¼ 4IDt/DVm (1)
where I is the discharge current in amps, Dt is the discharge time inseconds, DV is the discharge voltage in volts, andm is the total mass
Y. Huang et al. / Journal of Power Sources 252 (2014) 90e9792
of the active materials in both electrodes given in grams. The spe-cific capacitance based on the BET surface area is calculated usingEqn. (2) [16]:
CBET ¼ Cspec (F g�1)/SBET (m2 g�1) (2)
Where SBET is the specific surface area of the electrode. Energydensity in Watt-hours per kilogram (Wh kg�1) and power densityin Watts per kilogram (W kg�1) are calculated using the followingequations [23]:
E ¼ (Cspec*DV2)/2 (3)
P ¼ [(I*DV)/2*m] (4)
3. Results and discussion
3.1. Composition and structure
XPS was used to determine the chemical state of sulfur in thecarbon network. The results fromXPS are shown in Table 1. Since nospecial handling or pretreatment was performed, O2 and H2O fromthe ambient environmentwere probably adsorbed on the surface ofthe samples. Additionally, oxygen is also a common impurity in theAC. The sulfur content of the SAC sample is 2.7 at%, indicative of thepresence of sulfur in the AC after heat-treatment.
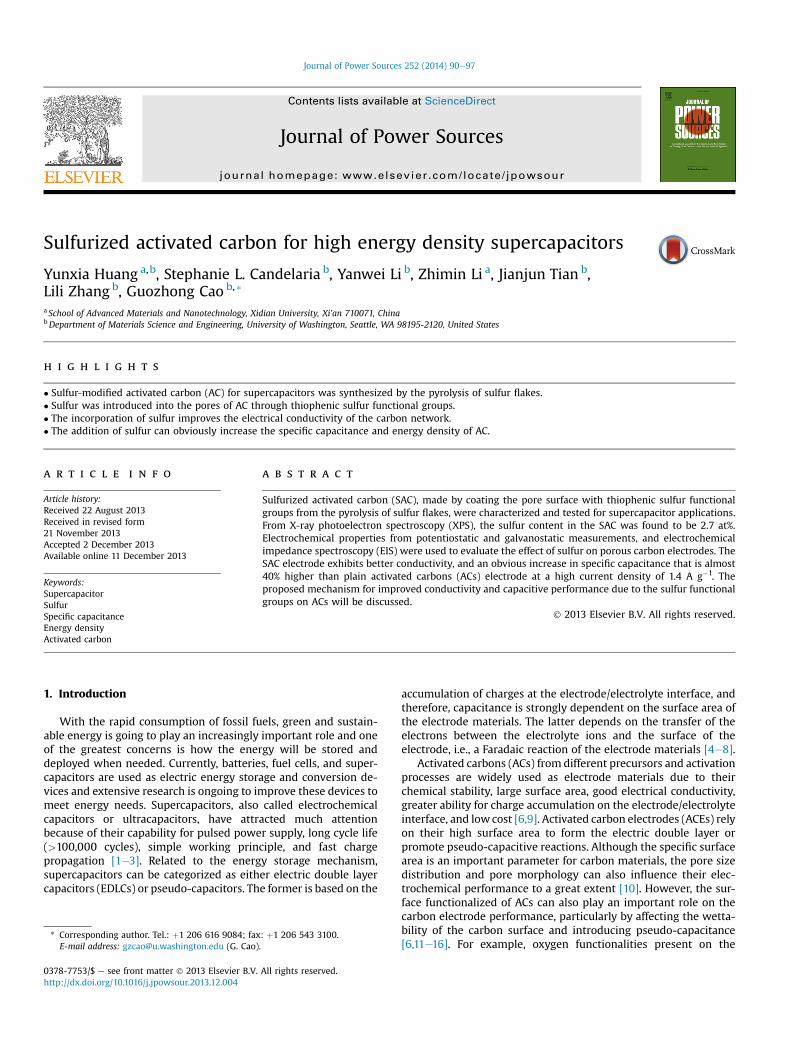
Fig. 1 shows high resolution XPS spectra of C 1s and S 2p for theSAC sample. As seen in Fig. 1a, the asymmetric C1s spectrum couldbe fit with three peaks. The peak observed at about 285.0 eV isconsistent with graphitic sp2 carbon [25], which indicates thestructure of carbon in the sample. The peaks at 286.3 eV representscarbon bound to one oxygen or sulfur by a single bond (e.g., CeO,CeS) [29,30]. The 289.3 eV peak are derived from OeC]O bond[29,31]. The XPS spectrum for S 2p shown in Fig. 1b indicates that Sis incorporated in the graphitic ring structure. The S 2p core levelline exhibits S 2p3/2 and S 2p1/2 signals at 164.2 eV and 165.4 eV,respectively, as well as a trace peak at 168.5 eV. The S 2p3/2 and S2p1/2 peaks constrained by 2:1 concentration ratio and 1.2 eVbinding energy separation correspond to spin-orbital splitting ofthiophenic sulfur atoms incorporated into graphite structure, i.e.sulfur dominated in the carbon framework through the formationof the CeS bond [24,29,32]. The trace peak at 168.5 eV is located atthe expected position for sulfone groups [27,29].
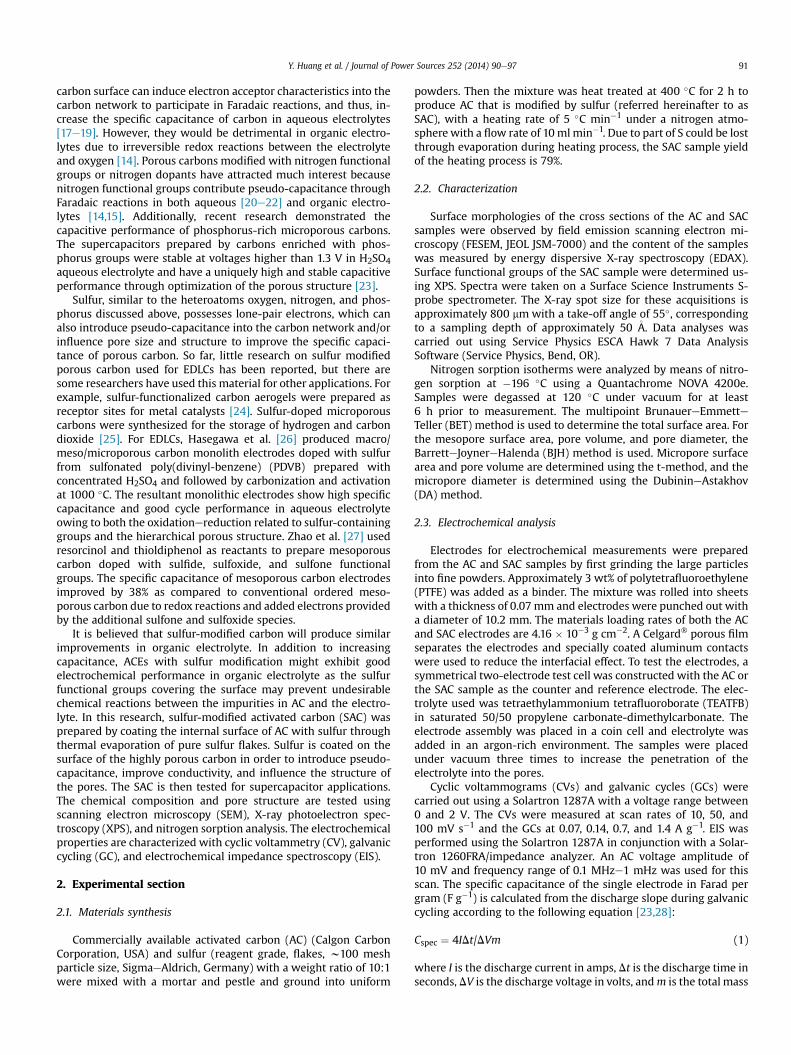
Fig. 2a and b show SEM images of the cross-section of the un-modified and S-modified AC samples, respectively. It can be seenthat the surface morphologies of the AC and SAC samples have noobvious difference and macro-pores are visible in the images. TheSAC sample still retains the porous structure after modificationwith sulfur. The elemental mappings for C and S from the same areaof the SAC sample are shown in Fig. 2c and d. The images indicateuniform presence of sulfur throughout the sample. The sulfurcontent in the SAC sample derived from the EDAX analysis shown inTable 1 is close to the value obtained from XPS analysis, furtherimplying the sulfur functional groups are homogenously distrib-uted in the SAC sample.
Table 1Chemical composition (at %) from EDAX and XPS.
Element Composition (at %)
AC sample(from EDAX)
SAC sample(from EDAX)
SAC sample(from XPS)
C 88.7 93.9 87.3O 11.4 3.4 10.0S e 2.7 2.7
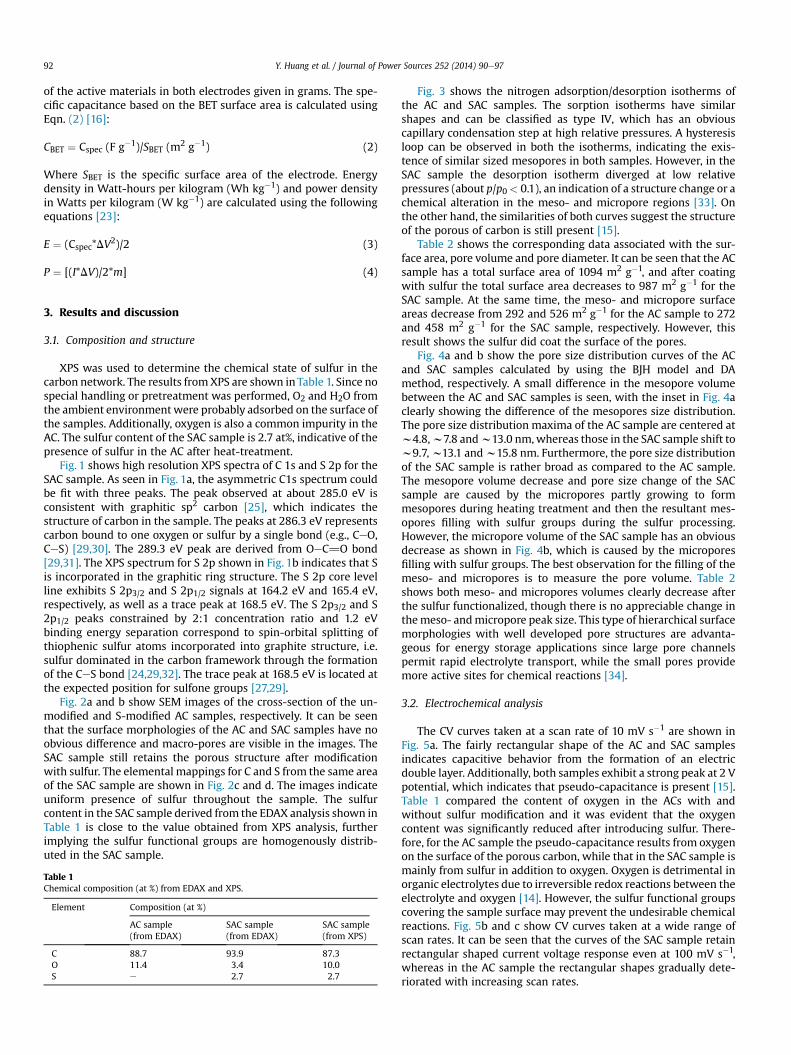
Fig. 3 shows the nitrogen adsorption/desorption isotherms ofthe AC and SAC samples. The sorption isotherms have similarshapes and can be classified as type IV, which has an obviouscapillary condensation step at high relative pressures. A hysteresisloop can be observed in both the isotherms, indicating the exis-tence of similar sized mesopores in both samples. However, in theSAC sample the desorption isotherm diverged at low relativepressures (about p/p0< 0.1), an indication of a structure change or achemical alteration in the meso- and micropore regions [33]. Onthe other hand, the similarities of both curves suggest the structureof the porous of carbon is still present [15].
Table 2 shows the corresponding data associated with the sur-face area, pore volume and pore diameter. It can be seen that the ACsample has a total surface area of 1094 m2 g�1, and after coatingwith sulfur the total surface area decreases to 987 m2 g�1 for theSAC sample. At the same time, the meso- and micropore surfaceareas decrease from 292 and 526 m2 g�1 for the AC sample to 272and 458 m2 g�1 for the SAC sample, respectively. However, thisresult shows the sulfur did coat the surface of the pores.
Fig. 4a and b show the pore size distribution curves of the ACand SAC samples calculated by using the BJH model and DAmethod, respectively. A small difference in the mesopore volumebetween the AC and SAC samples is seen, with the inset in Fig. 4aclearly showing the difference of the mesopores size distribution.The pore size distribution maxima of the AC sample are centered atw4.8,w7.8 andw13.0 nm,whereas those in the SAC sample shift tow9.7,w13.1 andw15.8 nm. Furthermore, the pore size distributionof the SAC sample is rather broad as compared to the AC sample.The mesopore volume decrease and pore size change of the SACsample are caused by the micropores partly growing to formmesopores during heating treatment and then the resultant mes-opores filling with sulfur groups during the sulfur processing.However, the micropore volume of the SAC sample has an obviousdecrease as shown in Fig. 4b, which is caused by the microporesfilling with sulfur groups. The best observation for the filling of themeso- and micropores is to measure the pore volume. Table 2shows both meso- and micropores volumes clearly decrease afterthe sulfur functionalized, though there is no appreciable change inthemeso- andmicropore peak size. This type of hierarchical surfacemorphologies with well developed pore structures are advanta-geous for energy storage applications since large pore channelspermit rapid electrolyte transport, while the small pores providemore active sites for chemical reactions [34].
3.2. Electrochemical analysis
The CV curves taken at a scan rate of 10 mV s�1 are shown inFig. 5a. The fairly rectangular shape of the AC and SAC samplesindicates capacitive behavior from the formation of an electricdouble layer. Additionally, both samples exhibit a strong peak at 2 Vpotential, which indicates that pseudo-capacitance is present [15].Table 1 compared the content of oxygen in the ACs with andwithout sulfur modification and it was evident that the oxygencontent was significantly reduced after introducing sulfur. There-fore, for the AC sample the pseudo-capacitance results from oxygenon the surface of the porous carbon, while that in the SAC sample ismainly from sulfur in addition to oxygen. Oxygen is detrimental inorganic electrolytes due to irreversible redox reactions between theelectrolyte and oxygen [14]. However, the sulfur functional groupscovering the sample surface may prevent the undesirable chemicalreactions. Fig. 5b and c show CV curves taken at a wide range ofscan rates. It can be seen that the curves of the SAC sample retainrectangular shaped current voltage response even at 100 mV s�1,whereas in the AC sample the rectangular shapes gradually dete-riorated with increasing scan rates.
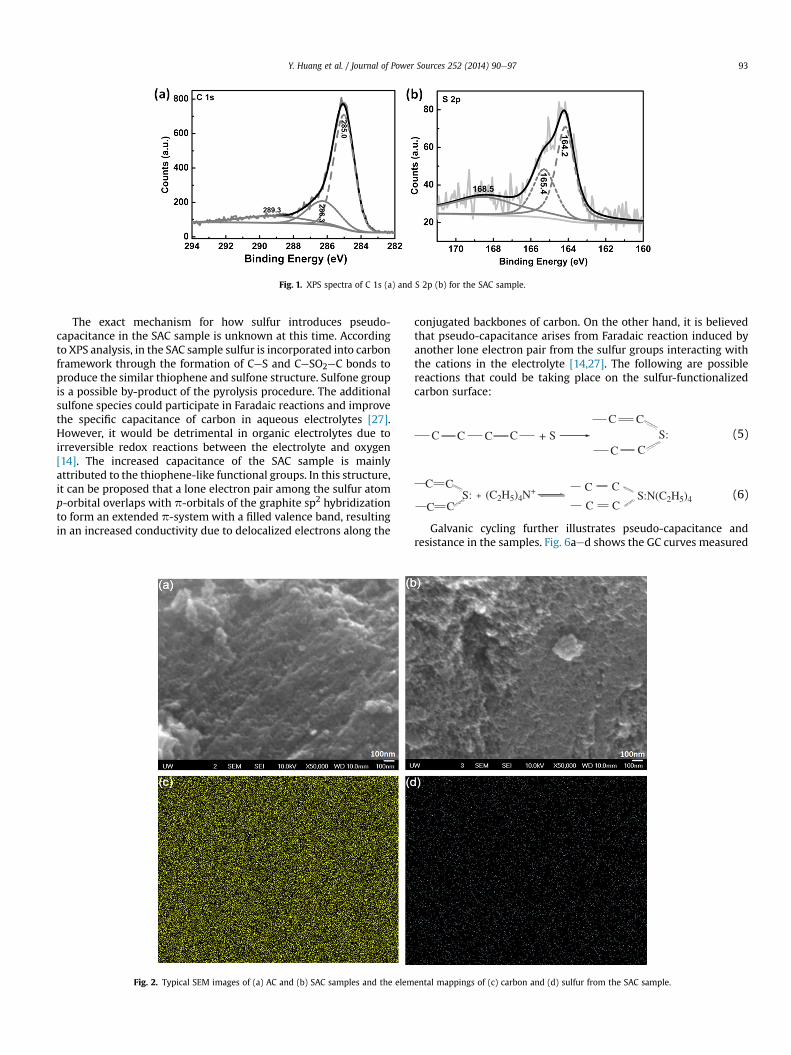
Fig. 1. XPS spectra of C 1s (a) and S 2p (b) for the SAC sample.
Y. Huang et al. / Journal of Power Sources 252 (2014) 90e97 93
The exact mechanism for how sulfur introduces pseudo-capacitance in the SAC sample is unknown at this time. Accordingto XPS analysis, in the SAC sample sulfur is incorporated into carbonframework through the formation of CeS and CeSO2eC bonds toproduce the similar thiophene and sulfone structure. Sulfone groupis a possible by-product of the pyrolysis procedure. The additionalsulfone species could participate in Faradaic reactions and improvethe specific capacitance of carbon in aqueous electrolytes [27].However, it would be detrimental in organic electrolytes due toirreversible redox reactions between the electrolyte and oxygen[14]. The increased capacitance of the SAC sample is mainlyattributed to the thiophene-like functional groups. In this structure,it can be proposed that a lone electron pair among the sulfur atomp-orbital overlaps with p-orbitals of the graphite sp2 hybridizationto form an extended p-system with a filled valence band, resultingin an increased conductivity due to delocalized electrons along the
Fig. 2. Typical SEM images of (a) AC and (b) SAC samples and the elem
conjugated backbones of carbon. On the other hand, it is believedthat pseudo-capacitance arises from Faradaic reaction induced byanother lone electron pair from the sulfur groups interacting withthe cations in the electrolyte [14,27]. The following are possiblereactions that could be taking place on the sulfur-functionalizedcarbon surface:
C C C C + S
C C
CS:
C(5)
C C
CS:
C+
C C
C C(C2H5)4N+ S:N(C2H5)4 (6)
Galvanic cycling further illustrates pseudo-capacitance andresistance in the samples. Fig. 6aed shows the GC curves measured
ental mappings of (c) carbon and (d) sulfur from the SAC sample.
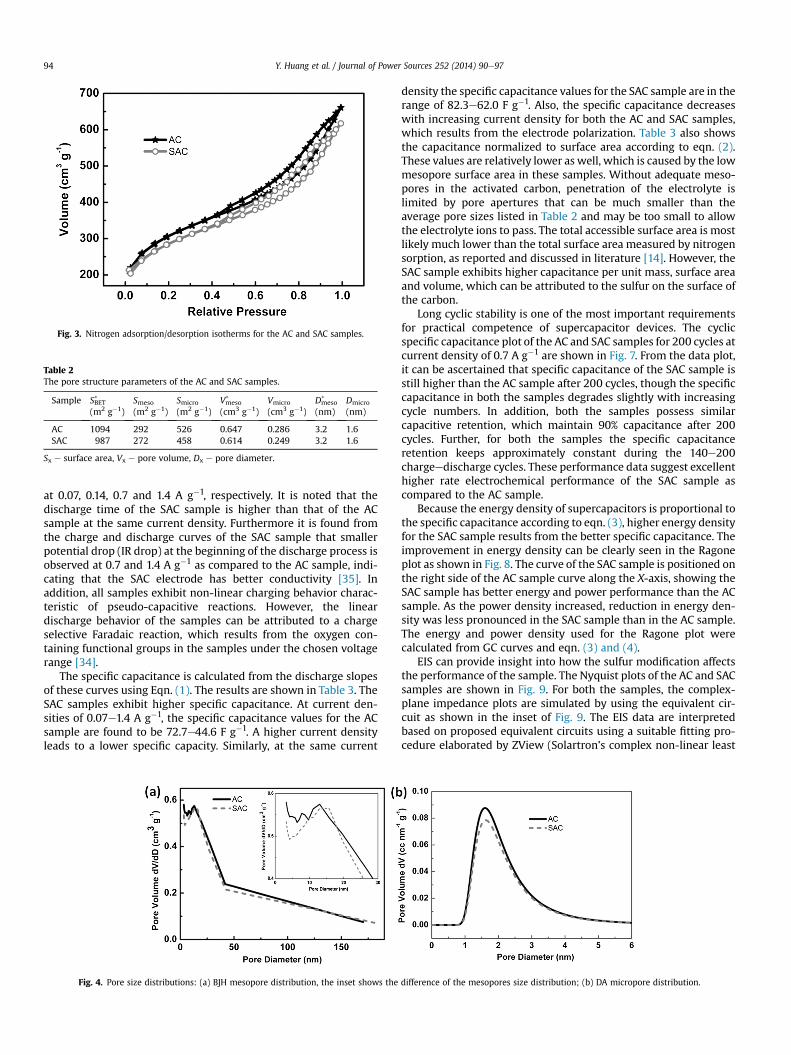
Fig. 3. Nitrogen adsorption/desorption isotherms for the AC and SAC samples.
Table 2The pore structure parameters of the AC and SAC samples.
Sample SBET*
(m2 g�1)Smeso
(m2 g�1)Smicro
(m2 g�1)Vmeso*
(cm3 g�1)Vmicro
(cm3 g�1)Dmeso*
(nm)Dmicro
(nm)
AC 1094 292 526 0.647 0.286 3.2 1.6SAC 987 272 458 0.614 0.249 3.2 1.6
Sx e surface area, Vx e pore volume, Dx e pore diameter.
Y. Huang et al. / Journal of Power Sources 252 (2014) 90e9794
at 0.07, 0.14, 0.7 and 1.4 A g�1, respectively. It is noted that thedischarge time of the SAC sample is higher than that of the ACsample at the same current density. Furthermore it is found fromthe charge and discharge curves of the SAC sample that smallerpotential drop (IR drop) at the beginning of the discharge process isobserved at 0.7 and 1.4 A g�1 as compared to the AC sample, indi-cating that the SAC electrode has better conductivity [35]. Inaddition, all samples exhibit non-linear charging behavior charac-teristic of pseudo-capacitive reactions. However, the lineardischarge behavior of the samples can be attributed to a chargeselective Faradaic reaction, which results from the oxygen con-taining functional groups in the samples under the chosen voltagerange [34].
The specific capacitance is calculated from the discharge slopesof these curves using Eqn. (1). The results are shown in Table 3. TheSAC samples exhibit higher specific capacitance. At current den-sities of 0.07e1.4 A g�1, the specific capacitance values for the ACsample are found to be 72.7e44.6 F g�1. A higher current densityleads to a lower specific capacity. Similarly, at the same current
Fig. 4. Pore size distributions: (a) BJH mesopore distribution, the inset shows the
density the specific capacitance values for the SAC sample are in therange of 82.3e62.0 F g�1. Also, the specific capacitance decreaseswith increasing current density for both the AC and SAC samples,which results from the electrode polarization. Table 3 also showsthe capacitance normalized to surface area according to eqn. (2).These values are relatively lower as well, which is caused by the lowmesopore surface area in these samples. Without adequate meso-pores in the activated carbon, penetration of the electrolyte islimited by pore apertures that can be much smaller than theaverage pore sizes listed in Table 2 and may be too small to allowthe electrolyte ions to pass. The total accessible surface area is mostlikely much lower than the total surface area measured by nitrogensorption, as reported and discussed in literature [14]. However, theSAC sample exhibits higher capacitance per unit mass, surface areaand volume, which can be attributed to the sulfur on the surface ofthe carbon.
Long cyclic stability is one of the most important requirementsfor practical competence of supercapacitor devices. The cyclicspecific capacitance plot of the AC and SAC samples for 200 cycles atcurrent density of 0.7 A g�1 are shown in Fig. 7. From the data plot,it can be ascertained that specific capacitance of the SAC sample isstill higher than the AC sample after 200 cycles, though the specificcapacitance in both the samples degrades slightly with increasingcycle numbers. In addition, both the samples possess similarcapacitive retention, which maintain 90% capacitance after 200cycles. Further, for both the samples the specific capacitanceretention keeps approximately constant during the 140e200chargeedischarge cycles. These performance data suggest excellenthigher rate electrochemical performance of the SAC sample ascompared to the AC sample.
Because the energy density of supercapacitors is proportional tothe specific capacitance according to eqn. (3), higher energy densityfor the SAC sample results from the better specific capacitance. Theimprovement in energy density can be clearly seen in the Ragoneplot as shown in Fig. 8. The curve of the SAC sample is positioned onthe right side of the AC sample curve along the X-axis, showing theSAC sample has better energy and power performance than the ACsample. As the power density increased, reduction in energy den-sity was less pronounced in the SAC sample than in the AC sample.The energy and power density used for the Ragone plot werecalculated from GC curves and eqn. (3) and (4).
EIS can provide insight into how the sulfur modification affectsthe performance of the sample. The Nyquist plots of the AC and SACsamples are shown in Fig. 9. For both the samples, the complex-plane impedance plots are simulated by using the equivalent cir-cuit as shown in the inset of Fig. 9. The EIS data are interpretedbased on proposed equivalent circuits using a suitable fitting pro-cedure elaborated by ZView (Solartron’s complex non-linear least
difference of the mesopores size distribution; (b) DA micropore distribution.
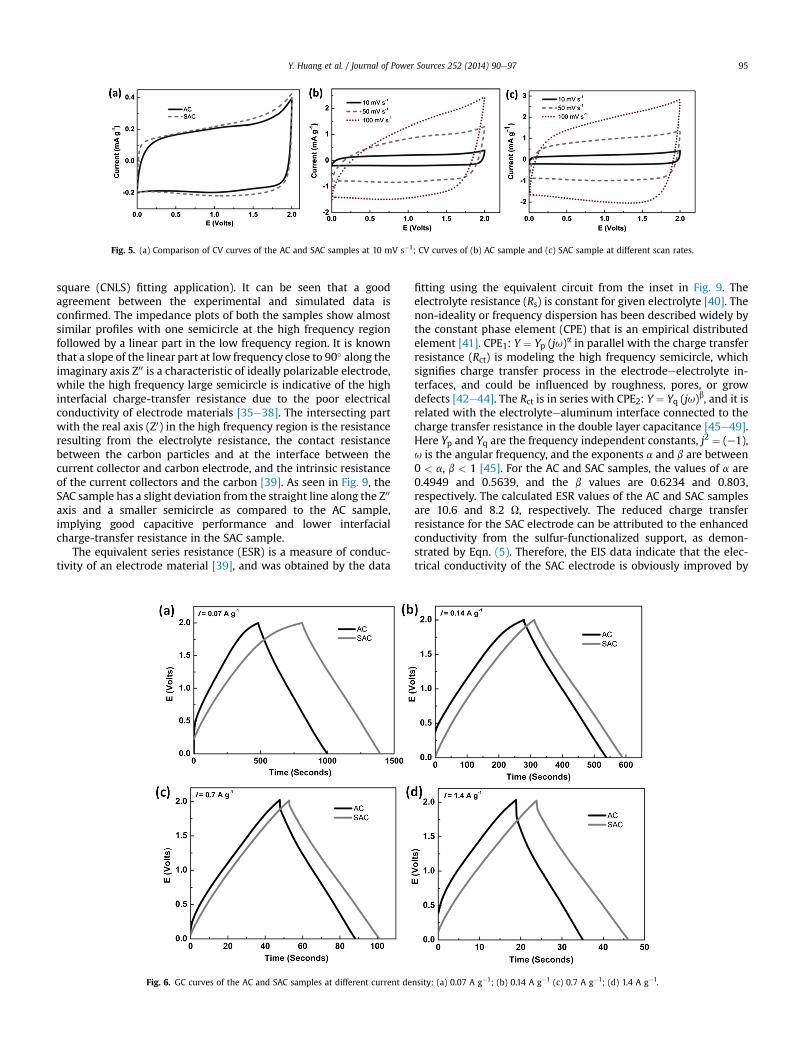
Fig. 5. (a) Comparison of CV curves of the AC and SAC samples at 10 mV s�1; CV curves of (b) AC sample and (c) SAC sample at different scan rates.
Y. Huang et al. / Journal of Power Sources 252 (2014) 90e97 95
square (CNLS) fitting application). It can be seen that a goodagreement between the experimental and simulated data isconfirmed. The impedance plots of both the samples show almostsimilar profiles with one semicircle at the high frequency regionfollowed by a linear part in the low frequency region. It is knownthat a slope of the linear part at low frequency close to 90� along theimaginary axis Z00 is a characteristic of ideally polarizable electrode,while the high frequency large semicircle is indicative of the highinterfacial charge-transfer resistance due to the poor electricalconductivity of electrode materials [35e38]. The intersecting partwith the real axis (Z0) in the high frequency region is the resistanceresulting from the electrolyte resistance, the contact resistancebetween the carbon particles and at the interface between thecurrent collector and carbon electrode, and the intrinsic resistanceof the current collectors and the carbon [39]. As seen in Fig. 9, theSAC sample has a slight deviation from the straight line along the Z00
axis and a smaller semicircle as compared to the AC sample,implying good capacitive performance and lower interfacialcharge-transfer resistance in the SAC sample.
The equivalent series resistance (ESR) is a measure of conduc-tivity of an electrode material [39], and was obtained by the data
Fig. 6. GC curves of the AC and SAC samples at different current de
fitting using the equivalent circuit from the inset in Fig. 9. Theelectrolyte resistance (Rs) is constant for given electrolyte [40]. Thenon-ideality or frequency dispersion has been described widely bythe constant phase element (CPE) that is an empirical distributedelement [41]. CPE1: Y ¼ Yp (ju)a in parallel with the charge transferresistance (Rct) is modeling the high frequency semicircle, whichsignifies charge transfer process in the electrodeeelectrolyte in-terfaces, and could be influenced by roughness, pores, or growdefects [42e44]. The Rct is in series with CPE2: Y ¼ Yq (ju)b, and it isrelated with the electrolyteealuminum interface connected to thecharge transfer resistance in the double layer capacitance [45e49].Here Yp and Yq are the frequency independent constants, j2 ¼ (e1),u is the angular frequency, and the exponents a and b are between0 < a, b < 1 [45]. For the AC and SAC samples, the values of a are0.4949 and 0.5639, and the b values are 0.6234 and 0.803,respectively. The calculated ESR values of the AC and SAC samplesare 10.6 and 8.2 U, respectively. The reduced charge transferresistance for the SAC electrode can be attributed to the enhancedconductivity from the sulfur-functionalized support, as demon-strated by Eqn. (5). Therefore, the EIS data indicate that the elec-trical conductivity of the SAC electrode is obviously improved by
nsity: (a) 0.07 A g�1; (b) 0.14 A g�1 (c) 0.7 A g�1; (d) 1.4 A g�1.
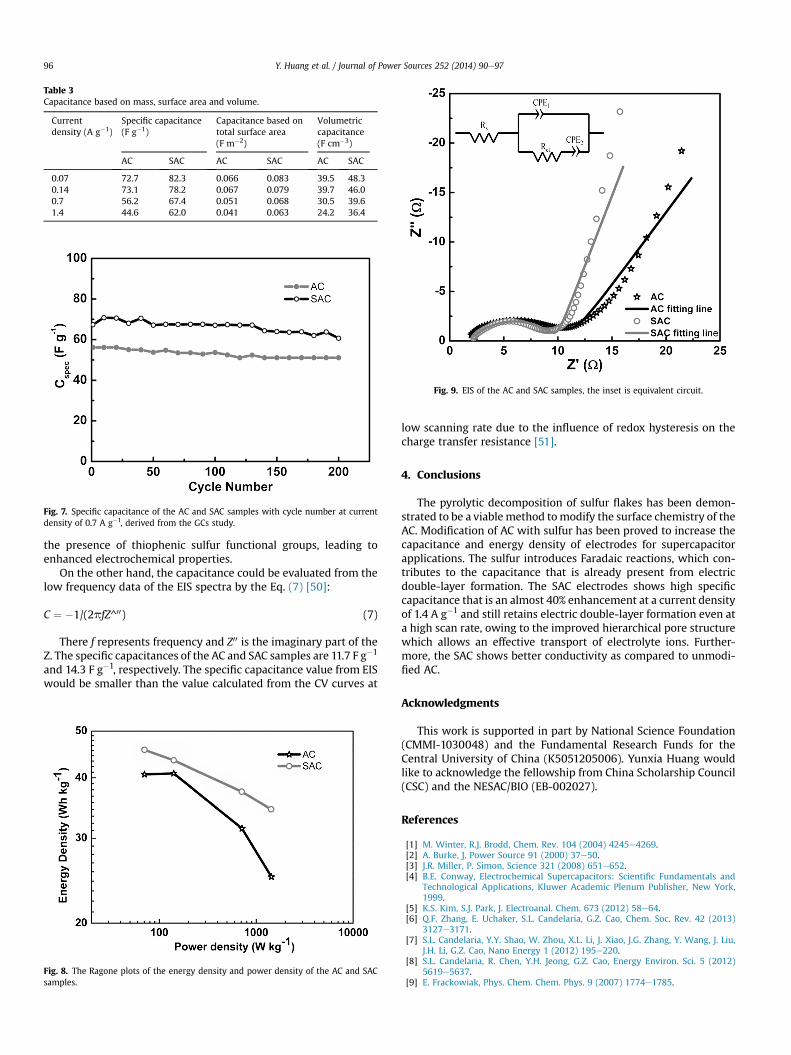
Table 3Capacitance based on mass, surface area and volume.
Currentdensity (A g�1)
Specific capacitance(F g�1)
Capacitance based ontotal surface area(F m�2)
Volumetriccapacitance(F cm�3)
AC SAC AC SAC AC SAC
0.07 72.7 82.3 0.066 0.083 39.5 48.30.14 73.1 78.2 0.067 0.079 39.7 46.00.7 56.2 67.4 0.051 0.068 30.5 39.61.4 44.6 62.0 0.041 0.063 24.2 36.4
Fig. 7. Specific capacitance of the AC and SAC samples with cycle number at currentdensity of 0.7 A g�1, derived from the GCs study.
Fig. 9. EIS of the AC and SAC samples, the inset is equivalent circuit.
Y. Huang et al. / Journal of Power Sources 252 (2014) 90e9796
the presence of thiophenic sulfur functional groups, leading toenhanced electrochemical properties.
On the other hand, the capacitance could be evaluated from thelow frequency data of the EIS spectra by the Eq. (7) [50]:
C ¼ �1/(2pfZ^00) (7)
There f represents frequency and Z00 is the imaginary part of theZ. The specific capacitances of the AC and SAC samples are 11.7 F g�1
and 14.3 F g�1, respectively. The specific capacitance value from EISwould be smaller than the value calculated from the CV curves at
Fig. 8. The Ragone plots of the energy density and power density of the AC and SACsamples.
low scanning rate due to the influence of redox hysteresis on thecharge transfer resistance [51].
4. Conclusions
The pyrolytic decomposition of sulfur flakes has been demon-strated to be a viable method tomodify the surface chemistry of theAC. Modification of AC with sulfur has been proved to increase thecapacitance and energy density of electrodes for supercapacitorapplications. The sulfur introduces Faradaic reactions, which con-tributes to the capacitance that is already present from electricdouble-layer formation. The SAC electrodes shows high specificcapacitance that is an almost 40% enhancement at a current densityof 1.4 A g�1 and still retains electric double-layer formation even ata high scan rate, owing to the improved hierarchical pore structurewhich allows an effective transport of electrolyte ions. Further-more, the SAC shows better conductivity as compared to unmodi-fied AC.
Acknowledgments
This work is supported in part by National Science Foundation(CMMI-1030048) and the Fundamental Research Funds for theCentral University of China (K5051205006). Yunxia Huang wouldlike to acknowledge the fellowship from China Scholarship Council(CSC) and the NESAC/BIO (EB-002027).
References
[1] M. Winter, R.J. Brodd, Chem. Rev. 104 (2004) 4245e4269.[2] A. Burke, J. Power Source 91 (2000) 37e50.[3] J.R. Miller, P. Simon, Science 321 (2008) 651e652.[4] B.E. Conway, Electrochemical Supercapacitors: Scientific Fundamentals and
Technological Applications, Kluwer Academic Plenum Publisher, New York,1999.
[5] K.S. Kim, S.J. Park, J. Electroanal. Chem. 673 (2012) 58e64.[6] Q.F. Zhang, E. Uchaker, S.L. Candelaria, G.Z. Cao, Chem. Soc. Rev. 42 (2013)
3127e3171.[7] S.L. Candelaria, Y.Y. Shao, W. Zhou, X.L. Li, J. Xiao, J.G. Zhang, Y. Wang, J. Liu,
J.H. Li, G.Z. Cao, Nano Energy 1 (2012) 195e220.[8] S.L. Candelaria, R. Chen, Y.H. Jeong, G.Z. Cao, Energy Environ. Sci. 5 (2012)
5619e5637.[9] E. Frackowiak, Phys. Chem. Chem. Phys. 9 (2007) 1774e1785.
Y. Huang et al. / Journal of Power Sources 252 (2014) 90e97 97
[10] B.B. Garcia, A.M. Feaver, Q.F. Zhang, R.D. Champion, G.Z. Cao, T.T. Fister,K.P. Nagle, G.T. Seidler, J. Appl. Phys. 104 (2008), 014305-1-9.
[11] A.G. Pandolfo, A.F. Hollenkamp, J. Power Sources 157 (2006) 11e27.[12] M. Seredych, D. Hulicova-Jurcakova, G.Q. Lu, T.J. Bandosz, Carbon 46 (2008)
1475e1488.[13] C. Largeot, C. Portet, J. Chmiola, P.L. Taberna, Y. Gogotsi, P. Simon, J. Am. Chem.
Soc. 130 (2008) 2730e2731.[14] S.L. Candelaria, B.B. Garcia, D.W. Liu, G.Z. Cao, J. Mater. Chem. 22 (2012) 9884e
9889.[15] B.B. Garcia, S.L. Candelaria, G.Z. Cao, J. Mater. Sci. 47 (2012) 5996e6004.[16] S. Sepehri, B.B. Garcia, Q.F. Zhang, G.Z. Cao, Carbon 47 (2009) 1436e1443.[17] H.A. Andreas, B.E. Conway, Electrochim. Acta 51 (2006) 6510e6520.[18] M.A. Montes-Moran, D. Suarez, J.A. Menendez, A.E. Fuente, Carbon 42 (2004)
1219e1225.[19] K. Jurewicz, K. Babel, A. Ziolkowski, H. Wachowska, Electrochim. Acta 48
(2003) 1491e1498.[20] D. Hulicova-Jurcakova, M. Kodama, S. Shiraishi, H. Hatori, Z.H. Zhu, G.Q. Lu,
Adv. Funct. Mater. 19 (2009) 1800e1809.[21] D. Hulicova, J. Yamashita, Y. Soneda, H. Hatori, M. Kodama, Chem. Mater. 17
(2005) 1241e1247.[22] F. Beguin, K. Szostak, G. Lota, E. Frackowiak, Adv. Mater. 17 (2005) 2380e
2384.[23] D. Hulicova-Jurcakova, A.M. Puziy, O.I. Poddubnaya, F. Suarez-Garcia,
J.M.D. Tascon, G.Q. Lu, J. Am. Chem. Soc. 131 (2009) 5026e5027.[24] W.S. Baker, J.W. Long, R.M. Strouda, D.R. Rolison, J. Non-Cryst. Solids 350
(2004) 80e87.[25] Y.D. Xia, Y.Q. Zhu, Y. Tang, Carbon 50 (2012) 5543e5553.[26] G. Hasegawa, M. Aoki, K. Kanamori, K. Nakanishi, T. Hanada, K. Tadanaga,
J. Mater. Chem. 21 (2011) 2060e2063.[27] X.C. Zhao, Q. Zhang, C.M. Chen, B.S. Zhang, S. Reichea, A.Q. Wang, T. Zhang,
R. Schlogl, D.S. Su, Nano Energy 1 (2012) 624e630.[28] Z.B. Lei, Z.W. Chen, X.S. Zhao, J. Phys. Chem. C 114 (2010) 19867e19874.[29] S.R. Kelemen, M. Afeworki, M.L. Gorbaty, M. Sansone, P.J. Kwiatek,
C.C. Walters, H. Freund, M. Siskin, Energy Fuels 21 (2007) 1548e1561.
[30] H.X. Wang, H. Zhou, A. Gestos, J. Fang, H. Niu, J. Ding, T. Lin, Soft Matter 9(2013) 277e282.
[31] Z. Konya, I. Vesselenyi, K. Niesz, A. Kukovecz, A. Demortier, A. Fonseca,J. Delhalle, Z. Mekhalif, J.B. Nagy, A.A. Koos, Z. Osvath, A. Kocsonya, L.P. Biro,I. Kiricsi, Chem. Phys. Lett. 360 (2002) 429e435.
[32] S. Glenis, A.J. Nelson, M.M. Labes, J. Appl. Phys. 86 (1999) 4464e4466.[33] G.Q. Lu, X.S. Zhao, Nanoporous Materials Science and Engineering, Imperial
College Press, London, 2004.[34] B.B. Garcia, S.L. Candelaria, D.W. Liu, S. Sepheri, J.A. Cruz, G.Z. Cao, Renewable
Energy 36 (2011) 1788e1794.[35] W. Xiong, M.X. Liu, L.H. Gan, Y.K. Lv, Y. Li, L. Yang, Z.J. Xu, Z.X. Hao, H.L. Liu,
L.W. Chen, J. Power Sources 196 (2011) 10461e10464.[36] W. Sugimoto, H. Iwata, K. Yokoshima, Y. Murakami, Y. Takasu, J. Phys. Chem. B
109 (2005) 7330e7338.[37] J.T. Zhang, J.W. Jiang, X.S. Zhao, J. Phys. Chem. C 115 (2011) 6448e6454.[38] Y.R. Nian, H. Teng, J. Electrochem. Soc. 149 (2002) A1008eA1014.[39] S.K. Meher, G.R. Rao, J. Power Sources 215 (2012) 317e328.[40] C. Kim, K.S. Yang, Appl. Phys. Lett. 83 (2003) 1216e1218.[41] H.K. Song, H.Y. Hwang, K.H. Lee, L.H. Dao, Electrochim. Acta 45 (2000) 2241e
2257.[42] S.K. Meher, P. Justin, G.R. Rao, Electrochim. Acta 55 (2010) 8388e8396.[43] C.C. Hu, K.H. Chang, T.Y. Hsu, J. Electrochem. Soc. 155 (2008) F196eF200.[44] O.M.S. Quintero, W.A. Chaparro, L. Ipaz, J.E.S. Barco, F.E. Beltrán, G. Zambrano,
Mater. Res. 16 (2013) 204e214.[45] C. Liu, Q. Bi, A. Matthews, Corros. Sci. 43 (2001) 1953e1961.[46] J.H. Lee, S.H. Ahn, J.G. Kim, Surf. Coat Technol. 190 (2005) 417e427.[47] Y.Y. Chang, D.Y. Wang, Surf. Coat Technol. 188e189 (2004) 478e483.[48] S.H. Ahn, J.H. Yoo, Y.S. Choi, J.G. Kim, J.G. Han Surf, Coat Technol. 162 (2003)
212e221.[49] D.K. Merl, P. Panjan, M. �Cekada, M. Ma�cek, Electrochim. Acta 49 (2004) 1527e
1533.[50] J. Wang, Y. l. Xu, X. hen, X.F. Sun, Combust. Sci. Technol. 67 (2007) 2981e2985.[51] R. Hass, J. García-Canadas, G. Garcia-Belmonte, J. Electroanal. Chem. 577
(2005) 99e105.