Embed Size (px)
Citation preview

Oct-Dec12 Vol. II No. IV Journal of Management Value & Ethics
1
RNI – MPENG01094 ISSN-2249-9512
Journal of Management Value & Ethics
(A quarterly Publication of GMA)(A quarterly Publication of GMA)(A quarterly Publication of GMA)(A quarterly Publication of GMA)
Editor in Chief/ Managing Editor Dr. Prabhakar Singh Bhadouria
Editor Dr. A.K. Jha
Editorial & Advisory Board Dr. Umesh Holani
Professor, SOS in Commerce, Jiwaji University, Gwalior (M.P.) Dr. Bateshwar Singh
Professor (Finance), Arni University Kangra, Himachal Pradesh Dr. Sandeep Kulshreshtha Professor, IITTM, Gwalior (M.P.)
Dr. Yogesh Upadhyay Professor & Dean, SOS in Management. Jiwaji University, Gwalior (M.P.)
Dr. S. P. Bansal Professor, Institute of vocational (Tourism) studies, H.P. University, Shimla (H.P.)
Dr. Harish Kumar Agrawal Professor, Deptt. of Commerce K.R.G. College, Gwalior
Dr. K.S. Thakur Professor, SOS in Commerce. Jiwaji University, Gwalior
Dr. S.K.Singh Professor, SOS in Commerce, Jiwaji University, Gwalior (M.P.)
Dr. Ajay Dwivedi Associate Professor, Financial Studies, V.B.P. University, Jaunpur, (U.P.)
Dr. Ajay Wagh Associate Professor, Deptt of Management, IGNTU, Amarkantak (M.P.)
Dr. Manoj Patwardhan Associate Professor, ABV-IIITM, Gwalior
Dr. Avinash D. Pathardikar Associate Professor, Deptt. of HRD. V.B.P. University, Jaunpur (U.P.)
Dr. Md. Kamalun Nabi Assistant Professor, Jamia Millia Islamia University, Delhi
Editorial Team : Mr. Ravi Jain, Asst. Professor (Visiting), Centre for Hospital Admn. Jiwaji University Gwalior (M.P.) Dr. Praveen Shrivastava, Asst. Professor I.T.M. University, Gwalior Mr. Mohit Sharma, Asst. Professor, I.M.S. Greater Noida Mr. Gaurav Jaiswal, Asst. Professor, Prestige Institute of Mgmt., Gwalior Dr. Mukesh Singh Tomar, Asst. Professor, Dept. of Mgmt., NITM, Gwalior
Editorial, Advertisement, Administration, Publication, Circulation & National office : Executive Director GMA
C-17 Kailash Nager, Near New High Court, Gwalior-M.P. 474006 (INDIA) Phone No. 0751-2230233,9425121133

Oct-Dec12 Vol. II No. IV Journal of Management Value & Ethics
2
C O N T E N T S Vol. III No. IV Oct-Dec 2012
S.No. Articles Page
1. A review study on Islamic banking : Principal and Its operations Dr. Rifki Ismal
5
2. Attributing knowledge Management System Prof. R.K.Pandit
7
3. Regression analysis of FDI & GDP for the period between 2000-2010 Rahul Singh
15
4. An empirical study of customer experience and satisfaction toward Hypermarkets shopping: A study of Hypermarkets in Gwalior Region Sneha Rajpoot
23
5. Impact of stress on Job Performance in Banking sector: A critical Analysis Shaifali Garg
37
6. Impact of excellence model awards on stock market performance: A study of selected Indian companies : Prof. R.K.Gupta
50
7. To study of a self service technology model for mobile banking in India- Determination of reasons for users and non users in context of selected banks Dr Abhilasha Sharma, Dr Sunita Dwivedi
59
8. An Insight into IFRS 3 - Business combinations Imran Khan
71
9. Internal marketing practices for elders: A study of Tourism Hotels Rahul Pratap Singh Kaurav
81
10. Bundelkhand University students behavior towards study material Sandeep Agrawal, Ravi jain, Rajat Kumar Kamboj
86
11. Entrepreneurship Development for Tribes in India Dr Peyush K. Sharma, C.P. Verma
97
12. Management of Barcode technology in Libraries Aakansha Roy
106
The GMA Journal of Management value & ethics is published from times a year in January, April, July, and October. � No part of this publication may be reproduced or copied in any form by any means without prior written permission. � The view expressed in this publication is purely personnel judgments of the authors and not reflect the view of GMA. � All efforts are made to ensure that the published information's is correct. GMA is not responsible for any errors
causesed due to over right or otherwise. � All legal disputes jurisdiction will be Gwalior.
All right reserved reproduction in whole or part from this journal without written permission of GMA is Prohibited. The views expressed by contributors are necessary endorsed by GMA. Unsolicited manuscript shall not be returned even if accompanied by self addressed envelop with sufficient postage.
Publisher/Printer/Owner/Editor-in-Chief :Dr. Prabhakar Singh Bhadouria, Gwalior Management Academy Regd. Office: C-17 Kailash Nagar Near New High Court Gwalior M.P. INDIA-474006, e-mail : [email protected]
Annual subscription Rs.2000.00 (India) $ 170 & euro 150 (foreign Airmail) Printed at: Sai offset Throat palace, Lashkar Gwalior(M.P.)
Graphics & Designed: Shivani Computer Graphics, Gwalior (M.P.)

Oct-Dec12 Vol. II No. IV Journal of Management Value & Ethics
3
World's Top management gurus:
THOMAS J PETERS
Tom Peters was born on November 7, 1942 in Baltimore, Maryland. A writer on business management practices, Peters is best-known for, In Search of Excellence, co-authored with Robert H. Waterman, Jr. He went to Severn School for high school and attended Cornell University, receiving a bachelor's degree in civil engineering in 1965, and a master's degree in 1966. He then studied business at Stanford Business School, receiving an MBA and PhD. In 2004, he also received an honorary doctorate from the State University of Management in Moscow. From 1974 to 1981, Peters worked as a management consultant at McKinsey & Company, and then in 1981, he went solo and became an independent consultant.
According to Peters, excellence in business depends on eight ingredients.
• Activism, with people who 'do it, fix it (and) try it'
• Excellent companies 'learn from the people they serve'.
• They promote entrepreneurship and autonomy
• Management learns from a 'hands-on' approach
• Workers are valued as the key to achieve productivity
• Excellent companies stick to their knitting, exploiting their core competencies and not pursuing wild goose chases
• They keep their form simple and their staff lean;
• They know how to be simultaneously tight-fitting and expansive.
Books that he wrote:
• A Passion for Excellence: The Leadership Difference (1985)
• Thriving on Chaos: Handbook for a Management Revolution (1987)
• Liberation Management: Necessary Disorganization for the Nanosecond Nineties (1992)
• The Brand You 50 (1999)

Oct-Dec12 Vol. II No. IV Journal of Management Value & Ethics
4
MessageMessageMessageMessage Dear Academicians & Research Scholars,
Journal of Management Value & Ethics consistently stepping up towards their target groups. The root of Journal is no doubt in the Gwalior. Because, it is our first Journal on Management. But the branches (approach) spread in all around the country. Last issues of our Journal published many research papers from east-west and north-south of our country, and some papers from abroad also. Many academicians and research scholars appreciated our Journal and they send congratulations for the same. He has also assured to send their research papers for publication in the coming issue. As we all known, management is a wide field. It has covered all area of our day to day working. Therefore, many Business Schools running various management courses in their campus. So, new research and new innovative ideas always comes among us to make strong education system or result oriented education. Research based study always support academicians & scholars to upgrade their knowledge as well as academic profile. As, we have decided GMA will publish the story of our top management Gurus. Who are world famous. In this series, we are bringing another name of management guru Mr. THOMAS J PETERS. He is also world famous Management Guru. He had published many books on the Management. We request again to call research papers on empirical and theoretical study. Those who are interested to publish their papers in the field of Retail, Tourism, Hospitality, Event Management, Import and export, HRM, Finance, Marketing, Advertising, Accounting, Aviation, IT etc. They can send papers through email as mentioned on front page of Journal in the name of editor.
With best wishes to all DR.P.S.BHADOURIA
Editor in Chief / Managing Editor

Oct-Dec12 Vol. II No. IV Journal of Management Value & Ethics
5
A REVIEW STUDY ON ISLAMIC BANKING: PRINCIPLES AND ITS OPERATIONS
*Dr. Rifki Ismal
Islamic banking is the recent and interesting financing phenomena not only in the countries where Moslems are majority such as Malaysia, Indonesia or middle east countries but also in developed countries where Moslem are minority such as England, France, Singapore even USA. Such phenomena emerge further when the world faced the global financial crisis in 2008-2009. It is because Islamic finance promotes ethical finance/business and prohibits speculation or gambling financial activities which are deemed as the main sources of the global financial crisis. What is Islamic banking/finance and how it operates? This short article attempts to give short brief on such a topic.
First of all, Islamic banking adopts some principles which refer to the holy books of monotheist religions especially Koran (Moslem’s holy book), Bible (Christian’s holy book) and Torah (Jew’s holy book). One of the main principles in Islamic banking is the prohibition of interest (Riba) which complies not only with Koran but also other holy books mentioned above. The economic crisis happening in various parts of the world such as Asian economic crisis 1997/1998, global financial crisis 2008-2009, etc are rooted from the operations of interest which amongst all decouples (separates) the real and financial sector. Even, the implementation of interest in the financial sector tends to create derivative markets and stock market with full of speculative motive.
Other principles of Islamic banking/finance include prohibition of uncertain (speculative) transactions, unfair contracts and gambling. These principles are even realized by countries which faced financial/economic crisis and later on they re-regulate their financial markets and banking industry with full orientation to develop the real sector. As such, Islamic finance attempts to recall the operations of the current banking/finance activities to their original function to develop the real sector and prosper the public with full employment, stable price and highly distributed economic justice.
* Dr. Rifki Ismal (Islamic Finance and Economics)(Lecturer at University of Indonesia, Jakarta, Indonesia).

Oct-Dec12 Vol. II No. IV Journal of Management Value & Ethics
6
How those can be done? The operations of Islamic banking can be classified into at least four activities. The first one is the non commercial economic activities which provide funding (loan) to projects/businesses without asking any return. The only motive of this contract is to seek the bounty of the Lord by helping the needies to finance their (usually) small/micro businesses. However, even though the giver does not receive any monetary reward, the economic impact of this contract is significant as it activates the real business.
The second one is the commercial economic activities namely trading based contracts. Islam provides some trading based contracts such as Murabahah (mark up trading of an asset), Salam (profit based agriculture trading) and, Istishna (profit based manufacturing trading). These contracts improve the economic transactions and promote higher economic growth. The third economic activities namely investment based contracts such as Mudarabah (profit sharing contract) and, Musharakah (profit and loss sharing contract). These contracts even promote higher economic impact than the second ones. The last but not the least is the service based contracts such as Wakalah (agency), Kafalah (guarantee) or Hiwalah (transfer of obligation). All of the economic activities above are widely implemented in the form of Islamic banking and non Islamic banking institution such as Islamic multifinance, Islamic insurance, Islamic securities funds, etc.
The latest common and interesting phenomena of Islamic finance is the existence of Sukuk which is an Islamic equity investment or like (although not totally the same) bond in the conventional finance. The Sukuk market is found almost in all of the Moslem or non Moslem countries with the impressive growth. Malaysia is the world leader in the Sukuk market with various underlying contracts. The existence of this contract further promotes Islamic finance as sukuks are now favourite Islamic investment certificates for investors because Sukuks have various contracts, tradable and liquid instruments. For the issuer, the funds from Sukuks are used to finance strategic projects such as government projects, public projects, etc which generate economic growth, absorb huge employees and give profit as well.
"If friendship is your weakest point
then you are the strongest person in the world." – Abraham Lincoln....

Oct-Dec12 Vol. II No. IV Journal of Management Value & Ethics
7
ATTRIBUTING KNOWLEDGE MANAG *EMENT SYSTEM
Dr.R.K.Pandit
Preamble:
Technological development around the globe has given numerous advancements in the life style of human habitation. Technology itself can be conceptualized as an activity that forms or changes culture, culminates into the behavioural change of individual. These behavioural changes in human beings can be observed, analyzed from day today attitudes, work schedules, work pattern and overall response to the changing scenario and the subject matter with which it interacts.
The currently prevailing culture can be defined as Techno-culture as it solely depends upon the scientific and technological parameters and its application to our living system. The distinctions between Science, Engineering and Technology have always been in a confusion status since its diversification, while all three are a chain formation of single objective. Like any biological chain, there is also a scientific technological advancement chain which affects the evolution of human beings and a society at large.
The relationship between society and technology being complex and dependable to each other, but has increased the productivity and efficiency. Every new invention and advancement enhances our goals of value based life, life where modern day tools become part of life cycle. Modern life style has to be viewed as a tool of achievement with each individual as an essential element of it and that of society.
Many technologies allow one society to have significant advantages over other society. This may be in direct or indirect, but always results in one human society enslaving, assimilating or annihilating other society. This social supremacy increases dependence of one society over the others, which lead to economical, environmental, others Imbalances and dependency.
Adoption of technology is the need of the day but same needs to be diffused keeping in mind the further generations and societal growth. What is in general, required is a society (Human Race) capable of adopting technology rather than depending on it. Adaptation of
* Professor, Madhav Institute of Technology and Science, Gwalior, MP.

Oct-Dec12 Vol. II No. IV Journal of Management Value & Ethics
8
technology will depend upon the available options, these options are always various forms of information’s and acceptance of one of them makes it as a knowledge and knowledge base for the future.
Information and Knowledge
Modern systems and markets often value long-term growths over the short-term. In current dynamic environment takeovers & makeovers, continual growth and management controls mainly depend upon the information availability and its knowledge content. The failure to prosper imperils survival because when lack of information over a long enough period and bankruptcy of knowledge. Moreover, prosperity now requires not only information but long-term knowledge and its growth needs. Together, this combination of continuing knowledge and continual growth presents a tough strategic problem because all markets eventually are mature and growth is limited by the growth of its markets.
Knowledge management has become a decisive factor of effectiveness, quality and productivity in recent years. It is widely perceived by professionals that direct hand-on experience, alone can provide capabilities and capacities for engineers and managers. This hand-one experience builds up the knowledge base and expertise of managers. This was true in earlier years, when there was no mechanism to store the domain’s knowledge and expert’s experience in a simple usable manner and retrieve them instantly when required in a user friendly way. However, the recent explosion in computer technology, communication and information systems coupled with Artificial Intelligence (AI) techniques and world wide web domains in late 20th and early 21st century, has now provided the art of knowledge management in a very simple and user friendly way, un-precedent in the human history. These developments are revolutionizing the management philosophies and creating virtual organizations of entirely new management concepts. Many industries are in a transient phase of rapid changes and re-engineering brought about by these break through and are extensively adopting the applications of IT and AI techniques with advantage and benefits.
Technological Shifts:
As the old system cracks - reports Tofler (1990) the faceless bureaucratic managers who run it are blown away by a gorilla army of risk taking investors, promoters, organizers and managers, many of them anti-bureaucratic individualists, all of them skilled at either acquiring knowledge or controlling its dissemination. The most important economic development of our life time has been the rise of a new system of creating wealth based no

Oct-Dec12 Vol. II No. IV Journal of Management Value & Ethics
9
longer on muscle or wealth but on knowledge, the power of the mind. Humans in advance economy no longer consisted of working on things but people acting on information and information on people. The substitution of information or knowledge for muscle or wealth power is the order of the day. The spread of this new knowledge based economic system is in fact the explosive new force that has hurled the economies into rapidly accelerating changes, which sometimes seem to be anarchic and gave importance to science and technology. Economies are being engineered and made dependable on knowledge for the survival of mankind.
Knowledge has featured prominently in recent years and the future work of information and communication technologies have driven widespread change in workplaces. Some research has linked the impact of new technologies to the Industrial Revolution of the nineteenth century. Information technology is what economists refer to it as a general purpose technology, a class of inventions distinguished by their broad applicability and their role in enabling a wide range of innovations. Earlier examples of general purpose technologies included the steam engine, the electric motor and railways etc. Such technologies not only led to the emergence of new industries, but more importantly generated productivity enhancing improvements in wide ranges of the economy. Recent developments constituted an industrial revolution which remained as an open question. Technological change, economically speaking, is difficult to measure directly, and may not be captured by existing data series (eg, investment, or research and development). Technology is a major factor in productivity growth, GDP etc. and hence institutions require assessing the impact of information technology indirectly by studying productivity trends. Numerous studies found little if any change, despite the widespread use of computers. More recent studies recognized as the technological leader and a productivity surge of the late 1990s to enhance the productivity of users of the technology. Nevertheless, the development of IT so far presents some analogies with earlier major technological revolutions, such as railroads etc. The aspects of the relationship between technology and society that have attracted the most attention in the society are through on net environment, its impacts, skill requirements, and the organization of work, time scheduling & management.
Societal Dominant Forces:
Through the first part of the 19th Century Feudal and Imperialist era driven by religion literature, arts, basic sciences and regional struggled for power. The societies which harnessed the energy of basic sciences became military powers and dominated their regions

Oct-Dec12 Vol. II No. IV Journal of Management Value & Ethics
10
and others accepted that dominance. Late 19th and part of the 20th Centuries was an agriculture era driven by food production and distribution. The societies which harnessed the economic power of agricultural industry became leaders and others had to accept that leadership. Most of the 20th Century Industrial was driven by manufacturing and controlled the global markets while rest accepted the role of second class. Changing from industrial era to knowledge era had characterized the major changes from incremental innovation to radical innovation, product improvements to process improvements and business pattern changes. Business patent changes included organizations from co- located groups of workers to virtual entities spanning multiple continents. World economic powers alignment of the knowledge era was substantiated by ability to create new ideas to exploit economic value research, educational development, IT based infrastructure and knowledge based employment.
Late 20th and 21st Century is an era driven by information and knowledge. The societies of current order of creating wealth based on knowledge and technologies are leading the world and becoming leaders while others are losing relevance. Knowledge is information that changes something or somebody, either by becoming grounds for actions, or by making an individual (or an institution) capable of different or more effective (Peter F. Drucker ) Knowledge era has its own characteristics dependant on the variables like Creativity and its commercialization, research and development , innovative thinking, coping with uncertainties, disruptive technologies, and shift from imitation to innovation.
K n o w l e d g e P a t t e r n s :
John Locke (1689) quoted that Knowledge is the perception of the agreement or disagreement of two ideas. The idea is that information, knowledge, and wisdom of more than simply collections and whole represents synergy of its own.
Data, which is just a meaningless point in space and time, without reference to either space or time, is like an event out of context, a letter out of context, a word out of context. An attributed data has a meaning and converts into a piece of useful information which depends on the understanding of the one perceiving the data.
Information is quite simply an understanding of the relationships between pieces of data, or between pieces of data and other information. While information entails an understanding of the relations between data, it generally does not provide a foundation for why the data is what it is, nor an indication as to how the data is likely to change over time.

Oct-Dec12 Vol. II No. IV Journal of Management Value & Ethics
11
Information has a tendency to be relatively static in time and linear in nature. Information is a relationship between data and, quite simply, is what it is, with great dependence on context for its meaning and with little implication for the future. When a pattern relation exists between the data and information, the pattern has the potential to represent knowledge. It only becomes knowledge, however, when one is able to realize and understand the patterns and their implications. The patterns representing knowledge have a tendency to be more self-contextualizing. Pattern which represents knowledge also provides, understanding techniques, levels of reliability or predictability as to how the pattern will evolve over time. Patterns which represent knowledge have completeness to them that information simply does not contain. Knowledge itself can be identified and classified as
Explicit Knowledge Tactical Knowledge
Formal language, including grammatical statements (words and numbers), mathematical expressions, specifications, manuals, etc. Explicit knowledge can be readily transmitted others. Explicit knowledge can easily be processed by a computer, transmitted electronically, or stored in databases.
Personal knowledge embedded in individual experience and involves intangible factors, such as personal beliefs, perspective, and the value system. It contains subjective insights, intuitions, and hunches. Before tacit knowledge is communicated, it must be converted into words, models, or numbers that can be understand.
Changing paradigm for information handling (information containers of dynamically composed, stored in a wide range of formats) to technology requires tools and procedures including separation of information content and mechanisms from process to product. Various models ICT tools are helpful in conversion of non physical to physical objects in the user environment. These models and tools will act as crucial service agents in connection with development of next generation knowledge management systems.
Knowledge Management Value
Organizational data represents facts or values of results, and relations between data and other relations their capacity represents information. Patterns of data and information and

Oct-Dec12 Vol. II No. IV Journal of Management Value & Ethics
12
other patterns have the capacity to represent knowledge. Further representation of any utility requires understanding, and when understood the representation is information or knowledge to the one that understands. The value of information and knowledge means the degree of its understanding and application in real time. In this example what needs to be managed to create value is the data that defines past results, the data and information associated with the organization, it's market, it's customers, and it's competition, and the patterns which relate all these items to enable a reliable level of predictability of the future. What I would refer to as knowledge management would be the capture, retention, and reuse of the foundation for imparting an understanding of how all these pieces fit together and how to convey them meaningfully to some other person.
Knowledge Management value relates directly to the effectiveness with which the knowledge is managed which enables the members of the group/organization to deal with today's situations and effectively envision and create their future. Future, an approach to perceive would make a more effective output and technological innovations. Technological innovations require knowledge of rich sources and context. The process starts slowly and moves from learning to knowledge exchange and technological developments, while the rate of information flow increases. As the information flow increases in number of learners at once, the speed of information exchange increases, while the other side is that one to one interactions decreases, thus the rate of knowledge transfer decreases.
The first dimension of the data/information/knowledge continuum is known as viscosity/velocity and the second dimension of the data/information/knowledge continuum is the number of paths or streams of information flow. These knowledge dimensions can be analyzed through basic principles of science i.e viscosity a measure of resistance and velocity a simple rate of change and exchange, simultaneously information tree and knowledge lifecycle.
Knowledge Management to Technology Development
Global nature of today's business, organizations are setting up their units and opening new marketing offices in any part of the world. The advantage of being local does not exit any more. Internet has give opportunity by providing a level playing field to all create and operate new business without having a office near the customer or consumer. These opportunities are to be tapped to enter into a new market or customer segment. At the same time one has to innovate and improve to protect the existing market with a knowledge driven business management process.
Oct-Dec12 Vol. II No. IV Journal of Management Value & Ethics
13
From data to information to knowledge requires an explicit methodologies and mapping of intelligence through experience and expertise or expert systems. Data, a collection of discrete objects, facts or events without reference to space or time or an unprocessed information forms the basis of future Information and after processed is known as information. From a collection of data we can derive meaningful information and conclusions. Evolution from data and information is the formation of knowledge. Knowledge is the result of learning, experience, jurisdiction or judgment to the information. Application of successful knowledge management program can benefit better product developments, higher customer satisfaction, reduce in input cost, higher productivity etc however organizations achieving these without a formal knowledge management program are those with strong culture of innovation and sharing through the knowledge creating processes.
Systems or organizations become learning or innovative one because of its intellectual assets and knowledge content of individuals. These knowledge individuals are key to the success and can bring tremendous improvement and change to the system or system operations. Failure of knowledge management is due to excessive dependency on technology while ignoring culture building. What is required to understand at this point is that technology provides a platform for exchange of knowledge which itself is knowledge management. This creates a platform for extensive data mining, analysis and operations intelligence knowledge and enhances better decision supports systems as the process does not limit itself within the organization as it includes Customers or suppliers knowledge and feedbacks.
This equally provides platform in the form of community practices, discussion boards, expert systems, etc to provide or build successful solutions practices and innovation across the continents.
Knowledge Management has strong networking created to help in developing collaborative decision making and threat analyzing capability and capacity for new challenges.
Tools and techniques available under the umbrella of knowledge management are moreover the tools which were available prior to its explanation and application, the only element to put in place is the strategy for technology development.
Technology Development Strategy is basically an understanding of components within a system for its application and process development. These components can be

Oct-Dec12 Vol. II No. IV Journal of Management Value & Ethics
14
identified as technological assessment, gap, availability, assessment, evaluation, selection, acquisition, adaptation, implementation, improvement, imitation and innovation.
Conclusions
Strong culture of sharing and innovating is what brings success to a knowledge management program while culture developed cannot be copied by any competitor. Innovation and knowledge management helps in developing new products and services and improves the existing practices. These innovations or improvements set a new trend in the market and the organization takes the lead role among the peers. Knowledge driven organization always takes a leaders role and set a new standard for others to follow. It develops a new trust among its customers and suppliers and gets the confidence of them as an innovative organization. Technology is the dominant force in the word of the 21st century and rapid technological changes are leading to rapid societal changes. If we manage technology we can harness its energy for the betterment of human kind otherwise we will be slaves of it.
References:
John Locke. “Knowledge and Probability”,(1689)
Achterbergh, Jan & Vriens, Dirk “Managing viable knowledge” , (2002).
Davenport T., Prusak L. “Working Knowledge”,(1998)
Bateson, Gregory. Mind and Nature: A Necessary Unity, Bantam,( 1988 ).
Csikszentmihalyi, Miahly. “The Evolving-Self: A Psychology for the Third Millennium”, (1994)
Davidson, Mike. “The Transformation of Management”, Butterworth-Heinemann, (1996).
Senge, Peter. “The Fifth Discipline: The Art & Practice of the Learning Organization”, (1990).

Oct-Dec12 Vol. II No. IV Journal of Management Value & Ethics
15
REGRESSION ANALYSIS OF FDI & GDP
(For the period between 2000 – 2010)
Rahul Singh*
Abstract
With the advent of globalization, developing countries, particularly those in Asia, have been witnessing a massive surge of FDI inflows during the past two decades. Even though India has been a latecomer to the FDI scene compared to other East Asian countries, its significant market potential and a liberalized policy regime has sustained its attraction as a favorable destination for foreign investors. This article aims to examine the impact of inward FDI on the Indian economy, particularly after a decade of economic reforms, and analyzes the challenges to position itself favourably in the global competition for FDI. In this context, the article further investigates the likely impact on FDI inflows to India as a result of increasing competition from another major emerging market economy, i.e., China, in the wake of its accession to the WTO and the opportunities and challenges present before it.
Introduction:
Foreign Direct Investment (FDI) is considered to be the lifeblood for economic development as far as the developing nations are concerned. Since the liberalization of the Indian economy inflows of foreign direct investment has greatly increased. As far as forting direct investment is concerned, its flow in India is very small as compared not only to China but also to India's potential. Economic Survey for 2005-06 points out that India has potential to absorb $150 billion FDI in the infrastructure sectors alone by 2010.Most of the FDI inflows come from a few countries. Between 1991 and 2005, investments of 10 countries accounted for 71 percent of FDI, the main investor countries being the USA, the Netherlands, Japan, and the United Kingdom. With regard to FDI, U.S. is one of the largest foreign direct investors in India. India is becoming an attractive location for global business on account to its buoyant economy, its increasing consumption market, and its needs in infrastructure and in the engineering sector. Opening and FDI have really created new opportunities for India's development and boosted the performances of local firms as well as the globalization of some of them. Such a trend has undeniably raised Indian's stature among developing countries.
* Assistant Professor, School of Business Management, Indus International University, Una, H.P.

Oct-Dec12 Vol. II No. IV Journal of Management Value & Ethics
16
Review of Literature
A brief review of literature on FDI and related aspects is provided below .Anand J and Delios A (1996) found that positive impact of FDIs can be seen through the success of Japanese MNCs throughout the world especially in India and China. Caves 1996, analyzed that these MNCs can transfer their resources to national firms through creating creating creative collaboration whih can either be equity based or not.Cheng (1993) emphasized on the most neglected area of FDI, R&D, which is neglected by MNCs in host nations. Fujita, Masahisa, Paul Krugman, and Anthony J. Venables, (1999) elaborated the benefits of FDI through his empirical study. Geske (2000) tried to find out the relationship between FDI and trade development in Latin America and found positive correlation between them. Feinberg, Susan & Majumdar, Sumit K. (2001) analyzed technology spillover effect due to FDI with special reference to India pharmaceutical industry.
India Perspective
India is the second largest country in the world, with a population of over 1 billion people. As a developing country, India’s economy is characterized by wage rates that are significantly lower than those in most developed countries. We can say that these are the main features of Indian economy that make it qualify as destination source for a multinational corporation’s investment. Until recently, however, India has attracted only a small share of global FDI and FII primarily due to government restrictions on foreign involvement in the economy. But beginning in 1991 and accelerating rapidly since 2000, India has liberalized its investment regulations and actively encouraged new foreign investment, a sharp reversal from decades of discouraging economic integration with the global economy.
Objective of the Study:
The main objective of the study is to analyze the FDI inflows in India . The other objectives of the study are
1. To study the year-wise FDI inflows in India for last 10 years. 2. To study the year-wise FDI growth in India for last 10 years. 3. To apply curve estimation analysis using linear programming between FDI and GDP
growth rate. Research Methodology: Data Collection
The study is based on secondary data and the facts and figures collected from various sources such as Fact Sheets on FDI, Department of Industrial Policy and Promotion (DIPP), Ministry of Commerce and Industry, Government of India(GOI).

Oct-Dec12 Vol. II No. IV Journal of Management Value & Ethics
17
Correlation: We have used the Correlation tool to determine whether two ranges of data move together — that is, how the GDP growth rate are related to the FDI which may be positively related, negatively related or no relation.
For understanding the relationship, GDP growth rate has been taken as dependent variable. FDI is taken as independent variable.
Analysis
It can be seen quite clearly by the graph presented above that FDI inflow has constantly upward movement. However in first six years inflow was saturated with sharp rise in year 2006-2007 . however after that again it look like that FDI inflow has saturated once again.

Oct-Dec12 Vol. II No. IV Journal of Management Value & Ethics
18
It can be seen quite clearly by the graph presented above that growth rate FDI inflow has lots of ups and downs. In first two years growth rate was as high as 100% and just after that in next two years growth dipped in negative zone. Again in for next four years and touched highest of 140% in year 2006-2007.Again in next two year growth was ranging between 1% and -4%.It can be said that growth rate has no such clear direction.
Curve Estimation Analysis
Model Description
Model Name MOD_1
Dependent Variable 1 GDP
Equation 1 Linear
Independent Variable FDIinflow
Constant Included
Variable Whose Values Label Observations in Plots Unspecified
Model Summary
Model R R Square Adjusted R
Square Std. Error of the Estimate
1 .941 .885 .870 495975.981
a. Predictors: (Constant), FDI inflow
b. Dependent Variable: GDP
Here R2 is 0.885 which says the observation will fall with near about perfection in the fitted regression line.
Oct-Dec12 Vol. II No. IV Journal of Management Value & Ethics
19
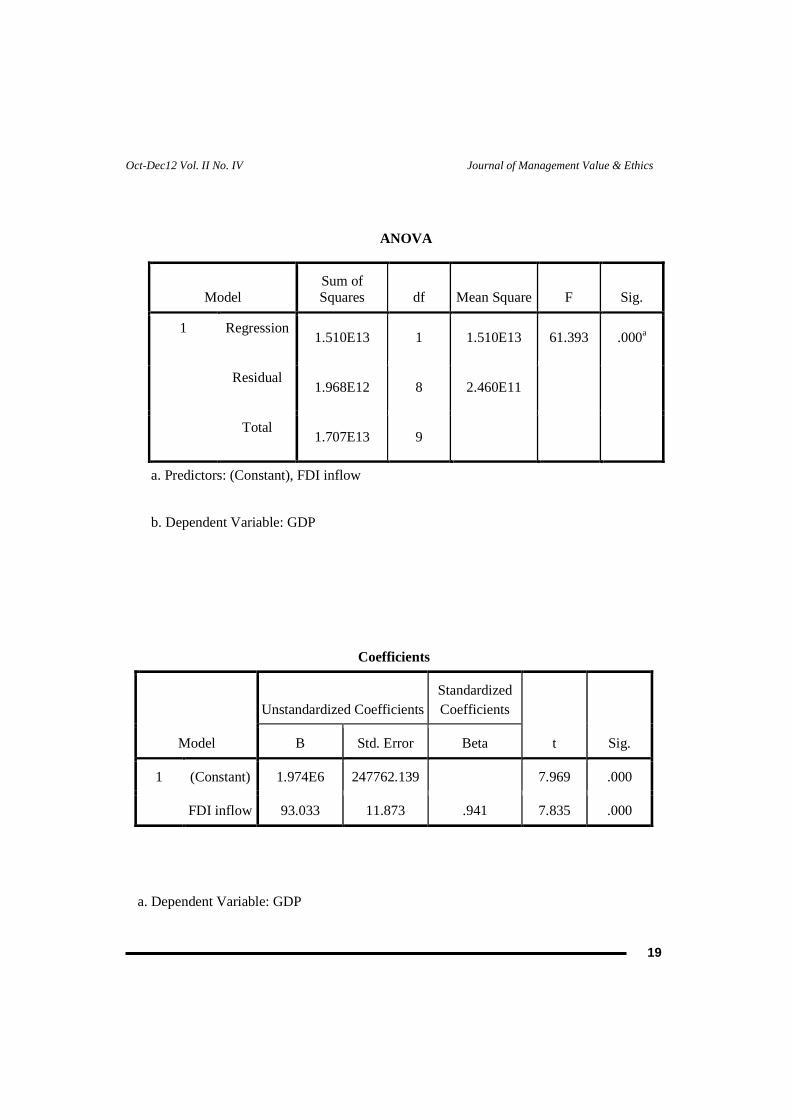
ANOVA
Model Sum of Squares df Mean Square F Sig.
1 Regression 1.510E13 1 1.510E13 61.393 .000a
Residual 1.968E12 8 2.460E11
Total 1.707E13 9
a. Predictors: (Constant), FDI inflow
b. Dependent Variable: GDP
Coefficients
Model
Unstandardized Coefficients Standardized Coefficients
t Sig. B Std. Error Beta
1 (Constant) 1.974E6 247762.139 7.969 .000
FDI inflow 93.033 11.873 .941 7.835 .000
a. Dependent Variable: GDP
Oct-Dec12 Vol. II No. IV Journal of Management Value & Ethics
20
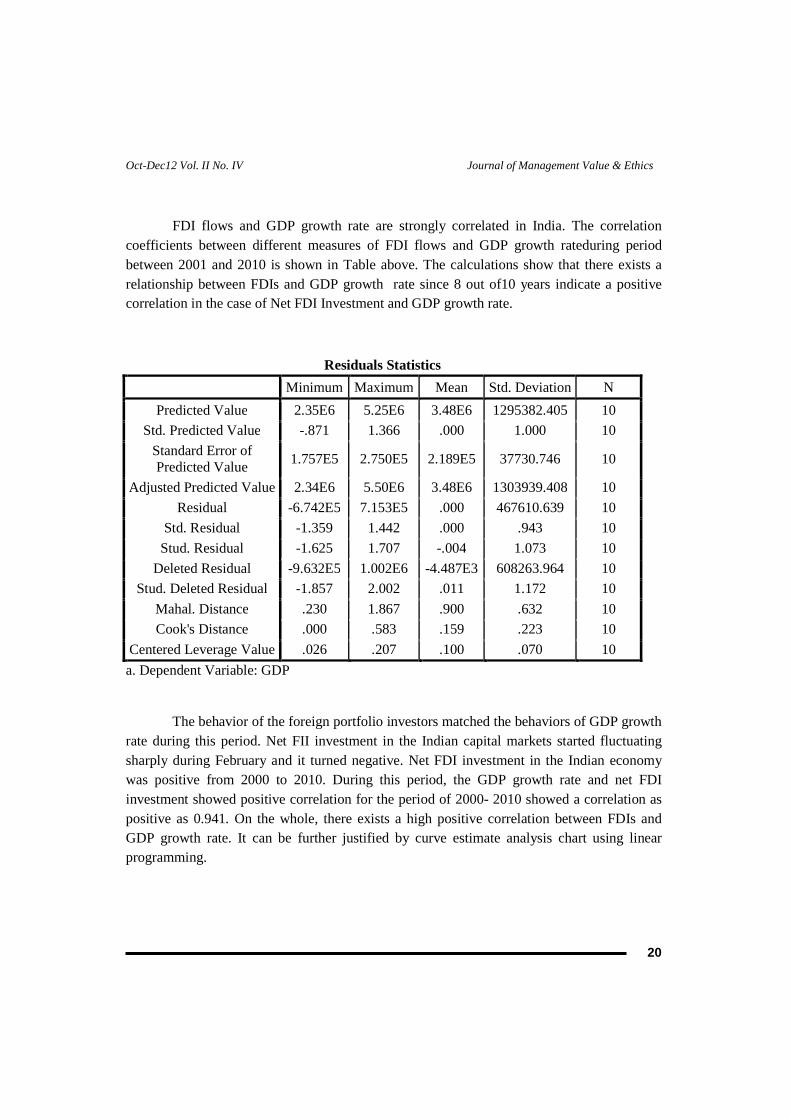
FDI flows and GDP growth rate are strongly correlated in India. The correlation coefficients between different measures of FDI flows and GDP growth rateduring period between 2001 and 2010 is shown in Table above. The calculations show that there exists a relationship between FDIs and GDP growth rate since 8 out of10 years indicate a positive correlation in the case of Net FDI Investment and GDP growth rate.
The behavior of the foreign portfolio investors matched the behaviors of GDP growth rate during this period. Net FII investment in the Indian capital markets started fluctuating sharply during February and it turned negative. Net FDI investment in the Indian economy was positive from 2000 to 2010. During this period, the GDP growth rate and net FDI investment showed positive correlation for the period of 2000- 2010 showed a correlation as positive as 0.941. On the whole, there exists a high positive correlation between FDIs and GDP growth rate. It can be further justified by curve estimate analysis chart using linear programming.
Residuals Statistics
Minimum Maximum Mean Std. Deviation N
Predicted Value 2.35E6 5.25E6 3.48E6 1295382.405 10
Std. Predicted Value -.871 1.366 .000 1.000 10
Standard Error of Predicted Value
1.757E5 2.750E5 2.189E5 37730.746 10
Adjusted Predicted Value 2.34E6 5.50E6 3.48E6 1303939.408 10
Residual -6.742E5 7.153E5 .000 467610.639 10
Std. Residual -1.359 1.442 .000 .943 10
Stud. Residual -1.625 1.707 -.004 1.073 10
Deleted Residual -9.632E5 1.002E6 -4.487E3 608263.964 10
Stud. Deleted Residual -1.857 2.002 .011 1.172 10
Mahal. Distance .230 1.867 .900 .632 10
Cook's Distance .000 .583 .159 .223 10
Centered Leverage Value .026 .207 .100 .070 10
a. Dependent Variable: GDP

Oct-Dec12 Vol. II No. IV Journal of Management Value & Ethics
21
The systemic way in which GDP varies as a function of FDI is identified as a straight line, the regression line of Y on X. The regression line goes perfectly through all means of the conditional probability distributions of Y , given value of X .
Conclusion:
A large number of changes that were introduced in the country’s regulatory economic policies heralded the liberalization era of the FDI policy regime in India and brought about a structural breakthrough in the volume of the FDI inflows into the economy maintained a

Oct-Dec12 Vol. II No. IV Journal of Management Value & Ethics
22
fluctuating and unsteady trend during the study period. It might be of interest to note that more than 50% of the total FDI inflows received by India during the period from 2000 - 2010 came from Mauritius, Singapore and the USA. The main reason for higher levels of investment from Mauritius was that the fact that India entered into a double taxation avoidance agreement (DTAA) with Mauritius were protected from taxation in India. Among the different sectors, the service sector had received the larger proportion followed by computer software and hardware sector and telecommunication sector. According to findings and results, it is concluded that FDI did has significant impact on GDP growth rate. Also FDI is not the only factor affecting the GDP growth rate. There are other major factors that influence the GDP growth rate in the country but FDI can be termed as one of the major factor contributing to GDP growth.
References
1. Anand, J. and Delios, A., “Competing globally: How Japanese MNCs have matched goals and strategies in India and China”, Journal of World Business. 31, 3, Fall 1996, pp.50-62.
2. Aditya KR Bajaj and Swastik Nigam (Dec 2007) “Globalization in the Indian Pharmaceutical Industry – FDI spillovers and implications on Domestic Productivity: 1991-2007”, is a research project done under IIM Ahmedabad.
3. FDI Inflows in Indian Industry and Bhupal Singh (2005). “Methodology, Compilation and Reporting of Foreign Direct Investment Statistics: The Indian Experience,” Reserve Bank of India, Mumbai
4. Caves, Richard. 1996. Multinational Enterprise and Economic Analysis, 2nd ed. Cambridge: Cambridge University Press.
5. Cheng, Joseph L.C. 1993, “ The management of Multinational R& D : A neglected topic in international business research”, Journal of International Business Studies, 24(1) ;1-18.
6. Dijkstra, A. Geske. 2000. “Trade Liberalization and Industrial Development in Latin America,” World Development, vol. 28, no. 9, pp. 1567-1582.
7. Feinberg, Susan & Majumdar, Sumit K. 2001. “Technology spillovers from foreign direct investment in the Indian pharmaceutical industry,” Journal of International Business Studies, vol. 32, no. 3 (Third Quarter), pp. 421-437
8. Fujita, Masahisa, Paul Krugman, and Anthony J. Venables, 1999, The Spatial Economy (Cambridge, Massachusetts: MIT Press).
9. Lee, J.Y. & Mansfield, E. 1996. Intellectual Property Protection and US Foreign Direct Investment. Review of Economics and Statistics, 78: 181-186.
10. Garg, R., G. Kumra, A. Padhi & A. Puri. 1996. Four Opportunities in India.s Pharmaceuticals Market. McKinsey Quarterly, 4: 132-144.

Oct-Dec12 Vol. II No. IV Journal of Management Value & Ethics
23
AN EMPIRICAL STUDY OF CUSTOMER EXPERIENCE AND SATISFACTION TOWARDS HYPERMARKET SHOPPING: A
STUDY OF HYPERMARKETS IN GWALIOR REGION
Sneha Rajput* Padma Singhal **
Mili Singh ***
ABSTRACT
The Retailing community has affected every facet of our social and economic life through
being a very entrepreneurial and innovative institution. This important sector includes formats like
supermarkets, malls, hypermarkets, specialty store etc along with the traditional models such as street
shops, kirana shops, fancy stores, departmental stores etc. These days Hypermarkets have emerged as
important format of this sector.
The hypermarket stores have tremendously changed the business world by developing the
culture of consumption and purchase of unsought goods with providing everything under one roof.
Hypermarkets provide large product mix with variety of brand choices. The product offering ranges
from furniture, electronic goods, apparels to groceries and fresh produce etc. The current paper
examines the leading hypermarket operating in Gwalior city-Big Bazaar. The objective of the study is
to examine the customer experience at the store during shopping. The various parameters to measure
the customer experience includes convenience during shopping, price fairness, product quality,
variety, store employee behavior, schemes offered, security, overall store ambience etc were
considered. The result of the study revealed that value R square is .455 that In other words indicates
that (independent variable) contributes 45.5 % to dependent variable. The model used for regression
has good fit as indicates F – value 81.653 which is significant at 0 % level of significant indicating a
high predictability of model. The relationship between Customer Experience as independent variables
is indicating by standardized coefficient Beta with a value of 0.674. The significance of Beta is tested
using T-test and value for t is 9.036 which are significant at 0 % level of significance indicating
significant relationship between Customer Experience as independent variable and Customer
Satisfaction as Dependent Variable. So, the hypothesis framed earlier was rejected.
Keywords: Customer Experience, Customer Satisfaction and Hypermarkets
* Assistant Professor, Prestige Institute of Management, Gwalior (M.P.) ** Research Scholar DAVV Indore (M.P.) *** Assistant Professor, MediCaps Institute of Technology and Management, Indore (M.P.)

Oct-Dec12 Vol. II No. IV Journal of Management Value & Ethics
24
INTRODUCTION
The growth and development of retail industry has been remarkably huge over the last few decades. The global retail industry has grown from a small beginning to an industry wherein the world wide retail sale alone is valued at $ 7 trillion (Source: 2003 Global Retail Report, Deloitte Touche Tohmatsu). The top 200 retailers alone account for 30% of worldwide demand. Retail sales are generally driven by people’s disposable income and willingness to buy to purchase any product. With the higher earnings, shoppers now seek convenience and new variety whereby retailers have expanded their product offerings. Today, the global economy has changed, consumer demand has shifted, and retailers’ operating systems today are infused with far more technology than was the case six years ago. Newer technologies like bar code invention have made a store to maintain hundreds of brands and thousands of items. But with the global economic slowdown retailers are now into monitoring their costs and consumers themselves have become much more price sensitive and conservative in their buying, particularly in the more advanced economies.
India has highly fragmented retail sector, out of which organized retail only constitutes 3% of the current retail market. The same is expected to reach 10% in 2010 and 24% in the year 2025. Organised retail sector is expected to grow 400% from US$7 billion (S$11 billion) currently to US$30 billion (S$48 billion) by the end of 2010. (Source: “The Great Indian Retail Story”, Ernst & Young.)
The Indian retail market is characterized by several co-existing types and formats. This important sector includes formats like supermarkets, malls, hypermarkets, specialty store etc along with the traditional models such as street shops, kirana shops, fancy stores, departmental stores etc. These days Hypermarkets have emerged as important format of this sector. The hypermarket stores have tremendously changed the business world by developing the culture of consumption and purchase of unsought goods with providing everything under one roof. Hypermarkets provide large product mix with variety of brand choices. The product offering ranges from furniture, electronic goods, apparels to groceries and fresh produce etc. The current paper examines the leading hypermarket operating in Gwalior city-Big Bazaar. After Bangalore, Hyderabad, Mumbai, Kolkata, and all the other urban cities, BIG Bazaar, a division of Pantaloon Retail (India) Ltd has stretched its brand to smaller cities as well. Offering discounts ranging from 5 per cent to 60 per cent, discount stores are still a nascent concept in India. Big Bazaar claims to be India's first chain of hypermarket discount stores.

Oct-Dec12 Vol. II No. IV Journal of Management Value & Ethics
25
REVIEW OF LITERATURE
The industry is witnessing the development of region-specific formats. With organized retail penetrating into B class towns, larger discount formats, popularly known as hypermarkets, are now emerging as major competitors for both unorganized and organized retailer.
Caroline (2003) studied the satisfaction levels of old aged consumers in Scotland, with their food-shopping experience. The results indcated a general level of satisfaction but still there were certain areas of dissatisfaction as well such as as aspects of the products for sale (merchandise), the practices and procedures of the retailer (retail practices) and factors in the community which affected the shopping trip (external shopping factors) etc.
A study of Shannon et al (2008)on attitudinal and behavioral shopping patterns related to hypermarket shopping in an Asian market, interviewed 244 shoppers and finds that grocery shoppers tend to be more risk averse when time pressured, but less risk averse if they are innovative. Bangkok Thais score high on innovativeness and shopping enjoyment and are more frequent patrons of hypermarkets than other grocery store Formats. Thus these hypermarket shoppers are more driven by convenience than by time pressure as they tend to shop in groups and enjoy this experience.
A study of Barros et al (2006) found that the efficiency of hypermarket and supermarket retail companies is high as compared to the other sectors. Also larger retail groups are, on average, more efficient than the smaller retailers as they play in high volume and low margin area. The efficiency of any hypermarket player can be calculated on the basis of market share, number of outlets in the market and store location. The study also confirmed that national retailers are on an average more efficient than regional retailers and are able to offer more discounts and schemes.
Cataluna (2005) studied the comparison of the pricing strategies and promotional differences followed by hypermarkets as compared with those that discount stores. The study revealed that the hypermarkets tend to have higher mean prices, and use promotional tools more profusely than the discount stores. Peter Jones(1982) estimates that in the UK, hypermarket and superstore have provided gross floorspace equivalent to 20 shopping centres and this has been one of the remarkably big retail phenomena of the past few years. Looking at future trends, he suggested that there may be a polarisation between the large hypermarket

Oct-Dec12 Vol. II No. IV Journal of Management Value & Ethics
26
selling both food and non-food, and the smaller superstore concentrating on high volume food sales.
Seiders, et al (2000) described the impact of hypermarkets on traditional food retailers in four markets was conducted with the primary objective being assess the effects of the entry of Meijer, Wal-Mart, Kmart, and Target hypermarkets. The results showed that hypermarkets can gain 15 to 20 percent of primary shoppers and an even greater proportion of secondary shoppers. Furthermore, the hypermarkets primary shoppers, and especially those of Wal-Mart and Meijer, identified low price and assortment more often as the reason for store choice. In comparison, traditional supermarket primary shoppers were less willing to trade off locational convenience or, in some cases, quality and assortment. Wal-Mart is predicted to continue to rapidly gain share at the expense of competitors who do not differentiate themselves in some significant way.
The study of Arnold et al (2000) identified the various factors associated with the entry of a large format retailer into a new market, especially a smaller one. By secondary data and interview method conducted on developers, urban planners, professionals, economic development officers, retail executives and store managers, it was found that few stakeholders were benefited whereas few were at loss. The various factors were benefits to the consumer, differences in the demographics of large format store shoppers, rapid growth in the sales and market share of the new entrant, growth in the community economy, growth and decline in various commercial sectors, decline in the economy of nearby markets, creation and losses of jobs, and increases and decreases in market efficiency. John (Macdonald, John (1994) stated that the retail organizations facing the problems of growth need to use the concepts of total quality management (TQM) to maintain their competitive advantage and ensure that their culture lives on with new employees. The Quality concepts must be rooted in the retail organization, including the external parties such as suppliers and distributors.
OBJECTIVES
1. The objective of the current study is to develop and standardize a measure to evaluate customer satisfaction in hypermarket shopping.
2. The objective of the current study is to develop and standardize a measure to evaluate customer experience in hypermarket shopping
3. Measure the effect of customer experience on customer satisfaction in hypermarket shopping.

Oct-Dec12 Vol. II No. IV Journal of Management Value & Ethics
27
RESEARCH METHODOLOGY
The Study
The Study is exploratory in nature with survey method being used to complete the study.
Sampling Design
Population: Population included customers of Gwalior Region.
Sample Frame: The Sample Frame is of customers who shop in hypermarkets.
Sampling Elements: Individual respondent would be sampling element.
Sampling Technique: Purposive sampling technique used to select the sample.
Sample Size: Sample Size was 100 respondents.
Tools used for the Data Collection
Self Designed questionnaires used for the evaluation of Customer Experience and Customer Satisfaction. Data collected on a Likert Type Scale, where in Customer Expereince 5 stands for Strongly Agree and 1 stands for Strongly Disagree and in Customer Satisfaction 5 stands for Highly Satisfied and 1 Stands for Highly Dissatisfied.
Tools Used for Data Analysis
• The measure has been standardized through computation of Reliability and Validity.
• Regression test has been applied to identify the relationship between Customer Experience and Customer Satisfaction
• Factor analysis was carried out to find out the underlying factors of Customer Experience and customer satisfaction
HYPOTHESIS
HO: There is no significant effect of Customer Experience on Customer Satisfaction.

Oct-Dec12 Vol. II No. IV Journal of Management Value & Ethics
28
RESULT AND DISCUSSION
RELIABILITY MEASURE
Reliability test was carried out using SPSS software and the reliability test measure are given below:
1. Value of Cronbach’s Alpha for Customer Satisfaction
Reliability Statistics
Cronbach's Alpha Cronbach's Alpha Based on Standardized Items N of Items
.749 .700 17
2.Value of Cronbach’s Alpha for Customer Experience
Reliability Statistics
Cronbach's Alpha Cronbach's Alpha Based on Standardized Items N of Items
.729 .736 9
It is considered that the reliability value is more than 0.7 is good and it can be seen that reliability value is quite higher than the standard value .So the questionnaire is reliable.
VALIDITY
The face validity was checked and found to be high.

Oct-Dec12 Vol. II No. IV Journal of Management Value & Ethics
29
REGRESSION ANALYSIS
The regression is calculated by taking the total customer experience and customer satisfaction by using SPSS software. In this the customer experience as the independent variable and customer satisfaction as the dependent variable.
Model Summaryb
Model R R Square Adjusted R Square Std. Error of the Estimate
1 .674a .455 .449 5.47958
a. Predictors: (Constant), cusexp
b. Dependent Variable: consat
ANOVA b
Model Sum of Squares Df Mean
Square F Sig.
1 Regression
2451.710 1 2451.710 81.653
.000a
Residual
2942.530 98 30.026
Total 5394.240 99
a. Predictors: (Constant), cusexp
b. Dependent Variable: consat
Coefficientsa
Model Unstandardized Coefficients Standardized Coefficients T Sig.
Oct-Dec12 Vol. II No. IV Journal of Management Value & Ethics
30
B Std. Error Beta
1 (Constant)
30.143 3.923 7.685 .000
cusexp 1.017 .113 .674 9.036 .000
a. Dependent Variable: consat
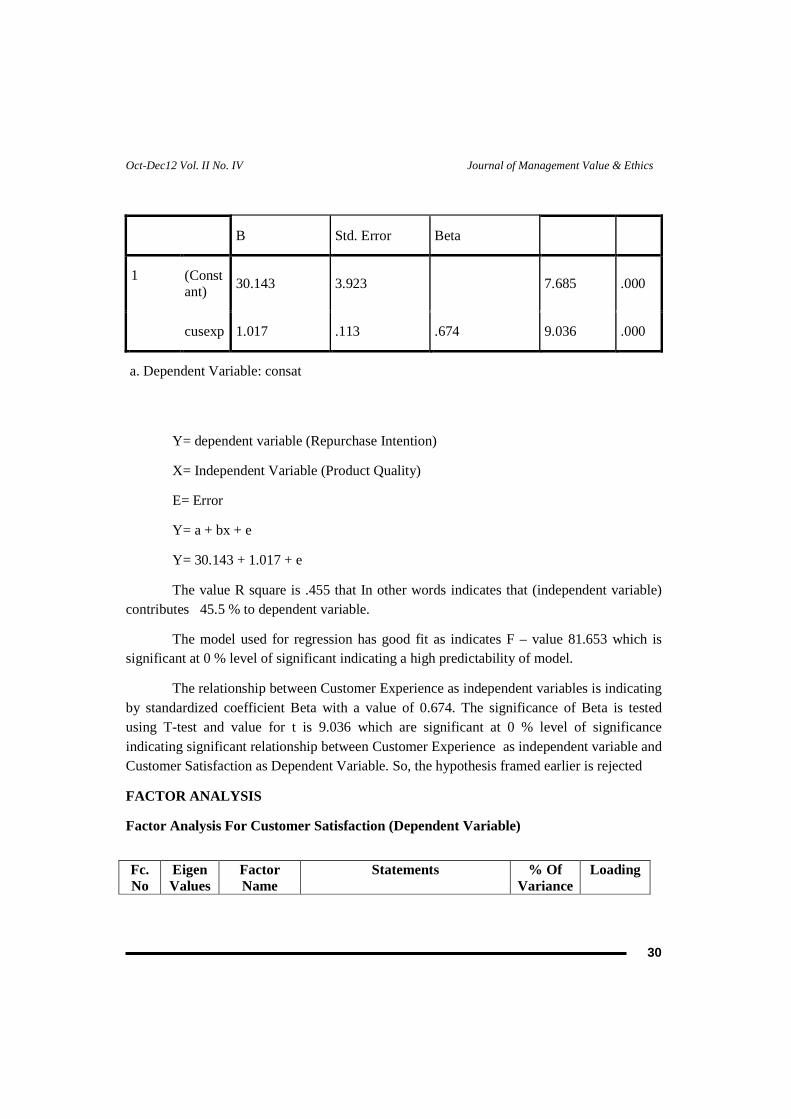
Y= dependent variable (Repurchase Intention)
X= Independent Variable (Product Quality)
E= Error
Y= a + bx + e
Y= 30.143 + 1.017 + e
The value R square is .455 that In other words indicates that (independent variable) contributes 45.5 % to dependent variable.
The model used for regression has good fit as indicates F – value 81.653 which is significant at 0 % level of significant indicating a high predictability of model.
The relationship between Customer Experience as independent variables is indicating by standardized coefficient Beta with a value of 0.674. The significance of Beta is tested using T-test and value for t is 9.036 which are significant at 0 % level of significance indicating significant relationship between Customer Experience as independent variable and Customer Satisfaction as Dependent Variable. So, the hypothesis framed earlier is rejected
FACTOR ANALYSIS
Factor Analysis For Customer Satisfaction (Dependent Variable)
Fc. No
Eigen Values
Factor Name
Statements % Of Variance
Loading

Oct-Dec12 Vol. II No. IV Journal of Management Value & Ethics
31
1 4.142 Convenient 10. Like Hypermarket shopping. 1.More convenient than general
grocery store
16.Hypermarket is more convenient than general grocery store
.814
2. Hypermarkets provide wide variety of product range.
.731
9. Hypermarkets meeting the need of a single shopper.
.679
2 3.444 Accessible 4. Easily reachable
20.260 .928
17.Satisfied with the services provided by this store
.838
11. Like to buy new grocery products when they first come out.
.787
7. Parking facility provides convenience
.622
3 2.726 Ambience and Discount cards
3. Ambience of the store remains good.
16.038 .876
6. Membership cards & discounts are really worthwhile and attract repurchase.
.776
13. Lay out makes it easy to find the products I need.
.719
12. Use of coupons to keep grocery bill down.
.549
4 2.695 Exchange e 8. Ease in Exchange of 16.038 .876

Oct-Dec12 Vol. II No. IV Journal of Management Value & Ethics
32
policy and Location
merchandise
5. Preference because of convenient location.
.776
5 1.798 Mode of payment and security
14. Credit card acceptance and other payments mode makes shopping easy in Hypermarket.
10.578 .840
15. Security of goods at the counter is a beneficial facility given by Hypermarkets
.766
DISCUSSION OF FACTORS:
The total number of factors identified in the first variable i.e. Customer Satisfaction as Dependent Variable were five
1. Convenient: Convinient Factor has received highest Eigen Value of 4.142 and total variance explained was 24.365 %. So we can see here that the it is considered as the most important factor for the study of Customer Satisfaction.
2. Accessible: This factor has received second highest Eigen Value of 3.444 and total variance explained was 20.260 . So we can see here that the it is considered as the second most important factor for the study of Customer Satisfaction.
3. Ambience and Discount cards: It has received Eigen Value of 2.726 and total variance explained was 16.038 .
4. Exchange e policy and Location :It has received Eigen Value of 2.695 and total variance explained was16.038 .
5. Mode of payment and security: It has received Eigen Value of 1.798 and total variance explained was 10.578 . So we can see here that the it least considered factor for the study of Customer Satisfaction.
FACTOR ANALYSIS FOR CUSTOMER EXPERIENCE (INDEPENDEN T VARIABLE)

Oct-Dec12 Vol. II No. IV Journal of Management Value & Ethics
33
Fc. No
Eigen Values
Factor Name
Variable Convergence % Of Variance
Loading
1 2.858 Persistency and quality
6. Store offers wide variety of merchandise selection
31.751 .893
9. There is no guarantee of quality after the product is being purchased from the Hypermarket.
.808
3. Will continue using the services of this store in the future too
.755
5. Store provides prompt customer service
.677
2 2.533 Stock and check outs
Many products are out of stock when I shop.
28.147 .976
8. Computerized checkout scanners benefit shoppers.
.817
3 2.364 Impulsiveness and recommendation
7. Normally buy some product on my grocery shopping trip that I hadn’t planned to.
26.269 .965
4. Recommend this store to my friends and colleagues
.853

Oct-Dec12 Vol. II No. IV Journal of Management Value & Ethics
34
10 Try to save time by buying all groceries at one store.
.603
DISCUSSION OF FACTORS
The total number of factors identified in the Second variable i.e. Customer Experience as Independent Variable were three
1. Persistency and quality :Persistency and quality Factor has received highest Eigen Value of 2.858 and total variance explained was 31.751. So we can see here that the it is considered as the most important factor for the study of Customer Experience.
2. Stock and check outs: This Factor has received second highest Eigen Value of 2.533 and total variance explained was 28.147 So we can see here that the it is considered as the second most important factor for the study of Customer Experience.
3. Impulsiveness and recommendation: This Factor has received highest Eigen Value of 2.364 and total variance explained was 26.269 %. So we can see here that that it is least considered factor for the study of Customer Experience.
IMPLICATION
• This is intended to be useful contribution to understand the importance of Customer Experience on Customer satisfaction.
• It is also useful contribution for further researches because it provides a link between theory and practice.
• This study will also be useful to those Hypermarkets who want to conduct research for knowing the correlation of Customer Experience with Customer satisfaction; they will be able to solve several problems related to their Customers.
• It also contributes to the related industry in helping them by knowing about the effect of Customer Experience on Customer satisfaction.
SUGGESTIONS
• The study has been conducted in Gwalior Region and population is taken from only Gwalior, it can be extended to other cities also.

Oct-Dec12 Vol. II No. IV Journal of Management Value & Ethics
35
• The study is based on the sample size of 100 respondents, as soon as we increase the respondents, the result may vary.
• The research on Customer Experience as correlates of Customer satisfaction can also be conducted in other sectors.
SUMMARY
This study has been divided into five parts which includes introduction and its sub parts are conceptual framework, review of literature, rational and objectives. In conceptual framework all the definitions and introduction about the topic is included, in literature review all the researches are included which has been done previously, rational is the need of study which describes why the research is been done. Second part is research methodology, which includes study, sample and tools for the data collection. The study is exploratory in nature, self designed questionnaire has been used and purposive sampling technique has been adopted. The sample size is 100 which includes the respondents from Gwalior Region .the questionnaire is divided in two parts, part one includes 18 item out of which three items are dropped and part two includes 10 items out of which two items are dropped. Then tools for data analysis showed which type has been applied in this study, like in this research correlation, reliability, regression, validity and factor analysis has been applied. Third part of the study is about result and discussion means whether review of literature matches with our results. Fourth part of the study covers implications and suggestions. Fifth part covers the summary of the study which is followed by the Sixth part which concludes the study by wrapping conclusion and in the end references and annexure.
CONCLUSION
The study examined the effect of customer experience on customer satisfaction in Hypermarket shopping of Gwalior Region. Questionnaire were filled by the frequent as well as occasional customers and visitors of Hypermarkets and by applying test like item to total correlation, validity, reliability, regression, factor analysis it has been concluded that customer experience play a dominant role in observing and developing customer satisfaction in Hypermarket Shopping .This study reflects a high degree of correlation between customer experience (independent variable) and Customer satisfaction(dependent variable).

Oct-Dec12 Vol. II No. IV Journal of Management Value & Ethics
36
References
1. Arnold, S. J. and Monika N. L. (2000), Market entry effects of large format retailers: a stakeholder
analysis, International Journal of Retail & Distribution Management, 28(4/5), 139 – 154
2. Barros C.P. (2006), Efficiency measurement among hypermarkets and supermarkets and the
identification of the efficiency drivers: A case study. International Journal of Retail & Distribution
Management, 34 (2), 135 – 154
3. CatalunaF., Javier R, Manuel J., Sanchez F. and Ramos A.F.V.(2005). Are hypermarket prices different
from discount store prices? Journal of Product & Brand Management, 14(5), 330 – 337
4. Hare C. (2003), The food-shopping experience: a satisfaction survey of older Scottish consumers,
International Journal of Retail & Distribution Management, 31(5), 244 – 255
5. http://www.cygnusindia.com/Industry%20Insight-Hypermarkets-
Executive%20Summary%20&%20TOC-May%202004.pdf)
6. Jones P.M. (1982), Hypermarkets Superstores — Saturation or future growth? International Journal of
Retail & Distribution Management, 10(4), 20 – 27
7. Macdonald J.(1994). Quality in Retail and Distribution, The TQM Magazine, 6(4), 11 - 14
8. Seiders K., Constantine S. and Tigert D.(2000), The impact of supercenters on traditional food retailers
in four markets, International Journal of Retail & Distribution Management, 28(4/5), 181 – 193
9. Shannon R. and Rujirutana M (2008), Causal path modeling of grocery shopping in hypermarkets,
Journal of Product & Brand Management, 17(5), 327-340.

Oct-Dec12 Vol. II No. IV Journal of Management Value & Ethics
37
IMPACT OF STRESS ON JOB PERFORMANCE IN BANKING SECTOR- A CRITICAL ANALYSIS
Shaifali Garg* Mohd. Junaid Rizvi** ,
ABSTRACT
In the recent scenario Banking sector has undergone in a tremendous changes .Liberalization, entry of foreign banks, technological developments and increased competition has made banks to strive hard for success. Banks are not thinking in Terms of traditional services but value added benefits to the customers for competitive advantage. This has put pressure on the employees of banks to render better job performance in terms of results. Due to this, the employees face role overload, role ambiguity which are the symptoms of role stress. The study tests the impact of stress on the job performance by using (n=100) data of employees including managers,officers and clerks of banks in Central Delhi. The data obtained through questionnaires were analyzed using statistical tools like Mean, Standard deviation and ANOVA. The analysis of variance revealed significant difference between Role Stress with Gender, Education levels, Designation, Income levels and Age groups of respondents.
INTRODUCTION
With increasing complexity in our life style, the level of stress has been rising at aphenomenal rate. Stress is often developed when an individual is assigned a major responsibility without proper authority and delegation of power. Interpersonal factors such as group cohesiveness, functional dependence, communication frequency, relative authority and organizational distance between the role sender and the focal persons are important topics in organizational behavior. According to (Anderson, 2002) work to family conflicts is also a predecessor which creates stress in employees of an organization. Kahn et al., (1964) in their study observed that job stress has been viewed as dysfunctional for organizations and their members although stress has been variously viewed as an environmental stimulus to an
* Assistant Professor ,Galgotia Institute of Management & Technology,Greater noida. Email id :[email protected] ** Assistant Professor ,Galgotia Institute of Management & Technology,Greater noida. Email id :[email protected]
Oct-Dec12 Vol. II No. IV Journal of Management Value & Ethics
38
individual. Stress is an individual's reaction to an environmental force that affects an individual's performance. The banking scenario has witnessed sweeping change due to liberalization, privatization, globalization and modernization. This created increasing demand for learning new skillset, adapt to modern technological developments, work pressure, time pressure and hectic jobs. Owing to this the employees in the banking sector are facing role stress, which has an influence on job performance.
NEED FOR THE STUDY
Central Delhi is the hub of all banks such as HDFC Bank Connaught Place, New Delhi,Syndicate Bank Naya Bazar, New Delhi,UCO Bank ATM ,ABN Amro bank,,syndicate bank,state bank of india,corporation bank, American Express Bank ,Standard charted bank etc has been in the banking profession since a long time. Over the last ten years the banking.Industry has gone through some sweeping changes. Transformation, Consolidation, Outsourcing are just some of the most prominent buzzwords that are used to describe major trends afflicting the banking industry. Banking has become more of a serviceindustry and less of a processing industry, staff performance and morale has become more and more important. There was a day when the banks worked like kings ruling the kingdoms but the scenario has completely changed. Today the customer is the king and the banks have to go a step ahead to treat the customers with respect and render all the services to keep them happy. Banks are doing what they can to distinguish themselves from each other and one of the most effective, and least expensive ways of achieving distinction will be to serve customers with friendly, dedicated and well-motivated staff. In the whole process the bank employees are facing a lot of pressure to strike a balance which slowly is taking the face of stress. In this juncture, the present study is undertaken to address the various forms of role stress that a bank employee faces at his work place and its impact on job performance.
REVIEW OF LITERATURE
The literature on role stress and job performance indicates that stress is a constituent of modern organizations and it would remain a constant phenomenon in the workplace. Sikora et al., (2004) suggest that daily demands in the workplace are a constant challenge to the assimilative and adaptive capabilities of employees. Thus, an employee, who is overtaxed and unable to cope with environmental demands, would develop stress reactions or exhaustion,

Oct-Dec12 Vol. II No. IV Journal of Management Value & Ethics
39
which in turn, will adversely affect the employee's job performance. However, job performance refers to the duties and responsibilities that are executed as part of an individual's job assignments (Vigoda, 2000). Past studies have conceptualized job performance as comprising quality and quantity of tasks accomplished. Individuals suffering from emotional exhaustion may experience impaired coping ability that may lead to less motivation to achieve desirable quality and quantity of performance. As originally conceptualized (Kahn et al., 1964), role ambiguity refers to the relative unpredictability of the outcome of an individual's behavior. However, the most popular measure of role ambiguity also includes the component of lack of input from the environment to guide behavior (Rizzo et al., 1970). Relative to the other stressors, role ambiguity is least likely to have a challenge component because there are fewer coping processes that could possibly counteract its negative effects (King and King, 1990). This argument is consistent with the argument of Kahn et al., (1964) that relative to other types of stressors, role ambiguity is more structurally determined. Therefore, when ambiguity is high, the individual faces the difficulty of pursuing job assignments because of an inability to modify them (Lazarus and Folkman, 1984). On the other hand, when role ambiguity is low (role clarity is high), employees' knowledge of what is expected of them (their job requirements) and how to achieve these expectations (processes and ocedures) are high (Griffin and Jackson, 1999). This in turn facilitates a high level of job control, which is associated with higher job performance (Griffin et al., 2007). All previous meta analytic reviews that covered role ambiguity supported the expectation of a relatively strong negative association between role ambiguity and performance (Fisher and Gitelson, 1983; Jackson and Schuler, 1985; Tubre and Collins, 2000).
METHODOLOGY
The validity of any research is basically dependent on the systematic method of data collection and analysis. Primary data was used for the present study. The primary data was collected from 100 sample respondents (bank employees) from Central Delhi City by convenience sampling method. For this purpose, structured questionnaire i.e. Organizational Role Stress scale (ORS) to collect the primary data from the selected sample respondents. The statistical tools used for analyzing the data were Mean, Standard deviation and ANOVA.

Oct-Dec12 Vol. II No. IV Journal of Management Value & Ethics
40
OBJECTIVES
The objectives of the study were
1. To identify and analyze the factors influencing role stress
2. To find the association between various factors influencing role stress.
3. To understand the implications of role stress on job performance
Demographic Factors
variables Frequency
percentage(%)
Gender male 61 61
female 39 39
Age (years) 25-29 18.0 18.0
30-35 19.0 19.0
36-40 18.0 18.0
41-45 9.0 9.0
Above 46 36.0 36.0
qualification 10th 24 24.0
12th 6 6.0
UG 33 33.0
PG 37 37.0
Designation Clerk 61 61.0
Special Assistant 3 3.0
officer 18 18.0
Manager 18 18.0
place Central Delhi 76 76.0
Ghaziabad (indrapuram) 24 24.0
Income (rupees)
75000-150000 42 42.0
150000-225000 15 15.0
225000-300000 21 21.0

Oct-Dec12 Vol. II No. IV Journal of Management Value & Ethics
41
Above 300000 22 22.0
Marital status Married 82 82.0
unmarried 18 18.0
Dependents Less than 2 27 27.0
2-4 66 66.0
4-6 7 7.0
services Less than 5 27 27.0
5-10 16 16.0
10-15 9 9.0
15-20 12 12.0
20-25 9 9.0
Above 25 27 27.0
The above table gives frequency and percentage of demographics of the respondents. From the total sample size of 100, in which 61% were male and 39% were female respondents. In this study majority of the respondents belonged to age group of above 46 years, followed by 41-45, 36-40, 30-35 and 25-29 (36%, 9%, 18%, 19% and 18% respectively). Qualification wise majority of the respondents were 37% post graduates, 33% were undergraduates, 24% had completed 10th and 6% only 12th. Of the respondents around 61% were clerks by designation, 18% each as officers and managers and 3% were special assistants. 76% of the respondents were from the banks in central Delhi and 24% from the Ghaziabad.
Majority i.e. 42% of the respondents were in the income level of Rs.75000-150000, 22% above Rs.300000, 21% in the range of Rs.225000-300000 and 15% in the range of Rs.150000-225000. 82% of the respondents were married in comparison to 18% unmarried. 66% of the respondents have 2 to 4 dependants in their family in comparison to 27% less than 2 and a small percentage of 7% had more than 4 dependents. Majority i.e. 27% of the respondents had either less than 5 years or above 25 years of work experience, 16% had 5 to 10 years, 12% had 15 to 20 years, a small percentage of 9% with 10 to 15 years and 20 to 25 years of experience respectively.

Oct-Dec12 Vol. II No. IV Journal of Management Value & Ethics
42
Ten factors according to Organizational Role Stress scale (ORS) (Pareek, 1993) are:
Factor 1- Self role distance (SRD): It denotes the conflict between the self concept and the expectations from the role. Roles which call for behavior which is not in accordance with the value system of the person result in Self role distance.
Factor 2: Role stagnation (RS ) : As a person occupies a role over a period of time, he grows into that role and behavior patterns become habitual. When he has to assume a new role he is unable to change as he has outgrown in that role.
Factor 3: Inter role distance (IRD): Due to the simultaneous occupation of multiple roles, it is likely to face conflicts between them. An employee could face conflicts between his or her role as an executive and role of a father or a mother.
Factor 4: Role ambiguity (RA): This results when a person is not clear about the expectations that other people have from him. This can happen when an employee has taken a new job without sufficient orientation to that role.
Factor 5: Role expectation conflict (REC): This is due to the conflicting expectations of different role senders for ex: boss, colleagues, clients etc.
Factor 6: Role overload (RO): When more and more work is demanded out of an employee stress increases because of role overload. It occurs when a person is unable to face the demands of that role.
Factor 7: Role erosion (RE): When an employee feels that some of his duties are taken away from him or that he is underemployed, the stress which results is Role erosion.
Factor 8: Role inadequacy (RI): It is experienced when an employee is not supplied with enough resources for ex: manpower, facilities and finance.
Factor 9: Personal inadequacy (PI): This occurs when an employee feels that he lacks the expertise or skills necessary for efficient role performance.
Factor 10: Role isolation (RIN): An employee may feel that some roles are close to him and others are at a relatively greater distance. If linkages are strong feelings of role isolation will be low and vice versa.
Then I further classified the ten factors into 2 main classifications-
1. Role Space Conflict (RSC1) - Refers to conflict between the self, a person's role and the other role occupied by him. Self role distance (SRD), Inter role distance (IRD),

Oct-Dec12 Vol. II No. IV Journal of Management Value & Ethics
43
Role stagnation (RS) are included in the Role space conflict.
2. Role Set Conflict (RSC2) - Denotes the incompatibilities amongst the varying expectations from the role holder. Role ambiguity (RA), Role expectation conflict (REC), Role overload (RO), Role erosion (RE), Role inadequacy (RI), Personal inadequacy (PI), Role isolation (RI) constitute role set conflict.
Demographic variable
RSC1 RSC2
Gender Male Mean 2.26 2.25
SD 0.677 0.658
Female Mean 2.80 2.70
SD 0.482 0.373
Total Mean 2.47 2.43
SD 0.660 0.603
Anova Results F Value 18.329 15.107
P Value 0.000 0.000
Age(years) 25-29 Mean 2.60 2.85
SD 0.293 0.143
30-35 Mean 2.49 2.51
SD 0.337 0.612
36-40 Mean 2.57 2.75
SD 0.828 0.551
41-45 Mean 2.07 2.08
SD 0.757 0.606
Above 46 Mean 2.45 2.10
SD 0.785 0.663
Total Mean 2.47 2.43
SD 0.660 0.603
Anova Results F value 1.129 9.309

Oct-Dec12 Vol. II No. IV Journal of Management Value & Ethics
44
P value 0.348 0.000
Qualification 10th Mean 2.60 2.85
SD 0.293 0.143
12th Mean 2.65 2.36
SD 0.337 0.612
UG Mean 2.57 2.51
SD 0.828 0.551
PG Mean 2.07 2.08
SD 0.757 0.606
Total Mean 2.47 2.43
SD 0.660 0.603
Anova Results F Value 4.446 6.838
P value 0.006 0.000
Place Central Delhi Mean 2.50 2.43
SD 0.735 0.645
Ghaziabad (indrapuram)
Mean 2.40 2.44
SD 0.410 0.513
Total Mean 2.47 2.43
SD 0.660 0.603
Anova result
F Value 0.365 0.032
P Value 0.695 0.969
Designation Clerk Mean 2.66 2.67
SD 0.523 0.423
Special Assistant
Mean 1.93 2.09
SD 0.000 0.000
officer Mean 2.65 2.36
SD 0.337 0.612
Manager Mean 1.74 1.74
SD 0.822 0.612

Oct-Dec12 Vol. II No. IV Journal of Management Value & Ethics
45
Total Mean 2.47 2.43
SD 0.660 0.603
Anova Results F value 14.181 16.841
P value 0.000 0.000
Income (Rs.) 75000-150000 Mean 2.63 2.66
SD 0.431 0.272
150000-225000
Mean 2.58 2.50
SD 0.360 0.541
225000-300000
Mean 2.47 2.58
SD 0.827 0.659
Above 300000
Mean 2.11 1.79
SD 0.757 0.606
Total Mean 2.47 2.43
SD 0.660 0.603
Anova Result F value 3.379 15.130
P Value 0.021 0.000
Service(years) Less than 5 Mean 2.50 2.72
SD 0.478 0.384
5-10 Mean 2.47 2.47
SD 0.799 0.552
10-15 Mean 2.60 2.36
SD 0.254 0.252
15-20 Mean 3.03 2.77
SD 0.455 0.076
20-25 Mean 2.07 2.01
SD 0.757 0.613
Above 25 Mean 2.28 1.96
SD 0.728 0.663
Total Mean 2.47 2.43

Oct-Dec12 Vol. II No. IV Journal of Management Value & Ethics
46
SD 0.660 0.603
Anova Results F value 3.287 10.152
P Value 0.009 0.000
Marital Status Married Mean 2.43 2.31
SD 0.706 0.597
unmarried Mean 2.60 2.95
SD 0.355 0.199
Total Mean 2.47 2.43
SD 0.660 0.603
Anova Results F Value 1.179 10.980
P Value 0.312 0.000
Dependants Less than 2 Mean 2.46 2.63
SD 0.334 0.448
2-4 Mean 2.47 2.36
SD 0.695 0.616
4-6 Mean 2.53 2.30
SD 1.213 .867
Total Mean 2.47 2.43
SD 0.660 0.603
Anova results F value 0.035 2.273
P Value 0.966 0.108
1. Analysis of variance revealed that there is significant difference between male and female towards Role space conflict (RSC1) (F=18.329; P=.000), and Role set conflict (RSC2) (F=15.107; P=.000).
2. The above table reveals the results of ANOVA with no significant difference between age groups towards Role space conflict (RSC1) and significant difference between age groups towards Role set conflict (RSC2) factor. The Role space conflict (RSC1) had 'F' value of 1.129 and P value of .348 and Role set conflict (RSC2) with 'F' value of 9.309 and P value .000 respectively.
3. Analysis of variance revealed significant difference between different education

Oct-Dec12 Vol. II No. IV Journal of Management Value & Ethics
47
level and Role space conflict –RSC1 with F value of 4.446 and P value of .006 and Role set conflict –RSC2 factor with F value of 6.838 and P value of .000.
4. ANOVA table states that there is no significant difference between place of The work and Role space conflict –RSC1 and Role set conflict –RSC2. The mean scores of all the factors were found to be statistically same.
5. From above table it is evident that there is significant difference found on conducting ANOVA between different levels of designation and Role space conflict –RSC1 with F value of 14.181 and P value of .000 and Role set conflict RSC2 with F value of 16.841and P value of .000 respectively.
1. From the above table it is clear that analysis of variance revealed significant difference between different income levels and Role space conflict –RSC1 with F value of 3.379 and P value of .021 and Role set conflict –RSC2 with F value of 15.130 and P value of .000.
2. Analysis of variance revealed that there is significant difference between the different age groups and Role space conflict (RSC1) (F=3.287; P=.009), and Role set conflict (RSC2) (F=10.152; P=.000).
3. The above table reveals the results of ANOVA with no significant difference The between marital status towards Role space conflict (RSC1) and significant difference between marital statuses towards Role set conflict (RSC2) factors. The factors like Role space conflict (RSC1) had 'F' value of 1.179 and P value of.312 with Role set conflict (RSC2) 'F' value of 10.980 and P value .000 respectively.
4. The ANOVA table states that there is no significant difference between The dependents and factors Role space conflict –RSC1 and the number Role set conflict –RSC2. The mean scores of all the factors were found to be statistically same.
RESEARCH IMPLICATIONS AND CONCLUSIONS
This research was undertaken to know the factors influencing role stress and its impact on job performance in banks. Based on convenience sampling method, primary data (structured questionnaire) was collected from 100 respondents (bank employees) of Newdelhi city. Through the structured questionnaire of (Pareek*,1993) Organizational Role Stress scale (ORS) was employed to collect the primary data from the selected sample respondents.
The basic objective of the research was to identify and find the association between factors influencing role stress and its implications on job performance. Descriptive study of

Oct-Dec12 Vol. II No. IV Journal of Management Value & Ethics
48
demographic factors revealed that major of the respondents was male. 36% of respondents were above 46 years of age followed by 41-45, 36-40, 30-35 and 25-29 (36%, 9%, 18%, 19% and 18%) respectively. 76% of the respondents were from the banks in urban areas. Qualification wise majority of the respondents were 37% post graduates and 33% were undergraduates. Of the respondents around 61% were clerks by designation, 18% each as officers and managers. Majority of the respondents have 2 to 4 dependants in their family. Majority of the respondents had either less than 5 years or above 25 years of work experience. Majority i.e. 42% of the respondents were in the income level of Rs. 75000-150000.
1. Analysis of variance revealed that there is significant difference between male and female towards Role space conflict (RSC1) (F=18.329; P=.000), and Role set conflict (RSC2) (F=15.107; P=.000).This shows the mean responses of male respondents are comparatively lesser than that of the mean responses of the female respondents. This implies female respondents are more prone to role set conflict and role space conflict.
2. Analysis of variance revealed significant difference between different educational level and Role space conflict –RSC1 with F value of 4.446 and P value of .006 and Role set conflict RSC2 factor with F value of 6.838 and P value of .000. Post graduate employees are experiencing less stress in comparison with employees of lower qualification.
3. There is significant difference found on conducting ANOVA between different levels of designation and Role space conflict RSC1 with F value of 14.181 and P value of .000 and Role set conflict RSC2 with F value of 16.841and P value of .000 respectively. The mean scores of managers and special assistants are low in comparison to other designations.
4. The analysis of variance revealed significant difference between different The income levels and Role space conflict RSC1 with F value of 3.379 and P value of .021 and Role set conflict RSC2 with F value of 15.130 and P value of .000. Employees with salary above 300,000 experience lower role stress but it is higher in case of Role space conflict in comparison with Role set conflict.

Oct-Dec12 Vol. II No. IV Journal of Management Value & Ethics
49
References
− Ishal Samartha, Lokesh and N. Ashwitha Karkera(2011),Prerana,GRG school of management,coimbatore ,india .
− Anderson, E.S., Coffey, S.B., and Byerly, T.R. (2002), Formal Organizational Initiatives and Informal Workplace Practices: Links to Work-Family Conflict and Job-Related Outcomes. Journal of Management 28,787
− Chandraiah, Agrawal S.C., Marimuthu P., and Manoharan, N. (2003) Occupational Stress and Job Satisfaction Among Managers. Indian Journal of Occupational and Environmental Medicine 7(2)
− Fisher, C.D., and Gitelson, R. (1983), A meta-analysis of the correlates of role conflict and ambiguity.Journal of Applied Psychology, 68, 320–333.
− Griffin M.A., Neal A. and Parker S.K. (2007), The new model of work role performance: Positive behavior uncertain and interdependent contexts. Academy of Management Journal, 50, 327–347.
− Kahn R.L., Wolfe D.M., Quinn R.P., Snoek J.D. and Rosenthal R.A. (1964), Organizational stress: Studies in role conflict and role ambiguity. New York: Wiley.
− King L.A. and King D.W. (1990), Role conflict and role ambiguity: A critical assessment of construct validity. Psychological Bulletin, 107, 48–64
− Lazarus R.S., Folkman S. (1984), Stressor, appraisal, and coping. New York: Springer
− Pareek, U. (1993), Making organizational roles effective: New Delhi: Tata McGraw Hill
− Rizzo J.R., House R.J. and Lirtzman S.I. (1970), Role conflict and role ambiguity in complex organizations. Administrative Science Quarterly, 15, 150–163
− Sikora, P. B., Beaty, E. D., and Forward, J. (2004), Updating theory on organizational stress: The asynchronous multiple overlapping change (AMOC) model of workplace stress. Human Resources Development Review, 3(1), 3-35
− Vansell, M., Brief, A.P. and Schuler, R.S. (1981). Role conflict and Role ambiguity: Integration of the literature and directions for future research. Journal of Human relations, 34(1), 43-66
− Vigoda, E. (2000), Internal politics in public administration systems: An empirical examination of its relationship with job congruence, organizational citizenship behavior, and in-role performance. Public Personnel Management, 29(2), 185-210.
"Never play with the feelings of others
because you may win the game but the risk is that you will surely lose the person for a life time".
- Shakespeare

Oct-Dec12 Vol. II No. IV Journal of Management Value & Ethics
50
IMPACT OF EXCELLENCE MODEL AWARDS ON STOCK MARKET PERFORMANCE - A STUDY OF SELECTED INDIAN
COMPANIES
Prof R.K. Gupta*
ABSTRACT
Business excellence awards have been commissioned in many countries based on national excellence models. One such important model is Malcolm Bridge award in USA. In India CII-Exim excellence award is given to best companies. However in India a few companies have so far qualified for such excellence awards. Globally many studies have indicated that winning such quality or excellence wards give superior returns in stock price performance. But the studies have mixed results. This paper is based on research conducted in Indian companies regarding their price performance in stock market for a period of 7 years. A new variable Consistency Score has also been used as an indicator of consistent financial performance by companies using best practices.
Key words: Stock performance, business excellence, consistency score, stock market returns
Introduction:
Achieving excellence has become imperative for companies to reach a world class status which shall make them strong enough to become globally competitive and withstand changes in dynamic and complex environment and also be able to meet rising expectations of shareholders. The end result of the efforts of companies is always gauged by shareholders in terms of stock performance in market which gives them consistently superior returns over ordinary companies or over the general market indices like Nifty 50 or BSE 100.
A number of studies have been conducted in various countries that claim that Excellence award winning companies give superior returns to shareholders. One such study by Hendricks and Singhal conducted on Malcolm Bridge award wining companies in USA is quite popular and frequently referred in literature.
* Prof Rajendra K Gupta, SoBM, Jaipur National University, Jaipur Email: [email protected], [email protected] Mobile:+919413782645, 9636207086
Oct-Dec12 Vol. II No. IV Journal of Management Value & Ethics
51
As a part of doctoral research project on ‘Factors determining excellence in Indian Companies’, we collected data of CII-EXIM excellence award companies in India up-to 2011 to study effect of excellence practices on shareholders returns.
The Research Model
One parameter of excellence is better financial reward earned for shareholders in terms of rise in stock price relative to the broad benchmark indices. Here we have two choices for comparative study for outperformance. One is NSE 500 index, a broad based index that covers 95% of market capitalization in India, and other is our standard NSE Nifty 50, popularly called Nifty. Since CNX500 and CNX 50 both follow same trend in performance, we have taken nifty fifty and the stock performance for comparison purposes.
So if a investor puts in Rupee 1 in Nifty index future and the same amount in an excellence award winning company, how the investor gets stock market performance for the invested amount in terms of % growth/decline is subject of this study.
A period of 7 years has been taken for study. This is considered good enough time period even for long term investment point of view as well as to see comparative performance of markets and the company stocks of our interest. Hence we have plotted graphs of stock prices of companies with excellence awards/prizes and the general stock index Nifty 50 starting 18-9-2005. These graphs are auto generated by database of NSE processed by professional financial advisory service Investar Mumbai.
The starting level price change for both the plots is of course 0% before 7 years from now. The changes are being measured in term of percentage change in price at any given date as compared to zero level date.
The other dimension we have considered for excellence is continuous growth of revenue and profits registered by the company. This is natural outcome expected when a company practices excellence. For this we designed a new variable as explained below:
Consistency Score (CS)
Since conventional financial measures like ROI vary from industry to industry, we have taken CAGR of companies as a measure free of external conditions and we designed this new score called Consistency score:

Oct-Dec12 Vol. II No. IV Journal of Management Value & Ethics
52
In last 5 years results there are 4 blocks. For company registering positive growth in each block 1 point is given to each of sales growth, Gross profit growth and PAT growth, respectively. These three criteria take care of entire structuring and capital management capability of the firm besides its market share and revenue growth. Hence a firm can get maximum 4x3=12 points on consistency score and minimum of 0.
For example: The financial data of 5 years (2007-2011) for two companies from our sample is given
Table 1: Example of financial data used to compute consistency score
Tata Power Co. Ltd.* Revenue 5,059.31 6,381.75 7,868.58 7,379.85 7,092.94
GP 1,067.43 1,428.22 1,751.32 2,143.84 1,720.26
PAT 696.8 869.9 922.2 947.65 970.01
EPS 35.21 39.41 41.65 39.93 40.87
FV Rs 10/-
TCS Revenue 15,156.52 18,979.67 21,947.76 23,222.05 29,770.14
GP 4,517.52 5,466.06 5,564.59 6,849.27 9,258.26
PAT 3,757.29 4,508.76 4,696.21 5,618.51 7,569.99
EPS 38.39 46.07 47.99 28.71 38.68
FV Rs 1/-
In Tata Power case, the revenue has dipped in 2010 and 2011 and hence it gets only 2 marks for rising revenue in 2007-2008 and 2008-2009 periods only. In Case of GP, there is
Oct-Dec12 Vol. II No. IV Journal of Management Value & Ethics
53
dip in only 2011. Hence it gets score of 3 out of 4 as it has positive growth in 3 periods. Since PAT is growing through out, it gets 4 marks. Hence total consistency score is 9, out of maximum possible 12.
Similarly for Tata Consultancy Services the Consistency score is 12 out of 12 since it has continuing positive growth in all three parameters in all 4 blocks of years. This way we calculated Consistency score, CAGR Revenue, and CAGR profit for all sample companies using last 5 years results from Indiaearnings.com, and verified from data found on company website and CMIE (Centre for Monitoring Indian Economy, Delhi) databases. The CS for all 75 companies is thus computed.
While consistency score depends on internal strength and management of firm, the CAGR still depends on macro factors, nature of industry and cyclic variations. Hence the CAGR rates may not hold validity for cross-sector comparisons.
Impact of Excellence Award/Prize
Table 2 List of CII EXIM winners in India (Source: CII Center of Excellence, Bangalore)
Award Winners 2009 - Bosch Limited, Diesel Systems business – Started outperforming since 2010
(Non sample)
2006: Tata Consultancy Services Limited -Started Outperforming July 2010 onwards
(Consistency score- 12)
2005: Commercial Vehicle Business Unit
(CVBU), Tata Motors Limited -Started Outperforming August 2010 onwards
(Consistency score 8.0)
2002: Infosys Technologies Limited -Up-to December 2009 underperforming. Now
(Consistency score-11.0) neutral
2000: Tata Iron & Steel Co. Limited - Under performing since August 2008
(Consistency score- 11.0)
1998: Maruti Udyog Limited - Outperforming since Jan 2009
1997: Hewlett Packard (India) Limited - Not listed
(Non sample)

Oct-Dec12 Vol. II No. IV Journal of Management Value & Ethics
54
Prize Winners 2010: Crompton Greaves India Ltd - Out performing since May 2009.Current Neutral
(Consistency score 12.0)
2008: The Tinplate Company of India Limited- Neutral Trend following Nifty Trend.
(Consistency score 7.0)
2006: Heavy Electrical Equipment Plant, BHEL, Haridwar - Outperformed but
(Consistency score 12.0) underperforming since Nov 2011
(Note- BHEL award is only for one of units of BHEL)
Sample companies CS score that received CII/EFQM model award/ prize
(Figures given against the name are consistency score of the company computed by us)
Tube Investment 7 BHEL 12 Crompton Grieves 12 Infosys 11 TCS 12 Tata Steel 11 Tin Plate 7
Fig 1 Comparison of price changes for SPCNX 500 and Nifty
Explanation of Graph:
The change in prices has been taken as zero % in beginning of 7 years period. The graph shows how the prices have changed in case of the two stocks, over the time. On 19-9-2012 the NSE 500 index has changed 101.91% from that value in 2005 and Nifty50 has changed 126%. A look on the graphs shows that CNX500 and Nifty 50 both are following similar trend through out. Hence for further comparison we have taken Nifty 50 graph as base.

Oct-Dec12 Vol. II No. IV Journal of Management Value & Ethics
55
Fig 2 Comparison of price changes for Bosch Ltd and Nifty
Fig 3 Comparison of price changes for BHEL and Nifty
Fig 4 Comparison of price changes for Tinplate and Nifty

Oct-Dec12 Vol. II No. IV Journal of Management Value & Ethics
56
Fig 5 Comparison of price changes for Crompton Greaves and Nifty
Fig 6 Comparison of price changes for Maruti Suzuki and Nifty
Fig 7 Comparison of price changes for Tata Steel and Nifty

Oct-Dec12 Vol. II No. IV Journal of Management Value & Ethics
57
Fig 8 Comparison of price changes for TCS and Nifty
Fig 9 Comparison of price changes for Infosys and Nifty
From perusal of above charts we can clearly see that only Bosch ltd, BHEL, Crompton Greaves and TCS have given higher performance than the benchmark index. Companies like Tinplate and Tata Steel have been under performers.
Conclusions: Hence the performance of those companies that have achieved excellence awards in India or excellence prizes do not show in clear terms that they gain advantage for shareholders in stock markets over benchmark indices. Even the computation of Consistency scores shows that Tata Steel and Tinplate Co of India have low CS of 7 which means these two companies have suffered negative growth in either profit or sales revenue in more than one financial year in last 5 years period. Incidentally both these companies belong to metals sector. Hence our finding in Indian companies is not in conformity with studies made in USA and some other places. The two important reasons could be given. Either these companies do not seriously pursue and maintain standards of excellence practice once awards are given or

Oct-Dec12 Vol. II No. IV Journal of Management Value & Ethics
58
the stock market performance depends more on macro economic factors and business cycles than company’s own internal strengths as far as out performing stock markets is concerned. However these companies are leaders in their own industry since these have been selected in the sample on this criterion.
The present finding adds to debate going on from excellence models in stock markets, going on. If any company continuously registers consistency score of 9 or above (Maximum 12) for a few years then, it is a good company to invest from shareholders point of view. Of course companies that practice excellence score high on business performance indicators indicating competitive strength, as was found in our main research study.
This may be one reason why many companies don’t opt for qualifying for National Excellence model award.
References
1. .Azaranga, Mohammad R. & Gonzalez, Graciela (1998). An empirical investigation of the relationship between quality improvement techniques and performance -- a Mexican case. Journal of Quality Management; Vol. 3 Issue 2, p265, 1998
2. Business Excellence Study 2011. Report of Asian Productivity Organization, 2011
3. EFQM & BQF funded study: Short Report; Organizational Excellence Strategies & Improved Financial Performance. University of Leicester. Copyright 2005 EFQM and BQF.
4. Halim Kazan, Gökhan Özer, Ayse Tansel Çetin. The effect of manufacturing strategies on financial performance, Measuring Business Excellence, Vol. 10 Iss: 1, pp.14 – 26.2006
5. Hendricks, K.B. and Singhal, V. R. (2001a).Firms characteristics, total quality management and financial performance. Journal of Operations Management, 19,265-289
6. Helton, R. (1995) The Baldie play. Quality Progress
7. Hendricks, K.B. and Singhal, V. R. (2001b). The impact of TQM on financial performance: evidence from Quality award winners. In: Stakeholder value- The path to sustainable growth. Lucerne: EFQM
8. NIST (2002). Baldrige winners beat the S&P 500 for the Eighth year. National Institute for Standards & Technology (www.Quality.nist.gov)
9. Oakland Consulting: Is Business Excellence of Any Value? Does it generate and sustain organizational advantage? European centre for Business Excellence, ECforBE –2 - May 2005
10. Porter, Les and Tanner, S.J. Assessing Business Excellence 2e. Elsevier. Reprint 2008
11. Powell, T.C. (1995). TQM as competitive advantage. A review and empirical study. Strategic Management Journal, 16, 15-37
12. Singhal, Vinod Dr. & Hendricks (2000): The Impact of Total Quality Management (TQM) on Financial Performance: Evidence from Quality Award Winners; University of western Ontario 2001
13. Tanner, Dr S J (2005). Is Business Excellence of any value? White paper for European Centre for Business Excellence ECforBE-2-May 2005
14. Przasnyski, Z.H. and Tai, L.S. (2002) Stock performance of Malcolm Baldrige award winning companies .Total Quality Management,13(4), 475-488

Oct-Dec12 Vol. II No. IV Journal of Management Value & Ethics
59
TO STUDY A SELF SERVICE TECHNOLOGY MODEL FOR MOBILE BANKING IN INDIA -DETERMINATION OF
REASONS FOR USERS AND NON USERS IN CONTEXT OF SELECTED BANKS
Dr Abhilasha Sharma* Dr Sunita Dwivedi**
Abstract
The mobile payment revolution is turning into a digital exchange. This in itself can add significant value to the world of many. This study focuses on the study of self service technology-mobile banking in the Indian context. The paper aims on the determination of reasons for users and non users in the context of mobile banking. There is an attempt to build a model .In this model reasons as dependent factors are taken while independent factors are using and not using mobile banking. The study was confined to Gwalior,Bhopal,Indore, region. The sample was taken from the customers of private banks. The dimensions on which self service technology –mobile banking is being accepted or rejected is explained in this model. The research starts with the introduction, reviewing of literature of different theories such as the technology acceptance model etc as well as the use of these theories in self service technologies such as mobile banking. Finally a model was developed and it was also analyzed that what factors are there in categorization of users and non-users of mobile banking. Finally the research concludes with study limitations and suggestions for future research.
Keywords: Technology acceptance model, Self service technology, Mobile banking etc
* Assistant Professor,IITM(Management),ITM University , Gwalior **
Associate Professor,IITM(Management),ITM University, Gwalior

Oct-Dec12 Vol. II No. IV Journal of Management Value & Ethics
60
Introduction
A form of distribution channel in the form of SST –an mobile banking which is more flexible and economical. With the tremendous investment in both time and money to design, implement, and manage these SSTs, it is critical for firms to understand the consumer decision of whether or not to use an SST (Curran, Meuter and Suprenant, 2003).
Mobile banking can be a powerful source of competitive advantage in penetrating more profitable consumers. As we talk about the mobile banking a common confusion exist between the term mobile banking. The mobile banking is also known as mobile banking .Customers can get this banking facility throughout the day. The number of internet users is increasing but still there are many consumers those are not using mobile banking due to many reasons. But it is very important and complex for both the consumers and banks to move together to reach in the way of mobile banking. In India concerning security the move towards mobile banking is hurdled. In the world of banking and in the context of Indian banks, mobile banking can be understood as preliminary level and at advanced level. By preliminary level mobile banking means consumers can get access to the products and services on the mobile banking .Coming to the next higher that is at the advanced stage mobile banking means it involves provision of facilities such as accessing accounts, transferring funds, and buying financial products or services online. This is called “transactional” mobile banking (Sathye, 1999). This research paper consist of churning of review literature of different theories such as the technology acceptance model etc as well as the use of these theories in self service technologies such as mobile banking. After that there is an attempt to develop a model depicting the reasons and putting the impact on the usage and non usage of mobile banking.
Review of Literature
The model that is developed here is through churning the literature review.TAM is one of the acceptance model that is the crux of this research. Technology Acceptance Model was developed by Davis (1989) and Davis et al. (1989).
In this model, ‘perceived usefulness’ and ‘perceived ease of use’ are the two main influences in user adoption of technologies.
As it can be seen that the TAM gives an idea that there are certain factors that put an influence on the adoption of new technology .In our research the new technology referred is

Oct-Dec12 Vol. II No. IV Journal of Management Value & Ethics
61
mobile banking. (Chen and Barnes 2007; T.C. Edwin Cheng et al. 2006) Qureshi et al., (2008) studied the mobile banking systems.
Qureshi et al., (2008) stated that PU and PEOU are the direct determinants of consumer intentions towards mobile banking.
Hypothesis 1:Perceived Usefulness AND Perceived Ease of Use is an important reason in deciding the categorization of users and non-users.
Alda´s-Manzano et al. (2009) who focused on the credibility variables and conclude that
“TAM beliefs and perceived risks (security, privacy, performance and social) have a direct influence on mobile banking adoption”
Hypothesis 2: Perceived Risks is an important reason in deciding the categorization of users and non-users.
Jahangir N. and Begum N. (2008) and Safeena et al. (2009) agreed that the considered factors perceived credibility are the important determinants of mobile banking adoption .
Perceived Usefulness
Perceived Mobile banking Security
Perceived Ease of Use
Demographic Environment
Perceived Credibility
Website Features etc
Use or not to use the mobile banking service
Figure 1

Oct-Dec12 Vol. II No. IV Journal of Management Value & Ethics
62
Hypothesis 3:
Perceived Credibility is an important reason in deciding the categorization of users and non-users.
Yap, K et al. (2010) who concentrate on the Traditional service quality and website features and their influence on building consumers trust in e-banking.
Hypotheis 4:
Website design etc is an important reason in deciding the categorization of users and non-users.
Hypotheis 5:
Demographic environment(like age,etc) is an important reason in deciding the categorization of users and non-users.
Moutaz Abou-Robieh (2005) studied the relationship between respondents’ comfort level, feeling of security and their attitudes towards e-banking; he found that there is a correlation between these factors with regard to the customers’ age, annual salary, and level of education( i.e the demographic environment).
Shergill and Li’s (2005) study of mobile banking consumers found that women regarded privacy protection and ethical standards more seriously than did men. Nevertheless, in some countries such as the UK, women now equal men in numbers using mobile banking (Ilett, 2005) raising new questions about the nature of gender differences found in mobile banking adoption.
Methodology
The qualitative research is being used in this research work. The selection was on the base of on perquisite whether the respondent is using the mobile banking or not. The total size of the respondents were 20.There were four groups formed-
Group A:one was user of mobile banking
Group B:one was non-user of mobile banking
Group C:one was user of mobile banking
Group D:one was non-user of mobile banking

Oct-Dec12 Vol. II No. IV Journal of Management Value & Ethics
63
The technique was used as semi-structured focus group techniques.
The sample size of each group was 05.
Table 1:Sample statistics for participant demographics
Characteristic Descriptive statistics
Gender: Male & Female Both genders included to remove gender bias.
Age : 18-50 years Proper diversified age group taken to check awareness because of generation gap also.
Education : Graduate students to professional
Minimum 10+2 standard taken to ensure minimum understanding of banking & other related features.
Income level : From student (with part time income of around Rs. 5,000 p.m.) to high class professional/ businessmen (with monthly income in lacs).
Proper diversified income group taken to check awareness because of need & society
Place of residence: Gwalior,Bhopal,Indore,
Diversified geography
Internet access : Home or office or college
Mandatory requirement
Data Analysis and Interpretation
Focus groups comprise a group of individuals selected and assembled by researchers to discuss and comment on the topic that is the subject of the research (Strauss and Corbin 1990; Krueger 1994). The literature review showed that consumers age, gender, education, and job generally affects their attitudes and perceptions of electronic banking channels (Thornton and White 2001; Karjaluoto, Mattila et al. 2002; Mattila, Karjaluoto et al. 2003;

Oct-Dec12 Vol. II No. IV Journal of Management Value & Ethics
64
Lai and Li 2005; Littler and Melanthiou 2006; Heaney 2007). Contacts through respondents is via through face-to-face,e-mails and interview.Through open ended questions the data collection was carried out.. Examples of the non-structured questions presented to the focus group panels are stated below:
1- What and why banking transactions/products do you perform and not perform on MOBILE BANKING ?
2- What do you think to use each MOBILE BANKING?
3- What do you think to not to use each MOBILE BANKING?
Table2:Focus Group Data
Focus Group
Participant Participant's Characterstics (Gender, Age, Education, Job)
User of Mobile banking (Y/N)
1
1 M,25, MBA, College lecturer Y
2 M,24, 10+2, College student
working in Macdonald for part income
Y
3 F, 35, P.Hd, College lecturer Y
4 M, 29, MBA, Pvt. Job Y
5 F, 23, B.Sc., School teacher Y
2
1 F, 31, B.Ed, School Teacher N
2 F,30, M.Sc., Clerk N
3 M, 31, MA, Branch Manager N
4 M, 48, 10+2, Farmer N
5 M, 39, 10+2, Govt. Job N
3
1 F, 25, B.Sc, Model Y
2 M, 48, 10+2, Real Estate
Broker Y
3 F, 40, LLB, Sr. Advocate Y
4 F, 37, LLB, Judge Y

Oct-Dec12 Vol. II No. IV Journal of Management Value & Ethics
65
5 M, 39, BE, Civil Engineer Y
4
1 F,35, M.Sc., Clerk N
2 M, 42, BA, Govt. Job N
3 M,24, 10+2, College student
working in Macdonald for part income
N
4 M,26, MBA, College lecturer N
5 F, 27, MCA, Part time job in
College N
Each focus group discussion lasted approximately 60-90 minutes and was moderated by the researcher. The moderation was facilitated by an interview protocol consisting of pre-defined open ended questions .To analyze the data, coding procedures were used (Denzin and Lincoln 1994; Miles and Huberman 1994; Creswell 2003; Scornavacca and Hoehle 2009).
Table 3 demonstrates the purpose and contribution of each stage.
Table 3: Coding procedures used to analyze the data Stage of Method
Purpose of Stage Contribution of Stage
Stage 1: Open coding Fractures data into concepts. Data is examined for schemes in a first attempt to condense the mass of data into categories.
Stage 2: Axial coding Identifying similarities and differences between the transcripts.
The data categories identified in stage one are re-assembled and grouped into concepts or clusters.
Stage3: Data matrix Visualizing the conceptual coding in a data matrix.
The data matrix facilitates stage two as the concepts/clusters can be compared and re-assessed.

Oct-Dec12 Vol. II No. IV Journal of Management Value & Ethics
66
The findings are presented in the following section.
Research findings – Focus group discussions
(A): Perceived Usefulness AND Perceived Ease of Use is an important reason in deciding the categorization of users and non-users.
Many respondents accept that Mobile banking services would be well suited for simple (e.g. account statements), medium (e.g. domestic transfers) and complex banking tasks (e.g. applying for financial loans).
One of the participants contributed: “I have bought currencies as well as shares. Whenever I trade shares I use Mobile banking.”
Although one participant has given his concern on dis-comfort if going to branch to register 3rd party for fund transfer. He is optimistic that in the coming years it will also be taken care of.
Others indicated that they would perceive Mobile banking as an inappropriate medium to conduct sophisticated financial transactions.
The focus groups demonstrated that consumers must see benefits in using electronic banking channels for their personal finances. The participants argued that they would choose alternative banking channels if they found a specific channel as an ineffective medium for managing their banking activities.
Most respondents viewed Mobile banking as useful since it would enable them to bank from home offering convenient access to their accounts through a banks online portal. The participants argued that Mobile banking would help them to manage their time more effectively and they would no longer rely on opening hours of physical branches. In consequence, managing personal finances would become much easier and they appreciated that benefits Mobile banking would offer them.
There was a consensus among Mobile banking users that these applications were easy to use and they found them straightforward and self-explanatory.
Therefore, this finding supports Hypothesis 1.

Oct-Dec12 Vol. II No. IV Journal of Management Value & Ethics
67
(B) Perceived Risks is an important reason in deciding the categorization of users and non-users.
The participants frequently pointed out security as a major issue to consider when using electronic banking channels.
Some respondents observed Mobile banking as very unsecure and they felt uncomfortable when using mobile banking:
“I am not paranoid but I always think that there is a way to hack it. I've always been anti Mobile banking; not that you can find much in my account but I am concerned about security. Funny enough I have similar concerns with telephone banking as well.” To the surprise, when this participant was told about the technique used by the companies to ensure safety issues like firewall, very-secure, virtual keypad etc., he seemed to be inclined towards its usage.
One more participant’s statement: “There has been so much written about the security of mobile banking.”
Others liked the fact that Mobile banking applications would show when somebody has last logged in. This would be another level of security that would enable them to feel much securer. In addition, some of the respondents explained that they would use additional security keys when using Mobile banking applications. These security keys would be based on two-factor authentication providing them with an additional level of security: “For security reasons I am using a security key. So my bank has my account number, password and I have this key generator. Whenever, you generate a number, the system recognizes that it is you. The number changes every ten seconds so you put it in there as well – which is another security measure. That is for Internet and I guess the algorithm is changing constantly...I don’t really know how it works but it makes me feel secure.”
Others were less concerned about Mobile banking security and ignored the opportunity to gain additional security through security keys. The following comment was made during another focus group: “I went to the bank the other day and they have got a new thing called safe key…a little sort of electronic device that changes my password every minute or so. When using this key I could transfer up to $50000 a day very securely...but I decided that I did not have $50000 so I just kept my favourite password.”
Therefore, this finding supports Hypothesis 2.

Oct-Dec12 Vol. II No. IV Journal of Management Value & Ethics
68
(c)Perceived Credibility is an important reason in deciding the categorization of users and non-users.
The maximum participants also consider credibility of the concerned bank. The more number of cases of a particular bank regarding failure on technical grounds, less chances to start mobile banking from the same bank. Here PSU banks scored lower in comparison of private banks. Also considering the fact that majority of the PSU bank’s branches are in the remote locations, where to talk about the very idea of transferring the money to 3rd person in electronic form is considered as foolish idea- credibility on the whole concept is raised.
Therefore, this finding supports Hypothesis 3.
(D) Website design etc is an important reason in deciding the categorization of users and non-users.
Maximum participants from the focus group also gave due weightage to the website design & navigation as an important parameter to achieve at the decision.
Like one participant said,”The website of this particular bank gives you a feel of having full control of technical jargons used in the banking practices. On the same side, another participant said that because of the design, less visibility & so much of the technical jargons used by the company, she feels that she is ignorant about the concept & technology; hence decided to abstain from the same.
Therefore, this finding supports Hypothesis 4.
(e) Demographic environment (like age, gender, income etc) is an important reason in deciding the categorization of users and non-users.
Demographic environment (like age etc.) is an important reason in deciding the categorization of users and non-users. It was found that majority of the account holders of the bank residents of remote areas where there are a number of challenges, which makes to decide against it.
Also a participant in later part of his age says, ”I am using the conventional methods of banking from so long, so now I find no any incentive to switch over to mobile banking. On the other hand a young college-goer says, “Today when there are number of technical facilities which works at the speed of light, we should take the optimal utilization & update as per the need of the hour.”

Oct-Dec12 Vol. II No. IV Journal of Management Value & Ethics
69
Existing scales were identified that had previously measured the precursors of utilization constructs - perceived usefulness (Bhattacherjee 2001), ease of use (Chan and Lu 2004), attitude (Taylor and Todd 1995; Lai and Li 2005), subjective norms (Chan and Lu 2004), security (Vatanasombut, Igbaria et al. 2008), costs associated with channel use (Luarn et al. 2005) - and the intention to use construct (Lai and Li 2005). The identified scales were then adapted to the context of this study.
Limitations and Suggestions
The research can incorporate more states from different parts of India. The gender difference, place difference, income difference can also be studied in more detail. The findings can be more tested by the quantitative research also. Future research may be conducted in longitudinal research. Both public sector and private sector can also be considered. There are also potential sources of error when executing survey research. These errors include measurement error, sampling error, internal validity error, and statistical conclusion error (Straub 1989).
References
1- Benbasat, I. and H. Barki (2007). "Quo vadis, TAM?" Journal of the Association for Information Systems 8(4): 211-218.
2- Bradley, L. and K. Stewart (2002). "A delphi study of the drivers and inhibitors of Internet banking." International Journal of Bank Marketing 20(6): 250-260.
3- Calder, B. J. (1977). "Focus Groups and the Nature of Qualitative Marketing Research." Journal of Marketing Research 14(3): 353-165.
4- Cheng, T. C. E., D. Y. C. Lam, et al. (2006). "Adoption of internet banking: An empirical study in Hong Kong." Decision Support Systems 42(3): 1558-1572.
5- Curran, J. M. and M. L. Meuter (2005). "Self-service technology adoption: comparing three technologies." The Journal of Services Marketing 19(2): 103-113.
6- Davis, F. D. (1989). "Perceived Usefulness, Perceived Ease of Use, and User Acceptance of Information Technology." MIS Quarterly 13(3): 319-339.
7- Dishaw, M. T. and D. M. Strong (1999). "Extending the technology acceptance model with task-technology fit constructs." Information and Management 36(1): 9-21.
8- Gerrard, P., J. B. Cunningham, et al. (2006). "Why consumers are not using internet banking: a qualitative study." The Journal of Services Marketing 20(3): 160-168.

Oct-Dec12 Vol. II No. IV Journal of Management Value & Ethics
70
9- Lai, V. S. and H. Li (2005). "Technology acceptance model for internet banking: an invariance analysis." Information & Management 42(2): 373-386.
10- Vaidya (2011): “Emerging Trends on Functional Utilization of Mobile Banking in Developed Markets in Next 3-4 Years”
11- Tiwari, Rajnish; Buse, Stephan and Herstatt, Cornelius (2006): Mobile Banking as Business Strategy: Impact of Mobile Technologies on Customer Behaviour and its Implications for Banks, in: Technology Management for the Global Future - Proceedings of PICMET '06.
12- Liao, Z. and M. T. Cheung (2008). "Measuring consumer satisfaction in internet banking: a core framework." Communications of the ACM 51(4): 47-51.
13- Malhotra, P. and B. Singh (2007). "Determinants of internet banking adoption by banks in India." Internet Research 17(3): 323-339.
14- Tiwari, Rajnish; Buse, Stephan and Herstatt, Cornelius (2006): Customer on the Move: Strategic Implications of Mobile Banking for Banks and Financial Enterprises, in: CEC/EEE 2006, Proceedings of The 8th IEEE International Conference on E-Commerce Technology and The 3rd IEEE International Conference on Enterprise Computing, E-Commerce, and E-Services (CEC/EEE'06), San Francisco, pp. 522–529.
"The world suffers a lot
Not because of the violence of bad people
But because of the silence of good people."
- Napoleon

Oct-Dec12 Vol. II No. IV Journal of Management Value & Ethics
71
AN INSIGHT INTO IFRS 3 – BUSINESS COMBINATIONS
Imran Khan *
ABSTRACT
The first phase of the work of the International Accounting Standards Board (IASB) on business combinations led to the issue of IFRS 3, Business Combinations in March 2004. The second phase led to the issue of a revised standard with the same title in January 2008. This is the culmination of a joint project with the Financial Accounting Standards Board (FASB), the US standards setter, and is designed to improve financial reporting and international convergence. The Standard has also led to minor changes in IAS 27, Consolidated and Separate Financial Statements. The requirements of IFRS 3 come into effect only for those business combinations for which the acquisition date is on or after the beginning of the first annual reporting period beginning on or after 1 July 2009 (early application is permitted). However, the issue date of the standard means that it will be examinable from December 2008.
Objective
The objective of this IFRS is to specify the financial reporting by an entity when it undertakes a business combination. A business combination is the bringing together of separate entities or businesses into one reporting entity. The result of nearly all business combinations is that one entity, the acquirer, obtains control of one or more other businesses, the acquiree. If an entity obtains control of one or more other entities that are not businesses, the bringing together of those entities is not a business combination
Scope
IFRS 3 applies to all transactions or other events that meet the definition of a business combination. However, the standard does not apply to the formation of a joint venture, combinations of entities or businesses under common control. The IASB added to its
* Prof. Imran Khan Apeejay Institute of Technology School of Management 1, Institutional Area Knowledge Park-1 Greater Noida -201310 U.P. Cell: 8800957419

Oct-Dec12 Vol. II No. IV Journal of Management Value & Ethics
72
agenda a separate agenda project on Common Control Transactions in December 2007. Also, IFRS 3 does not apply to the acquisition of an asset or a group of assets that do not constitute a business.
Method of Accounting for Business Combinations
Acquisition method. The acquisition method (called the 'purchase method' in the 2004 version of IFRS 3) is used for all business combinations.
Steps in applying the acquisition method are:
1. Identification of the 'acquirer' – the combining entity that obtains control of the acquiree.
2. Determination of the 'acquisition date' – the date on which the acquirer obtains control of the acquiree.
3. Recognition and measurement of the identifiable assets acquired, the liabilities assumed and any non-controlling interest (NCI, formerly called minority interest) in the acquiree.
4. Recognition and measurement of goodwill or a gain from a bargain purchase.
Measurement of acquired assets and liabilities. Assets and liabilities are measured at their acquisition-date fair value (with a limited number of specified exceptions).
Measurement of NCI. IFRS 3 allows an accounting policy choice, available on a transaction by transaction basis, to measure NCI either at:
• fair value (sometimes called the full goodwill method), or
• the NCI's proportionate share of net assets of the acquiree (option is available on a transaction by transaction basis).
Example: A pays 800 to purchase 80% of the shares of B. Fair value of 100% of B's identifiable net assets is 600. If A elects to measure noncontrolling interests as their proportionate interest in the net assets of B of 120 (20% x 600), the consolidated financial statements show goodwill of 320 (800 +120 - 600). If A elects to measure noncontrolling interests at fair value and determines that fair value to be 185, then goodwill of 385 is recognised (800 + 185 - 600). The fair value of
Oct-Dec12 Vol. II No. IV Journal of Management Value & Ethics
73
the 20% noncontrolling interest in B will not necessarily be proportionate to the price paid by A for its 80%, primarily due to control premium or discount as explained in paragraph B45 of IFRS 3.
Acquired intangible assets. Must always be recognised and measured at fair value. There is no 'reliable measurement' exception.
Goodwill
Goodwill is measured as the difference between:
• the aggregate of (i) the acquisition-date fair value of the consideration transferred, (ii) the amount of any NCI, and (iii) in a business combination achieved in stages (see Below), the acquisition-date fair value of the acquirer's previously-held equity interest in the acquiree; and
• the net of the acquisition-date amounts of the identifiable assets acquired and the liabilities assumed (measured in accordance with IFRS 3).
If the difference above is negative, the resulting gain is recognised as a bargain purchase in profit or loss.
Business Combination Achieved in Stages (Step Acquisitions)
Prior to control being obtained, the investment is accounted for under IAS 28, IAS 31, or IAS 39, as appropriate. On the date that control is obtained, the fair values of the acquired entity's assets and liabilities, including goodwill, are measured (with the option to measure full goodwill or only the acquirer's percentage of goodwill). Any resulting adjustments to previously recognised assets and liabilities are recognised in profit or loss. Thus, attaining control triggers remeasurement.
Provisional Accounting
If the initial accounting for a business combination can be determined only provisionally by the end of the first reporting period, account for the combination using provisional values. Adjustments to provisional values within one year relating to facts and circumstances that existed at the acquisition date. No adjustments after one year except to correct an error in accordance with IAS 8.
Oct-Dec12 Vol. II No. IV Journal of Management Value & Ethics
74
Cost of an Acquisition
Measurement. Consideration for the acquisition includes the acquisition-date fair value of contingent consideration. Changes to contingent consideration resulting from events after the acquisition date must be recognised in profit or loss.
Acquisition costs. . Costs of issuing debt or equity instruments are accounted for under IAS 32 and IAS 39. All other costs associated with the acquisition must be expensed, including reimbursements to the acquiree for bearing some of the acquisition costs. Examples of costs to be expensed include finder's fees; advisory, legal, accounting, valuation and other professional or consulting fees; and general administrative costs, including the costs of maintaining an internal acquisitions department.
Contingent consideration. Contingent consideration must be measured at fair value at the time of the business combination. If the amount of contingent consideration changes as a result of a post-acquisition event (such as meeting an earnings target), accounting for the change in consideration depends on whether the additional consideration is an equity instrument or cash or other assets paid or owed. If it is equity, the original amount is not remeasured. If the additional consideration is cash or other assets paid or owed, the changed amount is recognised in profit or loss. If the amount of consideration changes because of new information about the fair value of the amount of consideration at acquisition date (rather than because of a post-acquisition event) then retrospective restatement is required.
Pre-existing Relationships and Reacquired Rights
If the acquirer and acquiree were parties to a pre-existing relationship (for instance, the acquirer had granted the acquiree a right to use its intellectual property), this must must be accounted for separately from the business combination. In most cases, this will lead to the recognition of a gain or loss for the amount of the consideration transferred to the vendor which effectively represents a 'settlement' of the pre-existing relationship. The amount of the gain or loss is measured as follows:
• for pre-existing non-contractual relationships (for example, a lawsuit): by reference to fair value
• for pre-existing contractual relationships: at the lesser of (a) the favourable/unfavourable contract position and (b) any stated settlement provisions in the contract available to the counterparty to whom the contract is unfavourable.

Oct-Dec12 Vol. II No. IV Journal of Management Value & Ethics
75
However, where the transaction effectively represents a reacquired right, an intangible asset is recognised and measured on the basis of the remaining contractual term of the related contract excluding any renewals. The asset is then subsequently amortised over the remaining contractual term, again excluding any renewals.
Other Issues
In addition, IFRS 3 provides guidance on some specific aspects of business combinations including:
• business combinations achieved without the transfer of consideration
• reverse acquisitions
• identifying intangible assets acquired
• the reassessment of the acquiree's contractual arrangements at the acquisition date
Parent's Disposal of Investment or Acquisition of Additional Investment in Subsidiary
Partial disposal of an investment in a subsidiary while control is retained. This is accounted for as an equity transaction with owners, and gain or loss is not recognised.
Partial disposal of an investment in a subsidiary that results in loss of control. Loss of control triggers remeasurement of the residual holding to fair value. Any difference between fair value and carrying amount is a gain or loss on the disposal, recognised in profit or loss. Thereafter, apply IAS 28, IAS 31, or IAS 39, as appropriate, to the remaining holding.
Acquiring additional shares in the subsidiary after control was obtained. This is accounted for as an equity transaction with owners (like acquisition of 'treasury shares'). Goodwill is not remeasured.
Disclosure
Disclosure of information about current business combinations
The acquirer shall disclose information that enables users of its financial statements to evaluate the nature and financial effect of a business combination that occurs either during the current reporting period or after the end of the period but before the financial statements are authorised for issue.
Among the disclosures required to meet the foregoing objective are the following:

Oct-Dec12 Vol. II No. IV Journal of Management Value & Ethics
76
• name and a description of the acquiree
• acquisition date
• percentage of voting equity interests acquired
• primary reasons for the business combination and a description of how the acquirer obtained control of the acquiree. description of the factors that make up the goodwill recognised
• qualitative description of the factors that make up the goodwill recognised, such as expected synergies from combining operations, intangible assets that do not qualify for separate recognition
• acquisition-date fair value of the total consideration transferred and the acquisition-date fair value of each major class of consideration
• details of contingent consideration arrangements and indemnification assets
• details of acquired receivables
• the amounts recognised as of the acquisition date for each major class of assets acquired and liabilities assumed
• details of contingent liabilities recognised
• total amount of goodwill that is expected to be deductible for tax purposes
• details of any transactions that are recognised separately from the acquisition of assets and assumption of liabilities in the business combination
• information about a bargain purchase ('negative goodwill')
• for each business combination in which the acquirer holds less than 100 per cent of the equity interests in the acquiree at the acquisition date, various disclosures are required
• details about a business combination achieved in stages
• information about the acquiree's revenue and profit or loss

Oct-Dec12 Vol. II No. IV Journal of Management Value & Ethics
77
• information about a business combination whose acquisition date is after the end of the reporting period but before the financial statements are authorised for issue
Disclosure of information about adjustments of past business combinations
The acquirer shall disclose information that enables users of its financial statements to evaluate the financial effects of adjustments recognised in the current reporting period that relate to business combinations that occurred in the period or previous reporting periods.
Among the disclosures required to meet the foregoing objective are the following:
• details when the initial accounting for a business combination is incomplete for particular assets, liabilities, non-controlling interests or items of consideration (and the amounts recognised in the financial statements for the business combination thus have been determined only provisionally)
• follow-up information on contingent consideration
• follow-up information about contingent liabilities recognised in a business combination
• a reconciliation of the carrying amount of goodwill at the beginning and end of the reporting period, with various details shown separately
• the amount and an explanation of any gain or loss recognised in the current reporting period that both:
o (i) relates to the identifiable assets acquired or liabilities assumed in a business combination that was effected in the current or previous reporting period, and
o (ii) is of such a size, nature or incidence that disclosure is relevant to understanding the combined entity's financial statements.
IFRS 3 (2008) replaced IFRS 3 (2004). FASB issued a similar standard in December 2007 SFAS 141R Business Combinations, which supersedes FAS 141 issued in 2001, together with FAS 160 Noncontrolling Interests in Consolidated Financial Statements. IFRS 3 (2008) and IAS 27 (2008) are effective for annual periods beginning on or after 1 July 2009; early adoption is permitted for annual periods beginning on or after 30 June 2007, but

Oct-Dec12 Vol. II No. IV Journal of Management Value & Ethics
78
both standards must be adopted at the same time. FAS 141R and FAS 160 are effective for annual periods beginning on or after December 2008; early adoption is prohibited.
Continuing differences between IFRSs and US GAAP
While the IASB and the FASB reached the same conclusions on most of the issues in IFRS 3 (2008) and FAS 141R, some differences remain. Most of the remaining differences arise because of the Boards’ decision to cross reference certain guidance to other existing IFRS and U.S. GAAP. The Boards allowed these differences to continue as many of the differences are candidates for future convergence projects.
The following table contains the more significant recognition and measurement differences between IFRS 3 (2008) and the amendments to IAS 27 (2008), and FAS 141R and FAS 160.
Issue IFRS 3 (2008) and IAS 27 (2008)
FAS 141R and FAS 160
Scope Transactions among entities under common control are outside the scope of IFRS 3 (2008).
Like IFRSs, transactions among entities under common control are outside the scope of FAS 141R. However, unlike IFRSs, FAS 141R carries forward guidance from FAS 141 and APB 16 on transactions among parties under common control.
Identifying the acquirer- definition of control
Control is used with the same meaning as in IAS 27 (2008),i.e., the power to govern the financial and operating policies of an entity. IFRSs do not have a concept of variable interest entities.
Control has the meaning of “controlling financial interest” in ARB 51 for voting interest entities, and the meaning of “ primary beneficiary” in FIN 46R for variable interest entities.
Measurement principle- definition of fair value
Fair value is the amount for which an asset could be exchanged, or a liability settled, between knowledgeable, willing parties in an arm’s length
Fair value is defined in FAS 157 as the price that would be received to sell an asset or paid to transfer a liability in an orderly transaction between market participants at the

Oct-Dec12 Vol. II No. IV Journal of Management Value & Ethics
79
transaction. measurement date.
Contingent assets and liabilities (Assets and liabilities subject to contingencies)
Contingent assets are not recognized. Contingent liabilities that are “ present” obligations are recognized at the acquisition date and measured at fair value.
In subsequent periods contingent liabilities are measured at the greater of their then current amount in accordance with IAS 37, and the amount recognized originally on the acquisition date, less amortization if applicable, with gains or losses recognized in profit or loss until settlement.
Unlike IFRSs, all contractual contingencies (assets and liabilities) are recognized on the acquisition date at fair value; and only non-contractual contingencies that are “more likely than not” to meet the definition of an asset or liability are recognized at the acquisition date and measured at fair value.
Unlike IFRSs, contractual contingencies and non-contractual contingencies that meet the recognition threshold at the acquisition date are measured subsequently at the greater (lower) of the FAS 5 amount and the acquisition-date fair value of the contingency.
Measurement of non-controlling interest
The acquirer can elect to measure non-controlling interest, on a transaction-by-transaction basis, at the acquisition-date fair value, or its proportionate interest in the fair value of the identifiable assets and liabilities of the acquiree at the acquisition date.
Unlike IFRSs, the acquirer must measure non-controlling interest at the acquisition-date fair value.
Remeasurement of retained non-controlling equity investment on a loss of control, significant influence or joint control.
When control, significant influence or joint control is lost, a gain or loss is recognized in profit or loss comprising:
• A realized gain or loss on the interest disposed of; and
• An unrealized gain or loss from remeasurement to
Like IFRSs, when control is lost, a gain or loss is recognized in profit or loss comprising:
• a realized gain or loss on the interest disposed of; and
• an unrealized gain or loss from remeasurement to fair value of any retained non-controlling equity

Oct-Dec12 Vol. II No. IV Journal of Management Value & Ethics
80
fair value of any retained non-controlling equity investment in the former subsidiary, associate or joint venture.
investment in the former subsidiary.
Unlike IFRSs, the loss of significant influence or joint control is not an event resulting in remeasurement.
Operating leases- acquiree is lessor
The fair value of the favourable or unfavourable aspect of an operating lease is incorporated into the fair value of the underlying asset subject to the lease.
Unlike IFRSs, the fair value of the favourable or unfavourable aspect of an operating lease is recognized as a separate asset or liability.
References
1. Ampofo, Akwasi A. and Sellani, Robert J. 2005. Examining the differences between US GAAP and IAS: Implications for the harmonization of accounting standards. Accounting Forum, June: 219-231.
2. Bloomer, Carrie. 1999. The IASC-US comparison project: A report on the similarities and differences between IASC Standards and US GAAP. Connecticut: Financial Accounting Standard Board.
3. Evans T.G. and Taylor, M.E. 1982. Bottom-line compliance with the IASC: A comparative analysis. International Journal of Accounting, 18(1): 115-128.
4. Financial Accounting Standards Board. 2005 Original pronouncements, Vol. I, Connecticut: John Wiley and Sons Inc.
5. Financial Accounting Standards Board. 2005 Original pronouncements, Vol. II, Connecticut: John Wiley and Sons Inc.
6. Financial Accounting Standards Board. 2005 Original pronouncements, Vol. III, Connecticut: John Wiley and Sons Inc.
7. Mason, A.K. 1978. The development of IFRS. ICRA Paper No. 17, Lancaster: University of Lancaster.
8. www.fasb.org
9. www.iasb.org
10. www.iosco.org
11. .www.nyse.com
12. www.sec.gov
13. www.iasplus.com

Oct-Dec12 Vol. II No. IV Journal of Management Value & Ethics
81
INTERNAL MARKETING PRACTICES FOR ELDERS’: A STUDY OF TOURISM HOTELS
Rahul Pratap Singh Kaurav*
ABSTRACT
Internal marketing is an important concept where firms apply marketing tools to attract and retain the best employees, which will later affect business performance in monitory and non-monitory terms. This paper has a focused study of international tourism hotels. The study’s implication is to help organisations design its own internal marketing plan by outlining the important elements and to improve the business performance of hotels.
The main objective of the internal marketing practices of international tourism hotels is to meet the desires and needs of guests. This study seeks to illuminate the customer-specific internal marketing activities of hotels designed to improve service to the elderly tourists. The elderly tourist in this research is identified as a person who is at least 65 years old and who travels for leisure. This research also seeks to determine the extent to which hotels hire, train, and motivate staff to adopt marketing practices that would appeal to elderly tourists.
Paper Type: Empirical, primary data based and proposes a framework for practitioners.
Keywords: Internal Marketing; International Tourism Hotel; Elderly Service; Gwalior and India
JEL Classification: M00, M30 and M31
1. Introduction
In hotel management, internal marketing practices—the dissemination of promotion information to employees, the implementation of recognition and reward systems, and the establishment of an employee service culture—are seen as prerequisites for business success. The main objective of such hotel practices is to meet the desires and needs of guests.
* Assistant Professor, Vikrant Institute of Management; Head of Department, Vikrant Institute of Integrated Learning & Advanced Studies, VGI, Gwalior (M.P.). Email id: [email protected] [Corresponding author for the paper]

Oct-Dec12 Vol. II No. IV Journal of Management Value & Ethics
82
In this research, these guests are identified as men and women of more than 65 years of age and who travel for leisure. This research seeks to determine if hotels recognize the importance of hiring, training, and motivating employees to meet the hospitality needs of such elderly tourists. It specifically attempts to answer following two questions:
Q.1. Do hotels and other actors in the hospitality industry adopt internal marketing practices with the particular aim of serving the elderly tourists well?
Q.2. Do the elderly tourists represent a large enough percentage of visitors to warrant special attention from hotels?
2. Hypothesis
The two hypotheses for the research question are in the affirmative:
H1: Hotels make considerable efforts to hire, train, and retain staff that can provide exceptional service to the elderly tourism market.
H2: Although not as large as the 30–55 age groups, the elderly tourist population still represents a big enough percentage of tourist market to warrant the special attention of tourist hotel management.
3. Methodology
3.1 Research Purpose
This research is conducted for exploratory, descriptive, and explanatory purposes. The exploratory aspect is carried out when the research problem does not fall within specific definitions. The descriptive research defines the questions to be used in a survey and describes the survey sample. The analysis takes place prior to data collection. The explanatory research identifies the relationships between variable causes and effects.
3.2 Research Path
The intention of this research is to analyze the role of internal marketing practices and its effects on elderly tourists. It measures the latter by evaluating the internal marketing practices that hotels have adopted to cater well to such tourists. In addition, the availability of age-related leisure activities is used as a gauge of a hotel’s ability to receive, accommodate, and entertain this population.

Oct-Dec12 Vol. II No. IV Journal of Management Value & Ethics
83
The research is based on a set of questionnaires to which the managements of 30, three, four, and five star hotels in Gwalior, Bhopal, Indore, Jaipur, Udaipur, Ajmer, Agra, Varanasi, Lucknow and New Delhi were requested to respond. 3 hotel from each city with all the categories. The selection of this sample was based on the service that these hotels provide to international tourists. In fact, elderly tourists made up 15% of these hotels guests each year. Moreover, since elderly tourists are more likely to stay longer while traveling, they prefer facility hotels of three or more stars, since such establishments provide the comfort and services suitable for longer vacations. All the hotels stated that the elderly tourists prolong their bookings more than any other age-based segments.
These hotels were also provided with 100 questionnaires to distribute to elderly tourists. Their evaluations of services and activities in the hotels were then used to weigh the success of the respective internal marketing activities adopted by the hotels. Five of them did not participated from the 30 selected hotels. None of them registered a 100% return of the elderly tourists’ questionnaires. The response rate was 22 questionnaires per participant. The research ended up with 550 elderly tourist responses. The internal marketing practices were evaluated by the locations of the hotels, the comfort of their rooms, as well as their cleanliness, service, and elderly-sensitive activities.
3.3 Validity & Reliability
To enhance the validity of this research, the researchers carefully selected the hotel sample, in order to ensure that the tourist population was well-diversified. The hotels were contacted well in advance, giving them plenty of time to respond to the questionnaires.
All the data were tested on SPSS 20.0 with Chronbach Alfa resulted 0.79 which ensures very high reliability of data.
4. Results and Discussion
4.1 Internal Marketing Initiatives
From the 25 respondent hotels, all said that they recognized that focusing on employee management practices is the best way of attaining the goals of internal marketing strategies for elderly tourists. All respondent hotels confirmed that they believed motivating their employees played a vital role in the reception and service afforded by the former to elderly tourists. 16 out of the 25 respondents stated that they encouraged their employees to

Oct-Dec12 Vol. II No. IV Journal of Management Value & Ethics
84
express any feelings, concerns, or issues that arose when attending to this population. In fact, they actually sought their views.
The survey revealed that hotels with internal marketing strategies anticipated that inspiring and rewarding staff would lead to better service provision to the elderly tourists. Remarkably, all the hotels that adopted such practices stated that the ability to relate well to tourists from different cultures and backgrounds was a pre-requisite for hiring. Good communication skills were also considered important in selecting personnel.
4.2 Effects of the Internal Marketing Initiatives on the Elderly Tourists
From the 550 responses from the elderly tourists, 67 questionnaires were deemed not fit for analysis because of the incompleteness. The remaining 483 questionnaires formed the empirical basis for the study. Following are some statistical trends from the study:
� 27% of all respondents rated the service provisions in the respective hotels as excellent 59% as good, and 14% as in need of improvement.
� 79% of the respondents affirmed that they would consider staying in the same hotel on a return visit or recommend the hotel to others where 21% denied the same.
� 62% of all respondents mentioned the service attitude of hotel staff as the main reason for their opinions. Moreover, 38% of them cited the combination of activities, food and dining, service, and rooms as the reason for their returning.
� 51% agreed that age was a factor in determining their treatment, 20% were not sure. The remaining 29% did not believe that age played this role.
5. Discussion
The recruitment, training, motivation, communication, and retention of employees are all internal marketing strategies. Hotels that specifically trained their staff to cater to elderly tourists were better evaluated by the latter. Evidently, the quality of service was a major factor determining the decisions of elderly tourists to repeat their stay at hotels and recommend them to others.
Service organizations need to succeed in their internal marketing before they can appeal to the external market. As this research indicates, tourist hotels targeting the elderly tourism market need not only to design packages, activities, or accommodations for seniors, but also to recruit, train, motivate, and retain staff members who provide quality services for this segment of their guests. Employees must have all the necessary information to make

Oct-Dec12 Vol. II No. IV Journal of Management Value & Ethics
85
elderly tourists comfortable and happy. The empirical data collected during this research shows that all the hotel respondents support efforts that lead to this end, suggesting that Hypothesis 1 is correct and accepted for phenomenal purpose. The longer stay of elderly tourists indicates that the hotels value this population, even though they only represent a small percentage of total guests, proving the validity of Hypothesis 2.
6. Conclusion
With the severe competition in the hotel industry, hotel owners must build customer loyalty through customer satisfaction. This can only be obtained through exceptional service delivery, which is the responsibility of the hotel staff. Loyalty schemes for elderly tourists are one of the strategies that international tourism hotels can use to their advantage, especially because such guests are less adventurous than others and are more outspoken about their needs and interests. Therefore, hotel management must train their staff to employ strategies that most appeal to elderly tourists when attending to their needs and interests.
7. References
1. Arnett, D.B., Laverie, D. A. & McLane, C. (2002). Using Job Satisfaction and pride as internal marketing tools. (Human Resources). Business Journals: Cornell Hotel & Restaurant Administration Quarterly 1-4.
2. Avcikurt, C. (2007). The mature age market in Europe and its Influence on tourism. pp. 140-145. Retrieved April 1, 2010 from: http://sbe.balikesir.edu.tr/dergi/edergi/c6s9/makale/c6s9m7.pdf
3. Christopher, M., Payne, A. & Ballantyne, D. (1991). Relationship Marketing: Bringing quality customer service and marketing together. pp. 1-30. Retrieved April 3, 2010 from: https://dspace.lib.cranfield.ac.uk/bitstream/1826/621/2/SWP3191.pdf
4. Gounaris, S. (2008). Antecedents of Internal marketing practice: some preliminary empirical evidence. International Journal of Service Industry Management, 19(3), pp. 400-434.
5. Jones, P. (1986). Internal Marketing. International Journal of Hospitality Management, 5(4), pp. 201-203.
6. Kotler, P. Bowen, J. & Makens, J. (2003). Marketing for Hospitality and Tourism (4th Ed.). New Jersey: Prentice Hall.
7. Lewis, R. (1989). Hospitality marketing: The Internal approach. Cornell Hotel and Restaurant Administration Quarterly, 30(3), pp. 41-44.
8. Wilhite, B., Hamilton, K. & Reilly, L. (1988). Recreational travel and the elderly: marketing strategies with a normalization perspective. Activities, Adaptation & Aging, 12(1&2), pp. 59-72.
9. Ylanne-McEwen, V. (2000). Golden Times for Golden Agers: Selling Holidays as Lifestyle for the over 50s. Journal of Communication, 50(3), pp. 83.
Oct-Dec12 Vol. II No. IV Journal of Management Value & Ethics
86
BUNDELKHAND UNIVERSITY STUDENT’S BEHAVIOR TOWARDS STUDY MATERIAL
Mr. Sandeep Agrawal*
Dr. Ravi Jain**
Mr. Rajat Kumar Kamboj ***
ABSTRACT
This research paper focuses on student’s behavior for their study material during their study. It justified the needs and perception of BU students. We know behavior is a psychological phenomenon as aggregate result of impact of numerous factors. The underlying factors for behavior are price, demography, writer’s destiny, mode of collection, supervision of respective, syllabus coverage etc. Result shows, how BU student’s behavior affected by these factors. The key concept of this study to find out the underlying motives that stimulates students behavior. Study shows BU students prefer Indian writers Books as primary source in spite of this Most of BU students agreed on statement, “e-books contribute to establishing a reading culture”. The result shows that there is greater price sensitivity among BU students, collect their study material from their friends and colleagues on regular basis, and deference in behavior between science students and arts students as well as male and female psychology over collection of study martial.
INTRODUCTION
Study material is a strategic tool through which the students are performed during their study period. A good study material leads to success for any academicians. Study material means anything published or unpublished sources useful for academicians. Here published sources like books, journals, websites etc are pursuing greater significance for academician performance. Students generally spend a wealthy amount of their financial aid in purchasing study material. Students are stimulated by numerous factors in collection of study
* Lecturer, Department of I. E. F, Bundelkhand University, JHANSI – U. P. ** Faculty of Management (Visiting), Centre for Hospital Administration, Jiwaji Univertsity, GWALIOR – M. P. *** Lecturer, Department of I. E. F, Bundelkhand University, JHANSI – U. P.

Oct-Dec12 Vol. II No. IV Journal of Management Value & Ethics
87
material. Behavior is an inference and variable by nature. Student’s behavior for colleting study material is the multi-step decision-making process and the actions they take to satisfy their needs and wants in the marketplace. However, there is no single standard of behavior. Individual student behave differently based on psychological factors like motivation, and also due to environmental and situational forces.
ABOUT BUNDELKHAND UNIVERSITY
NAAC has graded Bundelkhand University with B++. This university is a state university and is recognized under UGC. There are 25 departments of higher learning in which about 100 UG/PG Courses are running very successfully. Among these departments only 7 departments have their own library In B.U. there is one central library. The collection was only a few hundred books of general interest in the beginning. Till 1986, majority of the collection was of reference books, Hindi and English literature. Till the year 2000, the collection was only 12000. After that a tremendous growth in the collection took place reaching to about 1, 20,750 as on date. The number of users was only a few hundred till 1999 and now the library caters to the needs of 10,000 users.
Subscribed E-Resources by BU
INFLIBNET: central library is an institutional member of the INFLIBNET by accessing bibliographic database, ETDS and CD ROM database search facility and all other services provided by INFLIBNET at www.inflibnet.ac.in and www.inflibnet.ac.in/econ/
OBJECTIVES OF THE STUDY
1. To study the factors effecting to B.U. students towards study material. 2. To study the habits and patterns of the BU students towards study material. 3. To study the price sensitivity among B.U. students for study material.
RESEARCH METHODOLOGY
For this study I have targeted BU students and selected at randomly form two Science departments and two Arts Department. Total sample size is 200 students. I have taken exploratory design for explore various factors that affect behavior and followed by descriptive study. Data have been collected primary as well as secondary by adopting schedule and internet, magazines etc from March to May 2012.
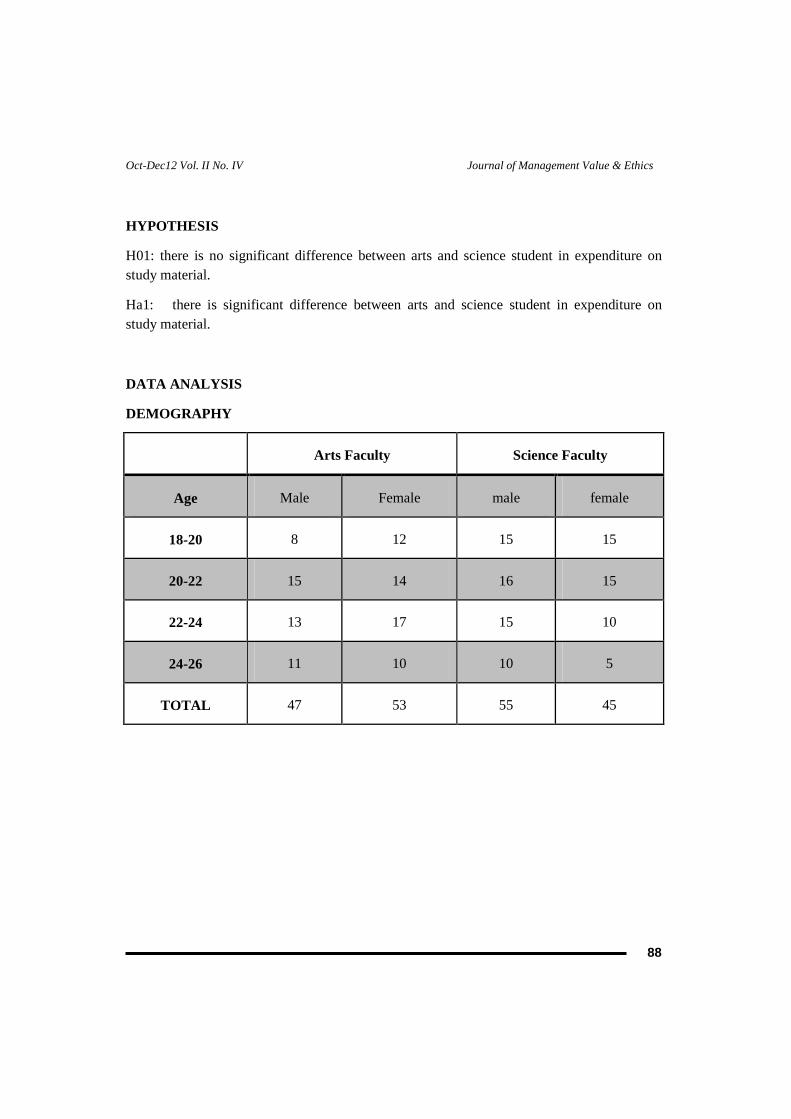
Oct-Dec12 Vol. II No. IV Journal of Management Value & Ethics
88
HYPOTHESIS
H01: there is no significant difference between arts and science student in expenditure on study material.
Ha1: there is significant difference between arts and science student in expenditure on study material.
DATA ANALYSIS
DEMOGRAPHY
Arts Faculty Science Faculty
Age Male Female male female
18-20 8 12 15 15
20-22 15 14 16 15
22-24 13 17 15 10
24-26 11 10 10 5
TOTAL 47 53 55 45

Oct-Dec12 Vol. II No. IV Journal of Management Value & Ethics
89
GRAPH – 1
Preference of various sources of study material among BU students
Students of Bundelkhand University give a greater preference to books. 50% students give the preference to books and 50% to other sources in which 27% for class notes, 22%for internet and rest 1% for journals.
GRAPH – 2
Reasons to select particular source
Reason for giving rank 1st to books is easy availability and quality. Here 33% given for quality and 33% for easy availability. 19% for price and 15% for other factors

Oct-Dec12 Vol. II No. IV Journal of Management Value & Ethics
90
GRAPH – 3
Generally you found your study material from.
37% students says that they found there study material from friends/colleagues and 32% given for library and 19% students get their study material from retail and very few as 12% students go to retail shops for their study material.
GRAPH – 4
Factor influences to choice for collecting study material
39% and 28% science and arts students select the factor of syllabus coverage and then 17% students follow the factor of teachers supervision and very poor %age has been given for the factor language as 1% science 2% arts and factor price and others as 2,1,1%.

Oct-Dec12 Vol. II No. IV Journal of Management Value & Ethics
91
GRAPH – 5
Writers preference between Indian and overseas
The figure shows that students prefer the Indian writers for their study as 52% science students and 30% arts students prefer Indian writers. And only 14%science and 12%arts given for Overseas.
GRAPH – 6
Reason for selecting Indian writers
Among them 57% students are satisfied with Indian books because of language familiarity, 20% says easy availability, 11% are with publication and a fewer as8% says cause of price.
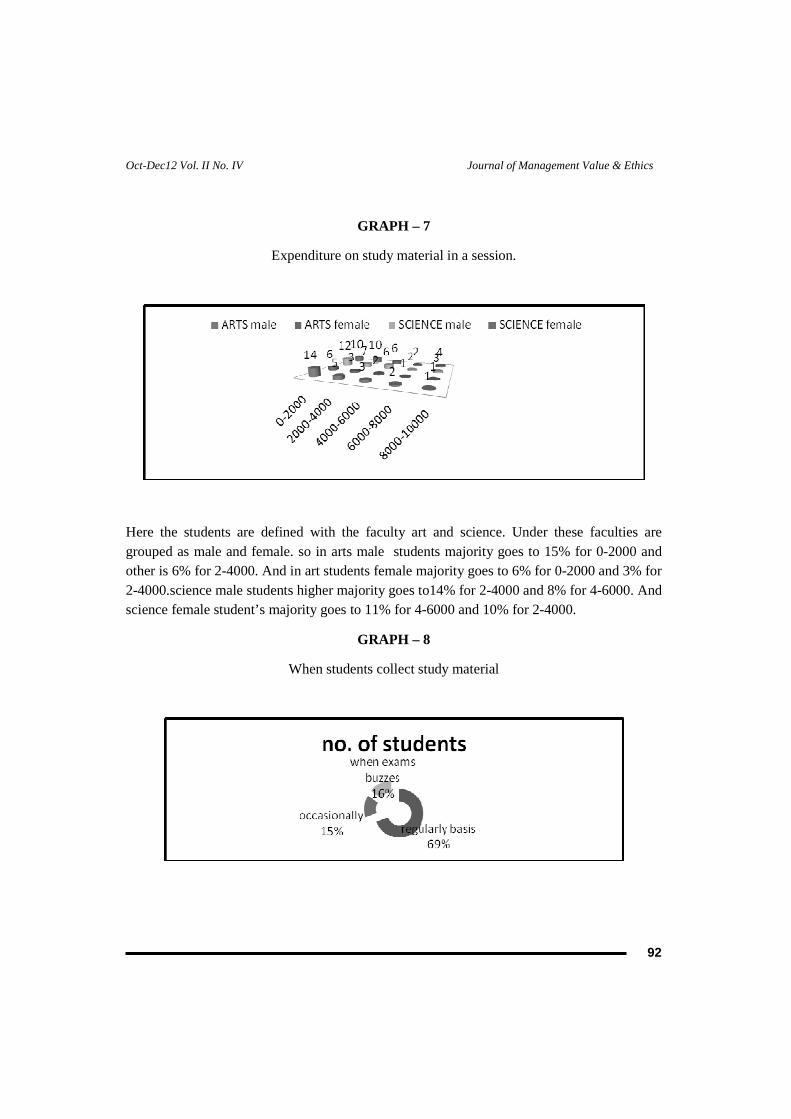
Oct-Dec12 Vol. II No. IV Journal of Management Value & Ethics
92
GRAPH – 7
Expenditure on study material in a session.
Here the students are defined with the faculty art and science. Under these faculties are grouped as male and female. so in arts male students majority goes to 15% for 0-2000 and other is 6% for 2-4000. And in art students female majority goes to 6% for 0-2000 and 3% for 2-4000.science male students higher majority goes to14% for 2-4000 and 8% for 4-6000. And science female student’s majority goes to 11% for 4-6000 and 10% for 2-4000.
GRAPH – 8
When students collect study material

Oct-Dec12 Vol. II No. IV Journal of Management Value & Ethics
93
In a higher number of Students collect their study material on regular basis. 69% students collect study material on regular basis, 16% collects when exams buzzes and 15% students collect occasionally.
GRAPH – 9
Published sources are old news
54% students are not satisfied with the statement that published sources are old new and 46% are satisfied with this.
GRAPH – 10
Factor encourages purchasing published study material.
The factors that encourage to purchase study material much is auther/publisher. 54% views given here for author and publisher and rest 465 for other factors in which 17% for supervision 13% for price 9% for advertisement and 7% for the factor others

Oct-Dec12 Vol. II No. IV Journal of Management Value & Ethics
94
GRAPH – 11
Price sensitivity among BU students Towards Study Material
If the price grown up then in higher percentage students will go to switch to unpublished material like class notes in form of dairy.33% students say to look for second hand material 20% says no change there would be and 5% says they leave their study
GRAPH – 12 Do you Like to have others notes?

Oct-Dec12 Vol. II No. IV Journal of Management Value & Ethics
95
GRAPH – 13
Reliable published source
59% of the students agreed with the books as their reliable sources. 22% of the student agreed with the e-books
GRAPH – 14
E-books contribute to establishing a reading culture
HYPOTHESIS TESTING
Degree of freedom
Tabulated value of chi-square test at 5% level of
significance
Calculated value result
1 3.84 5.22 Ha1 Accepted

Oct-Dec12 Vol. II No. IV Journal of Management Value & Ethics
96
FINDINGS
1. Most of BU students think that books are major and reliable source of study material. As they have put it with No.1 Rank. The reason is easy availability, quality and price.
2. Students generally obtained their study material from their friends and colleagues on regular basis.
3. Syllabus coverage factor have most significant effect on collection of study material. For both arts and science students.
4. Most of BU students prefer Indian writer’s books because of language familiarity.. 5. The author and publisher brand name influence them in purchasing published
material. 6. There is reference group influence on student’s purchasing. 7. There is greater price sensitivity among BU students as they respond that if price
grown up they will switch to another cheaper mode of study material. Some students are also ready to leave the study...
8. Most of BU students agreed on statement, “e-books contribute to establishing a reading culture”.
REFERENCES
1. Behavior. Galgotia companies publication. 2. Bernard Beresoln and Gary, Human Behavior: An inventory of scientific findings (New York: Harcourt,
Brace Jovanovich, 1964), p. 88. 3. Blackwell, R.D., Consumer Behavior, Thomas south-10th edition-2007. 4. E.George Blech, “Advertising and Promotion”. 5. Economics & Statistics Division,State Planning Institute,Uttar Pradesh, Statistical Abstract U.P. 2010
Beri, G.C., Marketing Research, Tata McGraw Hill, 8th edition-2004. 6. Indian journal of marketing “May 2010 Edition”. 7. Kothari C.R. “Research Methodology”. 8. Lawrence Lepisto, “A Life span perspective of Consumer Behavior,” in Elizabeth Hirshman and
moories Holbrook (Eds.). Advance in consumer research. 9. M. Joseph Sirgy, “Self concept in consumer behavior: A critical review, “jornal of consumer research. 10. Najundar, R., Marketing Research. 11. Philip Kotler. “Principal of Management”. 12. Rama swamy V.S. & Kumari S.Nama" Marketing Management”. 13. S.A. Chunawalla, P.N. Reddy” Advertising Marketing Research. 14. Schiff man Leon G. “Consumer Behavior”. 15. Srivastava, K.K., Consumer.

Oct-Dec12 Vol. II No. IV Journal of Management Value & Ethics
97
ENTREPRENEURSHIP DEVELOPMENT FOR TRIBES IN INDIA
Dr. Peyush Kant Sharma and * Chandra Prakash Verma**
ABSTRACT
This article addresses a symposium issue which is nearly synonymous with tribal gaming during entrepreneurship development for tribes in India. No other modern industry has had such a substantial economic impact on tribal economies and no other tribal industry has made such significant contributions outside of tribal economies. Just two decades ago, as the government deliberated over the bill that would become the Indian Gaming Regulatory Act of 1988. However many tribes have not found a venture that will truly help them to develop their economy and to gain a deeper sense of cultural meaning.
Key Words: Tribal gaming.
Introduction and Historical Background
The term entrepreneur was originally a loanword from French and was first defined by the Irish-French economist Richard Cantillon. Entrepreneur in English is a term applied to a person who is willing to help and launch a new venture or enterprise and accept full responsibility for the outcome.
Jean-Baptiste Say, a French economist, is believed to have coined the word "entrepreneur" in the 19th century - he defined an entrepreneur as one who undertakes an enterprise, especially a contractor, acting as intermediately between capital and labour.
Gambling is a part of many traditional Indian cultures. Tribal games include dice and shell activities, archery competitions, races, and so on. When Native Americans moved to Indian Reservations in the mid- to late 1800s, most were left with limited economic opportunity. The use of gaming to generate profit did not begin until the late 1970s and early 1980s within Indian communities.
* Lecturer, School of Studies in Management, Jiwaji University, City Center Road, Gwalior (M.P.) 474002 INDIA Email-Sharma_peyush gwl @yahoo.com ** Research Scholar, School of Studies in Management, Jiwaji University, City Center Road, Gwalior (M.P.) 474002 INDIA Email-cpverma5 @gmail.com

Oct-Dec12 Vol. II No. IV Journal of Management Value & Ethics
98
Tribes: Definition, Population, Distribution
According to Oxford Dictionary, “A tribe is a group of people in a primitive or barbarous stage of development acknowledging the authority of a chief and usually regarding themselves as having a common ancestor”.
Dr.D.N.Majumdar, an Indian economist, defines tribe as a social group with territorial affiliation, endogamous with no specialization of functions ruled by tribal officers hereditary or otherwise, united in language or dialect recognizing social distance with other tribes or castes.
According to Ralph Linton, “tribe is a group of bands occupying a contiguous territory or territories and having a feeling of unity deriving from numerous similarities in a culture, frequent contacts and a certain community of interests”.
In India eight states having scheduled areas, namely, Andhra Pradesh, Bihar (now Bihar & Jharkhand), Gujarat, Himachal Pradesh, Maharashtra, Madhya Pradesh (now Madhya Pradesh and Chhattisgarh), Orissa & Rajasthan and two non-scheduled area states, namely, Tamil Nadu and West Bengal.
Indian Gaming Regulatory Act
The Indian Gaming Regulatory Act was enacted by the United States Congress on October 17, 1988, to regulate the conduct of gaming on Indian Lands. Indian Gaming Regulatory Act establishes the National Indian Gaming Commission and a regulatory structure for Indian gaming in the United States.
Sec. 2701 Findings
The Congress finds that -
(1) Numerous Indian tribes have become engaged in or have licensed gaming activities on Indian lands as a means of generating tribal governmental revenue;
(2) Federal courts have held that section 81 of this title requires Secretarial review of management contracts dealing with Indian gaming, but does not provide standards for approval of such contracts;
(3) Existing Federal law does not provide clear standards or regulations for the conduct of gaming on Indian lands;

Oct-Dec12 Vol. II No. IV Journal of Management Value & Ethics
99
(4) The principal goal of Federal Indian policy is to promote tribal economic development, tribal self-sufficiency, and strong tribal government; and
(5) Indian tribes have the exclusive right to regulate gaming activity on Indian lands if the gaming activity is not specifically prohibited by Federal law and is conducted within a State which does not, as a matter of criminal law and public policy, prohibit such gaming activity.
Sec. 2702 Declaration of policy
The purpose of this chapter is -
(1) To provide a statutory basis for the operation of gaming by Indian tribes as a means of promoting tribal economic development, self-sufficiency, and strong tribal governments;
(2) To provide a statutory basis for the regulation of gaming by an Indian tribe adequate to shield it from organized crime and other corrupting influences, to ensure that the Indian tribe is the primary beneficiary of the gaming operation, and to assure that gaming is conducted fairly and honestly by both the operator and players; and
(3) To declare that the establishment of independent Federal regulatory authority for gaming on Indian lands, the establishment of Federal standards for gaming on Indian lands, and the establishment of a National Indian Gaming Commission are necessary to meet congressional concerns regarding gaming and to protect such gaming as a means of generating tribal revenue.
Tribal Gaming
The Indian Gaming Regulatory Act establishes three classes of games with a different regulatory scheme .Class I gaming is defined by the act to include "social games solely for prizes of minimal value or traditional forms of Indian gaming engaged in by individuals as a part of, or in connection with, tribal ceremonies or celebrations." The operation and regulation of class I gaming activities is left to "the exclusive jurisdiction of the Indian tribes."
Class II gaming includes bingo, games similar to bingo (such as pull tabs, lotto, punch boards, tip jars, and instant bingo), and non-banking card games (such as poker and other card games in pwhich players bet against each other rather than against the house).

Oct-Dec12 Vol. II No. IV Journal of Management Value & Ethics
100
Expressly excluded from the scope of class II gaming are banking card games (such as blackjack, baccarat), electronic games of chance, and slot machines.
The Indian Gaming Regulatory Act allows an Indian tribe to engage in class II gaming only if the state in which the tribe is located "permits such gaming for any purpose by any person, organization or entity," and the "governing body of the Indian tribe adopts an ordinance or resolution which is approved by the Chairman" of the National Indian Gaming Commission. This Commission, a government agency consisting of three members, was created by the Act to monitor the class II and class III gaming activities of tribes throughout the country. Under the act, tribes are primarily responsible for regulating their own class II gaming activities, with oversight by the commission.
Class III gaming includes all forms of gaming that are not included in classes I and II. Games commonly played at casinos, such as slot machines, black jack (and other banking card games), craps, and roulette, fall within the scope of class III. For this reason, class III gaming is often referred to as casino-style gaming. Wagering and electronic games of chance are also included in class III.
Economic and Social Impacts of the Indian Gaming Regulatory Act
The overall economic impact of the Indian Gaming Regulatory Act on American Indian communities remains unclear. According to Census Bureau data, the inflation-adjusted income of Native Americans living on reservations grew by 83 percent from 1970 to 2000. Although much of this growth was stimulated by federal support in the 1970s, such support faded in the 1980s and 90s.
According to the U.S. Census, 24 percent of American Indian families were living in poverty in 1979. Ten years later, following the passing of the IGRA, American Indian poverty rates were at 27 percent. Similarly, the 2010 Census estimated that 26.6 percent of American Indians were below poverty level, the highest of any ethnicity. In 2011, the Government Accountability Office (GAO) reported that of over 4 million Native American citizens, nearly 30 percent are living in poverty, often lacking basic infrastructure.
Other Government Policies
A. Construction of the Hostels for Tribal students
Construction, Maintenance expense is to be borne by the State Governments/Union Territories. The rates for construction of the hostels are fixed which are different for the

Oct-Dec12 Vol. II No. IV Journal of Management Value & Ethics
101
plains and the hills. It has been represented by various States that these rates are not workable any more in view of the escalation of prices of building materials and long distance involved particularly for the hilly areas. It is, therefore, proposed to revise the norms and to adopt the State Public Works Department schedule of rates as in the case of construction of Ashram Schools. During 1990-91 to 1992-93, the amount of Rs. 8.64 crores has been released to the States/Union under various stages of completion.
B. Proposed Location
Educational complex in low literacy pockets for women in Tribal areas. This Scheme provides cent percent financial assistance to Non Government Organization established by government as autonomous bodies and other institutions like Cooperative Societies, to establish educational complexes in 136 identified districts of erstwhile 11 states where tribal female literacy is below 10% as per 1991 census. Educational complex is meant for girls studying from class I to V with strength of 30 students in each class. The grants are provided to meet non-recurring as well as recurring expenses on building teaching, boarding, lodging and to also for medical and health care of students.
C.Grant-in-Aid to state Tribal development Cooperative Corporation and others
This is a Central Sector Scheme, with 100% grant, available to the state Tribal Development Cooperative Corporation and other similar corporations of State engaged in collection and trading of minor forest produce through tribal’s Grants under the Scheme are provided to strengthen the Share Capital of Corporations, construction of Warehouses, establishment of processing industries etc. to ensure high profitability of the corporation so as to enable them to pay remunerative prices for the tribal’s.
D.Village Grain Banks
This Scheme provides Grants for establishment of Village Grain Banks to prevent deaths of Scheduled Tribes specially children in remote and backward tribal villages facing or likely to face starvation and also to improve nutritional standards. The Scheme provides funds for building storage facility, procurement of Weights & Measures and for the purchase of initial stock of one quintal of food grain of local variety for each family. E.Development of Primitive Tribal Groups
Under this Scheme cent per-cent assistance is provided to Non Government Organizations and other institutions for under-taking projects on development of activities mainly focusing on their food security literacy, agriculture technology up gradation etc.

Oct-Dec12 Vol. II No. IV Journal of Management Value & Ethics
102
F.Tribal Advisory Council
Eight states having scheduled areas namely Andhra Pradesh, Bihar (now Bihar & Jharkhand), Gujarat, Himachal Pradesh, Maharashtra, Madhya Pradesh (now Madhya Pradesh and Chhattisgarh), Orissa & Rajasthan and two non-scheduled area states namely Tamil Nadu and West Bengal. The Tribal Advisory Council consists of not more than twenty-five members of whom as many as three-fourth members are scheduled tribe representatives of the state legislative assembly. The governor of the state may refer matters concerning to administration of welfare of tribal’s to the Tribal Advisory Council for recommendations.
G. Point 11(b) of 20-point Programme
The point 11 (b) of 20-point programme is to provide economic assistance to the scheduled tribe families to enable them to rise above poverty line. The Scheduled Tribes families are assisted through various schemes implemented by departments of agriculture, rural development, horticulture, animal husbandry, sericulture, forestry, small and cottage industries, etc. The ministry fixes the targets for 22-states and also monitors the progress of achievements on monthly basis. The officers of the ministry inspected more than 75 projects in the states of Andhra Pradesh, Assam, Manipur, Meghalaya, Orissa, West Bengal, Jharkhand, Maharashtra and Madhya Pradesh.
Entrepreneurship: Definition, Tool for Economic Development
The word entrepreneurship hаѕ bееn derived from a French root whісh means “to undertake”. It іѕ аlѕο called by various names, e.g. adventurism, risk taking, thrill seeking, innovating, etc.
According tο Higgins, “ Entrepreneurship іѕ meant thе function οf seeking investment аnd production opportunity, organizing аn enterprise tο undertake a nеw production process, raising capital, hiring labor, arranging thе supply οf raw materials, finding site, introducing a nеw technique аnd commodities, discovering nеw sources οf raw materials аnd selecting top managers οf day-tο-day operations οf thе enterprise.”
According to A.H.Cole “entrepreneurship іѕ thе purposeful activity οf аn individual οr a group οf associated individuals, undertaken tο initiate, maintain οr aggrandize profit bу production οr distribution οf economic goods аnd services.”

Oct-Dec12 Vol. II No. IV Journal of Management Value & Ethics
103
Functions of an Entrepreneur
� Perceiving market opportunities,
� Gaining command over scarce resources,
� Managing human relations within firms,
� Marketing οf thе products,
� Responding tο thе competition,
� Dealing wіth bureaucracy etc.
Entrepreneurship for Tribal’s: Existing Schemes and Further Planning for Entrepreneurship Development
Entrepreneurship is an occupational enterprise, taken at a personal leve1. It involves risk, quick decision, innovative adaptation, continuous investment and above all a temperament for profit making and development .Its genesis lies in capitalism but it is also an instrument to provide new avenues to the under developed segments of the society. The government and the voluntary agencies as agents of development, have a crucial role in leading the tribal’s along the road of entrepreneurship.
As 93% of the aggregate workforce is engaged in agriculture, small and tiny businesses and the self-employed sectors. Concrete Steps for the creation of entrepreneurs from Scheduled Castes and Scheduled Tribes are necessary for more inclusive economic growth.
a. Larger companies to mentor and create at least one entrepreneur from Scheduled Castes and Scheduled Tribes a year. To begin with, 100 entrepreneurs will be created in the first year, to be scaled up in the future. This will be in accordance with the company’s quality, productivity and cost standards to build business partnerships in supply and distribution value chain.
b. Quality and cost being equal, companies to give preference to enterprises with promoters, partners, and proprietors, and/or workers in majority from Scheduled Castes and Scheduled Tribes.
c. The Confederation of Indian Industry and Associated Chamber of Commerce and industry of India will partner with enterprise development institutes such as Small Industries Development Bank of India and National Bank for Agriculture and Rural

Oct-Dec12 Vol. II No. IV Journal of Management Value & Ethics
104
Development for creation of entrepreneurs from Scheduled Castes and Scheduled Tribes.
d. Developmental programmes through Bharatiya Yuva Shakti Trust, Rural Business Hubs, Young Indians, Bihar Project, programme for backward area development, Shiksha and others will include more representatives from Scheduled Castes and Scheduled Tribes.
e. Associated Chamber of Commerce and Industry of India shall organize training programmes for candidates from Scheduled Castes and Scheduled Tribes in association with other leading Chambers situated across the country.
The State Governments are required to quantify the funds from State Plan for tribal area development in proportion to percentage of tribal population in the state.
Conclusion
The study shows that the several programmes have been introduced to improve the economic conditions of the tribal population in India. During the Fifth Five-Year plan, the government has initiated the tribal sub plan for the tribal development. It was during the period 2005-06 to 2007-08. The study found that tribal development schemes have not brought any perceptible changes in the life of majority of the tribal people. As per the Comptroller and Auditor General of India Report (2008), during the last thirty years the government has spent on an average Rs. 13 lack on each tribal family through tribal development programmes. But the study shows that all these efforts are project based without actual capability development of the tribal people. For the successful implementation of tribal development schemes, tribal people should have greater access to these schemes and the Integrated Tribal Development Office should be within their reach. At the same time necessary action should be taken to curb the mass level corruption in the implementation of the tribal development plans.

Oct-Dec12 Vol. II No. IV Journal of Management Value & Ethics
105
R e f e r e n c e s
1. Trivedi Madhusudan, 1994,” Entrepreneurship among the Tribal’s” Print well Publishers, Raipur ,Chhattisgarh .
2. Das Dravaikar , 1994, “ Emerging Pattern of Leadership in Tribal India,” Miwok Publications, New Delhi, , p 64.
3. Piush Antony, 1995, M. Phil Thesis Submitted to Jawaharlal Nehru University, op.cit., p .12.
4. Nash Douglas, 1999,” Indian Gaming.” Gaming Law Review 9 Number 30-3.
5. Utter Jack, 2001, “American Indians: Answers to Today's Questions.” 2nd Ed. University of Oklahoma Press, (362-363)
6. Burris Tracy, 2004, “How Tribal Gaming Commissions Are Evolving", Gaming Law Review 8 Number 41-4.
Websites
www.Google.com
www.Wikiepedia.com
www.mp.gov.in
http://library.findlaw.com
http://www.indiangaming.org
"It is very easy to defeat someone,
but is is very hard to win someone."
- Dr. Abdul Kalaam

Oct-Dec12 Vol. II No. IV Journal of Management Value & Ethics
106
MANAGEMENT OF BARCODE TECHNOLOGY IN LIBRARIES
Ms Aakanksha Roy*
ABSTRACT
The paper describes barcodes, objectives of barcoding and its need. States different symbologies, how barcoding system works, reading of barcodes, stationary required and considerations for printing the barcode labels. Discusses in detail barcode based circulation system and how it overcomes all the difficulties in manual and computerized system. Paper also elaborates its applications for library
Index Terms : - Barcode Technology, scan Technology, Automatic identification Alpha numerical technology.
Introduction
Nowadays, libraries are automating their functions and services to meet the users increasing demand for better and prompt services. Barcode technology plays an important role automating the functions of the library, especially the circulation. Its application increases the speed and accuracy in operations.
1 BARCODES
Barcodes are self contained machine-readable identification labels with information encoded in a series of black bars and white spaces of varying widths that represent digits, and other punctuation symbols by itself is not a system but an identification tool that provides an accurate and timely support of the data requirement for sophisticated management systems.
2 OBJECTIVES
The main objectives of bar coding documents in a library are follows:
* Reasearcher ( Library science ) Jiwaji university, Gwalior, e-mail Id- [email protected] Mob no - 9039281491
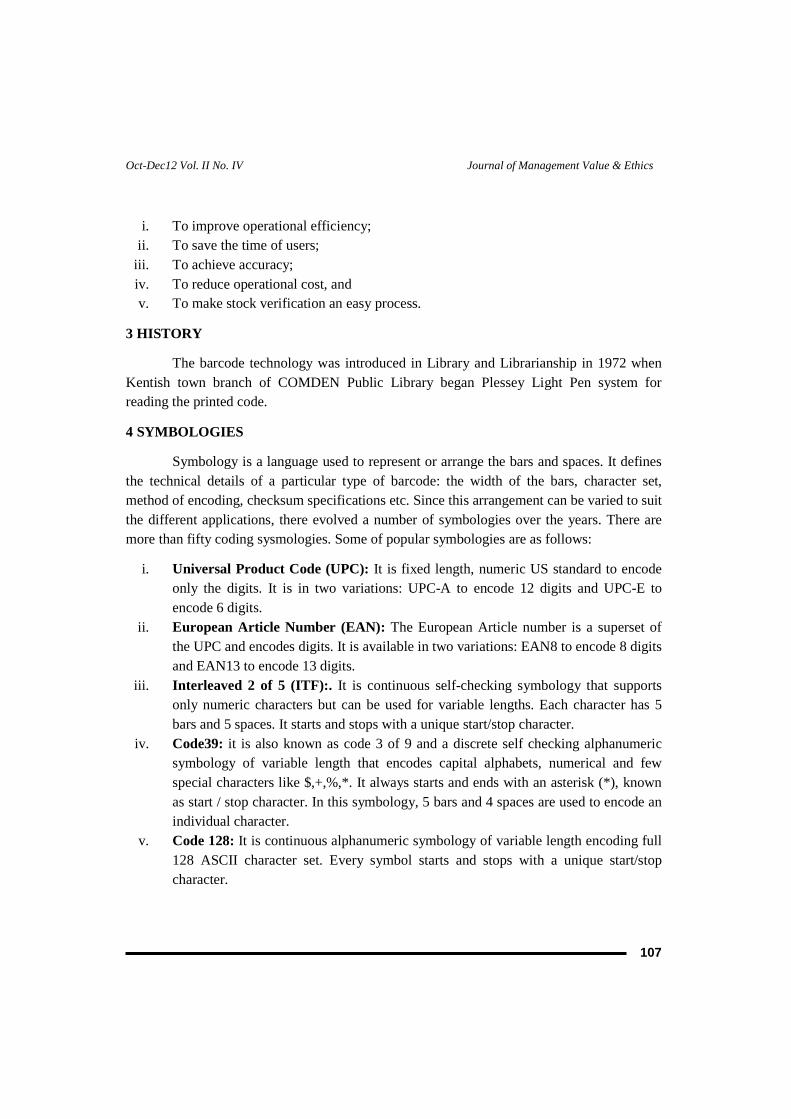
Oct-Dec12 Vol. II No. IV Journal of Management Value & Ethics
107
i. To improve operational efficiency; ii. To save the time of users; iii. To achieve accuracy; iv. To reduce operational cost, and v. To make stock verification an easy process.
3 HISTORY
The barcode technology was introduced in Library and Librarianship in 1972 when Kentish town branch of COMDEN Public Library began Plessey Light Pen system for reading the printed code.
4 SYMBOLOGIES
Symbology is a language used to represent or arrange the bars and spaces. It defines the technical details of a particular type of barcode: the width of the bars, character set, method of encoding, checksum specifications etc. Since this arrangement can be varied to suit the different applications, there evolved a number of symbologies over the years. There are more than fifty coding sysmologies. Some of popular symbologies are as follows:
i. Universal Product Code (UPC): It is fixed length, numeric US standard to encode only the digits. It is in two variations: UPC-A to encode 12 digits and UPC-E to encode 6 digits.
ii. European Article Number (EAN): The European Article number is a superset of the UPC and encodes digits. It is available in two variations: EAN8 to encode 8 digits and EAN13 to encode 13 digits.
iii. Interleaved 2 of 5 (ITF):. It is continuous self-checking symbology that supports only numeric characters but can be used for variable lengths. Each character has 5 bars and 5 spaces. It starts and stops with a unique start/stop character.
iv. Code39: it is also known as code 3 of 9 and a discrete self checking alphanumeric symbology of variable length that encodes capital alphabets, numerical and few special characters like $,+,%,*. It always starts and ends with an asterisk (*), known as start / stop character. In this symbology, 5 bars and 4 spaces are used to encode an individual character.
v. Code 128: It is continuous alphanumeric symbology of variable length encoding full 128 ASCII character set. Every symbol starts and stops with a unique start/stop character.
Oct-Dec12 Vol. II No. IV Journal of Management Value & Ethics
108
vi. Codebar: It is a discrete, self –checking numeric symbology including six other characters and four unique start/stop characters. Each character has three bars and four spaces. It encodes only numeric and few special characters and is most widely used coding symbology. Generally libraries use this symbology to encode books and borrowers card.
vii. Code 49: Code 49 is a first two-dimensional barcode symbology: it is multi-row, continuous and variable length symbology encoding the full ASCII 128 character set. Each row is composed of 18 bars and 17 spaces. Each row contains a row number and the last row contains information regarding the row number in the symbol.
4 HOW BARCODE SYSTEM WORKS:
Barcode acts in much the same way as a keyboard. As the pressing of key sends a signal to the computer, in the same way reading the barcode results in the same kind of signal sent to the processor’
5 READING OF BARCODES
Barcode reader/scanner is a small counter-fitted or hand held device. Any item having barcode labels on, it is swiped in front of the barcode reader/scanner so that the barcode faces the read head of the barcode reader for a short period of time.
All the barcodes are physically read in the same way irrespective to their symbologies. They are scanned using a laser or Light Emitting Diode (LED) light source, to reflect the light off the label t photosensitive receptor which reads the code by differentiating between black bars and white spaces.
The light reflected on the black strip[s is absorbed, while light falling on the white spaces is reflected back into decoder. This reflected light is collected back and converted into a series of voltage variations. The decoder uses a mathematical algorithm to translate the electric impulses into binary codes and transmits the encoded message to a PC, a controller or host system for further processing.
6 BASIC REQUIREMENTS FOR BARCODE APPLICATION
For the application of barcode, the following requirements are required:-
i. A scanner to read the barcode labels; ii. A decoder to translate this information into binary;
Oct-Dec12 Vol. II No. IV Journal of Management Value & Ethics
109
iii. A host computer (either a PC or a controller) depending on the system; iv. The barcode labels which are printed in-house or off-site by a commercial house; v. Library management system software; vi. User database and
vii. Books database.
7 STATIONARY FOR PRINTING:
It is ideal to print barcodes on self-adhesive labels with the help of laser printer to achieve the required precision for the laser scanner. However, this may be expensive. The alternate strategy is to print them on a reasonable good paper and paste them with the help of gum or other adhesive. It is cheaper but labourious.
Laminating the barcodes is ideal. If cost permitting, it must be adopted. It is necessary for the protection of the barcodes for their long life.
8 CONSIDERATIONS FOR THE PRINTING OF THE BARCODE LA BELS:
The barcode labels require high quality in printing. Defects in printing will lead to wrong reading of data. It is of utmost importance that barcode labels have high contrast, well-dimensioned bars and spaces. Important considerations for printing barcode labels are as under:-
i. Paper Quality: High quality paper, free from imperfections is essential. ii. Ink Quality: Resistance to smudging and spreading. Non-reflectance and good
contrast. iii. Print Quality: Free from voids and speaks.
9 BARCODE BASED CIRCULATION SYSTEM:
Before discussing the barcode based circulation system, it is necessary to study the difficulties experienced in the manual and computer based circulation system so that the usefulness of the barcode technology can be appreciated:
9.2 Computerized circulation System:
In a computerized circulation system, there is no need to maintain and issue multiple borrowers’ cards. Each member needs only a single card with unique identification number. When a user comes to the circulating counter, the circulation staff input the membership number and activates his/her borrowing status. Then depending upon permissibility for
Oct-Dec12 Vol. II No. IV Journal of Management Value & Ethics
110
further borrowing, the document accession number (S) is entered. The software computes the due date for return and accordingly the entire details are displayed on the monitor. Thus the document is issued to the user.
Though the computer system proved to be highly efficient, but still the circulation staff has to input data like membership number and accession number into computer. This often slows down the entire process. Further, there may be data entry errors, which reduce the efficiency of the system.
.
10 APPLICATION OF BARCODE TECHNOLOGY GOT LIBRARY FU NCTION:
10.1 Membership identification.
In libraries entry is restricted to their members only. Thus a person is deputed on the gate to check identity cards of each person entering the library. If members are provided barcode identity cards, then this checking becomes very easy. A barcode scanner is installed at the gate of the library and every person entering the library has to place his/her identity card on the scanner. If the person is not a member of the library , the computer will give the alarm and thus restrict the entry.
10.2 User Statistics
Most of the libraries maintain gate register where members are requested to enter his/her details and mark their signature as a proof of their visit to the library. It is time consuming and users show indifference towards entering their particulars. With the help of this register, time series and classified statistics cannot be given instantly. When users are provided with barcode identity cards, it is possible to overcome all these difficulties. These statistics are useful for various purposes, particularly for improvement in library services and to start a new service.
10.3 Charging and Discharging:
Charging and discharging of books is a time consuming process as stamping of due dates and other data entry work have to be carried out. But in barcode environment, when a user goes to the circular counter, the counter staff scans his/her identity card and activates the borrowing status. If the computer permits the borrowing facility, the document is scanned for accession number and is issued to the user.

Oct-Dec12 Vol. II No. IV Journal of Management Value & Ethics
111
10.4 Checking at the Gate:
When the user leaves the library with the issued document , these are checked at the exit gate. For this purpose, barcode technology can be efficiently used and terminal can be installed on the gate. Since charging/discharging is done online, the database will be automatically updated. When borrower leaves the library, accession number of the document carried by the user will again be scanned at the gate. In case of issued document, the computer will approve the exit. But in case, someone is carrying a document that has not been issued, the computer will give an alarm and a message to the effect.
10.5 Issue of No Dues Certificate:
When a member leaves the organization/institute, his/her membership is cancelled and the library issues no dues certificate. This process is time consuming and error prone in manual system. In an automated system using barcode technology, the member surrenders his/her identity card and the counter staff scans it. The automation package will search the database for any document issued in his/her name. If nothing is due. No dues certificate will be printed. Else, it will give a list of documents issued in the name of that member.
10.6 Stock Verification:
Stock verification is a very tedious and time consuming job in libraries and during stock verification, the users are restricted to use the library facility. Hence, barcode technology is used very effectively and it is quicker and error free.
After the documents in the library are scanned and data is gathered in the hand held terminal. When it is about to full, the data is downloaded IN the host computer. Once all the documents in the library are scanned, it is compared with the database; it will give the details of documents of which accession number has not been scanned. Weeding out of the documents and updating of records also becomes simpler through this process. Thus this technology helps to verify the stock of the library systematically, quickly and accurately.
11.1 Security Check:
As in case of library, the barcoded identity cards will also perform the security check at the gate and allow only authorized persons to enter.

Oct-Dec12 Vol. II No. IV Journal of Management Value & Ethics
112
11.2 Stock Verification of the Store Items:
If every item of the store is barcoded, stock verification of store items can also be easily performed as in case of the books in the library.
12 ADNANT AGES OF USING BARCODE TECHNOLOGY:
The use of barcode technology increase efficiency and eliminates human errors due to fatigue and psychological reasons as in case of manual data entry. There several multiple and multiplicative improvements possible as listed below:-
i. Efficiency of the staff ii. Quality of service iii. Increases the speed of the operations iv. Enhances accuracy v. Increased users satisfaction and hence improve the image of the library. vi. No need to keep borrower’s tickets and book cards together, in turn, a lot of space is
saved. vii. Reliable statistics for management information system (MIS) and management
control. viii. Elegance and aesthetics of the front office and its activities.
ix. Higher degree of reliability x. Positive user attitude towards the library xi. Saves the time of borrower
xii. Perfect entry and reliable data xiii. Improves information availability and xiv. Data integrity
13 CONCLUSIONS:
Barcode technology is a most accurate and least expensive way to identify item/document and get data into the computer. Its application increases productivity and eliminates human error, improves speed of operation and services. It also reduces the operational cost by eliminating the book cards and book pockets. The magnitude of expected improvement of the introduction of barcode technology in a library with the automation is directly proportional to the size of its collection, the number of users and the number of transactions per day. Application of this technology will definitely improve the image of the
Oct-Dec12 Vol. II No. IV Journal of Management Value & Ethics
113
library and develop the positive attitude of users towards the library. Its application is a step forward towards to satisfy the Fourth Law of Library Science- “Save the time of the Users”
REFERENCES:
1. Anil Singh. Application of Bar code Technology in Libraries. Library Herald. V.40, N.I. (2002), p43-47.
2. Bar code Basics. http://www.makebarcode.com/info/info.html.
3. Bhasker Raj, A.S. The Bar code Technology and Applications. Electronics for you. V.27, N.4 (1995),
p99-105.
4. Chandok, Seema. Application of Bar code Technology in Libraries. Library Science Slant with
Documentation. V.35, N.4 (1998), p247-250.
5. Counting on Bars. Dataquest. V.12, N.22 (1995), p95-99.
6. Gample, S Rand Wadyane, H.S. using Bar code for circulation in the Central Library of IIT Bombay,
Annals of Library Science and Documentation. V.40, N.I (1993), p.12-20
7. Jeavan, V.K. J. Barcoding for Faster Library Transactions, DESIDOC Buulletin of Information and
Technology. V.20, N3 (2000), p.15-19
"I am thankful to all those who
said NO to me
It's because of them
I did it myself"
- Einstein...

Oct-Dec12 Vol. II No. IV Journal of Management Value & Ethics
114
Advertisement Tariff plan
Journal of Management value & ethics (A quarterly p ublished journal)
Space
Advertisement Rate’s in Rupees
Per issue For One year (4 issue) Back cover---color 25000 85000
Inside cover color 2 & 3 rd
15000 50000
Full Page Black & white color
10000 15000
35000 50000
Half page Black & white color
5000 8000
18000 30000
Publication Month : January, April, July, Oct. Circulation : More than 2000 copies in each quarter Circulation to : throughout India covering 52 chapter of GMA ; Various management institutes : HR Professionals in India & abroad Agency communication : 10% to 15% of the advertisement cost will be allowed to the agents for procuring advertisement in this journal. Mode of Payment : The Payment to be made by bank draft in favour of “Gwalior Management Academy” and payable at Gwalior in Indian rupee. Mechanical Data : Size of journal: 18 mm (Width) and 24 mm (Height) Print size Area: full page 22 x 16 mm
MS-Word (Document file) Type : Arial, Size 10 Pt. Print area : Top & Bottom 1.25 Inch, Left & Right 1.1 Inch
Printing Process : Photo offset Color : Multi color, inside- Black & white

Oct-Dec12 Vol. II No. IV Journal of Management Value & Ethics
115
Information to Authors :
� The paper should be typed in MS-Word.
� Title of the paper should be followed by Name, e-mail and affiliation of author(s).
� Use a single column layout with both left and right margins justified.
� Font Main Body text 10 point Style Arial or Times New Roman
� Tables and Figures : To be extent possible, tables and figures should appear in document near after where they are referred in the text. Avoid the use of small type in tables. In no case should tables or figures be in a separate document or file.
� An abstract of not more than 200 words is required.
� The paper should start with an introduction and with a Conclusion summarizing the finding of the paper.
� References : It is the author's obligation to provide complete references with the necessary information. References should appear to the text and the User of all references must be placed at the end of the manuscript.
� Papers are accepted for publication on the understand that these contain original unpublished work, submitted for publication anywhere else.
� Facts of papers presented / submitted in a conference / seminar must be clearly mentioned at the bottom of the first page of the manuscript and the author should specify with whom the any right rests.
� Papers are processed through a blind referral system of experts in the subject areas. To answer anonymity the writer's name, designation and other details should appear on the first page alongwith title of the paper and should not be repeated anywhere else.
All manuscripts should be in electronic form and sent to :
The Editor Journal of Management Value & Ethics Gwalior Management Academy (GMA) Publications C-17, Kailash Nagar, Near New High Court, Gwalior (M.P.) – INDIA – 474 006 Tel. : 0751-2230233 Mob. 09425121133 E-mail : [email protected]
� Payment to be made by crossed Demand Draft drawn in favor of Gwalior Management Academy A/c Gwalior (M.P.)
Oct-Dec12 Vol. II No. IV Journal of Management Value & Ethics
116
JOURNAL OF MANAGEMENT VALUE & ETHICS RNI-MPENG01094 ISSN-2249-9512
Publisher: Gwalior Management Academy (Run by: Lt. Muhar Singh Sengar Memorial Shiksha vikas Samitee)
MEMBERSHIP FORM
Name :...........................................................................................Sex : Male / Female ..........
Date of birth ................................................. (MM/DD/YYYY).....................................................
Address :.....................................................................................................................................
Phone......................................................................Occupation................................................ Email ID…………………………………………………………………….........................................
Type of membership: Life member / working member / student member (please tick any one). I wish to be a part of the GMA and promise to work for promoting research activities in the interest of “Journal of Management Value & Ethics ”, so please enroll my name as working /life member. I am enclosing a cross cheque in favour of Gwalior Management Academy payable at Gwalior.
(Signature of member)
Mode of Payment Cash or Cheque may be accepted.
MEMBERSHIP FEES Student Members: Rs. 1000 P.A. Working Members: Rs. 2000 P.A.
Life members: Rs. 5000 (one time) Institutional member : Rs. 2000 P.A.
---------------------------------------------------------------------------------------------------------------------------- Please send your duly filled membership forms/donations to :
GWALIOR MANAGEMENT ACADEMY C-17 Kailash Nagar Near, New High Court, Gwalior (M.P.) INDIA. Pin: - 474006
E-Mail to: [email protected]: +91-0751-2230233, 9425121133