Embed Size (px)
Citation preview
Journal of Management & Muamalah Jurnal Pengurusan & Muamalah
eISSN 2180-1681
EDITORIAL BOARD/ SIDANG EDITOR
Chief Editor / Ketua Editor Dr. SARIFAH ISMAIL
Managing Editor / Editor Pengurusan
NORFAEZAH OTHMAN NOR SUHAILY BAKAR
Executive Editor / Editor Kerja
NURNADDIA NORDIN NOR AZLA ABDUL WAHAB
Editor / Editor
NOR AIMI MUHAMAD PUAD FADILAH MAT NOR
ZAINAB AMAN RAJ ZAHID ELLEY
Secretary / Setiausaha
JUNAINAH IDRIS
Editorial Advisory Board / Sidang Penasihat Editorial DR. NOR HAKIMAH MOHD NOR
DR. NORZALINA ZAINUDIN DR. FARADILLAH IQMAR OMAR
DR. MAWAR MURNI YUNUS DR. NORMAZAINI SALEH DR. NORZIAH OTHMAN
Special thanks to all involved in the publication of this journal. Sidang Editor merakamkan ucapan jutaan terima kasih kepada semua yang terlibat
dalam menjayakan penerbitan jurnal ini.
Views expressed in this journal are not necessarily reflect views of the editor or publisher. Authors are fully responsible towards their articles.
Artikel yang diterbitkan tidak semestinya mewakili pandangan editor atau penerbit. Para penulis bertanggungjawab sepenuhnya terhadap artikel dan tulisannya.
Published by/Diterbitkan oleh:
Faculty of Management & Muamalah Kolej Universiti Islam Antarabangsa Selangor (KUIS)
Bandar Seri Putra, 43 000 Kajang,
SELANGOR, MALAYSIA
Journal of Management & Muamalah, Vol. 6, No. 2, 2016
eISSN 2180-1681
Jurnal Pengurusan & Muamalah
Volume / Jilid 6 November / November 2016
Number / Nombor 2 eISSN 2180-1681
No.
Articles / Artikel
Page / Halaman
1 Penipuan dan Pemalsuan Dalam Urusniaga Tanah : Kesan Terhadap Hak Milik Tidak Boleh Di Sangkal (Fraud and Forgery in Land Dealings: Effect To The
Indefeasibility of Title) Rabi’ah Muhammad Serji
1-14
2
Regulating Anti-Competitive Business conduct via completion Law in Malaysia
(Mengawal Selia Tingkahlaku Perniagaan Anti Persaingan Melalui Undang-Undang Persaingan di Malaysia) Haliza A. Shukor & Nazura Abdul Manaf
15-26
3
Effect of Receivable turnover to Profitability PT. Bil Finance
Center Period 2014 (Kesan Pusingganti Belum Terima Keatas Keuntungan Pt. Pusat Kewangan Tempoh 2010-2014)
Fia Dialysa
27-41
4
Peranan Komunikasi Dalam Mengurangkan Konflik Kerja-Keluarga: Tinjauan Ke Atas Jururawat Di Selangor (The Role of Communication in Reducing Work-Family
Conflict: A Survey on Nurses in Selangor) Normazaini Saleh
42-60
5
Customer Satisfaction Analysis Of Sharia Business Unit In Yogyakarta
(Analisis Kepuasan Nasabah Pada Unit Usaha Syariah Bank Di Yogyakarta)
Aidha Trisanty & Arif Darmawan
61-76
6
Applying SERVQUAL to Improve the Quality of Service
Delivery in Vocational Education in Indonesia (Penggunaan SERVQUAL Untuk Penambahbaikan Kualiti
Perkhidmatan Di Pendidikan Vokasional Di Indonesia) RR Sita Dewi Kusumaningrum
77-90

Journal of Management & Muamalah, Vol. 6, No. 2, 2016
eISSN 2180-1681
7
Financial Literacy of Youths: A Case Study of Islamic Banking
and Finance Students in Kolej Universiti Islam Antarabangsa Selangor (Belia Celik Kewangan: Kajian Kes Pelajar Perbankan Islam
dan Kewangan di Kolej Universiti Islam Antarabangsa Selangor)
Nurul Wajhi Ahmad, Murni Yunus Mawar & Norazlina
Ripain
91-103
8
Attitudes, Tax Knowledge and Education Towards Compliance Behaviour
(Sikap, Pengetahuan Cukai dan Pendidikan Terhadap Tingkahlaku Pematuhan) Noor Suhaila Shaharuddin & Mohd Rizal Palil
104-115
Journal of Management & Muamalah, Vol. 6, No. 2, 2016
eISSN 2180-1681
4
Penipuan dan Pemalsuan Dalam Urusniaga Tanah: Kesan
Terhadap Hak Milik Tidak Boleh Di Sangkal
(Fraud and Forgery in Land Dealings: Effect to the Indefeasibility of Title)
Rabi’ah Muhammad Serji
Kolej Universiti Islam Antarabangsa Selangor Selangor, Malaysia
ABSTRAK
Prinsip undang-undang Tanah yang diguna pakai di Malaysia ialah prinsip undang-undang Tanah Torrens yang berasal dari Australia Selatan. Prinsip Torrens ini mementingkan
pendaftaran dalam setiap urusniaga tanah yang dijalankan. Setiap urusniaga tanah yang dilakukan mengikut prosedur yang telah ditetapkan oleh undang-undang akan memberikan pemilik berdaftar hak milik dan kepentingan yang tidak boleh disangkal dan disoal oleh sesiapa
pun. Jaminan hak milik ini telah diperuntukkan dengan jelas di dalam seksyen 340 Kanun Tanah Negara 1965. Namun begitu, peruntukan yang sama menyenaraikan pengecualian statut
terhadap perkara ini dan antara pengecualian yang diperuntukkan terhadap hak tidak boleh disangkal ialah sekiranya berlakunya penipuan dan pemalsuan dalam urusniaga tanah tersebut. Kertas kerja ini akan mengenalpasti penipuan dan pemalsuan bagaimanakah yang dimaksudkan
oleh seksyen 340 KTN dan kesannya terhadap hak milik tidak boleh disangkal di bawah sistem Torrens. Kajian kepustakaan dan analisis kes merupakan kaedah yang akan digunakan dalam
kertas kerja ini. Kata kunci: Prinsip Torrens, Kanun Tanah Negara 1965, Hak Tidak Boleh Disangkal,
Penipuan dan Pemalsuan, Urusniaga Tanah
ABSTRACT
Land law principle which was applied in Malaysia was Torrens system originated from South
Australia. According to the Torrens principle, registration of land dealings was very important. Every land dealing which follow all the procedures of law will gave the registered owner the
indefeasibility of title and interest. The guaranteed title to the registered owner was clearly enacted in section 340 of the National Land Code 1965. This section however listed out the statutory exceptions to the principle of indefeasibility such as fraud and forgery in land
dealings. This paper will studied what kind of fraud and forgery as mentioned in the exceptions of section 340 NLC and its impact to the principle of indefeasibility of title under the Torrens
system. The method of library research and case analysis was used in this paper. Keywords: Torrens Principle, National Land Code 1965, Indefeasibility of Title, Fraud and
Forgery, Land Dealings
Journal of Management & Muamalah, Vol. 6, No. 2, 2016
eISSN 2180-1681
5
PENGENALAN Undang-undang tanah di Malaysia khususnya negeri-negeri di semenanjung Malaysia terkandung dalam undang-undang tanah utama iaitu Kanun Tanah Negara 1965. Pemakaian undang-undang ini adalah berasaskan kepada prinsip kemuktamadan daftar yang dikenali
sebagai sistem Torrens. Sistem ini pada permulaannya telah diperkenalkan di Australia Selatan oleh pengasasnya iaitu Sir Richard Robert Torrens. Prinsip asas undang-undang Torrens ialah
semua urusniaga berkaitan tanah yang dilakukan perlu didaftarkan bagi memastikan urusniaga tersebut diiktiraf oleh undang-undang dan boleh dikuatkuasakan. Mengikut prinsip Torrens, setiap urusniaga berkaitan dengan tanah perlu menggunakan borang-borang berkaitan yang telah
ditetapkan dan didaftarkan bagi menjamin kesahan setiap urusan tanah yang dilakukan. Pendaftaran yang dilakukan mengikut prosedur yang telah ditetapkan akan memberikan hak
yang tidak boleh disangkal kepada pemilik. Ini bermakna mengikut sistem Torrens, hak pemilik berdaftar adalah mutlak dan tidak boleh dipersoalkan oleh sesiapa pun. Individu yang namanya didaftarkan sebagai pemilik berdaftar bagi sesuatu tanah dikatakan mempunyai hak milik yang
tidak boleh dicabar atau dipersoalkan (Visu Sinnadurai, 1984). Hak pemilik mengikut Torrens adalah dijamin oleh pihak berkuasa negeri (Ainul Jaria, 2008).
Namun, hak tidak boleh disangkal yang diberikan oleh undang-undang kepada pemilik berdaftar ini akan menimbulkan masalah apabila sesuatu urusniaga dilakukan dengan kewujudan fraud
dan pemalsuan. Selepas beberapa pindaan dan penambah baikan terhadap undang-undang tanah Torrens semenjak diperkenalkan, peruntukan dalam undang-undang utama berkaitan tanah di
Malaysia iaitu Kanun Tanah Negara 1965 memperuntukkan pengecualian terhadap prinsip tidak boleh sangkal ini di dalam seksyen 340(2).
SISTEM TORRENS Sistem Torrens merupakan sistem pentadbiran tanah yang diguna pakai di Malaysia pada hari ini. Sistem ini mula diperkenalkan di Semenanjung Tanah Melayu oleh British pada tahun 1864
dan seterusnya berkembang dan diamalkan oleh semua negeri di semenanjung melalui undang-undang tanah yang sama iaitu Kanun Tanah Negara 1965 yang mula berkuat kuasa mulai Januari 1966. Sistem Torrens mementingkan pendaftaran yang mana ianya menghendaki semua
urusniaga berkaitan tanah yang dilakukan perlu direkod dan didaftarkan bagi menjamin kesahannya. Pendaftaran akan memudahkan bakal pembeli untuk mengenal pasti hak milik,
kepentingan dan juga bebanan sekiranya ada terhadap tanah yang disiasat (Jerald Gomez, 2008). Secara umumnya, terdapat dua prinsip utama sistem Torrens iaitu prinsip Cermin dan prinsip
Tabir. Di bawah prinsip Cermin, pendaftaran mencerminkan segala fakta material berhubung hak milik seseorang ke atas tanahnya. Hak milik itu tidak boleh disangkal serta selamat, terang
dan mudah (Ridzuan Awang, 1994). Fakta material berkenaan adalah termasuk nama pemilik, butir-butir mengenai tanah, luas kawasan dan lokasinya, pelan ukur dan had sempadannya. Dengan kata lain, prinsip ini mencerminkan dalam rekod apa yang ada di atas tanah dengan
daftar hak milik. Daftar hak milik adalah seperti satu cermin yang mampu menunjukkan segala maklumat yang penting mengenai tanah yang mungkin dikehendaki oleh seorang bakal pembeli
atau bakal pemegang gadaian (Das, Sk, 1963). Prinsip ini telah diperuntukkan di dalam seksyen
Journal of Management & Muamalah, Vol. 6, No. 2, 2016
eISSN 2180-1681
6
340 Kanun tanah Negara 1965, bahawa pendaftaran sesuatu tanah atas nama seseorang atau
badan sebagai tuan punya, memberi hak milik dan kepentingan yang tidak boleh disangkal kecuali dalam keadaan-keadaan tertentu sahaja seperti penipuan, salah nyataan, pemalsuan atau instrumen yang tidak sah.
Prinsip kedua sistem Torrens iaitu prinsip Tabir yang membawa maksud daftar yang
mempunyai sifat sebagai satu tabir yang mana dalam setiap transaksi antara pemilik berdaftar dengan bakal pembeli, bakal pembeli hanya dikehendaki memberi perhatian kepada daftar dan tidak lebih daripada itu. Adalah memadai bagi pembeli untuk bergantung pada maklumat yang
ada dalam daftar dan tidak perlu, malahan tidak boleh melihat lebih jauh daripada itu (Salleh Buang, 2007). Di dalam kes Gibbs V Messer [1891] A.C. 248, Majlis Privy telah menjelaskan
bahawa tujuan utama sistem Torrens adalah:
“….untuk menyelamatkan orang-orang yang berurusan dengan pemilik tanah daripada
kesulitan dan perbelanjaan kerana terpaksa menyiasat latar belakang hak milik berkenaan untuk memuaskan hati mereka mengenai kesahihannya”.
Prinsip Tabir ini menitik beratkan tujuan pembeli dengan turut diberi perhatian terhadap pendaftaran yang dianggap sebagai suatu sumber maklumat berhubung dengan hak milik yang
sah dari segi undang-undang. Prinsip ini mementingkan maklumat yang tercatat di dalam rekod daftar dan tidak perlu melihat di sebalik tabir seperti sejarah tanah dan sebagainya.
Pendaftaran yang sah akan memberikan hak dan kepentingan yang tidak boleh disangkal kepada individu yang namanya tercatat dalam daftar. Objektif utama sistem Torrens ialah untuk
menjadikan pendaftaran dokumen hak milik sebagai bukti konklusif terhadap pemilikan sesuatu hartanah (Ainul jaria, Hunud, 2010).
HAK TIDAK BOLEH DISANGKAL Hak milik dan kepentingan yang tidak boleh disangkal merupakan kesan penting kepada pendaftaran urusniaga. Apabila hak milik dan kepentingan seseorang individu didaftarkan
mengikut prosedur pendaftaran yang telah ditetapkan oleh undang-undang, ianya akan direkodkan di dalam dokumen pendaftaran hak milik. Kesannya, individu yang mendaftarkan uruniaga tanah itu akan menjadi pemilik mutlak yang tidak boleh disangkal. Ini bermakna hak
pemilik berdaftar tidak boleh dipersoalkan atau ditarik balik. Semua urusniaga yang didaftarkan akan mendapat pengiktirafan dan perlindungan hak tidak boleh disangkal. Di dalam kes Teh Bee
v K Maruthamuthu [1977] 2 MLJ 7, Mahkamah Persekutuan mengesahkan bahawa di bawah sistem Torrens, daftar adalah segala-galanya dan membenarkan siasatan dilakukan ke atas hak seorang pemilik berdaftar merupakan amalan yang salah kerana ianya akan menjejaskan
maksud dan matlamat pendaftaran. Di dalam kes ini mahkamah memutuskan bahawa, fakta pendaftaran dokumen hak milik atas nama appelan merupakan satu bukti konklusif bahawa hak
milik ke atas tanah itu adalah terletak kepada appelan.
Journal of Management & Muamalah, Vol. 6, No. 2, 2016
eISSN 2180-1681
7
Namun begitu, untuk memperolehi hak ketidak boleh sangkalan, individu yang berurusniaga
hendaklah mendaftarkan kepentingannya mengikut kehendak Kanun Tanah Negara dan memastikan agar dokumen yang ingin didaftarkan adalah sah dan dapat diterima mengikut undang-undang. Jika pendaftaran kepentingan gagal dilakukan, adalah agak mustahil untuk
memperolehi hak tidak boleh disangkal (Joshua, 2006). Peruntukan undang-undang berkenaan hak tidak boleh disangkal terdapat pada bahagian dua
puluh, Kanun Tanah Negara 1965. Seksyen 340 kanun tersebut memperuntukkan, pendaftaran untuk memberi hak milik atau kepentingan yang tak boleh disangkal, kecuali dalam keadaan-keadaan tertentu. Klausa (1) seksyen 340 memperuntukkan seperti berikut:
(1) Hak milik atau kepentingan mana-mana orang atau badan buat masa itu sebagai tuan punya mana-mana tanah, atau atas nama siapa apa-apa pajakan, gadaian atau esmen
adalah buat masa itu terdaftar, hendaklah, tertakluk kepada peruntukan –peruntukan berikut seksyen ini, tidak boleh disangkal.
Seksyen 340(1) ini menyebut perkataan hak milik atau kepentingan. Terdapat perbezaan di antara hak milik dan kepentingan di dalam peruntukan ini iaitu hak milik merujuk kepada hak
milik seseorang terhadap tanah yang telah didaftarkan. Manakala kepentingan pula bukan merujuk kepada hak milik tetapi hanya kepada kepentingan yang diperolehi daripada tanah tersebut. Sebagai contoh kepentingan pemegang gadaian (pihak bank), penerima pajakan atau
pun pemilik tanah dominan dalam urusniaga esmen.
Secara mudahnya bolehlah disimpulkan bahawa hak milik mutlak akan diberikan oleh undang-undang kepada individu yang namanya tercatat dalam daftar. Sebagai contoh sekiranya berlaku pertikaian terhadap hak milik tanah antara A dan B, mahkamah akan melihat kepada daftar hak
milik. Sekiranya hak milik atau kepentingan didaftarkan atas nama A, maka A adalah pemilik sebenar menurut undang-undang dan hak A ke atas tanah tersebut tidak boleh disangkal atau
dipersoalkan oleh sesiapa pun. PENIPUAN DAN PEMALSUAN SERTA KESANNYA TERHADAP HAK MILIK
TIDAK BOLEH DISANGKAL
Perbincangan sebelum ini menunjukkan bahawa sistem Torrens sangat mementingkan
pendaftaran dan kesan kepada pendaftaran ialah hak dan kepentingan pemilik berdaftar menjadi tidak boleh disangkal dan dipersoal. Namun begitu, seksyen 340(2) kanun Tanah Negara 1965 sendiri memperuntukkan pengecualian kepada prinsip ini. Secara mudahnya, prinsip hak milik
tidak boleh disangkal dalam undang-undang tanah yang diamalkan di Malaysia bukanlah diberi secara mutlak. Namun, ianya masih tertakluk kepada pengecualian-pengecualian tertentu.
Klausa (2) seksyen 340 KTN 1965 memperuntukkan: (2) Hak milik atau kepentingan mana-mana orang atau badan sedemikian hendaklah
menjadi tak boleh sangkal –
(a) Dalam mana-mana kes penipuan atau salahnyata yang kepadanya orang atau badan itu, atau mana-mana ejen orang atau badan itu, adalah suatu pihak atau
privy; atau (b) Jika sekiranya pendaftaran diperolehi secara pemalsuan, atau dengan cara suatu
instrument yang tidak mencukupi atau tak sah; atau
Journal of Management & Muamalah, Vol. 6, No. 2, 2016
eISSN 2180-1681
8
(c) Jika sekiranya hakmilik atau kepentingan itu adalah diperolehi secara tidak sah
oleh orang atau badan dalam pergunaan berupa apa-apa kuasa atau autoriti yang diberi oleh mana-mana undang-undang bertulis.
Seksyen ini memperuntukkan keadaan-keadaan yang membolehkan hak milik atau kepentingan seseorang atau badan disangkal. Adalah penting untuk difahami bahawa tindakan bagi
menyangkal hak milik akan hanya dapat dilakukan setelah pendaftaran hak milik itu dilaksanakan. Sekiranya pendaftaran tidak dilakukan, adalah agak mustahil bagi sesuatu pihak untuk menyangkal hak milik pihak yang namanya didaftarkan sebagai pemilik (Joshua, 2006).
PENIPUAN DAN SALAH NYATA SEKSYEN 340(2)(a)
Klausa (a), seksyen 340(2) memperuntukkan bahawa sekiranya sesuatu hak milik atau kepentingan diperolehi secara penipuan atau salah nyataan, ia boleh menjadikan hak milik atau kepentingan itu sebagai boleh disangkal. Maksud peruntukan ini ialah, mana-mana orang atau
badan yang telah mendaftarkan hak milik atau kepentingannya setelah memperolehinya melalui penipuan atau istilah lain disebut sebagai fraud, maka pemilik asal akan dapat mengenepikan
kepentingan tersebut. Pemilik asal juga harus membuktikan bahawa penipuan itu telah dilakukan oleh pihak yang namanya telah didaftarkan sebagai pemilik baru yang hak miliknya ingin disangkal oleh pemilik asal.
Kanun Tanah Negara tidak mentakrifkan penipuan (fraud), oleh itu rujukan perlu dibuat kepada
keputusan kes-kes yang berkenaan. Di dalam kes Assets Co v Mere Roihi [1905] AC 176, mahkamah telah menyatakan bahawa fraud bermaksud fraud yang sebenar (actual fraud) iaitu kelakuan tidak jujur. Di dalam kes Waimiha Sawmilling Company Limited v Waione Timber
Company Limited [1926] AC 101, Lord Buckmaster menyatakan bahawa: ― Jika tujuan sesuatu pindah milik itu adalah untuk menipu seseorang supaya hilang
haknya yang telah pun wujud, itu juga merupakan fraud dan begitu juga halnya perbuatan memperdayakan orang lain dengan sengaja dan dengan itu menyebabkan sesuatu kepentingan itu tidak didaftarkan…..‖
Adalah penting bagi pemilik asal membuktikan bahawa pemilik baru yang memperolehi hak
milik melalui penipuan adalah merupakan pihak atau pun privy kepada penipuan. Dengan kata lain, hendaklah ada bukti bahawa penipuan berkenaan telah dilakukan oleh orang yang didaftarkan menjadi pemilik tanah berkenaan atau oleh wakilnya (Salleh Buang, 1993).
Contoh kes berkaitan actual fraud ialah kes Haji Aishah v Yah binti Taib (1949) 15 MLJ 128. Di
dalam kes ini, seorang wanita yang buta huruf telah diberitahu bahawa dokumen hak milik yang ditandatanganinya itu ialah borang gadaian. Sebenarnya dokumen itu ialah suratcara pindah milik. Suratcara itu kemudiannya telah digunakan untuk memindah milik tanah wanita itu
kepada Haji Musa. Haji Musa kemudiannya telah memindah milik tanah itu kepada defendan. Defendan menyedari penipuan yang telah dilakukan ke atas pemilik asal tanah itu. Mahkamah
memutuskan bahawa hak milik defendan hendaklah diketepikan.
Journal of Management & Muamalah, Vol. 6, No. 2, 2016
eISSN 2180-1681
9
Di dalam kes lain yang diputuskan oleh mahkamah Persekutuan iaitu kes Tai Lee Finance Co
Sdn Bhd v Official Assignee & Ors [1983] 1 MLJ 81, sebuah syarikat pemaju perumahan telah menjual beberapa lot tanah dalam projeknya kepada beberapa orang pembeli. Keseluruhan tanah itu kemudian telah digadaikan oleh pemaju kepada sebuah syarikat kewangan yang merupakan
pemegang gadaian, sebagai sekuriti pinjaman yang diperolehi daripada syarikat tersebut. Setelah masa berlalu, pemaju perumahan menghadapi kesulitan membayar balik pinjamannya kepada
pemegang gadaian. Pemegang gadaian kemudiannya telah mengambil tindakan melelong tanah yang digadai untuk mendapatkan balik wang pinjaman. Pada masa ini lah beberapa orang pembeli lot tanah itu telah mencelah.
Isu di dalam kes ini ialah, sama ada pemegang gadaian dianggap terlibat dalam perbuatan fraud
terhadap pencelah kerana apabila gadaian didaftarkan dia mengetahui bahawa lot-lot tanah berkenaan telah pun dijual kepada pencelah. Mahkamah telah menolak hujah ini dan menegaskan bahawa fraud bermaksud kelakuan atau perbuatan yang ‗tidak jujur‘ dan bukan
hanya sekadar fraud konstruktif atau fraud ekuiti. Berkenaan dengan salah nyata, tiada sebarang tafsiran berkaitan di bawah KTN 1965. Maka
adalah penting untuk menentukan sama ada salah nyata yang dimaksudkan di bawah kanun adalah salah nyata penipuan atau pun tidak. Di dalam kes Datuk Jaginder Singh v Tara Rajaratnam [1983] 2 MLJ 196, mahkamah memutuskan bahawa salah nyata di bawah seksyen
340(2)(a) adalah merupakan salah nyata penipuan (fraudulent misrepresentation). Oleh itu, salah nyata di bawah peruntukan ini boleh dianggap sebagai salah satu jenis fraud (Teo dan Khaw,
1995). Hakim Lee hun Hoe di dalam kes ini telah merujuk kepada perkataan ‗fraud atau salah nyata‘ dalam seksyen 340(2)(a) dan menyatakan bahawa perkataan ‗atau‘ di situ ialah sesuatu yang disjunktif, oleh itu istilah ‗fraud atau salah nyata‘ bermaksud fraud yang sebenar atau salah
nyata fraud atau kedua-duanya.
PEMALSUAN SEKSYEN 340(2)(b)
Mengikut peruntukan seksyen 340(2)(b) Kanun Tanah Negara 1965, hakmilik atau kepentingan mana-mana orang atau badan sedemikian janganlah menjadi tak boleh disangkal jika
pendaftaran diperolehi secara pemalsuan. Ini bermakna, jika terdapat pemalsuan dokumen dalam proses pindah milik, maka hak milik berdaftar yang diperolehi kemudiannya boleh
disangkal. Pemalsuan boleh wujud dalam keadaan seseorang yang menyalahgunakan nama pemilik
berdaftar dan tandatangannya untuk melaksanakan satu pendaftaran hak milik yang baru. Mengikut seksyen 340 (2)(b), apabila pendaftaran sesuatu urusniaga itu diperolehi secara
pemalsuan, maka hak milik yang didaftarkan itu boleh disangkal. Di dalam kes Ong Lock Choo v Quek Shin & Sons Ltd (1941) MLJ 88, seorang pemilik tanah telah memberikan dokumen hak miliknya kepada seorang peguam untuk urusan pendaftaran gadaian. Kerani peguam itu
kemudiannya telah memalsukan suratcara berkenaan dan menggadai tanah itu kepada orang lain. Mahkamah memutuskan bahawa gadaian yang didaftarkan itu tidak sah. Apa yang perlu
dibuktikan di dalam seksyen ini adalah tindakan pemalsuan itu sendiri dan tidak perlu membuktikan bahawa pemilik berdaftar yang baru telah menjadi ahli atau pun privi kepada pemalsuan seperti yang dikehendaki di bawah penipuan atau fraud (Joshua, 2006).
Journal of Management & Muamalah, Vol. 6, No. 2, 2016
eISSN 2180-1681
10
Di dalam kes Quah Hong Lian Neo v Seow Teong teck [1936] MLJ 203, seseorang telah
mendapat pindah milik sebidang tanah daripada pemiliknya menerusi tipu helah dan pemalsuan. Berikutnya sebagai seorang pemilik berdaftar, dia telah menggadai tanah itu kepada pihak ketiga. Mahkamah di dalam kes ini telah menjadikan kes Gibbs v Messer (1891)AC 248, sebagai
rujukan dan memutuskan bahawa pindah milik itu tidak sah. Oleh sebab dia tidak memperolehi hak yang sah menerusi pindah milik itu, dia tidak mempunyai apa-apa hak untuk mewujudkan
satu gadaian berasaskan maksim undang-undang nemo dat quod non habet. Di dalam kes OCBC Bank (M) Bhd v Pendaftar Hak milik Negeri Johor Darul Takzim [1999] 2 MLJ 511, mahkamah telah menyatakan bahawa untuk menyangkalkan hak milik atas alasan pemalsuan, pemalsuan itu
tidak perlu dikaitkan dengan pihak yang hak miliknya ingin disangkalkan. Hanya perlu buktikan bahawa terdapat pemalsuan di dalam pemindahan hak milik.
PIHAK KETIGA YANG BERTINDAK SECARA BONA FIDE
Namun begitu, masalah timbul dalam situasi jika sesuatu dokumen hak milik dipalsukan dan
kemudiannya pemilik berdaftar yang memperolehi hak milik melalui pemalsuan dokumen itu menjual tanah tersebut kepada pembeli yang membeli secara bona fide. Sama ada pemindahan
hak milik kepada pihak ketiga yang membeli secara bona fide itu boleh disangkal atau pun tidak. Perkara ini ada diperuntukkan di dalam seksyen 340(3) KTN 1965 seperti berikut:
(3) Jika sekiranya hakmilik atau kepentingan mana-mana orang atau badan adalah
boleh disangkal oleh sebab apa-apa keadaan yang dinyatakan dalam subsekyen(2)-
(a) Maka ia hendaklah tertanggung untuk diketepikan dalam tangan mana-mana orang atau badan yang kepadanya ia mungkin dipindahmilik kemudiannya; dan
(b) Apa-apa kepentingan yang diberi kemudiannya hendaklah tertanggung untuk
diketepikan dalam tangan mana-mana orang atau badan dalam mana ia adalah buat masa itu diletakhak:
Dengan syarat bahawa tiada apa jua dalam subseksyen ini hendaklah menyentuh apa-apa hak atau kepentingan yang diperolehi oleh mana-mana pembeli dengan suci hati dan untuk balasan
yang berharga, atau oleh mana-mana orang atau badan yang menuntut melalui atau di bawah seorang pembeli sedemikian.
Di dalam kes Adorna Properties Sdn. Bhd v Boonsom Boonyanit [2001] 2 CLJ 133, fakta secara ringkasnya ialah seseorang telah memalsukan tandatangan Boonsom dan telah memindah milik
suatu tanah yang asalnya hak milik Boonsom kepada Adorna. Adorna tidak mengetahui langsung tentang pemalsuan dan dokumen yang telah dipalsukan. Telah dihujahkan bahawa
urusan penjualan dan pendaftaran tanah telah dilakukan mengikut prosedur yang telah ditetapkan oleh undang-undang. Mahkamah Tinggi telah memutuskan kes ini berpihak kepada Adorna berdasarkan kepada proviso seksyen 340(3). Namun begitu, Mahkamah Rayuan telah
membuat keputusan sebaliknya dengan memutuskan bahawa hak yang didaftarkan atas nama Adorna adalah boleh disangkal berdasarkan kepada peruntukan seksyen 340(2) dan proviso
seksyen 340(3) tidak terpakai. Walau bagaimana pun, apabila rayuan dibuat ke Mahkamah Persekutuan, mahkamah memutuskan bahawa proviso seksyen 340(3) adalah terpakai dan memberikan hak milik yang tidak boleh disangkal kepada Adorna. Di dalam kes ini mahkamah
Journal of Management & Muamalah, Vol. 6, No. 2, 2016
eISSN 2180-1681
11
menganggap Adorna sebagai pembeli yang membeli secara suci hati (bona fide) sebagai mana
yang peruntukkan di dalam proviso seksyen 340(3). Associate Professor Teo Keang Sood ketika mengkritik penghakiman kes Adorna menyatakan
bahawa mahkamah telah tersilap dalam mentafsir peruntukan seksyen 340. Seksyen 340(1) digubal untuk memberikan pemilik berdaftar hak milik dan kepentingan yang tidak boleh
disangkal melainkan hak milik dan kepentingan itu diperolehi dengan cara yang dinyatakan di dalam sub seksyen (2) dan (3), seksyen 340. Salah satu keadaan yang dinyatakan di dalam seksyen 340(2) yang menjadikan hak milik dan kepentingan pemilik berdaftar boleh disangkal
ialah sekiranya pendaftaran hak milik itu diperolehi dengan cara pemalsuan. Pendaftaran hak milik yang diperolehi dengan cara pemalsuan menjadikan hak milik itu boleh disangkal dan
kesannya hak milik itu boleh diketepikan sebagaimana yang diperuntukkan di dalam seksyen 340(3). Walau bagaimana pun, terdapat proviso kepada seksyen 340(3) seperti yang telah diterangkan di atas (Teo Keang Sood, 2004).
Associate Professor Teo seterusnya meringkaskan kritikannya terhadap kes ini kepada 6 perkara
penting iaitu: i. Bersetuju dengan tafsiran mahkamah terhadap seksyen 340(1). ii. Seksyen 340(2) menjadikan pendaftaran hak milik dan kepentingan boleh
disangkal dalam kes pemalsuan walau pun pemilik berdaftar yang baru itu bukanlah pihak atau pun privy kepada perbuatan pemalsuan itu. Dengan kata
lain, walau pun sekiranya pemilik berdaftar bertindak secara suci hati, hak milik dan kepentingannya masih boleh disangkal jika terbukti wujudnya pemalsuan.
iii. Di dalam kes Boonsom, pihak yang melakukan pemalsuan tidak mendaftar tanah
itu atas namanya sendiri tetapi menjualnya terus kepada appelan iaitu Adorna. Dengan kata lain, Adorna membeli tanah itu terus daripada pihak yang
melakukan pemalsuan. Di dalam kes ini, situasi appelan itu termasuk di dalam peruntukan seksyen 340(2)(b) dan oleh itu menjadikan hak miliknya boleh disangkal. Kes ini bukanlah berkaitan pembeli yang membeli dengan suci hati
dan untuk balasan yang bernilai dan oleh itu seksyen 340(3) tidak terpakai. iv. Adalah penting untuk difahami bahawa seksyen 340(3) tidak terpakai melainkan
jika didapati hak milik dan kepentingan pemilik berdaftar boleh disangkal disebabkan wujudnya perkara-perkara yang dinyatakan di dalam seksyen 340(2). Sekiranya perkara itu berlaku, ianya hanya akan terpakai kepada pembeli yang
membeli daripada pemilik berdaftar yang mana hak milik dan kepentingannya boleh disangkal berdasarkan seksyen 340(2). Sekiranya perkara ini berlaku,
barulah seksyen 340(3) terpakai. v. Di dalam kes Boonsom, tiada ruang kepada pemakaian seksyen 340(3) kerana
tiada pembelian sebagaimana yang dinyatakan di dalam seksyen 340(3) berlaku.
Oleh itu hak milik dan kepentingan appelan masih boleh disangkal berdasarkan peruntukan seksyen 340(2).
Walau bagaimana pun harus difahami di sini bahawa kritikan Associate Professor Teo itu hanyalah pendapatnya dan tidak mengikat mana-mana pihak. Tafsiran seksyen 340 yang

Journal of Management & Muamalah, Vol. 6, No. 2, 2016
eISSN 2180-1681
12
mengikat boleh dilihat dalam keputusan mahkamah di dalam kes Tan Ying Hong v Tan Sian San
& Ors [2010] 2 MLJ 1. Di dalam kes ini, isu yang perlu diputuskan oleh mahkamah ialah sama ada pemilik berdaftar suatu gadaian di bawah Kanun Tanah Negara 1965 yang memilikinya melalui suatu dokumen yang telah dipalsukan akan memperolehi secara serta merta hak milik
dan kepentingan yang tidak boleh disangkal.
Fakta dalam kes ini ialah, perayu merupakan pemilik berdaftar tanah seluas Sembilan ekar yang terletak di Kuantan, Pahang. Tanpa pengetahuan perayu, responden pertama telah bertindak dengan menggunakan surat kuasa wakil yang telah dipalsukan untuk memeterai dua gadaian
bagi mendapatkan pinjaman untuk responden kedua. Responden kedua telah gagal membayar balik pinjaman dan pihak bank telah menuntut bayaran pinjaman tersebut daripada perayu.
Perayu membuat permohonan kepada mahkamah untuk mengisytiharkan bahawa gadaian itu tidak sah dan batal atas alasan surat kuasa wakil yang digunakan untuk proses gadaian itu telah dipalsukan. Mahkamah Tinggi menolak permohonan perayu atas alasan perayu bukan pemilik
sebenar tanah dan seksyen 340(3) KTN dan proviso telah melindungi responden ketiga. Mahkamah Rayuan mengekalkan keputusan Mahkamah Tinggi. Dalam rayuan ke Mahkamah
Persekutuan, mahkamah berpuas hati bahawa gadaian telah dimeterai dengan menggunakan instrument yang batal dan oleh itu secara automatik boleh diketepikan oleh perayu yang merupakan pemilik berdaftar. Mahkamah Persekutuan menegaskan, fakta bahawa hak atau
kepentingan itu diperolehi secara suci hati dan untuk balasan yang bernilai bukanlah persoalannya kerana sekiranya mahkamah berpuas hati bahawa gadaian itu diwujudkan dengan
menggunakan dokumen yang tidak sah, maka ia secara automatik menjadikan hak dan kepentingan yang didaftarkan itu boleh diketepikan. Mahkamah di dalam kes ini mengiktiraf prinsip hak milik tidak boleh disangkal secara tertunda dan bukannya serta merta seperti yang
biasa diamalkan di bawah sistem Torrens. Mahkamah Persekutuan di dalam kes ini menyatakan bahawa Mahkamah Persekutuan di dalam Kes Boonsom Bonyanit telah salah faham dalam
mentafsir seksyen 340(1) atau telah melakukan kesilapan dalam memutuskan kes tersebut. Keputusan kes Tan Ying Hong ini menunjukkan bahawa mahkamah telah mengubah prinsip
yang telah dibuat di dalam kes Boonsom.
KESIMPULAN Kesimpulannya daripada perbincangan ini jelas menunjukkan bahawa sistem Torrens
memberikan hak milik dan kepentingan yang tidak boleh disangkal kepada pemilik berdaftar suatu tanah. Namun sekiranya pendaftaran hak milik dan kepentingan itu diperolehi dengan cara
fraud atau pemalsuan, peruntukan seksyen 340(2) Kanun Tanah Negara 1965 seperti yang dinyatakan di atas, secara jelas menyatakan bahawa, yang bermaksud sekiranya terdapat fraud dan pemalsuan dalam sebarang urusniaga tanah, maka pendaftaran tidak akan memberikan hak
milik dan kepentingan yang tidak boleh disangkal kepada pemilik yang namanya tercatat di dalam daftar. Hak serta kepentingan yang didaftarkan itu boleh diketepikan. Ini bermaksud,
kesan terhadap kewujudan urusniaga tanah secara fraud dan pemalsuan ialah hak milik dan kepentingan pemilik berdaftar masih boleh disangkal dan persoalkan.
Journal of Management & Muamalah, Vol. 6, No. 2, 2016
eISSN 2180-1681
13
Kes-kes pemalsuan yang dibincangkan di atas menunjukkan pihak-pihak yang memalsukan
dokumen sebenarnya juga secara tidak langsung melakukan penipuan terhadap urusniaga yang dilakukan. Oleh itu penulis menyimpulkan bahawa seksyen 340(2) itu secara umumnya adalah berkaitan urusniaga yang melibatkan fraud dan kesannya adalah menjadikan hak milik dan
kepentingan yang didaftarkan itu boleh disangkal menurut undang-undang. Tafsiran terhadap seksyen 340 Kanun Tanah Negara 1965, yang telah dibuat oleh Mahkamah Persekutuan di
dalam kes Tan Ying Hong mampu memberi perlindungan hak milik kepada pemilik asal suatu tanah, selari dengan matlamat utama Sistem Torrens yang menjadikan pendaftaran sebagai asas perlindungan hak milik.
RUJUKAN
Ainul Jaria Maidin & Hunud Abia Kadouf. Weaknesses in The Registration of Land Dealings
System in Malaysia: Suggestions for Improvements for Enhancing the System. [2010] 1
LNS 1.
Ainul Jaria Maidin, Sharifah Zubaidah Syed Abdul Kader, Bashiran Begum Haji Mobarak Ali, Nor Asiah Mohamad, Azlinor Sufian, Ratna Azah Rosli & Fauziah Md. Nor. (2008) Principles of Malaysian Land Law. Lexis Nexis, Singapore.
Das, SK (1963) The Torrens System in Malaya. MLJ, Singapore.
Jerald Gomez. Section 340 of the National Land Code, Before and After Boonsom Boonyanit.
[2008] 1 MLJ lxxii.
Joshua Kevin Sathiaseelan (2006) Prinsip-prinsip Penting Perundangan Tanah di Malaysia.
Lexis Nexis, Malaysia. Noraida Harun, Jady@Zaidi Hassim dan Noor ‗Ashikin Hamid, Penipuan, Rasuah dan
Pencurian Maklumat dalam Urus Niaga Tanah: Cabaran dan Penyelesaian, [2013] 25
KANUN (2), 160.
Ridzuan Awang (1994) Undang-undang Tanah Islam; Pendekatan Perbandingan. Dewan Bahasa dan Pustaka, Kuala Lumpur.
Salleh Buang (1993) Undang-undang Tanah di Malaysia. Dewan Bahasa dan Pustaka, Kuala Lumpur.
Salleh Buang (2007) Malaysian Torrens System. Second Edition, Dewan Bahasa dan Pustaka,
Kuala Lumpur.
Teo Keang Sood, Khaw Lake Tee (1995) Land Law in Malaysia, Cases and Commentar.
Second Edition, Butterworths Asia, Malaysia.
Journal of Management & Muamalah, Vol. 6, No. 2, 2016
eISSN 2180-1681
14
Teo Keang Sood (2004) Demise of Deferred Indefeasibility under the Malaysian Torrens
System? Infoline. SENARAI KES
Adorna Properties Sdn. Bhd v Boonsom Boonyanit [2001] 2 CLJ 133 Assets Co v Mere Roihi [1905] AC 176
Datuk Jaginder Singh v Tara Rajaratnam [1983] 2 MLJ 196 Gibbs V Messer [1891] A.C. 248 Haji Aishah v Yah binti Taib (1949) 15 MLJ 128
OCBC Bank (M) Bhd v Pendaftar Hak milik Negeri Johor Darul Takzim [1999] 2 MLJ 511 Ong Lock Choo v Quek Shin & Sons Ltd (1941) MLJ 88
Quah Hong Lian Neo v Seow Teong teck [1936] MLJ 203 Tai Lee Finance Co Sdn Bhd v Official Assignee & Ors [1983] 1 MLJ 81 Tan Ying Hong v Tan Sian San & Ors [2010] 2 MLJ 1
Teh Bee v K Maruthamuthu [1977] 2 MLJ 7 Waimiha Sawmilling Company Limited v Waione Timber Company Limited [1926] AC 101
Rabi’ah Muhammad Serji
Faculty of Islamic Study and Civilization
Selangor International Islamic University College SELANGOR, MALAYSIA [email protected]
Journal of Management & Muamalah, Vol. 6, No. 2, 2016
eISSN 2180-1681
15
Regulating Anti-Competitive Business Conduct via Competition
Law in Malaysia
(Mengawal Selia Tingkahlaku Perniagaan Anti Persaingan Melalui Undang-Undang
Persaingan di Malaysia)
Haliza A.Shukor Prof Dr Nazura Abdul Manap
Universiti Kebangsaan Malaysia
Selangor, Malaysia
ABSTRACT
The introduction of the competition law in Malaysia via Competition Act 2010 has brought a
tremendous shift in business practices. Common practice in businesses such as collusion to exploit quantity and price of goods in the market is no longer permitted with the coming into force the Competition Act 2010 in 2012. Hence, it is the aim of this paper to identify roles of
Malaysia competition law in regulating anti-competitive business conduct in Malaysia. The result indicated that while competition law in Malaysia plays its role in combating anti-
competitive business conduct, improvements of the provisions such as inclusion of specific merger provisions in the Competition Act 2010 and specific guidelines for intellectual property matters are needed in order to further support implementation of competition law in Malaysia.
This paper employs library based approach which collects data from statutes, decided cases, journals and books.
Keywords: Anti-Competitive Business Conduct, Competition Law, Competition Act 2010,
Competition Commission Act 2010
ABSTRAK
Pengenalan Undang-Undang Persaingan di Malaysia melalui Akta Persaingan 2010 membawa perubahan besar dalam amalan perniagaan. Amalan biasa dalam perniagaan
seperti pakatan sulit untuk mengeksploitasi kuantiti dan harga barangan di pasaran adalah tidak lagi dibenarkan dengan mula berkuatkuasanya Akta Persaingan 2010 pada tahun 2012.
Oleh itu, tujuan artikel ini ialah untuk mengenal pasti peranan Undang-Undang Persaingan di Malaysia dalam mengatur kelakuan perniagaan yang bersifat anti-persaingan. Hasilnya menunjukkan bahawa,walaupun Undang-Undang Persaingan di Malaysia memainkan peranan
dalam memerangi perlakuan perniagaan yang bersifat anti-persaingan, namun penambahbaikan peruntukan seperti kemasukan peruntukan khusus berkaitan penggabungan
dalam Akta Persaingan 2010 dan garis panduan khusus bagi perkara-perkara berkaitan harta intelek adalah diperlukan dalam usaha untuk terus menyokong pelaksanaan Undang-Undang Persaingan di Malaysia. Artikel ini menggunakan pendekatan kepustakaan yang mengumpul
data dari statut, kes-kes yang telah diputuskan, jurnal-jurnaldan buku-buku.
Kata kunci: Anti-persaingan, Undang-Undang Persaingan, Akta Persaingan 2010
Journal of Management & Muamalah, Vol. 6, No. 2, 2016
eISSN 2180-1681
16
INTRODUCTION Competition law concerns with practices that bring harm to the competitive process (Whish, R. 2009). Some of the practices which bring harm to the competitive process may include participating in agreements which have their objects or effects to restrict competition and
improper monopolist behavior in the market. Agreement between competitors who agree to group together with the objective to reduce competition in the market by either fixing prices or
sharing information may result to society losing the benefit from the competition law, simply because it will restrict the choice of prices for the same product and services from entrepreneurs.
Apart from that, for the purpose of protection or obtaining power in the market, monopolists tend to behave in such a way which may harm the competition process in the market. The aim to
obtain market power is evidenced when a dominant supplier in the market buys all raw materials in order to exclude his competitor which amounts to market foreclosure, resulting harm in the competition process.
Thus, this article attempts to discuss the roles of Malaysia competition law in regulating anti-
competitive behavior in business practices. The first part of this article highlights the meaning and types of anti-competitive practices, followed by a brief overview of competition law in Malaysia. This article will further provide discussion on the roles of competition law in
regulating business conducts and highlight several issues which may be relevant for consideration by the competition authority in order to encourage fair business practices in the
market.
ANTI-COMPETITIVE PRACTICES: ITS DEFINITION AND TYPES
Definition
Anti competitive practices or also known as restrictive business practices (Goode, W., 2007) refers to a wide range of business practices in which a firm or group of firms may engage in order to restrict inter-firm competition to maintain or increase their relative market position and
profits without necessarily providing goods and services at a lower cost or of higher quality (https://stats.oecd.org/glossary/detail).
Generally, anti-competitive practices relate to business practices which aim to restrict fair competition in the market for the purpose of maintaining market power. However, in
determining which types of business practices are considered as anti-competitive varies by jurisdictions because each jurisdiction sets its own legal criteria in determining anti-competitive
practices. Anti-competitive practices as indicated by the Competition Act 2010 refer to two kinds of conducts, which are participating in anti-competitive agreement and abuse of dominant position.
Types of anti-competitive practices
According to Walter Goode, competition law in most jurisdictions deals with the following kinds of firm behavior; horizontal arrangement, vertical arrangement, misuse of market power by monopolies and control of mergers and acquisitions (Goode, W., 2007). As such, it can be
Journal of Management & Muamalah, Vol. 6, No. 2, 2016
eISSN 2180-1681
17
said that anti-competitive practices commonly relate to three kinds of conducts namely, cartels
which may occur between firms operating at the same level of production (horizontal arrangement) or firms operating at a different level of production (vertical arrangement), abuse of dominant position by an enterprise which is dominant in the market and merger.
Cartels exist as a result of formal or informal agreement between firms which agree to manage
the markets in order to eliminate competition (Goode, W., 2007) while abuse of dominant position occurs when an enterprise which possesses the market power abuses its dominant position in the market by behaving in such a way which restrict competition in the market. For
example, limiting production in order to foreclose the market, refusal to deal or supply or excessive pricing.
On the other hand, mergers relate to combination of operations between two groups of companies. Mergers can take place via different ways such as horizontal mergers, vertical
mergers or conglomerate mergers. Horizontal mergers happen when two competing companies join together and vertical mergers refer to combination of two companies in which one of the
company is a supplier to the other. Another type of merger, known as the conglomerate merger occurs when two companies in different industries combine together (Mushera Ambaras Khan, 2013)
In Malaysia, the Competition Act 2010 includes only two kinds of anti-competitive practices
namely prohibition from participating in anti-competitive agreement and abuse of dominant position (Part II of the Competition Act 2010). These two conducts which are declared as anti-competitive demands fulfillment of several criteria under the Competition Act 2010 before
enterprises can be declared as engaging in anti-competitive practices. For example, under Section 4 (1) of the Competition Act 2010, it requires enterprises to engage in ―horizontal or
vertical agreement‖ which has ―the object or effect of significantly preventing, restricting or distorting competition in any market for goods or services.‖ On the other hand, an enterprise is regarded as abusing its dominant position in the market if the dominant enterprise carry its
conduct in any ways listed under Section 10(2)(a) – (g) of the Competition Act 2010, namely, imposition of unfair trading condition to suppliers or customers, limiting production, market
outlets, technological development or investment to the prejudice of consumers, refusal to supply to a particular enterprise, applying different conditions to equivalent transactions with other trading partners, tying or bundling, predatory pricing and market foreclosure.
Provisions relating to mergers are excluded from the Competition Act 2010 due to the needs to
―promote global corporate competition and to further strengthen the economy of Malaysia.‖ The decision to exclude mergers from the Competition Act 2010 was highlighted by the Minister, Dato‘ Sri Ismail Sabri bin Yaakob during the presentation of the competition bill after ―taking
into account views from various agencies such as Bank Negara Malaysia and Securities Commission Malaysia‖ (Penyata Rasmi Parlimen Dewan Rakyat, 20 April 2010).
Journal of Management & Muamalah, Vol. 6, No. 2, 2016
eISSN 2180-1681
18
COMPETITION LAW IN MALAYSIA The competition regulation in Malaysia was initially regulated by sectors - the energy and the communication sectors. The provisions relating to competition rules are incorporated in their respective legislations, indicating prohibitions relating to anti-competitive practices. For
example, the Communications and Multimedia Act 1998 prohibits a licensee from “engaging in any conduct which has the purpose of substantially lessening competition in a communications
market” (Section 133 of the Communications and Multimedia Act 1998) while Section 135 Communications and Multimedia Act 1998, prohibits a licensee from entering into any understanding, agreement or arrangement which provides for rate fixing, market sharing,
boycott of a supplier of apparatus or boycott of another competitor. On the other hand, the energy sector provides a general provision relating to competition which can be seen in Section
14(1) (h) of the Energy Commission Act 2001. Section 14(1) (h) of the Energy Commission Act 2001 gives power to the Energy Commission to “promote and safeguard competition and fair and efficient market conduct or, in the absence of a competitive market, to prevent the misuse of
monopoly or market power in respect of the generation, production, transmission, distribution and supply of electricity and the supply of gas through pipelines.” It is pertinent to note that,
although competition law has been regulated by the abovementioned sectors, it does not cover other kinds of commercial activities.
Hence, a bill known as Fair Trade Practices Bill was introduced and approved on the 26th of October 2005 in the Parliament, the purpose of which is to accommodate the growth of trade
and business and encourage fair competition in business. The Fair Trade Policy seeks to accomplish several policy objectives which, among others include; to promote and protect market competition, produce active and competitive entrepreneurs, create fair and competitive
market prospects as well as to hinder anti-competitive practices that affect domestic market in order to prevent unjust trade practices.
Competition laws in Malaysia refer to the following; the Competition Act 2010 and the Competition Commission Act 2010 including any subsidiary legislation made under the
abovementioned laws (Section 2 of the Competition Commission Act 2010). The Competition Act 2010 mainly consists of provisions relating to the application of competition law in
Malaysia. The Competition Act 2010 mainly highlights the coverage of the Competition Act 2010 including commercial practices prohibited by the competition law, procedures relating to investigation, imposition of penalty and appeal procedures.
On the other hand, the Competition Commission Act 2010 provides provisions relating to the
establishments, powers and functions of the MyCC as well as other matters connected therewith. In brief, the Competition Commission Act 2010 elaborates on the establishment of the MyCC including the functions and powers of the MyCC as well the financial aspect of the MyCC such
as establishments of the Competition Commission Fund and the management of the fund.
Apart from the abovementioned legislations on competition law, it is also worth mentioning that the application of the competition laws in Malaysia is assisted by soft laws, which takes the form of guidelines. At present, the guidelines issued by the competition authority in Malaysia
Journal of Management & Muamalah, Vol. 6, No. 2, 2016
eISSN 2180-1681
19
are Guidelines on Leniency Regime, Guidelines on Financial Penalties, Guidelines on the
Market Definition, Guidelines on Complaints Procedures, Guidelines on Abuse of Dominant Position and Guidelines on Anti-Competitive Agreement. These guidelines are general in nature, applicable to all commercial activities, their main function being to provide clarification relating
to existing provisions in the Competition Act 2010 for the purpose of implementing and deciding issues in competition law.
ROLES OF MALAYSIA COMPETITION LAW IN REGULATING ANTI-
COMPETITIVE BUSINESS PRACTICES The roles of competition law varies depending on the aims and objectives of the competition
law in a particular jurisdiction. In relation to Malaysia, the primary objectives of the competition law can be deduced from the preamble of the Competition Act 2010 which provides for the promotion of economic development and protection of consumer‘s interest. The
Competition Act 2010 further provides that, for the purpose of promoting economic growth, the process of competition is to be protected because such process encourages efficiency,
innovation and entrepreneurship which will promote competitive prices, improvement in the quality of products and services as well as serving wider choices for consumers (Preamble of the Competition Act 2010).
The application of the Competition Act 2010 covers all commercial activities within and outside
Malaysia regardless of the status of the entity that carries them out. This is an indication that associations, government-linked companies (GLCs) as well as SMEs are not excluded from the coverage of Competition Act 2010 as expressly provided under Section 3 of the Competition
Act 2010. By virtue of Section 3(4) of the Competition Act 2010, commercial activity refers to ―any activity of a commercial nature‖ but does not include activities authorized by the
government whether direct or indirect, activities which are based on solidarity principles and purchase and offering of goods and services which are not part of any economic activity.
The discussion below attempts to highlight the roles of competition law in regulating anti-competitive business practices.
(i) Preventing collusion in the market under Section 4 of the Competition Act 2010
In order to prevent collusion in the market, Section 4(1) of the Competition Act 2010 prohibits enterprises from participating in horizontal or vertical agreement which has the object or effect
of significantly preventing, restricting or distorting competition in any market for goods or services. The term ‗enterprise‘ as referred to in Section 4 (1) of the Competition Act 2010 means ‗any entity carrying on commercial activities relating to goods or services‘. The term
‗agreement‘ as employed by Section 4(1) of the Competition Act 2010 refers to the following: any form of contract, arrangement or understanding, whether or not legally enforceable and
includes a decision by an association and concerted practices. The term ‗concerted practice‘ refers to secret co-operation made among enterprises, usually between competitors. Section 2 of the CA 2010 elaborates the meaning of ‗concerted practice‘:
Journal of Management & Muamalah, Vol. 6, No. 2, 2016
eISSN 2180-1681
20
any form of coordination between enterprises which knowingly substitutes practical
co-operation between them for the risks of competition and includes any practice which involves direct or indirect contact or communication between enterprises, the object or effect of which is either—
(a) to influence the conduct of one or more enterprises in a market; or
(b) to disclose the course of conduct which an enterprise has decided to adopt or is contemplating to adopt in a market,
in circumstances where such disclosure would not have been made under normal conditions of competition.
It is therefore submitted that the usage of the term ‗agreement‘ under the Competition Act 2010 is broad. The inclusion of contract under the term ‗agreement‘ signifies that it may be a written
or unwritten agreement since contract may exist regardless whether it is made orally or in writing. Other conducts such as arrangement, understanding, decisions by associations as well as
secret cooperation indicate that informal arrangements are not excluded from the ambit of ‗agreement‘ under the Competition Act 2010. Further, the Competition Act 2010 expressly mentions that contract, arrangement and understanding need not be legally enforceable in order
to fall within the meaning of ‗agreement‘ under the Section 2 of the Competition Act 2010.
Section 4(1) of the Competition Act 2010 expressly provides that agreements which have the object or effect of significantly preventing, restricting or distorting competition in any market for goods or services are prohibited, regardless whether such agreement is horizontal or vertical.
Horizontal agreement is agreement between enterprises operating at the same level of production. In contrast, vertical agreements refer to agreement concluded between enterprises
functioning at different levels of production.
The significant role of competition law in combating collusion in the market can be seen when the Competition Act 2010 declares that horizontal agreement whose objectives are either to fix price, to allocate markets between competitors, to limit or control production and bid rigging as
anti-competitive. Some of the instances in which this provision is violated can be seen when entrepreneurs agree among themselves to enter into price fixing agreement. As in the case
involving four container depot operators and an information technology service provider, the MyCC was of the opinion that these entrepreneurs engaged in price fixing which may result to financial penalty (Case Number: MyCC.700.2.005.2013).
Although scholars such as Mark Furse suggests that horizontal agreement is prone to distort
competition in the market rather than vertical agreement (Furse,M, 2008), vertical agreement is not excluded from the provision of anti-competitive agreement under the Competition Act 2010.
In fact, it is also recognized by the Malaysia Guidelines on Chapter 1 Prohibition under paragraph 3.11 which expressly provides that ‗vertical agreements in general are less harmful to competition than horizontal agreements‘. According to Tilottama Raychaudhuri, vertical
agreement may to a certain extent be anti-competitive when the firm imposing a vertical restraint
Journal of Management & Muamalah, Vol. 6, No. 2, 2016
eISSN 2180-1681
21
possesses market power which will consequently limit competition from other firms products.
For example, in an exclusive supply agreement, a manufacturer usually restricts distributors from acquiring products from other manufacturers. This kind of restriction might harm competition in the market because of its ability to foreclose the market and encourage collusion (Tilottama
Raychaudhuri, 2011).
This may be the reason why vertical agreement is included in the prohibition under Section 4(1)
of the Competition Act 2010. However, the determination of whether vertical agreement is anti-competitive is rather flexible since it employs rule or reason approach. In contrast, assessment of horizontal agreement is based on the deeming provision under Section 4(2) of the Competition
Act 2010, commonly known as per se rule. Once a horizontal agreement contains objects indicated under Section 4(2) of the Competition Act 2010, it is highly regarded as anti-
competitive. (ii) Preventing abuse of market power under Section 10 of the Competition Act 2010
Abuse of dominant position is another restriction provided in the Competition Act 2010 which
aims to control enterprises from abusing their dominant position in the market. Dominant position occurs when ―one or more enterprises possess such significant power in a market‖ so as to enable them to ―adjust prices or outputs or trading terms, without effective constraint from
competitors or potential competitors.‖ The above definition on dominant position as referred to by the Competition Act 2010 suggests that it does not prohibit entrepreneurs from possessing
dominant positions in the market. This is supported by the provision in Section 10 (1) of the Competition Act 2010 which provides that only those dominant enterprises which engage in conducts listed under Section 10(2) (a) to (g) would amount to abuse of dominant position.
Section 10(2) (a)-(g) of the CA 2010 provides a non-exhaustive list of abusive behavior by
dominant position which include excessive pricing, market foreclosure, refusal to deal or license, tying and bundling, and predatory pricing. Excessive pricing relates to a situation in which entrepreneurs would raise prices by restricting output. As a result, consumers who
purchase the goods would have to pay more due to the absence of competitive condition (Graham,C, 2013). Market foreclosure occurs when a supplier who is in a dominant position
buys all raw materials in order to exclude his competitor from the market while refusal to deal may occur when entrepreneurs set unacceptably high price in order to refuse request of supply (Liyang Hou, 2011).
Tying, on the other hand refers to a situation where the customer is forced to buy a second
product from the seller, failing which the seller would refuse to sell the first product to the customer while predatory pricing refers to entrepreneurs who excludes rivals from the market by setting prices below cost.
Recent examples can be seen in the case where MyCC proposed to impose financial penalty to
My EG Services Bhd (MyEG) for infringing Section 10 of the Competition Act 2010.
Journal of Management & Muamalah, Vol. 6, No. 2, 2016
eISSN 2180-1681
22
According to MyCC, MyEG contravenes Section 10 (2) of the Competition Act 2010 by
applying different conditions to equivalent transactions with other trading parties to the extent that may harm competition (Case Number: MyCC (ED) 700-1/1/2/2015).
Enforcement of provisions of the Competition Act 2010
The MyCC is an independent body under the Ministry of Domestic Trade, Co-operatives and Consumerism whose function is to enforce provisions contained in the Competition Act 2010. At present, the chairperson of the MyCC is YBhg Tan Sri Dato‘ Seri Siti Norma Yaakob who
was formerly a Chief Judge of Malaysia. The MyCC consists of a Chairman, four representatives from the government and three to five members made up of those
knowledgeable in commerce (Section 5 of the Competition Commission Act 2010). MyCC is vested with powers to enforce competition law (Section 16(d) of the Competition
Commission Act 2010) including imposition of penalty for infringement of competition law provisions ( Section 17(2)(b) of the Competition Commission Act 2010 ), organizing competition
law awareness programs among the public (Section 16(i) (j) of the Competition Commission Act 2010 )giving advices and alert the Minister in matters relevant to competition law especially when dealing with international agreements (Section 16(a),(b),(k) of the Competition
Commission Act 2010), perform studies in relation to issues relevant for competition law in Malaysia (Section 16(g) of the Competition Commission Act 2010) and to act as an advocate for
competition matters under Section 16(f) of the Competition Commission Act 2010. Enforcement of competition law in Malaysia takes two approaches, namely soft and hard
approaches. Soft approach refers to enforcement of competition law by the MyCC without imposing financial penalty to infringers. For example, the case of Cameron Highland
Floriculturist Association (CHFA) which was the earliest case decided by the MyCC relating to infringement of Section 4 (2) (a) of the Competition Act 2010 on price fixing. In that case, the MyCC decided that no financial penalty will be imposed to CHFA because the competition law
at that time was still in its infancy. Hence, the MyCC decided that stern warnings and advises to CHFA were sufficient to educate CHFA to comply with the competition rules. The MyCC
required the CHFA to perform the following act: to cease and stop the act of fixing prices of flowers; to provide responsibility on its members to refrain from any anti-competitive practices in the relevant market and to publish the remedial actions taken by them in the mainstream
newspapers (Case Number: MyCC/0003/2012(ACA).
On the other hand, hard approach takes place when the MyCC imposes financial penalty to infringers such as the case of ice manufacturers who agree among themselves to increase the
price of ice cubes. Their agreement to raise the price of ice cubes was published in the local newspapers. After due investigation by the MyCC, it was decided that the ice manufacturers
infringed Section 4(2)(a) of the Competition Act 2010 which resulted in financial penalty imposed by the MyCC (Case Number: MyCC.700.2.0001.2014).
Journal of Management & Muamalah, Vol. 6, No. 2, 2016
eISSN 2180-1681
23
Apart from that, the MyCC may accept undertaking from enterprises subject to the conditions
imposed by the MyCC. This is expressly provided under Section 43(1) of the Competition Act 2010. In the event the MyCC accepts an undertaking from enterprises in relation to an infringement, such enterprises will not be imposed financial penalty and the investigation will
be closed. Examples are cases involving Barbers Association (MIHSOA) and Malaysia Lorry Owners Association (PMLOA). The Chairman of Barbers Association issued media statement
relating to increase in the price of haircut. The Chairman of the Association further warns that members of the Association who fail to follow the decision will be taken action upon by the Association (http://www.mycc.gov.my/sites/default/files/Undertaking-Barbers.pdf). Similarly,
in the case involving Malaysia Lorry Owners Association (PMLOA) who agrees to fix transport charges for lorry services indicates violation of Section 4(2)(a) of the Competition Act 2010
(http://www.mycc.gov.my/sites/default/files/Undertaking-PMLOA.pdf). In both cases, the MIHSOA and PMLOA provide undertakings not to proceed with their decision to fix prices and directed their members to cease and desist from further implementing the decision. Their
undertakings have been accepted by the MyCC in accordance with Section 43 of the Competition Act 2010.
CHALLENGES AHEAD The coming into force of the Competition Act 2010 in Malaysia is seen as a step towards promoting fair competition in the market. The Competition Act 2010 is a comprehensive
legislation since it contains common provisions relating to anti-competitive practices whose purpose is to act as a legal mechanism in combating unfair business behavior in the market.
Nevertheless, there are few issues that need to be observed by the Malaysia competition authority in order to ensure competition law can be implemented effectively in Malaysia. The issues are as follows:
(i) Issues relating to mergers
Since there is absence of specific provisions controlling mergers and acquisitions under the Competition Act 2010, it indicates that there is a lack of a comprehensive regime regulating
anti-competitive mergers and acquisitions in Malaysia. At present, mergers and acquisitions in Malaysia are regulated by sectors such as Bank Negara Malaysia, Malaysia Communication and
Multimedia Commission and Energy Commission. Takeovers and mergers may infringe the competition law especially when parties in horizontal mergers decide to share information such as pricing information with competitors. Another
instance is when the merger has taken place, there is a risk of abuse of dominant position in the market because combination of two companies in the market would result in a dominant
position which may lead to abuse of dominant position and cartel. (ii) Issues relating to intellectual property
Intellectual property becomes part of the discussion under competition law when intellectual
property holders engage in practices not authorized by intellectual property law but seem to have
Journal of Management & Muamalah, Vol. 6, No. 2, 2016
eISSN 2180-1681
24
anti competitive effects (Hovenkamp, H.J., 2008). The main concern relating to intellectual
property is due to the fact that intellectual property is governed by laws relating to intellectual property, while the manner in which such intellectual property is to be exercised may be subject to competition law observation. Competition authority should be careful when dealing with
intellectual property matters because too strict assessment of competition law in intellectual property matters may restrict innovation.
Examples of intellectual property issue which falls within the ambit of competition law is when
intellectual property owners enter into licensing agreement. Some intellectual property licensing agreement has the possibility to create dominant market power and foreclose the market from
competitors. Other situations such as contractual restrictions contained in the intellectual property licensing agreement may be used to cover market sharing agreements which is prohibited under the competition law (Anderman, D.S. & Schmidt,H., 2009).
The current situation requires issues relating to intellectual property to be dealt by using the
provisions contained in the Competition Act 2010 and the existing general guidelines. However, based on Paragraph 4 of the Guidelines on Chapter 1 Prohibition, the MyCC endeavor to issue a separate guideline in near future to deal with intellectual property matters.
CONCLUSION AND RECOMMENDATION The foregoing discussion showed significant roles of Malaysia competition law in regulating
business conduct namely, prohibiting business operators from participating in anti-competitive practices, prevention of abuse of dominant position by dominant business
operators in the market and enforcement of competition law by a specific body regulating competition law in Malaysia, which is the MyCC.
However, specific provisions relating to mergers in the Competition Act 2010 are yet to be incorporated in the Competition Act 2010. Taking into consideration the possibilities of
infringement of competition law in the event mergers takes place, it is suggested that provisions relating to mergers be incorporated in the Competition Act 2010 so as to prevent abuse of dominant position in the market.
Another area of concern is relating to implementation of competition law in intellectual
property matters. Although the Competition Act 2010 provides provisions relating to conducts condemned by the competition law, the provisions and guidelines contain general application, which applies to all kinds of commercial activity. In the field of intellectual
property, it is suggested that specific guidelines would be helpful because guideline is able to provide a framework which can be used by the competition authority in deciding issues relating
to intellectual property (Carrier, M.A., 2002). Further, as practiced in Europe and United States of America, the existence of a specific guideline relating to intellectual property provides additional assistance to the competition authority as well as illustrative examples to solve arising
Journal of Management & Muamalah, Vol. 6, No. 2, 2016
eISSN 2180-1681
25
issues relating to intellectual property and competition law. As for Malaysia, the specific
guideline for intellectual property will serve as a guide to the MyCC in solving issues on competition law related to intellectual property.
REFERENCES
Anderman, D.S & Schmidt, H. (2009). EC Competition Law and IPRS in The Interface between Intellectual Property Rights and Competition Policy. United Kingdom: Cambridge University.
Carrier, M.A. (2002). Unraveling the Patent-Antitrust Paradox. University of Pennsylvania Law
Review, 150(3), 761-854. Decision of Competition Commission. (30 January 2015). Infringement of Section 4(2)(a) of the
Competition Act 2010 by TwentyFour (24) Ice Manufacturers of Kuala Lumpur, Selangor, and Putrajaya (No. MyCC.700.2.0001.2014) . Retrieved from
http://www.mycc.gov.my/sites/default/files/24IceManufacturers.pdf Decision of the Competition Commission. (24 June 2016). Infringement of section 10 of the
Competition Act 2010 by My E.G. Services Berhad (MyCC File Reference: MyCC (ED) 700-1/1/2/2015). Retrieved from http://www.mycc.gov.my/sites/default/files/Section-40-
Notice-of-Finding-of-an-Infringement-by-My-Services-Berhad.pdf Decision of the Competition Commission. (1 June 2016). Infringement of section 4(1) and 2(a)
of the Competition Act 2010 by Containerchain ( Malaysia) Sdn Bhd, AYZA Industries Sdn Bhd, ICS Depot Services Sdn Bhd, E.A.E. Depot & Freight Forwarding Sdn Bhd,
Prompt Dynamics Sdn Bhd.(MyCC File Reference: MyCC (ED) 700.2.005.2013). Retrieved from http://www.mycc.gov.my/legislation/case
Decision of the Competition Commission. (6 December 2012). MyCC/0003/2012(ACA). Retrieved from
http://www.mycc.gov.my/sites/default/files/CameronHighlandsFloriculturistAssociation.pdf
Furse, M. (2008). Competition Law of the EC and UK. Sixth Edition. United States: Oxford University Press.
Goode,W. (2007). Dictionary of Trade Policy Terms. Fifth Edition. United Kingdom:Cambridge
University Press.
Graham,C. (2013). EU & UK Competition Law. United Kingdom: Pearson.
Hovenkamp, J,H. (2008). The Intellectual Property-Antitrust Interface. University of Iowa Legal
Studies Research Paper. University of Iowa, 1979-2006.
Journal of Management & Muamalah, Vol. 6, No. 2, 2016
eISSN 2180-1681
26
Liyang Hou. (2011). Excessive Prices within EU Competition Law. European Competition Journal, 7, 47-70.
Musheera Ambaras Khan. (2013). A Guide to Malaysian Takeovers and Mergers Law. Malaysia: Sweet & Maxwell Asia.
OECD Glossary of statistical terms. Retrieved from https://stats.oecd.org/glossary/detail. Parlimen Malaysia. ( 20 April 2010). Penyata Rasmi Parlimen Dewan Rakyat. Retrieved
from http://www.parlimen.gov.my/hansard-dewan-rakyat.
Tilottama Raychaudhuri. (2011). Vertical restraints in Competition Law: The Need to Strike the Right Balance Between Regulation And Competition. NUJS Law Review, 4, 609-624.
Undertaking by the Malaysia Indian Hairdressing Saloon Owners Association. (2014).
Retrieved from http://www.mycc.gov.my/sites/default/files/Undertaking-Barbers.pdf. Undertaking by the Pan Malaysia Lorry Owners Association. (2014). MyCC Reference
Number 700.2.0036.2013. Retrieved from http://www.mycc.gov.my/sites/default/files/Undertaking-PMLOA.pdf.
Whish, R. (2009). Competition Law. New York: Oxford University Press.
STATUTES
Competition Act 2010 ( Act 712).
Competition Commission Act 2010 (Act 713). Communications and Multimedia Act 1998 (Act 588). Energy Commission Act 2001 ( Act 610).
Haliza A.Shukor
Faculty of Syariah & Law
Universiti Sains Islam Malaysia [email protected]
Prof Dr Nazura Abdul Manap
Faculty of Law
Universiti Kebangsaan Malaysia [email protected]
Journal of Management & Muamalah, Vol. 6, No. 2, 2016
eISSN 2180-1681
27
Effect Of Receivables Turnover To Profitability
Pt. Bii Finance Center Period 2010-2014
(Kesan Pusingganti Belum terima Keatas Keuntungan Pt. Pusat Kewangan Tempoh 2010-2014)
Fia Dialysa
Sekolah Tinggi Ilmu Ekonomi (STIE) EKUITAS
Bandung, Indonesia
ABSTRACT
Globalization encourages all parties to survive in the increasingly fierce competition and
business activity demanding high mobility of the business people. Society requires excess funds in order to turn around its business well. Non-bank financial institution is an alternative choice to provide funds for the community (Presidential Decree No. 61/1988 and Presidential Decree No.
9/2009). Healthy financial institutions are important in supporting the National economy (Ministry Decree No. 84/ PMK.012/2006 & Regulation FSA/POJK.05/2014). Leasing is a non-
bank financial institution that are needed at this time where the demand for vehicles is high because people mobility is increasing. The purpose of this study is to determine the effect of receivables turnover to profitability of PT. BII Finance Center in the period of 2010-2014. This
quantitative research uses simple linear regression analysis techniques with normality test, autocorrelation test, heteroscedasticity test, correlation coefficient, coefficient of determination
and t test. The method used is descriptive and verification, with data technique accumulation by documentary study and literature study. The data obtained are secondary data derived from the financial statements PT. BII Finance Center period of 2010-2014. The results of this study
indicate that Receivables Turnover has no significant effect to Profitability (ROA).
Keywords: Receivables Turnover; Profitability; Pt.Bii Finance Center
ABSTRAK
Globalisasi menggalakkan semua pihak untuk terus bertahan dalam persekitaran yang mana persaingan semakin meningkat dan permintaan yang tinggi terhadap aktiviti perniagaan
menuntut mobiliti tinggi dari ahli perniagaan. Masyarakat memerlukan lebihan dana bagi memastikan perniagaan mereka berjalan dengan baik. Institusi kewangan bukan bank adalah merupakan alternatif bagi menyediakan dana kepada masyarakat (Presidential Decree No.
61/1988 and Presidential Decree No. 9/2009). Institusi kewangan yang kukuh adalah penting dalam menyokong Ekonomi Nasional (Ministry Decree No. 84/ PMK.012/2006 & Regulation
FSA/POJK.05/2014). Pajakan adalah merupakan Institusi kewangan bukan bank yang diperlukan pada masa sekarang yang mana permintaan bagi kenderaan adalah tinggi disebabkan oleh mobiliti manusia semakin meningkat. Tujuan kajian ini dilakukan adalah untuk
menentukan kesan pusingganti belum terima terhadap keuntungan PT. BII Pusat kewangan dalam tempoh 2010-2014. Kaedah penyelidikan kuantitatif menggunakan teknik analisa regresi
linear mudah dengan ujian normaliti, penentuan „coefficient‟ dan ujian t. Kaedah yang
Journal of Management & Muamalah, Vol. 6, No. 2, 2016
eISSN 2180-1681
28
digunakan adalah deskriptif dan verifikasi, dengan teknik pengumpulan data melalui kajian
dokumentari dan kajian lepas. Data diperolehi dari data sekunder yang diperolehi daripada penyata kewangan PT. BII Pusat kewangan bagi tempoh 2010-2014. Hasil kajian mendapati bahawa pusingganti belum terima tidak memberi kesan signifikan keatas keuntungan (ROA).
Kata kunci: Pusingganti belum terima, keuntungan PT, pusat kewanganility Bii
INTRODUCTION
The economic crisis that occurs in Indonesia today, marks high economic competitiveness (the
era of free markets), political instability of economic conditions and commodity prices rising in the market, one of which is the economic crisis that occurred in China. According to CNBC sources on Friday (01/22/2016), China used its huge debts to stimulate economic growth in the
financial crisis. As a result, the burden of debt in local currency of each country continues to rise in the economic slowdown of countries with low economy.
The company as an economic builder also improved their business strategies to survive and help recover the national economic crisis, one of which is finance companies (leasing). Leasing as
one of the non-bank financial institutions showed uniquely ―no down payment‖. Financing can be granted up to 100% (full payout), which will help cash flow, especially for companies (lessee)
newly established or operating and growing company. Consumer finance in leasing becomes very important for a company because it can help them to increase sales of products or services.
Moreover, it is becoming important also for consumers because the consumer finance companies can help consumers to buy goods or services on credit.
Consumer financing is one of the formal financial institutions in Indonesia which is still relatively new. These institutions grow and develop along with the issuance of legal institutions
in the form of Decree (68/1988). Thus, now the existence of consumer finance shows a very good development. The rapid growth of the consumer finance business once again shows the
high public interest to buy charcoal-goods in installments along with the increasing living standard of the middle and lower layers. The development of consumer finance is also due to the constraints for low income people to access funds from other sources.
There are four reasons that encourage the development of consumer finance, namely: (1) Limited
formal financial resources (2) Difficulties in developing credit unions (3) Banks do not serve the consumer finance (4) Funding from moneylenders. Following the trend of the automotive industry, consumer finance business line of motor vehicle finance portfolio recorded a decrease
in finance receivables in the first quarter of 2015. Based on data from the Financial Services Authority cited Business (19.05.2015), consumer financing receivables in January-March
continued to fall despite the decline in numbers is still conservative. In detail, the decline in consumer financing receivables fell to 0.15% from Rp 246,54 trillion to Rp 246,16 trillion in February 2015. In March, receivables refinancing sagged a little in the position of Rp 246,14
Journal of Management & Muamalah, Vol. 6, No. 2, 2016
eISSN 2180-1681
29
trillion. A national wholesale sales of new motorcycles decreased 19% to 1.6 million units in the
first quarter of 2015, from the previous 2 million units in the same period in 2014. National sales of new cars also declined 14% to 282,000 units from 328,000 units in the first quarter of 2014. Not long ago, the Association of Indonesian Automotive Industries (Gaikindo) revised its car
sales target of 1.2 million units to 1.1 million units by the year's end. Nevertheless, consumer financing receivables still grew 7.13% over the same period last year amounting to Rp 229,742
trillion. In total, financing receivables in the first quarter of 2015 reached only Rp 369,8 trillion, an increase of 4.93% from the previous Rp 352,4 trillion.
Companies must be concerned with their financial condition and financial position effectively and efficiently.
-Ambarita (2009), Economics Now the company changed their strategy of cash to credit to increase the company profit. Credit
sales will cause receivables for the company. Receivables should be maintained as much as possible because they involve the risk of bad debts and risks of the embedded unproductive
capital due to late payment. Costs and risks of the receivables will increase in line with a growing volume of credit sales. Profit is an important element as one of the goals of the company. Financial ratios are commonly used to analyze it. This study uses the ratio Return on
Assets (ROA), as ROA is the ratio that indicates the efficiency for the company to manage all assets. ROA measures the rate of returns on total assets after interest expense and taxes.
LITERATURE REVIEW Return on Assets (ROA) is the company's financial ratios related to the profitability of the
company‟s ability to produce profit or the profit on the level of income, assets and certain share capital. By knowing the ROA, we can assess whether the company has been efficient in using its
assets in operating activities for generating profits -Hanafi & Halim (2003: 27), Economics
ROA is the ratio used to measure the net benefits derived from the use of the asset. In other words, the higher the ratio, the better the productivity of assets in net profit. This will further
enhance the company's attractiveness to investors. Increased attractiveness of the company will make the company more attractive to investors, because the rate of returns or dividend will be even greater. It will also have an impact on stock prices of these companies in the capital market
which will increase so that the ROA will affect the company's stock price. ROA figures can be good if more than 2%.
-Lestari & Sugiharto (2007: 196), Economics Definition of a finance company regulated in the Finance Minister Regulation No.84/PMK.012/
2006 on the financing company, in Article 1 letter (b) states that the financing company is an entity outside the bank and non-bank financial institutions specially set up to carry out the
activities included in the business of financial institutions. In Article 2 of the Minister of Finance Regulation No.84/PMK.012/2006 finance companies, notes that the shape of the business

Journal of Management & Muamalah, Vol. 6, No. 2, 2016
eISSN 2180-1681
30
activities of the company financing, among others: leasing, factoring, credit card, business and
consumer finance. There are two forms of leasing : (1) Finance Lease, which is an activity undertaken between the
lessor (owner of capital goods) and the tenant (lessee), whereby the lessee will have the right to be able to buy goods that use leasing in accordance with the rest of the agreement at the end of
contract. In other words, the ownership status of the goods can later be changed at the end of the contractual agreement. In this system, there are two types of contracts, the contract lease and purchase contract. (2) Operating Lease, which is an activity undertaken between the lessor with
the lessee, whereby the lessee at the end of the contract will not have the option to purchase goods that are leased. In other words, the lessee only benefit from the rented items only, while
the status of ownership of the goods remains with the property of the lessor. There are three parties involved in a transaction of Consumer financing: (1) The finance
company or creditors, (2) The consumer or debtor (3) The supplier. The mechanism of consumer financing transactions are: (a) Petition Phase. Consumer financing request is usually made by
consumers at the domicile of the supplier or dealer or provider of consumer goods. The supplier or dealer usually teams up with consumer finance companies (b) Stage checks and field inspections. Based on the application the applicant, the consumer finance company will check
the correctness of filling of the application form with the analysis and evaluation of the data and information that has been received. Then the following is performed: 1) Visit the place of
potential consumers (plant visit) 2) Checking elsewhere (credit checking) 3) Do the observation in general or special.
Some of the benefits that can be obtained from the process of leasing financing include: (a) savings capital, (b) profit from the effects of inflation, (c) as medium-term and long-term credit
facilities, (d) easy documentation process, (e) cash flow into a profit, and (f) the project can be financed on a large scale.
Credit sales transactions are generally referred to receivables Receivables cover all claims in the form of money to other parties, including individuals, corporations, or other organizations. -
Warren et.all (2008: 356), Economics
The main activity of the company's financing is the provision of consumer financing for the
procurement of goods based on the needs of consumers with payment in installments or on credit. Previously the focus of the activities of finance companies which only focused on the
financing of transport is now developing the purposes of the office, manufacturing, property, construction and agriculture.
The increasing rate of the transport sector adversely impacts the provision of funds for financing auto loans for both two wheels and four wheels. Credit sales will certainly give rise to
receivables financing. -Wijaya (2011), Economics

Journal of Management & Muamalah, Vol. 6, No. 2, 2016
eISSN 2180-1681
31
One of the assets that must be protected at the financing company is consumer finance
receivables, because the continuity of the company's business is highly dependent on the receivables. If the finance receivables are collectible as well, then the company's activities are not disrupted.
-Nurcholisa (2011), Economics
This receivable is related to working capital and the profitability of the company. Asset or assets are understood as a total treasure. But usually for the purposes of analysis, they are broken down into several categories, such as: Current assets, Long term investment, fixed assets, Intangible
assets, deferred tax assets, and Other assets. The list of assets or assets in the balance sheet is prepared in accordance with the liquidity level, ranging from the most liquid to illiquid. Credit
sales system of the company is one of the company's businesses in order to increase sales volume. In addition to the large number of accounts, the speed of the return of accounts receivable into cash also determines the amount of the company's profitability (how well the
company manages assets). Free settlement of accounts receivable into cash is called the accounts receivable turnover. Receivables turnover is not only used to assess a company's ability to
manage accounts efficiently but can also be used as a medium for improving the company's profitability.
PT. BII Finance Center is a subsidiary of PT Bank Internasional Indonesia Tbk (BII) with 99.99% ownership. The ultimate shareholder of BII is Malayan Banking Berhad (Maybank),
which is a bank based in Malaysia. The company obtained its license as a financing institution based on the Decision Letter of the Ministry of Finance of the Republic of Indonesia No. 888/KMK.013/1991 dated August 22, 1991, that has been amended with the Decision Letter of
the Ministry of Finance of the Republic of Indonesia No. KEP- 237/KM.5/2005 dated August 4,
2005. The scope of the Company‘s activities covers leasing, factoring, credit card, consumer financing, and financing activities are based on sharia principles.
The company is included in the consumer finance types which are not related to ownership with
suppliers. Stages of the process are: (1) Leasing agreement, purchase agreements vehicles financed by consumer finance companies and financing agreements vehicle purchases from the dealer to the consumer (2) The cash payment by leasing vehicles (3) The delivery of vehicles by
dealers (4) Payment in full up during a certain period to leasing.
The types of assets contained in the PT. BII Finance Center are: (1) Cash on banks and in banks (2) Investment in finance leases (3) Consumer financing receivables (4) Other receivables (5) Prepaid expenses (6) In deferred tax assets (net) (7) Fixed assets and (8) Other assets.
Transactions that affect assets: the purchase of property/assets in cash, the purchase of
property/assets on credit, sales of assets/assets in cash, and sales of assets/assets on credit.
Journal of Management & Muamalah, Vol. 6, No. 2, 2016
eISSN 2180-1681
32
Accounts receivable, an element of working capital is also always in a state of rotating
continuously in chains working capital turnover, namely: Cash Inventory Accounts receivable Cash The greater the amount of receivables of a company, the greater is the risk, but going along with it can also increase the profitability.
-Bambang .R.J (2008:85), Economics
Receivables are the company's claims on money, goods or services to others as a result of past transactions.
-Rudianto (2009:224), Economics
At the PT. BII Finance Center, the receivables are included in consumer financing receivables.
Consumer financing receivables include receivables (leasing) arising from those sales of goods on the delivery of services in the normal business of the company. Consumer financing receivable is part of the working capital which is always in a state of spin, meaning that
receivables will be collectible at any given moment and will arise again as a result of the sale. The accounts receivable turnover period depends on the length of the short time loan payments.
If the loan period is longer, it means that the receivables will be longer too in working capital and the receivables turnover rate in the period will get smaller.
The higher (turnover) shows the working capital invested in receivables is low, otherwise if the ratio is lower, it means no over-investment in accounts that require further analysis, probably
because part of the credit and collection work is not effective or there may be changes in the wisdom of lending.
-Munawir (2010), Economics
Profitability is the ability of the company to make a profit in relation to sales, total assets and
own capital. -Santoso(2008), Econom Profitability is the company's ability to generate profits and measure the level of operational efficiency and the efficiency in using the possessions.
-Chen (2005), Economics This study uses ROA.
ROA is the ability to generate profit from total assets owned by the company at a certain period. If ROA is high, this shows the better performance of the company, if the level of return is higher.
-Suad Husnan (2008), Economics
METHODOLOGY
The documents that involeved of this research are financial statements of PT. BII Finance Center
for the period 2010 to 2014 in connection with receivables and Return On Assets (ROA). The sampling technique used was purposive sampling technique that is done by selecting a sample
with a specific purpose in accordance with the established criteria. The data used is secondary data. The data collection technique is the study of literature and documentary research. The variables used in the study are Return On Assets (ROA) (dependent variable) and Receivables
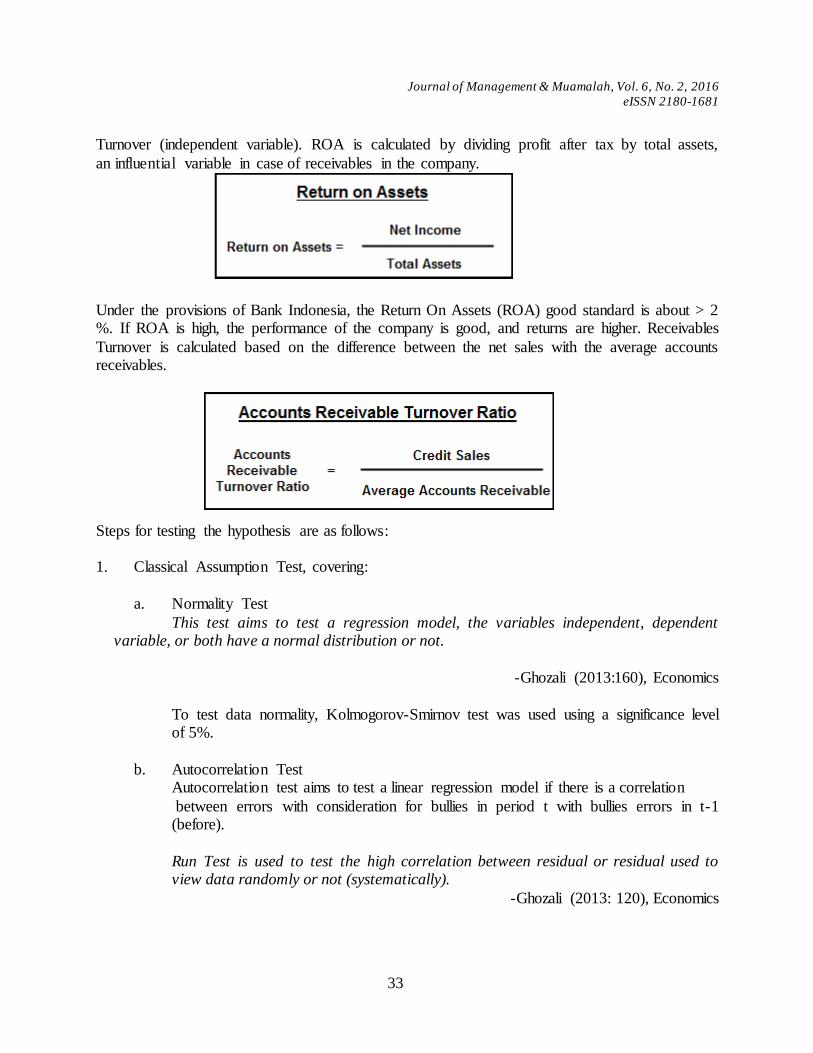
Journal of Management & Muamalah, Vol. 6, No. 2, 2016
eISSN 2180-1681
33
Turnover (independent variable). ROA is calculated by dividing profit after tax by total assets,
an influential variable in case of receivables in the company.
Under the provisions of Bank Indonesia, the Return On Assets (ROA) good standard is about > 2 %. If ROA is high, the performance of the company is good, and returns are higher. Receivables
Turnover is calculated based on the difference between the net sales with the average accounts receivables.
Steps for testing the hypothesis are as follows: 1. Classical Assumption Test, covering:
a. Normality Test
This test aims to test a regression model, the variables independent, dependent variable, or both have a normal distribution or not.
-Ghozali (2013:160), Economics
To test data normality, Kolmogorov-Smirnov test was used using a significance level of 5%.
b. Autocorrelation Test Autocorrelation test aims to test a linear regression model if there is a correlation
between errors with consideration for bullies in period t with bullies errors in t-1 (before).
Run Test is used to test the high correlation between residual or residual used to view data randomly or not (systematically).
-Ghozali (2013: 120), Economics
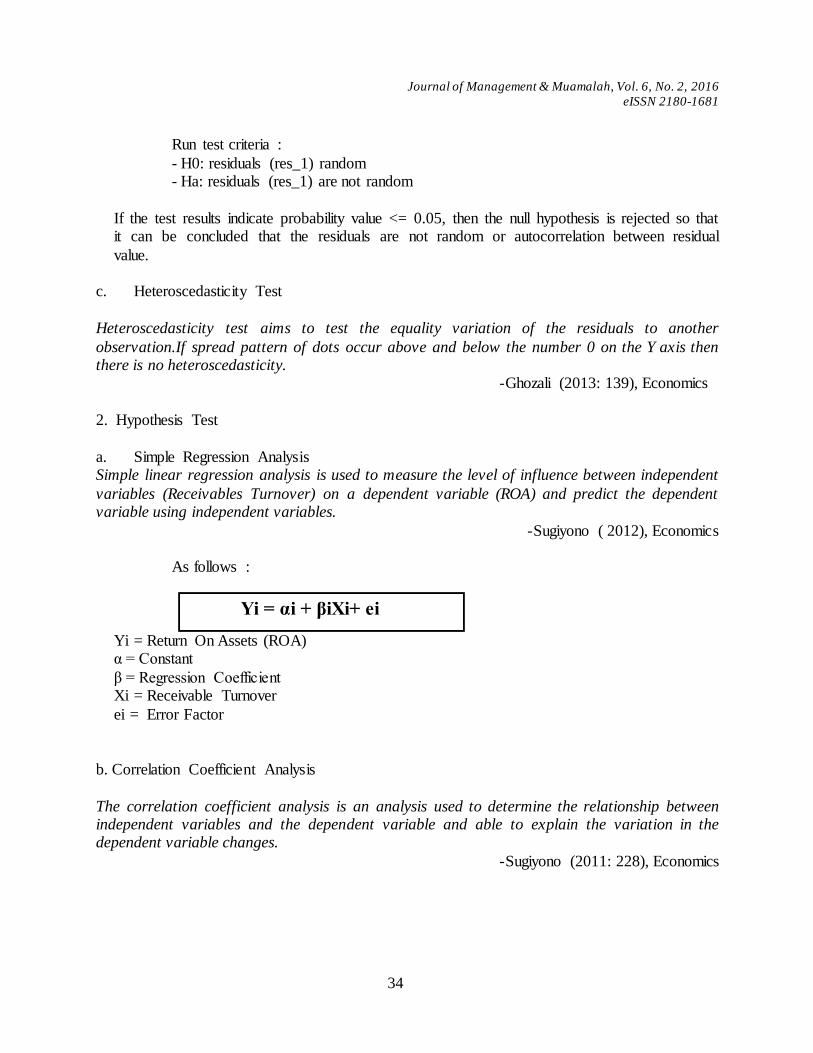
Journal of Management & Muamalah, Vol. 6, No. 2, 2016
eISSN 2180-1681
34
Run test criteria :
- H0: residuals (res_1) random - Ha: residuals (res_1) are not random
If the test results indicate probability value <= 0.05, then the null hypothesis is rejected so that it can be concluded that the residuals are not random or autocorrelation between residual
value.
c. Heteroscedasticity Test
Heteroscedasticity test aims to test the equality variation of the residuals to another
observation.If spread pattern of dots occur above and below the number 0 on the Y axis then there is no heteroscedasticity.
-Ghozali (2013: 139), Economics
2. Hypothesis Test
a. Simple Regression Analysis Simple linear regression analysis is used to measure the level of influence between independent
variables (Receivables Turnover) on a dependent variable (ROA) and predict the dependent variable using independent variables.
-Sugiyono ( 2012), Economics
As follows :
Yi = Return On Assets (ROA) α = Constant
β = Regression Coefficient Xi = Receivable Turnover
ei = Error Factor
b. Correlation Coefficient Analysis
The correlation coefficient analysis is an analysis used to determine the relationship between independent variables and the dependent variable and able to explain the variation in the dependent variable changes.
-Sugiyono (2011: 228), Economics
Yi = αi + βiXi+ ei
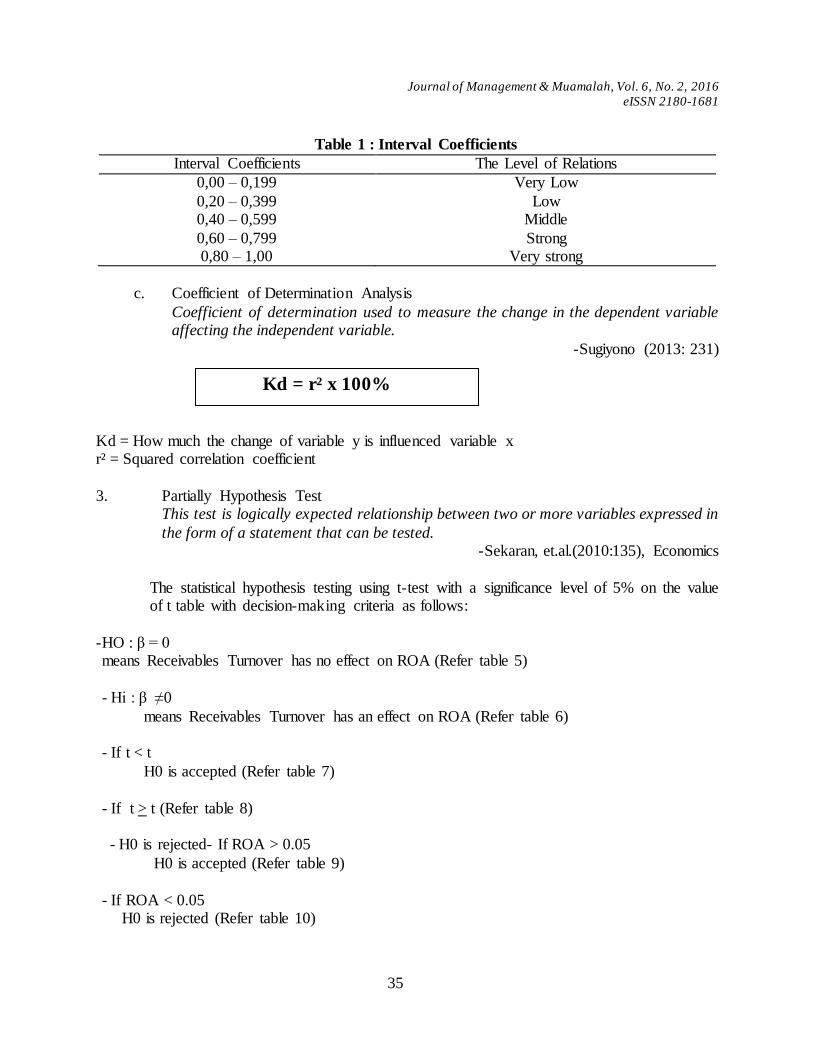
Journal of Management & Muamalah, Vol. 6, No. 2, 2016
eISSN 2180-1681
35
Table 1 : Interval Coefficients
Interval Coefficients The Level of Relations
0,00 – 0,199 Very Low
0,20 – 0,399 Low 0,40 – 0,599 Middle
0,60 – 0,799 Strong 0,80 – 1,00 Very strong
c. Coefficient of Determination Analysis
Coefficient of determination used to measure the change in the dependent variable affecting the independent variable.
-Sugiyono (2013: 231)
Kd = How much the change of variable y is influenced variable x r² = Squared correlation coefficient
3. Partially Hypothesis Test This test is logically expected relationship between two or more variables expressed in
the form of a statement that can be tested. -Sekaran, et.al.(2010:135), Economics
The statistical hypothesis testing using t-test with a significance level of 5% on the value of t table with decision-making criteria as follows:
-HO : β = 0 means Receivables Turnover has no effect on ROA (Refer table 5)
- Hi : β ≠0
means Receivables Turnover has an effect on ROA (Refer table 6) - If t < t
H0 is accepted (Refer table 7)
- If t > t (Refer table 8) - H0 is rejected- If ROA > 0.05
H0 is accepted (Refer table 9)
- If ROA < 0.05 H0 is rejected (Refer table 10)
Kd = r² x 100%
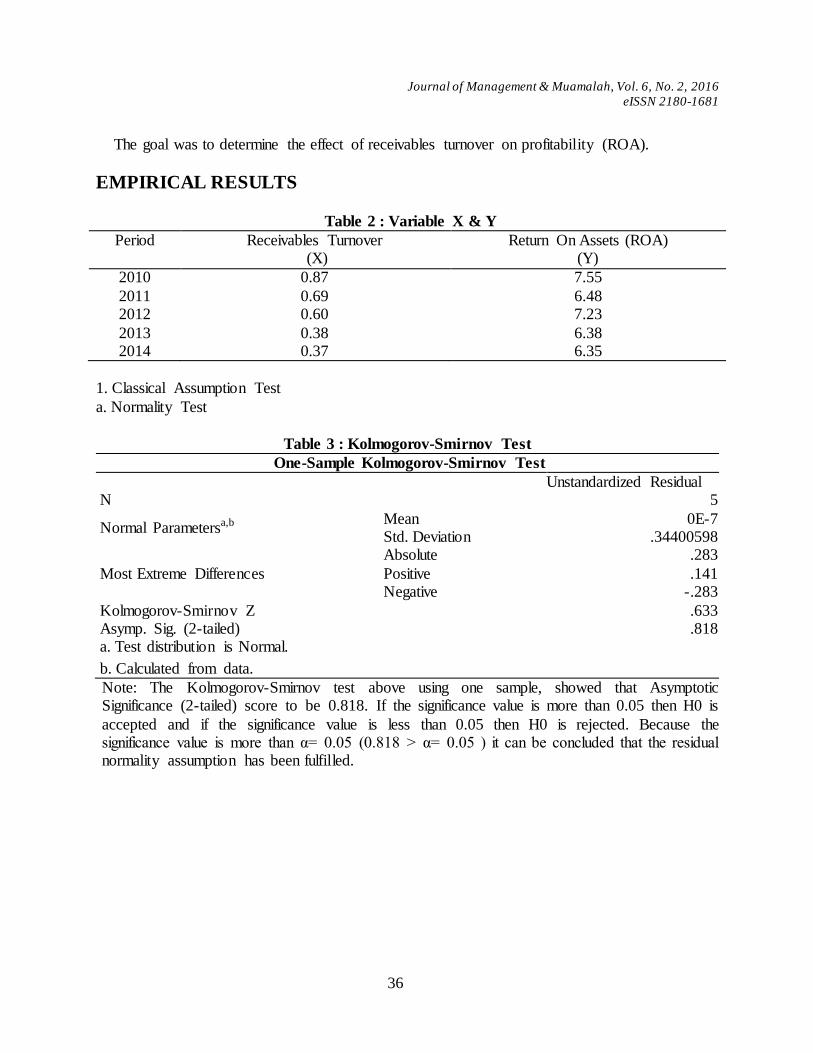
Journal of Management & Muamalah, Vol. 6, No. 2, 2016
eISSN 2180-1681
36
The goal was to determine the effect of receivables turnover on profitability (ROA).
EMPIRICAL RESULTS
Table 2 : Variable X & Y
Period Receivables Turnover (X)
Return On Assets (ROA) (Y)
2010 0.87 7.55
2011 0.69 6.48 2012 0.60 7.23
2013 0.38 6.38 2014 0.37 6.35
1. Classical Assumption Test
a. Normality Test
Table 3 : Kolmogorov-Smirnov Test
One-Sample Kolmogorov-Smirnov Test
Unstandardized Residual N 5
Normal Parametersa,b Mean 0E-7 Std. Deviation .34400598
Most Extreme Differences
Absolute .283
Positive .141 Negative -.283
Kolmogorov-Smirnov Z .633 Asymp. Sig. (2-tailed) .818 a. Test distribution is Normal.
b. Calculated from data.
Note: The Kolmogorov-Smirnov test above using one sample, showed that Asymptotic Significance (2-tailed) score to be 0.818. If the significance value is more than 0.05 then H0 is
accepted and if the significance value is less than 0.05 then H0 is rejected. Because the significance value is more than α= 0.05 (0.818 > α= 0.05 ) it can be concluded that the residual normality assumption has been fulfilled.

Journal of Management & Muamalah, Vol. 6, No. 2, 2016
eISSN 2180-1681
37
b. Autocorrelation Test
Table 4 : Run Test
Runs Test
Unstandardized Residual Test Valuea -.00499
Cases < Test Value 2 Cases >= Test Value 3 Total Cases 5
Number of Runs 4 Z .109
Asymp. Sig. (2-tailed) .913 a. Median
The calculation above shows the values obtained from the Test Run Asymp column. Sig (2-
tailed) is equal to 0.913 which shows that the probability value > 0.05 then the null hypothesis is accepted and it can be concluded that the residuals are random or not autocorrelation between
residual value.
c. Heteroscedasticity Test
Figure 1 : Scatterplot Graph
Based on the picture above, Scatterplot Graph shows that the dots do not form any particular pattern and the dots are spread randomly and scattered above and below the 0 (zero) on the Y
axis. This indicates that there is no heteroscedasticity in the regression model and that the regression model worthy to be used.
2. Hypothesis Test a. Simple Regression Analysis
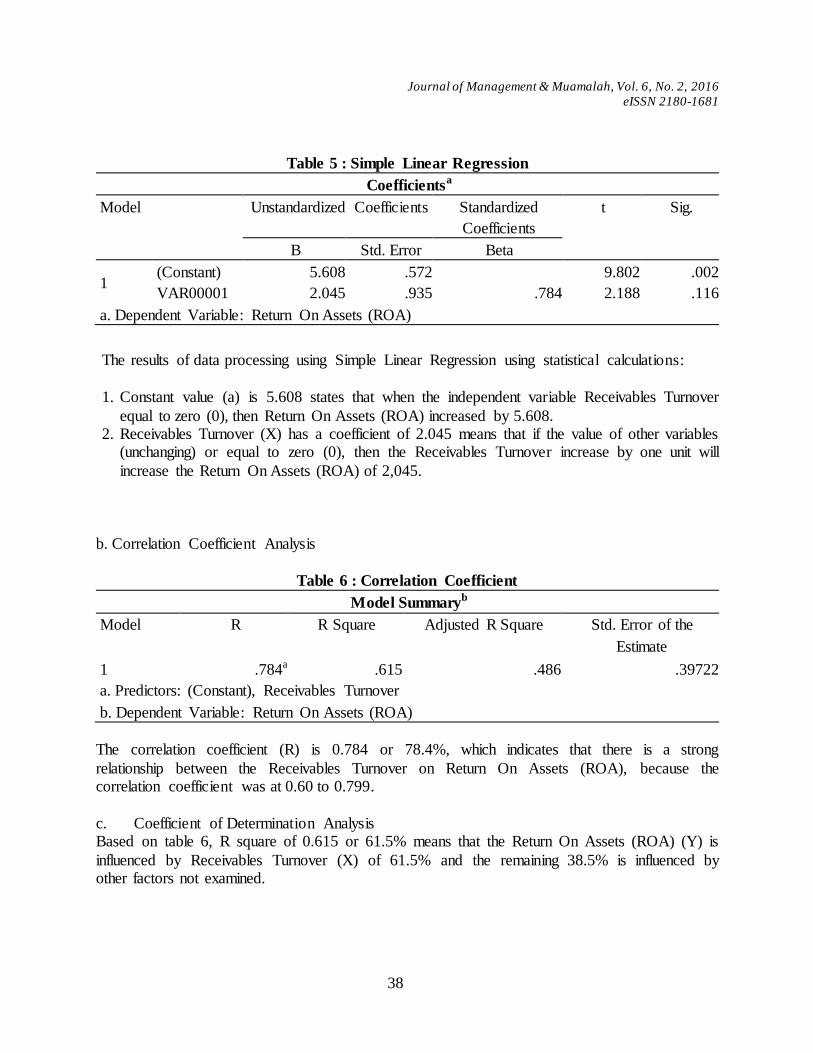
Journal of Management & Muamalah, Vol. 6, No. 2, 2016
eISSN 2180-1681
38
Table 5 : Simple Linear Regression
Coefficientsa
Model Unstandardized Coefficients Standardized
Coefficients
t Sig.
B Std. Error Beta
1 (Constant) 5.608 .572 9.802 .002
VAR00001 2.045 .935 .784 2.188 .116
a. Dependent Variable: Return On Assets (ROA)
The results of data processing using Simple Linear Regression using statistical calculations:
1. Constant value (a) is 5.608 states that when the independent variable Receivables Turnover
equal to zero (0), then Return On Assets (ROA) increased by 5.608. 2. Receivables Turnover (X) has a coefficient of 2.045 means that if the value of other variables
(unchanging) or equal to zero (0), then the Receivables Turnover increase by one unit will
increase the Return On Assets (ROA) of 2,045.
b. Correlation Coefficient Analysis
Table 6 : Correlation Coefficient
Model Summaryb
Model R R Square Adjusted R Square Std. Error of the
Estimate
1 .784a .615 .486 .39722
a. Predictors: (Constant), Receivables Turnover
b. Dependent Variable: Return On Assets (ROA)
The correlation coefficient (R) is 0.784 or 78.4%, which indicates that there is a strong
relationship between the Receivables Turnover on Return On Assets (ROA), because the correlation coefficient was at 0.60 to 0.799.
c. Coefficient of Determination Analysis Based on table 6, R square of 0.615 or 61.5% means that the Return On Assets (ROA) (Y) is
influenced by Receivables Turnover (X) of 61.5% and the remaining 38.5% is influenced by other factors not examined.
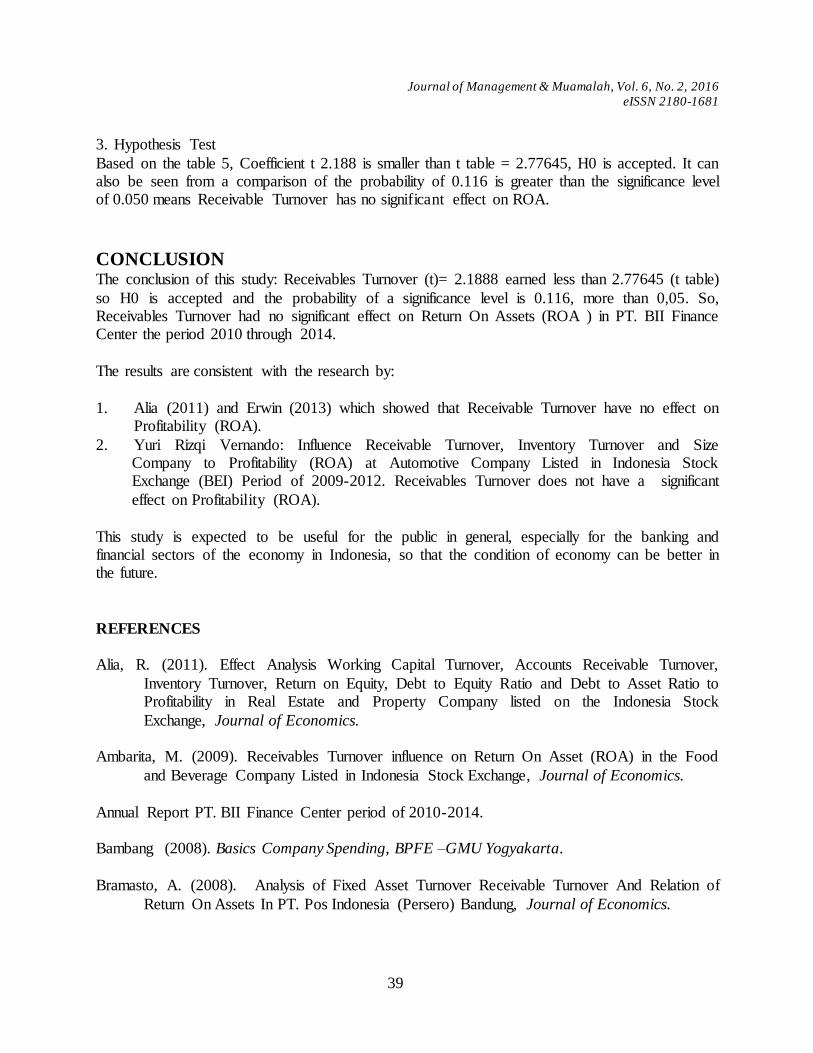
Journal of Management & Muamalah, Vol. 6, No. 2, 2016
eISSN 2180-1681
39
3. Hypothesis Test
Based on the table 5, Coefficient t 2.188 is smaller than t table = 2.77645, H0 is accepted. It can also be seen from a comparison of the probability of 0.116 is greater than the significance level of 0.050 means Receivable Turnover has no significant effect on ROA.
CONCLUSION The conclusion of this study: Receivables Turnover (t)= 2.1888 earned less than 2.77645 (t table)
so H0 is accepted and the probability of a significance level is 0.116, more than 0,05. So, Receivables Turnover had no significant effect on Return On Assets (ROA ) in PT. BII Finance Center the period 2010 through 2014.
The results are consistent with the research by:
1. Alia (2011) and Erwin (2013) which showed that Receivable Turnover have no effect on Profitability (ROA).
2. Yuri Rizqi Vernando: Influence Receivable Turnover, Inventory Turnover and Size Company to Profitability (ROA) at Automotive Company Listed in Indonesia Stock Exchange (BEI) Period of 2009-2012. Receivables Turnover does not have a significant
effect on Profitability (ROA).
This study is expected to be useful for the public in general, especially for the banking and financial sectors of the economy in Indonesia, so that the condition of economy can be better in the future.
REFERENCES
Alia, R. (2011). Effect Analysis Working Capital Turnover, Accounts Receivable Turnover,
Inventory Turnover, Return on Equity, Debt to Equity Ratio and Debt to Asset Ratio to Profitability in Real Estate and Property Company listed on the Indonesia Stock
Exchange, Journal of Economics. Ambarita, M. (2009). Receivables Turnover influence on Return On Asset (ROA) in the Food
and Beverage Company Listed in Indonesia Stock Exchange, Journal of Economics.
Annual Report PT. BII Finance Center period of 2010-2014. Bambang (2008). Basics Company Spending, BPFE –GMU Yogyakarta.
Bramasto, A. (2008). Analysis of Fixed Asset Turnover Receivable Turnover And Relation of
Return On Assets In PT. Pos Indonesia (Persero) Bandung, Journal of Economics.
Journal of Management & Muamalah, Vol. 6, No. 2, 2016
eISSN 2180-1681
40
Chen (2005). An Empirical Investigation of The Relationship between Intellectual Capital and
Firm‘s market value and Financial performance. Journal of Intellectual Capital. CNBC on Friday (01/22/2016).
Erwin, K. (2013). Influence Turnover Fixed Assets, Accounts Receivable and Inventory to
Profitability In The Automotive Company are in Indonesia Stock Exchange. Journal of Economics.
Finance Minister Regulation No.84/PMK.012/2006 the Minister of Finance Regulation No.84/PMK.012/2006.
Financial Services Authority cited Business (19.05.2015).
Ghozali, I. (2013). Multivariate Analysis Application Program 7th edition. Diponegoro University.
Hanafi, M., Halim, A. (2003). Financial Statement Analysis. UPP AMP YKPN.
Husnan, S. (2008). Finance Management, BPFE Yogyakarta.
Kania (2011). Effect of Internal Control Against Consumer Financing Receivables Turnover Ratio and Liquidity Ratio. Journal of Economics.
Lestari, I., Sugiharto, T. (2007). Performance Foreign Exchange Bank and Non Bank Foreign Exchange And Factors Affecting. Gunadharma University.
Ministry Decree No. 84/ PMK.012/2006 & Regulation FSA/POJK.05/2014).Ministry of Finance
of the Republic of Indonesia No. 888/KMK.013/1991.
Ministry of Finance of the Republic of Indonesia No. KEP- 237/KM.5/2005.
Munawir (2010). Financial Statement Analysis, Liberty Nurcholisa.
Nurcholisa (2011). Accounts Receivable Turnover Effect on Profitability of Financial Companies Listed on the Stock Exchange in 2008-2012, Journal of Economics.
Presidential Decree No. 61/1988 and Presidential Decree No. 9/2009.
Riyanto, Bambang. (2008). The Basic of Spending for Company, GPFE Yogyakarta.
Rudianto. (2009). Budgeting, Erlangga. Santoso, S. (2009). Complete Guide to Mastering Statistics, PT Elex Media Komputindo.

Journal of Management & Muamalah, Vol. 6, No. 2, 2016
eISSN 2180-1681
41
Sekaran (2009). Research Methods for Business Research Methodology To Deploying 4th Edition Book I, Salemba Empat.
Sugiyono. (2012). Qualitative and Quantitative Research Methods R & B, Alfabeta.
Vernando, Y. (2013). Influence Receivable Turnover, Inventory Turnover and Company Size To Profitability (ROA) On The Automotive Company are Indonesia Stock Exchange the period 2009 -2012, Journal of Economics.
Warren et al. (2008). Basic Accounting, Salemba Empat.
Wijaya et.al. (2011). Earnings Management on CEO Turnover Currently in Indonesia, Journal of
Accounting and Finance.
Fia Dialysa
Study Program of Management,(STIE) EKUITAS Jl. P.H.H Mustopa No.31 Bandung INDONESIA [email protected]/[email protected]

Journal of Management & Muamalah, Vol. 6, No. 2, 2016
eISSN 2180-1681
42
Peranan Komunikasi Dalam Mengurangkan Konflik Kerja-
Keluarga: Tinjauan Ke Atas Jururawat Di Selangor
(The Role of Communication in Reducing Work-Family Conflict: A Survey on Nurses in Selangor)
Normazaini Saleh
Kolej Universiti Islam Antarabangsa Selangor
Selangor, Malaysia
ABSTRAK
Konflik kerja-keluarga (WFC) telah mendapat perhatian penyelidik berikutan kesan negatif
WFC terhadap domain kerja (i.e tekanan kerja), keluarga (i.e kepuasan perkahwinan) dan individu (i.e kesihatan). Kajian lepas lebih memberi penumpuan dalam mengenalpasti faktor-
faktor yang mengakibatkan WFC berlaku, manakala kajian faktor-faktor yang dapat mengurangkan WFC tidak begitu ketara terutamanya faktor daripada domain keluarga seperti komunikasi dalam keluarga. Justeru, objektif kajian ini ialah untuk menyiasat peranan
komunikasi dalam mengurangkan WFC berlandaskan Theory Border. Kajian dilakukan ke atas sampel yang terdiri daripada 535 jururawat di 6 buah hospital awam di Selangor.
Pengujian hipotesis dilakukan dengan menggunakan analisis Regresi. Hasil kajian menunjukkan komunikasi keluarga mempunyai kaitan negatif dengan WFC dan tidak ada hubungan dengan FWC.Iini membuktikan peranan komunikasi keluarga sebagai sumber
penting dalam menangani permasalahan WFC.
Kata kunci: konflik kerja-keluarga (WFC), Konflik keluarga-kerja, Teori Sempadan, Komunikasi Keluarga
ABSTRACT
Work-family conflict (WFC) has gained the attention of researchers due to the negative
impact of the WFC towards work domain (i.e work stress), family (marital satisfaction) and individual (health). Past research focuses more on identifying factors that cause WFC to occur, while the study of factors that can reduce the WFC is still limited, especially factor
from the family domain such as communication within the family. Thus, the objective of this study is to investigate the role of communication in reducing WFC. Based on the Border
Theory (Clark 2000), communication has seen as an important factor that needs to be considered in order to reduce the WFC. Thus this study was conducted on a sample consisting of 535 nurses in six public hospitals in Selangor. Hypothesis testing is done by
using regression analysis. The results revealed that family communication showed negative association with the WFC. The results of this study demonstrate the importance of family
communication as a resource for addressing issues of WFC. Keywords: Work-family conflict, Family-work conflict, Border Theory, Family
Communication
Journal of Management & Muamalah, Vol. 6, No. 2, 2016
eISSN 2180-1681
43
PENGENALAN
Konflik kerja-keluarga berlaku apabila seseorang menghadapi kesulitan untuk menyesuaikan
peranan di tempat kerja dan peranan keluarga disebabkan oleh masa dan tenaga yang terhad. Seseorang yang terlibat dengan kerja dan dalam masa yang sama perlu melaksanakan peranan dalam keluarga akan menghadapi tekanan. Pekerja yang bekerja syif atau bekerja lebih masa
akan menjadi terlalu sibuk, terganggu, dan keletihan dan apabila pulang ke rumah dalam keadaan tersebut akan mengehadkan keupayaan mereka untuk memenuhi tuntutan daripada domain
keluarga yang akhirnya membawa kepada konflik (Frone et al. 1992; Greenhaus 1985).
Kajian menunjukkan pendedahan terhadap WFC dikaitkan dengan implikasi negatif sama ada
terhadap organisasi, keluarga dan individu (Allen et al. 2000). Antaranya adalah tekanan, komitmen, kepuasan kerja, niat untuk berhenti, ketidakhadiran, kepuasan perkahwinan, kepuasan hidup, kemurungan dan, masalah kesihatan (Amstad, Meier, Fasel, Elfering & Semmer 2011;
Berkman et al. 2015). Berikutan implikasi tersebut, maka kajian terhadap fenomena ini semakin mendapat perhatian meluas dalam kalangan penyelidik terutamanya bagi mengenal pasti faktor-
faktor yang berpotensi untuk mengurangkan WFC.
Komunikasi merupakan komponen penting dalam interaksi dan hubungan sesama manusia sama
ada dalam situasi kerja mahupun dalam keluarga. Komunikasi yang kompeten penting bagi membantu menyelesaikan masalah hubungan dengan cepat dan efektif manakala komunikasi
yang tidak berkesan merupakan masalah utama kepada kebanyakan hubungan interpersonal (Okun & Markowitz 2014). Kepentingan komunikasi dalam mengurangkan masalah konflik-kerja keluarga di sarankan oleh Clark (2000), dalam Border Theory di mana teori tersebut
mencadangkan peningkatan terhadap kesedaran silang-domain (cross-domain awareness). Bagi meningkatkan keseimbangan kerja-keluarga (work-family balance) ahli keluarga perlu
didedahkan dengan pelbagai maklumat berkaitan kerja supaya mereka mendapat kefahaman yang jelas tentang tuntutan kerja yang perlu ditangani oleh pekerja dan seterusnya dapat memberikan sokongan yang sepatutnya. Perkara ini hanya dapat dilakukan apabila terdapat
komunikasi yang berkesan dalam keluarga (Clark 2000). Walaupun terdapat banyak kajian berkaitan komunikasi dan kaitannya dengan keluarga, namun kajian terhadap peranan
komunikasi keluarga terhadap konflik kerja-keluarga adalah terhad.
Semakan literatur menunjukkan kebanyakan kajian anteseden WFC lebih memfokuskan kepada
anteseden kerja, berbanding anteseden daripada domain keluarga dan individu (Eby et al 2005; Zhang & Liu 2011). Kajian lepas lebih menumpukan kepada anteseden kerja kerana faktor dari
domain kerja dikatakan lebih lazim menyebabkan WFC berbanding dengan faktor keluarga, namun sesetengah kajian (Frone et al. 1992; Michel et al. 2011) turut mendapati faktor keluarga mempunyai kaitan signifikan terhadap WFC. Justeru, lebih banyak faktor keluarga seperti
komunikasi dalam keluarga wajar diberi perhatian (Lin Qiu & Jinyan Fan 2015)dan perlu diketengahkan bagi memahami kesannya terhadap WFC.
Journal of Management & Muamalah, Vol. 6, No. 2, 2016
eISSN 2180-1681
44
KAJIAN LITERATUR
Konflik Kerja-Keluarga
Greenhaus dan Beutell (1985) mendefinisikan konflik kerja-keluarga atau Work-Family Conflict
(WFC) sebagai satu bentuk konflik antara peranan (inter role conflict) yang berlaku apabila tekanan peranan daripada domain kerja dan domain keluarga tidak dapat disesuaikan atau bercanggah dalam keadaan tertentu. Berdasarkan Teori Peranan (Kahn, Wolfe, Quinn, Snoek &
Rosenthal 1964; Greenhaus & Beutell 1985), WFC tercetus apabila seseorang perlu melaksanakan pelbagai peranan pada masa yang sama dengan sumber yang terhad (Goode 1960).
Kerja dan keluarga adalah dua domain yang berbeza dari segi matlamat dan peranan (Clark 2000). Oleh itu, mereka yang melaksanakan dua peranan tersebut secara serentak akan
menghadapi masalah apabila berlaku pertindanan dari segi masa dan tenaga. Menurut Voydanoff (1988) dua aspek penting yang membawa kepada konflik ialah faktor yang berkait dengan; 1) masa untuk melaksanakan peranan kerja dan keluarga dan 2) pembawaan psikologi sama ada
positif atau negatif (ketegangan) daripada satu domain ke domain yang lain. Oleh sebab tanggungjawab kerja dan keluarga dilaksanakan di lokasi yang berbeza, umumnya individu
secara fizikal tidak dapat melakukan tugas berkaitan kerja dan keluarga dalam masa yang sama. Oleh itu, masa yang digunakan untuk melaksanakan satu peranan (kerja), tidak dapat digunakan untuk melaksanakan tugas dan peranan yang lain (keluarga).
Begitu juga dengan sumber tenaga yang digunakan untuk satu peranan memberi kesan kepada
pembawaan psikologi antara domain. Misalnya mereka yang terdedah kepada tekanan, keletihan, ketegangan di tempat kerja akan memberi kesan psikologi yang negatif apabila pulang ke rumah menyebabkan perhatian tidak dapat diberikan kepada keluarga. Ringkasnya, apabila seseorang
telah memperuntukkan sumber iaitu masa atau tenaga kepada satu peranan (i.i.: kerja), maka tiada atau kurang sumber yang tinggal untuk melaksanakan peranan yang lain (i.i.: keluarga) dan
ini akan menyebabkan WFC berlaku.
Secara konseptual, Greenhaus dan Beutell (1985) mendedahkan bahawa kedua-dua domain kerja
dan keluarga saling mempengaruhi antara satu sama lain. Ini bermakna, bukan sekadar tuntutan dan ciri kerja sahaja yang mempengaruhi atau menjejaskan keluarga (konflik kerja-keluarga),
malah keluarga atau domain bukan-kerja juga mempunyai sumbangan dalam menjejaskan konsentrasi pekerja terhadap pekerjaan (konflik keluarga-kerja). Apabila pekerja terpaksa memikirkan masalah keluarga atau menyelesaikan masalah berkaitan keluarga yang perlu
dilakukan pada waktu kerja, sehingga mengganggu produktiviti kerjanya akan membuatkan seseorang terlibat dengan konflik keluarga-kerja atau dikenali sebagai FWC atau family-work
conflict (FWC).
Secara empirikal, sebilangan penyelidik mendapati keputusan yang signifikan terhadap konsep
dwiarah WFC (Bellavia & Frone 2005). Frone et al. (1992) mendapati kedua-dua konflik kerja-keluarga (WFC) dan konflik keluarga-kerja (FWC) mempunyai anteseden dan implikasi yang
berbeza. Kajian mereka melaporkan tuntutan kerja dan penglibatan kerja mempunyai kaitan yang signifikan dengan WFC, manakala tuntutan dan penglibatan keluarga pula lebih memberi kesan
Journal of Management & Muamalah, Vol. 6, No. 2, 2016
eISSN 2180-1681
45
kepada FWC. Terdapat banyak bukti hasil kajian pengkaji-pengkaji lain mengesahkan bahawa
WFC harus dilihat dalam dua dimensi yang berbeza (Anderson et al. 2002; Byron 2005; Hammer, Bauer & Grandey 2003; Matthews, Bulger & Barnes-Farell 2010; Mesmer-Magnus & Viswesvaran 2005).
Walaupun terdapat kajian yang masih melihat WFC dalam bentuk uni-dimensi berdasarkan
hujah bahawa domain kerja lebih kuat mempengaruhi domain keluarga, berbanding sebaliknya (Aizzat & Khor 2008; Ford et al. 2007), tetapi kajian yang tidak mengambil kira dwiarah dilihat sebagai model yang tidak lengkap dan berisiko mengeluarkan keputusan atau kesimpulan yang
tidak tepat. Ini kerana kajian mereka tidak melihat senario sebenar secara menyeluruh interaksi domain kerja dan keluarga (Allen et al 2000; Frone et al. 1992). Di samping ia mengakibatkan
kesukaran untuk perbandingan keputusan dengan kajian yang lain, penyelidik juga mendakwa kegagalan untuk melihat kedua-dua konflik secara selari akan melemahkan keupayaan untuk membandingkan secara langsung kekerapan dan sejauh mana signifikannya setiap arah konflik
tersebut (Bellavia & Frone 2005; Carlson & Grzywacz 2008).
Kajian Mesmer-Magnus dan Viswesvaran (2005) turut menegaskan penggunaan pengukuran dwiarah berdasarkan kepada penemuan mereka berkaitan keesahan diskriminan (discriminant validity) ke atas WFC dan FWC. Berdasarkan kepada kepentingan mengkaji WFC dalam bentuk
dwiarah, maka perlu ditekankan bahawa penggunaan istilah WFC dalam perbincangan kajian ini merujuk kepada konteks dwiarah WFC. Walau bagaimanapun, dalam perbincangan yang lebih
khusus (cth: pembinaan hipotesis kajian), penggunaan melibatkan arah konflik yang spesifik akan digunakan secara nyata menggunakan singkatan WFC dan FWC. Justeru, kajian ini turut melihat kesan komunikasi keluarga terhadap dua dimensi konflik kerja-keluarga dan konflik
keluarga-kerja bagi mengenal pasti sejauh mana komunikasi keluarga dapat membantu pekerja keluar daripada kemelut kedua-dua konflik ini.
Komunikasi
Komunikasi adalah kemahiran mendengar (empati), kemahiran bercakap, berkongsi perasaan,
memberi penjelasan, dan kemahiran membuat keputusan (Olson 2000). Komunikasi dalam keluarga penting kerana ia menunjukkan keupayaan keluarga untuk menangani dan menyelesaikan masalah-masalah dalam keluarga (Ali et al., 2003). Komunikasi keluarga
merujuk kepada kemahiran ahli keluarga untuk mendengar dan melahirkan rasa empati, kemahiran bercakap dan berkongsi perasaan, memberi penjelasan serta kemahiran membuat
keputusan terbaik dalam keluarga untuk menangani dan menyelesaikan masalah keluarga. Justeru, dalam pertembungan antara kerja dan keluarga, perasaan saling memahami peranan atau kerja orang lain atau ahli keluarga sangat penting dan proses ini tidak berlaku dalam waktu yang
singkat (Foegen 1984), tetapi memerlukan komunikasi yang berterusan.
Border Theory (Clark 2000) menggalakkan komunikasi dan perkongsian maklumat berkaitan kerja dengan keluarga masing-masing. Apabila keluarga memahami tugas dan tanggung jawab kerja, mereka akan mendapat maklumat yang mencukupi dan mempunyai tanggapan yang betul
tentang kerja. Oleh itu, apabila keluarga dapat memahami dengan betul dan tepat berkaitan dengan tugas dan tuntutan kerja ahli keluarga yang lain (suami/ isteri), maka sokongan yang
Journal of Management & Muamalah, Vol. 6, No. 2, 2016
eISSN 2180-1681
46
sewajarnya dapat diberikan oleh ahli keluarga kepada pekerja. Keadaan ini dapat mengurangkan
konflik kerja-keluarga. Border Theory memberi pencerahan kepada penyelesaian konflik kerja-keluarga dengan meningkatkan kefahaman ahli domain yang lain melalui maklumat yang dikongsi bersama, contohnya banyak bercakap dan memberi maklumat mengenai apa yang
mereka lakukan di luar domain. Berkongsi perkara-perkara berkaitan kerja dengan ahli keluarga atau bercakap dengan penyelia dan rakan sekerja tentang keluarga dan aktiviti yang berkaitan
dengan keluarga akan meningkatkan sokongan daripada border keepers (pasangan/ keluarga atau penyelia) yang faham dan mengetahui apa yang berlaku dalam domain yang lain.
Kaitan Komunikasi Keluarga Dengan Konflik Kerja-Keluarga
Komunikasi keluarga merupakan sumber yang berpotensi mengurangkan tekanan. Menurut Patterson (2002) dalam Teori Family Resilience, keluargayang mempunyai keeratan dan
fleksibiliti yang tinggi, serta komunikasi yang efektif, bertindak sebagai faktor pelindung kepada tekanan, krisis (Patterson 2002a) dan WFC (Grzywacz, & Bass 2003). Komunikasi keluarga yang baik merupakan aset atau sumber kepada seseorang pekerja. Ini kerana walaupun pekerja
berhadapan dengan tekanan dan bebanan kerja yang tinggi, namun tekanan tersebut tidak menjejaskan tumpuan terhadap kerja kerana keluarga sentiasa memahami, mengambil berat dan
membantu apabila diperlukan. Begitu juga apabila berlaku perubahan yang menjejaskan keluarga misalnya perubahan
waktu/jadual kerja yang memerlukan ahli keluarga yang lain mengambil alih tugas-tugas pekerja atau pertukaran tempat kerja yang memerlukan komitmen ahli keluarga. Keluarga yang
mempunyai komunikasi yang baik tidak menghadapi masalah untuk mengadaptasi sebarang perubahan tersebut apabila diperlukan (Caliguiri et al. 1998). Ini kerana apabila maklumat berkaitan dengan tempat kerja dapat disampaikan dengan baik kepada keluarga dan keluarga
dapat memahami tuntutan kerja yang perlu dilaksanakan oleh pekerja, maka tuntutan daripada keluarga akan berkurangan, sekali gus mengurangkan FWC (Clark 2000).
Behnke, Macdermid, Coltrane, Parke, Duffy & Widaman (2008) melaporkan keeratan keluarga mengantara tekanan dan tingkah laku ibu bapa, di mana tekanan ekonomi dan tekanan hidup
yang dialami, meningkatkan lagi keeratan sesama ahli keluarga dan menjadikan tingkah laku ibu bapa lebih positif, mesra dan responsif. Lee et al. (2003) mendapati persekitaran keluarga yang
bercirikan konflik yang rendah dan keeratan yang tinggi dapat mengurangkan ketegangan peranan kerja-keluarga ibu bapa. Kajian mereka melaporkan ibu sangat mementingkan kualiti hubungan dengan keluarga, justeru walaupun terdedah kepada bebanan kerja, di samping
memikul tugas penjagaan dan berhadapan dengan kerenah anak, mereka dapat menangani ketegangan tersebut disebabkan oleh keeratan keluarga yang tinggi. Bagi bapa pula, ketegangan
psikologi berkurang apabila setiap ahli keluarga dapat menzahirkan perasaan dan berkomunikasi dengan baik.
Oleh itu, mereka yang mempunyai keluarga yang berfungsi dengan baik berkemungkinan besar tidak menghadapi masalah FWC kerana sebahagian besar tuntutan keluarga telah diselesaikan
dengan adanya bantuan daripada ahli daripada keluarga yang erat, boleh bertolak ansur dan jelas dalam komunikasi mereka. Ini sekali gus dapat mengurangkan pendedahan terhadap WFC
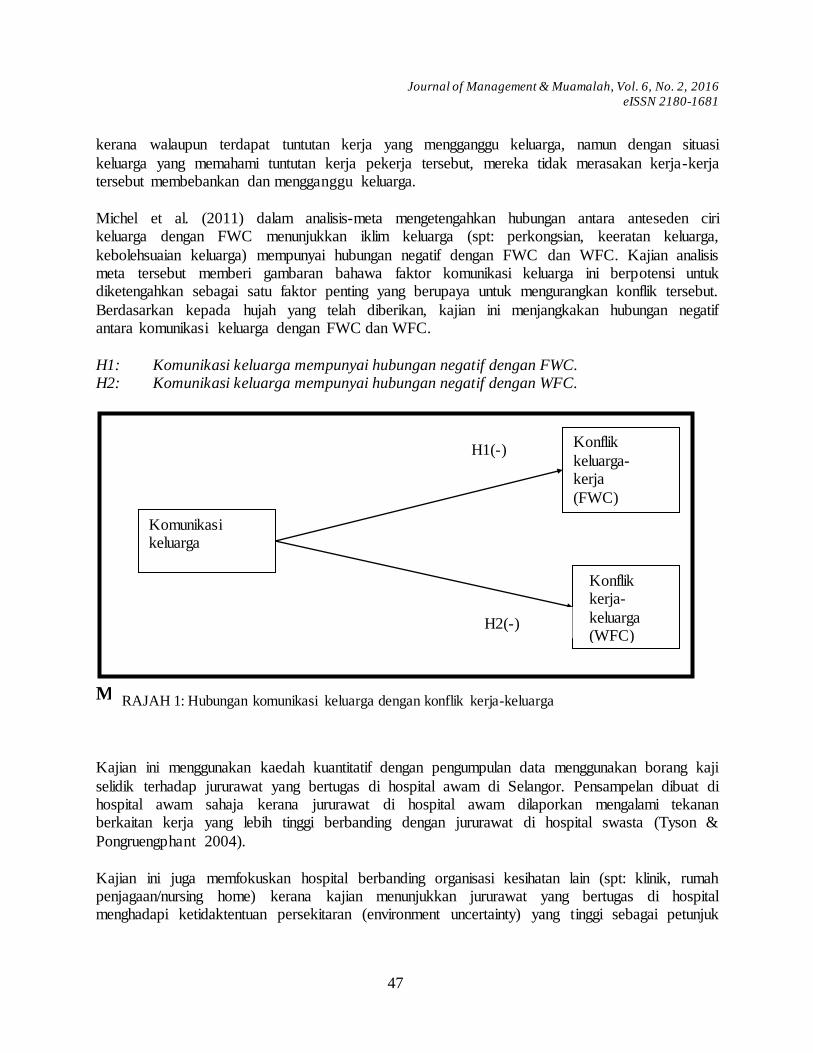
Journal of Management & Muamalah, Vol. 6, No. 2, 2016
eISSN 2180-1681
47
kerana walaupun terdapat tuntutan kerja yang mengganggu keluarga, namun dengan situasi
keluarga yang memahami tuntutan kerja pekerja tersebut, mereka tidak merasakan kerja-kerja tersebut membebankan dan mengganggu keluarga.
Michel et al. (2011) dalam analisis-meta mengetengahkan hubungan antara anteseden ciri keluarga dengan FWC menunjukkan iklim keluarga (spt: perkongsian, keeratan keluarga,
kebolehsuaian keluarga) mempunyai hubungan negatif dengan FWC dan WFC. Kajian analisis meta tersebut memberi gambaran bahawa faktor komunikasi keluarga ini berpotensi untuk diketengahkan sebagai satu faktor penting yang berupaya untuk mengurangkan konflik tersebut.
Berdasarkan kepada hujah yang telah diberikan, kajian ini menjangkakan hubungan negatif antara komunikasi keluarga dengan FWC dan WFC.
H1: Komunikasi keluarga mempunyai hubungan negatif dengan FWC. H2: Komunikasi keluarga mempunyai hubungan negatif dengan WFC.
METODOLOGI
Kajian ini menggunakan kaedah kuantitatif dengan pengumpulan data menggunakan borang kaji
selidik terhadap jururawat yang bertugas di hospital awam di Selangor. Pensampelan dibuat di hospital awam sahaja kerana jururawat di hospital awam dilaporkan mengalami tekanan berkaitan kerja yang lebih tinggi berbanding dengan jururawat di hospital swasta (Tyson &
Pongruengphant 2004).
Kajian ini juga memfokuskan hospital berbanding organisasi kesihatan lain (spt: klinik, rumah penjagaan/nursing home) kerana kajian menunjukkan jururawat yang bertugas di hospital menghadapi ketidaktentuan persekitaran (environment uncertainty) yang tinggi sebagai petunjuk
Konflik kerja-
keluarga (WFC)
Konflik
keluarga-kerja
(FWC)
Komunikasi keluarga
H1(-)
H2(-)
RAJAH 1: Hubungan komunikasi keluarga dengan konflik kerja-keluarga
Journal of Management & Muamalah, Vol. 6, No. 2, 2016
eISSN 2180-1681
48
kepada bebanan kerja yang lebih tinggi berbanding dengan rakan di organisasi kesihatan lain
(Van den Berg, Landeweerd, Tummers & Van Merode 2006). Jururawat dipilih sebagai responden kajian kerana kerjaya jururawat merupakan antara pekerjaan
yang penuh dengan tekanan (Van den Berg et al. 2006) akibat daripada pelbagai faktor penekan terutamanya beban kerja (Parikh, Taukari & Bhattacharya 2004). Selain itu, kerjaya jururawat
berhadapan dengan masa kerja yang panjang dan tidak menentu seperti pertukaran syif, masa bekerja yang tidak normal atau kerja pada hujung minggu, dan bebanan kerja fizikal (Van de Heijden, Demerouti & Bakker 2009) yang mengakibatkan kehabisan tenaga (burnout). Faktor ini
mengakibatkan mereka berpotensi untuk berhadapan dengan WFC yang tinggi (Burke &
Greenglass 2001; Haines, Marchand & Rousseau 2008; Yildirim & Aycan 2008). Dengan situasi kerja yang mencabar dalam profesion ini, hubungan antara-personal dalam bentuk sokongan sosial daripada penyelia (van der Heijden et al. 2008) dan keluarga adalah penting bagi
jururawat. Selain itu sampel jururawat dipilih kerana profesion jururawat sebagai sampel kajian WFC di Malaysia masih belum begitu meluas.
Secara spesifik, jururawat yang dijemput untuk terlibat dengan kajian ini adalah mereka yang telah berumah tangga. Kajian menunjukkan tahap WFC yang lebih ketara kepada individu yang
telah berkahwin berbanding dengan mereka yang tiada komitmen dengan perkahwinan dan anak-anak (Eagle et al. 1998), terutamanya anak pada usia yang muda (Grzywacz, Frone, Brewer &
Kovner 2006). Di samping itu dengan memfokuskan kepada jururawat, kajian ini akan memperolehi responden yang serba sama (homogeneous). Ini adalah penting kerana menurut Calder, Phillips dan Tybout (1981) ia dapat meningkatkan ramalan teoretikal kerana responden
mempunyai ciri dan tingkah laku yang sama. Selain itu ia akan mengurangkan kecenderungan kepada kesimpulan yang salah sama ada terdapat co-variation antara pemboleh ubah-pemboleh
ubah dalam kajian. Ini kerana jika sampel yang berlainan digunakan (dengan mengambil kira ciri-ciri responden yang akan memberi kesan kepada jawapan mereka) ia boleh meningkatkan kesilapan sisihan (error variance) dan sensitiviti ujian statistik akan berkurang dalam proses
mengenal pasti hubungan signifikan antara konstruk.
Selangor mempunyai 10 buah hospital awam dengan saiz yang pelbagai mengikut bilangan katil. Kajian menunjukkan bilangan katil adalah antara kaedah yang digunakan bagi mengenal pasti keperluan pengambilan jururawat di hospital (Hurst 2006; Twigg & Duffield 2009). Selangor
dipilih sebagai kawasan kajian kerana ia terletak di kawasan Lembah Klang yang merupakan pusat konsentrasi penduduk. Oleh itu kajian ini telah memilih 6 buah hospital (Jadual 1) yang
mempunyai bilangan katil melebihi 300 buah sebagai kerangka pensampelan iaitu Hospital Kajang, Hospital Selayang, Hospital Serdang, Hospital Sungai Buloh, dan Hospital Tengku Ampuan Rahimah, Klang. Secara umumnya hospital-hospital tersebut berada di kawasan bandar
besar yang mempunyai kepadatan penduduk yang lebih tinggi berbanding dengan hospital lain yang kebanyakannya berada di pinggir bandar. Jururawat-jururawat yang bertugas di hospital
tersebut akan dijemput untuk menyertai kajian ini dengan menjawab soal selidik secara sukarela. Kelebihan teknik ini adalah kajian ini boleh mendapatkan bilangan soal-selidik lengkap yang banyak dengan kos yang lebih ekonomik.
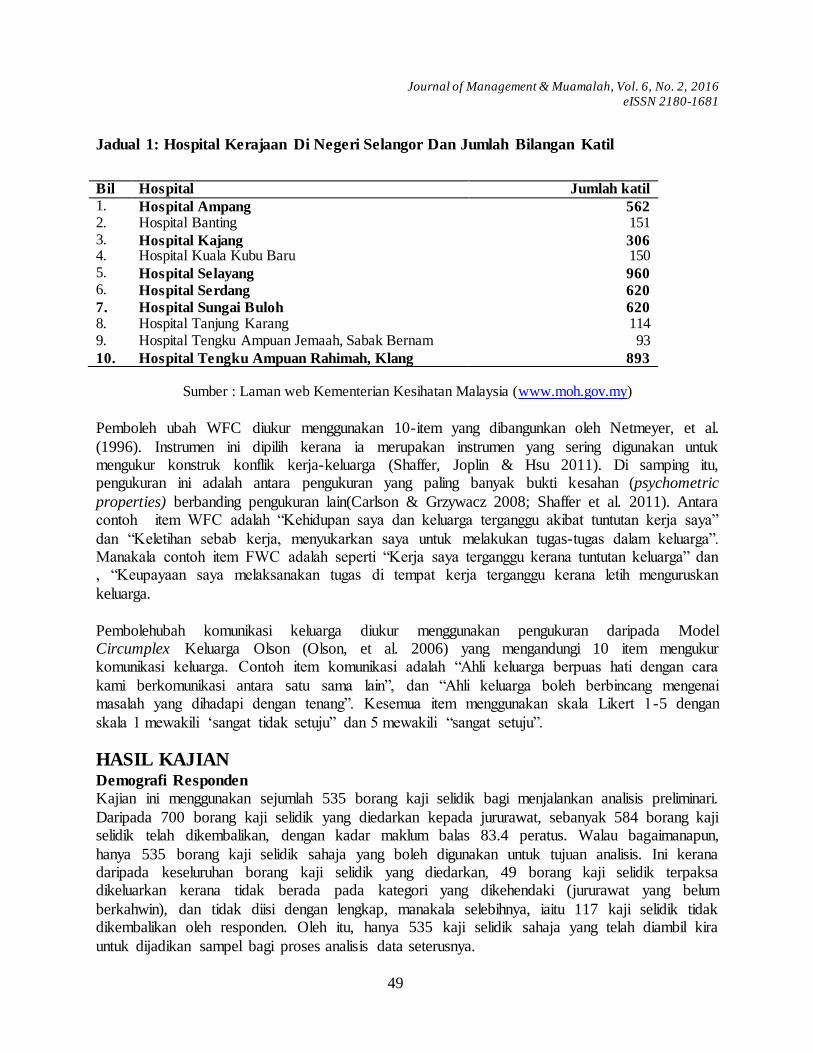
Journal of Management & Muamalah, Vol. 6, No. 2, 2016
eISSN 2180-1681
49
Jadual 1: Hospital Kerajaan Di Negeri Selangor Dan Jumlah Bilangan Katil
Bil Hospital Jumlah katil
1. Hospital Ampang 562 2. Hospital Banting 151 3. Hospital Kajang 306 4. Hospital Kuala Kubu Baru 150 5. Hospital Selayang 960 6. Hospital Serdang 620
7. Hospital Sungai Buloh 620 8. Hospital Tanjung Karang 114 9. Hospital Tengku Ampuan Jemaah, Sabak Bernam 93
10. Hospital Tengku Ampuan Rahimah, Klang 893
Sumber : Laman web Kementerian Kesihatan Malaysia (www.moh.gov.my)
Pemboleh ubah WFC diukur menggunakan 10-item yang dibangunkan oleh Netmeyer, et al.
(1996). Instrumen ini dipilih kerana ia merupakan instrumen yang sering digunakan untuk mengukur konstruk konflik kerja-keluarga (Shaffer, Joplin & Hsu 2011). Di samping itu, pengukuran ini adalah antara pengukuran yang paling banyak bukti kesahan (psychometric
properties) berbanding pengukuran lain(Carlson & Grzywacz 2008; Shaffer et al. 2011). Antara contoh item WFC adalah ―Kehidupan saya dan keluarga terganggu akibat tuntutan kerja saya‖
dan ―Keletihan sebab kerja, menyukarkan saya untuk melakukan tugas-tugas dalam keluarga‖. Manakala contoh item FWC adalah seperti ―Kerja saya terganggu kerana tuntutan keluarga‖ dan , ―Keupayaan saya melaksanakan tugas di tempat kerja terganggu kerana letih menguruskan
keluarga.
Pembolehubah komunikasi keluarga diukur menggunakan pengukuran daripada Model Circumplex Keluarga Olson (Olson, et al. 2006) yang mengandungi 10 item mengukur komunikasi keluarga. Contoh item komunikasi adalah ―Ahli keluarga berpuas hati dengan cara
kami berkomunikasi antara satu sama lain‖, dan ―Ahli keluarga boleh berbincang mengenai masalah yang dihadapi dengan tenang‖. Kesemua item menggunakan skala Likert 1-5 dengan
skala 1 mewakili ‗sangat tidak setuju‖ dan 5 mewakili ―sangat setuju‖.
HASIL KAJIAN
Demografi Responden
Kajian ini menggunakan sejumlah 535 borang kaji selidik bagi menjalankan analisis preliminari.
Daripada 700 borang kaji selidik yang diedarkan kepada jururawat, sebanyak 584 borang kaji selidik telah dikembalikan, dengan kadar maklum balas 83.4 peratus. Walau bagaimanapun,
hanya 535 borang kaji selidik sahaja yang boleh digunakan untuk tujuan analisis. Ini kerana daripada keseluruhan borang kaji selidik yang diedarkan, 49 borang kaji selidik terpaksa dikeluarkan kerana tidak berada pada kategori yang dikehendaki (jururawat yang belum
berkahwin), dan tidak diisi dengan lengkap, manakala selebihnya, iaitu 117 kaji selidik tidak dikembalikan oleh responden. Oleh itu, hanya 535 kaji selidik sahaja yang telah diambil kira
untuk dijadikan sampel bagi proses analisis data seterusnya.
Journal of Management & Muamalah, Vol. 6, No. 2, 2016
eISSN 2180-1681
50
Analisis latar belakang responden dijalankan dengan melihat taburan kekerapan latar belakang
responden (Jadual 2). Secara umumnya profesion jururawat di dominasi oleh golongan wanita. Ini dapat dilihat daripada dapatan kajian di mana majoriti responden ialah wanita iaitu sebanyak
97.4 peratus, dan selebihnya 2.6 peratus ialah jururawat lelaki. Kebanyakan (81.5%) responden berumur dalam lingkungan 26-45 tahun, manakala 27 peratus berada dalam lingkungan 46-55
tahun dan sebahagian kecil iaitu 1.9 peratus melebihi tempoh persaraan (>56 tahun) (mungkin khidmat cemerlang dan pengalaman mereka diperlukan oleh pihak hospital). Oleh kerana kajian hanya memfokuskan kepada pasangan yang telah berkahwin, hampir keseluruhan responden
(97.8%) berstatus berkahwin, manakala 1.7 peratus adalah ibu bapa tunggal. Bagi kategori belum berkahwin atau bujang, borang kaji selidik mereka telah dikeluarkan lebih awal dan tidak
menjadi sebahagian data untuk dianalisis.
Profesion jururawat juga di dominasi oleh kaum Melayu (93.5%), dan selebihnya Cina (2.2%),
India (3%) dan bangsa-bangsa lain seperti Kadazan dan Bidayuh sebanyak 1.3 peratus. Majoriti responden berkelayakan Diploma (72.7%), manakala 20.2 peratus mempunyai kelayakan Sijil.
Sebahagian kecil (1.3%) daripada responden telah melanjutkan pelajaran ke peringkat Sarjana dan PhD. Dari segi jawatan, responden yang mengisi borang kaji selidik terdiri daripada Jururawat Terlatih (71%), Jururawat Masyarakat (12.9%), Ketua Jururawat (10.8%) dan Penyelia
Jururawat (1.9%).
Majoriti responden yang mengisi borang kaji selidik terdiri daripada mereka yang memiliki anak (83.2%), manakala selebihnya (16.8%) tidak mempunyai anak. Kebanyakan responden mempunyai anak dengan bilangan kurang daripada 3 orang (71.7%), manakala sebahagian kecil
sahaja yang mempunyai anak 4 hingga 5 orang (8%), dan hanya 3 responden (0.6%) sahaja yang memiliki lebih daripada 6 orang anak. Dari segi umur anak pula, 256 responden (47.9%)
mempunyai anak berumur kurang dari 3 tahun, 37.9 peratus mempunyai anak yang berumur dalam lingkungan 3 hingga 6 tahun, manakala 26 peratus memiliki anak yang telah bersekolah rendah iaitu berumur dalam lingkungan 7 hingga 12 tahun. Bagi anak yang telah bersekolah
peringkat menengah pula (13 hingga 17 tahun), hanya 10.3 peratus sahaja responden yang memiliki anak dalam lingkungan umur tersebut, manakala hanya 8.6 peratus sahaja mempunyai
anak yang melebihi umur 18 tahun.
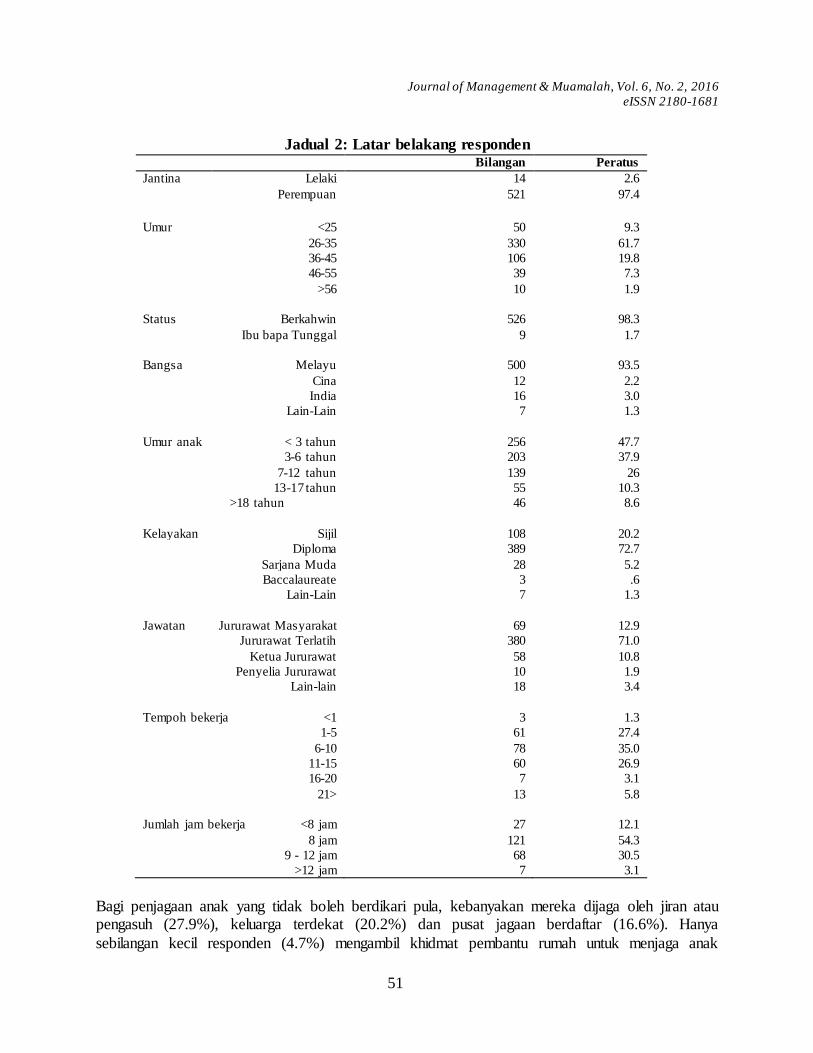
Journal of Management & Muamalah, Vol. 6, No. 2, 2016
eISSN 2180-1681
51
Jadual 2: Latar belakang responden Bilangan Peratus
Jantina Lelaki 14 2.6
Perempuan 521 97.4
Umur <25 50 9.3
26-35 330 61.7
36-45 106 19.8
46-55 39 7.3
>56 10 1.9
Status Berkahwin 526 98.3
Ibu bapa Tunggal 9 1.7
Bangsa Melayu 500 93.5
Cina 12 2.2
India 16 3.0
Lain-Lain 7 1.3
Umur anak < 3 tahun
3-6 tahun
7-12 tahun
13-17 tahun
>18 tahun
256
203
139
55
46
47.7
37.9
26
10.3
8.6
Kelayakan Sijil 108 20.2
Diploma 389 72.7
Sarjana Muda 28 5.2
Baccalaureate 3 .6
Lain-Lain 7 1.3
Jawatan Jururawat Masyarakat 69 12.9
Jururawat Terlatih 380 71.0
Ketua Jururawat 58 10.8
Penyelia Jururawat 10 1.9
Lain-lain 18 3.4
Tempoh bekerja <1 3 1.3
1-5 61 27.4
6-10 78 35.0
11-15 60 26.9
16-20 7 3.1
21> 13 5.8
Jumlah jam bekerja <8 jam 27 12.1
8 jam 121 54.3
9 - 12 jam 68 30.5
>12 jam 7 3.1
Bagi penjagaan anak yang tidak boleh berdikari pula, kebanyakan mereka dijaga oleh jiran atau pengasuh (27.9%), keluarga terdekat (20.2%) dan pusat jagaan berdaftar (16.6%). Hanya
sebilangan kecil responden (4.7%) mengambil khidmat pembantu rumah untuk menjaga anak
Journal of Management & Muamalah, Vol. 6, No. 2, 2016
eISSN 2180-1681
52
mereka atau dijaga sendiri oleh pasangan (3.6%) masing-masing. Fenomena menghantar anak ke
rumah pengasuh sama ada jiran, atau saudara-mara dan pusat jagaan memang dijangka kerana sebahagian besar daripada responden tinggal bersama pasangan dan anak-anak (60.6%) tanpa ibu-bapa atau saudara-mara yang tinggal bersama untuk membantu menjaga anak-anak semasa
mereka keluar bekerja.
Sebahagian besar (50.8%) responden telah berkhidmat sebagai jururawat untuk tempoh 1 hingga 5 tahun, manakala 34.9 peratus telah berkhidmat antara 6 hingga 15 tahun, dan selebihnya iaitu 3 peratus telah berkhidmat sebagai jururawat melebihi 15 tahun. 84.1 peratus responden terlibat
dengan kerja syif, dengan majoriti mereka bekerja pada syif bergilir, iaitu 83.4 peratus. Dari segi jam bekerja, sebanyak 54.3 peratus daripada responden yang bekerja 8 jam sehari (54.3%),
manakala 33.6 peratus bekerja lebih masa atau melebihi 8 jam sehari.
Pengujian Hipotesis
Analisis statistik untuk menguji hipotesis dilakukan menggunakan ujian korelasi dan regresi. Jadual 3 memaparkan sebahagian daripada analisis deskriptif yang merangkumi nilai purata dan sisihan piawai dan juga analisis inferensi iaitu korelasi di antara konstruk. Nilai min
menunjukkan WFC lebih tinggi berbanding dengan FWC. Keputusan ini selari dengan dapatan pengkaji lepas yang melaporkan WFC yang lebih tinggi berbanding FWC kerana tuntutan
daripada kerja lebih mudah melangkaui sempadan keluarga (Zaiton et al. 2010). Nilai min bagi konstruk komunikasi keluarga juga dilaporkan tinggi (melebihi nilai 4.0). Ini menggambarkan
bahawa responden melihat komunikasi dengan keluarga dengan pandangan yang positif.
Nilai min FWC yang rendah iaitu 2.17 menunjukkan responden tidak merasakan bahawa tuntutan daripada domain keluarga mengganggu kerja mereka. Ini dijelaskan teori sempadan atau Border Theory (Clark 2000) dan konsep kebolehtelapan (permeability) dalam kajian WFC, di
mana faktor-faktor daripada domain kerja lebih mudah merentas sempadan keluarga berbanding dengan faktor-faktor daripada domain keluarga yang sukar untuk merentas masuk ke dalam
domain kerja (Eagle et al. 1997; Frone et al. 1992a). Menurut Aryee et al. (1999) domain keluarga lebih mudah menyerap tekanan daripada domain kerja kerana mereka yang berada dalam domain keluarga membenarkan faktor daripada domain kerja mengganggu keluarga.
Menurut Zaiton et al. (2010), masyarakat Malaysia sangat mementingkan kesejahteraan keluarga dan mengambil berat perihal ibu bapa, justeru sebagai balasan, perkara berkaitan kerja biasanya
mendapat sokongan keluarga dan perkara berkaitan kerja jarang dilihat sebagai gangguan kepada kehidupan keluarga.
Jadual3: Skor min, sisihan piawai dan korelasi, Cronbach Alpha
Min SP 1 2 3
1. Komunikasi keluarga 4.04 .572 (0.94)
2.Konflik keluarga-kerja (FWC) 2.17 .766 -.018 (0.87)
3. Konflik kerja-keluarga (WFC) 3.04 .898 -.1.25** -.366** (0.87) Nota: SP(sisihan piawai)**p< 0.05 (1-tailed)
Journal of Management & Muamalah, Vol. 6, No. 2, 2016
eISSN 2180-1681
53
Keputusan analisis korelasi menunjukkan hubungan bivariate di antara pemboleh-pemboleh
ubah dalam kajian ini hanya signifikan kepada hubungan antara komunikasi keluarga dengan WFC, tetapi hubungan komunikasi keluarga dengan FWC adalah tidak signifikan. Kajian menunjukkan komunikasi yang berlaku dalam keluarga berkait rapat pengurangan WFC yang
dihadapi oleh pekerja.Keputusan korelasi menunjukkan komunikasi keluarga tidak mempunyai korelasi signifikan dengan FWC, oleh itu ujian regresi hanya dilakukan di antara komunikasi
keluarga dengan WFC sahaja.
Jadual 4: Keputusan Regresi bagi Konflik kerja-keluarga
Model β t P R2
1 Komunikasi keluarga -1.25 -2.918 0.004 .016* Nota: **p< 0.01,*p< 0.05
Keputusan ujian regresi dalam Jadual 4 menunjukkan komunikasi keluarga memainkan peranan
penting dalam mengurangkan konflik kerja-keluarga dengan nilai beta -.125**, (p<0.05). Justeru, hanya Hipotesis 2 disokong, manakala hipotesis 1 tidak disokong. Dapatan menunjukkan komunikasi keluarga hanya menerangkan sebanyak 1.6% dalam pengurangan
konflik kerja-keluarga. Walaupun nilai R2 tersebut kecil, namun ia merupakan indikator kepada kepentingan komunikasi keluarga dalam mengurangkan WFC.
PERBINCANGAN DAN KESIMPULAN Hasil kajian mendapati komunikasi dalam keluarga memainkan peranan penting dalam
mengurangkan konflik kerja-keluarga (WFC). Keputusan ini selari dengan pandangan Patterson (2002a) dalam Teori Family Resilience yang menyatakan bahawa ciri keluarga seperti keeratan,
fleksibiliti dan komunikasi berpotensi untuk menjadi faktor pelindung kepada keluarga dan individu dalam keluarga bagi mengurangkan tekanan. Keluarga merupakan institusi penting yang mempunyai peranan yang besar dalam mencorakkan kehidupan seseorang individu.
Justeru, mereka yang dapat berkomunikasi dengan baik sesama ahli keluarga mempunyai keupayaan untuk menangani tekanan akibat daripada persekitaran kerja yang mengganggu
keluarga. Komunikasi yang baik akan menatijahkan sokongan daripada keluarga dalam bentuk yang pelbagai seperti keluarga memahami bebanan tugas pekerja dan bertindak membantu apa sahaja yang boleh dilakukan bagi mengurangkan bebanan tersebut.
Walaupun hasil dapatan kajian menyokong perkaitan di antara komunikasi keluarga dengan
WFC, namun, hubungan antara komunikasi keluarga dengan konflik keluarga-kerja (FWC) adalah tidak berkait secara signifikan. Keputusan ini bertentangan dengan kajian lepas yang mengatakan bahawa faktor keluarga mempengaruhi FWC (Lee et al. 2003; Michel et al. 2011)
namun dalam konteks kajian ini yang melihat hubungan konflik kerja-keluarga dwiarah dengan faktor komunikasi keluarga, keputusan menunjukkan komunikasi keluarga tidak berperanan
sebagai peramal langsung yang signifikan kepada FWC.

Journal of Management & Muamalah, Vol. 6, No. 2, 2016
eISSN 2180-1681
54
Secara asasnya, Teori Pengekalan Sumber (Hobfoll 1989) dan Teori Ketahanan Keluarga
(Patterson 2002a) menggambarkan bahawa keluarga yang erat, fleksibel dan berkomunikasi dengan baik mampu menjadi sumber yang membolehkan seseorang mengendalikan tekanan dengan baik. Ini kerana apabila setiap ahli dalam keluarga mempunyai komunikasi yang baik
dalam keluarga, mereka menjadi lebih erat dan dapat bertolak ansur dengan sebarang perubahan dan sebarang masalah dan maklumat dapat dibincangkan dan disalurkan dengan baik, maka ia
mewujudkan kefahaman yang lebih baik tentang tuntutan daripada kedua-dua domain kerja dan keluarga.
Kulik (2009) mengatakan bahawa sesebuah perkahwinan (keluarga) yang baik dicirikan apabila adanya kasih sayang, empati, dan memperuntukkan masa berkualiti yang meningkatkan
keintiman (keeratan) yang menjadikan sesebuah perkahwinan atau keluarga itu berkualiti dan stabil. Keintiman dan kestabilan ini diperoleh dengan adanya perkongsian aktiviti dan peranan dalam keluarga yang dilakukan bersama-sama yang mana ia akan membina komunikasi, empati
dan perasaan saling memahami antara ahli keluarga. Oleh itu, jika sesebuah keluarga berfungsi sepenuhnya terutamanya dalam komunikasi mereka maka, hubungan dengan keluarga tersebut
menjadi sumber yang dapat membantu pekerja dalam mengurangkan tuntutan daripada keluarga (cth: panggilan telefon waktu bekerja, kerja rumah, penjagaan anak). Dengan itu, FWC dapat diuruskan dengan baik.
Namun, dapatan yang diperoleh dalam kajian ini tidak menyokong hujah tersebut. Keputusan
kajian ini mendapati tiada kaitan signifikan antarakomunikasi keluarga dengan FWC. Keadaan ini mungkin dapat dijelaskan oleh latar belakang responden dalam kajian ini. Berdasarkan Jadual
2, 81.5 peratus responden adalah mereka yang berumur dalam lingkungan 26-45 tahun. Menurut kajian Huffman, Culbertson, Henning dan Goh (2014) berkaitan WFC dan umur, mereka yang
berada dalam lingkungan umur antara 25-49 tahun berada di peringkat kehidupan yang lazimnya tertumpu kepada pengukuhan keluarga dan kerjaya, di mana mereka berhadapan dengan peningkatan dalam tuntutan kerja dan keluarga. Oleh itu, mereka berpotensi untuk menghadapi
WFC dan FWC yang tinggi. Berbeza dengan lingkungan umur selepas itu iaitu peringkat empty nest (lebih daripada 55 tahun) di mana kajian menunjukkan peringkat umur melebihi 55 tahun
kurang terlibat dengan penjagaan anak di rumah, dan mereka dikaitkan dengan WFC yang paling minimum (Allen & Finkelstein 2014; Erickson et al. 2010).
Dengan majoriti responden dalam kajian ini yang berada pada sela umur 25 hingga 46 tahun, ini memberi petunjuk bahawa mereka terlibat dalam melaksanakan tanggungjawab, serta peranan
yang lebih banyak dalam kedua-dua domain kerja dan keluarga. Tugas dan tanggungjawab keibubapaan di rumah yang meningkat dikaitkan dengan peningkatan FWC (Aminah 2007; Huffman et al. 2014). Oleh itu, komunikasi keluarga tidak begitu memberi kesan kepada FWC
bagi golongan yang berada dalam kategori ini.
Hal ini adalah berkait rapat dengan ciri keluarga, terutamanya dari segi umur anak. Allen dan Finkelstein (2014) dalam kajian mereka mendedahkan bahawa FWC berlaku paling tinggi pada peringkat keluarga yang mempunyai anak berumur kurang daripada 5 tahun. Keadaan ini dapat
Journal of Management & Muamalah, Vol. 6, No. 2, 2016
eISSN 2180-1681
55
dilihat dalam kajian ini di mana, kajian ini turut melaporkan sebanyak 85 peratus responden
mempunyai anak yang berumur kurang daripada 6 tahun. Ciri keluarga dengan anak yang belum mencapai umur boleh berdikari mungkin menjadikan komunikasi keluarga tidak memberi impak signifikan dalam mengurangkan FWC. Ini kerana ahli keluarga tersebut tidak dapat memainkan
peranan sepenuhnya bagi membantu mengurangkan FWC kerana walaupun terdapat komunikasi dalam keluarga, tetapi ianya tidak efektif kerana anak yang berumur kurang daripada 6 tahun
sukar untuk memahami masalah ibu bapa mereka walaupun telah dijelaskan, malah kemungkinan besar akan meningkatkan lagi beban dan tuntutan daripada domain keluarga.
Kepentingan kepada ciri keluarga yang menjadikan peranan komunikasi keluarga lebih realistik ini mungkin dapat dijelaskan oleh kajian Telzer et. al (2013). Kajian mereka mendapati remaja
yang berada dalam lingkungan umur 14 hingga 17 serta mempunyai hubungan kekeluargaan yang baik/ (keluarga sebagai protective factor kerana berjaya menanamkan budaya family obligation) cenderung untuk membuat keputusan yang bijak di mana mereka lebih memikirkan
kepentingan keluarga berbanding dengan kehendak sendiri. Oleh itu mereka tidak banyak mendatangkan masalah kepada ibu bapa berbanding dengan golongan yang masih bergantung
sepenuhnya kepada ibu bapa. Telzer et al. (2013) menekankan bahawa remaja yang mempunyai sifat berkewajipan kepada keluarga (family obligation) lebih terkawal dari melakukan perkara-perkara yang berisiko kerana mereka mempunyai keupayaan untuk mengawal keinginan diri.
Justeru, apabila sesebuah landskap keluarga dicirikan oleh anak-anak yang belum boleh berdikari, maka walaupun terdapat komunikasi dalam keluarga tersebut namun ianya tidak dapat
bertindak sebagai sumber yang dapat mengurangkan FWC.
Selain itu, Telzer (2013) turut membandingkan tindakan dan tingkah laku berisiko antara remaja
yang mempunyai budaya family obligation, berbanding dengan remaja yang hanya rapat dengan keluarga dan mendapat sokongan keluarga. Ini mungkin menjawab persoalan bagaimana sebuah
keluarga yang mungkin digambarkan sebagai rapat, erat, fleksibel dan mempunyai komunikasi dengan baik, namun tidak mempengaruhi FWC. Persoalan kepada situasi in bukanlah sejauh
mana rapat dan erat sesebuah keluarga, tetapi jauh daripada itu adalah nilai yang dipegang oleh setiap ahli keluarga. Ini kerana, walaupun sesebuah keluarga tersebut saling berhubung dan
berkomunikasi dengan baik, melakukan aktiviti bersama-sama, namun pertalian dalam keluarga tersebut tidak sampai kepada satu nilai seperti budaya family obligation (Telzer 2013), yang mana kepentingan keluarga di dahulukan berbanding dengan kepentingan sendiri. Oleh itu,
dengan hanya melihat kepada peranan komunikasi keluarga secara tunggal sahaja mungkin menyebabkan kajian ini tidak memperoleh kaitan langsung kefungsian keluarga dengan FWC.
Daripada perbincangan yang telah dikemukakan, kajian merumuskan bahawa komunikasi keluarga adalah penting dalam memastikan keharmonian dan keseimbangan dalam pelaksanaan
kerja dan keluarga. Ini dibuktikan dengan dapatan kajian yang menunjukkan kaitan signifikan di antara komunikasi keluarga dengan WFC di mana mereka yang mempunyai komunikasi yang
baik, saling memahami dan empati terhadap ahli keluarga yang lain akan dapat menguruskan WFC dengan baik.Dalam kehidupan yang semakin mencabar masa kini di mana manusia semakin sibuk dengan kerja dan aktiviti masing-masing, individu tidak dapat lari daripada
Journal of Management & Muamalah, Vol. 6, No. 2, 2016
eISSN 2180-1681
56
tekanan yang banyak dikaitkan dengan implikasi negatif. Oleh itu, persekitaran keluarga yang
harmoni, saling mengambil berat, serta berupaya untuk berkomunikasi dengan baik dapat membantu mereka yang berada dalam situasi tekanan untuk mengatur kembali tuntutan daripada kedua-dua domain kerja dan keluarga.
Pelbagai inisiatif boleh dilaksanakan bagi membantu pekerja membina hubungan yang baik
dengan keluarga. Organisasi boleh berperanan dengan mengadakan program bersesuaian yang melibatkan keluarga pekerja. Selain daripada program hari keluarga yang biasa dilaksanakan oleh organisasi, keluarga pekerja juga perlu didedahkan kepada program berkaitan tugas-tugas
yang ada dalam organisasi. Misalnya, mengadakan ‗organisasi terbuka‘ dengan menjemput keluarga untuk sama-sama terlibat, mengadakan dialog dan seumpamanya, yang mana program
yang dirangka bertujuan untuk menyalurkan maklumat berkaitan kerja kepada keluarga
RUJUKAN
Ali, A., Van Der Zee, K. & Sanders, G. (2003). Determinants of intercultural adjustment among
expatriate spouses. International Journal of Intercultural Relations. 27 (5):563-580. Allen, T. D., Herst, D. E., L.Bruck, C. S. & Sutton, M. (2000). Consequences associated with
work-to-family conflict: A review and agenda for future research. Journal of Occupational Health Psychology 5 (2):278-308.
Allen, T. D., & Finkelstein, L. M. (2014). Work–family conflict among members of full-time
dual-earner couples : an examination of family life stage , gender , and age work–family
conflict among members of full-time dual-earner couples : an examination. Journal of Occupational Health Psychology.http://dx.doi.org/10.1037/a0036941
Aminah Ahmad. (2007). Work-family conflict, life-cycle stage, social support, and coping
strategies among women employees. The Journal of Human Resource and Adult
Learning 3 (1):70-79.
Amstad, F. T., Meier, L. L., Fasel, U, .Elfering, A. & Semmer, N. K. (2011). A meta-analysis of work-family conflict and various outcomes with a special emphasis on cross-domain versus matching-domain relations. Journal of Occupational Health Psychology.
Anderson, S. E., Coffey, B. S. & Byerly, R. T. (2002). Formal organizational initiatives and
informal workplace practices: Links to work-family conflict and job-related outcomes. Journal of Management 28:787.
Aryee, S.Fields, D. & Luk, V. (1999). A cross-cultural test of a model of the work-family interface. Journal of Management 25 (4):491-511.
Journal of Management & Muamalah, Vol. 6, No. 2, 2016
eISSN 2180-1681
57
Behnke, A. O., Macdermid, S. M., Coltrane, S. L.Parke, R. D.Duffy, S. & Widaman, K. F.
(2008). Family cohesion in the lives of Mexican American and European American parents. Journal of Marriage and Family 70 (November):1045-1059.
Bellavia, G., Frone, M. (2005). Work family conflict. handbook of work stress http//www.sage.ereference.com/hdbk_workstress/Article_n6.html.
Berkman, L. F., Liu, S. Y., Hammer, L., Moen, P., Klein, L. C., Kelly, E., Fay, M., Davis, K.,
Durham, M., Karuntzos, G., & Buxton, O. M. (2015). Work–Family Conflict,
Cardiometabolic Risk, and Sleep Duration in Nursing Employees. Journal of Occupational Health Psychology. Advance online publication.
http://dx.doi.org/10.1037/a0039143 Calder, B. J., Phillips, L. W. & Tybout, A. M. (1981). Designing research for application. The
Journal of Consumer Research 8 (2).
Caliguiri, P. M., Hyland, M.M., & Bross, A.S. (1998). Testing a theoretical model for examining the relationship between family adjustment and expatriates' work adjustment. Journal of Applied Psychology 83 (4):598-614.
Carlson, D. S. & Grzywacz, J. G. (2008). Reflections and future directions on measurement in
work-family research. Dlm., K.Korabik, D. S. Lero & D.L. Whitehead. Handbook of work-family integration. Research, theory and best practices: Academic Press.
Clark, S. C. (2000). Work/family border theory: A new theory of work/family balance. Human Relations 53 (6):47-770.
Eagle, B. W., Icenogle, M. L., Maes, J. D. & Miles, E. W. (1998). The importance of employee
demographic profiles for understanding experiences of work-family interrole conflicts.
Journal of Social Psychology 138 (6):690-709.
Eby, L. T., Casper, W. J., Lockwood, A., Bordeaux, C. & Brinley, A. (2005). Work and family research in io/ob: Content analysis and review of the literature (1980-2002). Journal of Vocational Behavior 66 (1):124-197.
Erickson, J. J., Martinengo, G. & Hill, E. J. (2010). Putting work and family experiences in
context: Differences by family life stage. Human Relations 63 (7):955-979. Frone, M. R., Russell, M. & Cooper, M. L. (1992). Antecedents and outcomes of work-family
conflict: Testing a model of the work-family interface. Journal of Applied Psychology 77 (1):65-78.
Journal of Management & Muamalah, Vol. 6, No. 2, 2016
eISSN 2180-1681
58
Frone, M. R., Russell, M., & Cooper, M. L. (1992a). Prevalence of work-family conflict: Are
work and family boundaries asymmetrically permeable? Journal of Organizational Behavior 13: 723–729.
Greenhaus, J. H. & Beutell, N. J. (1985). Sources of conflict between work and family roles.
Academy of Management Review 10 (1):76-88.
Grzywacz, J. G. & Bass, B. L. (2003). Work, family, and mental health: Testing different models of work-family fit. Journal of Marriage and Family 65 (1):248-261.
Grzywacz, J. G., Frone, M. R., Brewer, C. S. & Kovner, C. T. (2006). Quantifying work-family conflict among registered nurses. Research in Nursing & Health 29:414-426.
Haines, V. Y., Marchand, A., & Rousseau, V. (2008). The mediating role of work-to-family conflict in the relationship between shiftwork and depression, 22(4): 341-356.
Hammer, B. L., Bauer, T.N & Grandey, A.A. (2003). Work-family conflict and work-related withdrawal behaviors. Journal of Business and Psychology 17 (3):419-436.
Hobfoll, S. E. (1989). Conservation of resources: A new attempt at conceptualizing stress. American Psychologist 44 (3):513-524.
Huffman, A., Culbertson, S. S., Henning, J. B., & Goh, A.(2014). Work-family conflict across
the lifespan. Journal of Managerial Psychology 28:761–780. doi:10.1108/JMP-07-2013-
0220
Hurst, K. (2006). Nursing by numbers. Nursing Standard October 21 (7):22-25 Kahn, R. L., Wolfe, D. M., Quinn, R., Snoek, J. D. & Rosenthal, R. A.(1964). Organizational
stress. New York: Wiley.
Kulik, L., & Rayyan, Faisal. (2006). Relationships between dual-earner spouses, strategies for coping with homework demands and emotional well-being. Community, Work and Family 9 (4):457-477.
Lee, M.Vernon-Feagans, L.Vazquez, A. & Kolak, A. (2003). The influence of family
environment and child temperament on work/family role strain for mothers and fathers. Infant & Child Development 12 (5):421-439.
Lin Qiu & Jinyan Fan (2015). Family boundary characteristics, work–family conflict and life satisfaction: A moderated mediation model, International Journal of Psychology 50(5):
336–344, DOI: 10.1002/ijop.12107

Journal of Management & Muamalah, Vol. 6, No. 2, 2016
eISSN 2180-1681
59
Mesmer-Magnus, J. R. & Viswesvaran, C. (2005). Convergence between measures of work-to-
family and family-to-work conflict a meta-analytic examination. Journal of Vocational Behavior 67:215-232.
Michel, J. S., Kotrba, L. M., Mitchelson, J. K., Clark, M. A. & Baltes, B. B. (2011). Antecedents of work–family conflict: A meta-analytic review. Journal of Organizational Behavior 32
(5):689-725. Olson, D. H. (2000). Circumplex model of marital and family sytems. Journal of Family
Therapy 22 (2):144-167.
Parikh, P., Taukari, A., & Bhattacharya, T. (2004).Occupational stress and coping among nurses. Journal of Health Management, 6(2):115-127 http://jhm.sagepub.com/cgi/content/refs/6/2/115
Patterson, J. M.(2002a). Understanding family resilience. Journal of Clinical Psychology 58
(3):233-246 Patterson, J. M. (2002b). Integrating family resilience and family stress theory. Journal of
Marriage and Family 64 (2):349-360.
Shaffer, M.A., Joplin, J.R.W., Hsu, Yu-Shan. (2011). Expanding the boundaries of work--family research: A review and agenda for future research. International Journal of Cross Cultural Management 11(2): 221-268.
Telzer E. H., Fuligni, A.J., Lieberman,M. D., & Galván, (2013). Meaningful family
relationships: neurocognitive buffers of adolescent risk taking. J Cogn Neurosci. 25(3): 374–387.
Twigg, D., & Duffield, C. (2009). A review of workload measures: a context for a new staffing methodology in Western Australia. International Journal of Nursing Studies, 46(1):132–
140.
Tyson, P. D., & Pongruengphant, R. (2004). Five-year follow-up study of stress among nurses in public and private hospitals in Thailand. International Journal of Nursing Studies,
41(3):247–54.
Van Den Berg, T. I. J., Landeweerd, J. A., Tummers, G. E. R., & Van Merode, G. G. (2006). A comparative study of organisational characteristics , work characteristics and nurses‘
psychological work reactions in a hospital and nursing home setting.International Journal of NursingStudies 43:491–505.
Journal of Management & Muamalah, Vol. 6, No. 2, 2016
eISSN 2180-1681
60
Van der Heijden, B. I. J. M., Demerouti, E., & Bakker, A. B. (2008). Work-home interference
among nurses: reciprocal relationships with job demands and health. Journal of Advanced Nursing, 62(5):572–84.
Voydanoff, P. (1988). Work role characteristics, family structure demands, and work/family conflict. Journal of Marriage and the Family 50 (3).
Yildirim, D., & Aycan, Z. (2008). Nurses‘ work demands and work – family conflict : A
questionnaire survey. International Journal of Nursing Studies 45:1366–1378.
Zaiton, H., Dollard, M. F. & Winefield, A. H. (2010). Work-family conflict in east vs western
countries. Cross Cultural Management: An International Journal 17 (1):30-49. Zhang, J. & Liu, Y. (2011). Antecedents of work-family conflict: Review and prospect.
International Journal of Business and Management, 6 (1):89-103.
Normazaini Saleh
Fakulti Pengurusan dan Muamalah,
Kolej Universiti Islam Antarabangsa Selangor [email protected]
Journal of Management & Muamalah, Vol. 6, No. 2, 2016
eISSN 2180-1681
61
Customer Satisfaction Analysis of Sharia Business Unit In
Yogyakarta
(Analisis Kepuasan Nasabah Pada Unit Usaha Syariah Bank Di Yogyakarta)
Aidha Trisanty, Arief Darmawan & Arif Darmawan
Universitas Islam Indonesia Sleman Yogyakarta, Indonesia
ABSTRACT This study is carried out to analyse the customer satisfaction at the Sharia Business Unit at a bank in Yogyakarta. The data for the study is collected using the CARTER method specifically
used with the sharia banking industry. The analysis was carried out using Importance Performance Analisis, gap analysis and Cartesian diagram. The results showed that expectations
(interest) of the existing customers of Sharia Business Unit in Yogyakarta is very high. Gap analysis results indicates an overall negative gap of 0.9 on the satisfaction of existing customers, meaning that the customers of Sharia Business Unit in Yogyakarta do not satisfied for services
received.
Keywords: Sharia bank, customer satisfaction, CARTER model, excellent service
ABSTRAK
Kajian ini bertujuan menganalisa tahap kepuasan pelanggan pada Unit Usaha Syariah Bank di Yogyakarta. Berdasarkan Importance Performance Analisis, analisis gap dan diagram kartesius,
hasil kajian menunjukkan harapan pelanggan terhadap Unit Usaha Syariah di Yogyakarta sangat tinggi. Hasil analisis gap menunjukkan adanya gap negatif secara keseluruhan sebanyak 0.9. Ia jelas menunjukkan pelanggan Unit Usaha Syariah di Yogyakarta tidak berpuas hati atas
layanan yang diterima oleh mereka.
Kata kunci: Bank Shariah, kepuasan pelanggan, model CARTER, perkhidmatan cemerlang
INTRODUCTION
Islamic banking has been growing rapidly in the last two decades. The escalation of Islamic banking has begun since the issue of the Law No. 10 of 1998 regulating the legal basis and the types of business that can be implemented along with the various policies of Bank Indonesia and
the fatwa of Indonesian Ulema Council (MUI) regarding the prohibition of bank interest, which
further encourages the growth of the Islamic banking industry. According to data from Bank Indonesia, by the end of June 2015, there have been 12 Islamic General Banks, 22 Sharia Business Units and 161 Sharia Rural Banks. The development can also be seen from the growth

Journal of Management & Muamalah, Vol. 6, No. 2, 2016
eISSN 2180-1681
62
of Islamic bank offices network development over the last five years of an average of twenty per
cent annually. The increasing number of players in this business certainly adds to a complication for an existing
competition. The existing conventional banks with an established wider network of offices offer more challenges for Islamic banks.
The development of the Islamic bank in Indonesia was also marked by the presence of conventional banks that also offered Islamic services through the Sharia Business Unit (SBU)
which aims to provide an alternative service for customers who want to transact according to sharia. By June 2015, there have been twenty-two (22) Sharia Business Units with network
services agencies of 327 offices (Bank Indonesia, 2016). Sharia Business Unit is a business unit of the head office of a conventional commercial bank that
serves as the head office of the office or unit conducting business based on sharia principles, or a unit of a branch office of a bank domiciled abroad conducting conventional business and serving
as the head office of sharia branch offices and/or sharia units (Bank Indonesia, 2016). The total percentage of Sharia office network today is eleven per cent compared to the overall
network of existing Islamic bank offices. It is certainly a challenge for the Sharia Business Unit in the Islamic banking industry. The challenge is not only from other Islamic banks, but also
from a conventional commercial bank which serves as its main and is under one management. This challenge also applies in the market share of Islamic banks which still controls less than five per cent share of the banking market as a whole indicating the lack of interest of the community
to transact through Islamic banks.
Challenges to survive amidst the present competition are also felt by the Sharia Unit Business in the region of Yogyakarta. In Yogyakarta province, there are two Sharia Business Units of conventional bank that opened its services namely, the Bank BTN Syariah as Sharia Business
Unit of PT. Bank Tabungan Negara (Persero) Tbk and Bank BPD DIY Syariah as Sharia Business Unit of PT. Bank BPD DIY which is owned by the regional banks of Yogyakarta
Provincial Government. Sharia is required to keep on finding ways to survive and to win the competition. One of which is
by making the customers loyal, as expressed by Ahsanul Haque et al. (2009) that customer loyalty will make Islamic banking survive. Thus, banks must provide them with quality products
and satisfying service to ensure their loyalty. In line with this, Kishada and Wahab (2013) in their study suggest that customer satisfaction and loyalty are closely related, and that the most influential factor of customer satisfaction is their trust on the Islamic banks.
Gaining knowledge on customer satisfaction, according Hazlina et al. (2011) can be done by
measuring the quality of service. This is in line with Thompson, De Souza and Gale (1985) who
Journal of Management & Muamalah, Vol. 6, No. 2, 2016
eISSN 2180-1681
63
articulate that the provision of good quality services (delivery of high service) is one way to
survive in the services business. The Sharia Business Unit, which is a service unit of a conventional bank, would definitely bump
up with hurdles to overcome. Thus, the quality of service to customers should be a top priority in order to meet the desires and expectations of the customers so that they are satisfied. The
satisfaction will surely contribute positively to the company because it can increase customer loyalty, which in turn will help the company to survive and win the competition.
LITERATURE REVIEW There are some relevant studies related to this study, one of which is the one conducted by Othman and Owen (2001), which suggests that the quality of service is very important in the
Islamic banking industry. For the measurement of quality of service, we can use the CARTER method that has more complete dimensions variable because there is a dimension of compliance
related to compliance with sharia elements. This method offers a unique and original measurement to determine customer satisfaction through six dimensions used.
Osman et al. (2009) conducted a study on customer satisfaction in the Malaysian Islamic Banking by using CARTER. This study showed that reliability dimension (mean 5:05) is
considered the most important factor in choosing a financial Islamic institution. Meanwhile, the next dimensions are assurance, tangibles, empathy, responsiveness and compliance.
The other study was conducted by Khafafa and Safii (2013), which measures customer satisfaction in the Libyan bank operated with the Islamic system. This study measures the
dimensions of service quality and its impact on customer satisfaction. Using the model of SERVQUAL (service quality) dimensions of service quality to be studied is a tangible dimension, assurance, reliability, responsiveness and empathy. The study also examines the level
of public awareness of the concept of Islamic banking products and services. This study shows that there is a positive and significant relationship between customer satisfaction and provided
quality of services to the tangible dimension, responsiveness, assurance and empathy.
2.1 Customer Satisfaction
According to Kotler (2012) satisfaction is a pleasant feeling on the performance or perceived outcome according to expectations. Satisfaction can also be interpreted as a sense of excitement when it reaches the expected goal (Boonlertvanich, 2011). Hoq and Amin (2010) state that
satisfaction is one of the most important factors to increase customer loyalty. Customers who feel very satisfied, will highly unlikely to switch to another bank. Empirical research also states
that a satisfied customer will come back to make another purchase again and again and will make positive promotion through word-of-mouth communication (Blodgett and Anderson, 2000; Maxham and Netemeyer, 2002).
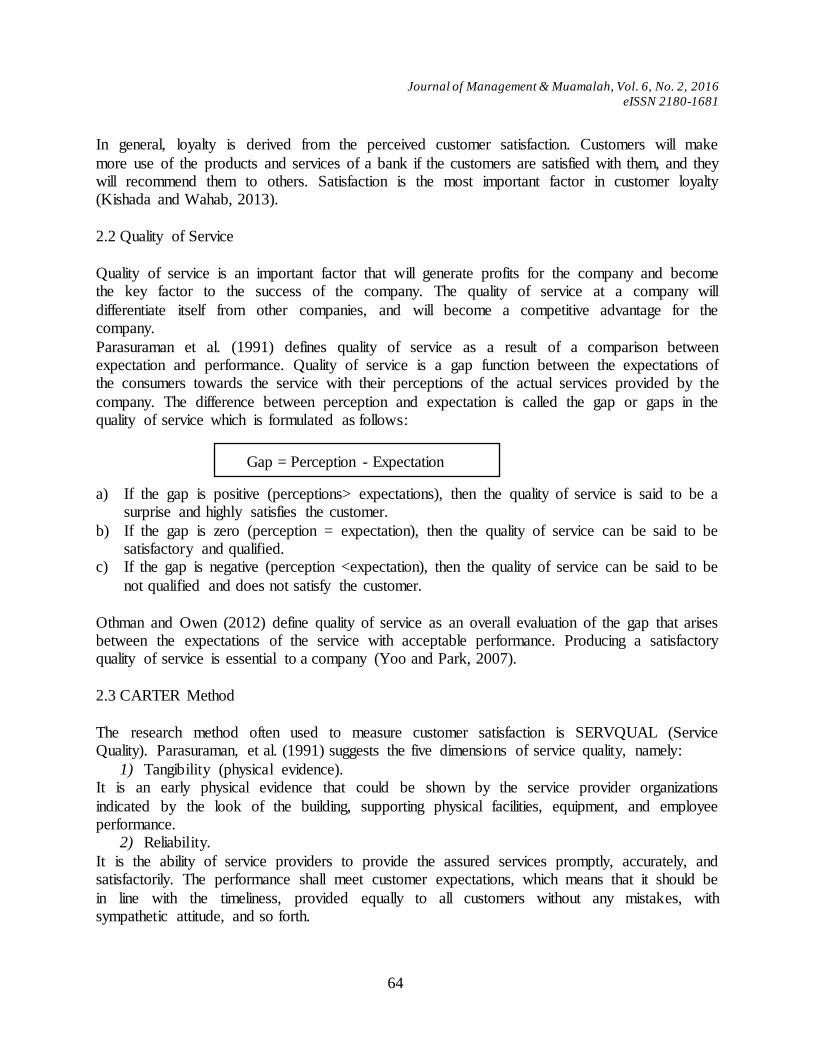
Journal of Management & Muamalah, Vol. 6, No. 2, 2016
eISSN 2180-1681
64
Gap = Perception - Expectation
In general, loyalty is derived from the perceived customer satisfaction. Customers will make
more use of the products and services of a bank if the customers are satisfied with them, and they will recommend them to others. Satisfaction is the most important factor in customer loyalty (Kishada and Wahab, 2013).
2.2 Quality of Service
Quality of service is an important factor that will generate profits for the company and become the key factor to the success of the company. The quality of service at a company will
differentiate itself from other companies, and will become a competitive advantage for the company.
Parasuraman et al. (1991) defines quality of service as a result of a comparison between expectation and performance. Quality of service is a gap function between the expectations of the consumers towards the service with their perceptions of the actual services provided by the
company. The difference between perception and expectation is called the gap or gaps in the quality of service which is formulated as follows:
a) If the gap is positive (perceptions> expectations), then the quality of service is said to be a surprise and highly satisfies the customer.
b) If the gap is zero (perception = expectation), then the quality of service can be said to be satisfactory and qualified.
c) If the gap is negative (perception <expectation), then the quality of service can be said to be
not qualified and does not satisfy the customer.
Othman and Owen (2012) define quality of service as an overall evaluation of the gap that arises between the expectations of the service with acceptable performance. Producing a satisfactory quality of service is essential to a company (Yoo and Park, 2007).
2.3 CARTER Method
The research method often used to measure customer satisfaction is SERVQUAL (Service Quality). Parasuraman, et al. (1991) suggests the five dimensions of service quality, namely:
1) Tangibility (physical evidence). It is an early physical evidence that could be shown by the service provider organizations
indicated by the look of the building, supporting physical facilities, equipment, and employee performance.
2) Reliability.
It is the ability of service providers to provide the assured services promptly, accurately, and satisfactorily. The performance shall meet customer expectations, which means that it should be
in line with the timeliness, provided equally to all customers without any mistakes, with sympathetic attitude, and so forth.
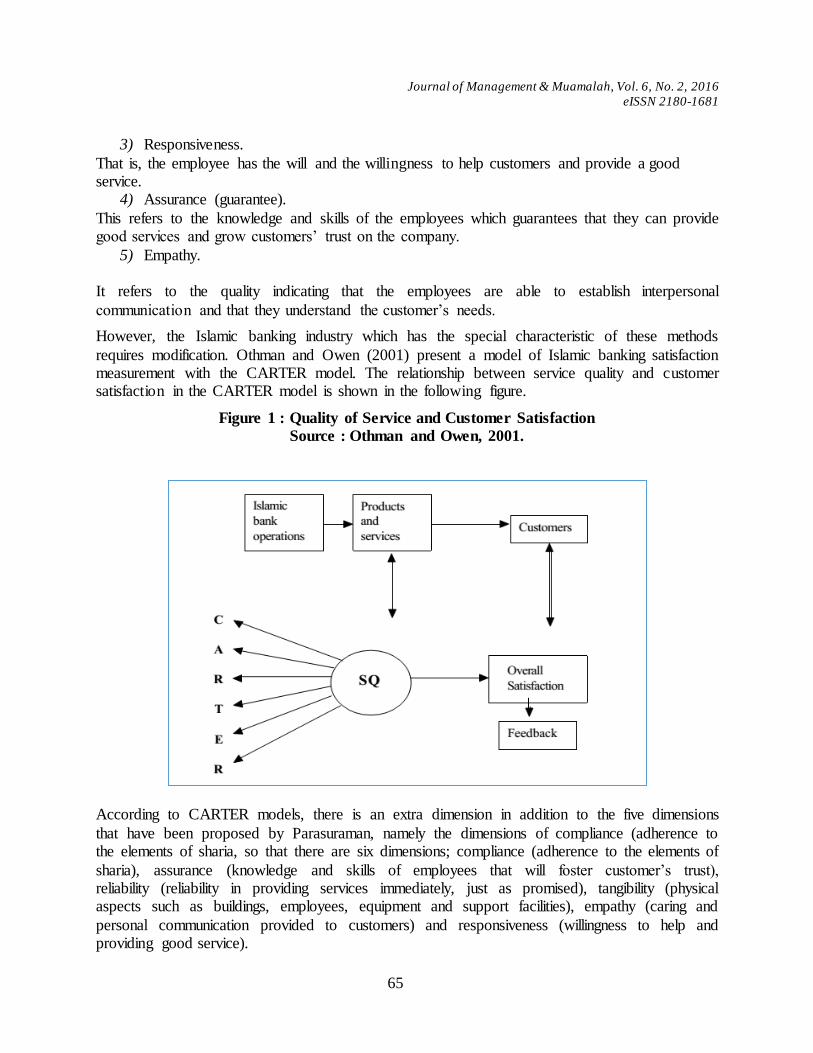
Journal of Management & Muamalah, Vol. 6, No. 2, 2016
eISSN 2180-1681
65
3) Responsiveness.
That is, the employee has the will and the willingness to help customers and provide a good service.
4) Assurance (guarantee).
This refers to the knowledge and skills of the employees which guarantees that they can provide good services and grow customers‘ trust on the company.
5) Empathy. It refers to the quality indicating that the employees are able to establish interpersonal
communication and that they understand the customer‘s needs.
However, the Islamic banking industry which has the special characteristic of these methods
requires modification. Othman and Owen (2001) present a model of Islamic banking satisfaction measurement with the CARTER model. The relationship between service quality and customer satisfaction in the CARTER model is shown in the following figure.
Figure 1 : Quality of Service and Customer Satisfaction
Source : Othman and Owen, 2001.
According to CARTER models, there is an extra dimension in addition to the five dimensions
that have been proposed by Parasuraman, namely the dimensions of compliance (adherence to the elements of sharia, so that there are six dimensions; compliance (adherence to the elements of
sharia), assurance (knowledge and skills of employees that will foster customer‘s trust), reliability (reliability in providing services immediately, just as promised), tangibility (physical aspects such as buildings, employees, equipment and support facilities), empathy (caring and
personal communication provided to customers) and responsiveness (willingness to help and providing good service).
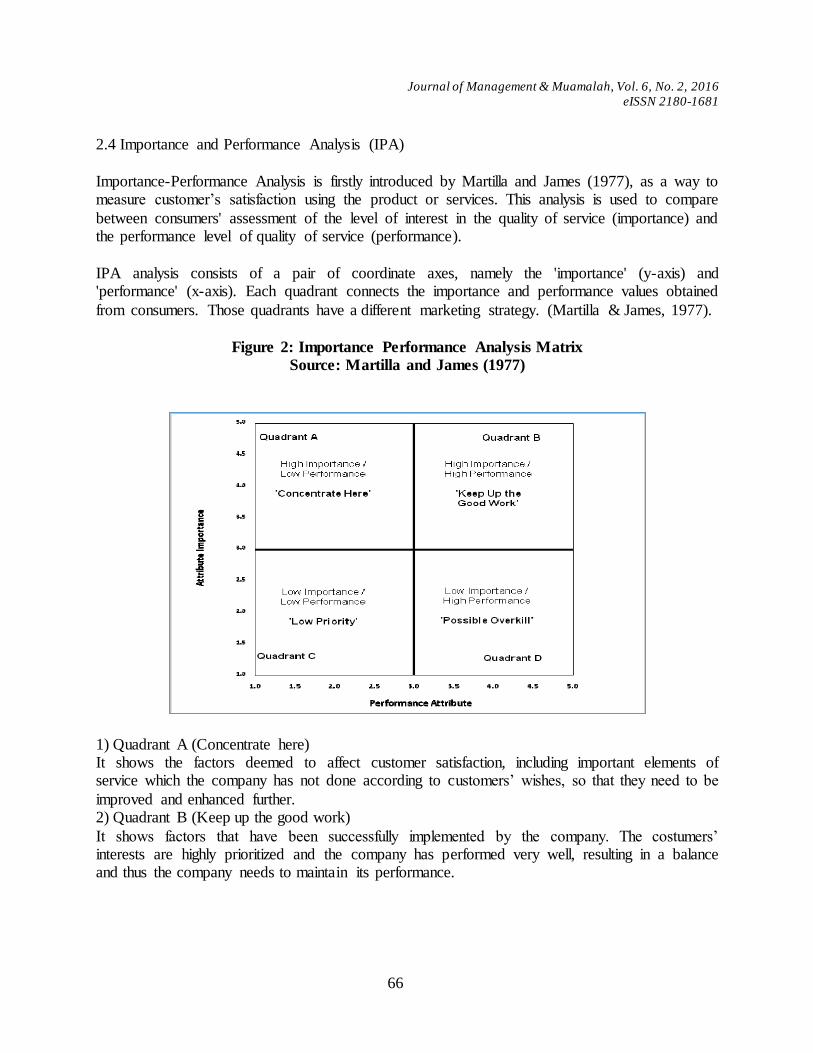
Journal of Management & Muamalah, Vol. 6, No. 2, 2016
eISSN 2180-1681
66
2.4 Importance and Performance Analysis (IPA)
Importance-Performance Analysis is firstly introduced by Martilla and James (1977), as a way to measure customer‘s satisfaction using the product or services. This analysis is used to compare
between consumers' assessment of the level of interest in the quality of service (importance) and the performance level of quality of service (performance).
IPA analysis consists of a pair of coordinate axes, namely the 'importance' (y-axis) and 'performance' (x-axis). Each quadrant connects the importance and performance values obtained
from consumers. Those quadrants have a different marketing strategy. (Martilla & James, 1977).
Figure 2: Importance Performance Analysis Matrix
Source: Martilla and James (1977)
1) Quadrant A (Concentrate here) It shows the factors deemed to affect customer satisfaction, including important elements of service which the company has not done according to customers‘ wishes, so that they need to be
improved and enhanced further. 2) Quadrant B (Keep up the good work)
It shows factors that have been successfully implemented by the company. The costumers‘ interests are highly prioritized and the company has performed very well, resulting in a balance and thus the company needs to maintain its performance.
Journal of Management & Muamalah, Vol. 6, No. 2, 2016
eISSN 2180-1681
67
3) Quadrant C (Low priority)
It shows factors that have less important effect on costumers. The interests of consumers are at a low level, and the company delivers exceptional performance - mediocre. 4) Quadrant D (Possible overkill)
It shows the factors that affect less important to customers but the implementation of which is excessive. It is considered to be less important but turn out to be very satisfying.
METHODOLOGY The object of this study is the Sharia Business Unit in the region of Yogyakarta. The population
covers all the customers of Sharia banks in the business unit which are at Bank BTN Syariah and Bank BPD Syariah. Methods of data collection is through questionnaires provision towards existing customers in the Sharia Business Unit using CARTER method which has six dimensions, namely compliance,
assurance, reliability, tangibility, empathy and responsiveness. To determine whether there are differences between the importance of a service to the actual performance of these services, gap
analysis is used. The statistical methods used were average. The smaller the gap, the bigger is the customer satisfaction.
In addition, the analysis was also done using Importance Performance Analysis (IPA) as a tool to evaluate the quality of existing services.
EMPIRICAL RESULTS
Importance Performance Analysis
This analysis classifies the average assessment of significance (importance) of customers for
service quality of Sharia Business Unit with intervals. The interval (Imam Ghozali, 2006) is determined by the following manner:
The highest = 5 5 – 1 = 4
The lowest =1
Interval = 4 = 0.8 5 With a five point scale, the obtained interval is as follows:
1 – 1.79 = very low 1.8 – 2.59 = low
2.6 – 3.399 = fairly low 3.4 – 4.19 = high 4.2 – 5 = very high
The average rating of the customers‘ interest on the quality of service on Sharia in Yogyakarta can be seen in the table 1:
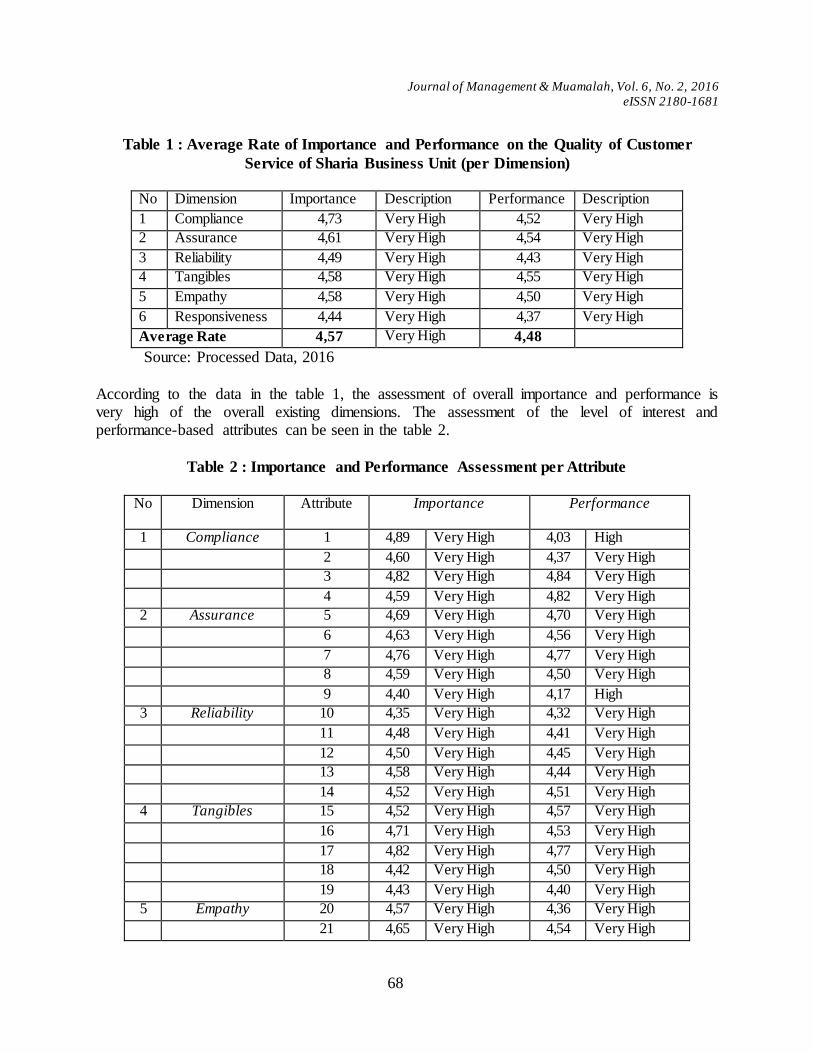
Journal of Management & Muamalah, Vol. 6, No. 2, 2016
eISSN 2180-1681
68
Table 1 : Average Rate of Importance and Performance on the Quality of Customer
Service of Sharia Business Unit (per Dimension)
No Dimension Importance Description Performance Description
1 Compliance 4,73 Very High 4,52 Very High
2 Assurance 4,61 Very High 4,54 Very High
3 Reliability 4,49 Very High 4,43 Very High
4 Tangibles 4,58 Very High 4,55 Very High
5 Empathy 4,58 Very High 4,50 Very High
6 Responsiveness 4,44 Very High 4,37 Very High
Average Rate 4,57 Very High 4,48
Source: Processed Data, 2016
According to the data in the table 1, the assessment of overall importance and performance is very high of the overall existing dimensions. The assessment of the level of interest and performance-based attributes can be seen in the table 2.
Table 2 : Importance and Performance Assessment per Attribute
No Dimension Attribute Importance
Performance
1 Compliance 1 4,89 Very High 4,03 High
2 4,60 Very High 4,37 Very High
3 4,82 Very High 4,84 Very High
4 4,59 Very High 4,82 Very High
2 Assurance 5 4,69 Very High 4,70 Very High
6 4,63 Very High 4,56 Very High
7 4,76 Very High 4,77 Very High
8 4,59 Very High 4,50 Very High
9 4,40 Very High 4,17 High
3 Reliability 10 4,35 Very High 4,32 Very High
11 4,48 Very High 4,41 Very High
12 4,50 Very High 4,45 Very High
13 4,58 Very High 4,44 Very High
14 4,52 Very High 4,51 Very High
4 Tangibles 15 4,52 Very High 4,57 Very High
16 4,71 Very High 4,53 Very High
17 4,82 Very High 4,77 Very High
18 4,42 Very High 4,50 Very High
19 4,43 Very High 4,40 Very High
5 Empathy 20 4,57 Very High 4,36 Very High
21 4,65 Very High 4,54 Very High
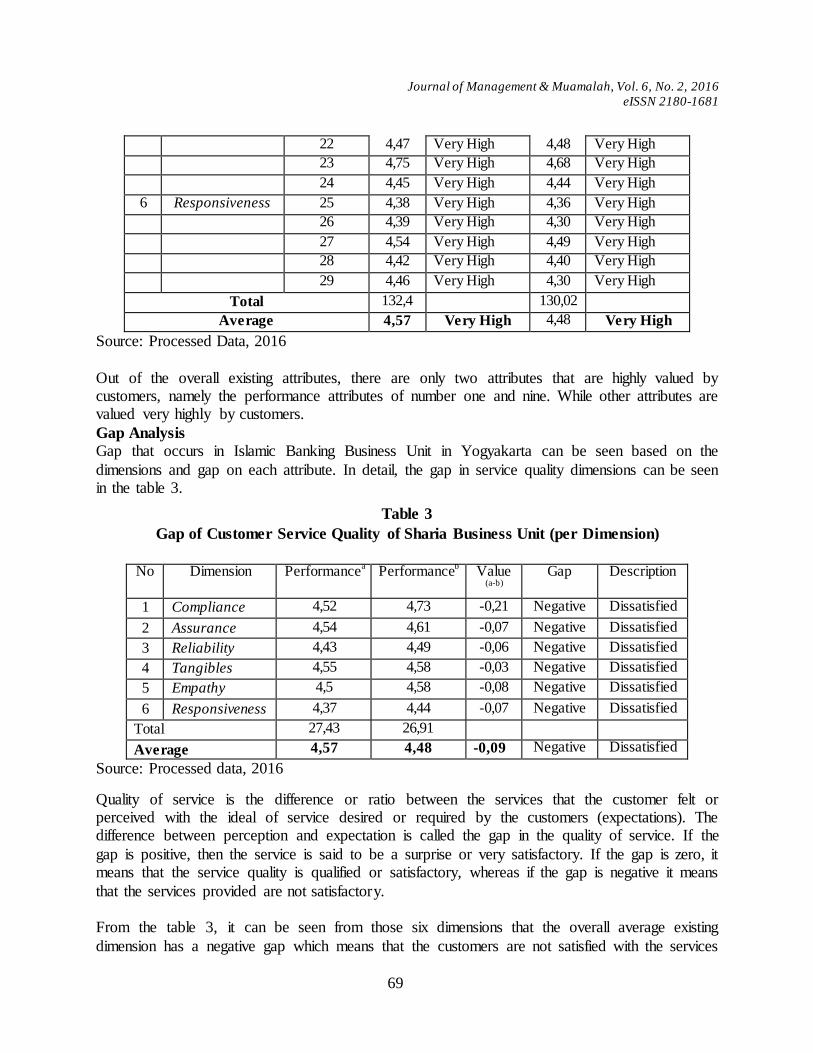
Journal of Management & Muamalah, Vol. 6, No. 2, 2016
eISSN 2180-1681
69
22 4,47 Very High 4,48 Very High
23 4,75 Very High 4,68 Very High
24 4,45 Very High 4,44 Very High
6 Responsiveness 25 4,38 Very High 4,36 Very High
26 4,39 Very High 4,30 Very High
27 4,54 Very High 4,49 Very High
28 4,42 Very High 4,40 Very High
29 4,46 Very High 4,30 Very High
Total 132,4 130,02
Average 4,57 Very High 4,48 Very High
Source: Processed Data, 2016
Out of the overall existing attributes, there are only two attributes that are highly valued by customers, namely the performance attributes of number one and nine. While other attributes are valued very highly by customers.
Gap Analysis
Gap that occurs in Islamic Banking Business Unit in Yogyakarta can be seen based on the
dimensions and gap on each attribute. In detail, the gap in service quality dimensions can be seen in the table 3.
Table 3
Gap of Customer Service Quality of Sharia Business Unit (per Dimension)
No Dimension Performance
a Performance
b Value
(a-b) Gap Description
1 Compliance 4,52 4,73 -0,21 Negative Dissatisfied
2 Assurance 4,54 4,61 -0,07 Negative Dissatisfied
3 Reliability 4,43 4,49 -0,06 Negative Dissatisfied
4 Tangibles 4,55 4,58 -0,03 Negative Dissatisfied
5 Empathy 4,5 4,58 -0,08 Negative Dissatisfied
6 Responsiveness 4,37 4,44 -0,07 Negative Dissatisfied
Total 27,43 26,91
Average 4,57 4,48 -0,09 Negative Dissatisfied
Source: Processed data, 2016
Quality of service is the difference or ratio between the services that the customer felt or perceived with the ideal of service desired or required by the customers (expectations). The difference between perception and expectation is called the gap in the quality of service. If the
gap is positive, then the service is said to be a surprise or very satisfactory. If the gap is zero, it means that the service quality is qualified or satisfactory, whereas if the gap is negative it means
that the services provided are not satisfactory. From the table 3, it can be seen from those six dimensions that the overall average existing
dimension has a negative gap which means that the customers are not satisfied with the services
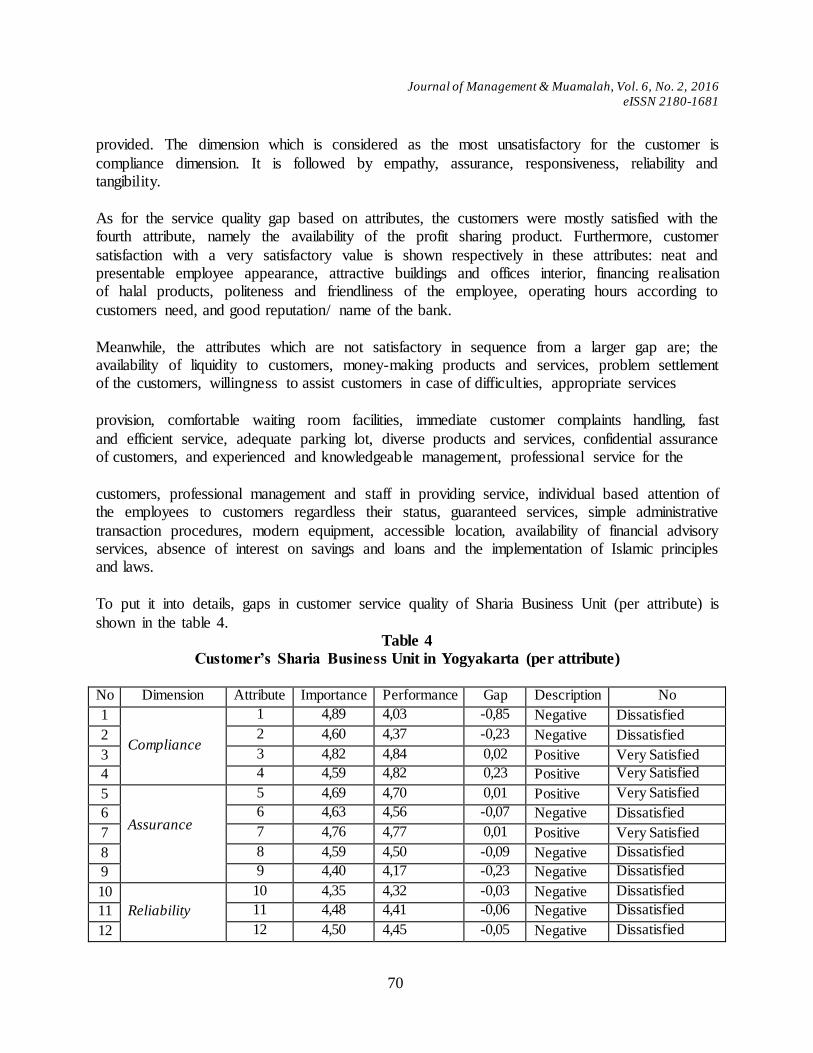
Journal of Management & Muamalah, Vol. 6, No. 2, 2016
eISSN 2180-1681
70
provided. The dimension which is considered as the most unsatisfactory for the customer is
compliance dimension. It is followed by empathy, assurance, responsiveness, reliability and tangibility.
As for the service quality gap based on attributes, the customers were mostly satisfied with the fourth attribute, namely the availability of the profit sharing product. Furthermore, customer
satisfaction with a very satisfactory value is shown respectively in these attributes: neat and presentable employee appearance, attractive buildings and offices interior, financing realisation of halal products, politeness and friendliness of the employee, operating hours according to
customers need, and good reputation/ name of the bank.
Meanwhile, the attributes which are not satisfactory in sequence from a larger gap are; the availability of liquidity to customers, money-making products and services, problem settlement of the customers, willingness to assist customers in case of difficulties, appropriate services
provision, comfortable waiting room facilities, immediate customer complaints handling, fast
and efficient service, adequate parking lot, diverse products and services, confidential assurance of customers, and experienced and knowledgeable management, professional service for the
customers, professional management and staff in providing service, individual based attention of the employees to customers regardless their status, guaranteed services, simple administrative
transaction procedures, modern equipment, accessible location, availability of financial advisory services, absence of interest on savings and loans and the implementation of Islamic principles and laws.
To put it into details, gaps in customer service quality of Sharia Business Unit (per attribute) is
shown in the table 4. Table 4
Customer’s Sharia Business Unit in Yogyakarta (per attribute)
No Dimension Attribute
Importance Performance
Gap Description No
1
Compliance
1 4,89 4,03 -0,85 Negative Dissatisfied
2 2 4,60 4,37 -0,23 Negative Dissatisfied
3 3 4,82 4,84 0,02 Positive Very Satisfied
4 4 4,59 4,82 0,23 Positive Very Satisfied
5
Assurance
5 4,69 4,70 0,01 Positive Very Satisfied
6 6 4,63 4,56 -0,07 Negative Dissatisfied
7 7 4,76 4,77 0,01 Positive Very Satisfied
8 8 4,59 4,50 -0,09 Negative Dissatisfied
9 9 4,40 4,17 -0,23 Negative Dissatisfied
10
Reliability
10 4,35 4,32 -0,03 Negative Dissatisfied
11 11 4,48 4,41 -0,06 Negative Dissatisfied
12 12 4,50 4,45 -0,05 Negative Dissatisfied
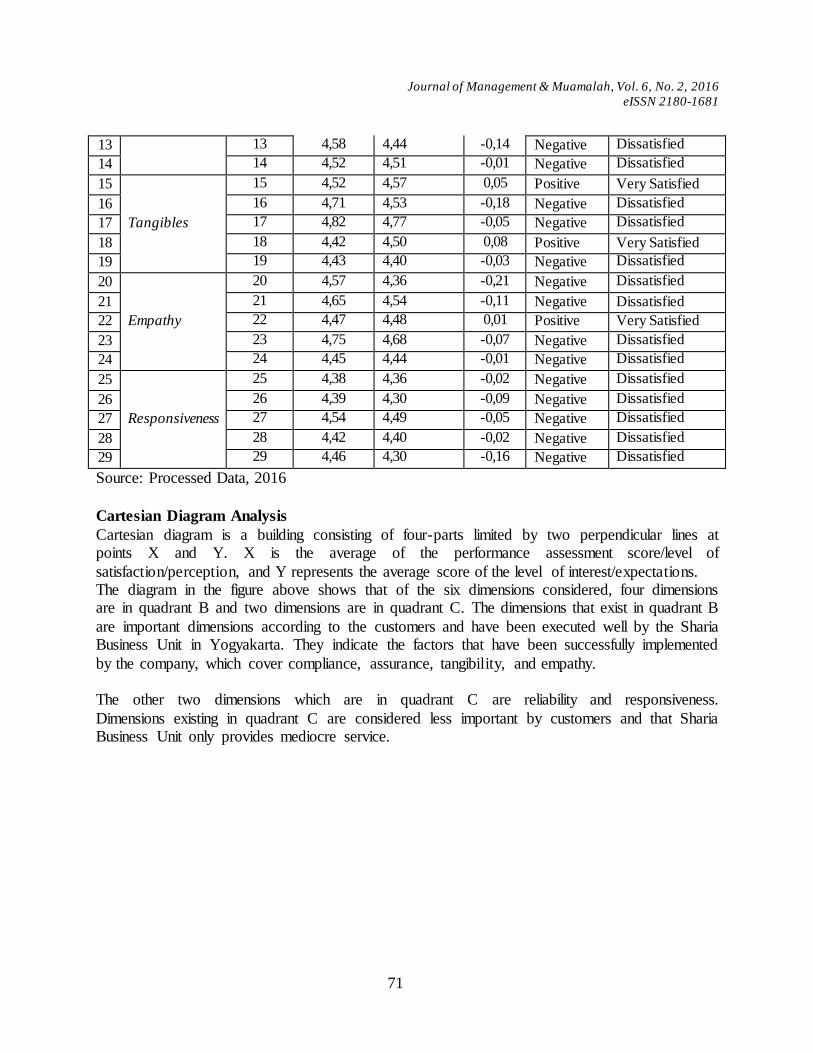
Journal of Management & Muamalah, Vol. 6, No. 2, 2016
eISSN 2180-1681
71
13 13 4,58 4,44 -0,14 Negative Dissatisfied
14 14 4,52 4,51 -0,01 Negative Dissatisfied
15
Tangibles
15 4,52 4,57 0,05 Positive Very Satisfied
16 16 4,71 4,53 -0,18 Negative Dissatisfied
17 17 4,82 4,77 -0,05 Negative Dissatisfied
18 18 4,42 4,50 0,08 Positive Very Satisfied
19 19 4,43 4,40 -0,03 Negative Dissatisfied
20
Empathy
20 4,57 4,36 -0,21 Negative Dissatisfied
21 21 4,65 4,54 -0,11 Negative Dissatisfied
22 22 4,47 4,48 0,01 Positive Very Satisfied
23 23 4,75 4,68 -0,07 Negative Dissatisfied
24 24 4,45 4,44 -0,01 Negative Dissatisfied
25
Responsiveness
25 4,38 4,36 -0,02 Negative Dissatisfied
26 26 4,39 4,30 -0,09 Negative Dissatisfied
27 27 4,54 4,49 -0,05 Negative Dissatisfied
28 28 4,42 4,40 -0,02 Negative Dissatisfied
29 29 4,46 4,30 -0,16 Negative Dissatisfied
Source: Processed Data, 2016
Cartesian Diagram Analysis
Cartesian diagram is a building consisting of four-parts limited by two perpendicular lines at points X and Y. X is the average of the performance assessment score/level of
satisfaction/perception, and Y represents the average score of the level of interest/expectations. The diagram in the figure above shows that of the six dimensions considered, four dimensions are in quadrant B and two dimensions are in quadrant C. The dimensions that exist in quadrant B
are important dimensions according to the customers and have been executed well by the Sharia Business Unit in Yogyakarta. They indicate the factors that have been successfully implemented
by the company, which cover compliance, assurance, tangibility, and empathy. The other two dimensions which are in quadrant C are reliability and responsiveness.
Dimensions existing in quadrant C are considered less important by customers and that Sharia Business Unit only provides mediocre service.
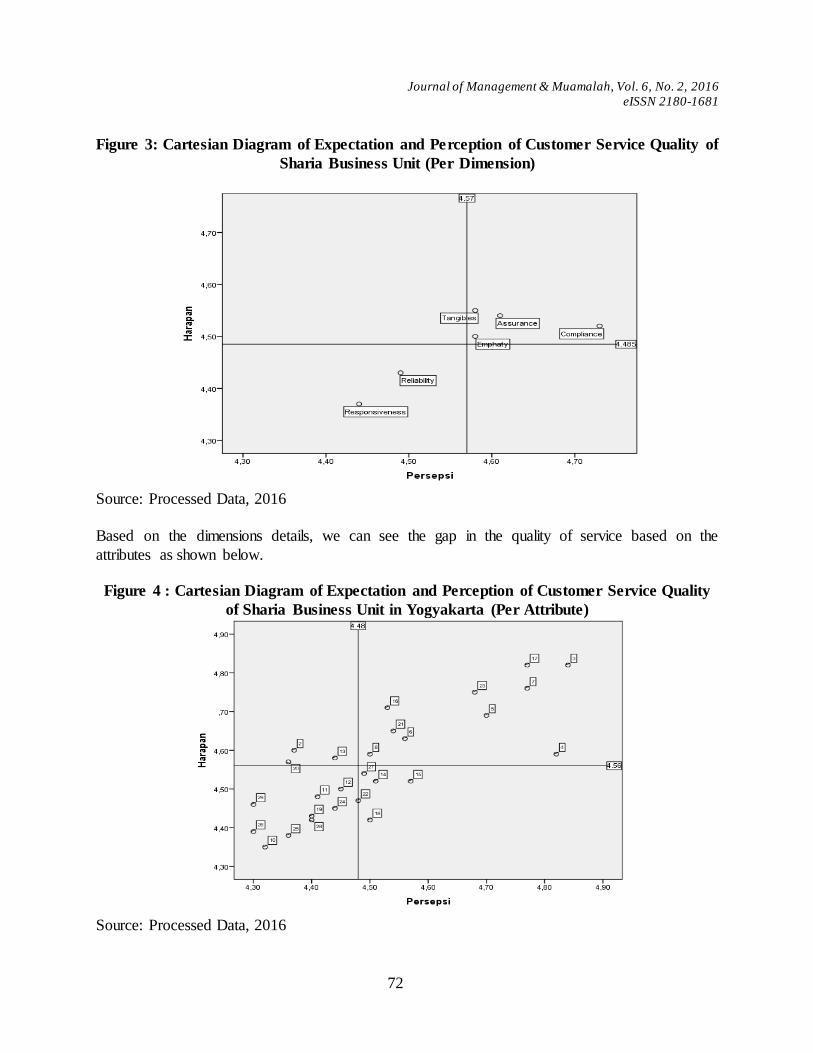
Journal of Management & Muamalah, Vol. 6, No. 2, 2016
eISSN 2180-1681
72
Figure 3: Cartesian Diagram of Expectation and Perception of Customer Service Quality of
Sharia Business Unit (Per Dimension)
Source: Processed Data, 2016
Based on the dimensions details, we can see the gap in the quality of service based on the
attributes as shown below.
Figure 4 : Cartesian Diagram of Expectation and Perception of Customer Service Quality
of Sharia Business Unit in Yogyakarta (Per Attribute)
Source: Processed Data, 2016
Journal of Management & Muamalah, Vol. 6, No. 2, 2016
eISSN 2180-1681
73
The foregoing figure illustrates that there are three attributes in quadrant A, namely attribute
number 2, 13, and 20. These attributes in particular are: absence of interest liabilities for saving and loan, service provision according to the promised service, and accessible location. Those three attributes are considered important by the customers but have yet to be performed by the
Sharia Business Unit according to the expected.
In quadrant B there are ten attributes, namely; financial provision for halal products, profit sharing investment provision, good reputation, experienced and knowledgeable management, polite and friendly employees, professional management and staff in serving the customers,
modern equipment, adequate parking facilities, individual basis attention of the employees to customers regardless of their status, guarantee of customer confidentiality. The attributes in
quadrant B are considered important by the customers and have been successfully implemented properly by Sharia Business Unit of many banks in Yogyakarta.
Quadrant C covers nine attributes namely: providing proper service, diverse products and services, fast and efficient service, comfortable waiting room facility, money making products
and services, willingness to help customers in case of difficulties during the transaction, professional service of the employees, and simple administrative transaction procedures. In this quadrant, the existing attributes are considered less important by the customers and that the
company or Sharia Business Unit only provides mediocre service. Quadrant D covers attributes that the customers consider as unimportant, in which the company has provided its best
performance. The attributes of this quadrant are: guarantee of liquidity provision for customers, attractive outlook of the building and office, neat and presentable employee appearance, operating hour according to customers‘ need, and fast complaint handling.
CONCLUSION AND RECOMMENDATIONS Conclusion a. On the whole, the customers of Sharia Business Unit of Banks in Yogyakarta are not
satisfied with the perceived service, as shown by the negative gap of the total average between performance and customer expectation of (-0.09). The gap value for each
compliance dimension is (-0,21) , assurance (-0,07), reliability (-0,06), tangibility (-0,03), empathy (-0,08) and responsiveness (-0,07).
b. According to the tested attributes, there are seven attributes which are considered
satisfactory by the customers, namely: the availability of profit sharing product, neat and presentable employee appearance, attractive building and office outlook, realisation of
financial provision for halal products, polite and friendly employees, and suitable operating hours to customer‘s need and good bank reputation. Meanwhile, other attributes are considered as not quite satisfactory by the costumers.
Journal of Management & Muamalah, Vol. 6, No. 2, 2016
eISSN 2180-1681
74
Recommendations
a. The Sharia Business Unit is required to maintain the attributes deemed satisfactory by the customers and to develop the service quality of the attributes deemed as unsatisfactory by
the customers. b. The attributes which need to be more developed are the availability of liquidity for the
customers, money making products and services, problem solving for the customers, willingness to help customers in case of difficulties, proper service provision, comfortable waiting room facility, fast complaint handling, fast and efficient service, adequate parking
facility, diverse products and services, guarantee of customers‘ confidentiality, experienced and knowledgeable management, employee professional service for customers, professional
management and staff, individual based attention by the employee regardless of the customers‘ status, service provision according to the promised service, simple administrative procedure in transaction, modern equipment, accessible location, financial consultancy
provision, absence of interest liabilities for saving and loans, and implementation of Islamic principles and law.
c. This study provides benefit for the bank in order to maintain its customer. Therefore, the Sharia Business Unit may use the results of this study to improve its customer satisfaction.
REFERENCES
Ahasanul, H., Jamil, O., and Ahmad, Z. Hj. I. (2009). Factor influences selection of Islamic banking: a study on Malaysian customer preferences. American Journal of Applied Sciences, 6(5): 922-928.
Bank Indonesia. (2015). Undang-Undang Nomor 10 Tahun 1998 Tentang Perbankan Syariah.
Jakarta : (http://www.bi.go.id, accessed January 27th, 2015).
Blodgett, J.G., and Anderson, R. D. (2000). A Bayesian network model of the consumer
complaint process. Journal of Service Research, 2(4): 321-38.
Boonlertvanich, K. (2011). Effect of customer perceived value on satisfaction and customer
loyalty in banking service: the moderating effect of main-bank status. International
Journal of Business Research, 11(6), 40-54.
Ghozali, Imam. (2006). Statistik Nonparametrik. Semarang: BP UNDIP.
Hazlina, A, K., Nasim, R, and Reza, M. (2011). Impacts of service quality on customer
satisfaction: Study of online banking and ATM services in Malaysia. International Journal
of Trade and Economic Finance, Vol 2(1).
Hoq, M. Z., and Amin, M. (2010). The role of customer satisfaction to enhance customer loyalty.
African Journal of Business Management, 4(12): 2385-2392.
Journal of Management & Muamalah, Vol. 6, No. 2, 2016
eISSN 2180-1681
75
Horstmann, R. (1998). Customer satisfaction and loyalty: An empirical assessment in the service
industry. Journal of Application Management and Entrepreneurship, Vol 4:39 -54.
Khafafa, A, J, and Safii, Z. (2013). Customer satisfaction and islamic banking awareness in the
islamic banking window system in Libya. Middle-East Journal of Scientific Research,
Vol.13, 12-17.
Kishada and Wahab. (2013). Factors affecting customer loyalty in islamic banking: evidence
from Malaysian banks. International Journal of Business and Social Science, Vol. 4 No. 7.
Kotler, P. Armstrong. (2012). Principles of Marketing, 14th Edition, New Jersy, USA. Pearson
Education Inc.
Martilla, J. and James, J. (1977), Importance-Performance Analysis, Journal of Marketing,
41(1), 77-79.
Maxham, J.G. and Netemeyer, R.G. (2002). Modeling customer perceptions of complaint
handling over time: the effects of perceived justice on satisfaction and intent. Journal of
Retailing, 78: 239-52.
Osman, et al. (2009). Customers Satisfaction in Malaysian Islamic Banking : Journal of
Economics and Finance, February, Vol 1 (1).
Othman, A. and Owen, L. (2012). The multi dimensionality of CARTER models to measure
customer service quality in islamic banking industry: a study in Kuwait Finance House.
International Journal of Islamic Financial Services Vol 3(4).
Othman, A. and Owen, L. (2001), ―Developing an instrument to measure customer service
quality (SQ) in Islamic Banks‖, International Journal of Islamic Financial Services, Vol. 3
(1).
Parasuraman, A., Berry, L., and Zeithaml, V. (1991). Perceived service quality as a customer –
based performance measure: An empirical examination of organizational barriers using an
extended service quality model. Human Resource Management, Vol. 30 No. 3.
Thompson, DeSouza and Gale. (1985). The strategic management of services quality.
Cambridge, Massachusetts: Strategic Planning Institute.
Yoo, D. K., and Park, J. A. (2007). Perceived service quality: Analyzing relationships among
employees, customers, and financial performance. International Journal of Quality &
Reliability Management, 24(9): 908–926.

Journal of Management & Muamalah, Vol. 6, No. 2, 2016
eISSN 2180-1681
76
Aidha Trisanty, Arief Darmawan
Diploma III of Economics Universitas Islam Indonesia Sleman Yogyakarta
Indonesia [email protected]
Arif Darmawan
Diploma III of Economics
Universitas Islam Indonesia Sleman, Yogyakarta
Indonesia [email protected]
Journal of Management & Muamalah, Vol. 6, No. 2, 2016
eISSN 2180-1681
77
Applying SERVQUAL to Improve the Quality of Service Delivery
in Vocational Education in Indonesia
(Penggunaan SERVQUAL Untuk Penambahbaikan Kualiti Perkhidmatan Di
Pendidikan Vokasional Di Indonesia)
RR SITA DEWI KUSUMANINGRUM
Universitas Islam Indonesia
ABSTRACT
Vocational education at higher education in Indonesia is playing an important role in preparing
students to be qualified/skilled workers to enter the job world. In order to meet the purpose, vocational education providers need to assess its current service quality. The case study employ SERVQUAL as the tool of analysis. In this study, gap between students‘ expectations and
perceptions on service delivery are identified through questionnaires based on five dimensions, namely tangibles, reliability, responsiveness, assurance, and empathy. Besides, the
questionnaires are also distributed to the program management to compare the result of gap of expectations and perceptions on service delivery between the students and the program management. The study‘s finding found two dimensions of SERVQUAL with the highest gap,
namely tangibles and reliability. Both dimensions cover two importants areas of services in vocational education the diploma programme management and should put into priority, which
are teaching laboratories and practical learning, respectively. Key Words: SERVQUAL, Expectation, Perception, Vocational Education
ABSTRAK
Pendidikan Tinggi Vokasi di Indonesia berperan penting dalam menyiapkan mahasiswa menjadi pekerja yang kompeten/terampil saat memasuki dunia kerja. Untuk itu, penyelenggara Pendidikan Tinggi Vokasi perlu mengevaluasi kualitas layanannya. Studi ini menerapkan
SERVQUAL sebagai alat analisis untuk mengidentifikasi gap antara harapan dan persepsi mahasiswa atas penyelenggaraan layanan pendidikan tinggi vokasi melalui penyebaran
kuesioner yang meliputi lima dimensi, yaitu wujud (tangibles), keandalan (reliability), respon (responsiveness), jaminan (assurance), dan empati (empathy). Kuesioner juga disebarkan kepada pengelola program untuk membandingkan gap harapan dan persepsi atas
penyelenggaraan layanan antara mahasiswa dan pengelola program. Hasil studi menunjukkan dua dimensi SERVQUAL dengan gap terbesar yang harus mendapat prioritas, yaitu
laboratorium dan pembelajaran secara praktik. Kata Kunci: SERVQUAL, Harapan, Persepsi, Pendidikan Tinggi Vokasi
Journal of Management & Muamalah, Vol. 6, No. 2, 2016
eISSN 2180-1681
78
INTRODUCTION
There are growing concerns that vocational education is playing an important role in the
development process, especially in the development of labour. Vocational education might act
as a filter for human resource to enter the labour market because it will divide labour into
different occupations with distinct quality, skill, and status (Clarke & Winch, 2007). UNESCO,
through its UNEVOC (International Centre for Technical and Vocational Education and
Training), has also put special attention in monitoring the implementation and development of
the vocational education system that aims at providing demand-driven and practice oriented
programs to improve the employability and participation in lifelong learning.
Currently, vocational education is also becoming one focus of development in Indonesia. The
Government of Indonesia is in the continuous process of developing the vocational education so
that it can contribute more to the human resource development in Indonesia. To support this
process, the Government of Indonesia has stipulated Presidential Decree (Peraturan Presiden-
Perpres) No.8/2012 on Indonesia‘s National Qualifications Framework (Kerangka Kualifikasi
Nasional Indonesia-KKNI). This national qualifications framework becomes the reflection of
human resource quality in Indonesia that is endorsed by Law No.12/2012 on Higher Education.
It is stated in Law No.12/2012 on Higher Education article 16 that vocational education (diploma
programme) aims at preparing students to be a highly qualified/skilled employees. In order to
meet the learning objective, the students of vocational education are eligible to obtain
educational services in accordance with their talent, interest, potential, and ability. Besides, the
characteristics of vocational education are different from academic education. Generally, the
required composition of practical and theoretical learning in vocational education is at a
minimum of 60:40. Therefore, service providers of vocational education are required to deliver
their best education services comprising facilities, learning environment, lecturer, academic staff,
etcetera, which can support the learning process that meets vocational education needs.
It is expected that the more students feel satisfied with vocational education service quality, the
more opportunity there will be for increasing student enrolment. Obviously, it is important for
the vocational education service providers to provide the best service quality by accommodating
students‘ expectation in order to succeed the learning as well as marketing process in vocational
education.
Based on earlier explanation, this study aims at exploring the quality of services of vocational programmes in Indonesia based on a case study. This study is important since the result of the study would be a valuable input for significant improvement of service quality of vocational
education in Indonesia. In addition, this study would enrich the discussion of service quality in vocational education.
Journal of Management & Muamalah, Vol. 6, No. 2, 2016
eISSN 2180-1681
79
LITERATURE REVIEW
International Perspectives on Vocational Education
Vocational education can be defined as ―the provision of materials, activities and teaching that is
designed to prepare people to function, at a specified level, in specific roles in the context of
(usually) paid employment‖ (Lucas, Claxton, & Webster, 2010). In Anglo Saxon countries
(United Kingdom, United States, Canada, Ireland, and Australia), vocational education is defined
in simpler way, that is, ―preparing young people and adults for working life which involves
technical and practical processes‖ (Clarke & Winch, 2007, p.9). Further, Clarke and Winch
mentioned that ―especially in the United States and the United Kingdom, vocational education is
often seen as training for particular jobs in order to serve the needs of current employers‖ (p.10).
Vocational education has been continuously becoming a topic of discussion in international
forums. According to Professor Chris Winch, there are three elements of vocational education (Lucas et al., 2010):
1) Application. This means that vocational education has to put technical knowledge into practice. However, it is sometimes difficult to ensure this condition.
2) Personal development. This includes the ability to act independently, including in the workplace, and the opportunity to have access to the broader cultural assets of the society just as people who have academic education do.
3) A civic role. This role should enable people to understand how their work and their
place in the economy has an impact on the wider society.
Vocational education will continue to play an important role in the society since around half of
all jobs in 2020 will require a medium level-qualification (Cedefop, 2011). The European Centre for the Development of Vocational Training (Cedefop) has identified several benefits of vocational education as depicted in Figure 1.
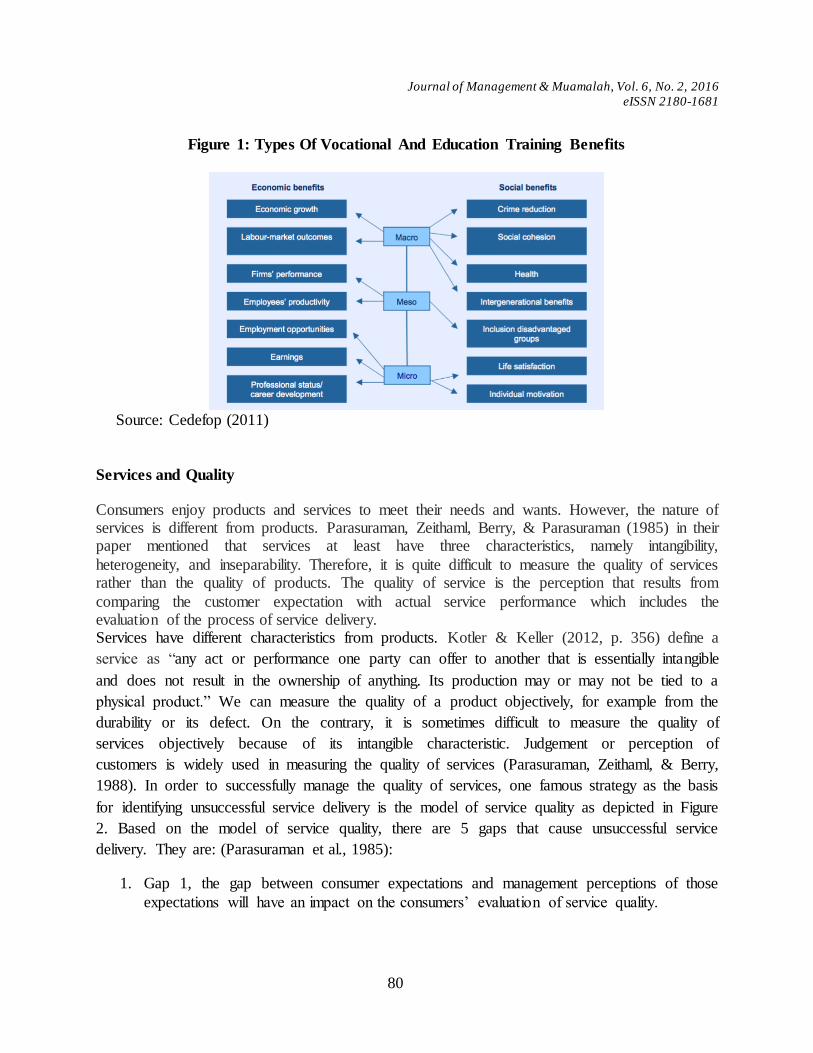
Journal of Management & Muamalah, Vol. 6, No. 2, 2016
eISSN 2180-1681
80
Figure 1: Types Of Vocational And Education Training Benefits
Source: Cedefop (2011)
Services and Quality
Consumers enjoy products and services to meet their needs and wants. However, the nature of services is different from products. Parasuraman, Zeithaml, Berry, & Parasuraman (1985) in their paper mentioned that services at least have three characteristics, namely intangibility,
heterogeneity, and inseparability. Therefore, it is quite difficult to measure the quality of services rather than the quality of products. The quality of service is the perception that results from
comparing the customer expectation with actual service performance which includes the evaluation of the process of service delivery. Services have different characteristics from products. Kotler & Keller (2012, p. 356) define a
service as ―any act or performance one party can offer to another that is essentially intangible
and does not result in the ownership of anything. Its production may or may not be tied to a
physical product.‖ We can measure the quality of a product objectively, for example from the
durability or its defect. On the contrary, it is sometimes difficult to measure the quality of
services objectively because of its intangible characteristic. Judgement or perception of
customers is widely used in measuring the quality of services (Parasuraman, Zeithaml, & Berry,
1988). In order to successfully manage the quality of services, one famous strategy as the basis
for identifying unsuccessful service delivery is the model of service quality as depicted in Figure
2. Based on the model of service quality, there are 5 gaps that cause unsuccessful service
delivery. They are: (Parasuraman et al., 1985):
1. Gap 1, the gap between consumer expectations and management perceptions of those
expectations will have an impact on the consumers‘ evaluation of service quality.
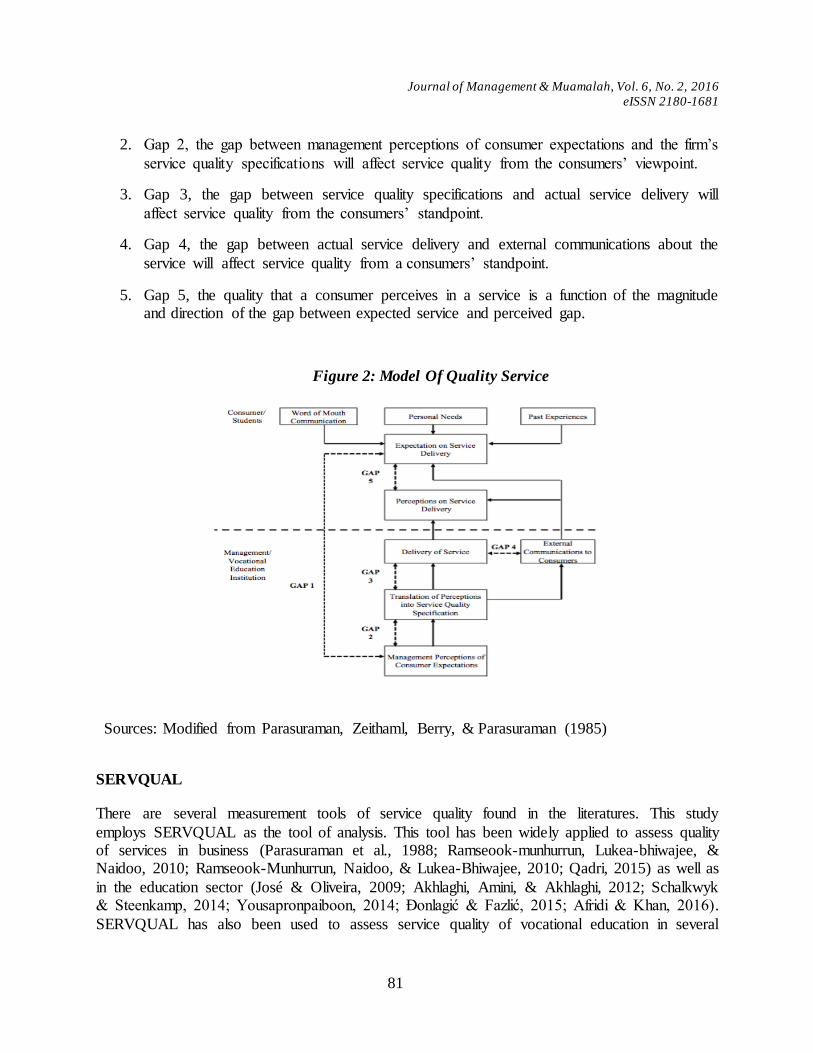
Journal of Management & Muamalah, Vol. 6, No. 2, 2016
eISSN 2180-1681
81
2. Gap 2, the gap between management perceptions of consumer expectations and the firm‘s
service quality specifications will affect service quality from the consumers‘ viewpoint.
3. Gap 3, the gap between service quality specifications and actual service delivery will
affect service quality from the consumers‘ standpoint.
4. Gap 4, the gap between actual service delivery and external communications about the
service will affect service quality from a consumers‘ standpoint.
5. Gap 5, the quality that a consumer perceives in a service is a function of the magnitude and direction of the gap between expected service and perceived gap.
Figure 2: Model Of Quality Service
Sources: Modified from Parasuraman, Zeithaml, Berry, & Parasuraman (1985)
SERVQUAL
There are several measurement tools of service quality found in the literatures. This study
employs SERVQUAL as the tool of analysis. This tool has been widely applied to assess quality of services in business (Parasuraman et al., 1988; Ramseook-munhurrun, Lukea-bhiwajee, & Naidoo, 2010; Ramseook-Munhurrun, Naidoo, & Lukea-Bhiwajee, 2010; Qadri, 2015) as well as
in the education sector (José & Oliveira, 2009; Akhlaghi, Amini, & Akhlaghi, 2012; Schalkwyk & Steenkamp, 2014; Yousapronpaiboon, 2014; Đonlagić & Fazlić, 2015; Afridi & Khan, 2016).
SERVQUAL has also been used to assess service quality of vocational education in several
Journal of Management & Muamalah, Vol. 6, No. 2, 2016
eISSN 2180-1681
82
countries such as Czech Republic (Stasiak-betlejewska, Kaye, & Dyason, 1989), Malaysia
(Ibrahim, Rahman, & Yasin, 2012), Iran (Akhlaghi et al., 2012), Poland (Pradela, 2015), etc. Parasuraman et al., (1988) have determined five dimensions for the measurement of service quality using SERVQUAL which can be detailed as follows:
1. Tangibles: the physical evidence of the service, such as physical facilities, equipment, personnel, and communication materials
2. Reliability: ability to perform the promised service dependably and accurately, that is, how consistent is an organization in providing quality service and how much customers can rely
on the firm.
3. Responsiveness: willingness to help customers and provide prompt service, that is, how much the staff members are ready and willing to provide services.
4. Assurance: knowledge and courtesy of employee and their ability to inspire trust and confidence, including the skills of the service providers.
5. Empathy: caring, individualized attention the firm provides its customers, that is, how much an organization understands customers‘ requirements.
METHODOLOGY This study applies empirical research using quantitative descriptive method based on the model of service quality (SERVQUAL) as depicted in Figure 2. This study is focused on Gap 5 (gap
between expected service and perceived service) from the perspective of customers as well as service providers. The data of perceived service quality are obtained from the students of
vocational education (consumer side) and the management/institution of vocational education (service provider side).
In order to get a better picture of analysis, the case study applies purposive sampling. The questionnaires are designed to be distributed to more than 150 students with the minimum
criteria of having joined the programme for two semesters and obtained a GPA of 3.00 at the time of analysis. Respondents from all departments in the programme (Management, Finance and Banking, and Accounting) are included in the study. Besides students, the questionnaires are
also distributed to the management of the programme that consists of the programme manager, the lecturers, and staff members of the programme.
The questionnaires used in the case study are developed based on five dimensions of the SERVQUAL model, namely tangibles, reliability, responsiveness, assurance, and empathy
(Parasuraman et al., 1988). Each dimension is reflected in the question with areas of service quality as can be seen in Table 1. There are 17 questions developed to accommodate each
dimension of SERVQUAL. All questions are then applied to understand respondents‘ expectation as well as perception. In addition, there is a question to know the expectation and perception on overall service delivery of the case study. The responses are collected using 5

Journal of Management & Muamalah, Vol. 6, No. 2, 2016
eISSN 2180-1681
83
point Likert-scale from ―strongly disagree‖ (1) to ―strongly agree‖ (5). To ensure the validity and
reliability of the data, the questionnaire is tested using Cronbach‘s Alpha in SPSS 20.
Table 1: Dimension And Area Of Service Quality
Dimension Areas of Service Quality Number of
Question
Tangible
Availability of Program Building, Teaching
Laboratories, Modern Teaching Equipment, Information Media, and Handouts
5
Reliability
Convenient Time of Service Delivery,
Promptness of Service Delivery, Practical Learning
3
Responsiveness Helpful Lecturers and Staff Members, Quick Response of Staff Members, Friendly and
Professional Staff Members
3
Assurance Good Communication Skill of Staff Members, Confident Staff Members, Competent Lecturers
and Practitioners
3
Empathy Equal Treatment from Staff Members, Easily Contacted Lecturers
3
Total 17
Based on (Parasuraman et al., 1988), the perceived service quality (Q) or the gap of service quality is expressed as:
(1) Q = P – E
where P and E are the ratings on the corresponding perceptions and expectations statements, respectively. The positive result shows that respondents are satisfied with the level of service
quality. On the contrary, the negative result shows that the respondents‘ expectation regarding educational services, is more than what they perceive from the currently offered services.
EMPIRICAL RESULTS This study was conducted in the ―Diploma Programme of Economy, Universitas Islam Indonesia‖ in Indonesia which has 736 students. Due to the semester break, only 123 students
were able to participate as respondents and only 112 of them met the criteria. The instrument reliability was checked for the questionnaires distributed to students using SPSS 20 and found the Cronbach‘s alpha to be 0.968.
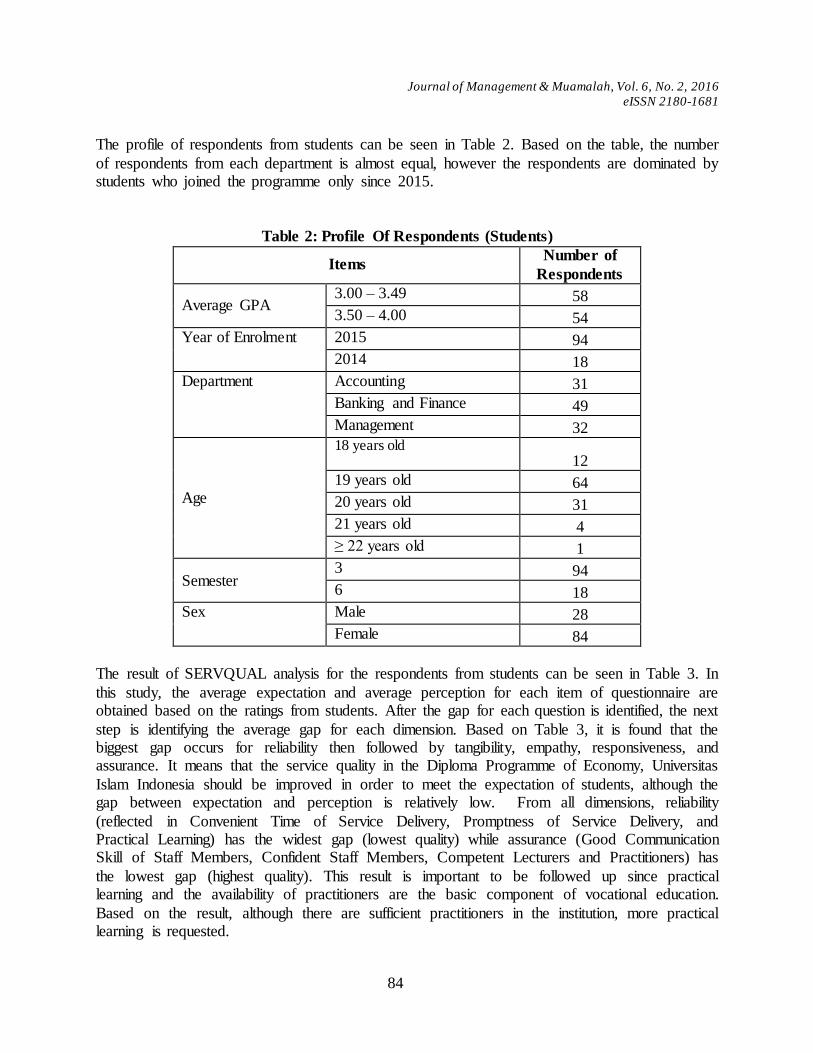
Journal of Management & Muamalah, Vol. 6, No. 2, 2016
eISSN 2180-1681
84
The profile of respondents from students can be seen in Table 2. Based on the table, the number
of respondents from each department is almost equal, however the respondents are dominated by students who joined the programme only since 2015.
Table 2: Profile Of Respondents (Students)
Items Number of
Respondents
Average GPA 3.00 – 3.49 58
3.50 – 4.00 54
Year of Enrolment 2015 94
2014 18
Department Accounting 31
Banking and Finance 49
Management 32
Age
18 years old 12
19 years old 64
20 years old 31
21 years old 4
≥ 22 years old 1
Semester 3 94
6 18
Sex Male 28
Female 84
The result of SERVQUAL analysis for the respondents from students can be seen in Table 3. In
this study, the average expectation and average perception for each item of questionnaire are obtained based on the ratings from students. After the gap for each question is identified, the next
step is identifying the average gap for each dimension. Based on Table 3, it is found that the biggest gap occurs for reliability then followed by tangibility, empathy, responsiveness, and assurance. It means that the service quality in the Diploma Programme of Economy, Universitas
Islam Indonesia should be improved in order to meet the expectation of students, although the gap between expectation and perception is relatively low. From all dimensions, reliability
(reflected in Convenient Time of Service Delivery, Promptness of Service Delivery, and Practical Learning) has the widest gap (lowest quality) while assurance (Good Communication Skill of Staff Members, Confident Staff Members, Competent Lecturers and Practitioners) has
the lowest gap (highest quality). This result is important to be followed up since practical learning and the availability of practitioners are the basic component of vocational education.
Based on the result, although there are sufficient practitioners in the institution, more practical learning is requested.
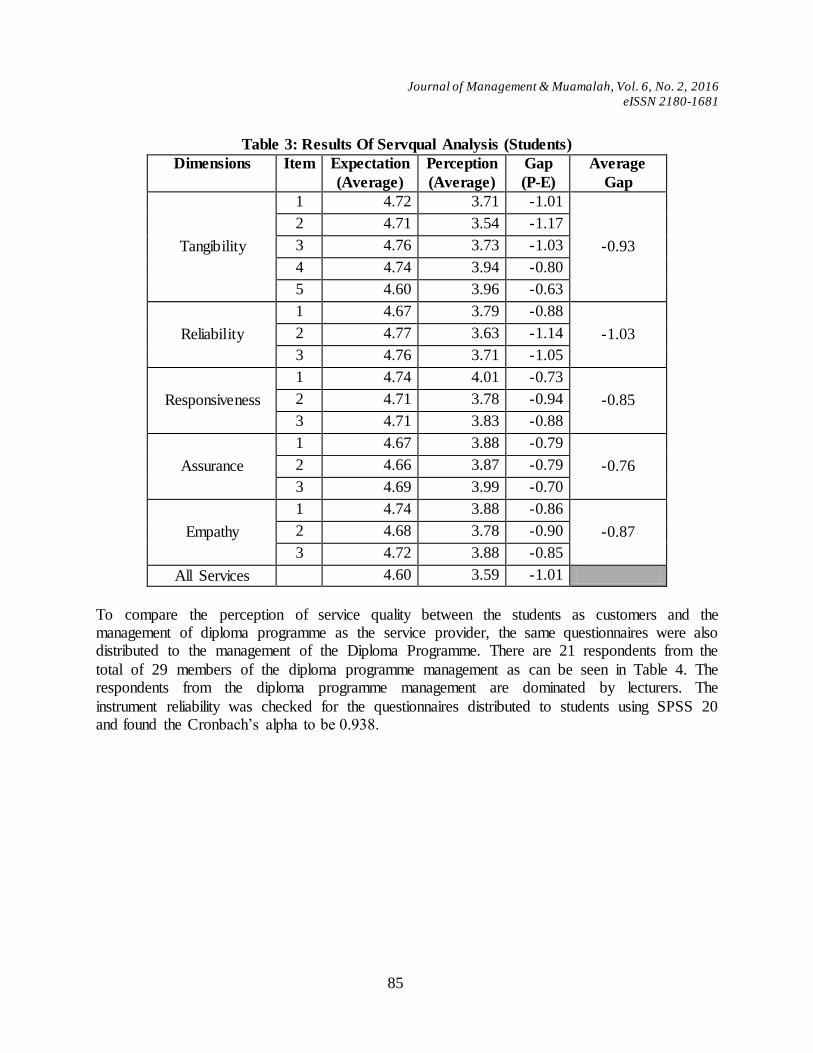
Journal of Management & Muamalah, Vol. 6, No. 2, 2016
eISSN 2180-1681
85
Table 3: Results Of Servqual Analysis (Students)
Dimensions Item Expectation
(Average)
Perception
(Average)
Gap
(P-E)
Average
Gap
Tangibility
1 4.72 3.71 -1.01
-0.93
2 4.71 3.54 -1.17
3 4.76 3.73 -1.03
4 4.74 3.94 -0.80
5 4.60 3.96 -0.63
Reliability
1 4.67 3.79 -0.88
-1.03 2 4.77 3.63 -1.14
3 4.76 3.71 -1.05
Responsiveness
1 4.74 4.01 -0.73
-0.85 2 4.71 3.78 -0.94
3 4.71 3.83 -0.88
Assurance
1 4.67 3.88 -0.79
-0.76 2 4.66 3.87 -0.79
3 4.69 3.99 -0.70
Empathy
1 4.74 3.88 -0.86
-0.87 2 4.68 3.78 -0.90
3 4.72 3.88 -0.85
All Services 4.60 3.59 -1.01
To compare the perception of service quality between the students as customers and the management of diploma programme as the service provider, the same questionnaires were also distributed to the management of the Diploma Programme. There are 21 respondents from the
total of 29 members of the diploma programme management as can be seen in Table 4. The respondents from the diploma programme management are dominated by lecturers. The
instrument reliability was checked for the questionnaires distributed to students using SPSS 20 and found the Cronbach‘s alpha to be 0.938.
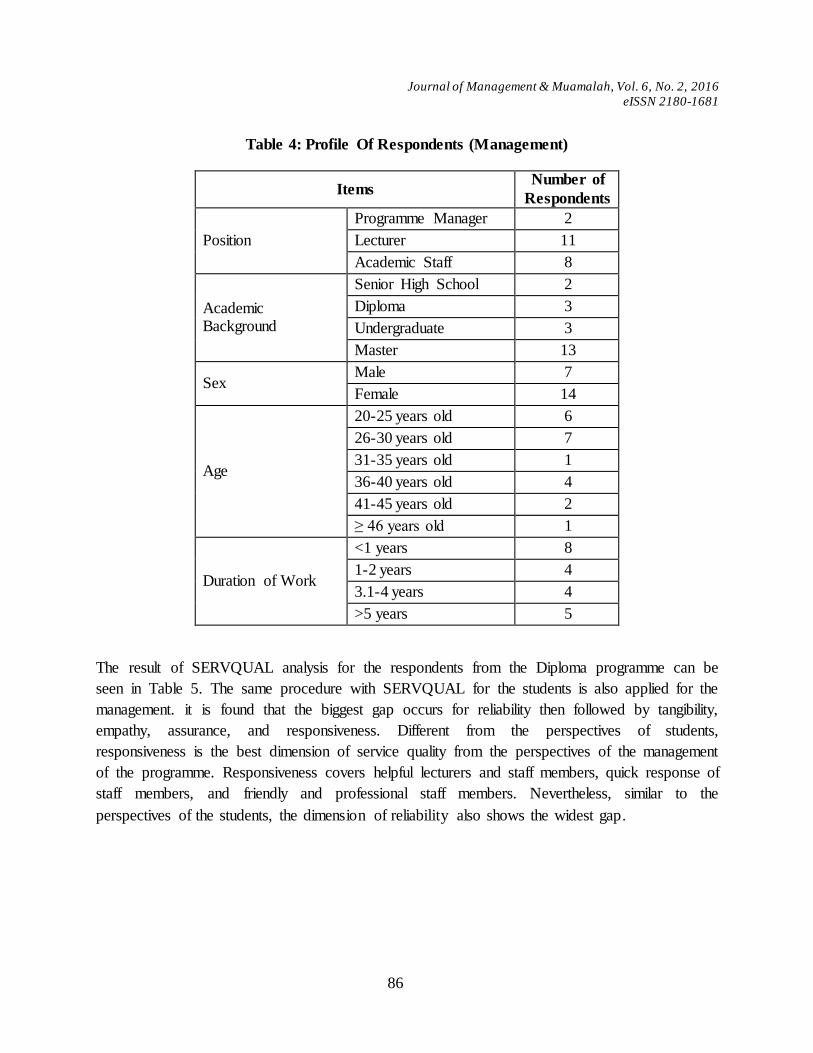
Journal of Management & Muamalah, Vol. 6, No. 2, 2016
eISSN 2180-1681
86
Table 4: Profile Of Respondents (Management)
Items Number of
Respondents
Position
Programme Manager 2
Lecturer 11
Academic Staff 8
Academic Background
Senior High School 2
Diploma 3
Undergraduate 3
Master 13
Sex Male 7
Female 14
Age
20-25 years old 6
26-30 years old 7
31-35 years old 1
36-40 years old 4
41-45 years old 2
≥ 46 years old 1
Duration of Work
<1 years 8
1-2 years 4
3.1-4 years 4
>5 years 5
The result of SERVQUAL analysis for the respondents from the Diploma programme can be
seen in Table 5. The same procedure with SERVQUAL for the students is also applied for the
management. it is found that the biggest gap occurs for reliability then followed by tangibility,
empathy, assurance, and responsiveness. Different from the perspectives of students,
responsiveness is the best dimension of service quality from the perspectives of the management
of the programme. Responsiveness covers helpful lecturers and staff members, quick response of
staff members, and friendly and professional staff members. Nevertheless, similar to the
perspectives of the students, the dimension of reliability also shows the widest gap.

Journal of Management & Muamalah, Vol. 6, No. 2, 2016
eISSN 2180-1681
87
Table 5: Results Of Servqual Analysis (Management)
Dimensions Item Expectation
(Average)
Perception
(Average)
Gap
(P-E)
Average
Gap
Tangibility
1 4.81 4.19 -0.62
-0.91
2 4.81 3.57 -1.24
3 4.86 4.05 -0.81
4 4.81 4.33 -0.48
5 4.81 3.38 -1.43
Reliability
1 4.90 3.86 -1.05
-1.02 2 4.81 3.95 -0.86
3 4.71 3.57 -1.14
Responsiveness
1 4.76 4.38 -0.38
-0.63 2 4.76 4.05 -0.71
3 4.76 3.95 -0.81
Assurance
1 4.67 3.81 -0.86
-0.67 2 4.71 3.95 -0.76
3 4.86 4.48 -0.38
Empathy
1 4.86 4.05 -0.81
-0.79 2 4.76 4.05 -0.71
3 4.71 3.86 -0.86
All Services 4.71 3.81 -0.90
Comparison of service quality from the perspective of students as well as the perspective of
programme managers can be seen in Table 6. Based on the table, the total average gap of service
quality from the perspectives of students is highest compared to those of the institution. The total
average gap of service quality from the perspective of students is -4.43 while from the
perspective of the management of diploma programme is -4.03. From Table 6, it can also be seen
the weighted gap from each dimension. It is found that from both perspectives, tangible and
reliability have the biggest weighted gap, which is more than 20%.
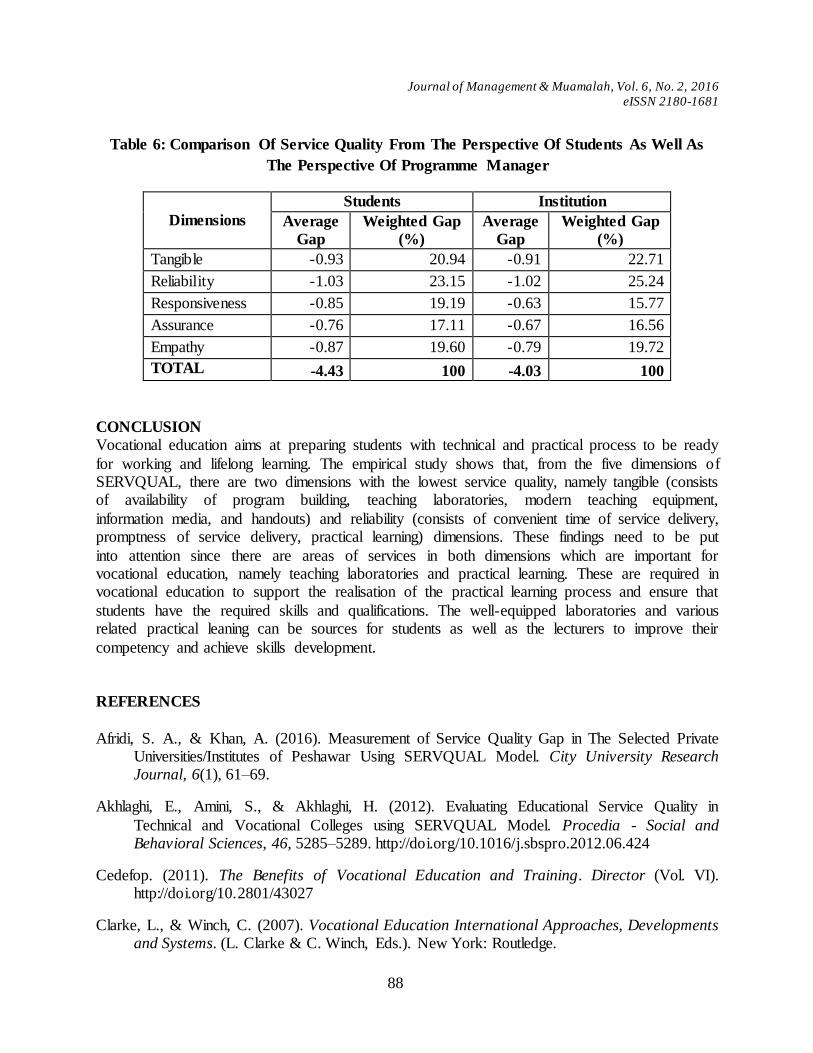
Journal of Management & Muamalah, Vol. 6, No. 2, 2016
eISSN 2180-1681
88
Table 6: Comparison Of Service Quality From The Perspective Of Students As Well As
The Perspective Of Programme Manager
Dimensions
Students Institution
Average
Gap
Weighted Gap
(%)
Average
Gap
Weighted Gap
(%)
Tangible -0.93 20.94 -0.91 22.71
Reliability -1.03 23.15 -1.02 25.24
Responsiveness -0.85 19.19 -0.63 15.77
Assurance -0.76 17.11 -0.67 16.56
Empathy -0.87 19.60 -0.79 19.72
TOTAL -4.43 100 -4.03 100
CONCLUSION
Vocational education aims at preparing students with technical and practical process to be ready
for working and lifelong learning. The empirical study shows that, from the five dimensions of SERVQUAL, there are two dimensions with the lowest service quality, namely tangible (consists of availability of program building, teaching laboratories, modern teaching equipment,
information media, and handouts) and reliability (consists of convenient time of service delivery, promptness of service delivery, practical learning) dimensions. These findings need to be put
into attention since there are areas of services in both dimensions which are important for vocational education, namely teaching laboratories and practical learning. These are required in vocational education to support the realisation of the practical learning process and ensure that
students have the required skills and qualifications. The well-equipped laboratories and various related practical leaning can be sources for students as well as the lecturers to improve their
competency and achieve skills development.
REFERENCES
Afridi, S. A., & Khan, A. (2016). Measurement of Service Quality Gap in The Selected Private Universities/Institutes of Peshawar Using SERVQUAL Model. City University Research Journal, 6(1), 61–69.
Akhlaghi, E., Amini, S., & Akhlaghi, H. (2012). Evaluating Educational Service Quality in
Technical and Vocational Colleges using SERVQUAL Model. Procedia - Social and Behavioral Sciences, 46, 5285–5289. http://doi.org/10.1016/j.sbspro.2012.06.424
Cedefop. (2011). The Benefits of Vocational Education and Training. Director (Vol. VI). http://doi.org/10.2801/43027
Clarke, L., & Winch, C. (2007). Vocational Education International Approaches, Developments and Systems. (L. Clarke & C. Winch, Eds.). New York: Routledge.

Journal of Management & Muamalah, Vol. 6, No. 2, 2016
eISSN 2180-1681
89
Đonlagić, S., & Fazlić, S. (2015). Quality Assessment in Higher Education Using the Servqual
Model. Management, 20(1), 39–57.
Ibrahim, M. Z., Rahman, M. N. A., & Yasin, R. M. (2012). Assessing Students Perceptions of
Service Quality in Technical Educational and Vocational Training (TEVT) Institution in Malaysia. Procedia - Social and Behavioral Sciences, 56(Ictlhe), 272–283.
http://doi.org/10.1016/j.sbspro.2012.09.655
José, O., & Oliveira, D. (2009). Adaptation and application of the SERVQUAL scale in higher
education. POMS 20th Annual Conference, 55(14).
Kotler, P., & Keller, K.L. (2012). Marketing Management 14th Ed. New Jersey: Pearson.
Lucas, B., Claxton, G., & Webster, R. (2010). Mind the Gap in the Flesh. London: University of
Winchester and Edge Foundation.
Parasuraman, a, Zeithaml, V. a, & Berry, L. L. (1988). SERQUAL: A Multiple-Item Scale for
Measuring Consumer Perceptions of Service Quality. Journal of Retailing. http://doi.org/10.1016/S0148-2963(99)00084-3
Parasuraman, a, Zeithaml, V. a, Berry, L. L., & Parasuraman. (1985). A Conceptual Model of Service Quality and Its Implications for Future Research. Journal of Marketing.
http://doi.org/10.2307/1251430
Pradela, A. (2015). Quality of Graduates‘ Preparation for Labour Market – A ServQual Analysis.
Procedia - Social and Behavioral Sciences, 174, 1671–1677. http://doi.org/10.1016/j.sbspro.2015.01.820
Qadri, U. A. (2015). Measuring Service Quality Expectation and Perception Using SERVQUAL: A Gap Analysis. Business and Economics Journal, 6(3), 1–7. http://doi.org/10.4172/2151-
6219.1000162
Ramseook-munhurrun, P., Lukea-bhiwajee, S. D., & Naidoo, P. (2010). Service Quality in the
Public Service. International Journal of Marketing and Marketing Research, 3(1), 37–50. http://doi.org/10.1017/CBO9781107415324.004
Ramseook-Munhurrun, P., Naidoo, P., & Lukea-Bhiwajee, S. D. (2010). Measuring Service Quality: Perceptions of Employees. Global Journal of Business Research (GJBR), 4(1),
47–58. Retrieved from http://search.ebscohost.com/login.aspx?direct=true&db=bth&AN=47108037&site=ehost-live
Schalkwyk, R. D. van, & Steenkamp, R. J. (2014). The Exploration of Service Quality and Its
Measurement for Private Higher Education Institutions. Southern African Business Review, 18(2), 83–107.
Stasiak-betlejewska, R., Kaye, M., & Dyason, M. (1989). The Services Quality Level Assessment at The Technical University Using The Servqual Method. Journal on

Journal of Management & Muamalah, Vol. 6, No. 2, 2016
eISSN 2180-1681
90
Efficiency and Responsibility in Education and Science, 7(3–4), 53–58.
http://doi.org/10.7160/eriesj.2014.070302.Introduction
Yousapronpaiboon, K. (2014). SERVQUAL: Measuring Higher Education Service Quality in
Thailand. Procedia - Social and Behavioral Sciences, 116, 1088–1095. http://doi.org/10.1016/j.sbspro.2014.01.350
Rr Sita Dewi Kusumaningrum
Department of Management, Diploma Program of Economy
Universitas Islam Indonesia Jalan Kaliurang Km 14,5 Sleman, Yogyakarta 55584, INDONESIA
Journal of Management & Muamalah, Vol. 6, No. 2, 2016
eISSN 2180-1681
91
Financial Literacy of Youths: A Case Study of
Islamic Banking and Finance Students in
Kolej Universiti Islam Antarabangsa Selangor
(Belia Celik Kewangan: Kajian Kes Pelajar Perbankan Islam dan Kewangan di
Kolej Universiti Islam Antarabangsa Selangor)
Nurul Wajhi Ahmad, Murni Yunus Mawar & Norazlina Ripain
Kolej Universiti Islam Antarabangsa Selangor Selangor, Malaysia
ABSTRACT
This paper investigates the influence of various factors on different dimensions of financial
literacy. The study was conducted and focused on respondents among Islamic Banking and Finance students in Kolej Universiti Islam Antarabangsa Selangor (KUIS). This paper utilized
questionnaire based surveys to obtain information about financial literacy. The sample comprised of 201 students in the programmes of Islamic Banking and Finance, Faculty of Management and Muamalah KUIS. The study provides an in-depth analysis of respondents‘ financial knowledge
(FK), financial education (FE) and financial attitude (FA) measured with a 5-point Likert scale. The study also investigates the relationship between the dimensions of financial literacy. The
findings indicate that financial knowledge, financial education and financial attitude significantly influence financial literacy. Nevertheless, financial knowledge (FK) has the strongest relationship with financial literacy (FL) (r = 0.645), followed by the financial education (FE) (r
= 0.631) and financial attitude (FA) (r = 0.546). The results also indicate that this group of students need for further intervention strategy by the authorities in order to enhance financial
literacy among them. Keywords: Financial literacy, financial knowledge, financial behaviour, financial attitude
ABSTRAK
Kertas kajian ini mengkaji tentang pengaruh pelbagai faktor pada dimensi yang berbeza
berkaitan celik kewangan. Kajian ini dijalankan ke atas pelajar Perbankan Islam dan Kewangan
di Kolej Universiti Islam Antarabangsa Selangor (KUIS). Kertas kajian ini menggunakan
kaedah tinjauan berasaskan soal selidik untuk mendapatkan maklumat berkaitan celik
kewangan. Jumlah sampel kajian adalah seramai 201 pelajar dari program Perbankan Islam
dan Kewangan, Fakulti Pengurusan dan Muamalah, KUIS. Berdasarkan Skala 5 Likert, kajian
ini memberikan analisis yang mendalam berkaitan pengetahuan kewangan (FK), pendidikan
kewangan (FE) dan sikap kewangan (FA) bagi setiap responden. Kajian ini turut mengkaji
hubungan di antara dimensi celik kewangan. Hasil dapatan kajian menunjukkan pengetahuan
Journal of Management & Muamalah, Vol. 6, No. 2, 2016
eISSN 2180-1681
92
kewangan, pendidikan kewangan dan sikap kewangan sangat mempengaruhi celik kewangan
seseorang. Walau bagaimanapun, pengetahuan kewangan (FK) mempunyai hubungan yang kuat
dengan celik kewangan (FL) (r = 0.645), diikuti oleh pendidikan kewangan (FE) (r = 0.631) dan
seterusnya sikap kewangan (FA) (r = 0.546). Hasil dapatan kajian turut menunjukkan bahawa
strategi campurtangan yang berterusan oleh pihak berkuasa adalah sangat perlu dalam
meningkatkan lagi tahap celik kewangan di kalangan mereka.
Katakunci: Celik kewangan, pengetahuan kewangan, tingkah laku kewangan, sikap kewangan
INTRODUCTION In a world of improved individual financial responsibility, where the market is full with multifarious financial products, financial literacy is essential. The ability to understand basic
concepts in finance and deal with day to day financial transaction is very important. Thus, individuals should be equipped with good financial knowledge, financial education and attitudes to make wise financial decisions. In fact, financial literacy has a great impact on the economic
development for a particular nation.
Financial literacy is knowledge and understanding of financial concepts and risks, and the skills, motivation and confidence to apply such knowledge and understanding in order to make effective decisions across a range of financial contexts, to improve the financial well-being of
individuals and society, and to enable participation in economic life (Lusardi, 2015). A financial illiterate person will create financial problems and tend to constantly make a wrong financial
decision. Visa‘s International Financial Literacy BAROMETER 2012 conducted a survey from February
to April of 2012 with 25,500 participants in 28 countries. This survey revealed that Brazil was the most financially literate with 50.4% out of 100. Other countries which are categorized as top
five are Mexico, Australia, the United States and Canada. Malaysia ranked at ninth scoring 41.7% in terms of financial literacy but surprisingly, only 39.6% of Malaysian citizens have three-month worth of savings set aside for an emergency. According to the survey, only people
in China, Taiwan, Hong Kong, Japan and Canada had more than three months of savings. Having all these fact and figures, there is an increasing need for financial knowledge and
financial skills. In fact, the Central Bank of Malaysia has included the need for enhanced financial education at
the national level by collaborating with the Ministry of Education (MOE) to integrate financial education into school curricula. The aim of the programme is to improve and cultivate financial
education, financial knowledge and attitudes at a very young age. These concerted efforts were taken by the Malaysian government to nurture and educate people to be better in making wise financial decisions.
The data from Participation in Education, World Development Indicators (see http://wdi.worldbank.org/table/2.11) reported that the market for Malaysian students is actually
huge and lucrative since the gross enrolment ratio at the tertiary level represents 30% of relevant
Journal of Management & Muamalah, Vol. 6, No. 2, 2016
eISSN 2180-1681
93
age group in 2014. In relation to that, Malaysia currently has 18 public universities and 47 private universities and colleges. This growth is consistent with the greater number of enrolment in higher education and increasing in cost of college studies. Thus, this indicates an increasing
number of students making loans to finance high education expenses. In this situation, financial knowledge, financial education and financial attitudes play a vital role in supporting students to
properly manage their funds. Indeed, the attitude of individuals towards money will eventually affect their financial literacy and behaviour. As explained by Albeerdy and Gharleghi (2015), individuals who observed money as just a tool to obtain their wants will not have a proper
financial planning for the future. Unfortunately, this view has become the main problem in this modern era.
For more than a decade, we can see the significant improvement in terms of the Malaysian standard of living. This situation also stimulates the changing in student‘s lifestyles as they are
granted greater freedom from their guardians to make their own shopping and consumption decisions. The recent financial environment can also entice youth to borrow money even though
it is not inevitably for them to do so, due to the dynamic, innovative and flexible credit policy (Kamaruddin and Mokhlis, 2003).
Apart from that, parental norms play a significant role on money management (Devi, Sabbir, Othman, and Danaraj, 2016). They found that the role of parents from the infant stage of an
individual is imperative, so as to ensure that they are taught at every stage of their life on the importance of wealth optimization. This will mould individuals to be financially savvy and attain financial freedom in the later part of their lives.
The greatest concern should be emphasized on the financial literacy among students as it will
affect their later lifecycle. Major previous researches have shown that people with high financial literacy have the ability to plan, implement and make better decisions in life.
Based on the facts, there is a pressing need for students to have an adequate financial knowledge, education and attitudes in order for them to make the finest decisions. There is a concern to
educate the youths to prepare for their future and ultimately have a sufficient retirement fund. Otherwise students tend to misuse the money and will further lead to poor financial management as most of them live separately from their parents. Past study shows that poor financial
management can affect students‘ academic performance, mental and physical well-being, and even the ability to find employment after graduation (Albeerdy and Gharleghi, 2015).
In this regard, this paper has three objectives to be achieved. First, to identify whether there is any influence from financial knowledge towards financial literacy among students; second, to
identify whether there is any influence from financial education towards financial literacy among students; and third, to identify whether there are any consequences from financial attitudes
towards financial literacy among students.
LITERATURE REVIEW
Journal of Management & Muamalah, Vol. 6, No. 2, 2016
eISSN 2180-1681
94
Financial Literacy
At the macro level, financial literacy is an essential component to the nation economic health as
it will influence the country‘s development. Financial literacy means the peoples‘ ability to process economic information and make informed decisions about financial planning, wealth
accumulation, pensions, and debt. In what follows, we outline recent theoretical research showing how financial knowledge can be cast as a type of investment in human capital (Lusardi and Mitchell, 2013).
According to Fraczek and Klimontowicz (2015), financial literacy is usually understood as a
combination of awareness, knowledge, skill, attitude and behaviour, necessary in sound financial decision-making and ultimately achieve individual financial well-being. Therefore, all students must be equipped with the knowledge on how to retain a good spending habit since financial
literacy has many implications on future life. Additionally, individuals with a low level of financial literacy will suffer from the lack of knowledge at every stage of their lives.
Previous research has found that financial literacy can have important implications for financial behaviour. People with low financial literacy are more likely to have problems with debt, less
likely to participate in the stock market, less likely to choose mutual funds with lower fees, less likely to accumulate wealth and manage wealth effectively and less likely to plan for retirement
(Lusardi, Mitchell, and Curto, 2010). We must realize the importance of having a high level of literacy specifically among students.
Consumer and Financial Literacy (CFL) Treasury Taskforce (2004) reported that financial literacy level among university students and young adults were poor and has led to various
financial situations which include more students working part-time jobs, increased cost of financing higher education and others (Ibrahim, Harun, and Isa, 2009).
Financial Knowledge
Financial knowledge and financial literacy are always used interchangeably. But, financial
literacy consists of both knowledge and application of human capital specific to personal finance. The level of overall endowed and attained human capital influences a person‘s financial literacy (Huston, 2010). Financial knowledge can be defined as the stock of knowledge acquired through
education and/or experience specifically related to essential personal finance concepts and products. Hence, an Islamic financial knowledge would be the stock of knowledge that one
acquires specifically related to Islamic finance concepts and products (Azmi and Chong, 2014). This acquired financial knowledge will be a prerequisite for a positive financial literacy and shapes future habits.
On the other hand, people who lack financial knowledge will face negative consequences in financial management. According to Lusardi and Mitchell (2013), low levels of financial
knowledge are pervasive, suggesting that it will be quite challenging to provide the tools to help people function more effectively in complex financial and credit markets requiring sophisticated financial decision-making.
Journal of Management & Muamalah, Vol. 6, No. 2, 2016
eISSN 2180-1681
95
An early study found inadequate levels of knowledge among high school and university students, as well as working employees, about personal finance knowledge and methods (Ibrahim & Alqaydi, 2013). Recent media report on the increasing bankruptcy case among youths due to
credit cards usage indicates the lack of financial knowledge. This spending habit needs to be changed and definitely must be further improved the financial knowledge among students.
Major institutions such as schools, families, governments, and financial institutions must all collaborate in stimulating financial knowledge among students at a very young age. This is consistent with Shaari et al., (2013) who stated that financial decisions are highly influenced by
financial knowledge. In fact, students with higher levels of financial literacy made good spending decision in a hypothetical circumstance.
Financial Education
Financial education is an input intended to increase a person‘s human capital, specifically
financial knowledge and/or application (i.e. financial literacy) (Huston, 2010). A well-designed financial literacy instrument that adequately captures personal finance knowledge and
application can provide insight into how well financial education improves the human capital needed to behave appropriately to enhance financial well-being. Some relevant studies such as Ambuehl et al. (2014), Batty et al. (2015), and Becchetti et al. (2013) showed that financial
education programmes seem to contribute in individual financial literacy. Therefore, financial education should be considered as a concept and proxy that upholds financial literacy. The major
purpose of financial education programmes is to accommodate all participants with a basic knowledge of financial management skills.
Various themes have been explained to define financial education including being knowledgeable on numerous issues of managing money and assets such as banking issues,
investment, insurance and taxes. On the other hand, it is important also to understand the basic concept in managing money and asset such as time value of money and risk management techniques. Having all this information will actually assist individuals in planning, implementing
and evaluating financial decisions (Hogarth, 2006).
Financial education is one of the critically important components in financial literacy. In fact, policymakers have designed effective education programs targeted at young people. Realizing the importance of financial education and financial literacy, the Malaysian government through
the Central bank of Malaysia came out with an excellent programme to nurture and educate people to be better in making wise financial decisions. For instance, the Pocket Money Book
programme was introduced in 1998 by distributing 7.9 million copies for students throughout Malaysia, creating financial education websites for students, and workshops for teachers and students. These programmes inculcated students at an early age in managing and controlling their
personal finance.
The US Federal Government established the Office of Financial Education in the US Treasury Department and the National Financial Literacy and Education Commission (Mian, 2014). This was their national level strategy to promote financial education and financial literacy. Mian
Journal of Management & Muamalah, Vol. 6, No. 2, 2016
eISSN 2180-1681
96
(2014) also revealed the research findings on the impact of financial education on American
household savings. It showed that adults who possess low financial literacy will definitely make poor financial decisions. This finding indicates that, financial education is a crucial tool for an individual to attain an effective financial literacy.
For more than a decade, any effort towards upholding financial education will eventually
increase participation in savings plan (Bayer et al., 1996). Supported by recent researches, it can be explained that financial education is the process to improve financial literacy. In fact, financial education will influence people‘s financial awareness, yet individuals must
continuously enhance knowledge on various types of financial products and features (Fraczek and Klimontowicz, 2015).
However, there are arguments in recent findings as the evidence shown that financial education has only a minimal impact on financial literacy. No significant link exist between these two
variables due to the influence of any other factors. The cost of conducting financial education programmes is high as compared to its impact on participants. Hathaway and Khatiwada (2008)
in their Federal Reserve Bank of Cleveland working paper found that the best program design advice is to target specific audiences and areas of financial activity (such as credit or retirement planning), and to offer training on a just-in-time or ―teachable moments‖ approach. In terms of
program outcomes, they concluded that ―Unfortunately, we do not find conclusive evidence that, in general, financial education programmes do lead to greater financial knowledge, and,
ultimately, to better financial behaviour. Financial Attitude
Current studies defines financial attitudes as someone beliefs, value and psychological tendency when making a financial decision. Belief and values are both related with personal financial
concepts for instance, the belief that it is important for to have an appropriate level of savings. While psychological tendency will influence on how to evaluate financial management practices with some degree of agreement and disagreement (Parrotta and Johnson, 1998; Chowa et al.,
2012)
Previous studies explained that parents and guardian are the main sources for youths to acquire knowledge on money. Parent‘s behaviour and attitudes will somehow shape the children‘s financial attitudes and behaviour development. Chowa et al., (2012) stated that parents and other
family members have a strong impact on students‘ financial knowledge, attitudes, and behaviour. Parents are among of the prime socialization proxies that will influence the financial attitudes of
youths and adolescents. Te‘eni-Harari (2016) also found that parents and peers do influence youth‘s financial knowledge. Recently, it is argued that parental norms play significant roles on child development. Youths
actually learn about money matters and management from their parents. Indeed, youths who acquire knowledge on managing money from their mothers will tend to have a higher level of
financial literacy. In fact, past study shows that a parental norm has a significant and positive relationship on money management of the young adults (Ibrahim et al., 2009; Devi et al., 2016). The above findings show that family, especially guardians, have a huge impact and roles on
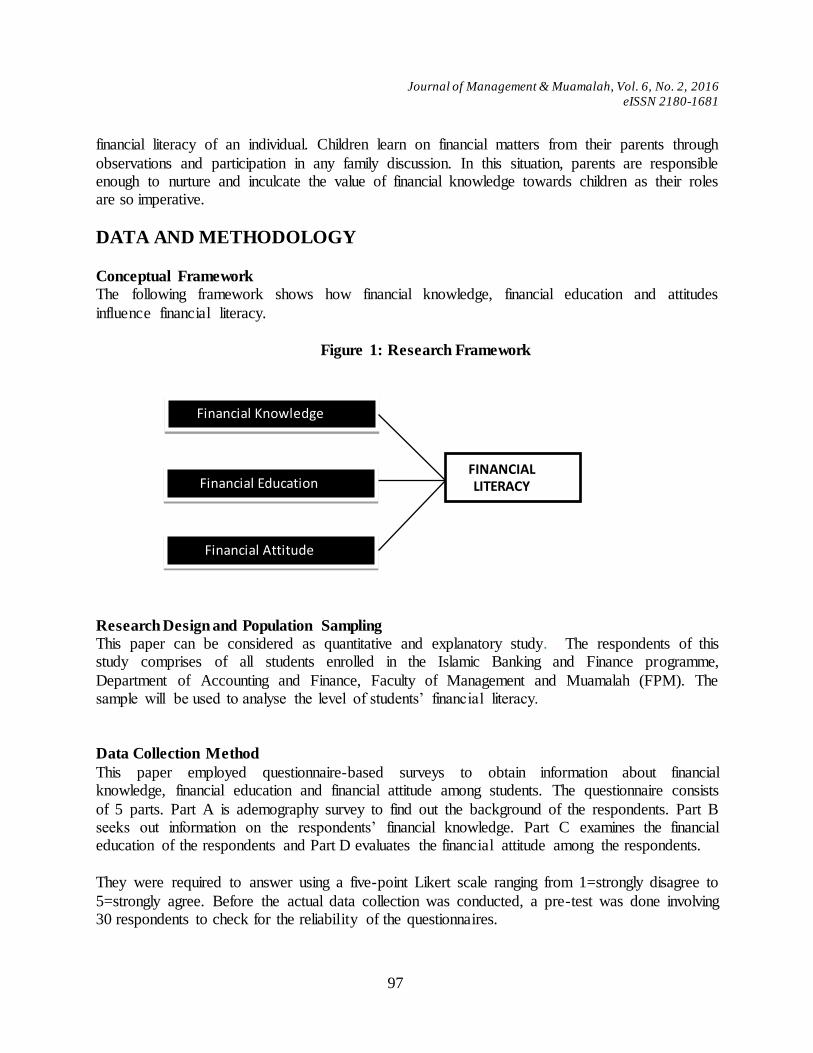
Journal of Management & Muamalah, Vol. 6, No. 2, 2016
eISSN 2180-1681
97
financial literacy of an individual. Children learn on financial matters from their parents through
observations and participation in any family discussion. In this situation, parents are responsible enough to nurture and inculcate the value of financial knowledge towards children as their roles are so imperative.
DATA AND METHODOLOGY
Conceptual Framework
The following framework shows how financial knowledge, financial education and attitudes
influence financial literacy.
Figure 1: Research Framework
Research Design and Population Sampling
This paper can be considered as quantitative and explanatory study. The respondents of this study comprises of all students enrolled in the Islamic Banking and Finance programme,
Department of Accounting and Finance, Faculty of Management and Muamalah (FPM). The sample will be used to analyse the level of students‘ financial literacy.
Data Collection Method
This paper employed questionnaire-based surveys to obtain information about financial knowledge, financial education and financial attitude among students. The questionnaire consists
of 5 parts. Part A is ademography survey to find out the background of the respondents. Part B seeks out information on the respondents‘ financial knowledge. Part C examines the financial education of the respondents and Part D evaluates the financial attitude among the respondents.
They were required to answer using a five-point Likert scale ranging from 1=strongly disagree to
5=strongly agree. Before the actual data collection was conducted, a pre-test was done involving 30 respondents to check for the reliability of the questionnaires.
Financial Knowledge
Financial Education
Financial Attitude
FINANCIAL LITERACY
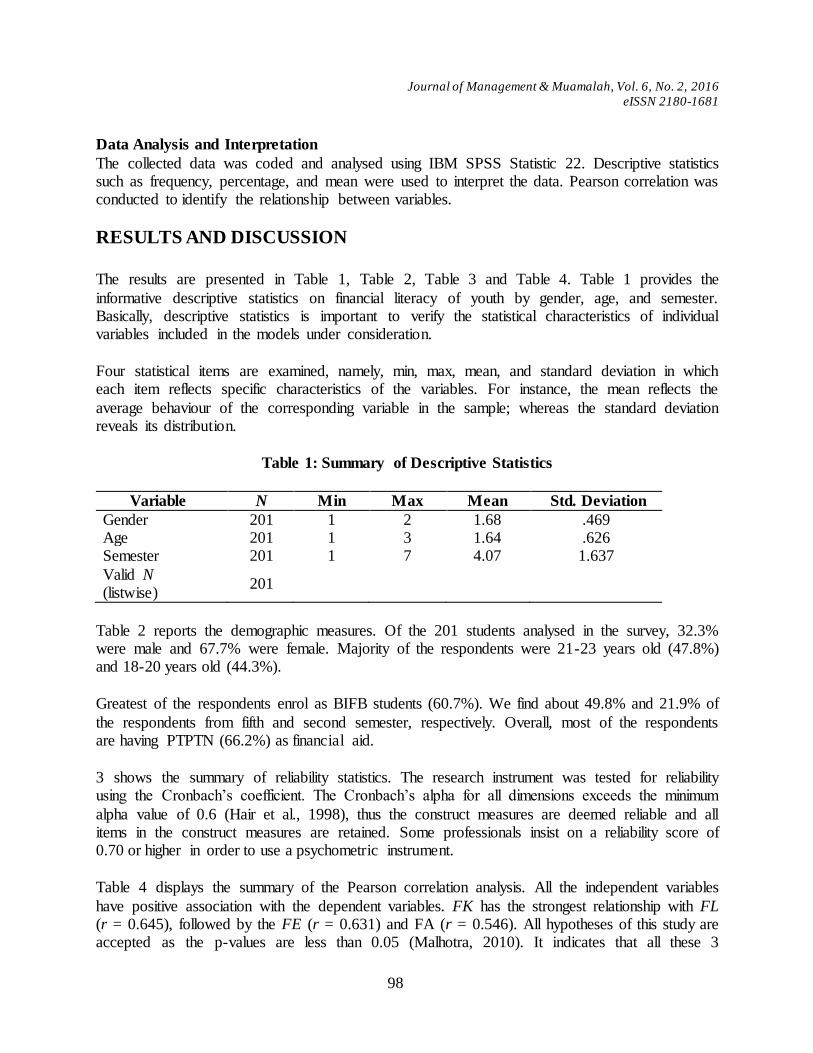
Journal of Management & Muamalah, Vol. 6, No. 2, 2016
eISSN 2180-1681
98
Data Analysis and Interpretation
The collected data was coded and analysed using IBM SPSS Statistic 22. Descriptive statistics such as frequency, percentage, and mean were used to interpret the data. Pearson correlation was conducted to identify the relationship between variables.
RESULTS AND DISCUSSION
The results are presented in Table 1, Table 2, Table 3 and Table 4. Table 1 provides the
informative descriptive statistics on financial literacy of youth by gender, age, and semester. Basically, descriptive statistics is important to verify the statistical characteristics of individual variables included in the models under consideration.
Four statistical items are examined, namely, min, max, mean, and standard deviation in which each item reflects specific characteristics of the variables. For instance, the mean reflects the
average behaviour of the corresponding variable in the sample; whereas the standard deviation reveals its distribution.
Table 1: Summary of Descriptive Statistics
Variable N Min Max Mean Std. Deviation
Gender 201 1 2 1.68 .469 Age 201 1 3 1.64 .626 Semester 201 1 7 4.07 1.637
Valid N (listwise)
201
Table 2 reports the demographic measures. Of the 201 students analysed in the survey, 32.3% were male and 67.7% were female. Majority of the respondents were 21-23 years old (47.8%) and 18-20 years old (44.3%).
Greatest of the respondents enrol as BIFB students (60.7%). We find about 49.8% and 21.9% of
the respondents from fifth and second semester, respectively. Overall, most of the respondents are having PTPTN (66.2%) as financial aid.
3 shows the summary of reliability statistics. The research instrument was tested for reliability using the Cronbach‘s coefficient. The Cronbach‘s alpha for all dimensions exceeds the minimum
alpha value of 0.6 (Hair et al., 1998), thus the construct measures are deemed reliable and all items in the construct measures are retained. Some professionals insist on a reliability score of 0.70 or higher in order to use a psychometric instrument.
Table 4 displays the summary of the Pearson correlation analysis. All the independent variables
have positive association with the dependent variables. FK has the strongest relationship with FL (r = 0.645), followed by the FE (r = 0.631) and FA (r = 0.546). All hypotheses of this study are accepted as the p-values are less than 0.05 (Malhotra, 2010). It indicates that all these 3
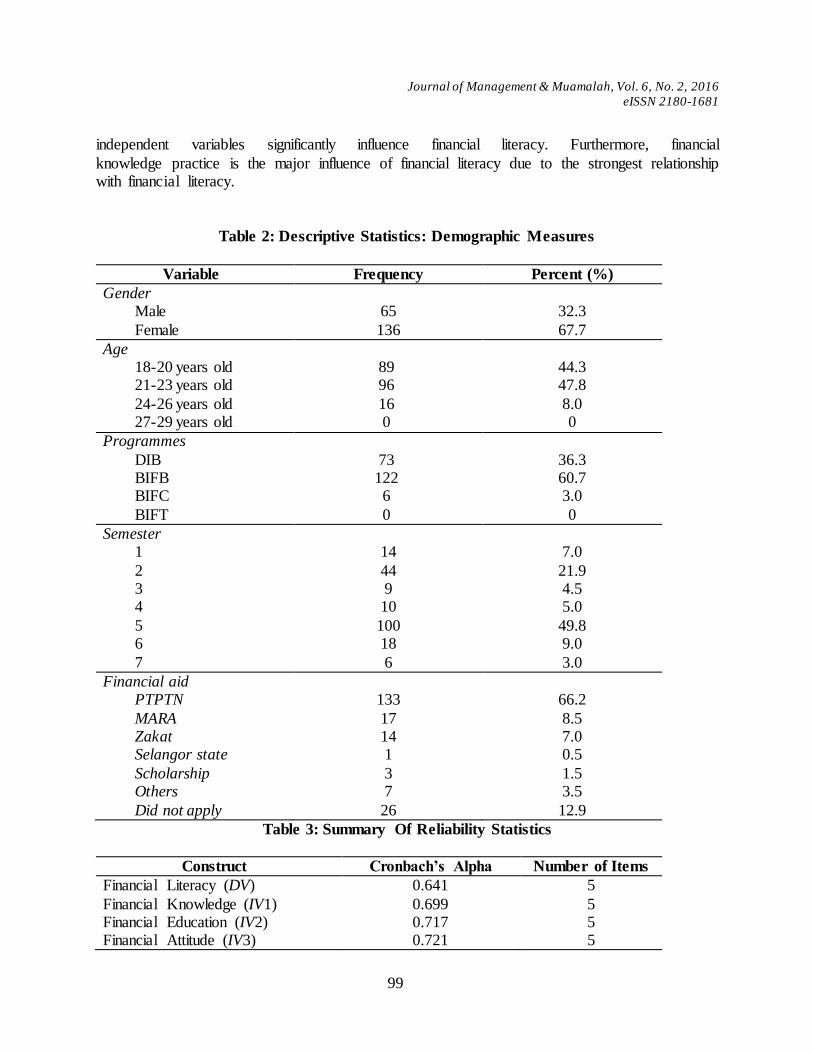
Journal of Management & Muamalah, Vol. 6, No. 2, 2016
eISSN 2180-1681
99
independent variables significantly influence financial literacy. Furthermore, financial
knowledge practice is the major influence of financial literacy due to the strongest relationship with financial literacy.
Table 2: Descriptive Statistics: Demographic Measures
Variable Frequency Percent (%)
Gender Male
Female
65
136
32.3
67.7
Age 18-20 years old 21-23 years old
24-26 years old 27-29 years old
89 96
16 0
44.3 47.8
8.0 0
Programmes
DIB BIFB BIFC
BIFT
73 122 6
0
36.3 60.7 3.0
0
Semester 1
2 3 4
5 6
7
14
44 9 10
100 18
6
7.0
21.9 4.5 5.0
49.8 9.0
3.0
Financial aid PTPTN
MARA Zakat Selangor state
Scholarship Others
Did not apply
133
17 14 1
3 7
26
66.2
8.5 7.0 0.5
1.5 3.5
12.9
Table 3: Summary Of Reliability Statistics
Construct Cronbach’s Alpha Number of Items
Financial Literacy (DV) 0.641 5
Financial Knowledge (IV1) 0.699 5 Financial Education (IV2) 0.717 5 Financial Attitude (IV3) 0.721 5
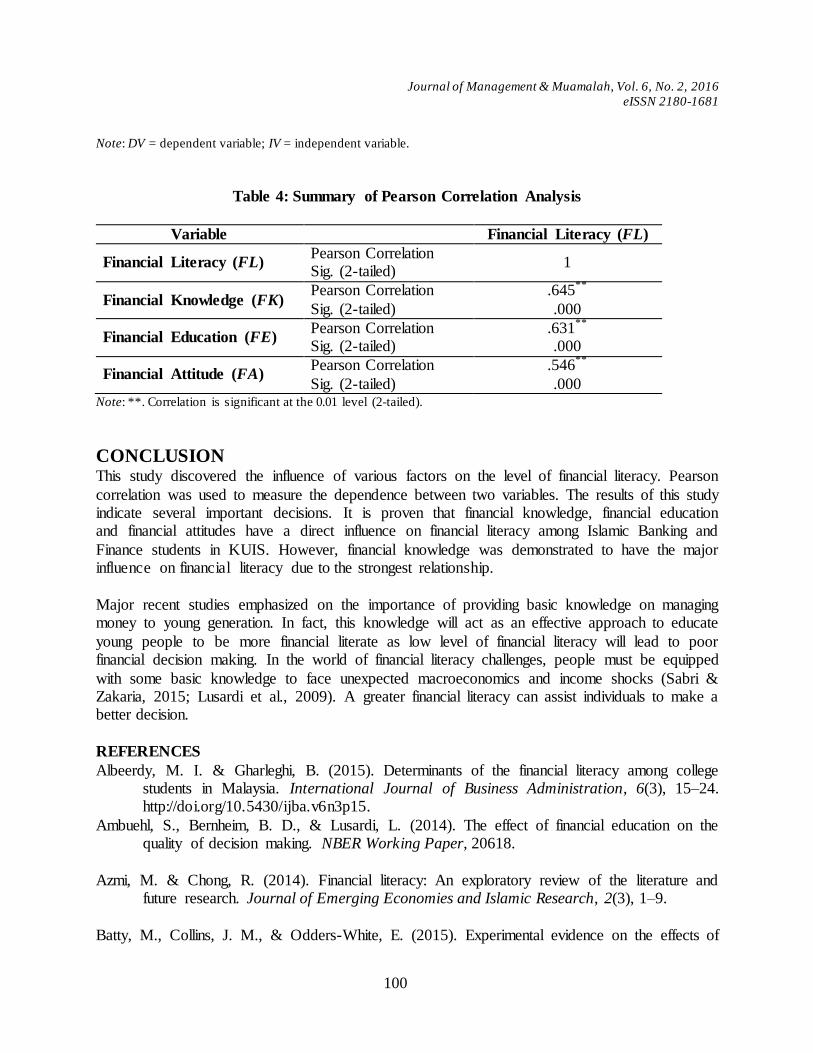
Journal of Management & Muamalah, Vol. 6, No. 2, 2016
eISSN 2180-1681
100
Note: DV = dependent variable; IV = independent variable.
Table 4: Summary of Pearson Correlation Analysis
Variable
Financial Literacy (FL)
Financial Literacy (FL) Pearson Correlation Sig. (2-tailed)
1
Financial Knowledge (FK) Pearson Correlation
Sig. (2-tailed)
.645**
.000
Financial Education (FE) Pearson Correlation Sig. (2-tailed)
.631**
.000
Financial Attitude (FA) Pearson Correlation
Sig. (2-tailed)
.546**
.000 Note: **. Correlation is significant at the 0.01 level (2-tailed).
CONCLUSION This study discovered the influence of various factors on the level of financial literacy. Pearson
correlation was used to measure the dependence between two variables. The results of this study indicate several important decisions. It is proven that financial knowledge, financial education and financial attitudes have a direct influence on financial literacy among Islamic Banking and
Finance students in KUIS. However, financial knowledge was demonstrated to have the major influence on financial literacy due to the strongest relationship.
Major recent studies emphasized on the importance of providing basic knowledge on managing money to young generation. In fact, this knowledge will act as an effective approach to educate
young people to be more financial literate as low level of financial literacy will lead to poor financial decision making. In the world of financial literacy challenges, people must be equipped
with some basic knowledge to face unexpected macroeconomics and income shocks (Sabri & Zakaria, 2015; Lusardi et al., 2009). A greater financial literacy can assist individuals to make a better decision.
REFERENCES
Albeerdy, M. I. & Gharleghi, B. (2015). Determinants of the financial literacy among college students in Malaysia. International Journal of Business Administration, 6(3), 15–24. http://doi.org/10.5430/ijba.v6n3p15.
Ambuehl, S., Bernheim, B. D., & Lusardi, L. (2014). The effect of financial education on the quality of decision making. NBER Working Paper, 20618.
Azmi, M. & Chong, R. (2014). Financial literacy: An exploratory review of the literature and
future research. Journal of Emerging Economies and Islamic Research, 2(3), 1–9.
Batty, M., Collins, J. M., & Odders-White, E. (2015). Experimental evidence on the effects of
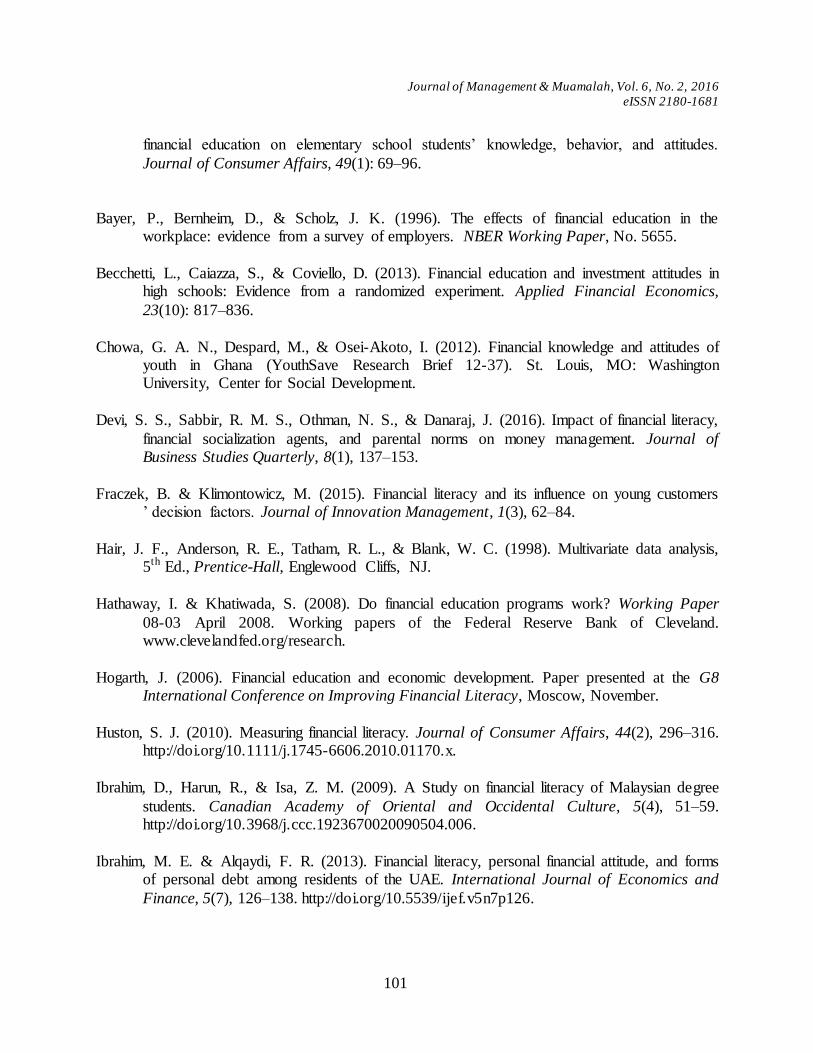
Journal of Management & Muamalah, Vol. 6, No. 2, 2016
eISSN 2180-1681
101
financial education on elementary school students‘ knowledge, behavior, and attitudes.
Journal of Consumer Affairs, 49(1): 69–96.
Bayer, P., Bernheim, D., & Scholz, J. K. (1996). The effects of financial education in the workplace: evidence from a survey of employers. NBER Working Paper, No. 5655.
Becchetti, L., Caiazza, S., & Coviello, D. (2013). Financial education and investment attitudes in
high schools: Evidence from a randomized experiment. Applied Financial Economics,
23(10): 817–836.
Chowa, G. A. N., Despard, M., & Osei-Akoto, I. (2012). Financial knowledge and attitudes of youth in Ghana (YouthSave Research Brief 12-37). St. Louis, MO: Washington University, Center for Social Development.
Devi, S. S., Sabbir, R. M. S., Othman, N. S., & Danaraj, J. (2016). Impact of financial literacy,
financial socialization agents, and parental norms on money management. Journal of Business Studies Quarterly, 8(1), 137–153.
Fraczek, B. & Klimontowicz, M. (2015). Financial literacy and its influence on young customers ‘ decision factors. Journal of Innovation Management, 1(3), 62–84.
Hair, J. F., Anderson, R. E., Tatham, R. L., & Blank, W. C. (1998). Multivariate data analysis,
5th Ed., Prentice-Hall, Englewood Cliffs, NJ.
Hathaway, I. & Khatiwada, S. (2008). Do financial education programs work? Working Paper
08-03 April 2008. Working papers of the Federal Reserve Bank of Cleveland. www.clevelandfed.org/research.
Hogarth, J. (2006). Financial education and economic development. Paper presented at the G8 International Conference on Improving Financial Literacy, Moscow, November.
Huston, S. J. (2010). Measuring financial literacy. Journal of Consumer Affairs, 44(2), 296–316.
http://doi.org/10.1111/j.1745-6606.2010.01170.x.
Ibrahim, D., Harun, R., & Isa, Z. M. (2009). A Study on financial literacy of Malaysian degree
students. Canadian Academy of Oriental and Occidental Culture, 5(4), 51–59. http://doi.org/10.3968/j.ccc.1923670020090504.006.
Ibrahim, M. E. & Alqaydi, F. R. (2013). Financial literacy, personal financial attitude, and forms of personal debt among residents of the UAE. International Journal of Economics and
Finance, 5(7), 126–138. http://doi.org/10.5539/ijef.v5n7p126.

Journal of Management & Muamalah, Vol. 6, No. 2, 2016
eISSN 2180-1681
102
Kamaruddin, A. R., & Mokhlis. (2003). Consumer socialization, social structural factors and
decision-making styles: A case study of adolescents in Malaysia. International Journal of Consumer Studies. http://dx.doi.org/10.1046/j.1470-6431.2003.00297.x.
Lusardi, A. (2015). Financial Education and Investor Behavior Conference – Rio, December 8, 2015.
Lusardi, A., & Mitchell, O. S. (2013). The economic importance of financial literacy. NBER
Working Paper, No. 18952).
Lusardi, A., Mitchell, O. S., & Curto, V. (2009). Financial literacy among the young. NBER
Working Paper Series, No. 15352. http://doi.org/10.1111/j.1745-6606.2010.01173.x. Lusardi, A., Mitchell, O. S., & Curto, V. (2010). Financial literacy among the young. The
Journal of Consumer Affairs, 44(2), 358–380.
Malhotra, N. K. (2010). Marketing research: an applied orientation, 6th Ed., Pearson Education, Inc. USA.
Mian, T. S. (2014). Examining the level of financial literacy among Saudi investors and its impact on financial decisions. International Journal of Accounting and Financial
Reporting, 4(2), 312–328. http://doi.org/http://dx.doi.org/10.5296/ijafr.v4i2.6487. Parrotta, J. L., & Johnson, P. J. (1998). The impact of financial attitudes and knowledge on
financial management and satisfaction of recently married individuals, 9(2).
Sabri, M. F. & Zakaria, N. F. (2015). The influence of financial literacy, money attitude, financial strain and financial capability on young employees‘ financial well-being. Pertanika Journal of Social Sciences and Humanities, 23(4), 827–848.
Shaari, N. A., Hasan, N. A., Ramesh Kumar Moona Haji, M., & Mior Ahmad Jafri Md, S.
(2013). Financial literacy: A study among the university students. Interdisciplinary Journal of Contemporary Research in Business, 5(2), 279.
Tali Te‘eni-Harari. (2016). Financial literacy among children: The role of involvement in saving money. Young Consumers, 17(2), 197–208.
World Bank (2014). World Development Indicators 2014. Washington, D.C., World Bank.
http://wdi.worldbank.org/table/2.11.
Nurul Wajhi Ahmad
Department of Accounting and Finance
Journal of Management & Muamalah, Vol. 6, No. 2, 2016
eISSN 2180-1681
103
Faculty of Management and Muamalah
International Islamic University College Selangor (KUIS) SELANGOR, MALAYSIA [email protected]
Murni Yunus Mawar
Department of Economics and Management Faculty of Management and Muamalah
International Islamic University College Selangor (KUIS)
SELANGOR, MALAYSIA [email protected]
Norazlina Ripain
Department of Accounting and Finance
Faculty of Management and Muamalah
International Islamic University College Selangor (KUIS)
SELANGOR, MALAYSIA [email protected]
Attitudes and Tax Compliance:
The Role of Tax Knowledge and Education
(Sikap dan Pematuhan Cukai: Peranan Pengetahuan Cukai dan Pendidikan)
Noor Suhaila Shaharuddin
Journal of Management & Muamalah, Vol. 6, No. 2, 2016
eISSN 2180-1681
104
Kolej Universiti Islam Antarabangsa Selangor
Selangor, Malaysia
Mohd Rizal Palil
Universiti Kebangsaan Malaysia
ABSTRACT
Tax knowledge and education among taxpayers are vital and very important in any countries. Lacking of knowledge and education will diminish tax collection that would have been used
for the nation‘s economic and social planning. This paper attempts to highlights the importance of tax knowledge and education in our daily routines. Tax knowledge was found
to moderate the relationship between attitude and compliance under reporting scenario. However, findings failed to support the moderating effect of tax knowledge on the relationship between attitude and compliance under filing scenario.
Key Words: Attitudes, Tax Knowledge, Compliance Behaviour
ABSTRAK
Pengetahuan dalam ilmu percukaian di kalangan pembayar cukai adalah penting bagi sesebuah negara. Pengetahuan yang cetek di kalangan penduduk akan menjejaskan hasil
kutipan cukai bagi membiayai pembangunan ekonomi dan sosial. Kajian ini cuba menonjolkan betapa pentingnya pengetahuan dan pendidikan ilmu percukaian dalam rutin
harian kita. Hasil kajian mendapati pengetahuan cukai berperanan sebagai pembolehubah penyederhana dalam hubungan antara sikap dan pematuhan di bawah senario pematuhan laporan. Namun, dapatan kajian gagal untuk menyokong pembolehubah penyederhana di
bawah senario pematuhan pemfailan.
Kata kunci: Sikap, Pengetahuan Cukai, Pematuhan Tingkahlaku
INTRODUCTION
Prior studies have documented that taxpayer compliance decisions are influenced by many social psychological factors (Bobek, Hageman, & Kelliher, 2011; Morse et al. 2009;
Randlane, 2012). People‘s attitude toward behaviour has been shown to be one of the most relevant socio-psychological factors of tax compliance (Murphy, 2004; Kirchler, Hoelzl, & Wahl, 2008; Randlane, 2012). The importance of attitudes in determining tax compliance is
evident in a review of Cullis and Lewis (1997). In their study, the authors conclude that the values, attitudes, perceptions and morals of the taxpayers are of paramount importance. They
particularly state that tax compliance will be relatively high when attitudes towards compliance are favourable. This is consistent with Hanno and Violette (1996) who empirically establish the positive link between attitude toward tax compliance and
Journal of Management & Muamalah, Vol. 6, No. 2, 2016
eISSN 2180-1681
105
compliance behaviour. In Malaysia, Loo, Mckerchar, & Hansford (2009) found that
taxpayers with favourable attitudes would be more compliant. In other words, people do willingly to comply with their tax obligations may be positively related to their attitudes about taxes.
Research has identified there are certain components that forming taxpayers‘ attitude
such as social norms, tax morale, patriotism, guilt and shame that are considered to have significant influence on tax compliance behaviour (Hanno & Violette, 1996; Kirchler, 2007; Kornhauser, 2007; and Torgler, 2007. While those components are undeniably important,
this present study is however, interested on focusing on emotional components of attitudes such as sense of civic duty, feelings of guilt, and feelings of shame for failure to comply with
the requirement of tax law. In other words, all these emotions elements would be the motivational forces in deterring taxpayer engaging in tax evasion.
In the context of tax compliance studies, Torgler (2007) argued that person who chooses to evade taxes may feels guilty of not paying or less paying income tax if the
obligation of paying taxes is an accepted social norm. They may feel worried about getting caught and feel ashamed if all underreported income is discovered by tax authority. In fact, there is some evidence that feelings of shame and guilt over wrongdoing may influence
taxpayers‘ reporting decision (Alm & Torgler, 2011). Erard & Feinstein (1994) based on psychological theories incorporate the role of guilt and shame in tax compliance behaviour.
Nevertheless, Erard and Feinstein‘s approach concluded that the taxpayer will not experience the threat of embarrassment if the people whose opinions are most valued do not discover his crime.
Ahmad & Braithwaite (2005a) also have found that feeling of guilt and shame may
have been the driving mechanisms in predicting whether a person will or will not comply with their obligations. In a recent study of Coricelli, Joffily, Montmarquette, & Villeval (2010) investigated the role of emotions and tax evasions, stated that people may feel anxiety
not only because of possible punishment for illegal behaviour but also as a matter of moral implications associated with the risk of a public exposure of their behaviour. In other words,
they may feel regret and shame if their cheating behaviour is publicly revealed. This might have a significant impact on efforts to improve compliance and reduce the proportion of evaded income. Coricelli, Joffily, Montmarquette, & Villeval (2010) further suggested that a
tax authority should capture moral emotional in order to encourage more tax compliance from individuals.
In addition, they may feel good about themselves for doing the right thing and served
their country and communities (Calvet & Alm, 2014). They are able to file successfully an
appropriate tax return and pay the correct amount of taxes. Torgler (2004) also found that the extent of happiness may influence the moral attitudes towards tax compliance and thus
increase taxpayers‘ willingness to pay taxes honestly. In some cases, however, some taxpayers may feel good and gets mental and financial peace even though they are doing something wrong. If taxpayers think that evading taxes is not wrong as it does not really hurt
Journal of Management & Muamalah, Vol. 6, No. 2, 2016
eISSN 2180-1681
106
anyone, he or she may not comply with tax laws. In other words, they do not feel remorse for
avoiding their tax obligations and will never find themselves at fault (Murphy, 2004a). In fact, they blame someone else for what has happened to them. Thus, it is clear that all these feelings, thoughts and beliefs can have a strong influence in forming taxpayer attitudes
towards tax compliance.
Apart from that, attitude that based on sense of civic duty is also relevant and important in explaining tax compliance behaviour. Civic duty refers to a belief that an individual has an obligation to undertake actions that benefit others even when the actions are costly to
themselves. The question of why some people pay taxes while others do not can be explained, or at least in part by recognizing a person‘s sense of civic duty. Some suggest that
an individual will comply with their tax obligation not merely because they are concerned with the threat of punishment or fears of being under the ―radar screen‖ of tax administration, but because they have a sense of civic duty (Bergman & Nevarez, 2006). Some researchers
have shown that the sense of civic duty has a powerful predictor of how likely an individual‘s reaction to tax issues (Torgler, 2007; Hofmann et al. 2008).
Kornhauser (2007) claimed that people with a high sense of obligation to comply with
tax laws will see paying taxes as a gain, not as a loss of personal income. They believed that
the government will act in their interest and provide numerous vital benefits for society. When they believed that the tax system is fair, an individual with a strong sense of civic duty
are therefore tend to be compliant and willing to cooperate with tax authority. They have an ―intrinsic motivation‖ to comply with such obligation even if the system provides opportunities for noncompliance (Alm, Kirchler, & Muehlbacher, 2012).
The concept of civic duty is also supported by the work of Orviska & Hudson's (2002).
They believed that people may comply with the law because they feel that the legal authorities have the right to dictate behaviour. However, civic responsibilities have a close relation with voluntary work and it‘s really good because it makes an individual feel better
for giving back to the society. In brief, the results provide evidence that both civic duty and law abidance have a significant impact on the decision to evade taxes via attitudes to tax
evasion. In other words, senses of civic duty are the motivational forces in deterring taxpayer engaging in tax evasion. People could avoid all tax, but the concept of civic duty suggest that people would still choose to pay tax because they feels bonded to and concerned about the
welfare and rights of others in one‘s community.
In summary, the inclusion of noneconomic factors such as attitude may be a significant factor in the analysis of tax compliance. To a certain extent, according to Rhodes & Courneya (2003) attitudes are more important than opportunities in determining taxpayers‘
behaviour. Therefore, policy makers need to address the emotional components and opinions about government or the tax system to better understand the general framework of attitudes
in tax compliance.
Journal of Management & Muamalah, Vol. 6, No. 2, 2016
eISSN 2180-1681
107
ROLE OF TAX KNOWLEDGE AND EDUCATION
One of the underlying assumptions about the link between attitudes and behaviour is the
principle of consistency. It is usually assumed that the behaviour of a person tend to be consistent with the attitudes that they hold. Therefore, if we knew someone‘s attitude, then
we could predict about how that individual will behave. As mentioned before, attitudes have an impact on the decision we make. These attitudes affect how people feel about certain issues, which in turn may govern their behaviour. However, in some cases people do not
always follow what they believe, but behave differently. For instance, in a tax context people may have a positive feeling towards paying taxes, but were much more likely to support for
tax evasion. Thus, the difference between what we say and what we do may raise some questions about the relationship between attitude and behaviour. It is apparent that there are factors that intervene between attitude and behaviour which cause a person‘s behaviour to be
inconsistent with his or her attitudes.
Journal of Management & Muamalah, Vol. 6, No. 2, 2016
eISSN 2180-1681
108
In taxation context, attitude toward tax compliance may be influenced by various
factors for example fairness perceptions of the tax system ((Kirchler, 2007, Devos, 2009;
Feld & Frey, 2007), taxpayers‘ understanding of a tax law (Palil and Lymer, 2009), tax
education (Mat Bahari & Lai, 2009;), demographic factors (Ross & Mcgee, 2012) and many
others. While the contributions of those factors are generally acknowledged, the present
study however, focuses solely on one main behavioural factor that have been identified as
universal importance for sole proprietors namely tax knowledge requirements.
Prior studies of small business have shown that lack of tax knowledge are major contributors to unintentional non compliance. They were also shown to have less tax knowledge than employed persons, thus felt less competent in filing their tax returns
(Kamleitner et al. 2012; Loo, Mckerchar, & Hansford, 2009). It was found that, they were not able to compute tax liability and even not aware of the existence of the relevant
incentives and exemptions that the government has provided to reduce their tax burden (Lai & Zainal Arifin, 2011; Loo et al. 2010). When they feel unqualified to file their tax appropriately, a majority seeks advice from tax practitioner to deal with their tax matters
(Kirchler, 2007).
Tax laws are too complex to be understood by laymen and its changes make it difficult not only for tax officers, tax academics, tax practitioners to keep abreast of the latest development, but to ordinary people like the sole proprietors (Choong, Wong, & Khin,
2011). Essentially, tax law imposes two separate obligations on sole proprietor namely submitting tax return and the payments of tax liabilities. In order to meet both obligations
there is a need keep records and documents in relation to their business operations. They also need to analyze how certain transactions should be treated for tax purposes and struggle to properly calculate their tax liability. These obligations may seem quite complicated and
complex for the small business owners who cannot afford to hire a tax agent. Even for those having their taxes prepared by tax agent, they may not fully understand what they are
actually looking at. Since tax laws are criticised for being too complex, it can be expected that the level of
tax knowledge is considered relatively low (Kirchler, 2007). In order to enhance taxpayers‘ ability to understand the tax laws and to take advantage of these tax incentives and
exemptions, previous studies have documented that tax knowledge plays a strong role in forming an individual‘s attitude and consequently improve compliance (Eriksen & Fallan, 1996; Palil & Mustapha, 2011). According to Loo et al. (2010), when a taxpayer has good
knowledge on taxes, it may somehow improve taxpayer‘s positive attitudes towards tax laws. These improvements are expected to encourage the willingness of taxpayer to comply with
tax obligations. Barjoyai (1992) also emphasized the importance of tax knowledge as the most essential factor that can influence peoples' attitudes towards taxation and tax compliance behaviors. It is probably more important than knowledge of geography or
geometry. Barjoyai further suggested that all future taxpayers need to be equipped with
Journal of Management & Muamalah, Vol. 6, No. 2, 2016
eISSN 2180-1681
109
sufficient tax knowledge at schools or tertiary levels as taxation is a universal knowledge and
needed by each citizen with potential liability of paying tax one day. Several researchers have reported that greater awareness and additional knowledge on
tax matters has a positive influence on attitudes towards tax compliance. For example, in a study by Eriksen and Fallan (1996) reports significant changes in respondents attitude toward
tax due to the increased in specific tax knowledge. They presumed both the information about tax rules and the financial knowledge as in order to calculate economic consequences for taxpayers. After taking part in a course on taxes, respondents more severely judged tax
evasion and perceived tax system as fairer. It shows that tax knowledge is one of the best devices to reduce the tax evasion among taxpayers, given that as the level of tax knowledge
increases. Another related study by Fallan (1999) confirmed that a better knowledge of tax law would improve taxpayer attitudes and consequently have an impact on tax compliance behaviour. A central issue was whether knowledge related to taxation would influences the
attitudes of male and female tax law students differently. In that experimental study, Fallan (1999) focused on technical knowledge of tax concerning tax allowances and tax liabilities.
The author found that better understanding of the tax system would significantly change both male and females‘ attitudes towards the fairness of tax system. After increasing their tax knowledge, they considered the tax system to be fairer than they did before. Having
demonstrated the importance of tax knowledge in shaping tax compliance behaviour, the following hypotheses are proposed:
H1: Tax knowledge and education moderates the relationship between attitude and intention to comply with tax obligations (reporting compliance)
H2: Tax knowledge education moderates the relationship between attitude and intention
to comply with tax obligations (filing compliance)
METHODOLOGY
Sample and Data
The sample of this study would be small business taxpayers who operate business, located on the both sides of the North-South Expressway. Based on the data released by Malaysian
Highway Authority, there are 24 Rest and Service areas (inclusive of four overhead bridge restaurants) and 45 lay-bys on all PLUS-operated highways for the convenience of the travelling public. Fourteen locations of rest areas have been chosen to be included in the
survey. The survey questionnaire was handed directly to the target respondents. An estimated of 276 stall operators were expected to be included in this study. However, the actual
numbers of stall operators present were only 245 people. The data collection process took approximately five months to complete, commencing in April 2014 and ending in early August 2014.
Instrument
The questionnaire survey consists of four sections namely Section A, Section B, Section C and Section D. Section A and Section B were designed to measure the behavioural dimension of respondents. Section C was designed to measure the amount of tax knowledge where the
Journal of Management & Muamalah, Vol. 6, No. 2, 2016
eISSN 2180-1681
110
respondents were tested on some of the basic tax knowledge. Finally, Section D contained
questions on the respondents‘ profile such as age, gender, education and experience. All instruments were adapted from various literatures with minor wording modifications to fit the study context.
In this study, compliance behaviour was measured through its proxy, intention to
comply. Due to the lack of access to IRB data, it was not possible to measure the actual tax behaviour of the respondent. As such, this study developed two different tax compliance scenarios that are relevant to their business activities in explaining tax compliance behaviour.
Each scenarios contain a brief descriptions of a real life tax compliance situation which requires respondents to respond how they might react in a given circumstances.
In the first scenario, respondents were asked whether they would report the cash
income on their tax return if they were in similar situation as stated in the scenario. The
second scenario requires the respondent to determine whether they would file a tax return if they were in similar situation faced by a hypothetical person. In order to increase the validity
and reliability of the scenarios, a discussion has taken place between the researcher and tax officer of IRBM. They were asked whether or not the scenarios presented reflect the reality and the most frequent tax scenarios that they faced.
In order to assess attitude toward compliance behaviour, a few statements were
provided where the respondents were asked to indicate how they feel about the compliant course of action as described in the scenario. An attitude which relates to emotional elements such as guilty, sense of civic duty is measured with six items. For instance, in the reporting
compliance scenario, respondents were asked whether they feel pleased of guilty if they omit the cash sale from the tax computation. These statements were adapted from previous
research by Ajzen (2002) and Saad (2009) with some minor modifications. The level of tax knowledge was measured based on the total score of each
respondent. Marks were given for each question and it was consistent with the method used by Eriksen and Fallan (1996). Respondents with correct answers received a score of 3 (well
informed), respondents with ‗do not know‘ answer received a score of 2 (un-informed) and respondents with a wrong answer received a score of 1 (mis-informed)
RESULTS The research model was tested using the SPSS for descriptive, correlation and reliability analysis. Then we proceeded to use AMOS version 20 to test the model using Structural Equation Modelling (SEM). In addition, multi-group analysis was conducted to test whether
a moderating effect of tax knowledge exists. The sample was split into two groups, namely Data 1 and Data 2. Data 1 is renamed as low tax knowledge group and data 2 is renamed as
high tax knowledge group. In order to determine whether the moderating variable affect the direction of attitude and intention to comply, this study used the criterion suggested by Hair et al. (2010). According to Hair et al. (2010), a moderating effect is present under two
Journal of Management & Muamalah, Vol. 6, No. 2, 2016
eISSN 2180-1681
111
circumstances. In the first situation, beta for first group is significant while beta for second
group is non-significant. In the second situation, beta for both group are significant but one is positive while the other is negative. The respondents‘ profile is presented in Table 1. There were a total of 225 respondents and the profile of respondents reasonably reflects the sample
population of stall operators along the expressway.
The distribution of the 225 respondents shows that about 47.1 per cent of the respondents were males and 51.6 per cent were females. They are mainly in the 36 – 45 year old range (30.7 per cent) and only 4 per cent under the age 25 years. The majority of the
respondents were Malays (86.2 per cent), and the remainders were Chinese (10.2 per cent) and Indian (1.3 per cent). About 23.6 per cent of the respondents have been in the business
for less than 10 years, 44.9 per cent between 10 – 19 years and the remainder of 28.9 per cent have been in the business for more than 20 years. About 44.8 per cent of respondents engaged in food stalls and about 38.6 percent of respondents sell beverages. Meanwhile,
about 9.4 percent of the respondents selling various kinds of local fruits and the rest of them that is 4.1 percent, selling handicrafts and other products. However, it was found that most
respondents never filed their tax return (49.8 per cent) and 16.4 per cent of the respondents had filed their tax return for more 5 times. When asked whether the respondents have attending any seminars or courses organized by IRB, the majority of them (77.3 per cent)
would response ―no‖ even though the seminar was conducted without a charge.
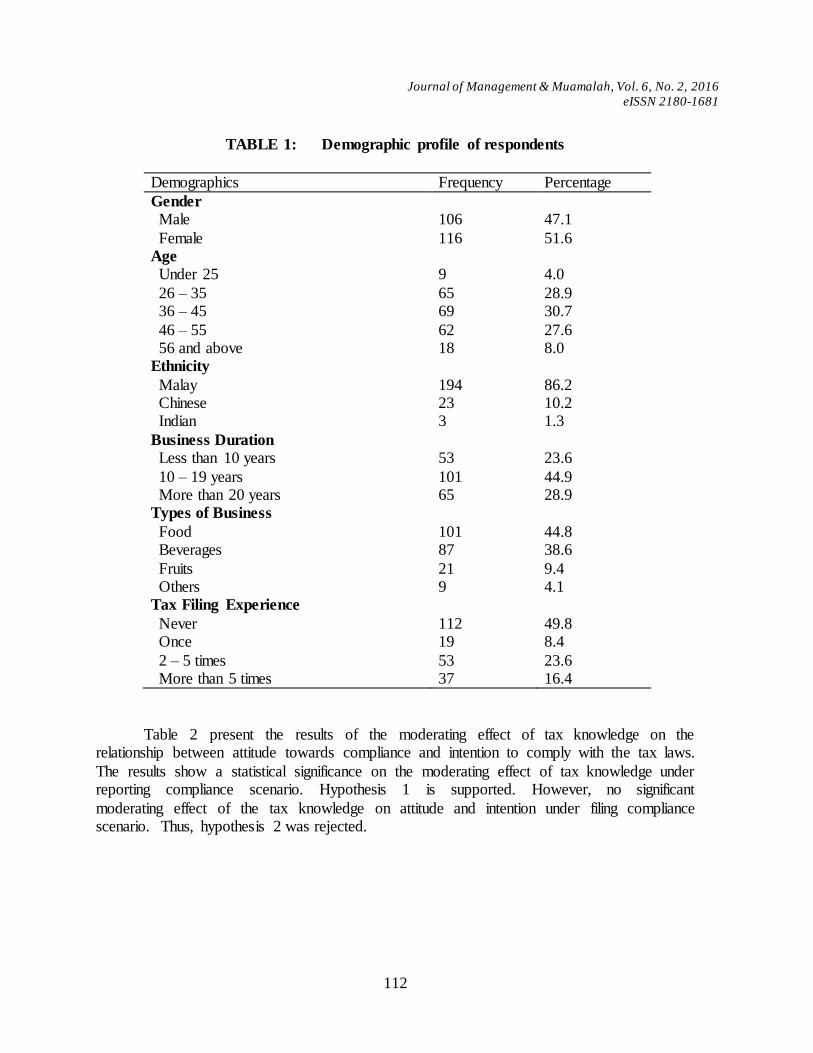
Journal of Management & Muamalah, Vol. 6, No. 2, 2016
eISSN 2180-1681
112
TABLE 1: Demographic profile of respondents
Demographics Frequency Percentage
Gender
Male
Female
106
116
47.1
51.6 Age
Under 25
26 – 35 36 – 45
46 – 55 56 and above
9
65 69
62 18
4.0
28.9 30.7
27.6 8.0
Ethnicity
Malay Chinese Indian
194 23 3
86.2 10.2 1.3
Business Duration
Less than 10 years
10 – 19 years More than 20 years
53
101 65
23.6
44.9 28.9
Types of Business
Food Beverages
Fruits Others
101 87
21 9
44.8 38.6
9.4 4.1
Tax Filing Experience
Never Once
2 – 5 times More than 5 times
112 19
53 37
49.8 8.4
23.6 16.4
Table 2 present the results of the moderating effect of tax knowledge on the relationship between attitude towards compliance and intention to comply with the tax laws.
The results show a statistical significance on the moderating effect of tax knowledge under reporting compliance scenario. Hypothesis 1 is supported. However, no significant
moderating effect of the tax knowledge on attitude and intention under filing compliance scenario. Thus, hypothesis 2 was rejected.
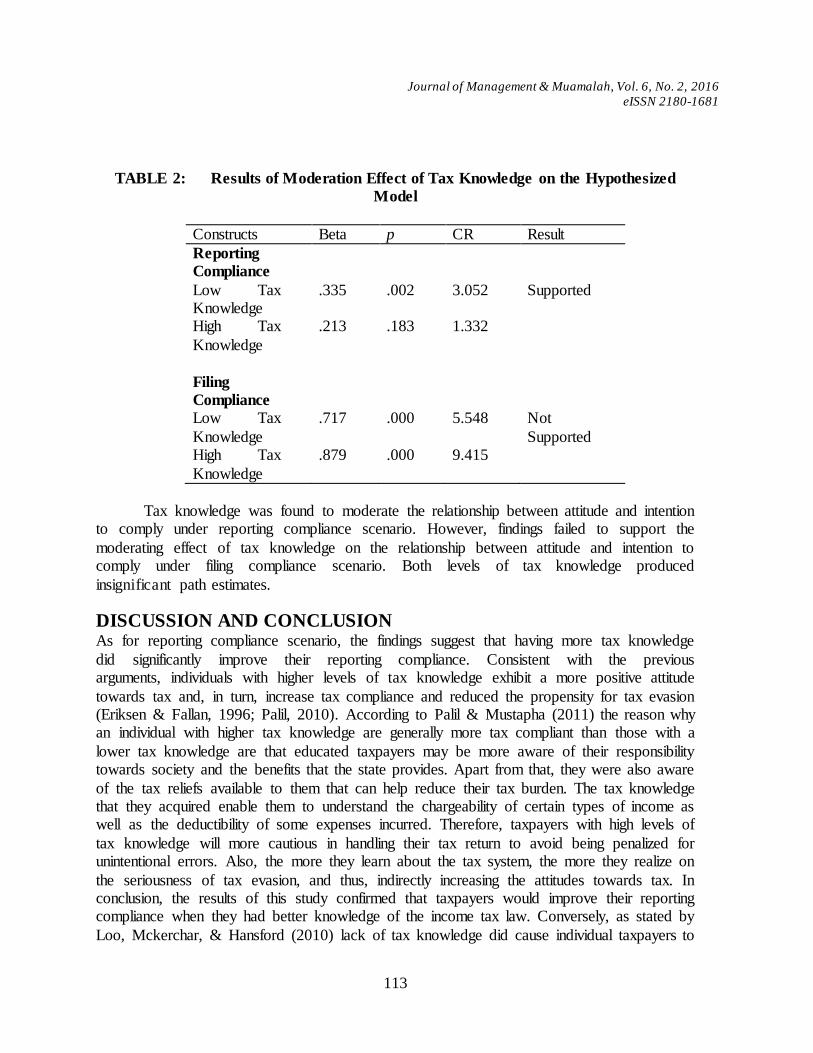
Journal of Management & Muamalah, Vol. 6, No. 2, 2016
eISSN 2180-1681
113
TABLE 2: Results of Moderation Effect of Tax Knowledge on the Hypothesized
Model
Constructs Beta p CR Result
Reporting
Compliance
Low Tax Knowledge
.335 .002 3.052 Supported
High Tax
Knowledge
.213 .183 1.332
Filing
Compliance
Low Tax
Knowledge
.717 .000 5.548 Not
Supported High Tax
Knowledge
.879 .000 9.415
Tax knowledge was found to moderate the relationship between attitude and intention to comply under reporting compliance scenario. However, findings failed to support the
moderating effect of tax knowledge on the relationship between attitude and intention to comply under filing compliance scenario. Both levels of tax knowledge produced
insignificant path estimates.
DISCUSSION AND CONCLUSION As for reporting compliance scenario, the findings suggest that having more tax knowledge
did significantly improve their reporting compliance. Consistent with the previous arguments, individuals with higher levels of tax knowledge exhibit a more positive attitude
towards tax and, in turn, increase tax compliance and reduced the propensity for tax evasion (Eriksen & Fallan, 1996; Palil, 2010). According to Palil & Mustapha (2011) the reason why an individual with higher tax knowledge are generally more tax compliant than those with a
lower tax knowledge are that educated taxpayers may be more aware of their responsibility towards society and the benefits that the state provides. Apart from that, they were also aware
of the tax reliefs available to them that can help reduce their tax burden. The tax knowledge that they acquired enable them to understand the chargeability of certain types of income as well as the deductibility of some expenses incurred. Therefore, taxpayers with high levels of
tax knowledge will more cautious in handling their tax return to avoid being penalized for unintentional errors. Also, the more they learn about the tax system, the more they realize on
the seriousness of tax evasion, and thus, indirectly increasing the attitudes towards tax. In conclusion, the results of this study confirmed that taxpayers would improve their reporting compliance when they had better knowledge of the income tax law. Conversely, as stated by
Loo, Mckerchar, & Hansford (2010) lack of tax knowledge did cause individual taxpayers to
Journal of Management & Muamalah, Vol. 6, No. 2, 2016
eISSN 2180-1681
114
engage in numerous errors in tax returns, particularly those who prepared their own tax
returns. This, in turn, would lead to unintentional non-compliance behaviour. However, they further added that, for some taxpayers who seem to have better knowledge on tax law might exercise better tax planning in terms of tax avoidance.
With regard to the impact of tax knowledge on filing compliance scenario, results
provide no support for Hypotheses 2. Findings indicate that tax knowledge is not a moderator on the relationship between attitude and intention to comply. Thus, tax knowledge did not affect the strength and direction of the relation between these two variables. This does make
sense because to file an income tax return, high level knowledge of tax laws are not necessary. It does not matter whether they have sufficient knowledge of tax laws, they would
be able to file a tax return if they wanted to, even with minimum tax knowledge As such, based on the case scenario presented to respondents, the tax knowledge may not be important in their decision to file or not to file a personal tax return.
The findings of this study could be used as a reference for any tax regime in order to
improve the management of their tax system. It was found that taxpayers‘ compliance behaviour depends on their attitude towards the tax system. If taxpayers have favourable attitudes towards tax authorities, then this will lead to more compliance. In this study, the
effects of guilt feelings and a strong sense of civic duty are the motivational forces leading to, or deterring, taxpayers engaging in noncompliant behaviour. Thus, tax authorities should
be focusing on these emotional components if they wish to increase taxpayers‘ compliance. However, it is generally difficult to cultivate a more positive attitude towards voluntary compliance, particularly when they have unfavourable views of tax system. This is because
an attitude is normally associated with someone‘s self perception where the tax authorities might have little or no control. As such, a relatively easier way to improve compliance is to
focus on the issues of concern highlighted in this study particularly in the ―reporting compliance scenario‖. Attitudes towards compliance could be improved by enhancing taxpayers‘ level of tax knowledge and emphasis on technical and computational aspects of
filing returns. In other words, tax authorities may have to focus on the technical aspect of the tax knowledge and the content of the tax law in their efforts to improve taxpayers knowledge
and reduce the complexity of the income tax systems. Apart from that, the tax authority could play its role by disseminating all information
regarding taxes collected and the details of how the tax revenue was spent. A lack of information can result in negative perceptions among taxpayers on the government spending
of tax revenues even though the government might have spent the money wisely. Therefore, a long run campaigns through the public media and ongoing seminars for the taxpayers could be an effective way to communicate tax matters to general public. It is also recommended to
introduce taxation as a compulsory subject at the secondary school level in order to educate the nations on the importance of tax in their life. In addition, tax courses also should be
offered to other fields of study as currently tax courses are only offered for accounting students. By doing so, every person has sufficient tax knowledge to understand the tax laws and comply voluntarily.
Journal of Management & Muamalah, Vol. 6, No. 2, 2016
eISSN 2180-1681
115
To conclude, the information obtained from this study should assist policy-makers, particularly tax authorities, in reviewing and modifying current tax systems, where necessary, to improve voluntary tax compliance.
REFERENCES
Ahmad, E., & Braithwaite, V. (2005). A need for emotionally intelligent policy : Linking tax evasion with higher education funding. Legal and Criminological Psychology, 10(2), 291–308.
Alm, J., Kirchler, E., & Muehlbacher, S. (2012). Rethinking the Research Paradigms for
Analyzing Tax Compliance Behavior Rethinking the Research Paradigms for Analyzing Tax Compliance Behaviour. Tulane Economic Working Paper No. 1210, Tulane University.
Alm, J., & Torgler, B. (2011). Do Ethics Matter? Tax Compliance and Morality. Journal of
Business Ethics, 101(4), 635–651.
Bergman, M., & Nevarez, A. (2006). Do Audits Enhance Compliance? An Empirical Assessment of VAT Enforcement. National Tax Journal, LIX(No 4), 817–832.
Bobek, D. D., Hageman, A. M., & Kelliher, C. F. (2011). The Social Norms Of Tax Compliance : Scale Development , Social Desirability , And Presentation Effects. Advances
in Accounting Behavioral Research, 14(2011), 37–66.
Calvet, R., & Alm, J. (2014). Empathy , Sympathy , and Tax Compliance. Journal of Economic Psychology, 40, 62–82.
Choong, K. F., Wong, E., & Khin, S. (2011). A Study on Self-Assessment Tax System
Awareness in Malaysia. Australian Journal of Basic and Applied Sciences, 5(January 2007), 881–888.
Coricelli, G., Joffily, M., Montmarquette, C., & Villeval, M. C. (2010). Cheating, emotions, and
rationality: an experiment on tax evasion. Experimental Economics, 13(2), 226–247. doi:10.1007/s10683-010-9237-5
Cullis, J. G., & Lewis, A. (1997). Why people pay taxes: From a conventional economic model to a model of social convention. Journal of Economic Psychology, 18, 305-321
Erard, B., & Feinstein, J. S. (1994). Honesty and evasion in the tax compliance game. The RAND Journal of Economics, 25(1), 1–19.
Journal of Management & Muamalah, Vol. 6, No. 2, 2016
eISSN 2180-1681
116
Eriksen, K., & Fallan, L. (1996). Tax knowledge and attitudes towards taxation; A report on a
quasi-experiment. Journal of Economic Psychology, 17(3), 387–402.
Fallan, L. (1999). Gender , Exposure to Tax Knowledge , and Attitudes Towards Taxation ; An Experimental Approach. Journal of Business Ethics, 18, 173–184.
Hofmann, E., Hoelzl, E., & Kirchler, E. (2008). Preconditions of Voluntary Tax Compliance:
Knowledge and Evaluation of Taxation, Norms, Fairness, and Motivation to Cooperate. Journal of Psychology, 216(4), 209–217.
Kamleitner, B., Korunka, C., & Kirchler, E. (2012). Tax compliance of small business owners : A review. International Journal of Entrepreneurial Behaviour & Research, 18(3), 330–351.
Kirchler, E. (2007). The Economic Psychology of Tax Behavior. Cambridge: Cambridge
University Press.
Kirchler, E., Hoelzl, E., & Wahl, I. (2008). Enforced versus voluntary tax compliance: The ―slippery slope‖ framework. Journal of Economic Psychology, 29(2), 210–225.
Kornhauser, M. E. (2007). Normative and Cognitive Aspects of Tax Compliance : Literature
Review and Recommendations for the IRS Regarding Individual Taxpayers. Florida Tax Review, 8(6), 138–180.
Lai, M. L., & Zainal Arifin, M. (2011). Small Business Enterprises And Taxation : A Case Study
Of Corporate Clients Of A Tax. Academy of Accounting and Financial Studies Journal, 15(1), 11–25.
Loo, E. C., Mckerchar, M., & Hansford, A. (2010). Findings On The Impact Of Self Assessment On The Compliance Behaviour Of Individual Taxpayers In Malaysia : A Case Study
Approach. Journal Of Australian Taxation, 1–23.
Loo, E. C., Mckerchar, M., & Hansford, A. N. N. (2009). Understanding The Compliance Behaviour Ofmalaysian Individual Taxpayers Using Amixedmethod Approach. Journal of
the Australasian Tax Teachers Association, 4(1), 181–202.
Mat Bahari, A. B., & Lai, M. L. (2009). Introducing Tax Education in Non-Accounting Curricuium in Higher Education : Survey Evidence, 7(1), 37–51.
Morse, S., Karlinsky, S., & Bankman, J. (2009). Cash Businesses and Tax Evasion. Stanford
Law & Policy Review, 20, 37–68.
Murphy, K. (2004a). Aggressive tax planning: Differentiating those playing the game from those who don‘t. Journal of Economic Psychology, 25(3), 307–329.
Journal of Management & Muamalah, Vol. 6, No. 2, 2016
eISSN 2180-1681
117
Murphy, K. (2004b). An Examination Of Taxpayers ‘ Attitudes Towards The Australian Tax
System : Findings From A Survey Of Tax Scheme Investors. Working Paper 46, (November).
Orviska, M., & Hudson, J. (2002). Tax evasion , civic duty and the law abiding citizen. European Journal of Political Economy, 19(1), 83–102.
Palil, M. R., & Mustapha, A. F. (2011). Factors affecting tax compliance behaviour in self assessment system. African Journal of Business Management, 5(33), 12864–12872.
Petty, R. E., Wheeler, S. C., & Tormala, Z. L. (2003). Persuasion and Attitude Change. In T.Millon & M.J.Lerner (Eds.). Comprehensive Handbook of Psychology , New York: John
Wiley, 5, 353–382.
Randlane, K. (2012). Tax Compliance and Tax Attitudes : The Case of Estonia. Journal Of Management And Change, (29).
Ross, A. M., & Mcgee, R. W. (2012). A Demographic Study Of Polish Attitudes Toward Tax
Evasion. Academy of Accounting and Financial Studies Journal, 16(4), 1–41.
Schneider, F., & Torgler, B. (2007). What Shapes Attitudes Toward Paying Taxes ? Evidence from Multicultural European Countries. Social Science Quarterly, 88(2), 443–470.
Torgler, B. (2004). Tax morale in Asian countries. Journal of Asian Economics, 15(2), 237–266.
Torgler, B. (2007). Tax Compliance and Tax Morale: A Theoretical and Empirical Analysis.
Cheltenham, UK: Edward Elgar Publishing.
Noor Suhaila Shaharuddin
Faculty of Management and Muamalah
Kolej Universiti Islam Antarabangsa Selangor Bandar Seri Putra, 43000 Kajang, Selangor, MALAYSIA [email protected]
Mohd Rizal Palil
School of Accounting, Faculty of Economics and Management Universiti Kebangsaan Malaysia 43600 UKM Bangi, MALAYSIA