Embed Size (px)
Citation preview

Journal of International Academic Research for Multidisciplinary
www.jiarm.com
Editorial Board
Dr. Kari Jabbour, Ph.D Curriculum Developer, American College of Technology, Missouri, USA.
Er.Chandramohan, M.S System Specialist - OGP ABB Australia Pvt. Ltd., Australia.
Dr. S.K. Singh Chief Scientist Advanced Materials Technology Department Institute of Minerals & Materials Technology Bhubaneswar, India
Dr. Jake M. Laguador Director, Research and Statistics Center, Lyceum of the Philippines University, Philippines.
Prof. Dr. Sharath Babu, LLM Ph.D Dean. Faculty of Law, Karnatak University Dharwad, Karnataka, India
Dr.S.M Kadri, MBBS, MPH/ICHD, FFP Fellow, Public Health Foundation of India Epidemiologist Division of Epidemiology and Public Health, Kashmir, India
Dr.Bhumika Talwar, BDS Research Officer State Institute of Health & Family Welfare Jaipur, India
Dr. Tej Pratap Mall Ph.D Head, Postgraduate Department of Botany, Kisan P.G. College, Bahraich, India.
Dr. Arup Kanti Konar, Ph.D Associate Professor of Economics Achhruram, Memorial College, SKB University, Jhalda,Purulia, West Bengal. India
Dr. S.Raja Ph.D Research Associate, Madras Research Center of CMFR , Indian Council of Agricultural Research, Chennai, India
Dr. Vijay Pithadia, Ph.D, Director - Sri Aurobindo Institute of Management Rajkot, India.
Er. R. Bhuvanewari Devi M. Tech, MCIHT Highway Engineer, Infrastructure, Ramboll, Abu Dhabi, UAE Sanda Maican, Ph.D. Senior Researcher, Department of Ecology, Taxonomy and Nature Conservation Institute of Biology of the Romanian Academy, Bucharest, Romania Dr. Reynalda B. Garcia Professor, Graduate School & College of Education, Arts and Sciences Lyceum of the Philippines University Philippines Dr.Damarla Bala Venkata Ramana Senior Scientist Central Research Institute for Dryland Agriculture (CRIDA) Hyderabad, A.P, India PROF. Dr.S.V.Kshirsagar, M.B.B.S,M.S Head - Department of Anatomy, Bidar Institute of Medical Sciences, Karnataka, India. Dr Asifa Nazir, M.B.B.S, MD, Assistant Professor, Dept of Microbiology Government Medical College, Srinagar, India. Dr.AmitaPuri, Ph.D Officiating Principal Army Inst. Of Education New Delhi, India Dr. Shobana Nelasco Ph.D Associate Professor, Fellow of Indian Council of Social Science Research (On Deputation}, Department of Economics, Bharathidasan University, Trichirappalli. India M. Suresh Kumar, PHD Assistant Manager, Godrej Security Solution, India. Dr.T.Chandrasekarayya,Ph.D Assistant Professor, Dept Of Population Studies & Social Work, S.V.University, Tirupati, India.
JIARM VOLUME 1 ISSUE 8 (SEPTEMBER 2013) ISSN : 2320 – 5083
175 www.jiarm.com
FACTORS AFFECTING THE EFFECTIVENESS OF MONITORING AND EVALUATION OF CONSTITUENCY DEVELOPMENT FUND PROJECTS IN
CHANGAMWE CONSTITUENCY, KENYA
MUSOMBA KASANGA SAMMY* KERONGO FRANCIS M**
MUTUA NICHOLAS MUTHAMA*** KILIKA SAMUEL****
*School of Human Resource Development, Jomo Kenyatta University of Agriculture & Technology, Nairobi-Kenya
**School of Human Resource Development, Jomo Kenyatta University of Agriculture & Technology, Nairobi-Kenya ***Assistant Lecturer & Chairman of the Dept. of Mathematics and Informatics, Taita Taveta University College, Voi-Kenya
****School of Science & Informatics, Dept. of Mathematics and Informatics, Taita Taveta University College, Voi-Kenya
ABSTRACT
Although Kenya has pursued economic development through central planning since
independence in 1963, the centralization of authority and management of resources has led to
inadequate distribution of resources across regions. Substantive decentralization policy came
in 1983 with the adoption of the District Focus for Rural Development (DFRD) strategy
which aimed at enhancing geographical equity where funds were allocated to less developed
districts. The Constituency Development Fund was created in 2003 out of the desire to
achieve Community Driven Development where the local communities generate their own
development agenda and get it funded by the central government. Unlike other devolved
funds that go through several bureaucracies, the funds under this program go directly to the
local level. The research sought to find out the factors affecting the effective monitoring and
evaluation of projects under this fund. The research had five guiding objectives. These were:
To determine the influence of level of training, budgetary allocation, stakeholder
participation, politics and institutional framework on effective monitoring and evaluation of
CDF projects. A descriptive survey research design was used to collect primary data. The
questionnaire was pilot tested so that the anomalies were corrected. Qualitative data was also
collected which provided adequate clarifications on some aspects of the primary data. The
research purposively targeted 31 respondents, 27 of whom were project Management
Committee members responsible for monitoring and evaluation of CDF projects according to
the CDF Act (2003). The rest were officials charged with responsibilities for prudent
management of this fund. A census was done involving all the respondents. Descriptive
analysis of the data collected was mainly done in narrative form using descriptive statistics
and tables as appropriate. The results agreed with other similar studies done previously. The
research established that there were several factors affecting effective monitoring and
evaluation of Constituencies Development Fund. These included lack of training of those
JIARM VOLUME 1 ISSUE 8 (SEPTEMBER 2013) ISSN : 2320 – 5083
176 www.jiarm.com
tasked with monitoring and evaluation activities and unclear institutional framework for
conducting the same. Other factors included not incorporating monitoring and evaluation
budget into project budgets, limited involvement or primary stakeholders and political
interference. The study recommends training of the various committees involved in
monitoring and evaluation to arm them with requisite skills and improve communication of
data, defining clear structures for monitoring and evaluation including an appointment of
monitoring and evaluation personnel, delineation of monitoring budget from capacity
building, involvement of primary beneficiaries at all stages of the project cycle other than
conceptualization and limiting political influence in the CDF projects. The study also
recommends further research to establish whether monitoring and evaluation is effective in
other sectors covered by the CDF like Health and Water other than Education. Other
research could also look at modalities of strengthening primary stakeholders in order to
optimize their participation in monitoring and evaluation of projects.
KEYWORDS: Monitoring, Evaluation, Constituency Development Fund (CDF), Prudent
Management, Census, Stakeholders.
1. Background and Purpose
In March 1995, over 100 world leaders reached an agreement in Copenhagen to
eradicate poverty and foster social integration as a way of putting people at the centre of
development during the World Summit for Social Development, UN (1995). Five years later
in September 2000, world nations, Kenya included, adopted the Millennium Declaration.
This declaration adopted eight targets and actions to be achieved by 2015 chief of which
included eradication of extreme poverty and hunger with achieving universal primary
education MDGs Status Report for Kenya, (2005).
Most countries have resorted to decentralization of resources to tackle these challenges.
Decentralization refers to “the transfer of political power, decision making capacity and
resources from central to sub-national levels of government” Walker, (2002). This has led to
resuscitation of old institutions that seemed to offer opportunities for decentralization. Since
1990s decentralization has been linked to collective empowerment and democracy due to
failure of marketising reforms to significantly reduce absolute poverty Houtzager, (2003).
Democratic decentralization is more focused on democracy pluralism and human rights
Cook and Minor 1998; United Nations Capital Development Fund, (2000).
JIARM VOLUME 1 ISSUE 8 (SEPTEMBER 2013) ISSN : 2320 – 5083
177 www.jiarm.com
Most analysts distinguish among three types of decentralization namely administrative, fiscal
and political Smoke, (2003); and forms of decentralization; deconcentration, devolution
delegation, and privatization Work, (2002). Deconcentration and delegation are forms of
administrative decentralization. Political decentralization occurs in situations where political
power and authority are transferred to sub-national levels of government. Citizens and their
elected leaders get engaged in decision making and encourage citizen mobilization Litvack,
Ahmad and Bird, (1998) finally; we have fiscal decentralization which involves transfer of
financial resources from central government to sub national levels of government Work,
(2002). It is argued that is properly applied, fiscal decentralization can help in development.
It only needs institutional arrangements, such as a legal framework, political and
administrative institutions, local capacity, civil society and multi-party elections Litvack et al
(1998); McLure 1995; Tanzi, (2001).
According to studies done by Khasnabis,(2005) following the 73rd Constitution Amendment
Act 1992, a new generation of Panchayati Ray Institutions (PRI) has come into being in rural
India with respect to the preparation of plans for economic development schemes. The studies
showed that some states have benefited from decentralization. Democratic decentralization is
associated with a programme of radical agrarian reform, which over a period of more that 20
years has produced significant benefits for the poor in terms of participation growth of agriculture production and human development Webster,( 2000); Crook and Sverrisson, (2001)
Studies previously done by Ceara, Minas Gerais and Rio Grande do Sul (van) Zyl et al,
(1995), Tender, (1997); World Bank, (1997); Heller, (2001) show that most positive anti-
positive outcomes have been associated with either federally funded rural development
programmes (most notably the North East Rural Development Programmes) or state and city
level programmers launched by progressive reforming parties (Brazillian Social Democratic
Party) and the PT (Workers Party)-in. In the public sector reforms in Africa, decentralization
has various meanings. Generally it is understood as the process where power and
responsibilities are transferred from the central authority to lower levels in a territorial
hierarchy, Cook and Manor (1998); Mawhood (1993). In practice, it takes different meanings
to different people Bardhan (2002), Mawhood (1993). In Africa decentralization, during the
colonial period, it meant management of local populations by extending central
administration into the local arena Mamdani, (1996). After independence, it was
conceptualized as the transfer of responsibility for planning, management and resource
raising and allocation from the central government to its field ministries and agencies
,Cheema and Rondinelli cited in UNDP (1998) in this context, decentralization took the form
JIARM VOLUME 1 ISSUE 8 (SEPTEMBER 2013) ISSN : 2320 – 5083
178 www.jiarm.com
of administration from the central government to the local fields, delegation to semi
autonomous bodies such as parastatals and devolution of functions to non government
institutions, Cheema and Rondinelli, (1983). In the 1980s, there arose a shift towards market
mechanisms from public services leading to deregulation and privatization in addition to
deconcentration and devolution World Bank (1983); Mohan and Strokke, (2000).
According to studies done by Crook and Manor, (1998) District Assemblies were formed in
1989, which were initially successful in enhancing electoral participation and giving access
and representation groups, such as the uneducated, farmers, traders and artisans. This was
later refurbished through introduction of a District Assembles Common Fund that allocated
5% local revenue to the District Assemblies Owosu, (2004)
Other studies showed that fiscal decentralization has been hampered by inter-party political
relationships. There seems to be an understanding that sub-national governments’ autonomy
and capacity to run their affairs and genuinely represent their interest at the central level are
party in power at the centre, Aalen (2002); Assefa (2006). Fiscal decentralization has
accompanied the decentralization of responsibilities. Sub-counties may now retain about two
thirds of the revenue collected within their area. But overall resources remain meager, and
transfers from central government are low and increasingly tied to conditions, leaving little
room for local discretion. Additional, broader reforms are necessary to achieve effective
participation by villagers. Local elites exercise much influence in determine how funds
raised. Many local leaders are held back by illeracy, lack of knowledge of government
procedure and low awareness of theirs Steffenson, jesper, Tidemand, (2004); UNDP,(2000)
Locally, the fight against poverty, ignorance and disease has been a major goal of the
Government since independent dent. Kenya has pursed economic development through
central planning since independent in 1964. The centralization of authority and management
of resources has led to the inadequate distribution of resources across regions, resulting in a
growing inequality in services, infrastructure and development across the country Court and
Kinyanjui (1980); Mapesa and Kibua, (2006).
To overcome the distortion in the allocation of public expenditure a number of
decentralization programs were put into place during the 1960s and 1970s, but with much
success as these programs became politicized and the misallocation of resources persisted
9Cort and Kinyanjui (1980). The more substantive decentralization came in 1983 with the
adoption of the District Focus for Rural Development DFRD strategy GOK, (1983);
Makokha, (1985); Chitere and Ireri, (2004). It aimed at enhancing geographically equity
where funds were allocated to less development districts. This failed due to incompetence of
JIARM VOLUME 1 ISSUE 8 (SEPTEMBER 2013) ISSN : 2320 – 5083
179 www.jiarm.com
staff in participatory planning, absence of monitoring and evaluation poor design of projects
weak commitment of sector staffing multi-sectoral initiatives. Weak social administrative
structures below the districts were also cited GOK, (1999).
In September 2000, world nations adopted the Millennium Declaration. The results were
adopted and targeted actions to be achieved by 2015 MDGs Status Report for Kenya, (2005).
Chief among these goals are eradication of poverty and attainment of Universal Primary
Education. Kenya has equally elaborated a newly industrializing, middle income county
providing high quality of life for its citizens by the year 2030, through its Economic, Social
and Political Pillars GOK, (2008)
As part of this strategy, in 2003, the government of Kenya established the Constituency
Development Fund (CDF); a program that seeks to enhance community’s participation in the
fight against poverty at the grassroots level. Established under the CDF Act 2003, and
amended in 2007, CDF was to help in development by channeling financial resources to the
Constituency level for the implementation of community based development projects with
long term effects of improving the people social economic development projects with long
term effects of improving the people social and economic well being CDF Act (2003): GOK,
(2005). Another objective of the introduction of the CDF was to control and reduce
imbalances in regional development brought about partisan as had been experienced
previously in Kenya, Mapesa & Kibua, (2006)
The Fund is administered by an offer under the National Management Committee. It
comprises an annual budgetary allocation equivalent to 2.5% of the national revenue.
National Devolved Funds Report, (2007). The CDF Act also provides that 75% of this
amount shall be disbursed equally to all the 210 constituencies and the remaining 25% shall
be disbursed on the basis of population and the poverty index GOK, (2005)
The CDF has so far disbursed a total of KES 70,956,300,000 to the 210 constituencies since
it inception in 2003. Most of these projects are in the Education (55%), water (11%) and
health (6%) sectors nationally (The CDF Strategic Plan, 2011). Of this amount, Changamwe
Constituency has used a total of KES 226,603,836 (CDF Office, Changamwe) in projects in
various sectors, most of which has been spent in Education Projects. For Kenya to remain on
target for Millennium Development Goals (2015) and Vision 2030, it is therefore important
to study how the Constituency Development Fund projects are monitored and evaluated.
Uitto (2004) defines monitoring briefly as a continuous function that aims primarily to
provide3, management and stakeholders with early indicators of project performance of a
project and progress (or lack therefore) in achievement of the results. Mulwa (2008) and
JIARM VOLUME 1 ISSUE 8 (SEPTEMBER 2013) ISSN : 2320 – 5083
180 www.jiarm.com
DAC (2001) agree but add that it involves measuring, assessing recording and analyzing the
project information on a continuous basis and communication the same to those concerned.
Crawford and Bryce (2003) argue that monitoring is an ongoing process of data capture and
analysists for primarily project control with an internally driven emphasis on efficiency of
project. The authors define efficiency of project. The authors define efficiency in this context
as doing the right thing that is efficient conversion of inputs to outputs within budget and
schedule and wise use of human, financial and natural capital. This definition emphasizes the
fact that monitoring is geared mainly to project control.
Evaluations are systematic and independent. They are an assessment of an ongoing or
completed project including its design, implementation and results. Evaluation assess the
relevance, efficiency of implementation, effectiveness, impact and suitability of the project,
Uitto, (2003); OECD, (2002) and should be credible and objective, IFAD,(2004).
The essence of this study was therefore to look at the factors affecting effective monitoring
and evaluation of projects under the CDF.
1.1 Objectives of the study
1.1.1 General Objective
The purpose of this study was to examine the factors affecting Monitoring and Evaluation of
CDF Projects in Kenya with specific reference to projects within the Education Sector in
Changamwe Constituency.
1.1.2 Specific Objectives of the study
The objectives of this study will be:
i. To determine the influence of level of training of CDF committee members on
effective Monitoring and Evaluation of CDF Projects in Changamwe.
ii. To assess the influence of budgetary allocation on effective Monitoring and
Evaluation of CDF Projects in Changamwe Constituency.
iii. To establish the influence of stakeholder participation on effective monitoring and
evaluation of CDF projects in Changamwe Constituency.
iv. To determine the influence of politics on effective Monitoring and Evaluation of CDF
Projects in Changamwe Constituency.
1.2 Research Questions
The study will attempt to answer the following research questions:
i. What level of training of CDF committee members influence the effectiveness of
Monitoring and Evaluation of CDF projects in Changamwe Constituency?

JIARM VOLUME 1 ISSUE 8 (SEPTEMBER 2013) ISSN : 2320 – 5083
181 www.jiarm.com
ii. What level of budgetary allocation influence the effectiveness of Monitoring and
Evaluation in CDF Projects in Changamwe Constituency?
iii. How stakeholder involvements influence the effectiveness of Monitoring and
Evaluation in CDF Projects in Changamwe Constituency?
iv. How politics influence the effectiveness of Monitoring and Evaluation in CDF
projects in Changamwe Constituency.
1.3 Delimitation of the study
The study focused on all projects funded by CDF in the whole constituency. Since it was not
practical to study all of them, Changamwe constituency was housed to represent them.
Further due to cost considerations, a purposive sample of projects in the education sector
within Changamwe Constituency was be targeted for the study.
1.4 Limitation of the Study
(a) Quality of data
Due to suspicious that emanated from the Research project the researcher feared the accuracy
of data could be affected.
(b) Intrusiveness
The researcher was viewed as invasive especially when questions on funds management were
raised.
( c ) Lack of Current Literature
The major challenge of the research was the availability of current literature on the C.D.F
financial information at Changamwe Constituency.
(d) Lack of authority to access Government data
The issue on authorization to gain access to gain government data or conduct interviews with
any of the respondent was also a challenge.
(e) Weather Challenges
At the time of research the weather conditions were not favourable.
(e) Health challenges.
The researcher was affected by sickness which in return affected his research work.
1.5 Scope of the Study
The Researcher was conducted in Changamwe Constituency within Mombasa County. The
study involved Public Schools in Changamwe Constituency and the researcher concentrated
on factors affecting effective monitoring and evaluation of projects under the C.D.F. The
study was cross-sectional on public schools. The cross-sectional study is one which looks at
JIARM VOLUME 1 ISSUE 8 (SEPTEMBER 2013) ISSN : 2320 – 5083
182 www.jiarm.com
the various entities of a population at one point in time. Different schools were picked for the
study. The geographical area was Mombasa County.
1.6 Significance of the study
The findings of the study will be beneficial to the following:
CDF fund managers and staff.
The CDF fund managers will benefit from the results of this research by enabling them
incorporate tools and indicators for monitoring and evaluation. Besides they will learn best
process and methods that promote effective monitoring and evaluation.
Government Officers
The officers charged with monitoring and evaluation like those from the ministry of state for
planning National Development and vision 2030, will be determined to develop modify or
design tools that will determine efficiency, effectiveness, relevance and impact of evaluation.
Committees
Similarly Constituency Development fund committee together with other smaller Committee
will be equipped with strategic on how to monitor and evaluate project effectively.
Members of the Parliament
The Member of Parliament will equally benefit from research by providing insight on how to
manage the development funds under their care with integrity and fairness while having
conscious of the needs of their constituents.
All Stakeholders
All the stakeholders in the management and governance of the project will be sensitized on
their roles in the management of the fund. This will pre-empty any conflicts and
disagreements associated with the fund.
2. Literature review
2.1 Introduction
Projects are aimed at solving social problems and the beneficiaries are key stakeholders. This
review of literature looks at the need for monitoring and evaluation with respect to projects. It
largely dwells on factors influencing effective monitoring and evaluation process. It also
covers logical framework and theoretical approaches to monitoring and evaluation. Program
and Social Science theories which provide a basis for logic, process, social change and
impact of programs aimed at addressing the effectiveness and relevance of development
project are also covered. The review concludes with the conceptual framework.
JIARM VOLUME 1 ISSUE 8 (SEPTEMBER 2013) ISSN : 2320 – 5083
183 www.jiarm.com
2.2 Theoretical Framework for Monitoring and Evaluation in Projects
Chen, (1990) described the term theory as a frame of reference that helps humans understand
their world and how to function within it. The first major boom in evaluation occurred in the
United States in late 1960s and 70s under the Kennedy and Johnson Administrations, when
social programs were developed on a grand scale and heavily supported by federal funding
under the policies of the “War on Poverty” and the “Great Society” Rossi, Lipsey,
Freeman,(2004). New theories of evaluation practice, methods, and tools are being developed
and refined to address a much broader and diverse range of evaluation practice challenges.
The Evaluation Theory consists of Social Science Theory and Program Theory.
Social Science Theory plays several important roles in evaluation practice. Such theory and
prior research can be very informative for initial needs assessment and program design. A
careful examination of available literature, including primary studies, may turn up knowledge
about effective strategies for dealing with the problems of concern, lessons learned about
what does not work which may save program designers and evaluators time and resources,
Donaldson (2001);Lipsey,(1990)
Program Theory on the other hand guides an evaluation by identifying key program elements
and articulating how these elements are expected to relate to each other. Data collection plans
are then made within the framework in order to measure the extent and nature of each
element’s occurrence. Once collected, the data are analyzed within the framework. First, data
that have been collected by different methods or from different sources on the same program
element are triangulated, Denzin, (1970); Greene, Caraceli, and Graham, (1989); Trochim,
(1989); Yin, (1994). Stake (1967) presented a model that calls for describing the intended
antecedents (whatever needs to be before a program is operational) transactions (activities
and outputs), and outcomes of a program. The data on the program in operation are compared
to what was intended and to what the standards are for that kind of program.
Another early proponent theory, Weiss (1972) recommended using path diagrams to model
the sequences of steps between a programs’ intervention and the desired outcomes. This kind
of casual model helps the evaluator identify the variable to include in the evaluation, discover
where in the chain of events the sequence breaks down, and stay attuned to changes in
program implementation that may affect the pattern depicted in the model Program theory is
define in evaluation practice today as the construction of a plausible and sensible model of
how a program is supposed to work, Bickman, (1987) or a set of propositions regarding
what goes on in the black box during the transformation on input to output, that is, how a bad
situation in transformed into a better one through treatment inputs, Lipsey,(1993 ). It is also
JIARM VOLUME 1 ISSUE 8 (SEPTEMBER 2013) ISSN : 2320 – 5083
184 www.jiarm.com
looked at as the process through which program components are presumed to affect
outcomes.
Rossi (2004 describes program theory as consisting of the organizational plan which deals
with how to garner, configure, and deploy resources, and how to organize program activities
so that the intended service system is developed and maintained. The theory also deals with
the service utilization plan which looks at how the intended target population receives the
intended amount of the intended intervention through interaction with the programs service
delivery system. Finally, it looks at how the intended intervention for the specified target
population brings about the desired social benefits (impacts)
Rogers, as cited by Uitto (2000) identifies advantages of the theory based framework to
monitoring and evaluation to include being able to attribute projects outcomes to specific
projects or activities and identify unanticipated and undesired programme or project
consequences. Theory based evaluations enable the evaluator to tell why and how the
programme is working, Weiss, (2003): and Birkmayer and Weiss, (2000).
Monitoring and evaluation are intimately linked project management functions and as a result
there is a lot confusion in trying to make them work on projects Crawford and Bryce, (2003)
Monitoring and Evaluation are distinct but complementary passia, (2004). Casley and Kumar
(1986) as quoted by Crawford and Bryce (2003) disprove the use the acronym M&E
(Monitoring and evaluation) as it suggest that we are looking at a single function without
making a clear distinction between the two.
Monitoring ensures that implementation is moving according to plans and if not, the project
manager takes corrective action. Monitoring enhances project management decision making
during the implementation thereby increasing the chances of good project performance
Crawford and Bryce, (2003): and Gyorkos, (2003). It also facilitates transparency and
accountability of the resources to the stakeholders including donors, project beneficiaries and
the wider community in which the project is implemented. Monitoring tracks and documents
resources use throughout the implementation of the project, Passia, (2004): Uitto, (2004)
Evaluation assesses project effectiveness in achieving its goals and in determining the
relevance and sustainability of an ongoing project, McCoy, (2005). It compares the project
impact with what was set to be achieved in the project plan, Shapiro (2004). Evaluations are
mainly of two types depending on when they take place. These are formative and summative
evaluations. Formative Evaluation is concerned more with efficient use of resources to
produce outputs and focuses on strengths, weakness, and challenges of the project and
whether the continued project plan will be able to deliver the project objectives or it needs
JIARM VOLUME 1 ISSUE 8 (SEPTEMBER 2013) ISSN : 2320 – 5083
185 www.jiarm.com
redesigning, Passia, (2004). Formative evaluations are sometimes called interim or midterm
evaluations. Summative evaluations are carried out at the end of the project and aims at
determining how the project progressed, what went right and wrong and capture any lessons
learned Shapiro,(2004). Wellings and Macdowall, (2000) identify two types of summative
evaluation is geared towards guiding future projects by facilitating organizational learning by
documenting good practices and mistakes. Outcome evaluation is concerned with extent to
which the set objectives were achieved and how we can attribute the role of project to the
outcomes In order to carry out monitoring evaluation effectively, there are some critical
factors that must be taken into account. These include use of relevant skills, sound methods,
adequate resources and transparency, in order to be a quality Jones et al, (2009). The
resources here include skilled personnel and financial resources. Rogers (2008) suggests the
use of multi-stakeholders’ dialogs in data collection, hypothesis testing and in the
intervention, in order to allow greater participation and recognize the differences that may
arise. All these must be done within a supportive institutional framework while being
cognizant of political influence.
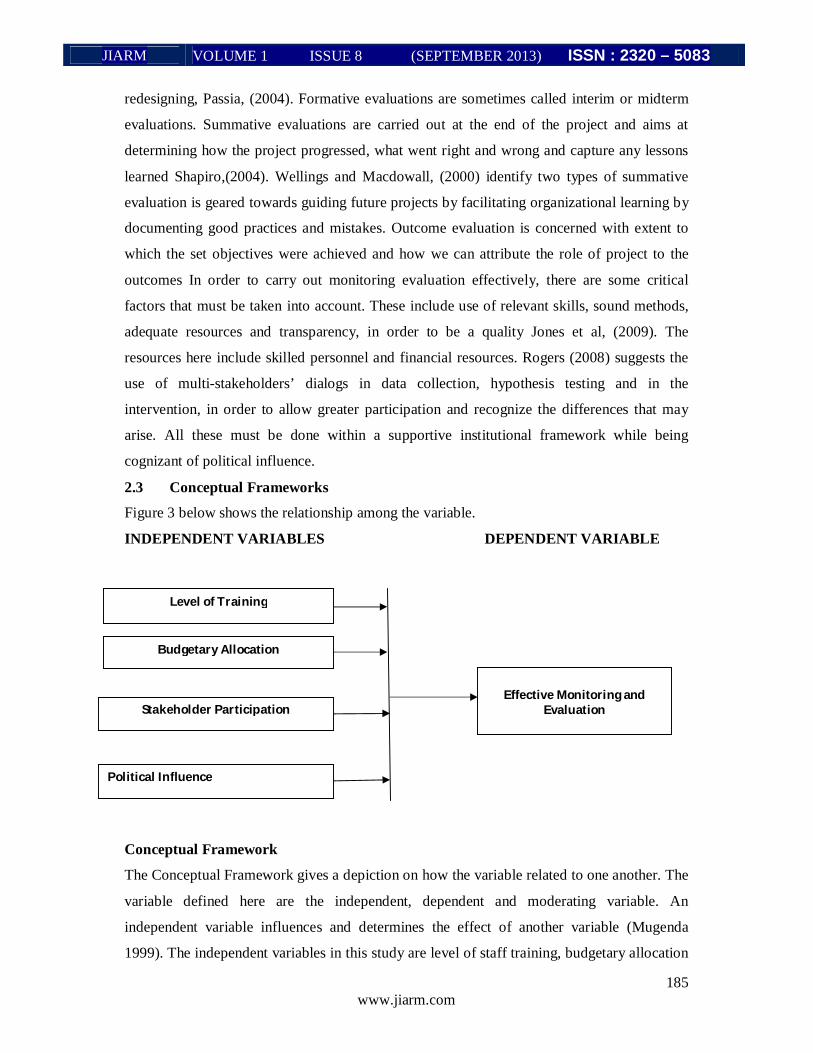
2.3 Conceptual Frameworks
Figure 3 below shows the relationship among the variable.
INDEPENDENT VARIABLES DEPENDENT VARIABLE
Conceptual Framework
The Conceptual Framework gives a depiction on how the variable related to one another. The
variable defined here are the independent, dependent and moderating variable. An
independent variable influences and determines the effect of another variable (Mugenda
1999). The independent variables in this study are level of staff training, budgetary allocation
Level of Training
Budgetary Allocation
Stakeholder Participation
Political Influence
Effective Monitoring and
Evaluation
JIARM VOLUME 1 ISSUE 8 (SEPTEMBER 2013) ISSN : 2320 – 5083
186 www.jiarm.com
and stakeholder participation. Dependent variable is that factor which is observed and
measured to determine the effect of the independent variable (Nyandemo). The dependent
variable is effective monitoring and evaluation of CDF projects. The moderator variable is
that which is measured, manipulated to discover whether or not it modifies the relationship
between the independent variable and the dependent. The political influence is identified as a
moderating variable.
Evaluations should be carried on with the relevant skills, sound methods, adequate resources
and transparency, in order to be quality, Jones et al, (2009). This implies the training of
personnel largely determines the effectiveness of monitoring and evaluation.
Another factor to consider is the budgetary allocation. A monitoring and evaluation budget
can be clearly delineated within the overall project budget to give the monitoring and
evaluation function the due recognition it plays in project management, Gyorkos, (2003): and
McCoy et al, (2005). Greater participation is equally necessary. Rogers (2008) suggests the
use of multi-stakeholders dialogues in data collection, hypothesis testing and in the intervention, in order to allow greater participation and recognize the differences that may arise.
Apart from a coherent framework, politics also plays a very huge role. As Robert Chambers
has put it; ‘the starting point would be to ask about the political economy of the evaluation:
who would gain/ who might lose/ and how? And, especially, how was it intended and
anticipated that the findings would make a difference?’ Chambers, (2009)
2.3.1 Training and Monitoring and Evaluation
The technical capacity of the organization in conducting evaluations, the value and
participation of its human resources in the policymaking process, and their motivation to
impact decisions, can be huge determinants of how the evaluation’s lessons are produced,
communicated and perceived, Vanessa and Gala, (2011).
Human resources on the project should be given clear job allocation and designation befitting
their expertise, if they are inadequate then training for the requisite skills should be arranged.
For projects with staff that are sent out in the field to carry out project activities on their own
there is need for constant and intensive on site support to the outfield staff, Ramesh,(2002)
:and Reijer et al, (.2002)
One if the larger aspects of developing employee’s skills and abilities is the actual
organizational focus on the employee to become better, either as a person or as a contributor
to the organization. The attention by the organization coupled with increased expectations
following the opportunity can lead to a self-fulfilling prophecy of enhanced output by the
employee, Pearce and Robinson, (2004).
JIARM VOLUME 1 ISSUE 8 (SEPTEMBER 2013) ISSN : 2320 – 5083
187 www.jiarm.com
Foresti, (2007) argues this means not just training, but a whole suite of learning approaches:
from secondments to research institutes and opportunities to work on impact evaluations
within the organization or elsewhere, to time spent by program staff in evaluation
departments and equally, time spent by evaluators in the field.
Evaluation must also be independent and relevant. Independence is achieved when it is
carried out by entities and persons free of the control of those responsible for the design and
implementation of the development intervention; OECD, (2002) and Gaarder and Briceno,
(2010). Research shows that it is vital to determine what methods are appropriate to the users’
needs the given context and issues of data, baseline and indicators Hulme, (2000).
Despite the fact that the Constituencies Development Fund disbursement is growing at higher
rate, the Fund commits 2% of its budget for capacity building into which Monitoring and
Evaluation of CDF Projects is included. What is demanded of the Board and by extension,
the community level organs together with which it operates, cannot be met by the current
capacity both in terms of human resources as well as available skills, CDF Board, Strategic
Plan, (2011).
2.3.2 Budgetary Allocation and Monitoring and Evaluation
The project budget should provide a clear and adequate provision for monitoring and
evaluation activities. A monitoring and evaluation budget can be clearly delineated within the
overall project budget to give the monitoring and evaluation function the due recognition it
plays in project management, Gyorkos, (2003): and McCoy, (2005). A monitoring and
evaluation budget should be about 5 to 10 percent of the total budget, Kelly and Magongo,
(2004): IFRC, (2001) and AIDS Alliance, (2006)
According to the Constituencies Development Act (2003), at the Constituency Level, a
maximum of 3% of each constituency’s annual allocation may be used for administration,
15% for an education bursary scheme, 2% for sports activities and25% for environmental
activities. Although CDF does not cover recurrent costs it allows 3% of the constituency’s
annual allocation to be used for recurrent expenses of vehicles, equipment and machinery
since they constitute development projects under the CDF Act.
It is important to note that only 2% may be allocated for Monitoring and Evaluation of
ongoing projects and capacity building activities while 5% is kept aside as an emergency
reserve to be made available for emergencies that may occur in the Constituency like drought
and famine. Changamwe constituency has allocated only 1.1% of its budget for capacity
building; far below the 2% guideline (CDF Office, Changamwe).
JIARM VOLUME 1 ISSUE 8 (SEPTEMBER 2013) ISSN : 2320 – 5083
188 www.jiarm.com
2.3.3 Stakeholder Participation and Monitoring Evaluation.
Engaging stakeholders in discussions about the what, how, and why, of program activities is
often empowering for them and additionally, promotes inclusions and facilities meaningful
participation by diverse stakeholder groups, Donaldson, (2003). Stakeholder participation
means empowering development beneficiaries in terms of resources and needs identification,
planning on the use of resources and the actual implementation of development initiatives,
Chambers, (1997); Chitere, (1994)
Best practice example demonstrates that a central factor facilitating update of evaluations is
stakeholder involvement. This involvement must be brought in at the early stages of the
Evaluation process, include the support of high –profile champions and attract political
agents interested in learning or using instruments to demonstrates effectiveness, Jones,
(2008); Proudlock (2009) also found that the whole process of impact evaluation and
particularly the analysis and interpretation of results can be greatly improved by the
participation of intended beneficiaries, who are after all the primary stakeholders in their own
development and the best judges of their own situation. However, stakeholders engagement
needs to be managed with care too much stakeholder’s involvement could lead to undue
influence on the evaluation, and too little could lead to evaluators dominating the process,
Patton, (2008).
Although the CDF allows the community to identify the projects close to their interests at the
Location Development Committee Levels, CDF Act,(2003), it’s difficult to tell their level of
competency in determining what is beneficial in the long run or how to integrate the projects
within neighbors’ locations or constituencies for maximum benefit, Mwangi, (2005).
Whether the community participates in the identification of projects depends on how the MP
shapes the boundaries of engagement. There are those who will be invited and those who will
not be invited in the identification of projects in CDF. The projects identified by those close
to the MP are said to be passed as having been identified by the community, Mungai, (2009).
2.3.4 Politics and Monitoring and Evaluation
Choice regarding the purpose and scope of impact evaluations are political and has important
implications for the selection of appropriate methodologies, the kinds of knowledge and
conclusions generated, and follow-up and use of these. It is crucial therefore, that adequate
time is factored in for the meaningful participation of all stakeholders in defining the purpose
and scope of impact evaluations, Patton, (2008); Sandison, (2006); Proudlock, (2009).
The key issue is whether the question being posed in the impact evaluation are relevant to
these needs. If they are not, then there is a high like hood the evaluation will not see
JIARM VOLUME 1 ISSUE 8 (SEPTEMBER 2013) ISSN : 2320 – 5083
189 www.jiarm.com
substantial take-up, Patton, (2008). The CDF is virtually under the control of politicians who
not only propose the projects in their constituencies but also present and vote for their
estimates in Parliament. It is odd and against the principle of separation of powers for
Members of Parliament to submit annual estimates to themselves for approval, take part in
the actual spending and then query the spending and then query the spending themselves
through Public Accounts Committee or Public Investments Committee, Ongoya & Lumallas,
(2005) To the extent that members of Parliament have a key role in the identification and
implementation of the projects, we do expect choices are influenced by political
maximization, Mwangi,(2005).
Mapesa and Kibua, (2006) Found that majority of constituents in some selected
constituencies in Kenya took CDF funds for the local politicians own development gesture
extended to the people. With this kind of mentality, it is expected that when such funds are
embezzled, the local people may not know, and if so may be unable to question or may not
know the channel through which to complain.
The CDF Act 2003 allows Members of Parliament (MPs) to be members of the Constituency
Development Fund Committees which must be constituted within 60 days of the new
parliament and consists of 15 members. This includes MP as chairperson, unless he/she opts
out where the CDFC elects, two councilors, one District Officer within the area, two religious
leaders, two representative of men, two representatives of women, one representative of
women, one representative of youth, a representative of Non-Government Organizations
within the area and a maximum of three other persons from the constituency such that the
number doesn’t exceed fifteen. An officer is seconded by the Board as an ex-officio member,
CDF Act (2003). The structure and management of CDF makes it venerable to political
manipulation.
2.4 Critique of the Literature Review relevant to the study
Devolution of resource to the decentralized unit of management is seen as one of the positive
move by the central authorities, there is a concern about the organizational and management
structure of the CDF since politicians (mps) control the project formulation and disbursement
of the finance. Besides the control the CDF and at time are the chairmen or patrons. Patron
title does not even exist in the Act, Onhoya and Lumallas, (2005). This essentially means
they are likely to influence what aspect of a project to monitor and what information to be
share with other stakeholders. Secondly, the logical framework approach of project
formulation and implementation is largely ignored. Some of the project in the education and
health sectors is idle due to lack of personnel KHRC, (2010). According to Mwangi (2005),
JIARM VOLUME 1 ISSUE 8 (SEPTEMBER 2013) ISSN : 2320 – 5083
190 www.jiarm.com
Projects are prioritized not because of the immediate socio-economic needs but for political
maximization, besides community mobilization is likely to suffer due to the feeding that the
CDF money is free which causes fiscal illusion. Thirdly, project cutting across locational and
constituency borders will be avoided since communities want to own their own project and as
such they wouldn’t prioritize or consider project whose benefits seep over to neighbouring
constituencies, claws or tribes.
Fourthly, the institutional framework is weak and therefore they cannot support the effective
monitoring and evaluation. Finally, the financial resource being devolved through CDF is
not enough to address the public project needed adequately.
2.5 Project Monitoring and Evaluation Process and Approaches
Monitoring and Evaluation should be integral components of the management cycle
including project planning and design, Passia,(2004) Gyorkos, (2003) notes that project
planners should include a clearly delineated monitoring and evaluation plan as an integral
part of the overall project plan that include monitoring and evaluation activities , persons to
carry out the activities, frequency of activities , sufficient budget for activities and
specification of the use of monitoring and evaluation findings.
Evaluation is the tool for proving knowledge for continued implementation. Ex-post
evaluation may be used for impact assessment, Michelson, (1995).
Jody and Ray (2004) identify the complementary roles of the two functions. Information from
monitoring feeds into evaluation in order understand and capture any lessons in the middle
or at the end of the implementation with regard to what went right or wrong fro learning
purposes. This could lead to redesigning the project.
2.6 Summary of the Literature Review
This section has differentiated monitoring from evaluation in projects. Although monitoring
is continuous; evaluation is periodic and aims at addressing relevance, effectiveness and
impact of projects,. It has also looked at training, budgetary allocation, stakeholder
participation and political influence as factor that influence monitoring and evaluation of
projects. The Evaluation Theory consisting of Program and Social Science sub-theories and
their interrelationships was described. The Logical Framework Approach to monitoring and
evaluation was equally discussed. The Conceptual Framework diagram was then drawn and
the factor explained.
2.7 Research Gaps
There is therefore concern about the organizational and management structure of the CDF
since the politicians (MPs) control the project formulation and disbursement of the finances.
JIARM VOLUME 1 ISSUE 8 (SEPTEMBER 2013) ISSN : 2320 – 5083
191 www.jiarm.com
Besides they control the CDFC and times are chairmen or patrons. The latter title does not
even exist in the Act, Ongoya and Lumalla, (2005). This essentially means they are likely to
influence exist in the Act, Ongoya and Lumallas, (2005). This essentially means they are
likely to influence what aspects of a project to monitor and what information to be shared
with other stakeholders.
Secondly, the Logical Framework Approach of project formulation and implementation is
largely ignored. Some of the projects in the education and health sectors idle due to lack of
personnel, KHRC, (2010). Projects are prioritized not because of the immediate socio-
economic needs but for political maximization, Mwangi, (2005). Besides community
mobilization is likely to suffer due to the feeling that the CDF money is free. This causes
‘fiscal illusion’, Mwangi, (2005).Finally, projects cutting across locational or constituency
borders will be avoided since communities want to ‘own’ their own projects and as such they
wouldn’t prioritize or consider projects whose benefits seep over to neighbouring
constituencies, clans or tribes, Mwangi,(2005).
3. Research methodology
3.1 Introduction
This section presents the research design and the methodology used in this study. It also
highlight the research design, target population, sampling technique and sample size, the
methods of data collection, the instruments for data collection and procedures, pre-costing of
instruments quality control which includes validity, reliability, data analysis and presentation.
3.2 Research Design
This study used descriptive survey research design to ascertain and make assertions on how
level of training of personnel, budgetary allocation, stakeholder participation and political
influence affect effectiveness of Monitoring and Evaluation of CDF projects. Descriptive
research studies are those studies which are concerned with describing the characteristics of a
particular individual or of a group and ascertain whether variables are associated, Kothari,
(2004). Survey research sought to obtain information that describes existing phenomena by
asking individuals about their perceptions, attitude, behavior or values, Mugenda and
Mugenda ,(1999).
The descriptive survey method was used by the researcher as the appropriate method for the
research at hand because it is the most appropriate in collecting data about the characteristics
of a large population in terms of being cost effective and within the constraints of time
available. Moreover, the questionnaire was employed as the main tool for data collection,
JIARM VOLUME 1 ISSUE 8 (SEPTEMBER 2013) ISSN : 2320 – 5083
192 www.jiarm.com
Harrison and Clock, (2004), and Kelly et al. (2002). It also produced data based on real world
observation which makes them data empirical. Descriptive data are typically collected
through a questionnaire survey, interview or by observation, Mugenda and Mugenda, (1999).
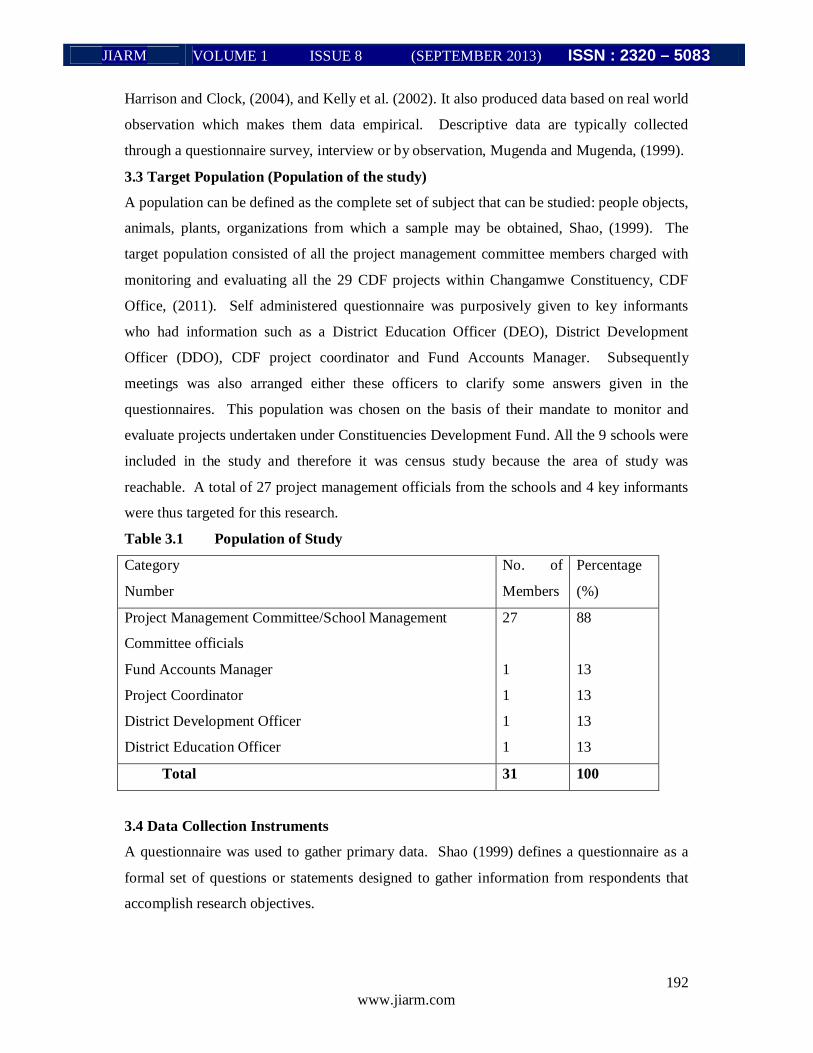
3.3 Target Population (Population of the study)
A population can be defined as the complete set of subject that can be studied: people objects,
animals, plants, organizations from which a sample may be obtained, Shao, (1999). The
target population consisted of all the project management committee members charged with
monitoring and evaluating all the 29 CDF projects within Changamwe Constituency, CDF
Office, (2011). Self administered questionnaire was purposively given to key informants
who had information such as a District Education Officer (DEO), District Development
Officer (DDO), CDF project coordinator and Fund Accounts Manager. Subsequently
meetings was also arranged either these officers to clarify some answers given in the
questionnaires. This population was chosen on the basis of their mandate to monitor and
evaluate projects undertaken under Constituencies Development Fund. All the 9 schools were
included in the study and therefore it was census study because the area of study was
reachable. A total of 27 project management officials from the schools and 4 key informants
were thus targeted for this research.
Table 3.1 Population of Study
Category
Number
No. of
Members
Percentage
(%)
Project Management Committee/School Management
Committee officials
Fund Accounts Manager
Project Coordinator
District Development Officer
District Education Officer
27
1
1
1
1
88
13
13
13
13
Total 31 100
3.4 Data Collection Instruments
A questionnaire was used to gather primary data. Shao (1999) defines a questionnaire as a
formal set of questions or statements designed to gather information from respondents that
accomplish research objectives.

JIARM VOLUME 1 ISSUE 8 (SEPTEMBER 2013) ISSN : 2320 – 5083
193 www.jiarm.com
A series of structure and unstructured questions was used. The self administered
questionnaires was dropped and later picked from the respondents through the secretaries of
the committees who were the school head teachers. The key informant’s questionnaires were
delivered personally. In order to improve response rates, the researcher maintained telephone
contacts with the head teachers to follow up on data collection.
3.4.1 Validity of Research Instruments
Validity indicates the degree to which an instrument measures what it is supposed to measure
while reliability of an instrument is when it gives consistent results, Kothari, (2004). Internal
validity was achieved by ensuring questions counterchecked one another. The answers in
some questions will be to verify or clarify earlier given answers. The questions were phrased
logically and sequentially in simple language.
3.4.2 Reliability of Research Instruments
Reliability refers to the degree to which a research instrument yields consistent results or data
after repeated trials, Mugenda and Mugenda, (1999). The questionnaire was pilot-tested to
some selected subjects with the outcome being used to improve it by ensuring the data
obtained was largely sufficient to the subjects.
3.5 Data Collection procedures
The researcher used open – ended and structured questionnaire to collect primary data. A
“pick and drop” method was used to distribute and collect the questionnaires which were self
administered by the respondent. This self administration was necessary to give the
respondents humble time to respond to the issue raised. The purpose of these type of
questions was to capture the undertones from the research.
3.6 Pilot test
Depending on the instrument being used for the purpose of determining the effectiveness and
validity of the instruments, the researcher conducted a participating pre-testing. After
respondents were asked to fill about five questionnaires the errors that were noted were
corrected.
3.7 Data Analysis and presentation
The data was edited to eliminate mistakes and ensure consistency. The data was then cleaned
and coded using Statistical Packages for Social Sciences (SPSS) and Ms Excel software and
classified into meaningful categories for analysis. This was to assess whether any
associations between the variables exist. The data analysis was included both quantitative
and qualitative methods. The data was then tabulated to capture salient details of the
questionnaire. Numerical summaries were then drawn using tables, frequencies, percentages,
JIARM VOLUME 1 ISSUE 8 (SEPTEMBER 2013) ISSN : 2320 – 5083
194 www.jiarm.com
mean averages and standard deviation as appropriate. Descriptive analysis of the data
collected was mainly in narrative form but greatly making use of the values.
4. Data Presentation, Analysis and Interpretation
4.1 Introduction
This section presents the findings of the study and analysis from data collected from 18
primary school management committee and 9 secondary school project management
committee members purposively selected due to their role in monitoring and evaluating CDF
projects. The response rate and the demographic characteristics and the respondents are
presented. The operational definition of variables in section three guided the formulation of
the questionnaire items which subsequently addressed the study objectives. Five major
themes addressing the factors affecting effective monitoring and evaluation of projects were
addressed by the study. These were level of training of committee members, institutional
framework, the budgetary allocation, stakeholder participation and political influence. The
analysis and discussion in this section focuses on these themes. After validation, the
questionnaires were used for gathering data. Simple descriptive statistics such as frequencies,
percentages, mean averages and standard deviations were used where appropriate for data
analysis. The findings were presented in tables.
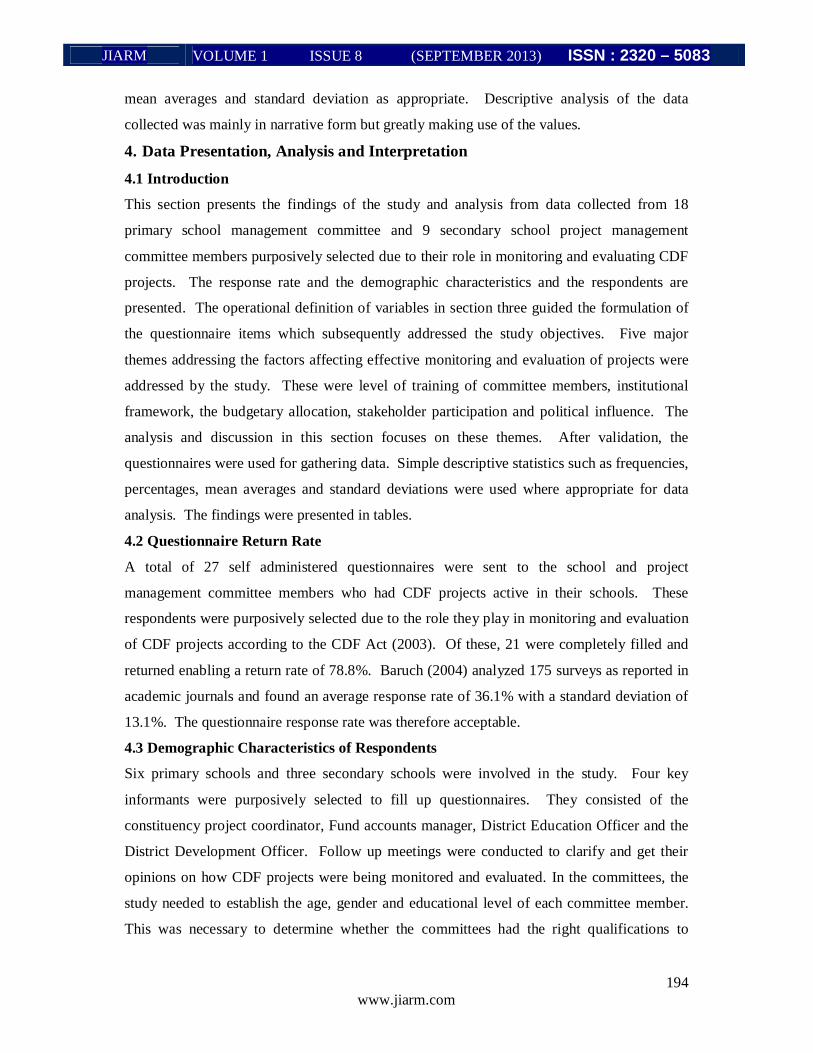
4.2 Questionnaire Return Rate
A total of 27 self administered questionnaires were sent to the school and project
management committee members who had CDF projects active in their schools. These
respondents were purposively selected due to the role they play in monitoring and evaluation
of CDF projects according to the CDF Act (2003). Of these, 21 were completely filled and
returned enabling a return rate of 78.8%. Baruch (2004) analyzed 175 surveys as reported in
academic journals and found an average response rate of 36.1% with a standard deviation of
13.1%. The questionnaire response rate was therefore acceptable.
4.3 Demographic Characteristics of Respondents
Six primary schools and three secondary schools were involved in the study. Four key
informants were purposively selected to fill up questionnaires. They consisted of the
constituency project coordinator, Fund accounts manager, District Education Officer and the
District Development Officer. Follow up meetings were conducted to clarify and get their
opinions on how CDF projects were being monitored and evaluated. In the committees, the
study needed to establish the age, gender and educational level of each committee member.
This was necessary to determine whether the committees had the right qualifications to
JIARM VOLUME 1 ISSUE 8 (SEPTEMBER 2013) ISSN : 2320 – 5083
195 www.jiarm.com
benefit from any training in monitoring and evaluation or participate optimally in projects
during implementation. The gender characteristics would determine whether both genders
would be represented equitably in the projects. The other analyses were done according to
the themes based on the objectives of the study.
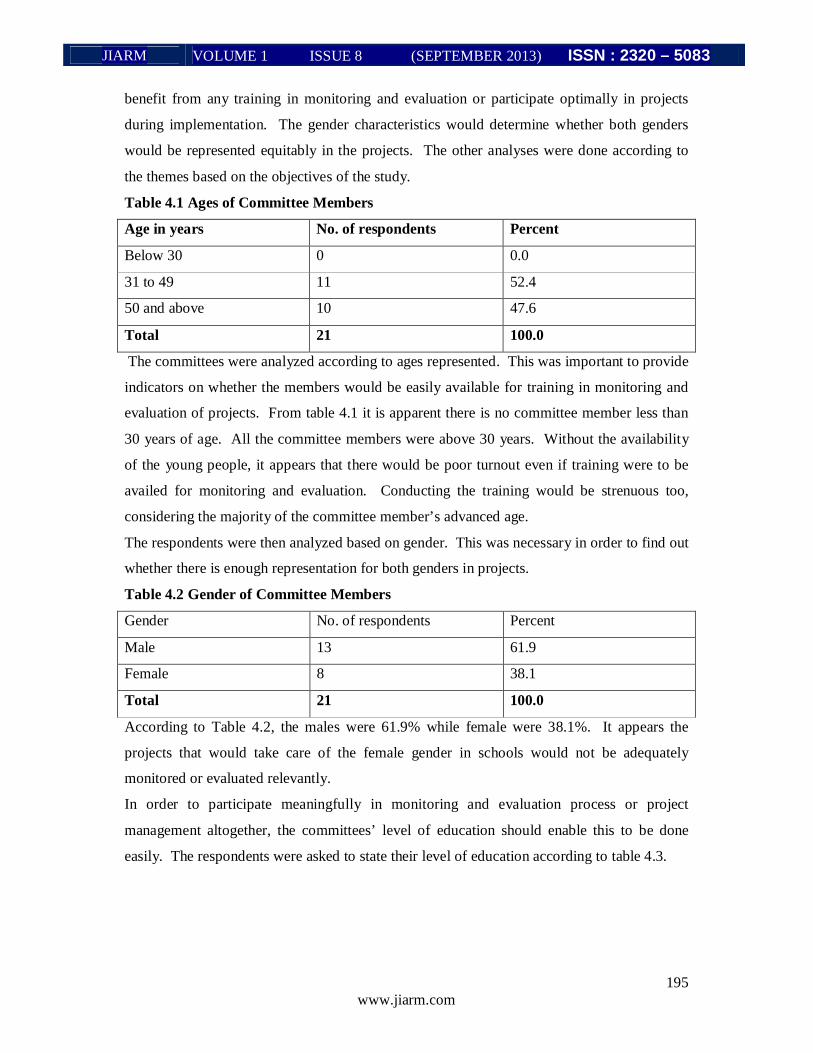
Table 4.1 Ages of Committee Members
Age in years No. of respondents Percent
Below 30 0 0.0
31 to 49 11 52.4
50 and above 10 47.6
Total 21 100.0
The committees were analyzed according to ages represented. This was important to provide
indicators on whether the members would be easily available for training in monitoring and
evaluation of projects. From table 4.1 it is apparent there is no committee member less than
30 years of age. All the committee members were above 30 years. Without the availability
of the young people, it appears that there would be poor turnout even if training were to be
availed for monitoring and evaluation. Conducting the training would be strenuous too,
considering the majority of the committee member’s advanced age.
The respondents were then analyzed based on gender. This was necessary in order to find out
whether there is enough representation for both genders in projects.
Table 4.2 Gender of Committee Members
Gender No. of respondents Percent
Male 13 61.9
Female 8 38.1
Total 21 100.0
According to Table 4.2, the males were 61.9% while female were 38.1%. It appears the
projects that would take care of the female gender in schools would not be adequately
monitored or evaluated relevantly.
In order to participate meaningfully in monitoring and evaluation process or project
management altogether, the committees’ level of education should enable this to be done
easily. The respondents were asked to state their level of education according to table 4.3.
JIARM VOLUME 1 ISSUE 8 (SEPTEMBER 2013) ISSN : 2320 – 5083
196 www.jiarm.com
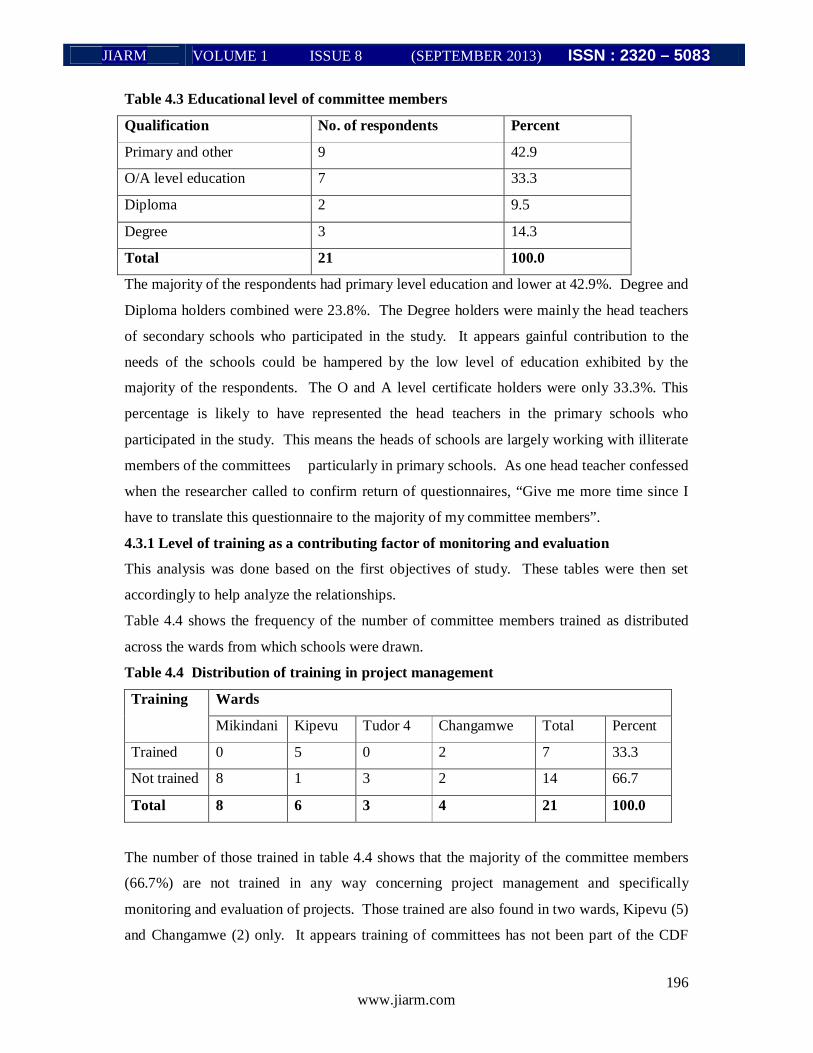
Table 4.3 Educational level of committee members
Qualification No. of respondents Percent
Primary and other 9 42.9
O/A level education 7 33.3
Diploma 2 9.5
Degree 3 14.3
Total 21 100.0
The majority of the respondents had primary level education and lower at 42.9%. Degree and
Diploma holders combined were 23.8%. The Degree holders were mainly the head teachers
of secondary schools who participated in the study. It appears gainful contribution to the
needs of the schools could be hampered by the low level of education exhibited by the
majority of the respondents. The O and A level certificate holders were only 33.3%. This
percentage is likely to have represented the head teachers in the primary schools who
participated in the study. This means the heads of schools are largely working with illiterate
members of the committees particularly in primary schools. As one head teacher confessed
when the researcher called to confirm return of questionnaires, “Give me more time since I
have to translate this questionnaire to the majority of my committee members”.
4.3.1 Level of training as a contributing factor of monitoring and evaluation
This analysis was done based on the first objectives of study. These tables were then set
accordingly to help analyze the relationships.
Table 4.4 shows the frequency of the number of committee members trained as distributed
across the wards from which schools were drawn.
Table 4.4 Distribution of training in project management
Training Wards
Mikindani Kipevu Tudor 4 Changamwe Total Percent
Trained 0 5 0 2 7 33.3
Not trained 8 1 3 2 14 66.7
Total 8 6 3 4 21 100.0
The number of those trained in table 4.4 shows that the majority of the committee members
(66.7%) are not trained in any way concerning project management and specifically
monitoring and evaluation of projects. Those trained are also found in two wards, Kipevu (5)
and Changamwe (2) only. It appears training of committees has not been part of the CDF
JIARM VOLUME 1 ISSUE 8 (SEPTEMBER 2013) ISSN : 2320 – 5083
197 www.jiarm.com
program and if so, it is yet to reach project localities. Mikindani has the largest number of
members (8) but no training has taken place according to the results. According to the CDF
Board, the main problem with capacity building is high turnover of the CDF committee
members, CDF strategic plan, (2011). Training falls under capacity building. Those trained
were also asked questions on use of baseline survey, logical framework analysis and
monitoring and evaluation planning. All the respondents did not carry out these.
In Tudor 4, 100% of the respondents have not received any training yet they are in charge of
projects; some of which involve millions of shillings. The study sought find out the level of
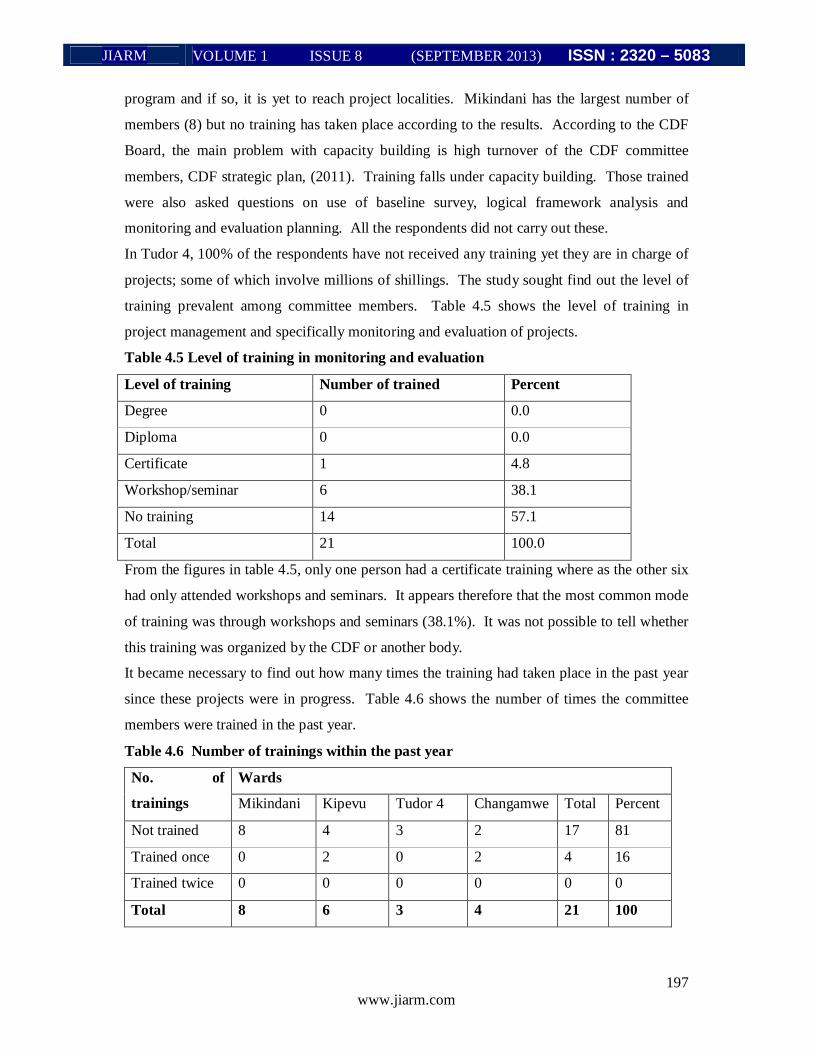
training prevalent among committee members. Table 4.5 shows the level of training in
project management and specifically monitoring and evaluation of projects.
Table 4.5 Level of training in monitoring and evaluation
Level of training Number of trained Percent
Degree 0 0.0
Diploma 0 0.0
Certificate 1 4.8
Workshop/seminar 6 38.1
No training 14 57.1
Total 21 100.0
From the figures in table 4.5, only one person had a certificate training where as the other six
had only attended workshops and seminars. It appears therefore that the most common mode
of training was through workshops and seminars (38.1%). It was not possible to tell whether
this training was organized by the CDF or another body.
It became necessary to find out how many times the training had taken place in the past year
since these projects were in progress. Table 4.6 shows the number of times the committee
members were trained in the past year.
Table 4.6 Number of trainings within the past year
No. of
trainings
Wards
Mikindani Kipevu Tudor 4 Changamwe Total Percent
Not trained 8 4 3 2 17 81
Trained once 0 2 0 2 4 16
Trained twice 0 0 0 0 0 0
Total 8 6 3 4 21 100
JIARM VOLUME 1 ISSUE 8 (SEPTEMBER 2013) ISSN : 2320 – 5083
198 www.jiarm.com
From table 4.6 it appears only 16% of the respondents had been trained in the past one year.
Besides, they had only been trained once in a calendar year. Considering that projects
operate in conceptualization, feasibility, implementation and evaluation cycles, it is not
possible to tell which of the cycles was targeted for training. It appears therefore, that all
those who got the training may have not trained in monitoring and evaluation wholly. None
of the respondents had been trained twice.
When data from the key informants was examined, only one had training in monitoring
valuation. The key informant decried the inability to carry out monitoring tasks due to lack
expertise in the field of monitoring and evaluation. His role was reduced to a supervisory
one; simply showing up to ensure some activity is on the ground’. One of the key informants
had this on training, “that is the job of ministry of planning and vision 2030 and the relevant
line ministries.”
It appears from the line ministry that the monitoring and evaluation of CDF projects has left
to the relevant monitoring and evaluation government units under the ministry of planning
vision 2030 and thus the subsequent training of committees are not taken care of. There is no
clear picture on how these committees, the line ministry and the ministry for national
planning and vision 2030 engage.
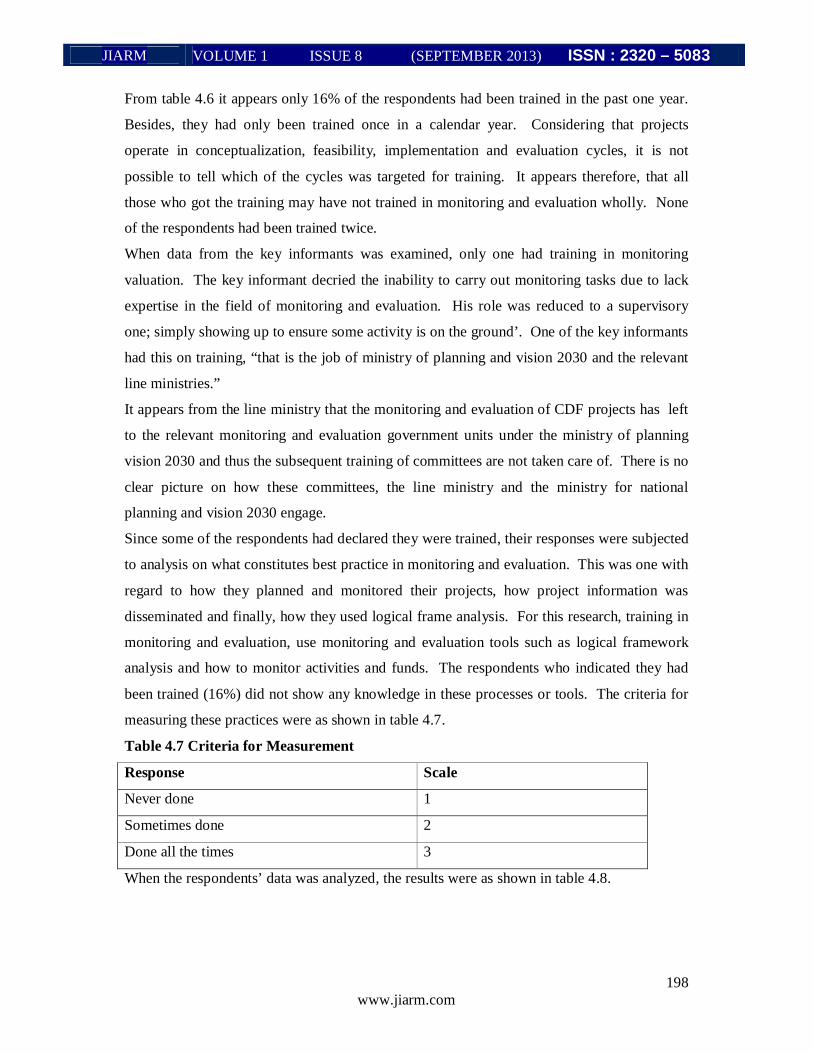
Since some of the respondents had declared they were trained, their responses were subjected
to analysis on what constitutes best practice in monitoring and evaluation. This was one with
regard to how they planned and monitored their projects, how project information was
disseminated and finally, how they used logical frame analysis. For this research, training in
monitoring and evaluation, use monitoring and evaluation tools such as logical framework
analysis and how to monitor activities and funds. The respondents who indicated they had
been trained (16%) did not show any knowledge in these processes or tools. The criteria for
measuring these practices were as shown in table 4.7.
Table 4.7 Criteria for Measurement
Response Scale
Never done 1
Sometimes done 2
Done all the times 3
When the respondents’ data was analyzed, the results were as shown in table 4.8.
JIARM VOLUME 1 ISSUE 8 (SEPTEMBER 2013) ISSN : 2320 – 5083
199 www.jiarm.com
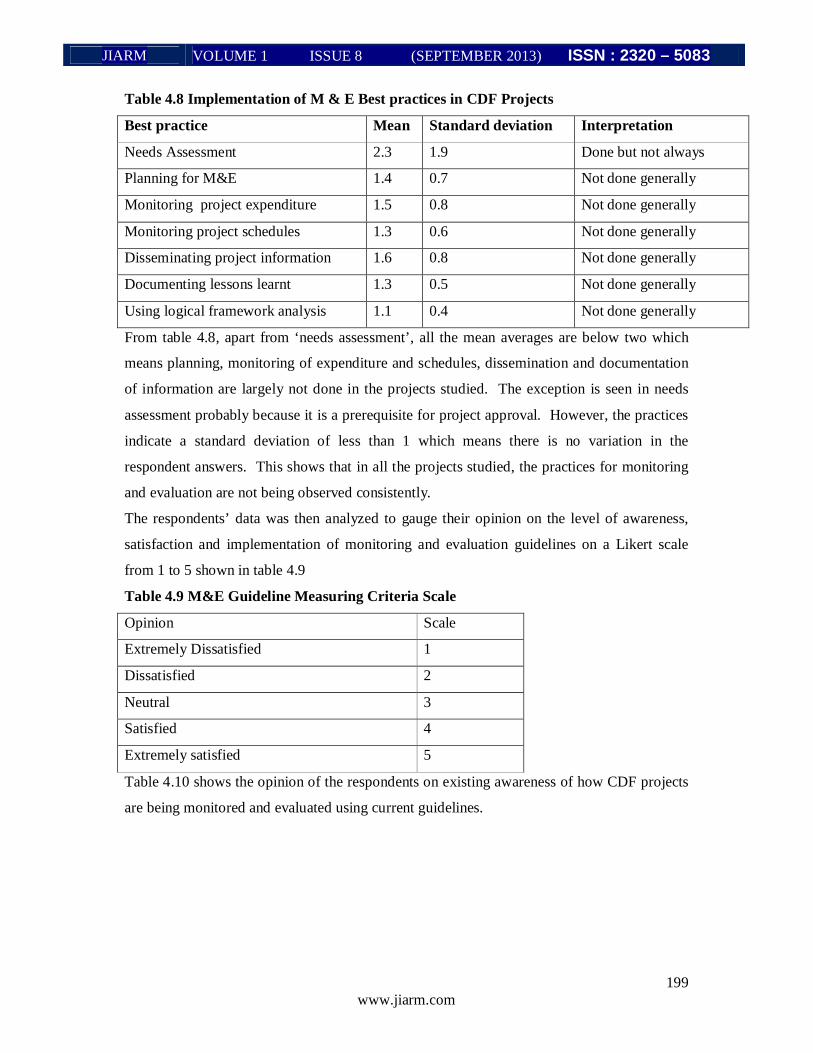
Table 4.8 Implementation of M & E Best practices in CDF Projects
Best practice Mean Standard deviation Interpretation
Needs Assessment 2.3 1.9 Done but not always
Planning for M&E 1.4 0.7 Not done generally
Monitoring project expenditure 1.5 0.8 Not done generally
Monitoring project schedules 1.3 0.6 Not done generally
Disseminating project information 1.6 0.8 Not done generally
Documenting lessons learnt 1.3 0.5 Not done generally
Using logical framework analysis 1.1 0.4 Not done generally
From table 4.8, apart from ‘needs assessment’, all the mean averages are below two which
means planning, monitoring of expenditure and schedules, dissemination and documentation
of information are largely not done in the projects studied. The exception is seen in needs
assessment probably because it is a prerequisite for project approval. However, the practices
indicate a standard deviation of less than 1 which means there is no variation in the
respondent answers. This shows that in all the projects studied, the practices for monitoring
and evaluation are not being observed consistently.
The respondents’ data was then analyzed to gauge their opinion on the level of awareness,
satisfaction and implementation of monitoring and evaluation guidelines on a Likert scale
from 1 to 5 shown in table 4.9
Table 4.9 M&E Guideline Measuring Criteria Scale
Opinion Scale
Extremely Dissatisfied 1
Dissatisfied 2
Neutral 3
Satisfied 4
Extremely satisfied 5
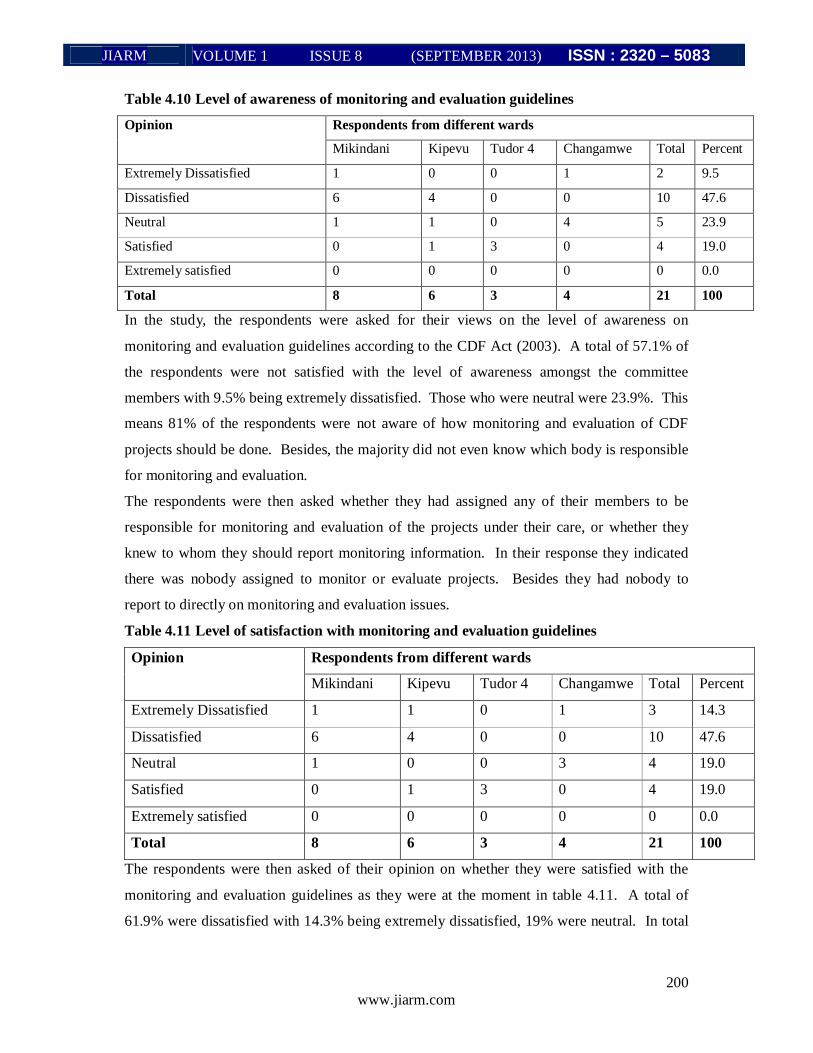
Table 4.10 shows the opinion of the respondents on existing awareness of how CDF projects
are being monitored and evaluated using current guidelines.
JIARM VOLUME 1 ISSUE 8 (SEPTEMBER 2013) ISSN : 2320 – 5083
200 www.jiarm.com
Table 4.10 Level of awareness of monitoring and evaluation guidelines
Opinion Respondents from different wards
Mikindani Kipevu Tudor 4 Changamwe Total Percent
Extremely Dissatisfied 1 0 0 1 2 9.5
Dissatisfied 6 4 0 0 10 47.6
Neutral 1 1 0 4 5 23.9
Satisfied 0 1 3 0 4 19.0
Extremely satisfied 0 0 0 0 0 0.0
Total 8 6 3 4 21 100
In the study, the respondents were asked for their views on the level of awareness on
monitoring and evaluation guidelines according to the CDF Act (2003). A total of 57.1% of
the respondents were not satisfied with the level of awareness amongst the committee
members with 9.5% being extremely dissatisfied. Those who were neutral were 23.9%. This
means 81% of the respondents were not aware of how monitoring and evaluation of CDF
projects should be done. Besides, the majority did not even know which body is responsible
for monitoring and evaluation.
The respondents were then asked whether they had assigned any of their members to be
responsible for monitoring and evaluation of the projects under their care, or whether they
knew to whom they should report monitoring information. In their response they indicated
there was nobody assigned to monitor or evaluate projects. Besides they had nobody to
report to directly on monitoring and evaluation issues.
Table 4.11 Level of satisfaction with monitoring and evaluation guidelines
Opinion Respondents from different wards
Mikindani Kipevu Tudor 4 Changamwe Total Percent
Extremely Dissatisfied 1 1 0 1 3 14.3
Dissatisfied 6 4 0 0 10 47.6
Neutral 1 0 0 3 4 19.0
Satisfied 0 1 3 0 4 19.0
Extremely satisfied 0 0 0 0 0 0.0
Total 8 6 3 4 21 100
The respondents were then asked of their opinion on whether they were satisfied with the
monitoring and evaluation guidelines as they were at the moment in table 4.11. A total of
61.9% were dissatisfied with 14.3% being extremely dissatisfied, 19% were neutral. In total
JIARM VOLUME 1 ISSUE 8 (SEPTEMBER 2013) ISSN : 2320 – 5083
201 www.jiarm.com
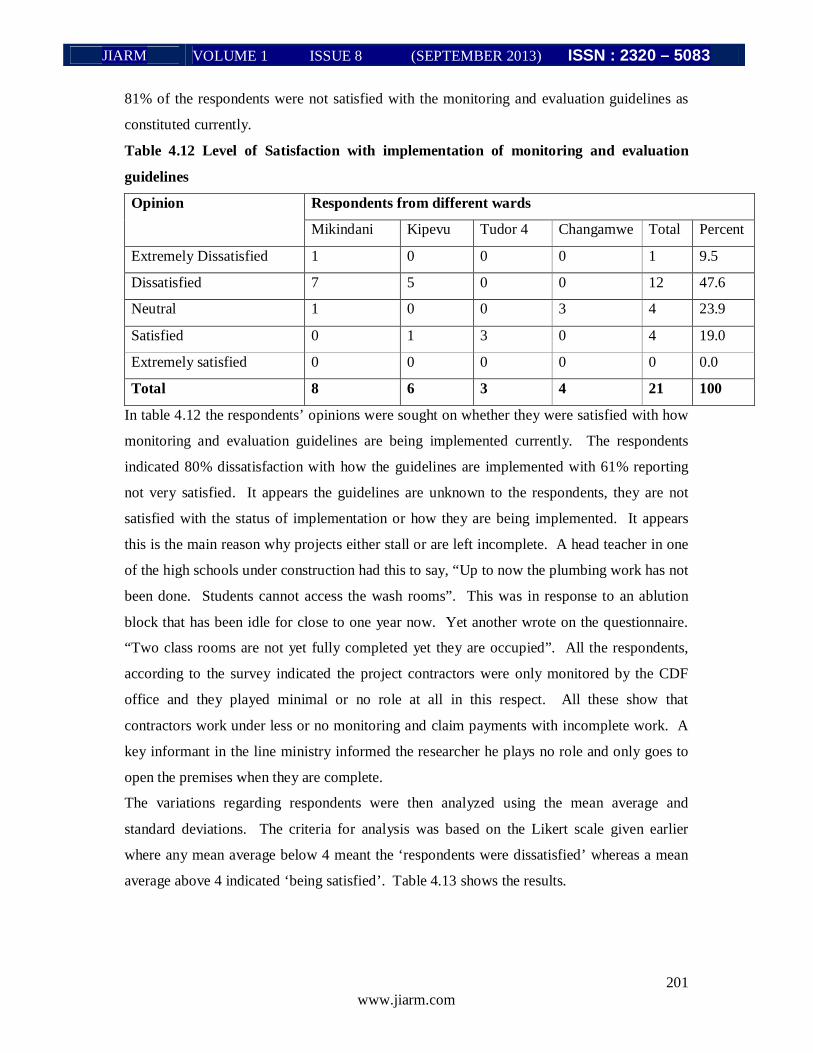
81% of the respondents were not satisfied with the monitoring and evaluation guidelines as
constituted currently.
Table 4.12 Level of Satisfaction with implementation of monitoring and evaluation
guidelines
Opinion Respondents from different wards
Mikindani Kipevu Tudor 4 Changamwe Total Percent
Extremely Dissatisfied 1 0 0 0 1 9.5
Dissatisfied 7 5 0 0 12 47.6
Neutral 1 0 0 3 4 23.9
Satisfied 0 1 3 0 4 19.0
Extremely satisfied 0 0 0 0 0 0.0
Total 8 6 3 4 21 100
In table 4.12 the respondents’ opinions were sought on whether they were satisfied with how
monitoring and evaluation guidelines are being implemented currently. The respondents
indicated 80% dissatisfaction with how the guidelines are implemented with 61% reporting
not very satisfied. It appears the guidelines are unknown to the respondents, they are not
satisfied with the status of implementation or how they are being implemented. It appears
this is the main reason why projects either stall or are left incomplete. A head teacher in one
of the high schools under construction had this to say, “Up to now the plumbing work has not
been done. Students cannot access the wash rooms”. This was in response to an ablution
block that has been idle for close to one year now. Yet another wrote on the questionnaire.
“Two class rooms are not yet fully completed yet they are occupied”. All the respondents,
according to the survey indicated the project contractors were only monitored by the CDF
office and they played minimal or no role at all in this respect. All these show that
contractors work under less or no monitoring and claim payments with incomplete work. A
key informant in the line ministry informed the researcher he plays no role and only goes to
open the premises when they are complete.
The variations regarding respondents were then analyzed using the mean average and
standard deviations. The criteria for analysis was based on the Likert scale given earlier
where any mean average below 4 meant the ‘respondents were dissatisfied’ whereas a mean
average above 4 indicated ‘being satisfied’. Table 4.13 shows the results.
JIARM VOLUME 1 ISSUE 8 (SEPTEMBER 2013) ISSN : 2320 – 5083
202 www.jiarm.com
Table 4.13 respondent reaction to monitoring and evaluation guidelines
Opinion Item Mean Standard
Deviation
Interpretation
Awareness of guidelines
Satisfaction with
guidelines
Implementation of
guidelines
2.57
2.43
2.43
0.98
0.98
0.87
Majority are consistently not aware
Majority are consistently dissatisfied.
Majority not happy with implementation.
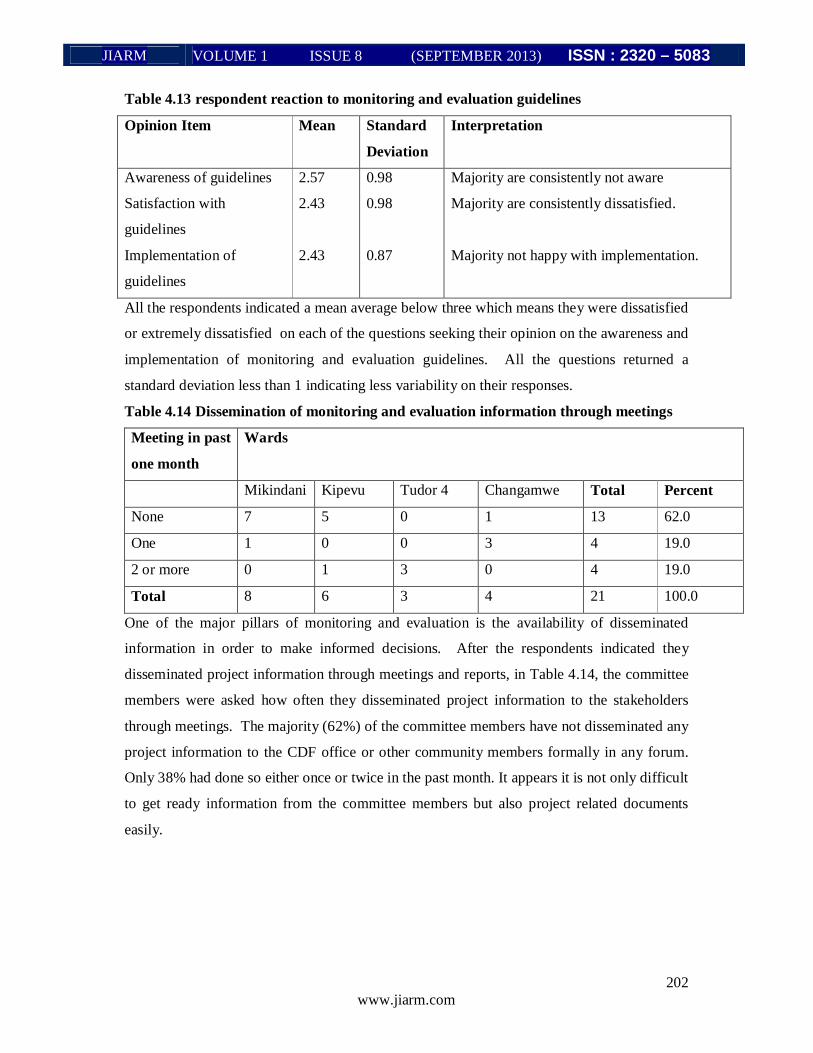
All the respondents indicated a mean average below three which means they were dissatisfied
or extremely dissatisfied on each of the questions seeking their opinion on the awareness and
implementation of monitoring and evaluation guidelines. All the questions returned a
standard deviation less than 1 indicating less variability on their responses.
Table 4.14 Dissemination of monitoring and evaluation information through meetings
Meeting in past
one month
Wards
Mikindani Kipevu Tudor 4 Changamwe Total Percent
None 7 5 0 1 13 62.0
One 1 0 0 3 4 19.0
2 or more 0 1 3 0 4 19.0
Total 8 6 3 4 21 100.0
One of the major pillars of monitoring and evaluation is the availability of disseminated
information in order to make informed decisions. After the respondents indicated they
disseminated project information through meetings and reports, in Table 4.14, the committee
members were asked how often they disseminated project information to the stakeholders
through meetings. The majority (62%) of the committee members have not disseminated any
project information to the CDF office or other community members formally in any forum.
Only 38% had done so either once or twice in the past month. It appears it is not only difficult
to get ready information from the committee members but also project related documents
easily.
JIARM VOLUME 1 ISSUE 8 (SEPTEMBER 2013) ISSN : 2320 – 5083
203 www.jiarm.com
Table 4.15 Dissemination of monitoring and evaluation information through reports
Meeting in past
one month
Wards
Mikindani Kipevu Tudor 4 Changamwe Total Percent
None 7 5 0 2 14 66.7
One 1 1 0 1 3 14.3
2 or more 0 0 3 1 4 19.0
Total 8 6 3 4 21 100.0
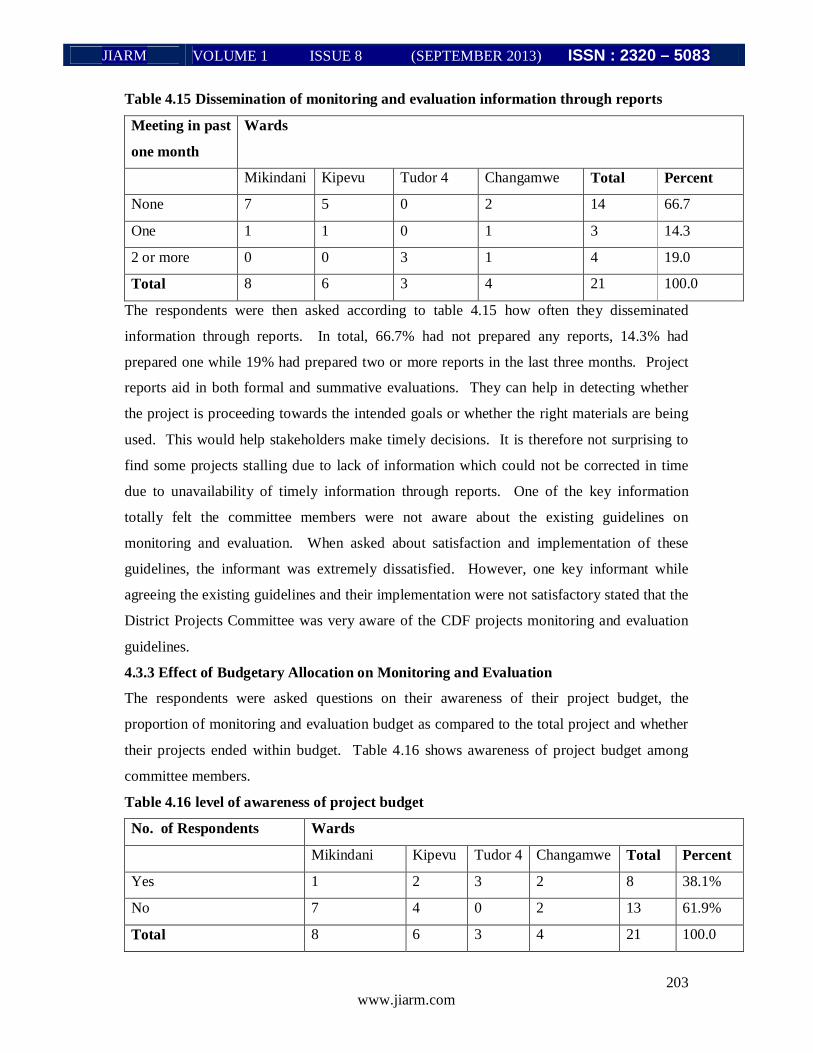
The respondents were then asked according to table 4.15 how often they disseminated
information through reports. In total, 66.7% had not prepared any reports, 14.3% had
prepared one while 19% had prepared two or more reports in the last three months. Project
reports aid in both formal and summative evaluations. They can help in detecting whether
the project is proceeding towards the intended goals or whether the right materials are being
used. This would help stakeholders make timely decisions. It is therefore not surprising to
find some projects stalling due to lack of information which could not be corrected in time
due to unavailability of timely information through reports. One of the key information
totally felt the committee members were not aware about the existing guidelines on
monitoring and evaluation. When asked about satisfaction and implementation of these
guidelines, the informant was extremely dissatisfied. However, one key informant while
agreeing the existing guidelines and their implementation were not satisfactory stated that the
District Projects Committee was very aware of the CDF projects monitoring and evaluation
guidelines.
4.3.3 Effect of Budgetary Allocation on Monitoring and Evaluation
The respondents were asked questions on their awareness of their project budget, the
proportion of monitoring and evaluation budget as compared to the total project and whether
their projects ended within budget. Table 4.16 shows awareness of project budget among
committee members.
Table 4.16 level of awareness of project budget
No. of Respondents Wards
Mikindani Kipevu Tudor 4 Changamwe Total Percent
Yes 1 2 3 2 8 38.1%
No 7 4 0 2 13 61.9%
Total 8 6 3 4 21 100.0
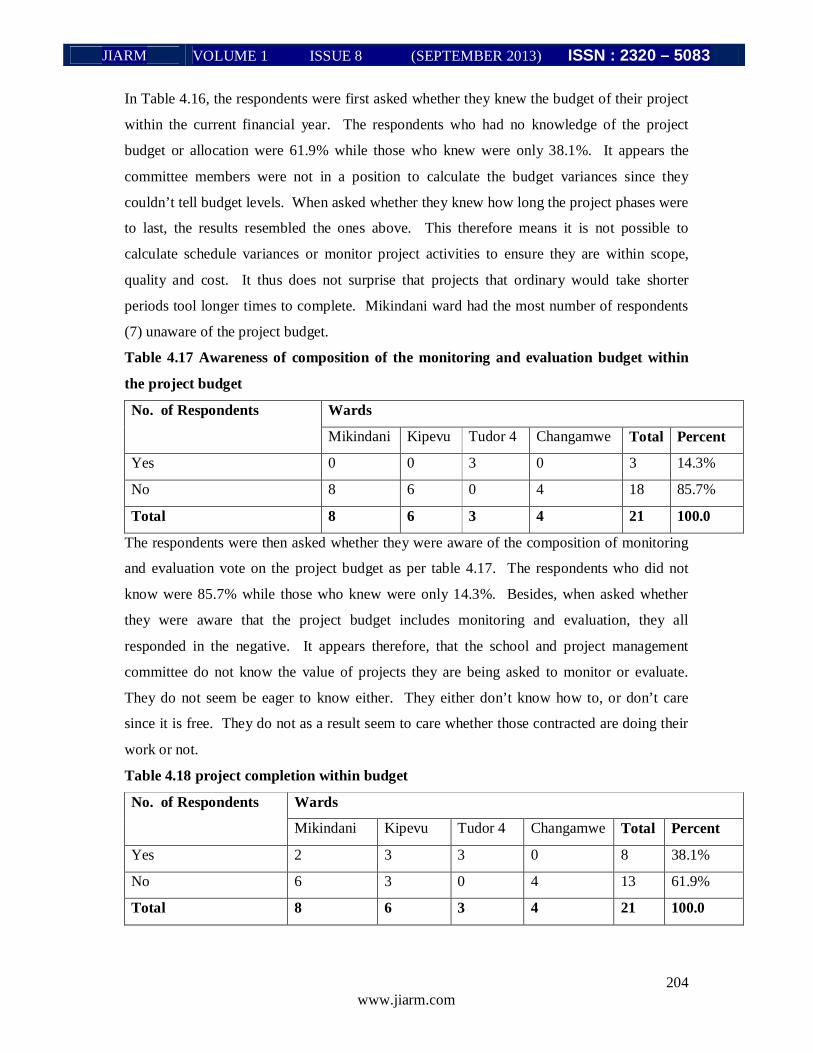
JIARM VOLUME 1 ISSUE 8 (SEPTEMBER 2013) ISSN : 2320 – 5083
204 www.jiarm.com
In Table 4.16, the respondents were first asked whether they knew the budget of their project
within the current financial year. The respondents who had no knowledge of the project
budget or allocation were 61.9% while those who knew were only 38.1%. It appears the
committee members were not in a position to calculate the budget variances since they
couldn’t tell budget levels. When asked whether they knew how long the project phases were
to last, the results resembled the ones above. This therefore means it is not possible to
calculate schedule variances or monitor project activities to ensure they are within scope,
quality and cost. It thus does not surprise that projects that ordinary would take shorter
periods tool longer times to complete. Mikindani ward had the most number of respondents
(7) unaware of the project budget.
Table 4.17 Awareness of composition of the monitoring and evaluation budget within
the project budget
No. of Respondents Wards
Mikindani Kipevu Tudor 4 Changamwe Total Percent
Yes 0 0 3 0 3 14.3%
No 8 6 0 4 18 85.7%
Total 8 6 3 4 21 100.0
The respondents were then asked whether they were aware of the composition of monitoring
and evaluation vote on the project budget as per table 4.17. The respondents who did not
know were 85.7% while those who knew were only 14.3%. Besides, when asked whether
they were aware that the project budget includes monitoring and evaluation, they all
responded in the negative. It appears therefore, that the school and project management
committee do not know the value of projects they are being asked to monitor or evaluate.
They do not seem be eager to know either. They either don’t know how to, or don’t care
since it is free. They do not as a result seem to care whether those contracted are doing their
work or not.
Table 4.18 project completion within budget
No. of Respondents Wards
Mikindani Kipevu Tudor 4 Changamwe Total Percent
Yes 2 3 3 0 8 38.1%
No 6 3 0 4 13 61.9%
Total 8 6 3 4 21 100.0
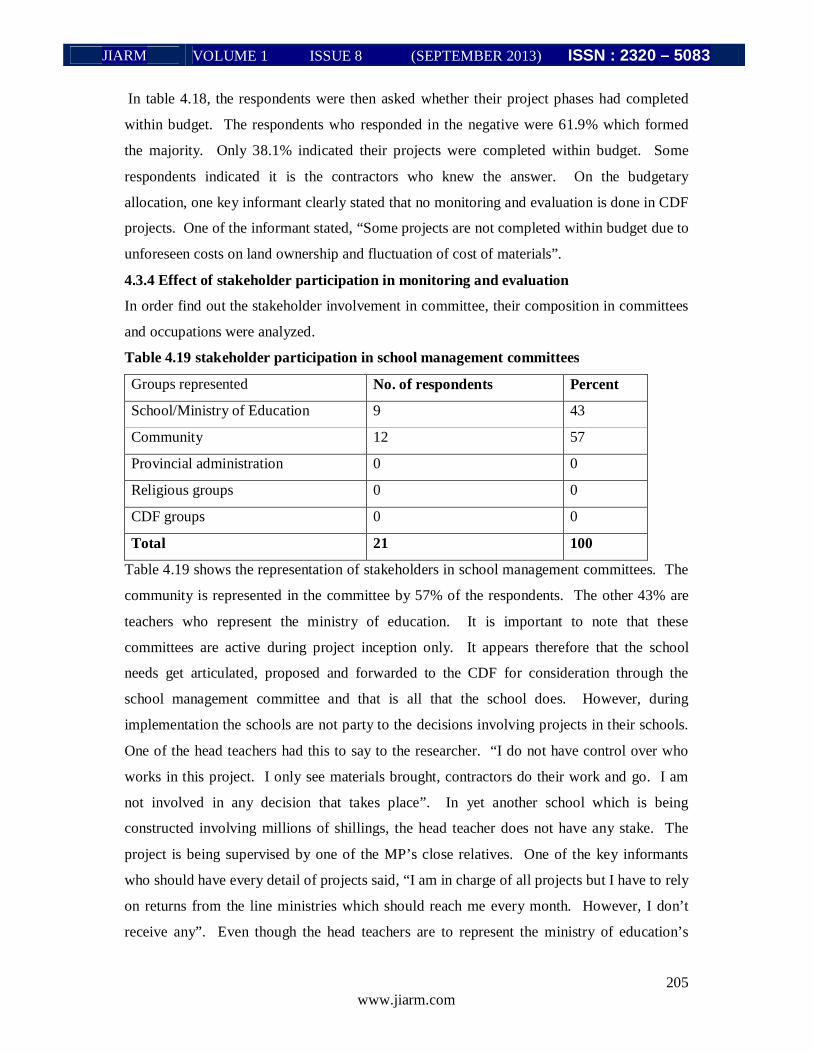
JIARM VOLUME 1 ISSUE 8 (SEPTEMBER 2013) ISSN : 2320 – 5083
205 www.jiarm.com
In table 4.18, the respondents were then asked whether their project phases had completed
within budget. The respondents who responded in the negative were 61.9% which formed
the majority. Only 38.1% indicated their projects were completed within budget. Some
respondents indicated it is the contractors who knew the answer. On the budgetary
allocation, one key informant clearly stated that no monitoring and evaluation is done in CDF
projects. One of the informant stated, “Some projects are not completed within budget due to
unforeseen costs on land ownership and fluctuation of cost of materials”.
4.3.4 Effect of stakeholder participation in monitoring and evaluation
In order find out the stakeholder involvement in committee, their composition in committees
and occupations were analyzed.
Table 4.19 stakeholder participation in school management committees
Groups represented No. of respondents Percent
School/Ministry of Education 9 43
Community 12 57
Provincial administration 0 0
Religious groups 0 0
CDF groups 0 0
Total 21 100
Table 4.19 shows the representation of stakeholders in school management committees. The
community is represented in the committee by 57% of the respondents. The other 43% are
teachers who represent the ministry of education. It is important to note that these
committees are active during project inception only. It appears therefore that the school
needs get articulated, proposed and forwarded to the CDF for consideration through the
school management committee and that is all that the school does. However, during
implementation the schools are not party to the decisions involving projects in their schools.
One of the head teachers had this to say to the researcher. “I do not have control over who
works in this project. I only see materials brought, contractors do their work and go. I am
not involved in any decision that takes place”. In yet another school which is being
constructed involving millions of shillings, the head teacher does not have any stake. The
project is being supervised by one of the MP’s close relatives. One of the key informants
who should have every detail of projects said, “I am in charge of all projects but I have to rely
on returns from the line ministries which should reach me every month. However, I don’t
receive any”. Even though the head teachers are to represent the ministry of education’s
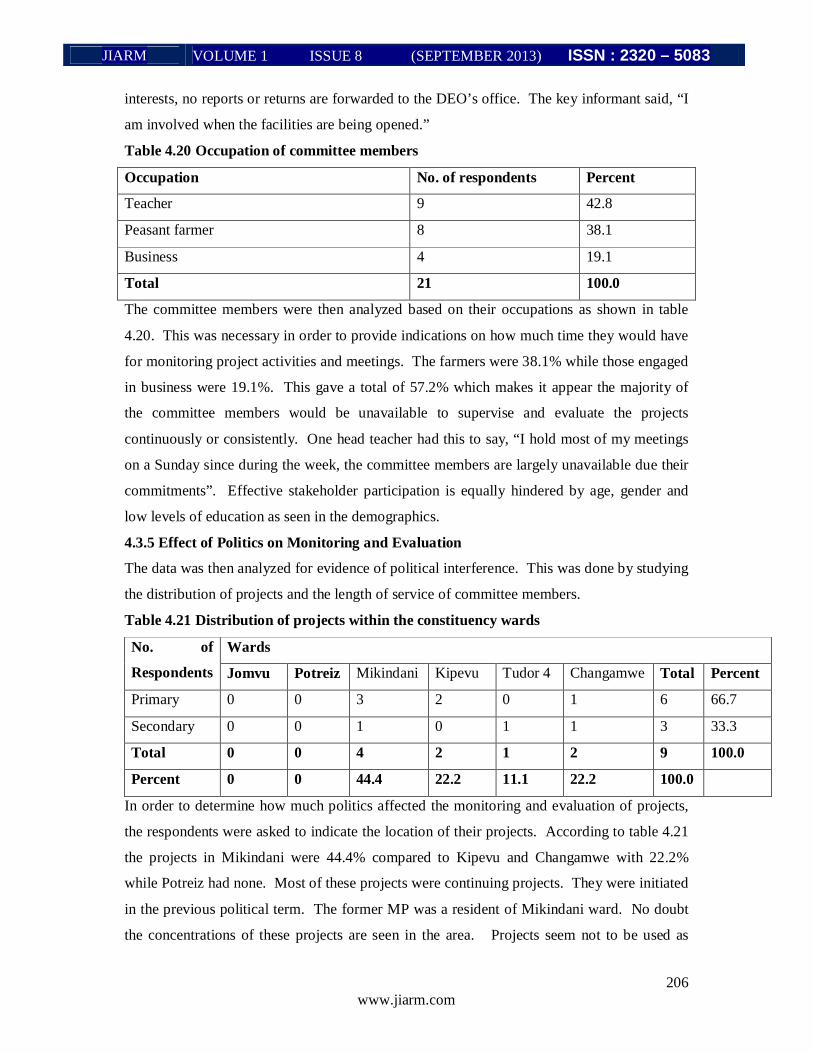
JIARM VOLUME 1 ISSUE 8 (SEPTEMBER 2013) ISSN : 2320 – 5083
206 www.jiarm.com
interests, no reports or returns are forwarded to the DEO’s office. The key informant said, “I
am involved when the facilities are being opened.”
Table 4.20 Occupation of committee members
Occupation No. of respondents Percent
Teacher 9 42.8
Peasant farmer 8 38.1
Business 4 19.1
Total 21 100.0
The committee members were then analyzed based on their occupations as shown in table
4.20. This was necessary in order to provide indications on how much time they would have
for monitoring project activities and meetings. The farmers were 38.1% while those engaged
in business were 19.1%. This gave a total of 57.2% which makes it appear the majority of
the committee members would be unavailable to supervise and evaluate the projects
continuously or consistently. One head teacher had this to say, “I hold most of my meetings
on a Sunday since during the week, the committee members are largely unavailable due their
commitments”. Effective stakeholder participation is equally hindered by age, gender and
low levels of education as seen in the demographics.
4.3.5 Effect of Politics on Monitoring and Evaluation
The data was then analyzed for evidence of political interference. This was done by studying
the distribution of projects and the length of service of committee members.
Table 4.21 Distribution of projects within the constituency wards
No. of
Respondents
Wards
Jomvu Potreiz Mikindani Kipevu Tudor 4 Changamwe Total Percent
Primary 0 0 3 2 0 1 6 66.7
Secondary 0 0 1 0 1 1 3 33.3
Total 0 0 4 2 1 2 9 100.0
Percent 0 0 44.4 22.2 11.1 22.2 100.0
In order to determine how much politics affected the monitoring and evaluation of projects,
the respondents were asked to indicate the location of their projects. According to table 4.21
the projects in Mikindani were 44.4% compared to Kipevu and Changamwe with 22.2%
while Potreiz had none. Most of these projects were continuing projects. They were initiated
in the previous political term. The former MP was a resident of Mikindani ward. No doubt
the concentrations of these projects are seen in the area. Projects seem not to be used as
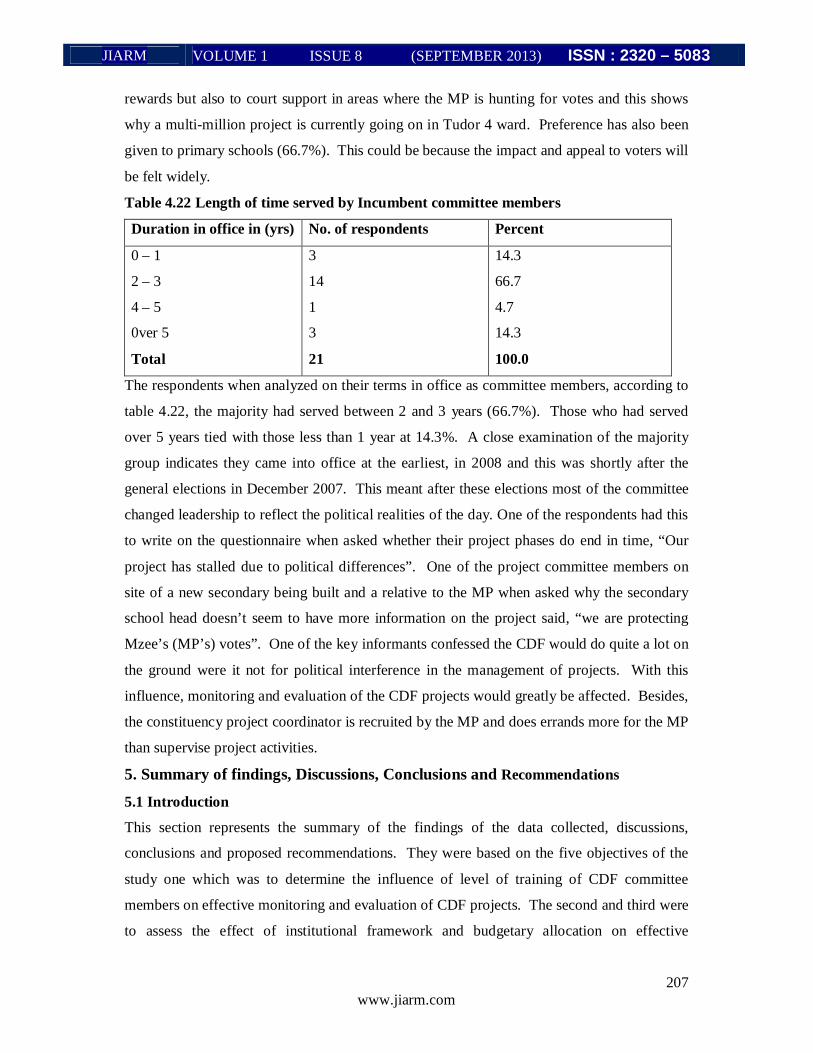
JIARM VOLUME 1 ISSUE 8 (SEPTEMBER 2013) ISSN : 2320 – 5083
207 www.jiarm.com
rewards but also to court support in areas where the MP is hunting for votes and this shows
why a multi-million project is currently going on in Tudor 4 ward. Preference has also been
given to primary schools (66.7%). This could be because the impact and appeal to voters will
be felt widely.
Table 4.22 Length of time served by Incumbent committee members
Duration in office in (yrs) No. of respondents Percent
0 – 1
2 – 3
4 – 5
0ver 5
Total
3
14
1
3
21
14.3
66.7
4.7
14.3
100.0
The respondents when analyzed on their terms in office as committee members, according to
table 4.22, the majority had served between 2 and 3 years (66.7%). Those who had served
over 5 years tied with those less than 1 year at 14.3%. A close examination of the majority
group indicates they came into office at the earliest, in 2008 and this was shortly after the
general elections in December 2007. This meant after these elections most of the committee
changed leadership to reflect the political realities of the day. One of the respondents had this
to write on the questionnaire when asked whether their project phases do end in time, “Our
project has stalled due to political differences”. One of the project committee members on
site of a new secondary being built and a relative to the MP when asked why the secondary
school head doesn’t seem to have more information on the project said, “we are protecting
Mzee’s (MP’s) votes”. One of the key informants confessed the CDF would do quite a lot on
the ground were it not for political interference in the management of projects. With this
influence, monitoring and evaluation of the CDF projects would greatly be affected. Besides,
the constituency project coordinator is recruited by the MP and does errands more for the MP
than supervise project activities.
5. Summary of findings, Discussions, Conclusions and Recommendations
5.1 Introduction
This section represents the summary of the findings of the data collected, discussions,
conclusions and proposed recommendations. They were based on the five objectives of the
study one which was to determine the influence of level of training of CDF committee
members on effective monitoring and evaluation of CDF projects. The second and third were
to assess the effect of institutional framework and budgetary allocation on effective
JIARM VOLUME 1 ISSUE 8 (SEPTEMBER 2013) ISSN : 2320 – 5083
208 www.jiarm.com
monitoring evaluation of the CDF projects. The study also sought to establish the influence
of stakeholder participation and politics on effective monitoring and evaluation of CDF
projects.
5.2 Summary of Findings
The findings of the study managed to address both the research questions and objectives. The
study had set out to establish factors affecting the effectiveness of monitoring and evaluation
of CDF projects within the education sector in Changamwe constituency, Changamwe
District. On the effect of level of training, the study found there was low level of training of
committee members charged with monitoring and evaluation of the projects under the CDF.
Those not trained were 66.7% of the respondents. Besides, those trained had only attended
workshops and seminars (38.1%). Even amongst these, only 19% had trained once in the
past calendar year.
The study revealed that the committee members were not aware of the monitoring and
evaluation guidelines (81%). They were also not satisfied with how they were being
implemented (80%). The large number of respondents dissemination the monitoring and
evaluation information through meetings which were not regular with the majority (62%) not
having held any meeting in the past month. They didn’t prepare monitoring and evaluation
reports in the last three months on projects under them. This means there are no records with
data to aid project implementers on future similar projects. These findings agree with those
of Aukot, Okendo and Korir (2010), who argue that skills for effective monitoring
information sharing may be lacking among the community members in CDF projects. They
further agree there is no mechanism for information dissemination on ongoing projects
including commencement and completion time, cost, those involved in the implementation
and how. The study found out that the respondents were not aware of the monitoring and
evaluation budget for their projects (85.7%). They therefore could not tell what percentage it
was of the total project budget. The biggest surprise was that the respondents could not tell
how much they had been allocated for their projects as well (61.9%). Another 61.9% could
not tell whether their project phases had been completed within budget. One of the
respondents wrote down misappropriation and embezzlement of funds as one of the reasons
the projects were never completed in time and within budget.
The study found out that the majority of the primary beneficiaries were represented in the
projects at formulation stage (57%) only. They had little or no role after the projects were
approved during implementation. Mapesa and Kibua (2006) fault the utilization of the fund
on grounds of poor management and low community involvement.
JIARM VOLUME 1 ISSUE 8 (SEPTEMBER 2013) ISSN : 2320 – 5083
209 www.jiarm.com
It was also apparent the majority had low level of education as a hindrance to meaningful
contribution in the monitoring and evaluation of the projects. Those with primary level
education and below were 42.9% of the respondents. Although the teachers were at A/O
level and above in educational level, they were left as the main opinion leaders. The majority
of the teachers may not have been trained in monitoring and evaluation of projects. Mwangi
(2005) agrees that the average level of education in a constituency is expected to influence
the involvement of the community and also the extent to which they are able to monitor the
utilization of funds. It is therefore expected that CDF projects will be more in line with
priorities in areas where the average level of education is higher.
The occupation of the stakeholders indicates they were farmers and businessmen (57.2%).
This means they would hardly have time to monitor projects or get time for their evaluation.
Aukot, Okendo and Korir (2010) agree with these findings stating that information collection
has a time component which directly translates to a financial implication. Directly this may
mean paying someone to collect the information while indirectly it may mean the cost
forgone by the person who opts to collect information rather than engage in an economic
activity. Besides, the ages of the respondents were quite advanced. Those over 50 years were
47.6%. This would make training them quite an arduous task even if they were to be available.
Other findings indicated that politics played a big role on how projects were distributed and
being run. Mikindani ward had majority of the projects (44.4%) since the former members of
parliament was from the area. The majority of the respondents had served for only between 2
and 3 years (66.7%). This means most of them came into office after the 2007 elections.
Some of the projects with large budgetary allocations were being supervised by supporters or
relatives of MP. For unknown reasons, the secondary school head teachers participating in
the study complained of being sidelined ruing the project implementations. The projects
coordinator had no training on project management and like the constituency development
fund committee members; he was under the control of the area MP. These findings agree
with others which clearly indicated that projects under the CDF are for political patronage as
opposed to local community development as was envisioned in the CDF Act , Awiti, (2008);
IEA (2006); Gikonyo , (2008); Mapesa and Kibua , (2006); Mwalulu and Irungu, (2007).
This makes efficiency in the projects difficult since efficiency is primarily determined by the
degree of involvement by local communities and also the capacity for the beneficiaries to
hold politicians and those in charge of implementation accountable, Mwangi, (2005).
JIARM VOLUME 1 ISSUE 8 (SEPTEMBER 2013) ISSN : 2320 – 5083
210 www.jiarm.com
5.3 Discussions
This study indicated that the monitoring and evaluation of constituency development funds
projects within Changamwe constituency is not effective. It has also shown that the level of
training is largely inadequate and that there is no effective institutional framework for
monitoring and evaluation of projects. The budgetary allocation for monitoring and
evaluation appears on paper but no effected on the projects. Even though the school
administrations are stakeholders, in some instances they are left as observers. Politics plays
an overbearing role on constituencies’ development fund.
The research study found that even though monitoring and evaluation ought to be done by the
local communities and projects implementation committees (ww.cdf.go.ke, April 2011), they
were not trained on how to do this. Further, implementation challenges still dog the CDF
particularly with regard to issues of governance, KPPRA, (2006): CGD, (2007).
The study found that essential skills for monitoring and evaluation lack even within the CDF
personnel and therefore training needs to be done. Foresti, (2207) argues this means not just
training, but a whole suite of learning approaches: from secondments to research institutes
and opportunities to work on impact evaluations within the organization or elsewhere, to time
spent by programme staff in evaluation departments and equally time spent by evaluators in the field.
The baseline survey study which should be undertaken before the project commences so that
the condition prior to the implementation of the project is determined, Webb and Elliot,
(2002): and Gyorkos, (2003) is not done. The monitoring and evaluation plan which should
be prepared as an integral part of project plan and design, Passia, (2004): and McCoy et al.,
(2005) in never in place. It is therefore difficult to determine what methods are appropriate to
the users’ needs, the given context, and issues of data, baselines and indicators, Hulme,
(2000) in the CDF projects.
Monitoring and evaluation expertise such as design skills particularly Log Frame design,
indicator setting: both qualitative and quantitative, design of data collecting instruments
including questionnaires, focus discussion guides are nonexistent. Other necessary skills
including data collection skills such as conducting interviews, conducting focus group
discussion, data analysis and report writing skills, Hughes d’Ateth, (2002): and Gibbs et al.,
(2002) are not there altogether. Processes or activities to be done on the project are tracked
with aid of a project schedule or project timeline. At regular intervals actual schedule of
activities done is compared with the planned schedule to determine whether the project is
within schedule or over schedule, Crawford and Bryce, (2003). This practice is entirely not
being followed on the ground and some projects are not completed in time or within budget.
JIARM VOLUME 1 ISSUE 8 (SEPTEMBER 2013) ISSN : 2320 – 5083
211 www.jiarm.com
There is no clear structured institutional framework for monitoring and evaluation according
to the findings. The location development committees do not exist in certain projects and
CDF uses existing structures such as the school management committees for projects in
school. There is no individual within the CDF directly responsible for monitoring and
evaluation. According to Kelly and Magongo (2004), AUSAID (2—6), Gyorkos (2003) and
McCoy et al (2005), there should be an individual who is directly in charge of the monitoring
and as a main function and an identification of different personnel for the different activities
of the monitoring and evaluation such as data collection, analysis, report writing,
dissemination of the monitoring and evaluation findings. The District Development Officer’s
involvement in the management of all devolved funds is wanting since the district line
ministry officials are not directly answerable to the constituencies’ development fund board.
Although the fund managers are supposed to be politically independent, in some cases, interference from area MPs continues with subsequent transfer of fund managers, KHRC, (2010)
The monitoring and evaluation budget, although stated by the CDF board at 2%, CDF
Strategic Plan, (2011): CDF Act, (2003), is not reflected in the CDF projects on the ground.
According to Kelly and Magongo (2004), IFRC (2001) and AIDS Alliance (2006), the
monitoring and evaluation budget needs to be about 5 to 10 percent of the total budget. The
Changamwe constituency budget has assigned only 1.1% of its budget to both capacity
building and monitoring and evaluation (CDF, Changamwe Office). Besides, financial
resources should be tracked with a project budget. The project activities should have costs
attached to them, and a comparison made of what has been spent on project activities with
what should have been spent as per planned expenditure in the budget, Crawford and Bryce,
(2003). Without proper records in the projects, this is not being achieved in CDF projects.
According to the study, stakeholders for school projects are largely used during project
conceptualization. After this, they are entirely passive during the implementation.
According to Chambers (1997) and Chitere (1994), stakeholder’s participation means
empowering development beneficiaries in terms of resources and needs identification,
planning on the use of resources and the actual implementation of development initiatives.
This is not done with regard to these projects under the CDF.
The findings agree with Mungai (2009), who found that the community participates in the
identification of projects depending on how the MP shapes the boundaries of engagement.
There are those who will be invited and those who will not be invited in the identification of
projects in CDF. The project identified by those close to the MP are said to be passed as
having been identified by the community.
JIARM VOLUME 1 ISSUE 8 (SEPTEMBER 2013) ISSN : 2320 – 5083
212 www.jiarm.com
Mwangi (2005), explains the passivity of CDF project beneficiaries by saying they are not
motivated to monitor how the fund is used in projects since the fund is seen to be free causing
what he calls ‘fiscal illusion’. The stakeholders are equally not entirely representative with
61.9% being male and 38.9% female. These findings agree with Aukot et al (2010), who say that attributes such as gender, disability status and age balance are not clarified in the term
‘community’. The study found profound influence of politics on project management and by
extension monitoring and evaluation. This agrees with the findings of Ongoya and Lumallas
(2005) that found the fund to be under the control f politicians who not only proposed the
projects in their constituencies but also presented and voted for their estimates in parliament.
It is against the principle of separation of powers for members of parliament to submit annual
estimates to themselves for approval, take part in the actual spending and then query the
spending themselves through public accounts committee or public investments committee.
An MP can easily use his patronage networks to influence memberships of committees in
order to determine which projects are identified and prioritized in the locations the MP got
the highest votes or where there is hope for future votes, Mwalulu and Irungu, (2007). This
has been compounded by the fact that citizens base their decision to re-elect their MP on a
number of factors, including how the contending MPs manage the CDF, Gutierrez-Romero,
(2010).
5.4 Conclusion
The study found that the committee members were not trained on monitoring and evaluation
of projects. This is because a few of them did needs assessment before initiating projects,
however, no planning was done for monitoring and evaluation, there was no monitoring of
project schedules and expenditure, no dissemination of information or documentation of
lessons learnt.
The study results indicated no clear institutional framework for doing monitoring and
evaluation. There was low awareness for guidelines for monitoring and evaluation among the
committee members. The committee members were not only dissatisfied with these
guidelines but also did not approve of how they were implemented.
The study found that the committee members were not aware of the budgetary allocation for
monitoring and evaluation or what proportion it was of the total project budget. Surprisingly,
they could not tell the current budgets for their projects, too.
The results showed that primary beneficiaries of the projects partially participated only
during project conceptualization. At the implementation stage, the projects are largely under
the CDF staff. It was also found that the primary stakeholders had very low education levels

JIARM VOLUME 1 ISSUE 8 (SEPTEMBER 2013) ISSN : 2320 – 5083
213 www.jiarm.com
and very old. This compromised their capacity to participate optimally in projects. Besides
they were mainly business people or farmers making it difficult for them to get time for
monitoring projects.
Finally, the study found that profound influence of politics on the projects under CDF. The
projects were distributed either in areas where the MP hailed from or where he was hunting
for votes. Critical stakeholders such head teachers in secondary schools seemed
disenfranchised since these projects are run by the MP’s supporters or relatives.
5.5 Recommendations
It is evident that several factors affect monitoring and evaluation of CDF projects. CDF has
numerous weaknesses, which if not redressed will seriously undermine the success of the
fund. These include low levels of stakeholder participation in the monitoring and evaluation
of projects being implemented and low representations of other groups such as women; poor
compliance with CDF regulations and procedures; the powerful role of the MP, which has in
several cases, been abused; lack of transparency and accountability especially in the
monitoring of project expenditure; lack of access to information which hampers the ability of
the public to effectively monitor CDF usage; and poor feedback mechanisms between the
different committees and government organs in the monitoring and evaluation process.
The researcher has the following recommendations to make with regard to monitoring and
valuation of CDF projects.
1. Training. The findings found a critical lack of expertise in monitoring and evaluation of
projects implemented by the CDF. The respondents indicated 66.7% were not trained in
monitoring and evaluation. The CDF Board in conjunction with the line ministries and the
monitoring agencies within the ministry of National Planning and Vision 2030 should
institute programmes to impact CDF projects monitoring and evaluation skills amongst the
various CDF committees.
2. Budgetary Allocation. The CDF projects must clearly define what percentage of project
cost would go to monitoring and evaluation. Capacity building costs should clearly be
delineated from monitoring and evaluation for the sake of accountability and transparency.
3. Stakeholder Participation. The primary beneficiaries need to be included even at project
implementation stages. As of now they are confined to project conceptualization. After this
the CDF office takes over all functions. They should play an active role since they are the
consumers of the projects for the sake of sustainability. The term ‘community’ should
equally define how the various marginalized groups such as the female gender and disabled
will be represented.
JIARM VOLUME 1 ISSUE 8 (SEPTEMBER 2013) ISSN : 2320 – 5083
214 www.jiarm.com
4. Politics. The influence of politicians should be controlled through an amendment of the
CDF Act. They should not get involved in the choice of constituency development fund
committees. This will reduce cronyism, nepotism and use of project as a reward or otherwise
for political gain. It is therefore recommended that the MPs play the watchdog role of monitoring the use of CDF and should not chair or influence any of the committees under the CDF.
5.6 Recommendation for further research
1. Further research needs to be carried out to establish how other CDF projects in the
health and water sectors are being monitored and evaluated.
2. Other researchers could also look at how to strengthen primary stakeholders in CDF
projects particularly how to ensure the beneficiaries can participate effectively in
monitoring and evaluating their projects.
References 1. Akin, M.C & Christie, C.A. (2004). An evaluation theory tree revisited. In American Evaluation
Association (2005). Guiding principles for Evaluators. From http://www.eval.org. Retrieved April 20,2011
2. Aukot, Okendo and Korir (n.d), Decentralized Fund Regimes in Kenya, A Guide to Community Participation, Legal Advice Centre.
3. Awiti, P.V. (2008) ‘An assessment of The Use and Management of Development Funds: The case of Constituencies Development Fund in Kenya’. MA thesis, Institute of Social Studies, The Hague.
4. Briceno, B. and Gaarder, M.(2009) ‘Institutionalizing Evaluation: Review of International Experience’. 3ie Research Paper. London: 3iE
5. (www.3ieimpact.org/admin/pdfs_papers/50.pdf). Retrieved April 20, 2011. 6. Carolien M. Klein Haarhuis and Frans L. Leeuw, “Fighting Governmental Corruption: The New
World Bank Program Evaluated”, Journal of international development, Vol. 16, 2004, pp.547 – 561.
7. Casley D and Kumar K. (1988): The collection, Analysis and use of Monitoring and Evaluation Data. Maryland: World Bank.
8. Centre for Governance and Development (2007), National Devolve Funds Report, institutional procedures and structures. Nairobi: Kenya
9. Chambers, R.(2009) So that the poor Count More: Using Participatory Methods for Impact Evaluation in Designing impact evaluations: different perspectives. 3ie Working paper 4. London: 3iE (www.3ieimpact.org/admin/pdfs_papers/50.pdf).
10. Cheema and Rondinelli (1983), Implementing Decentralization Policies. An Introduction in Decentralization and Development: Policy Development in Developing Countries.
11. Sage publications. 12. Chen, H.T & Rossi, P. H. (1983). Evaluating with sense: The Theory – Driven Approach. Evaluation
Review 7, 283 – 302. 13. Chen, H.T. (1997). Applying mixed methods under the framework of theory-driven evaluations. New
Directions for Evaluation, 74, 61 – 72. 14. Chitere, O.P & Ireri, O.N (2004). District Focus for Rural Development in Kenya: It’s Limitations as
a Decentralization and participatory planning strategy and prospects for the future. Nairobi: Institute for Policy Analysis and Research.
15. Chiweza L.A (2010), Public Sector Reforms and Decentralization of Public Sector Services: Lessons from Malawi (1994 – 2006), books.google.com
16. Constituencies Development Fund Board (2011), 2010 – 2014 Strategic Plan, Equitable Development for Kenyans, Government Press.
17. CORE (2006): Participatory monitoring and evaluation of community and faith based programs. Washington. USAID
JIARM VOLUME 1 ISSUE 8 (SEPTEMBER 2013) ISSN : 2320 – 5083
215 www.jiarm.com
18. Crawford P & Bryce P. (2003): Project Monitoring and Evaluation: A method of enhancing the efficiency and effectiveness of aid project implementation. International Journal of Project Management, 21(5): 363 – 373
19. Crook Richard (2003), Decentralization and Poverty reduction in Africa: The Politics of local Central Relations, Public Administration Development, 23, 77 – 78
20. Donaldson S & Lipsey M(2003), Roles for Theory in Contemporary Evaluation Practice: Developing Practical Knowledge, Evaluating Social Programs and Problems:
21. Visions for the new Millennium (pp111 – 142) 22. Gikonyo, W. (2008) The CDF Social Audit Guide: A Handbook for Communities. Nairobi: Open
Society Initiative for East Africa. 23. GOK (2008), District Development Plan, Kilindini District, Government Press 24. Government of Kenya (2003) Constituencies Development Fund Act 2003.
http://www.cdf.go.ke/images/docs/revised%20cdf%20act%2_annotatedversion.pdf http://www.cdf.go.ke. Retrieved 11th April 2011.
25. Government of Kenya (2003). Interim Poverty Reduction Strategy Paper 2000/03. Government Press. 26. GOK (2008), Kenya Vision 2030, Government Press. 27. Gutierrez-Romero R. (2010), Decentralization, Accountability and the 2007 MPs Elections in
Kenya (Vol. 2): London: University of Oxford 28. Gyorkos T. (2003): Monitoring and Evaluation of large scale Helminth control programmes. Acta
Tropic, 86(2): 275 – 282 29. Hulme, D.(2000) ‘Impact Assessment Methodologies for Microfinance: Theory, Experience and
Better Practice’, World Development 28 (1): 79 – 98. 30. IFAD – Managing for impact in Rural Development. A guide for Project M&E 31. Jody Z and Ray R. (2004): Ten Steps to a result based monitoring and evaluation system: A
Handbook for Development practitioners. Washington: World Bank 32. Johan.M. Owen and Patricia J. Rogers, Program Evaluation: Forms and Approaches (London: Sage,
1999). 33. Jones, N. et al. (2009) ‘Improving Impact Evaluation Coordination and Use’. A Scoping study
commissioned by the DFID Evaluation Department on behalf of NONIE (www.odi.org.uk/resources/download/3177.pdf). Retrieved June 15, 2011.
34. Kelly K and Magongo B. (2004): Report on Assessment of Monitoring and Evaluation Capacity of HIV/AIDS organization in Swaziland. Swaziland: NERCHA.
35. Kenya Human Rights Commission (KHRC, 2010) and Social and Public Accountability Network (SPN, 2010) – Harmonization of Decentralized Fund in Kenya, Towards Alignment, Citizen Engagement and Accountability, Government Press.
36. Khan, M. Adil (1989) A south Asian Regional Study on Current Thoughts and practices in Monitoring and Evaluation. Washington DC: Economic Development Institute of the World Bank.
37. Kibua, N.T. (2006) An Assessment of the Management and Utility of the Constituency Development Fund in Kenya. Nairobi: Institute of Policy Analysis and Research.
38. Kimani F, Nekesa P. and Ndung’u B (2009), Best Practices in Constituency Development Fund, Collaborative Centre for Gender Development.
39. KIPPRA, (2006) Baseline Survey on Decentralized Funds in Kenya, Harmonization of Decentralized Development KIPPRA: Nairobi Kenya
40. Kothari C.R (2004), Research Methodology, Methods and Techniques (Second Revised Edition), New Delhi: New Age International Publishers.
41. Leeuw F.L, Reconstructing Program Theories and Problems to be Solved American Journal of Evaluation, Vol. 24, no. 1. (2003), pp. 5 – 20;
42. Litvack (2000), Rethinking Decentralisation at the World Bank, Washington DC: World Bank 43. Makokha, J(1985), The District Focus: Conceptual and Management Problems. Nairobi: East African
Research Bureau. 44. Manor and Cook (1998), Democracy and Decentralisation in South Asia and West Africa.
Participation, Accountability and Performance, Cambridge: Cambridge University Press 45. Mapesa, B. M & Kibua T.N (2006). An Assessment of the Management and Utilization of the
Constituency Development Fund in Kenya. Nairobi: Institute for Policy Analysis and Research. 46. Mawhood (1993), Local Government in the third World: Experience of Decentralisation in Tropical
Africa 47. Mugenda O and Mugenda A (1990), Research Methods, Quantitative and Qualitative Approaches,
Nairobi: Acts Press (1999).
JIARM VOLUME 1 ISSUE 8 (SEPTEMBER 2013) ISSN : 2320 – 5083
216 www.jiarm.com
48. Mulwa F.W (2008), Participatory Monitoring and Evaluation of Community Projects, Community Based Project Monitoring, Qualitative Impact Assessment, and People Friendly Evaluation Methods, Nairobi: Paulines Publications Africa (2008)
49. Mulwa, F.W & Nguluu, S.N (2003). Participatory Monitoring and Evaluation: A Strategy for Organization Strengthening. Nairobi and Eldoret: Zapf Chancery and Premise-Olivex Publishers.
50. Mungai (2009), Civil Society’s Role in Enhancing Accountability and Community’s participation in the management of Public Funds: The case of the constituencies Development Fund in Kenya (MA Thesis, Hague: The Netherlands).
51. Muzinda M (2007), Monitoring and Evaluation practices and Challenges of Gaborone Based Local NGOs Implementing HIV/AIDS projects in Botswana, (Master of Project Planning Thesis).
52. Mwalulu, J. and D, Irungu (2007) CDF The Constituency Fund for Development or Campaigns? Nairobi: The Youth Agenda.
53. Mwangi, S. Kimenyi (2005), Efficiency and Efficacy of Kenya’s Constituency Development Fund: Theory and Evidence. Economics Working Papers paper. 200542(www.digitalcommons.ucon.edu) Retrieved April 23, 2011.
54. Ochoki Nyamori (2009), Making Development Accountable, A critical analysis of the systems of accounting and accountability for the constituency Development Fund in Kenya, School of Accounting, La Trobe University, Melbourne Australia (www.emeraldinsight.com). Retrieved May 20, 2011.
55. OECD. (2002): Glossary of Key terms in Evaluation and Results based Management. Paris: OECD. 56. Ongoya ZE and Lumallas E (2005), A critical Appraisal of the Constituency Development Fund Act,
Nairobi, Kenya. 57. Owusu G (2004), Small Towns and Decentralized Development in Ghana: Theory and Practice, Africa
Spectrum 39(2004)2; 165 – 195 58. PASSIA:Civil Society empowerment: Monitoring and Evaluation.
www.passia.org/seminars/2002/monitoring.htm (Accessed on 21/4/2011) 59. Patton, M. Q. (2010) Developmental Evaluation: Applying Complexity Concepts to Enhance
Innovation and Use. New York: Guilford Press. 60. PMI. (2004): A Guide to the Project management Book of Knowledge. New York: PMI 61. Khasnabis R (2005), Resources for Autonomy-Financing the Local Bodies, Salt Lake City: Manirban
Calcutta Research Group. 62. Reidar D. (2003): The logical frame work: an easy escape, a straightjacket, or a usefully planning
tool. Journal of Development in Practice, 3(1): 57 – 70. 63. Rogers, P. (2009) Matching Impact Evaluation Design to the Nature of the Intervention and the
purpose of the Evaluation in Designing impact evaluations: different perspectives. 3ie Working paper4.London: 3iE (www.3ieimpact.org/admin/pdfs_papers/50.pdf).
64. Romero R(2009), Decentralisation, Accountability Vol. 2: London, University Pres. 65. Shapiro J. (2004): Monitoring and Evaluation. Johannesburg: CIVICUS 66. Smoke (2003) Decentralisation in Africa: Goods, Dimensions, Myths and Challenges, Public
Administration and Development, Vol 23. 67. Steffenson Jasper Per Tidemand (2004), A Comparative Analysis of Decentralizing Kenya Tanzania
and Uganda. Country Study-Uganda vol 1 & 2 Washington D.C: World Bank. 68. Tambulasi R. (2010), Reforming the Malawian Public Sector: Retrospectives and Prospectives,
African Books Collective 69. Uitto JA. (2004): Multi-country co-operation around shared waters: Role of Monitoring and
Evaluation. Global Environmental Change, 14(1): 5 – 14 70. UNDP (2006). Handbook on Monitoring and Evaluation for Results, UN: Millennium Development
Goals Report 2006 71. Vanesa W. and Gala D. (2011) Sound Expectations: From Impact Evaluations to Policy Change
Center for the Implementation of Public Policies Promoting Equity and Growth (CIPPEC) 72. Weiss H. (2004): On Theory – Based Evaluation: Winning Friends and Influencing People Evaluation
Exchange, 9(4): 2 -7 73. Work (2002), Overview of Decentralisation Worldwide. A stepping stone to improved Governance
and Human Development. A paper presented at 2nd International 74. Van Grembergen, W. (2002) Information Systems Evaluation Management. IRM Press: NY